Fort Recovery, OH
Fort Recovery Map
Fort Recovery Overview
1,955
TOTAL POPULATION
1,007
MALE POPULATION
948
FEMALE POPULATION
106.22
MALES / 100 FEMALES
94.14
FEMALES / 100 MALES
31.5
MEDIAN AGE
3.6
AVG FAMILY SIZE
2.8
AVG HOUSEHOLD SIZE
$30,407
PER CAPITA INCOME
$92,829
AVG FAMILY INCOME
$64,013
AVG HOUSEHOLD INCOME
25.3%
WAGE / INCOME GAP [ % ]
74.7¢/ $1
WAGE / INCOME GAP [ $ ]
0.37
INEQUALITY / GINI INDEX
1,034
LABOR FORCE [ PEOPLE ]
70.3%
PERCENT IN LABOR FORCE
2.6%
UNEMPLOYMENT RATE
Fort Recovery Zip Codes
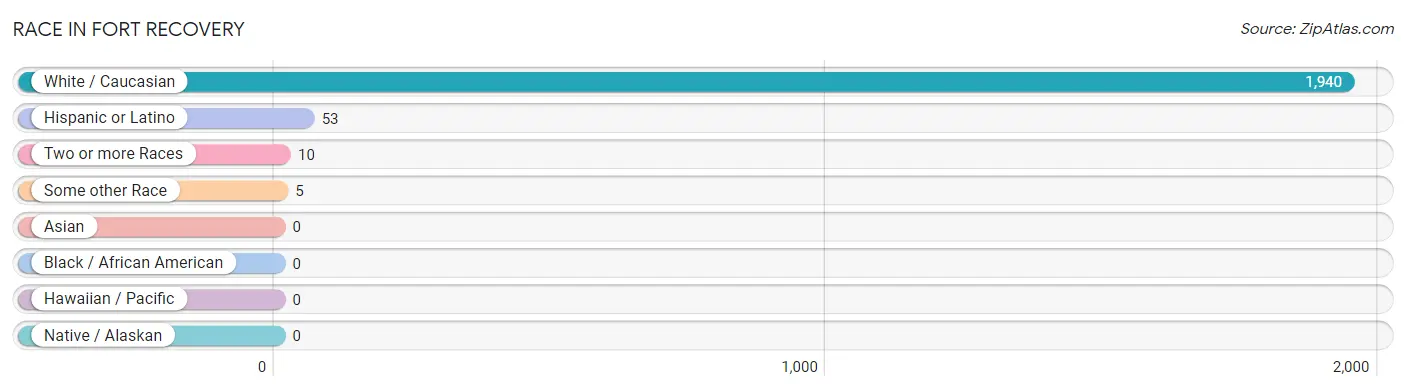
Race in Fort Recovery
The most populous races in Fort Recovery are White / Caucasian (1,940 | 99.2%), Hispanic or Latino (53 | 2.7%), and Two or more Races (10 | 0.5%).
| Race | # Population | % Population |
| Asian | 0 | 0.0% |
| Black / African American | 0 | 0.0% |
| Hawaiian / Pacific | 0 | 0.0% |
| Hispanic or Latino | 53 | 2.7% |
| Native / Alaskan | 0 | 0.0% |
| White / Caucasian | 1,940 | 99.2% |
| Two or more Races | 10 | 0.5% |
| Some other Race | 5 | 0.3% |
| Total | 1,955 | 100.0% |
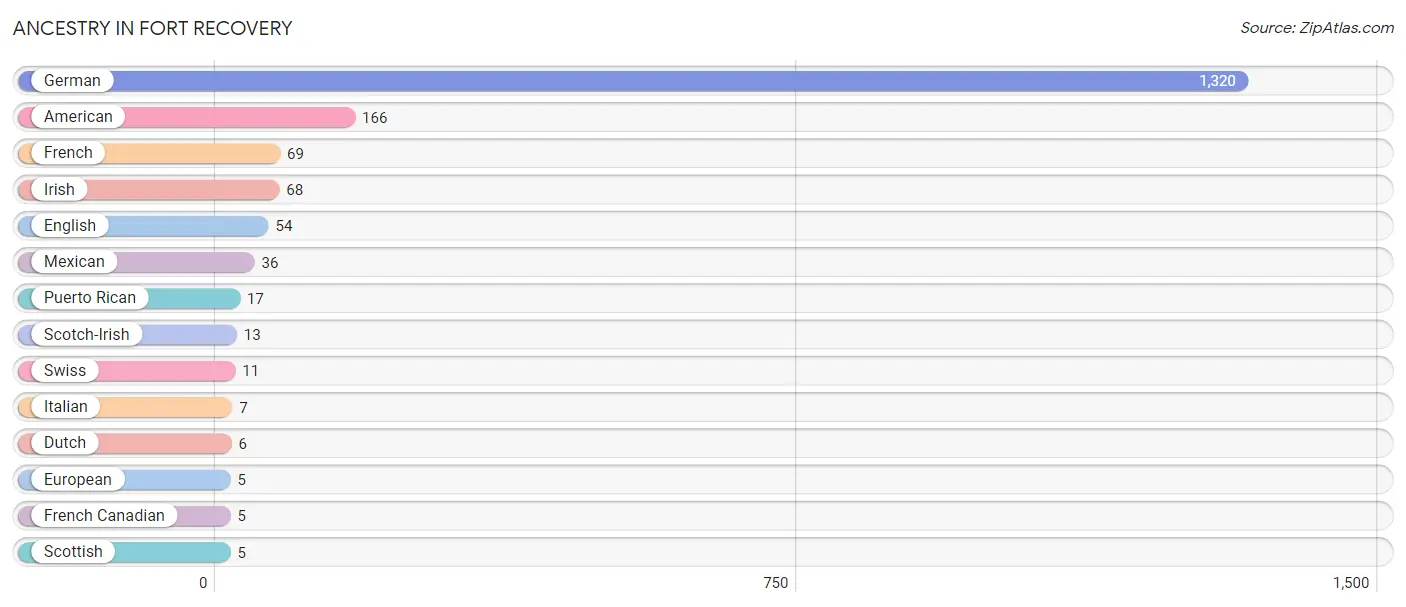
Ancestry in Fort Recovery
The most populous ancestries reported in Fort Recovery are German (1,320 | 67.5%), American (166 | 8.5%), French (69 | 3.5%), Irish (68 | 3.5%), and English (54 | 2.8%), together accounting for 85.8% of all Fort Recovery residents.
| Ancestry | # Population | % Population |
| American | 166 | 8.5% |
| Dutch | 6 | 0.3% |
| English | 54 | 2.8% |
| European | 5 | 0.3% |
| French | 69 | 3.5% |
| French Canadian | 5 | 0.3% |
| German | 1,320 | 67.5% |
| Irish | 68 | 3.5% |
| Italian | 7 | 0.4% |
| Mexican | 36 | 1.8% |
| Puerto Rican | 17 | 0.9% |
| Scotch-Irish | 13 | 0.7% |
| Scottish | 5 | 0.3% |
| Swiss | 11 | 0.6% | View All 14 Rows |
Immigrants in Fort Recovery
The most numerous immigrant groups reported in Fort Recovery came from , and Canada (3 | 0.2%), together accounting for 0.2% of all Fort Recovery residents.

| Immigration Origin | # Population | % Population |
| Canada | 3 | 0.2% | View All 1 Rows |
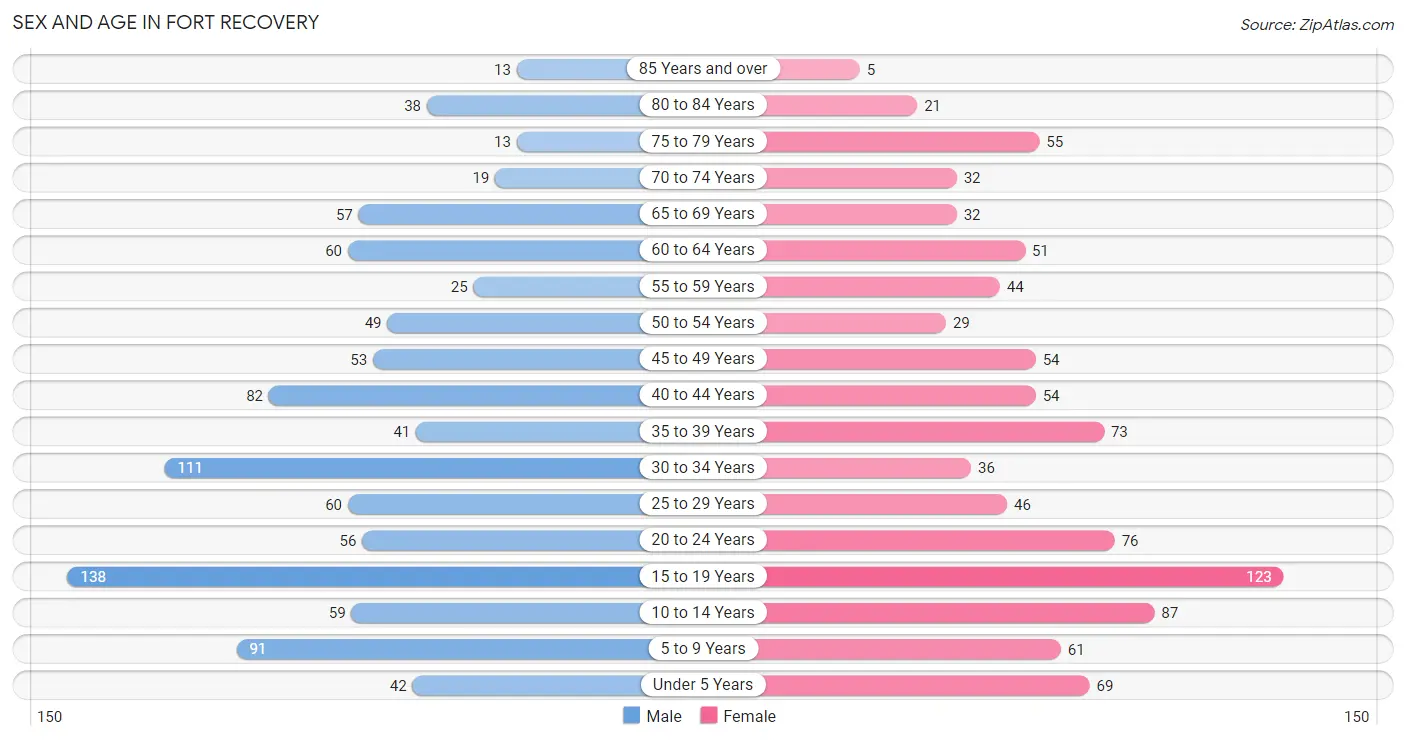
Sex and Age in Fort Recovery
Sex and Age in Fort Recovery
The most populous age groups in Fort Recovery are 15 to 19 Years (138 | 13.7%) for men and 15 to 19 Years (123 | 13.0%) for women.
| Age Bracket | Male | Female |
| Under 5 Years | 42 (4.2%) | 69 (7.3%) |
| 5 to 9 Years | 91 (9.0%) | 61 (6.4%) |
| 10 to 14 Years | 59 (5.9%) | 87 (9.2%) |
| 15 to 19 Years | 138 (13.7%) | 123 (13.0%) |
| 20 to 24 Years | 56 (5.6%) | 76 (8.0%) |
| 25 to 29 Years | 60 (6.0%) | 46 (4.9%) |
| 30 to 34 Years | 111 (11.0%) | 36 (3.8%) |
| 35 to 39 Years | 41 (4.1%) | 73 (7.7%) |
| 40 to 44 Years | 82 (8.1%) | 54 (5.7%) |
| 45 to 49 Years | 53 (5.3%) | 54 (5.7%) |
| 50 to 54 Years | 49 (4.9%) | 29 (3.1%) |
| 55 to 59 Years | 25 (2.5%) | 44 (4.6%) |
| 60 to 64 Years | 60 (6.0%) | 51 (5.4%) |
| 65 to 69 Years | 57 (5.7%) | 32 (3.4%) |
| 70 to 74 Years | 19 (1.9%) | 32 (3.4%) |
| 75 to 79 Years | 13 (1.3%) | 55 (5.8%) |
| 80 to 84 Years | 38 (3.8%) | 21 (2.2%) |
| 85 Years and over | 13 (1.3%) | 5 (0.5%) |
| Total | 1,007 (100.0%) | 948 (100.0%) |
Families and Households in Fort Recovery
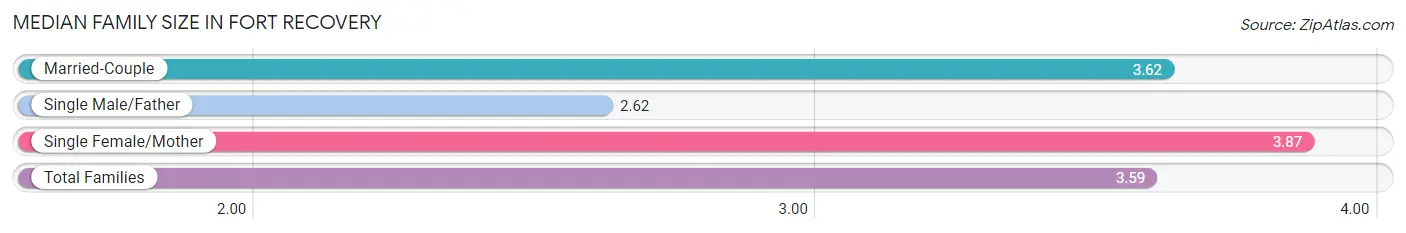
Median Family Size in Fort Recovery
The median family size in Fort Recovery is 3.59 persons per family, with single female/mother families (52 | 11.1%) accounting for the largest median family size of 3.87 persons per family. On the other hand, single male/father families (26 | 5.5%) represent the smallest median family size with 2.62 persons per family.
| Family Type | # Families | Family Size |
| Married-Couple | 391 (83.4%) | 3.62 |
| Single Male/Father | 26 (5.5%) | 2.62 |
| Single Female/Mother | 52 (11.1%) | 3.87 |
| Total Families | 469 (100.0%) | 3.59 |
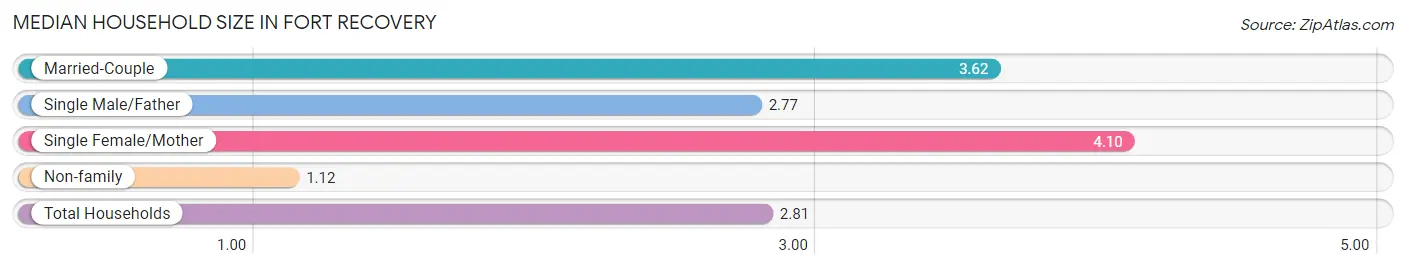
Median Household Size in Fort Recovery
The median household size in Fort Recovery is 2.81 persons per household, with single female/mother households (52 | 7.5%) accounting for the largest median household size of 4.1 persons per household. non-family households (226 | 32.5%) represent the smallest median household size with 1.12 persons per household.
| Household Type | # Households | Household Size |
| Married-Couple | 391 (56.3%) | 3.62 |
| Single Male/Father | 26 (3.7%) | 2.77 |
| Single Female/Mother | 52 (7.5%) | 4.10 |
| Non-family | 226 (32.5%) | 1.12 |
| Total Households | 695 (100.0%) | 2.81 |
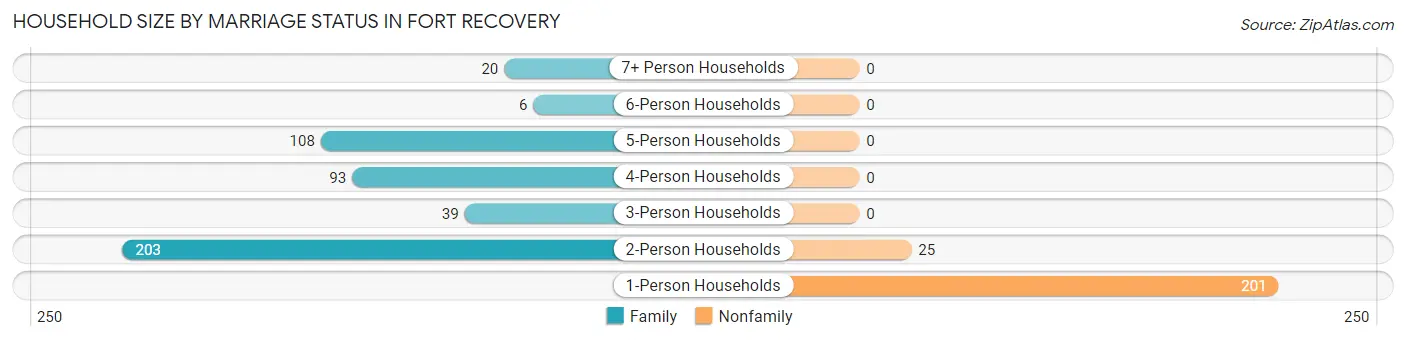
Household Size by Marriage Status in Fort Recovery
Out of a total of 695 households in Fort Recovery, 469 (67.5%) are family households, while 226 (32.5%) are nonfamily households. The most numerous type of family households are 2-person households, comprising 203, and the most common type of nonfamily households are 1-person households, comprising 201.
| Household Size | Family Households | Nonfamily Households |
| 1-Person Households | - | 201 (28.9%) |
| 2-Person Households | 203 (29.2%) | 25 (3.6%) |
| 3-Person Households | 39 (5.6%) | 0 (0.0%) |
| 4-Person Households | 93 (13.4%) | 0 (0.0%) |
| 5-Person Households | 108 (15.5%) | 0 (0.0%) |
| 6-Person Households | 6 (0.9%) | 0 (0.0%) |
| 7+ Person Households | 20 (2.9%) | 0 (0.0%) |
| Total | 469 (67.5%) | 226 (32.5%) |
Female Fertility in Fort Recovery
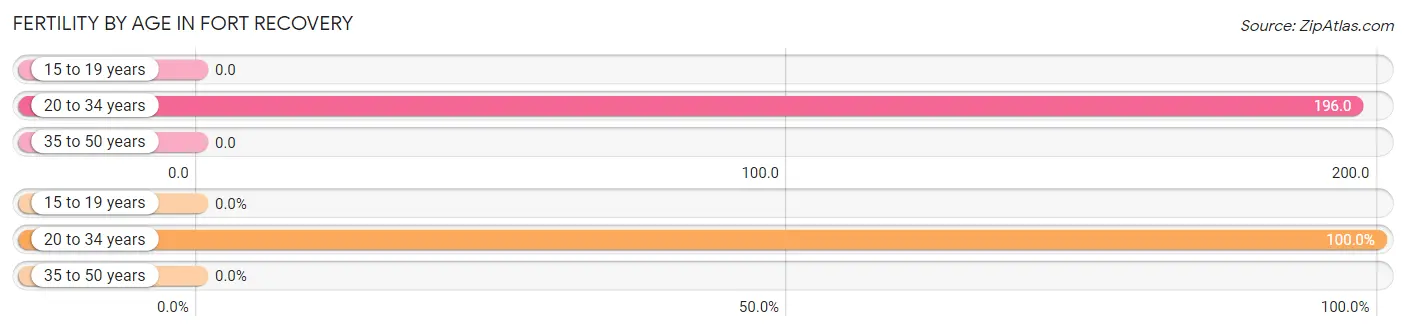
Fertility by Age in Fort Recovery
Average fertility rate in Fort Recovery is 66.0 births per 1,000 women. Women in the age bracket of 20 to 34 years have the highest fertility rate with 196.0 births per 1,000 women. Women in the age bracket of 20 to 34 years acount for 100.0% of all women with births.
| Age Bracket | Women with Births | Births / 1,000 Women |
| 15 to 19 years | 0 (0.0%) | 0.0 |
| 20 to 34 years | 31 (100.0%) | 196.0 |
| 35 to 50 years | 0 (0.0%) | 0.0 |
| Total | 31 (100.0%) | 66.0 |
Fertility by Age by Marriage Status in Fort Recovery
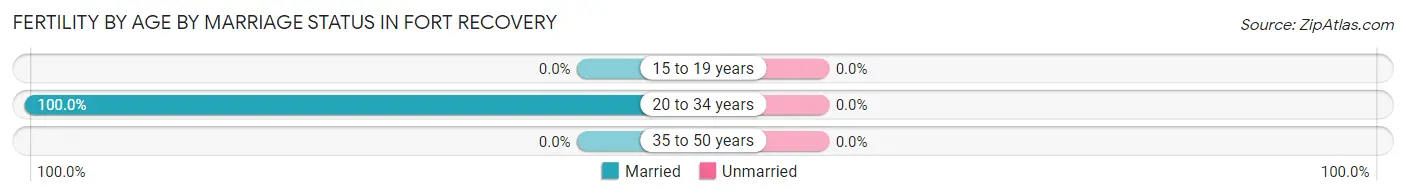
| Age Bracket | Married | Unmarried |
| 15 to 19 years | 0 (0.0%) | 0 (0.0%) |
| 20 to 34 years | 31 (100.0%) | 0 (0.0%) |
| 35 to 50 years | 0 (0.0%) | 0 (0.0%) |
| Total | 31 (100.0%) | 0 (0.0%) |
Fertility by Education in Fort Recovery
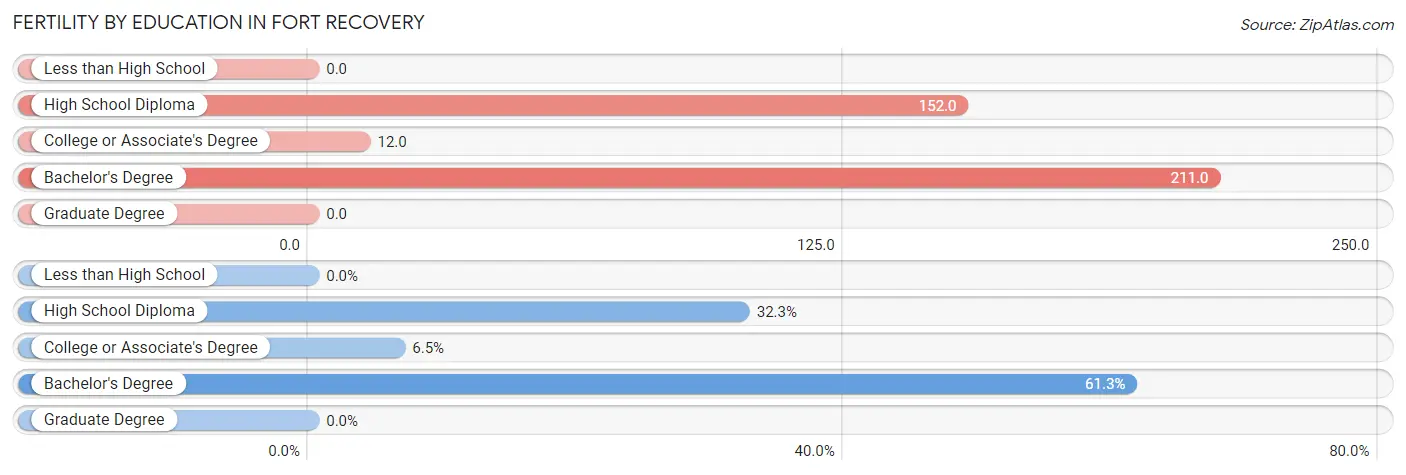
| Educational Attainment | Women with Births | Births / 1,000 Women |
| Less than High School | 0 (0.0%) | 0.0 |
| High School Diploma | 10 (32.3%) | 152.0 |
| College or Associate's Degree | 2 (6.5%) | 12.0 |
| Bachelor's Degree | 19 (61.3%) | 211.0 |
| Graduate Degree | 0 (0.0%) | 0.0 |
| Total | 31 (100.0%) | 66.0 |
Fertility by Education by Marriage Status in Fort Recovery
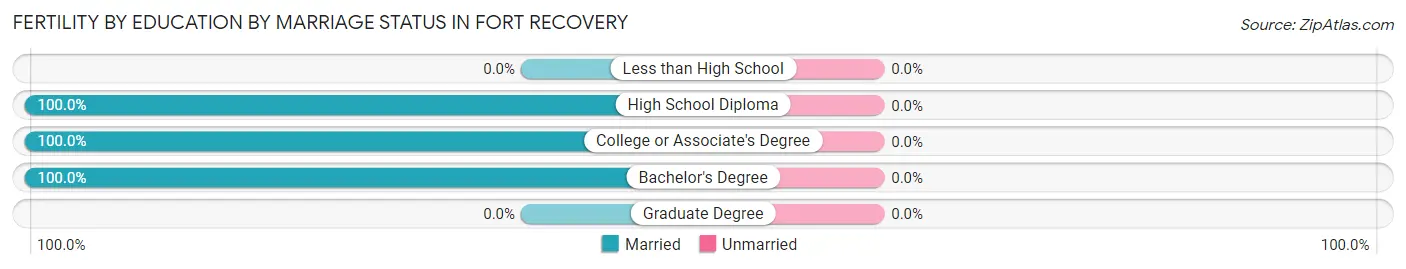
| Educational Attainment | Married | Unmarried |
| Less than High School | 0 (0.0%) | 0 (0.0%) |
| High School Diploma | 10 (100.0%) | 0 (0.0%) |
| College or Associate's Degree | 2 (100.0%) | 0 (0.0%) |
| Bachelor's Degree | 19 (100.0%) | 0 (0.0%) |
| Graduate Degree | 0 (0.0%) | 0 (0.0%) |
| Total | 31 (100.0%) | 0 (0.0%) |
Income in Fort Recovery
Income Overview in Fort Recovery
Per Capita Income in Fort Recovery is $30,407, while median incomes of families and households are $92,829 and $64,013 respectively.
| Characteristic | Number | Measure |
| Per Capita Income | 1,955 | $30,407 |
| Median Family Income | 469 | $92,829 |
| Mean Family Income | 469 | $98,897 |
| Median Household Income | 695 | $64,013 |
| Mean Household Income | 695 | $82,854 |
| Income Deficit | 469 | $0 |
| Wage / Income Gap (%) | 1,955 | 25.26% |
| Wage / Income Gap ($) | 1,955 | 74.74¢ per $1 |
| Gini / Inequality Index | 1,955 | 0.37 |
Earnings by Sex in Fort Recovery
Average Earnings in Fort Recovery are $43,974, $51,283 for men and $38,327 for women, a difference of 25.3%.
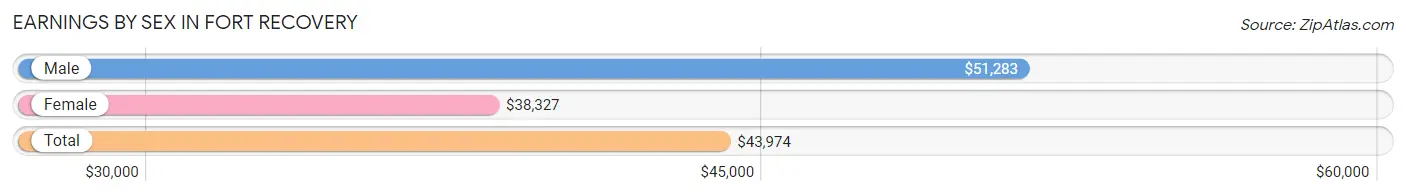
| Sex | Number | Average Earnings |
| Male | 601 (55.0%) | $51,283 |
| Female | 491 (45.0%) | $38,327 |
| Total | 1,092 (100.0%) | $43,974 |
Earnings by Sex by Income Bracket in Fort Recovery
The most common earnings brackets in Fort Recovery are $50,000 to $54,999 for men (126 | 21.0%) and $35,000 to $39,999 for women (67 | 13.7%).
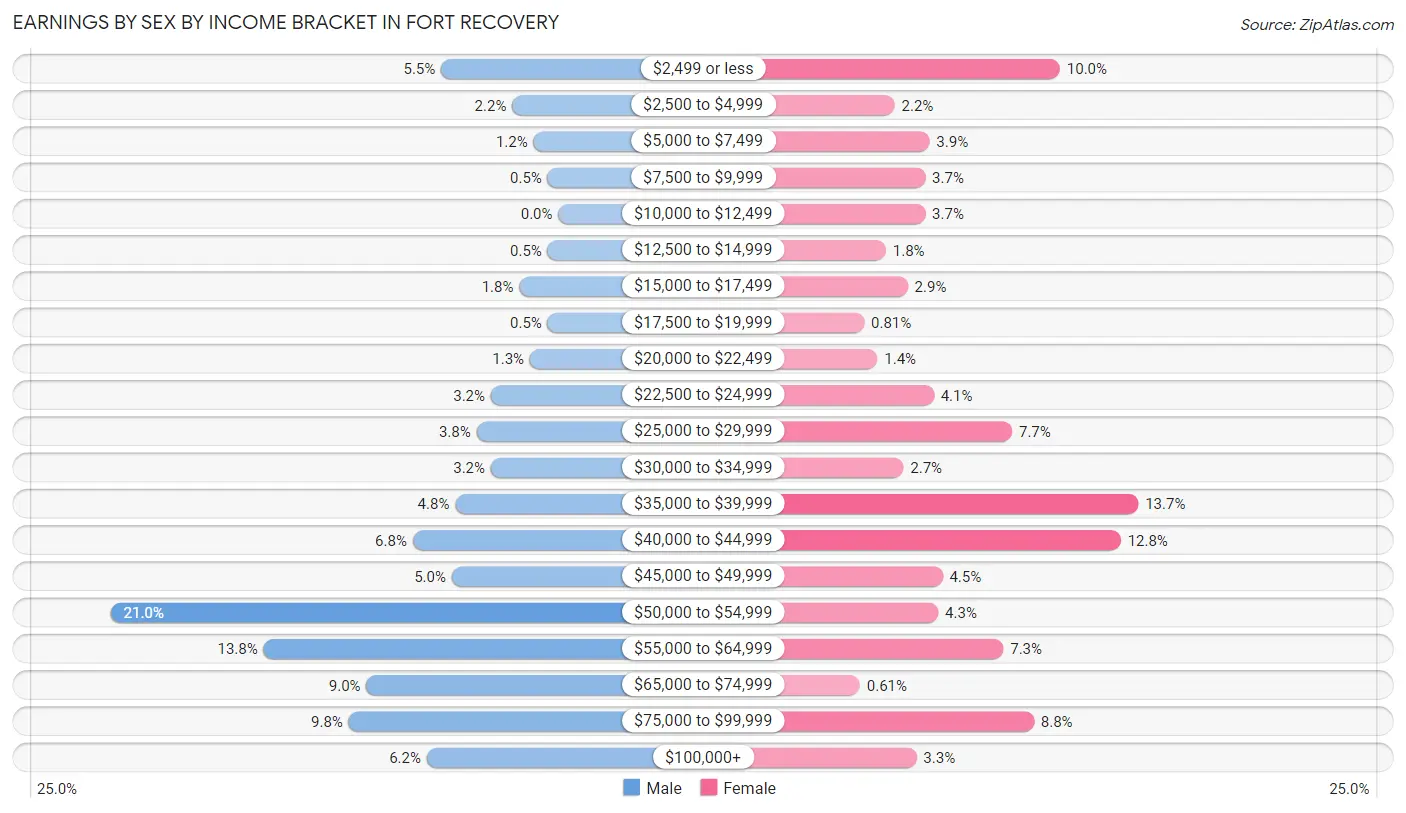
| Income | Male | Female |
| $2,499 or less | 33 (5.5%) | 49 (10.0%) |
| $2,500 to $4,999 | 13 (2.2%) | 11 (2.2%) |
| $5,000 to $7,499 | 7 (1.2%) | 19 (3.9%) |
| $7,500 to $9,999 | 3 (0.5%) | 18 (3.7%) |
| $10,000 to $12,499 | 0 (0.0%) | 18 (3.7%) |
| $12,500 to $14,999 | 3 (0.5%) | 9 (1.8%) |
| $15,000 to $17,499 | 11 (1.8%) | 14 (2.9%) |
| $17,500 to $19,999 | 3 (0.5%) | 4 (0.8%) |
| $20,000 to $22,499 | 8 (1.3%) | 7 (1.4%) |
| $22,500 to $24,999 | 19 (3.2%) | 20 (4.1%) |
| $25,000 to $29,999 | 23 (3.8%) | 38 (7.7%) |
| $30,000 to $34,999 | 19 (3.2%) | 13 (2.6%) |
| $35,000 to $39,999 | 29 (4.8%) | 67 (13.7%) |
| $40,000 to $44,999 | 41 (6.8%) | 63 (12.8%) |
| $45,000 to $49,999 | 30 (5.0%) | 22 (4.5%) |
| $50,000 to $54,999 | 126 (21.0%) | 21 (4.3%) |
| $55,000 to $64,999 | 83 (13.8%) | 36 (7.3%) |
| $65,000 to $74,999 | 54 (9.0%) | 3 (0.6%) |
| $75,000 to $99,999 | 59 (9.8%) | 43 (8.8%) |
| $100,000+ | 37 (6.2%) | 16 (3.3%) |
| Total | 601 (100.0%) | 491 (100.0%) |
Earnings by Sex by Educational Attainment in Fort Recovery
Average earnings in Fort Recovery are $52,348 for men and $40,515 for women, a difference of 22.6%. Men with an educational attainment of bachelor's degree enjoy the highest average annual earnings of $61,071, while those with college or associate's degree education earn the least with $51,521. Women with an educational attainment of graduate degree earn the most with the average annual earnings of $78,906, while those with high school diploma education have the smallest earnings of $25,682.
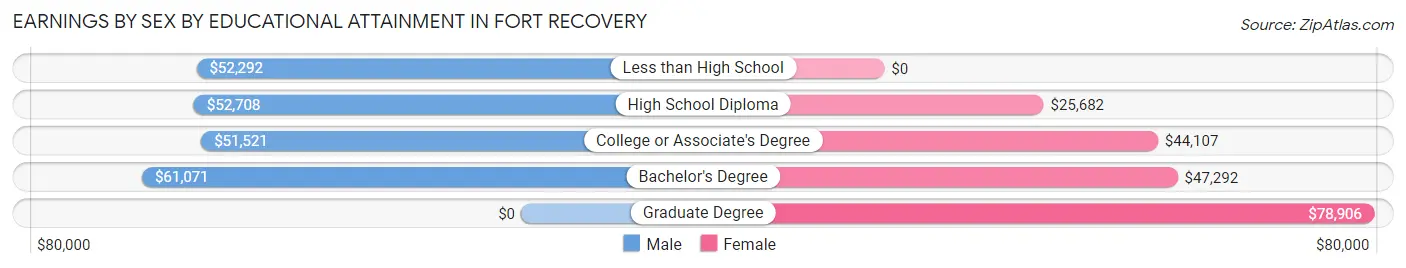
| Educational Attainment | Male Income | Female Income |
| Less than High School | $52,292 | $0 |
| High School Diploma | $52,708 | $25,682 |
| College or Associate's Degree | $51,521 | $44,107 |
| Bachelor's Degree | $61,071 | $47,292 |
| Graduate Degree | - | - |
| Total | $52,348 | $40,515 |
Family Income in Fort Recovery
Family Income Brackets in Fort Recovery
According to the Fort Recovery family income data, there are 124 families falling into the $100,000 to $149,999 income range, which is the most common income bracket and makes up 26.4% of all families.
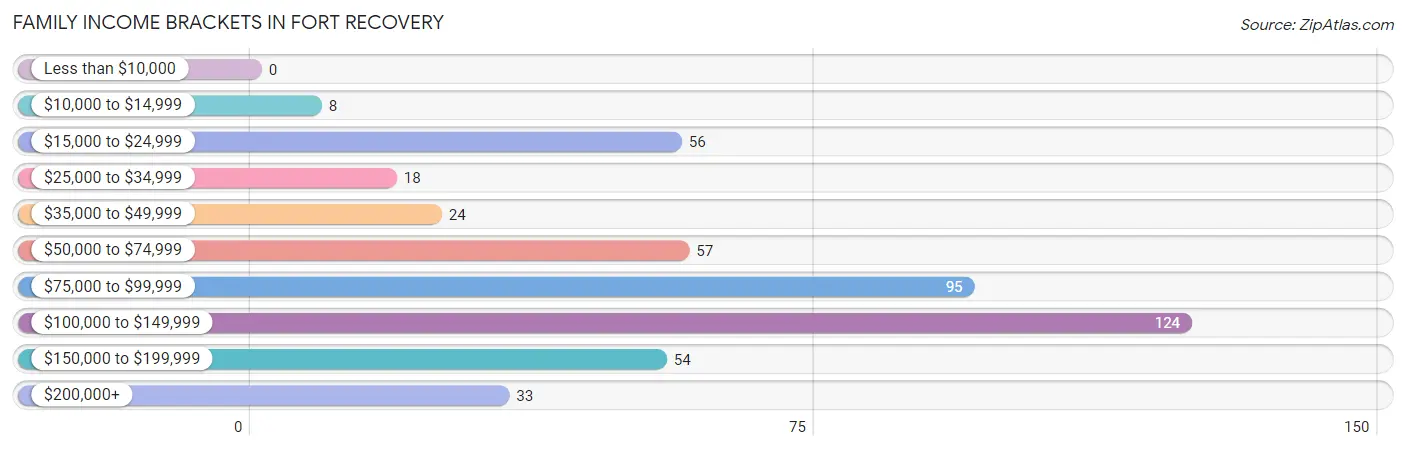
| Income Bracket | # Families | % Families |
| Less than $10,000 | 0 | 0.0% |
| $10,000 to $14,999 | 8 | 1.7% |
| $15,000 to $24,999 | 56 | 11.9% |
| $25,000 to $34,999 | 18 | 3.8% |
| $35,000 to $49,999 | 24 | 5.1% |
| $50,000 to $74,999 | 57 | 12.2% |
| $75,000 to $99,999 | 95 | 20.3% |
| $100,000 to $149,999 | 124 | 26.4% |
| $150,000 to $199,999 | 54 | 11.5% |
| $200,000+ | 33 | 7.0% |
Family Income by Famaliy Size in Fort Recovery
5-person families (104 | 22.2%) account for the highest median family income in Fort Recovery with $118,600 per family, while 3-person families (31 | 6.6%) have the highest median income of $39,028 per family member.
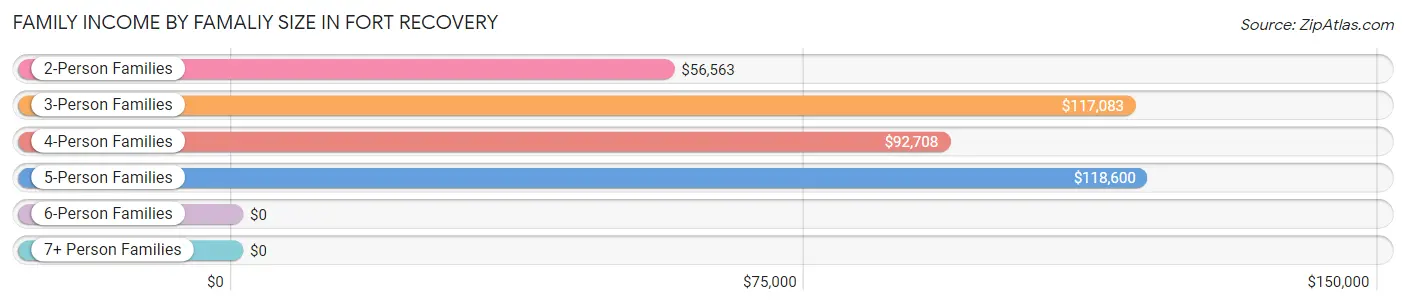
| Income Bracket | # Families | Median Income |
| 2-Person Families | 211 (45.0%) | $56,563 |
| 3-Person Families | 31 (6.6%) | $117,083 |
| 4-Person Families | 97 (20.7%) | $92,708 |
| 5-Person Families | 104 (22.2%) | $118,600 |
| 6-Person Families | 6 (1.3%) | $0 |
| 7+ Person Families | 20 (4.3%) | $0 |
| Total | 469 (100.0%) | $92,829 |
Family Income by Number of Earners in Fort Recovery
The median family income in Fort Recovery is $92,829, with families comprising 3+ earners (102) having the highest median family income of $131,250, while families with no earners (73) have the lowest median family income of $22,074, accounting for 21.7% and 15.6% of families, respectively.
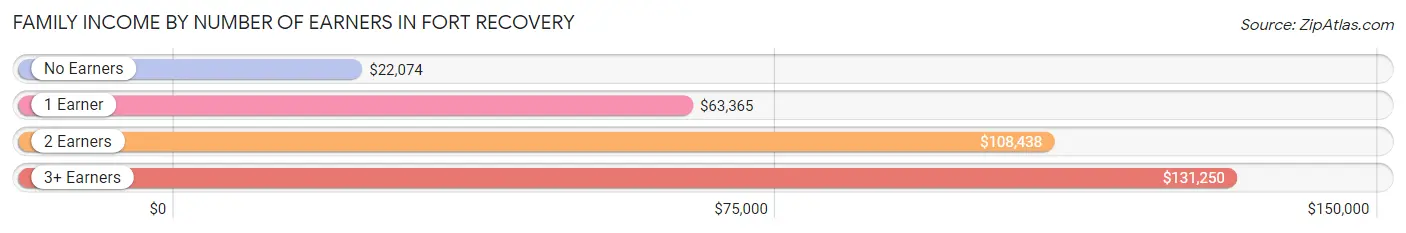
| Number of Earners | # Families | Median Income |
| No Earners | 73 (15.6%) | $22,074 |
| 1 Earner | 99 (21.1%) | $63,365 |
| 2 Earners | 195 (41.6%) | $108,438 |
| 3+ Earners | 102 (21.7%) | $131,250 |
| Total | 469 (100.0%) | $92,829 |
Household Income in Fort Recovery
Household Income Brackets in Fort Recovery
With 161 households falling in the category, the $50,000 to $74,999 income range is the most frequent in Fort Recovery, accounting for 23.2% of all households. In contrast, only 5 households (0.7%) fall into the less than $10,000 income bracket, making it the least populous group.
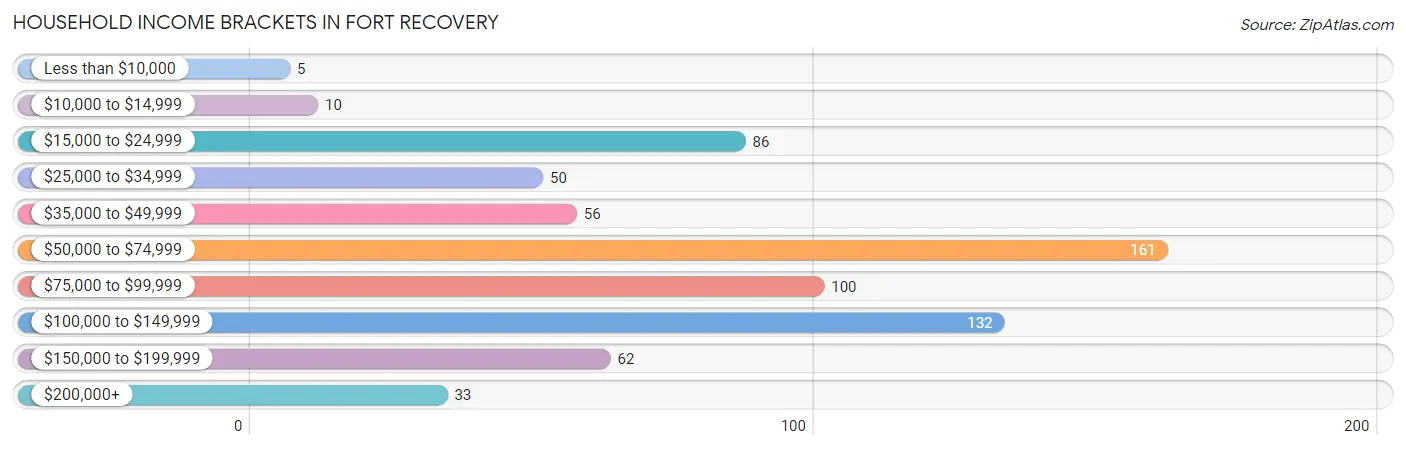
| Income Bracket | # Households | % Households |
| Less than $10,000 | 5 | 0.7% |
| $10,000 to $14,999 | 10 | 1.4% |
| $15,000 to $24,999 | 86 | 12.4% |
| $25,000 to $34,999 | 50 | 7.2% |
| $35,000 to $49,999 | 56 | 8.1% |
| $50,000 to $74,999 | 161 | 23.2% |
| $75,000 to $99,999 | 100 | 14.4% |
| $100,000 to $149,999 | 132 | 19.0% |
| $150,000 to $199,999 | 62 | 8.9% |
| $200,000+ | 33 | 4.7% |
Household Income by Householder Age in Fort Recovery
The median household income in Fort Recovery is $64,013, with the highest median household income of $106,875 found in the 45 to 64 years age bracket for the primary householder. A total of 183 households (26.3%) fall into this category. Meanwhile, the 15 to 24 years age bracket for the primary householder has the lowest median household income of $0, with 6 households (0.9%) in this group.
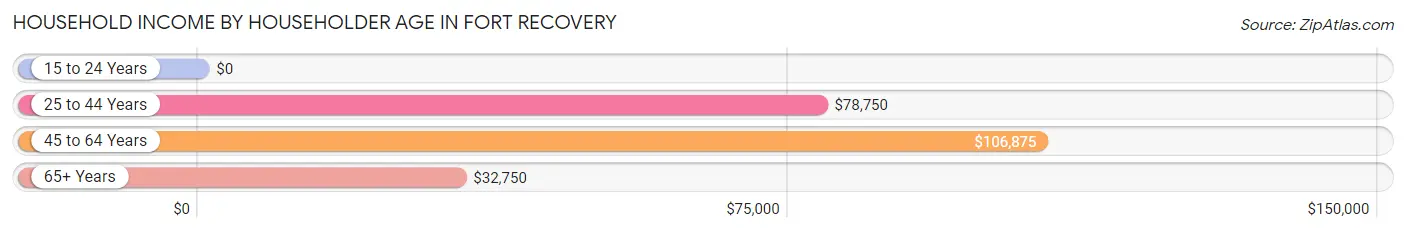
| Income Bracket | # Households | Median Income |
| 15 to 24 Years | 6 (0.9%) | $0 |
| 25 to 44 Years | 317 (45.6%) | $78,750 |
| 45 to 64 Years | 183 (26.3%) | $106,875 |
| 65+ Years | 189 (27.2%) | $32,750 |
| Total | 695 (100.0%) | $64,013 |
Poverty in Fort Recovery
Income Below Poverty by Sex and Age in Fort Recovery
With 2.9% poverty level for males and 2.2% for females among the residents of Fort Recovery, 25 to 34 year old males and 5 year old females are the most vulnerable to poverty, with 13 males (7.6%) and 2 females (25.0%) in their respective age groups living below the poverty level.
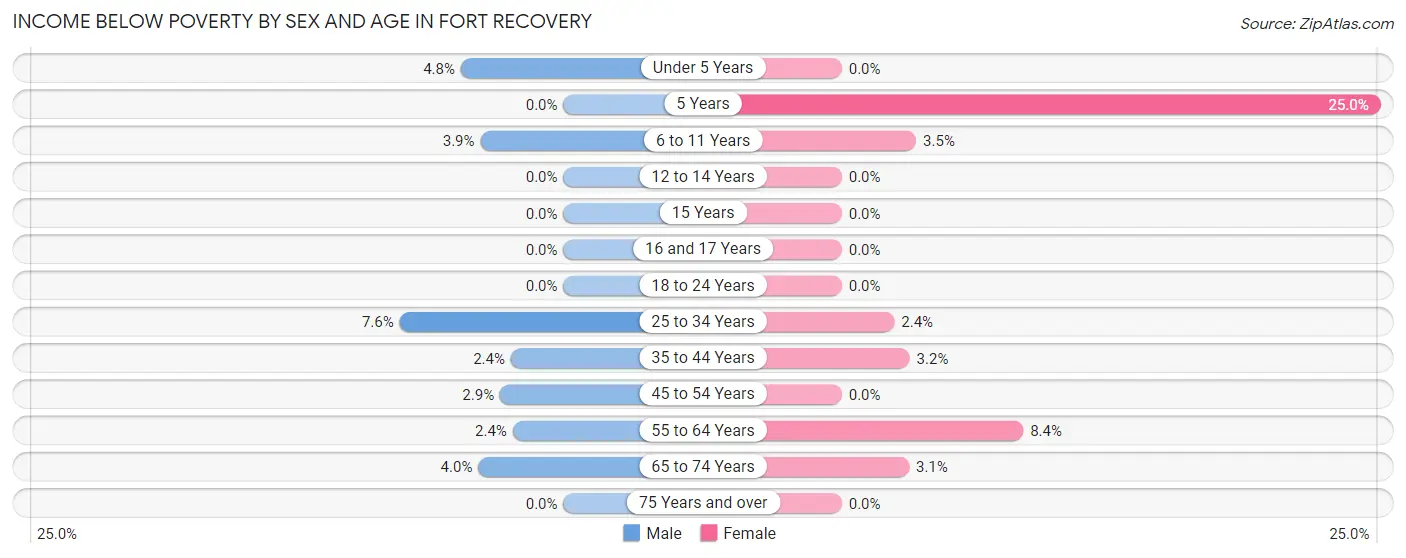
| Age Bracket | Male | Female |
| Under 5 Years | 2 (4.8%) | 0 (0.0%) |
| 5 Years | 0 (0.0%) | 2 (25.0%) |
| 6 to 11 Years | 3 (3.8%) | 3 (3.5%) |
| 12 to 14 Years | 0 (0.0%) | 0 (0.0%) |
| 15 Years | 0 (0.0%) | 0 (0.0%) |
| 16 and 17 Years | 0 (0.0%) | 0 (0.0%) |
| 18 to 24 Years | 0 (0.0%) | 0 (0.0%) |
| 25 to 34 Years | 13 (7.6%) | 2 (2.4%) |
| 35 to 44 Years | 3 (2.4%) | 4 (3.2%) |
| 45 to 54 Years | 3 (2.9%) | 0 (0.0%) |
| 55 to 64 Years | 2 (2.4%) | 8 (8.4%) |
| 65 to 74 Years | 3 (4.0%) | 2 (3.1%) |
| 75 Years and over | 0 (0.0%) | 0 (0.0%) |
| Total | 29 (2.9%) | 21 (2.2%) |
Income Above Poverty by Sex and Age in Fort Recovery
According to the poverty statistics in Fort Recovery, males aged 5 years and females aged under 5 years are the age groups that are most secure financially, with 100.0% of males and 100.0% of females in these age groups living above the poverty line.
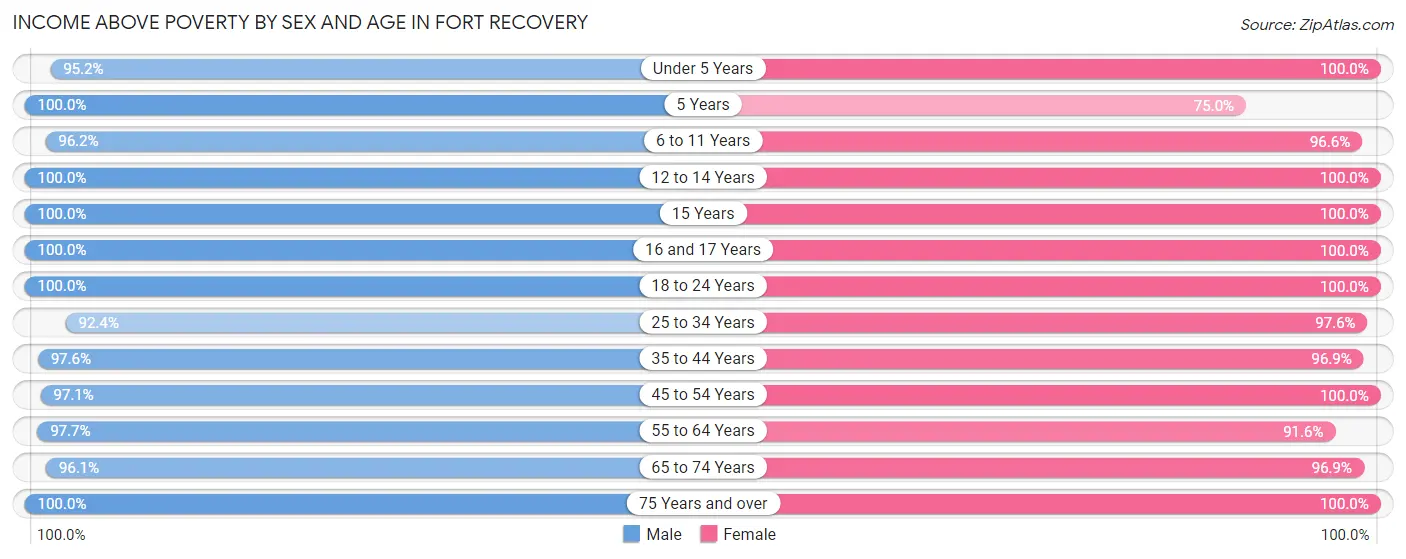
| Age Bracket | Male | Female |
| Under 5 Years | 40 (95.2%) | 69 (100.0%) |
| 5 Years | 35 (100.0%) | 6 (75.0%) |
| 6 to 11 Years | 75 (96.2%) | 84 (96.6%) |
| 12 to 14 Years | 37 (100.0%) | 53 (100.0%) |
| 15 Years | 54 (100.0%) | 21 (100.0%) |
| 16 and 17 Years | 57 (100.0%) | 75 (100.0%) |
| 18 to 24 Years | 83 (100.0%) | 103 (100.0%) |
| 25 to 34 Years | 158 (92.4%) | 80 (97.6%) |
| 35 to 44 Years | 120 (97.6%) | 123 (96.9%) |
| 45 to 54 Years | 99 (97.1%) | 83 (100.0%) |
| 55 to 64 Years | 83 (97.7%) | 87 (91.6%) |
| 65 to 74 Years | 73 (96.1%) | 62 (96.9%) |
| 75 Years and over | 64 (100.0%) | 81 (100.0%) |
| Total | 978 (97.1%) | 927 (97.8%) |
Income Below Poverty Among Married-Couple Families in Fort Recovery
The poverty statistics for married-couple families in Fort Recovery show that 0.5% or 2 of the total 391 families live below the poverty line. Families with 3 or 4 children have the highest poverty rate of 3.2%, comprising of 2 families. On the other hand, families with no children have the lowest poverty rate of 0.0%, which includes 0 families.
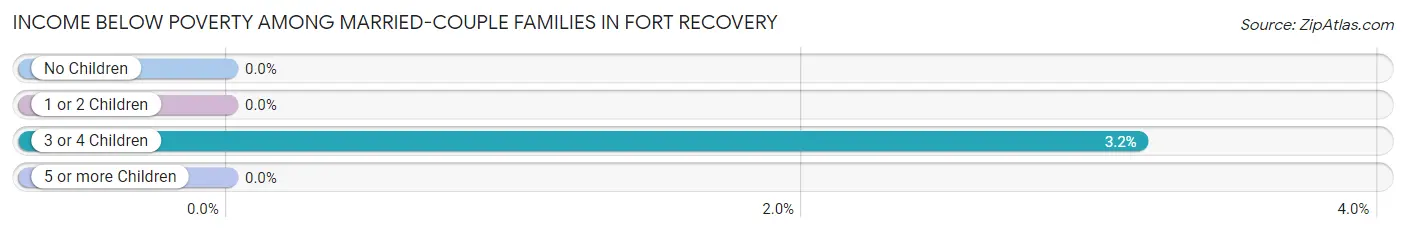
| Children | Above Poverty | Below Poverty |
| No Children | 185 (100.0%) | 0 (0.0%) |
| 1 or 2 Children | 143 (100.0%) | 0 (0.0%) |
| 3 or 4 Children | 61 (96.8%) | 2 (3.2%) |
| 5 or more Children | 0 (0.0%) | 0 (0.0%) |
| Total | 389 (99.5%) | 2 (0.5%) |
Income Below Poverty Among Single-Parent Households in Fort Recovery
According to the poverty data in Fort Recovery, 11.5% or 3 single-father households and 15.4% or 8 single-mother households are living below the poverty line. Among single-father households, those with 1 or 2 children have the highest poverty rate, with 3 households (21.4%) experiencing poverty. Likewise, among single-mother households, those with no children have the highest poverty rate, with 8 households (33.3%) falling below the poverty line.
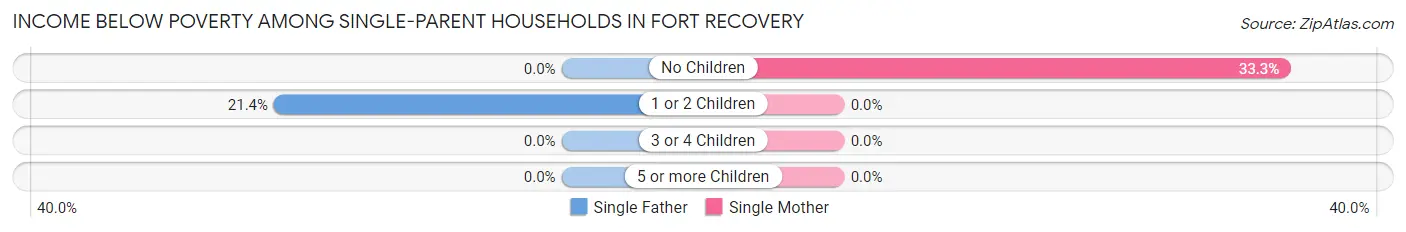
| Children | Single Father | Single Mother |
| No Children | 0 (0.0%) | 8 (33.3%) |
| 1 or 2 Children | 3 (21.4%) | 0 (0.0%) |
| 3 or 4 Children | 0 (0.0%) | 0 (0.0%) |
| 5 or more Children | 0 (0.0%) | 0 (0.0%) |
| Total | 3 (11.5%) | 8 (15.4%) |
Income Below Poverty Among Married-Couple vs Single-Parent Households in Fort Recovery
The poverty data for Fort Recovery shows that 2 of the married-couple family households (0.5%) and 11 of the single-parent households (14.1%) are living below the poverty level. Within the married-couple family households, those with 3 or 4 children have the highest poverty rate, with 2 households (3.2%) falling below the poverty line. Among the single-parent households, those with no children have the highest poverty rate, with 8 household (25.0%) living below poverty.
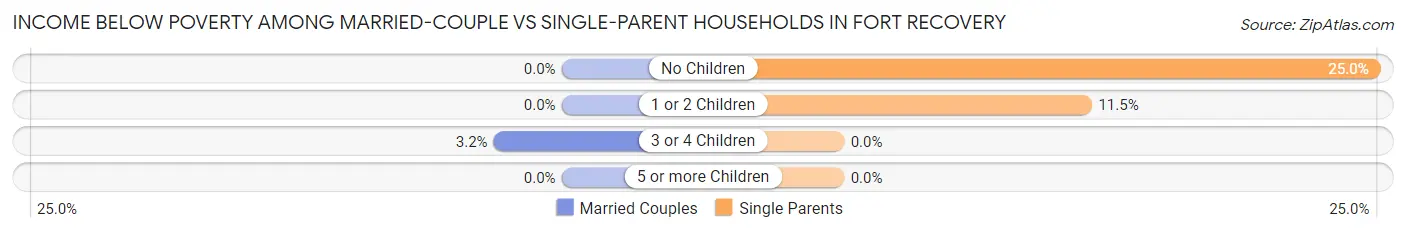
| Children | Married-Couple Families | Single-Parent Households |
| No Children | 0 (0.0%) | 8 (25.0%) |
| 1 or 2 Children | 0 (0.0%) | 3 (11.5%) |
| 3 or 4 Children | 2 (3.2%) | 0 (0.0%) |
| 5 or more Children | 0 (0.0%) | 0 (0.0%) |
| Total | 2 (0.5%) | 11 (14.1%) |
Employment Characteristics in Fort Recovery
Employment by Class of Employer in Fort Recovery
Among the 987 employed individuals in Fort Recovery, private company employees (758 | 76.8%), local government employees (81 | 8.2%), and not-for-profit organizations (59 | 6.0%) make up the most common classes of employment.
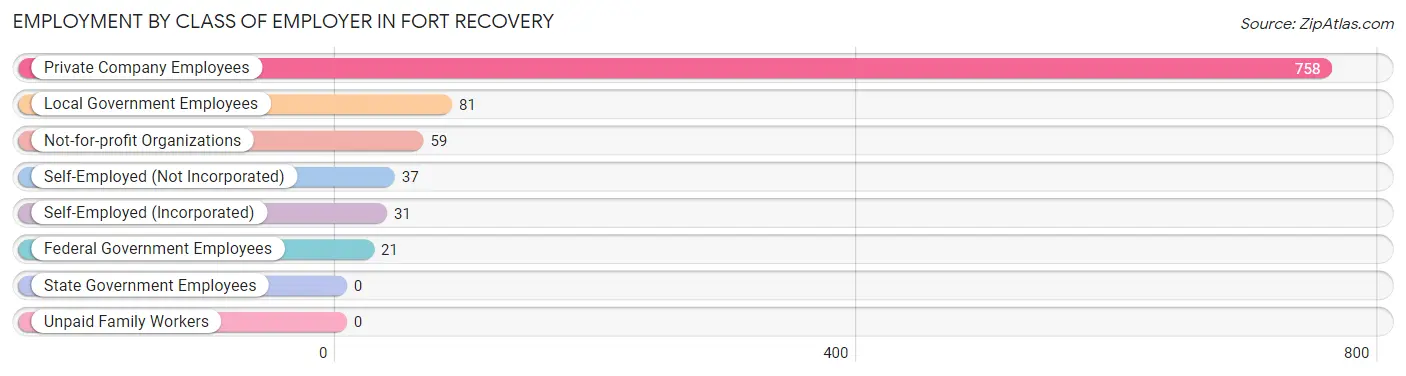
| Employer Class | # Employees | % Employees |
| Private Company Employees | 758 | 76.8% |
| Self-Employed (Incorporated) | 31 | 3.1% |
| Self-Employed (Not Incorporated) | 37 | 3.7% |
| Not-for-profit Organizations | 59 | 6.0% |
| Local Government Employees | 81 | 8.2% |
| State Government Employees | 0 | 0.0% |
| Federal Government Employees | 21 | 2.1% |
| Unpaid Family Workers | 0 | 0.0% |
| Total | 987 | 100.0% |
Employment Status by Age in Fort Recovery
According to the labor force statistics for Fort Recovery, out of the total population over 16 years of age (1,471), 70.3% or 1,034 individuals are in the labor force, with 2.6% or 27 of them unemployed. The age group with the highest labor force participation rate is 25 to 29 years, with 100.0% or 106 individuals in the labor force. Within the labor force, the 20 to 24 years age range has the highest percentage of unemployed individuals, with 11.3% or 13 of them being unemployed.
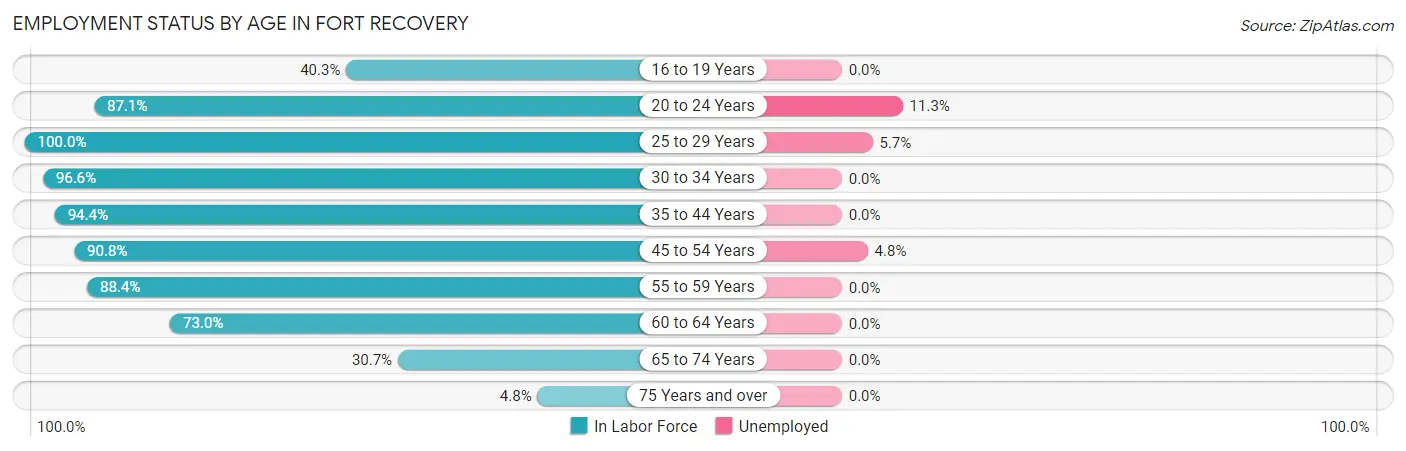
| Age Bracket | In Labor Force | Unemployed |
| 16 to 19 Years | 75 (40.3%) | 0 (0.0%) |
| 20 to 24 Years | 115 (87.1%) | 13 (11.3%) |
| 25 to 29 Years | 106 (100.0%) | 6 (5.7%) |
| 30 to 34 Years | 142 (96.6%) | 0 (0.0%) |
| 35 to 44 Years | 236 (94.4%) | 0 (0.0%) |
| 45 to 54 Years | 168 (90.8%) | 8 (4.8%) |
| 55 to 59 Years | 61 (88.4%) | 0 (0.0%) |
| 60 to 64 Years | 81 (73.0%) | 0 (0.0%) |
| 65 to 74 Years | 43 (30.7%) | 0 (0.0%) |
| 75 Years and over | 7 (4.8%) | 0 (0.0%) |
| Total | 1,034 (70.3%) | 27 (2.6%) |
Employment Status by Educational Attainment in Fort Recovery
According to labor force statistics for Fort Recovery, 91.5% of individuals (794) out of the total population between 25 and 64 years of age (868) are in the labor force, with 1.8% or 14 of them being unemployed. The group with the highest labor force participation rate are those with the educational attainment of bachelor's degree or higher, with 95.4% or 229 individuals in the labor force. Within the labor force, individuals with high school diploma education have the highest percentage of unemployment, with 6.2% or 14 of them being unemployed.
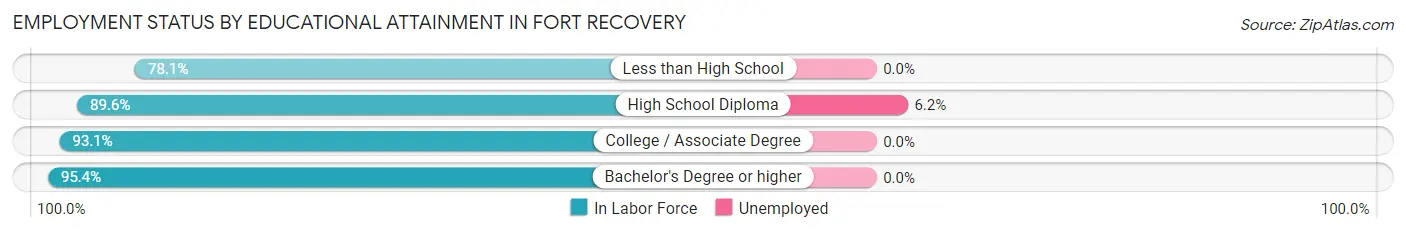
| Educational Attainment | In Labor Force | Unemployed |
| Less than High School | 57 (78.1%) | 0 (0.0%) |
| High School Diploma | 225 (89.6%) | 16 (6.2%) |
| College / Associate Degree | 283 (93.1%) | 0 (0.0%) |
| Bachelor's Degree or higher | 229 (95.4%) | 0 (0.0%) |
| Total | 794 (91.5%) | 16 (1.8%) |
Employment Occupations by Sex in Fort Recovery
Management, Business, Science and Arts Occupations
The most common Management, Business, Science and Arts occupations in Fort Recovery are Health Diagnosing & Treating (125 | 12.4%), Health Technologists (104 | 10.3%), Management (69 | 6.9%), Computers, Engineering & Science (60 | 6.0%), and Community & Social Service (52 | 5.2%).
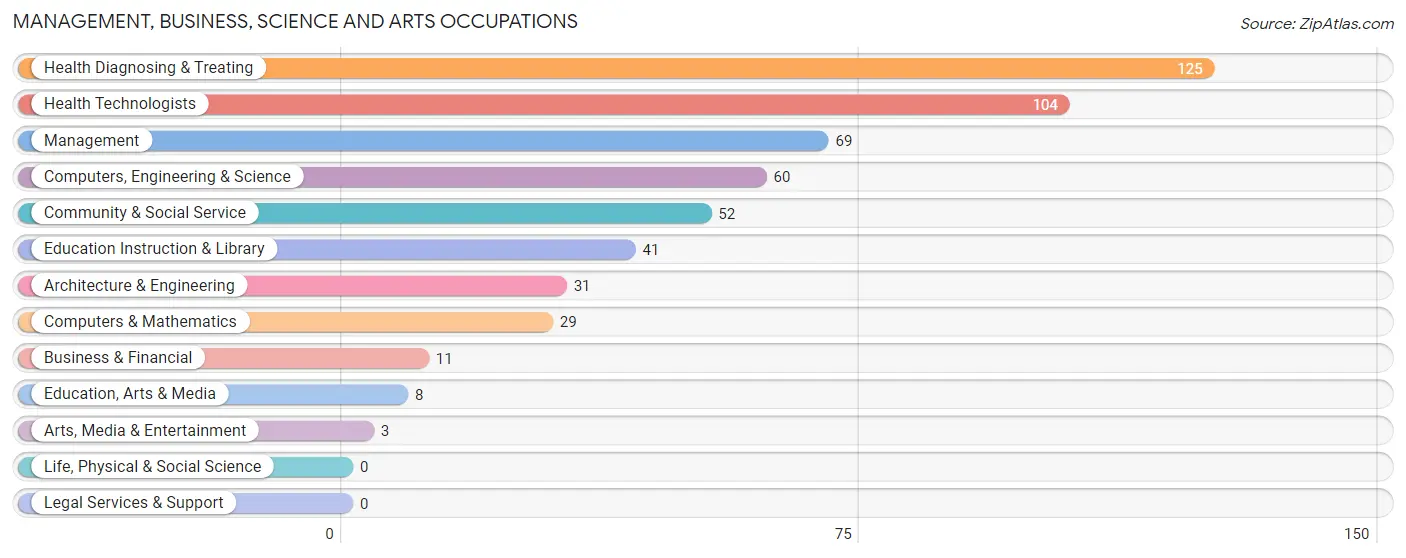
Management, Business, Science and Arts Occupations by Sex
Within the Management, Business, Science and Arts occupations in Fort Recovery, the most male-oriented occupations are Business & Financial (100.0%), Computers & Mathematics (100.0%), and Arts, Media & Entertainment (100.0%), while the most female-oriented occupations are Education Instruction & Library (100.0%), Health Diagnosing & Treating (97.6%), and Health Technologists (97.1%).
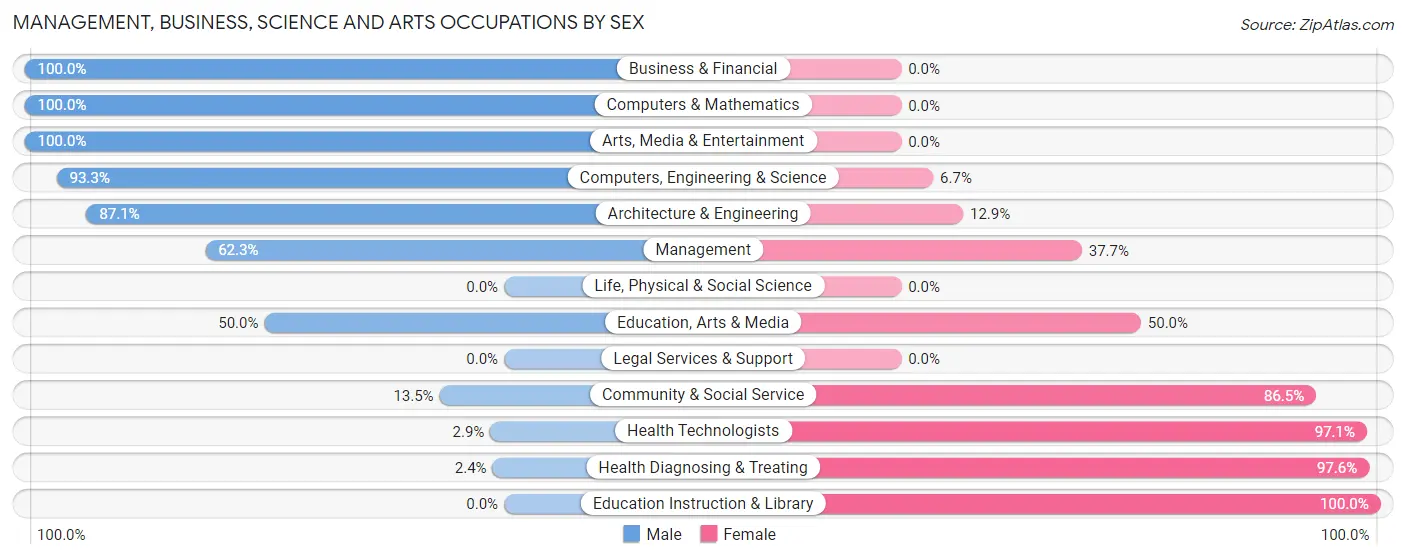
| Occupation | Male | Female |
| Management | 43 (62.3%) | 26 (37.7%) |
| Business & Financial | 11 (100.0%) | 0 (0.0%) |
| Computers, Engineering & Science | 56 (93.3%) | 4 (6.7%) |
| Computers & Mathematics | 29 (100.0%) | 0 (0.0%) |
| Architecture & Engineering | 27 (87.1%) | 4 (12.9%) |
| Life, Physical & Social Science | 0 (0.0%) | 0 (0.0%) |
| Community & Social Service | 7 (13.5%) | 45 (86.5%) |
| Education, Arts & Media | 4 (50.0%) | 4 (50.0%) |
| Legal Services & Support | 0 (0.0%) | 0 (0.0%) |
| Education Instruction & Library | 0 (0.0%) | 41 (100.0%) |
| Arts, Media & Entertainment | 3 (100.0%) | 0 (0.0%) |
| Health Diagnosing & Treating | 3 (2.4%) | 122 (97.6%) |
| Health Technologists | 3 (2.9%) | 101 (97.1%) |
| Total (Category) | 120 (37.9%) | 197 (62.2%) |
| Total (Overall) | 572 (56.8%) | 435 (43.2%) |
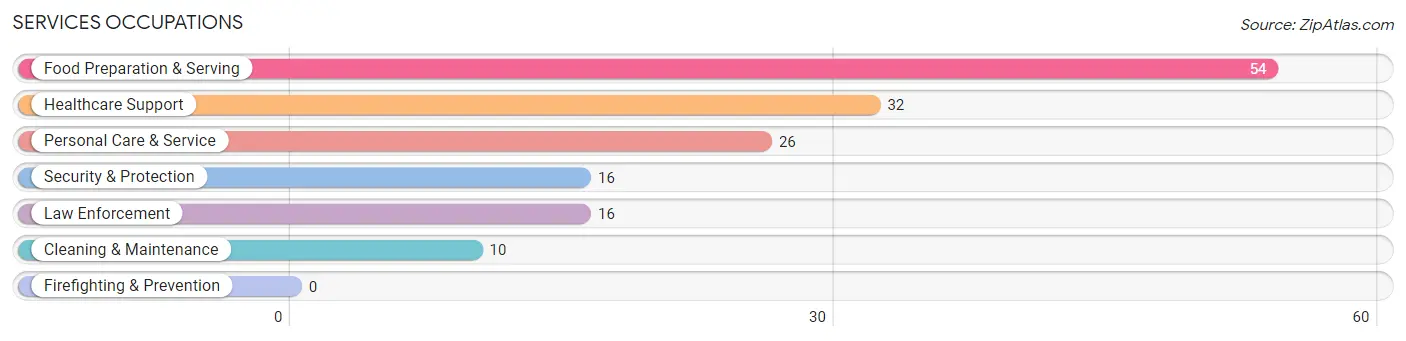
Services Occupations
The most common Services occupations in Fort Recovery are Food Preparation & Serving (54 | 5.4%), Healthcare Support (32 | 3.2%), Personal Care & Service (26 | 2.6%), Security & Protection (16 | 1.6%), and Law Enforcement (16 | 1.6%).
Services Occupations by Sex
Within the Services occupations in Fort Recovery, the most male-oriented occupations are Security & Protection (100.0%), Law Enforcement (100.0%), and Food Preparation & Serving (40.7%), while the most female-oriented occupations are Healthcare Support (100.0%), Personal Care & Service (84.6%), and Cleaning & Maintenance (80.0%).
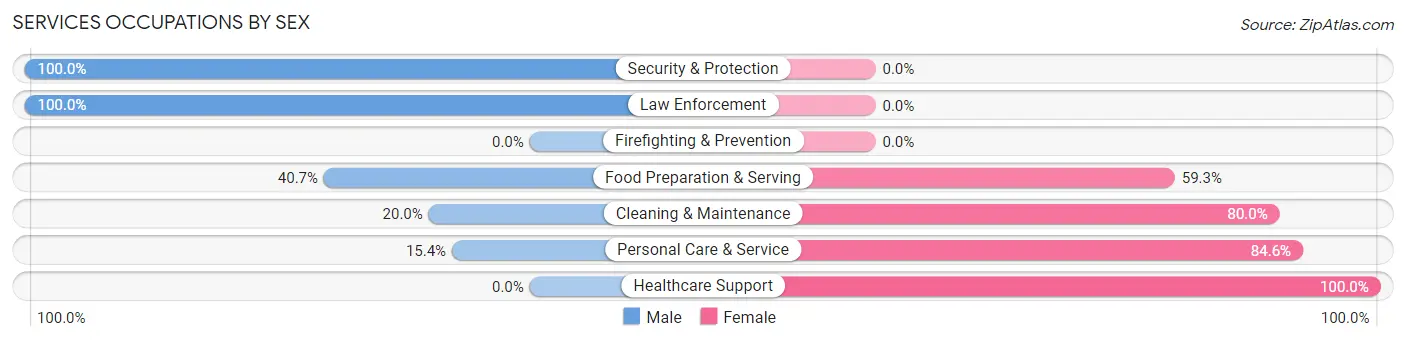
| Occupation | Male | Female |
| Healthcare Support | 0 (0.0%) | 32 (100.0%) |
| Security & Protection | 16 (100.0%) | 0 (0.0%) |
| Firefighting & Prevention | 0 (0.0%) | 0 (0.0%) |
| Law Enforcement | 16 (100.0%) | 0 (0.0%) |
| Food Preparation & Serving | 22 (40.7%) | 32 (59.3%) |
| Cleaning & Maintenance | 2 (20.0%) | 8 (80.0%) |
| Personal Care & Service | 4 (15.4%) | 22 (84.6%) |
| Total (Category) | 44 (31.9%) | 94 (68.1%) |
| Total (Overall) | 572 (56.8%) | 435 (43.2%) |
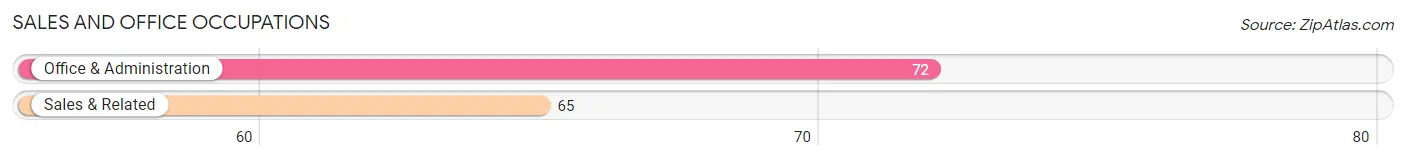
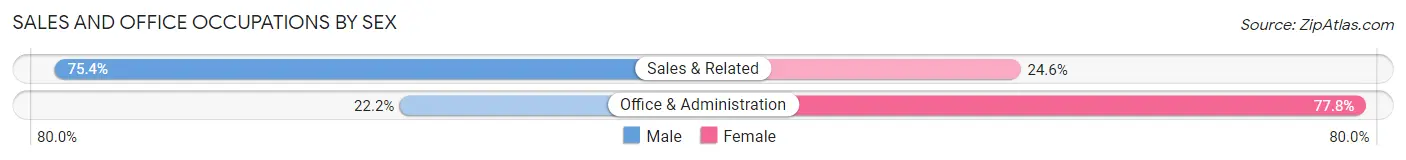
Sales and Office Occupations
The most common Sales and Office occupations in Fort Recovery are Office & Administration (72 | 7.1%), and Sales & Related (65 | 6.5%).
Sales and Office Occupations by Sex
| Occupation | Male | Female |
| Sales & Related | 49 (75.4%) | 16 (24.6%) |
| Office & Administration | 16 (22.2%) | 56 (77.8%) |
| Total (Category) | 65 (47.4%) | 72 (52.5%) |
| Total (Overall) | 572 (56.8%) | 435 (43.2%) |
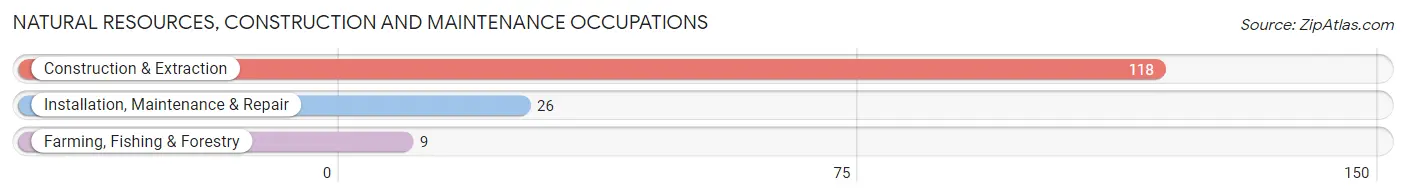
Natural Resources, Construction and Maintenance Occupations
The most common Natural Resources, Construction and Maintenance occupations in Fort Recovery are Construction & Extraction (118 | 11.7%), Installation, Maintenance & Repair (26 | 2.6%), and Farming, Fishing & Forestry (9 | 0.9%).
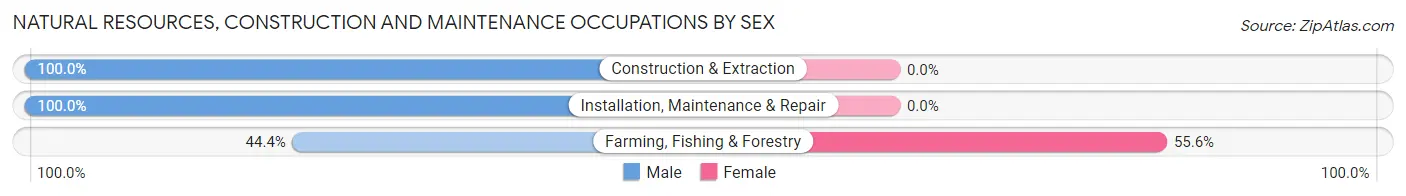
Natural Resources, Construction and Maintenance Occupations by Sex
| Occupation | Male | Female |
| Farming, Fishing & Forestry | 4 (44.4%) | 5 (55.6%) |
| Construction & Extraction | 118 (100.0%) | 0 (0.0%) |
| Installation, Maintenance & Repair | 26 (100.0%) | 0 (0.0%) |
| Total (Category) | 148 (96.7%) | 5 (3.3%) |
| Total (Overall) | 572 (56.8%) | 435 (43.2%) |
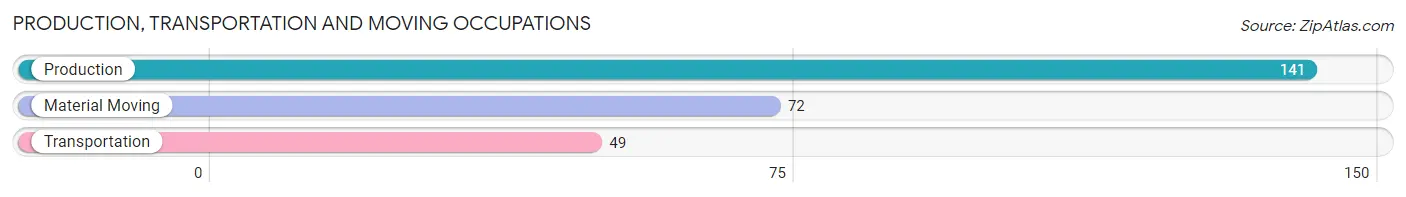
Production, Transportation and Moving Occupations
The most common Production, Transportation and Moving occupations in Fort Recovery are Production (141 | 14.0%), Material Moving (72 | 7.1%), and Transportation (49 | 4.9%).
Production, Transportation and Moving Occupations by Sex

| Occupation | Male | Female |
| Production | 90 (63.8%) | 51 (36.2%) |
| Transportation | 47 (95.9%) | 2 (4.1%) |
| Material Moving | 58 (80.6%) | 14 (19.4%) |
| Total (Category) | 195 (74.4%) | 67 (25.6%) |
| Total (Overall) | 572 (56.8%) | 435 (43.2%) |
Employment Industries by Sex in Fort Recovery
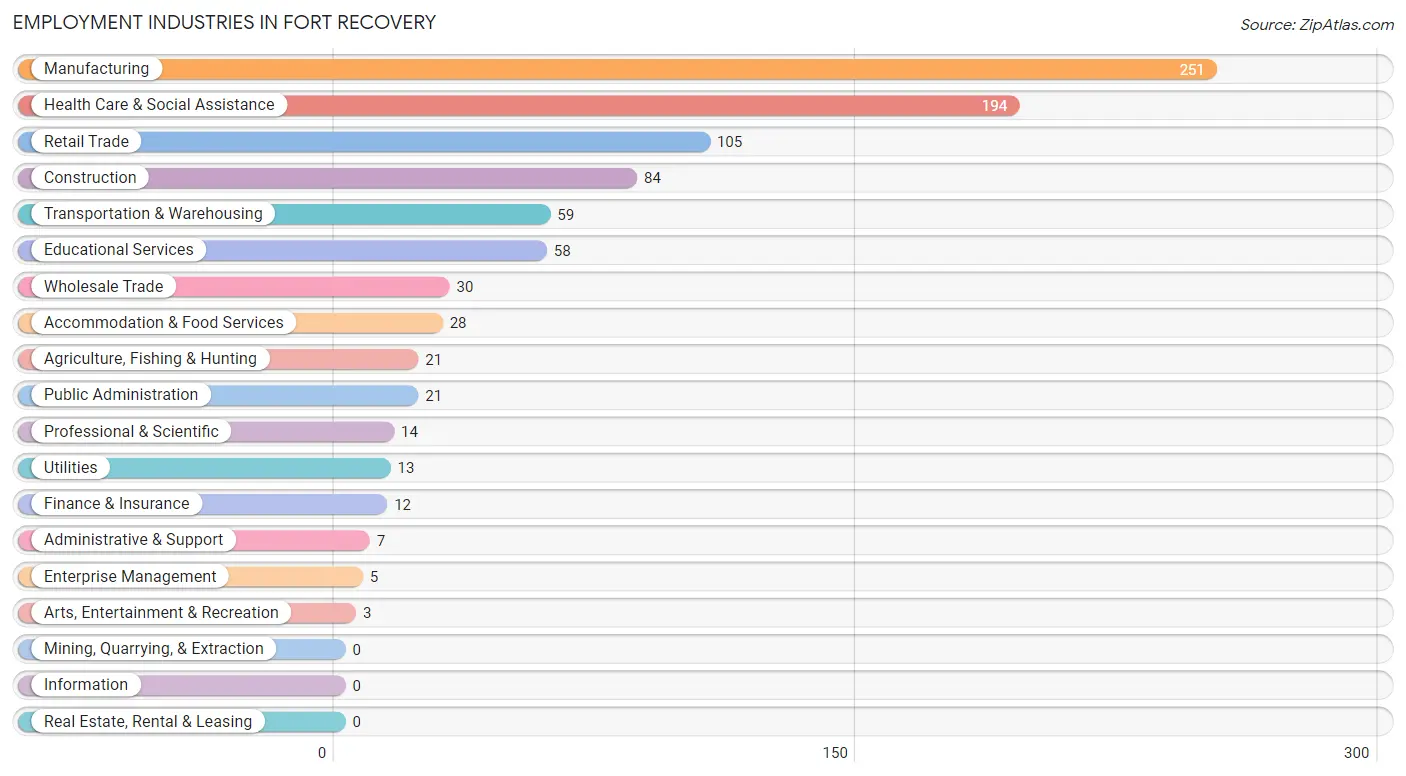
Employment Industries in Fort Recovery
The major employment industries in Fort Recovery include Manufacturing (251 | 24.9%), Health Care & Social Assistance (194 | 19.3%), Retail Trade (105 | 10.4%), Construction (84 | 8.3%), and Transportation & Warehousing (59 | 5.9%).
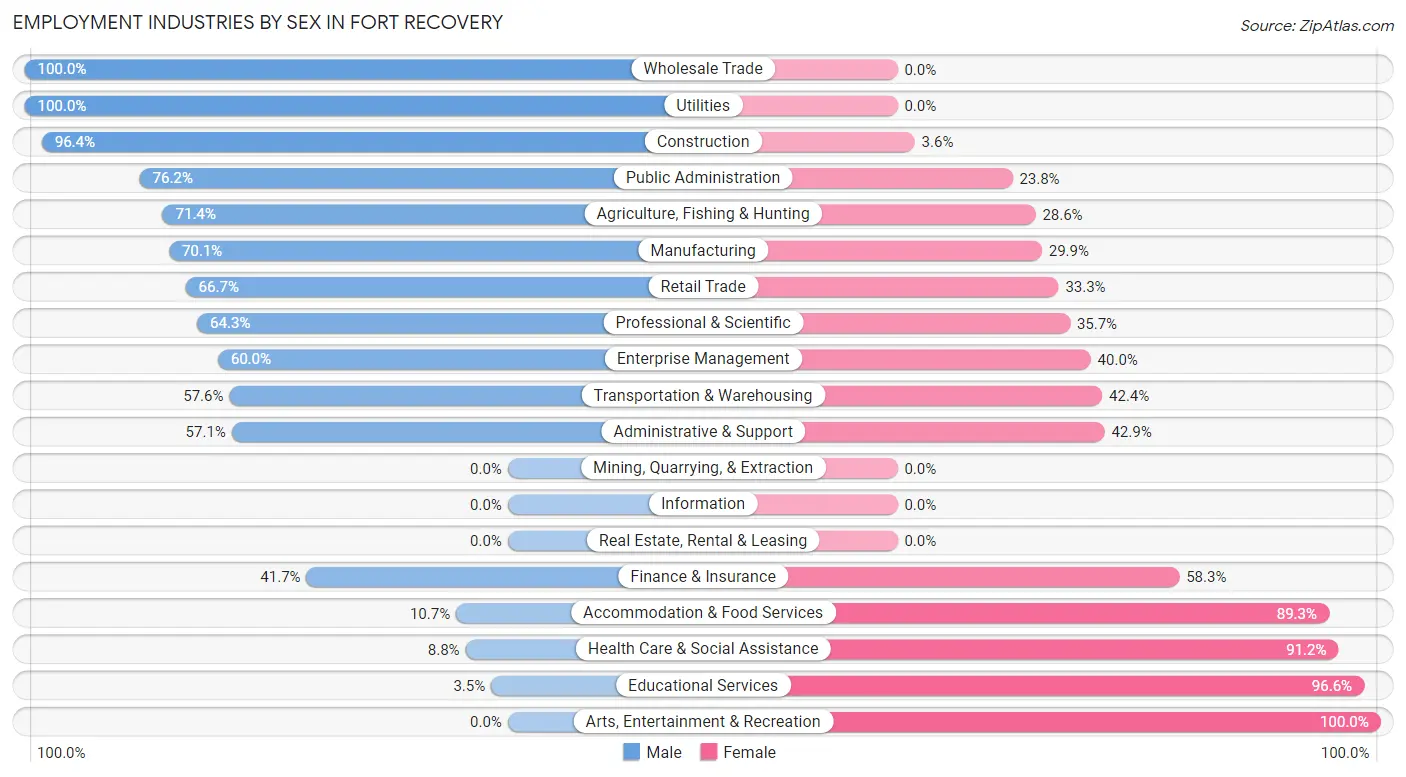
Employment Industries by Sex in Fort Recovery
The Fort Recovery industries that see more men than women are Wholesale Trade (100.0%), Utilities (100.0%), and Construction (96.4%), whereas the industries that tend to have a higher number of women are Arts, Entertainment & Recreation (100.0%), Educational Services (96.6%), and Health Care & Social Assistance (91.2%).
| Industry | Male | Female |
| Agriculture, Fishing & Hunting | 15 (71.4%) | 6 (28.6%) |
| Mining, Quarrying, & Extraction | 0 (0.0%) | 0 (0.0%) |
| Construction | 81 (96.4%) | 3 (3.6%) |
| Manufacturing | 176 (70.1%) | 75 (29.9%) |
| Wholesale Trade | 30 (100.0%) | 0 (0.0%) |
| Retail Trade | 70 (66.7%) | 35 (33.3%) |
| Transportation & Warehousing | 34 (57.6%) | 25 (42.4%) |
| Utilities | 13 (100.0%) | 0 (0.0%) |
| Information | 0 (0.0%) | 0 (0.0%) |
| Finance & Insurance | 5 (41.7%) | 7 (58.3%) |
| Real Estate, Rental & Leasing | 0 (0.0%) | 0 (0.0%) |
| Professional & Scientific | 9 (64.3%) | 5 (35.7%) |
| Enterprise Management | 3 (60.0%) | 2 (40.0%) |
| Administrative & Support | 4 (57.1%) | 3 (42.9%) |
| Educational Services | 2 (3.5%) | 56 (96.6%) |
| Health Care & Social Assistance | 17 (8.8%) | 177 (91.2%) |
| Arts, Entertainment & Recreation | 0 (0.0%) | 3 (100.0%) |
| Accommodation & Food Services | 3 (10.7%) | 25 (89.3%) |
| Public Administration | 16 (76.2%) | 5 (23.8%) |
| Total | 572 (56.8%) | 435 (43.2%) |
Education in Fort Recovery
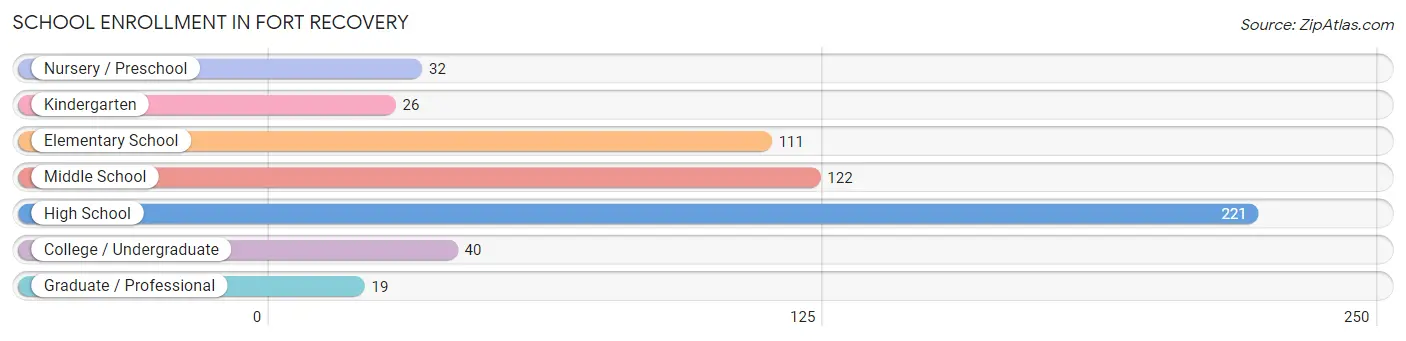
School Enrollment in Fort Recovery
The most common levels of schooling among the 571 students in Fort Recovery are high school (221 | 38.7%), middle school (122 | 21.4%), and elementary school (111 | 19.4%).
| School Level | # Students | % Students |
| Nursery / Preschool | 32 | 5.6% |
| Kindergarten | 26 | 4.5% |
| Elementary School | 111 | 19.4% |
| Middle School | 122 | 21.4% |
| High School | 221 | 38.7% |
| College / Undergraduate | 40 | 7.0% |
| Graduate / Professional | 19 | 3.3% |
| Total | 571 | 100.0% |
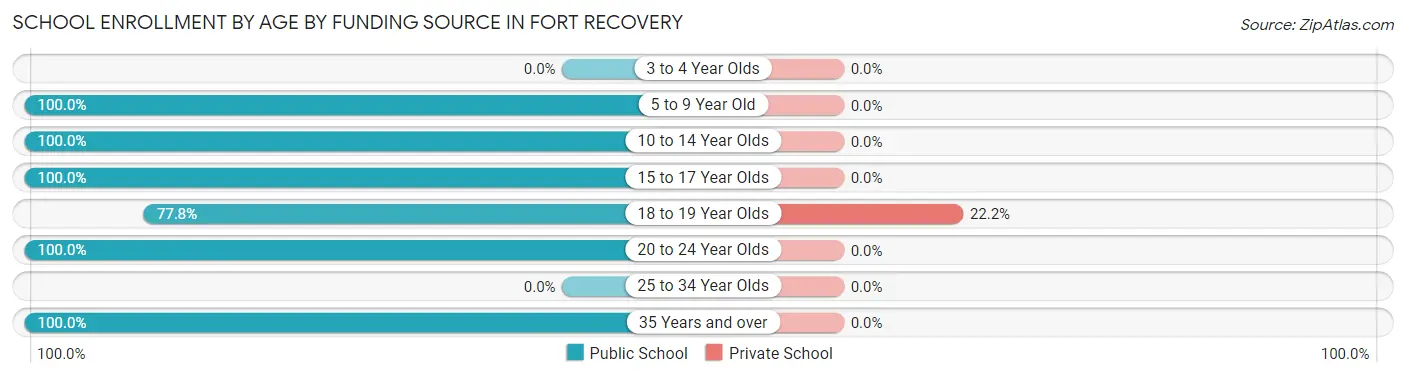
School Enrollment by Age by Funding Source in Fort Recovery
Out of a total of 571 students who are enrolled in schools in Fort Recovery, 6 (1.1%) attend a private institution, while the remaining 565 (98.9%) are enrolled in public schools. The age group of 18 to 19 year olds has the highest likelihood of being enrolled in private schools, with 6 (22.2% in the age bracket) enrolled. Conversely, the age group of 5 to 9 year old has the lowest likelihood of being enrolled in a private school, with 150 (100.0% in the age bracket) attending a public institution.
| Age Bracket | Public School | Private School |
| 3 to 4 Year Olds | 0 (0.0%) | 0 (0.0%) |
| 5 to 9 Year Old | 150 (100.0%) | 0 (0.0%) |
| 10 to 14 Year Olds | 146 (100.0%) | 0 (0.0%) |
| 15 to 17 Year Olds | 207 (100.0%) | 0 (0.0%) |
| 18 to 19 Year Olds | 21 (77.8%) | 6 (22.2%) |
| 20 to 24 Year Olds | 33 (100.0%) | 0 (0.0%) |
| 25 to 34 Year Olds | 0 (0.0%) | 0 (0.0%) |
| 35 Years and over | 8 (100.0%) | 0 (0.0%) |
| Total | 565 (98.9%) | 6 (1.1%) |
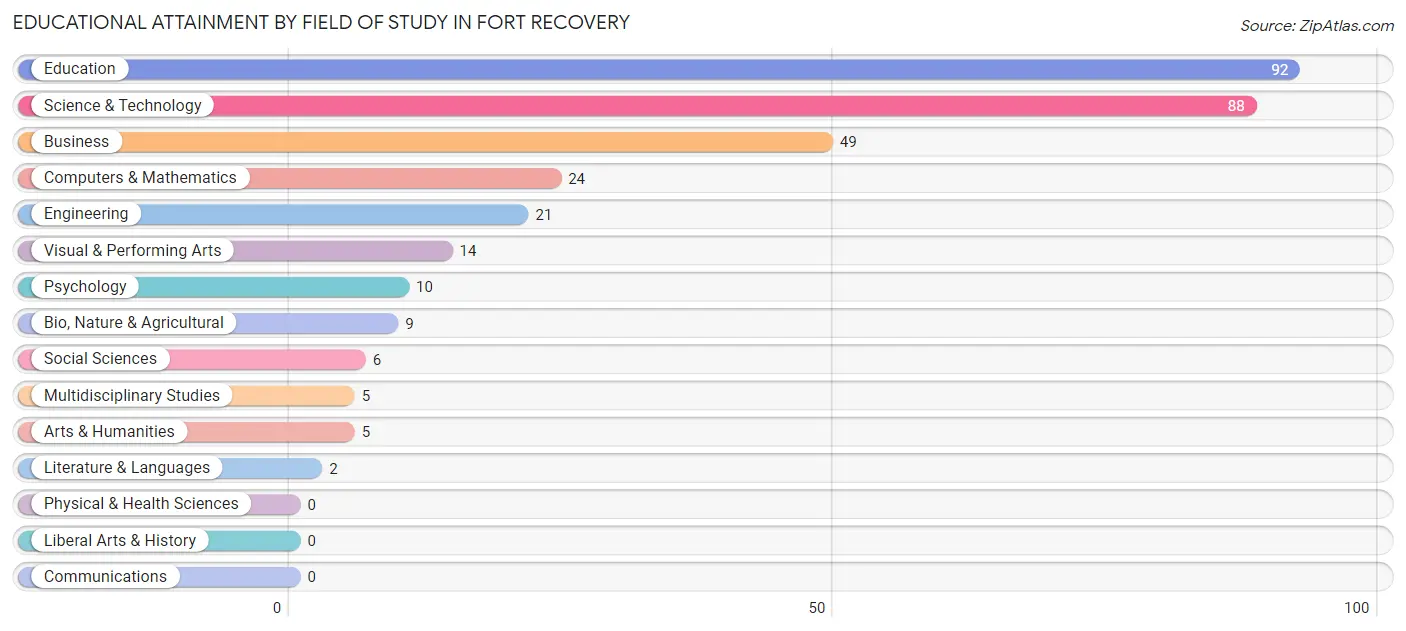
Educational Attainment by Field of Study in Fort Recovery
Education (92 | 28.3%), science & technology (88 | 27.1%), business (49 | 15.1%), computers & mathematics (24 | 7.4%), and engineering (21 | 6.5%) are the most common fields of study among 325 individuals in Fort Recovery who have obtained a bachelor's degree or higher.
| Field of Study | # Graduates | % Graduates |
| Computers & Mathematics | 24 | 7.4% |
| Bio, Nature & Agricultural | 9 | 2.8% |
| Physical & Health Sciences | 0 | 0.0% |
| Psychology | 10 | 3.1% |
| Social Sciences | 6 | 1.8% |
| Engineering | 21 | 6.5% |
| Multidisciplinary Studies | 5 | 1.5% |
| Science & Technology | 88 | 27.1% |
| Business | 49 | 15.1% |
| Education | 92 | 28.3% |
| Literature & Languages | 2 | 0.6% |
| Liberal Arts & History | 0 | 0.0% |
| Visual & Performing Arts | 14 | 4.3% |
| Communications | 0 | 0.0% |
| Arts & Humanities | 5 | 1.5% |
| Total | 325 | 100.0% |
Transportation & Commute in Fort Recovery
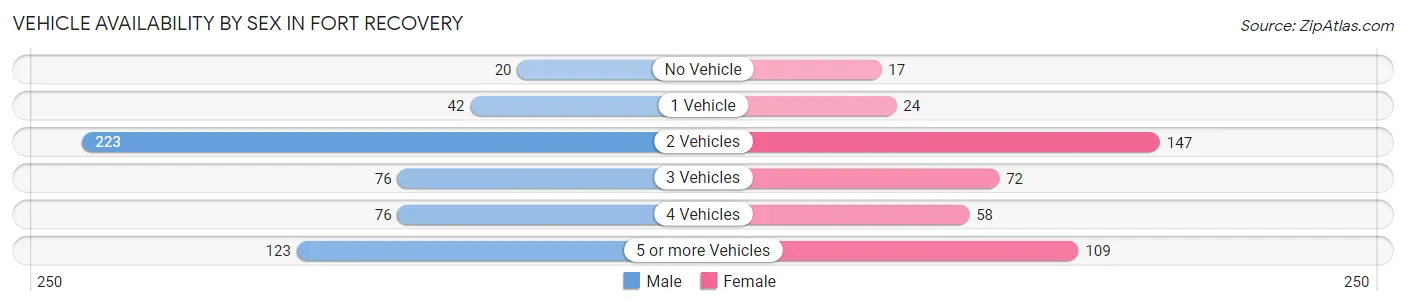
Vehicle Availability by Sex in Fort Recovery
The most prevalent vehicle ownership categories in Fort Recovery are males with 2 vehicles (223, accounting for 39.8%) and females with 2 vehicles (147, making up 52.2%).
| Vehicles Available | Male | Female |
| No Vehicle | 20 (3.6%) | 17 (4.0%) |
| 1 Vehicle | 42 (7.5%) | 24 (5.6%) |
| 2 Vehicles | 223 (39.8%) | 147 (34.4%) |
| 3 Vehicles | 76 (13.6%) | 72 (16.9%) |
| 4 Vehicles | 76 (13.6%) | 58 (13.6%) |
| 5 or more Vehicles | 123 (22.0%) | 109 (25.5%) |
| Total | 560 (100.0%) | 427 (100.0%) |
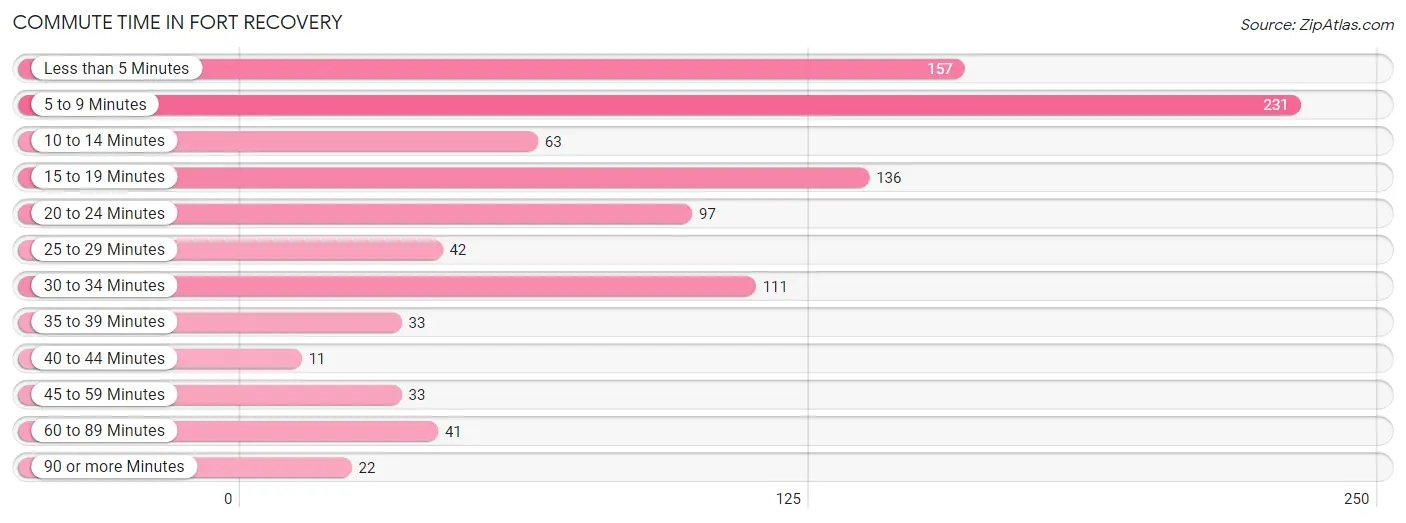
Commute Time in Fort Recovery
The most frequently occuring commute durations in Fort Recovery are 5 to 9 minutes (231 commuters, 23.6%), less than 5 minutes (157 commuters, 16.1%), and 15 to 19 minutes (136 commuters, 13.9%).
| Commute Time | # Commuters | % Commuters |
| Less than 5 Minutes | 157 | 16.1% |
| 5 to 9 Minutes | 231 | 23.6% |
| 10 to 14 Minutes | 63 | 6.5% |
| 15 to 19 Minutes | 136 | 13.9% |
| 20 to 24 Minutes | 97 | 9.9% |
| 25 to 29 Minutes | 42 | 4.3% |
| 30 to 34 Minutes | 111 | 11.4% |
| 35 to 39 Minutes | 33 | 3.4% |
| 40 to 44 Minutes | 11 | 1.1% |
| 45 to 59 Minutes | 33 | 3.4% |
| 60 to 89 Minutes | 41 | 4.2% |
| 90 or more Minutes | 22 | 2.2% |
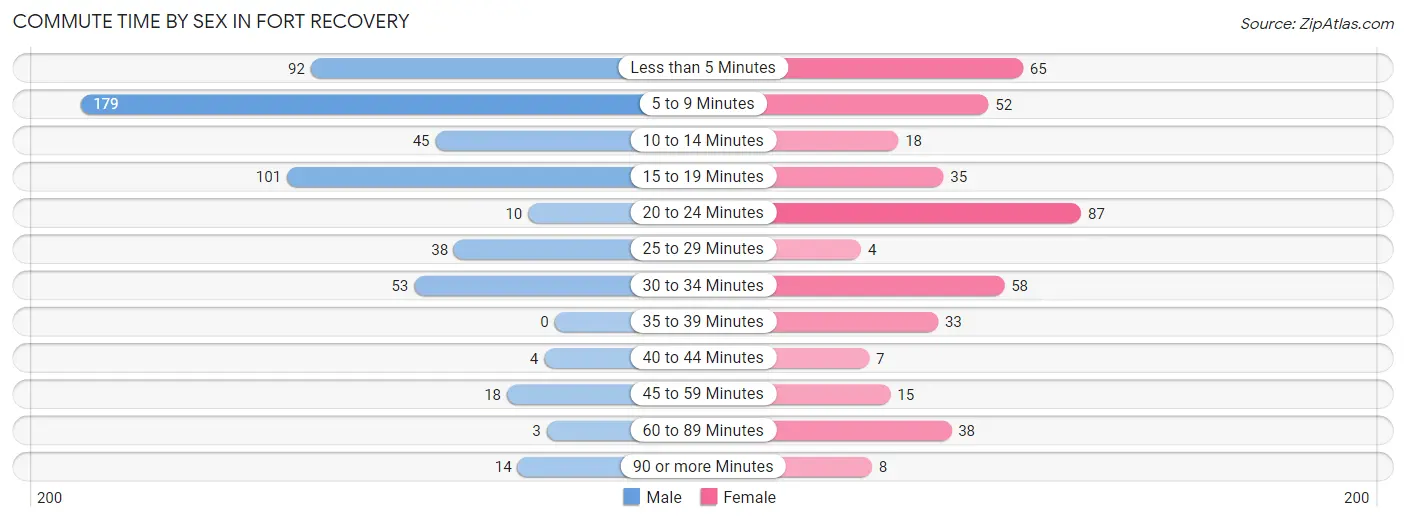
Commute Time by Sex in Fort Recovery
The most common commute times in Fort Recovery are 5 to 9 minutes (179 commuters, 32.1%) for males and 20 to 24 minutes (87 commuters, 20.7%) for females.
| Commute Time | Male | Female |
| Less than 5 Minutes | 92 (16.5%) | 65 (15.5%) |
| 5 to 9 Minutes | 179 (32.1%) | 52 (12.4%) |
| 10 to 14 Minutes | 45 (8.1%) | 18 (4.3%) |
| 15 to 19 Minutes | 101 (18.1%) | 35 (8.3%) |
| 20 to 24 Minutes | 10 (1.8%) | 87 (20.7%) |
| 25 to 29 Minutes | 38 (6.8%) | 4 (0.9%) |
| 30 to 34 Minutes | 53 (9.5%) | 58 (13.8%) |
| 35 to 39 Minutes | 0 (0.0%) | 33 (7.9%) |
| 40 to 44 Minutes | 4 (0.7%) | 7 (1.7%) |
| 45 to 59 Minutes | 18 (3.2%) | 15 (3.6%) |
| 60 to 89 Minutes | 3 (0.5%) | 38 (9.0%) |
| 90 or more Minutes | 14 (2.5%) | 8 (1.9%) |
Time of Departure to Work by Sex in Fort Recovery
The most frequent times of departure to work in Fort Recovery are 6:30 AM to 6:59 AM (147, 26.4%) for males and 7:00 AM to 7:29 AM (102, 24.3%) for females.
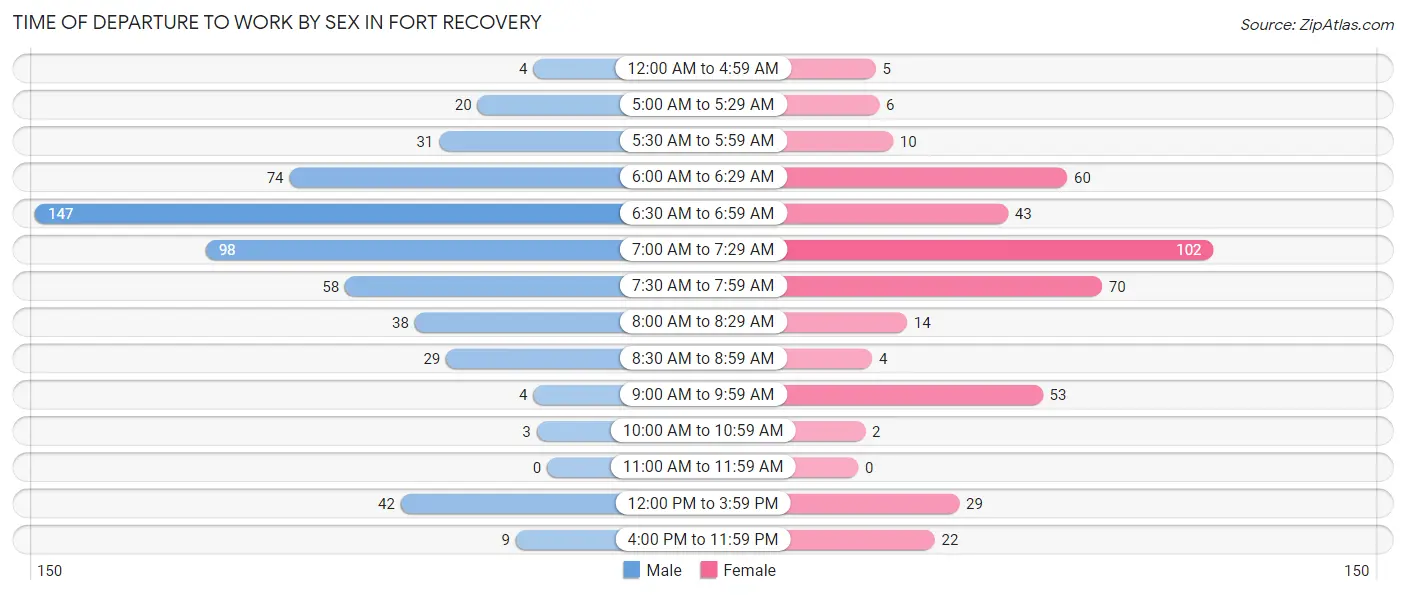
| Time of Departure | Male | Female |
| 12:00 AM to 4:59 AM | 4 (0.7%) | 5 (1.2%) |
| 5:00 AM to 5:29 AM | 20 (3.6%) | 6 (1.4%) |
| 5:30 AM to 5:59 AM | 31 (5.6%) | 10 (2.4%) |
| 6:00 AM to 6:29 AM | 74 (13.3%) | 60 (14.3%) |
| 6:30 AM to 6:59 AM | 147 (26.4%) | 43 (10.2%) |
| 7:00 AM to 7:29 AM | 98 (17.6%) | 102 (24.3%) |
| 7:30 AM to 7:59 AM | 58 (10.4%) | 70 (16.7%) |
| 8:00 AM to 8:29 AM | 38 (6.8%) | 14 (3.3%) |
| 8:30 AM to 8:59 AM | 29 (5.2%) | 4 (0.9%) |
| 9:00 AM to 9:59 AM | 4 (0.7%) | 53 (12.6%) |
| 10:00 AM to 10:59 AM | 3 (0.5%) | 2 (0.5%) |
| 11:00 AM to 11:59 AM | 0 (0.0%) | 0 (0.0%) |
| 12:00 PM to 3:59 PM | 42 (7.5%) | 29 (6.9%) |
| 4:00 PM to 11:59 PM | 9 (1.6%) | 22 (5.2%) |
| Total | 557 (100.0%) | 420 (100.0%) |
Housing Occupancy in Fort Recovery
Occupancy by Ownership in Fort Recovery
Of the total 695 dwellings in Fort Recovery, owner-occupied units account for 604 (86.9%), while renter-occupied units make up 91 (13.1%).
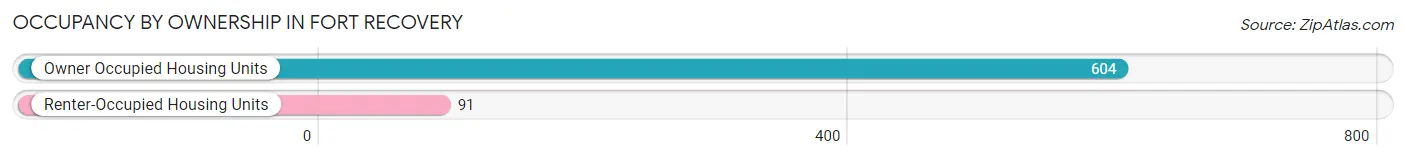
| Occupancy | # Housing Units | % Housing Units |
| Owner Occupied Housing Units | 604 | 86.9% |
| Renter-Occupied Housing Units | 91 | 13.1% |
| Total Occupied Housing Units | 695 | 100.0% |
Occupancy by Household Size in Fort Recovery
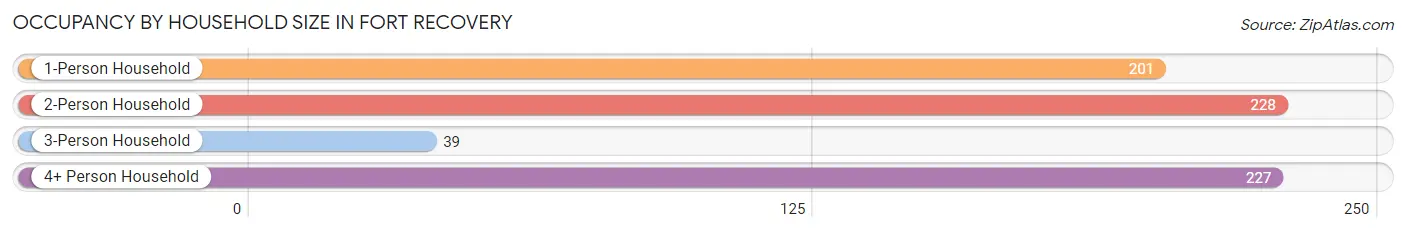
| Household Size | # Housing Units | % Housing Units |
| 1-Person Household | 201 | 28.9% |
| 2-Person Household | 228 | 32.8% |
| 3-Person Household | 39 | 5.6% |
| 4+ Person Household | 227 | 32.7% |
| Total Housing Units | 695 | 100.0% |
Occupancy by Ownership by Household Size in Fort Recovery
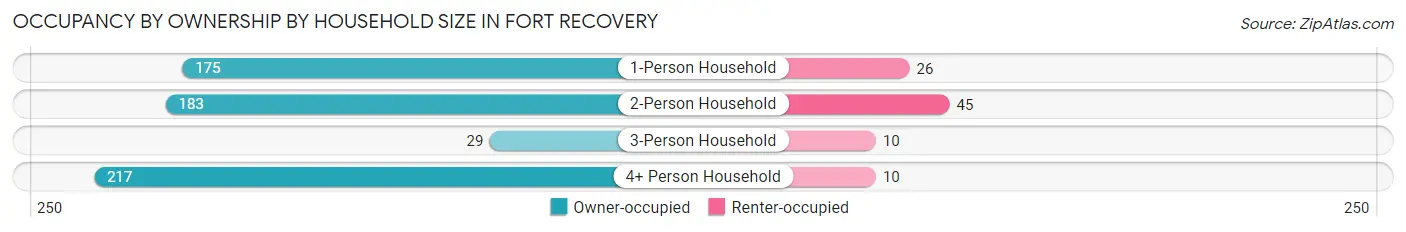
| Household Size | Owner-occupied | Renter-occupied |
| 1-Person Household | 175 (87.1%) | 26 (12.9%) |
| 2-Person Household | 183 (80.3%) | 45 (19.7%) |
| 3-Person Household | 29 (74.4%) | 10 (25.6%) |
| 4+ Person Household | 217 (95.6%) | 10 (4.4%) |
| Total Housing Units | 604 (86.9%) | 91 (13.1%) |
Occupancy by Educational Attainment in Fort Recovery
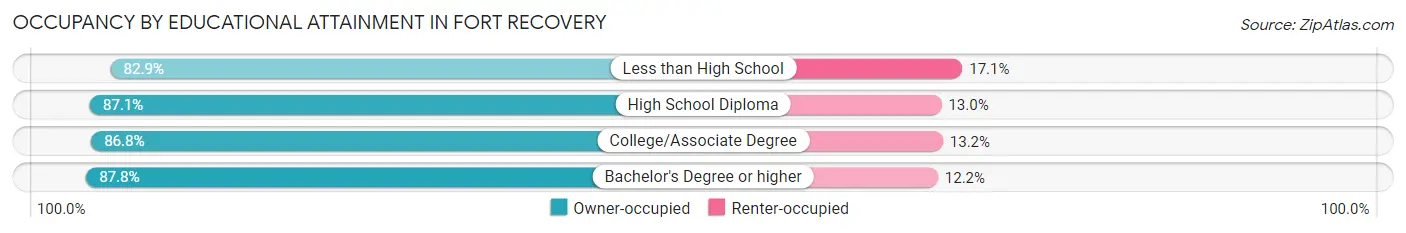
| Household Size | Owner-occupied | Renter-occupied |
| Less than High School | 34 (82.9%) | 7 (17.1%) |
| High School Diploma | 195 (87.1%) | 29 (13.0%) |
| College/Associate Degree | 210 (86.8%) | 32 (13.2%) |
| Bachelor's Degree or higher | 165 (87.8%) | 23 (12.2%) |
Occupancy by Age of Householder in Fort Recovery
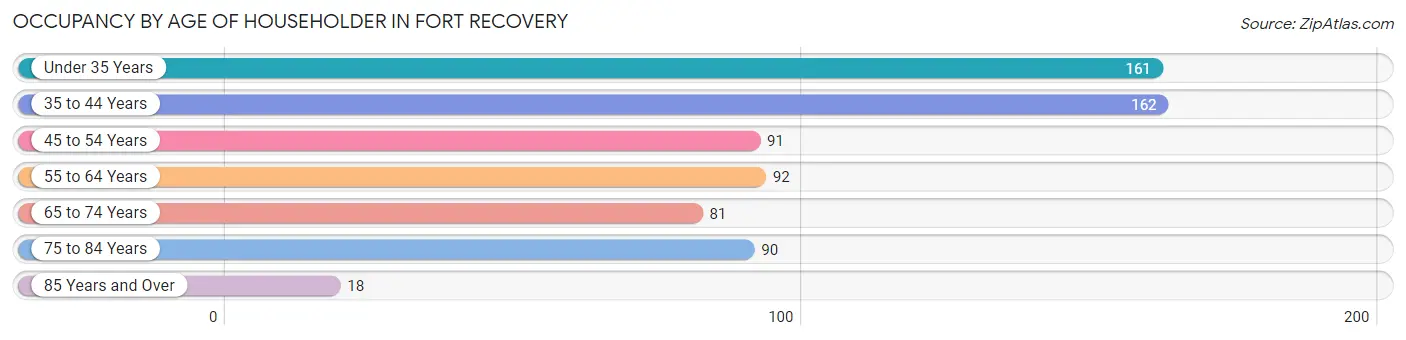
| Age Bracket | # Households | % Households |
| Under 35 Years | 161 | 23.2% |
| 35 to 44 Years | 162 | 23.3% |
| 45 to 54 Years | 91 | 13.1% |
| 55 to 64 Years | 92 | 13.2% |
| 65 to 74 Years | 81 | 11.7% |
| 75 to 84 Years | 90 | 13.0% |
| 85 Years and Over | 18 | 2.6% |
| Total | 695 | 100.0% |
Housing Finances in Fort Recovery
Median Income by Occupancy in Fort Recovery
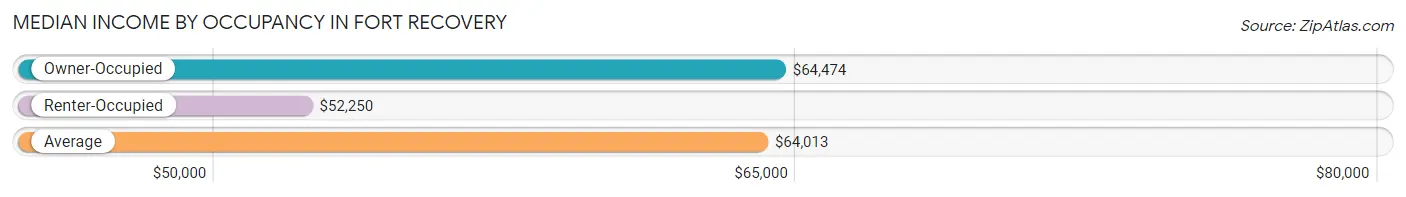
| Occupancy Type | # Households | Median Income |
| Owner-Occupied | 604 (86.9%) | $64,474 |
| Renter-Occupied | 91 (13.1%) | $52,250 |
| Average | 695 (100.0%) | $64,013 |
Occupancy by Householder Income Bracket in Fort Recovery
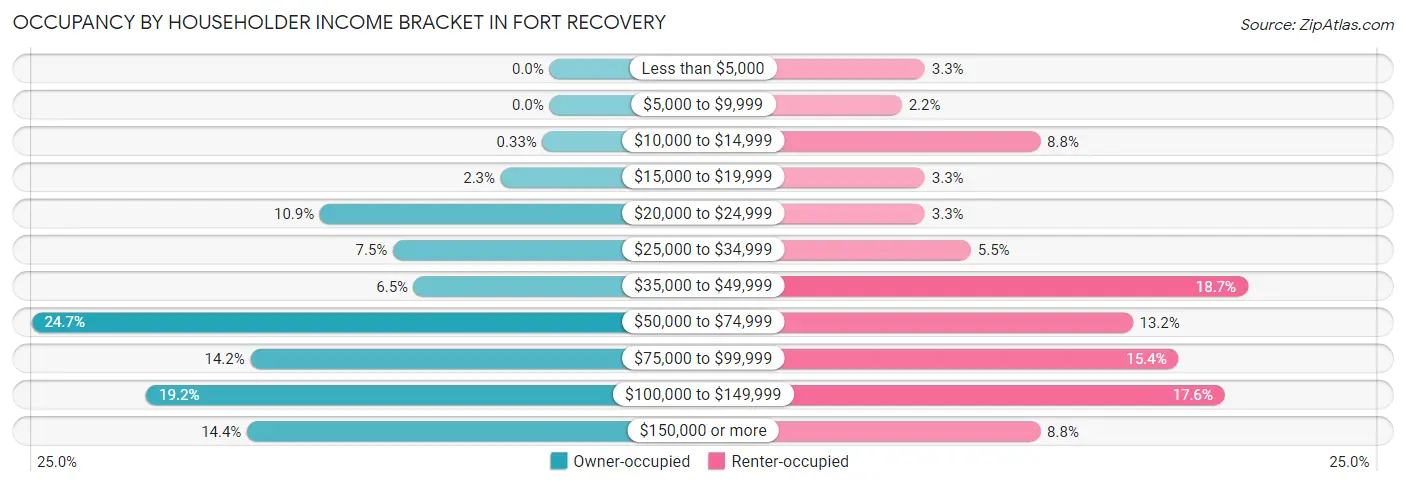
| Income Bracket | Owner-occupied | Renter-occupied |
| Less than $5,000 | 0 (0.0%) | 3 (3.3%) |
| $5,000 to $9,999 | 0 (0.0%) | 2 (2.2%) |
| $10,000 to $14,999 | 2 (0.3%) | 8 (8.8%) |
| $15,000 to $19,999 | 14 (2.3%) | 3 (3.3%) |
| $20,000 to $24,999 | 66 (10.9%) | 3 (3.3%) |
| $25,000 to $34,999 | 45 (7.4%) | 5 (5.5%) |
| $35,000 to $49,999 | 39 (6.5%) | 17 (18.7%) |
| $50,000 to $74,999 | 149 (24.7%) | 12 (13.2%) |
| $75,000 to $99,999 | 86 (14.2%) | 14 (15.4%) |
| $100,000 to $149,999 | 116 (19.2%) | 16 (17.6%) |
| $150,000 or more | 87 (14.4%) | 8 (8.8%) |
| Total | 604 (100.0%) | 91 (100.0%) |
Monthly Housing Cost Tiers in Fort Recovery
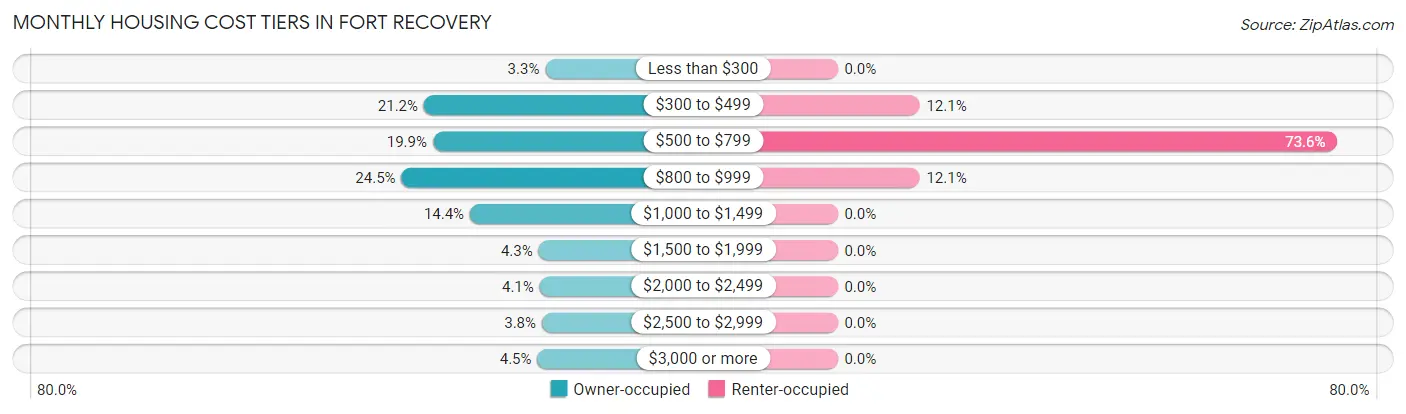
| Monthly Cost | Owner-occupied | Renter-occupied |
| Less than $300 | 20 (3.3%) | 0 (0.0%) |
| $300 to $499 | 128 (21.2%) | 11 (12.1%) |
| $500 to $799 | 120 (19.9%) | 67 (73.6%) |
| $800 to $999 | 148 (24.5%) | 11 (12.1%) |
| $1,000 to $1,499 | 87 (14.4%) | 0 (0.0%) |
| $1,500 to $1,999 | 26 (4.3%) | 0 (0.0%) |
| $2,000 to $2,499 | 25 (4.1%) | 0 (0.0%) |
| $2,500 to $2,999 | 23 (3.8%) | 0 (0.0%) |
| $3,000 or more | 27 (4.5%) | 0 (0.0%) |
| Total | 604 (100.0%) | 91 (100.0%) |
Physical Housing Characteristics in Fort Recovery
Housing Structures in Fort Recovery
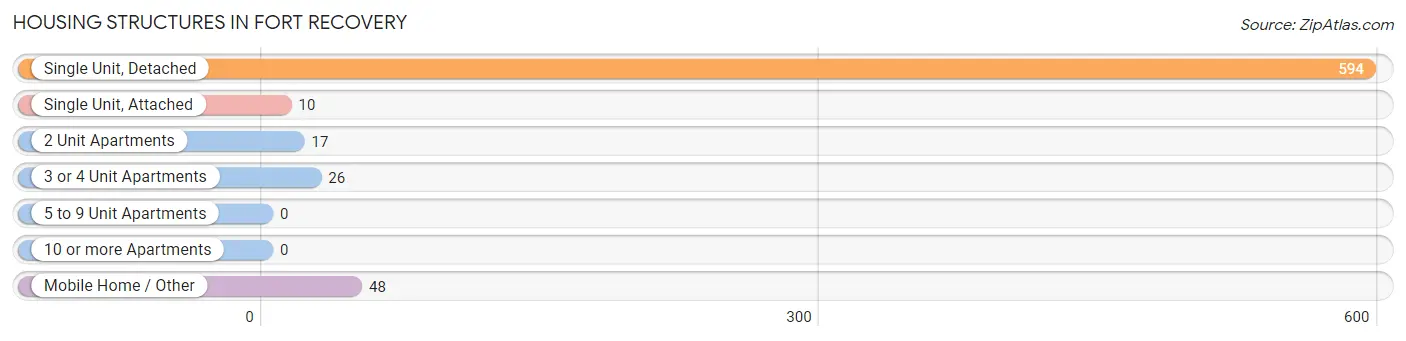
| Structure Type | # Housing Units | % Housing Units |
| Single Unit, Detached | 594 | 85.5% |
| Single Unit, Attached | 10 | 1.4% |
| 2 Unit Apartments | 17 | 2.5% |
| 3 or 4 Unit Apartments | 26 | 3.7% |
| 5 to 9 Unit Apartments | 0 | 0.0% |
| 10 or more Apartments | 0 | 0.0% |
| Mobile Home / Other | 48 | 6.9% |
| Total | 695 | 100.0% |
Housing Structures by Occupancy in Fort Recovery
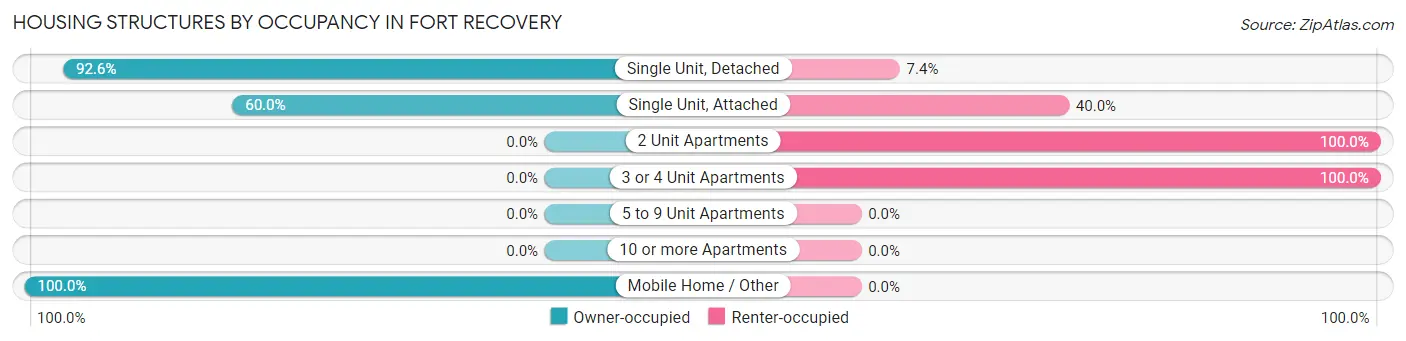
| Structure Type | Owner-occupied | Renter-occupied |
| Single Unit, Detached | 550 (92.6%) | 44 (7.4%) |
| Single Unit, Attached | 6 (60.0%) | 4 (40.0%) |
| 2 Unit Apartments | 0 (0.0%) | 17 (100.0%) |
| 3 or 4 Unit Apartments | 0 (0.0%) | 26 (100.0%) |
| 5 to 9 Unit Apartments | 0 (0.0%) | 0 (0.0%) |
| 10 or more Apartments | 0 (0.0%) | 0 (0.0%) |
| Mobile Home / Other | 48 (100.0%) | 0 (0.0%) |
| Total | 604 (86.9%) | 91 (13.1%) |
Housing Structures by Number of Rooms in Fort Recovery
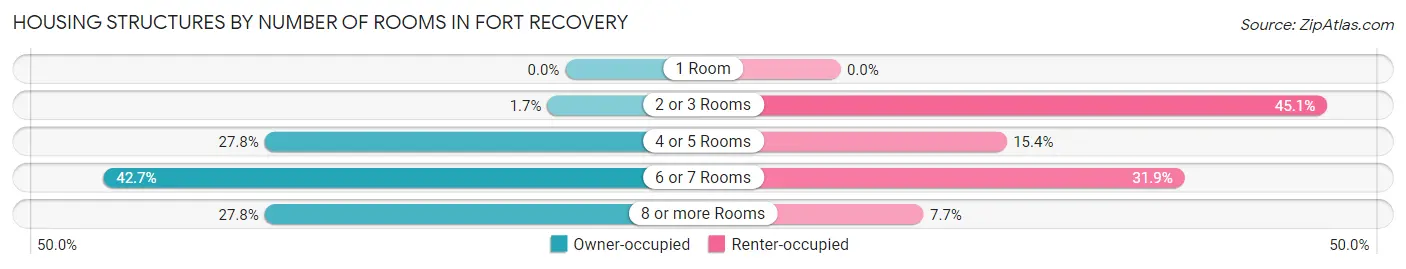
| Number of Rooms | Owner-occupied | Renter-occupied |
| 1 Room | 0 (0.0%) | 0 (0.0%) |
| 2 or 3 Rooms | 10 (1.7%) | 41 (45.1%) |
| 4 or 5 Rooms | 168 (27.8%) | 14 (15.4%) |
| 6 or 7 Rooms | 258 (42.7%) | 29 (31.9%) |
| 8 or more Rooms | 168 (27.8%) | 7 (7.7%) |
| Total | 604 (100.0%) | 91 (100.0%) |
Housing Structure by Heating Type in Fort Recovery
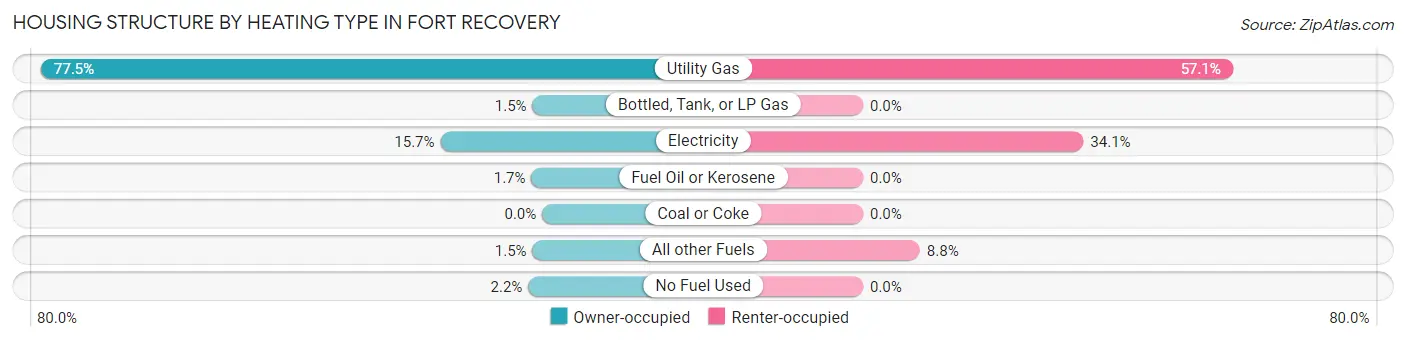
| Heating Type | Owner-occupied | Renter-occupied |
| Utility Gas | 468 (77.5%) | 52 (57.1%) |
| Bottled, Tank, or LP Gas | 9 (1.5%) | 0 (0.0%) |
| Electricity | 95 (15.7%) | 31 (34.1%) |
| Fuel Oil or Kerosene | 10 (1.7%) | 0 (0.0%) |
| Coal or Coke | 0 (0.0%) | 0 (0.0%) |
| All other Fuels | 9 (1.5%) | 8 (8.8%) |
| No Fuel Used | 13 (2.1%) | 0 (0.0%) |
| Total | 604 (100.0%) | 91 (100.0%) |
Household Vehicle Usage in Fort Recovery
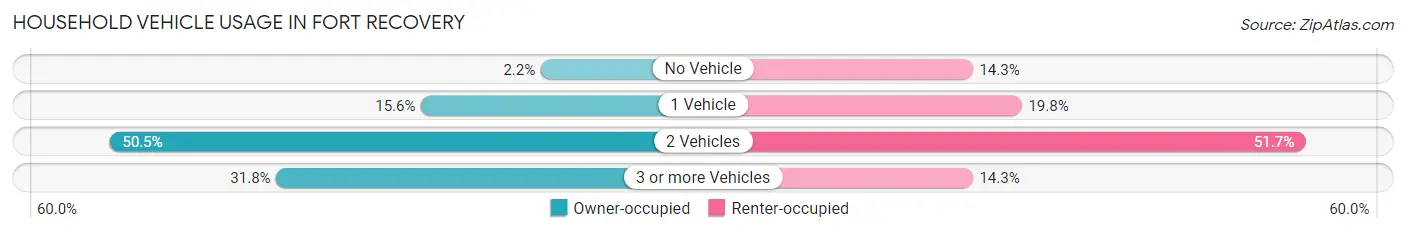
| Vehicles per Household | Owner-occupied | Renter-occupied |
| No Vehicle | 13 (2.1%) | 13 (14.3%) |
| 1 Vehicle | 94 (15.6%) | 18 (19.8%) |
| 2 Vehicles | 305 (50.5%) | 47 (51.6%) |
| 3 or more Vehicles | 192 (31.8%) | 13 (14.3%) |
| Total | 604 (100.0%) | 91 (100.0%) |
Real Estate & Mortgages in Fort Recovery
Real Estate and Mortgage Overview in Fort Recovery
| Characteristic | Without Mortgage | With Mortgage |
| Housing Units | 247 | 357 |
| Median Property Value | $160,500 | $146,800 |
| Median Household Income | $55,074 | $60 |
| Monthly Housing Costs | $467 | $27 |
| Real Estate Taxes | $1,741 | $14 |
Property Value by Mortgage Status in Fort Recovery
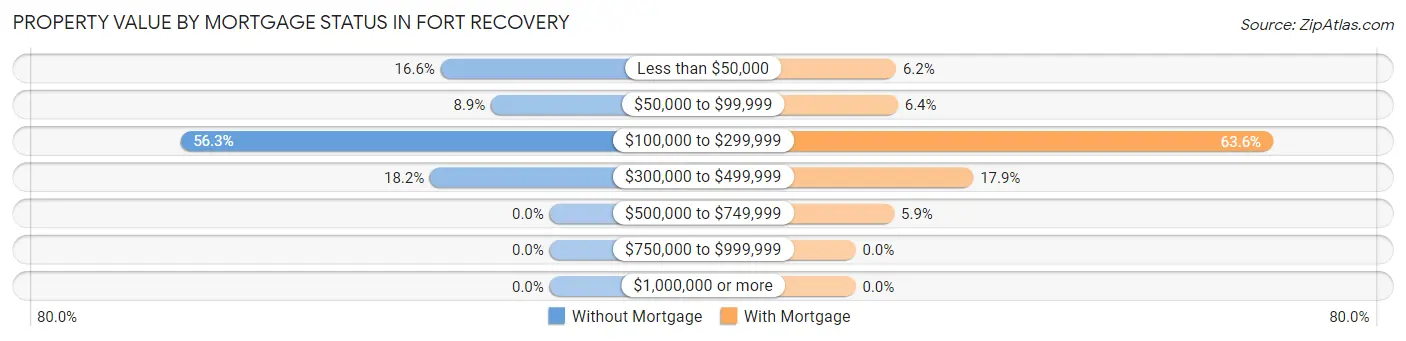
| Property Value | Without Mortgage | With Mortgage |
| Less than $50,000 | 41 (16.6%) | 22 (6.2%) |
| $50,000 to $99,999 | 22 (8.9%) | 23 (6.4%) |
| $100,000 to $299,999 | 139 (56.3%) | 227 (63.6%) |
| $300,000 to $499,999 | 45 (18.2%) | 64 (17.9%) |
| $500,000 to $749,999 | 0 (0.0%) | 21 (5.9%) |
| $750,000 to $999,999 | 0 (0.0%) | 0 (0.0%) |
| $1,000,000 or more | 0 (0.0%) | 0 (0.0%) |
| Total | 247 (100.0%) | 357 (100.0%) |
Household Income by Mortgage Status in Fort Recovery
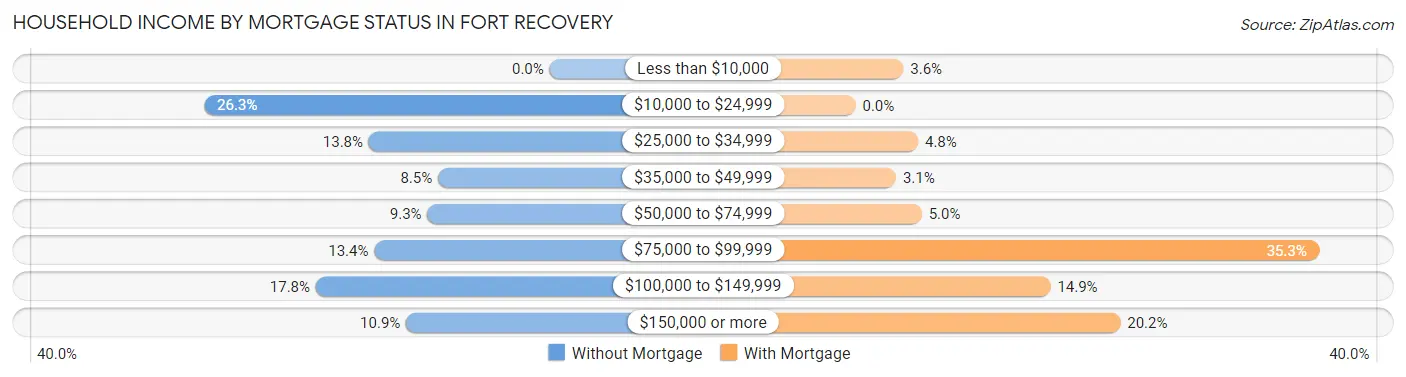
| Household Income | Without Mortgage | With Mortgage |
| Less than $10,000 | 0 (0.0%) | 13 (3.6%) |
| $10,000 to $24,999 | 65 (26.3%) | 0 (0.0%) |
| $25,000 to $34,999 | 34 (13.8%) | 17 (4.8%) |
| $35,000 to $49,999 | 21 (8.5%) | 11 (3.1%) |
| $50,000 to $74,999 | 23 (9.3%) | 18 (5.0%) |
| $75,000 to $99,999 | 33 (13.4%) | 126 (35.3%) |
| $100,000 to $149,999 | 44 (17.8%) | 53 (14.8%) |
| $150,000 or more | 27 (10.9%) | 72 (20.2%) |
| Total | 247 (100.0%) | 357 (100.0%) |
Property Value to Household Income Ratio in Fort Recovery
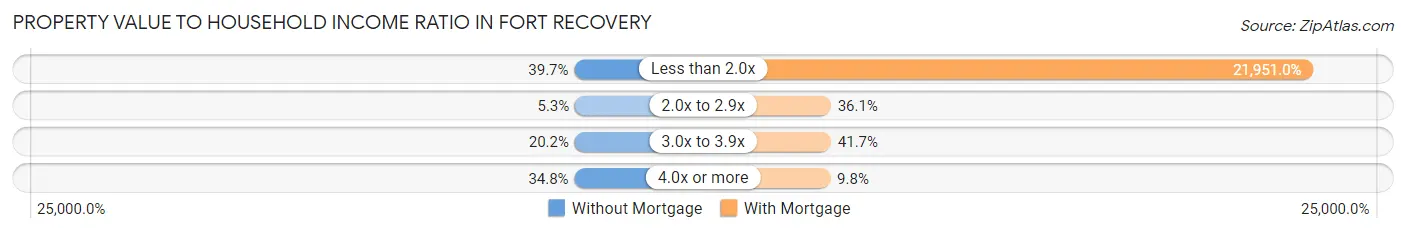
| Value-to-Income Ratio | Without Mortgage | With Mortgage |
| Less than 2.0x | 98 (39.7%) | 78,365 (21,951.0%) |
| 2.0x to 2.9x | 13 (5.3%) | 129 (36.1%) |
| 3.0x to 3.9x | 50 (20.2%) | 149 (41.7%) |
| 4.0x or more | 86 (34.8%) | 35 (9.8%) |
| Total | 247 (100.0%) | 357 (100.0%) |
Real Estate Taxes by Mortgage Status in Fort Recovery
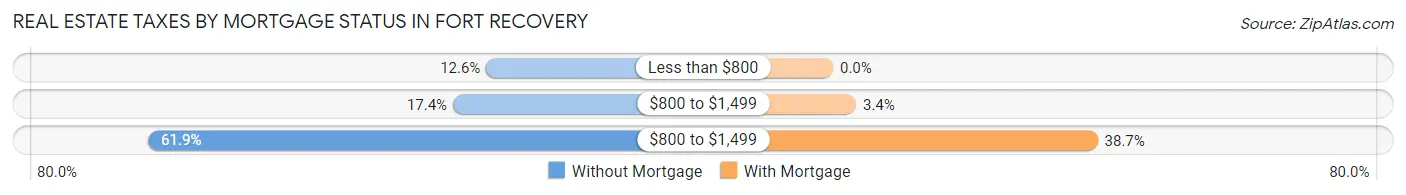
| Property Taxes | Without Mortgage | With Mortgage |
| Less than $800 | 31 (12.6%) | 0 (0.0%) |
| $800 to $1,499 | 43 (17.4%) | 12 (3.4%) |
| $800 to $1,499 | 153 (61.9%) | 138 (38.7%) |
| Total | 247 (100.0%) | 357 (100.0%) |
Health & Disability in Fort Recovery
Health Insurance Coverage by Age in Fort Recovery
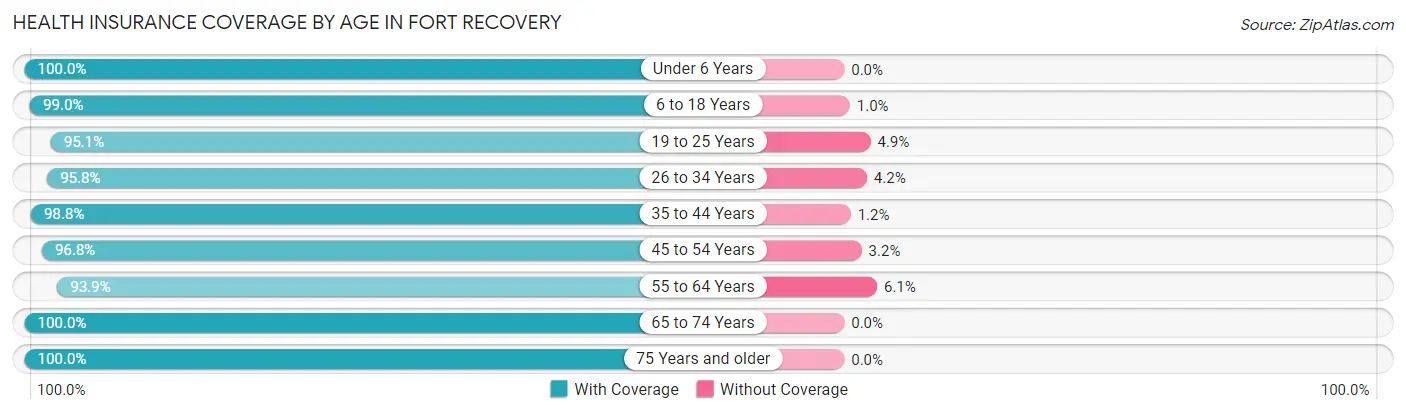
| Age Bracket | With Coverage | Without Coverage |
| Under 6 Years | 154 (100.0%) | 0 (0.0%) |
| 6 to 18 Years | 475 (99.0%) | 5 (1.0%) |
| 19 to 25 Years | 175 (95.1%) | 9 (4.9%) |
| 26 to 34 Years | 227 (95.8%) | 10 (4.2%) |
| 35 to 44 Years | 247 (98.8%) | 3 (1.2%) |
| 45 to 54 Years | 179 (96.8%) | 6 (3.2%) |
| 55 to 64 Years | 169 (93.9%) | 11 (6.1%) |
| 65 to 74 Years | 140 (100.0%) | 0 (0.0%) |
| 75 Years and older | 145 (100.0%) | 0 (0.0%) |
| Total | 1,911 (97.8%) | 44 (2.2%) |
Health Insurance Coverage by Citizenship Status in Fort Recovery
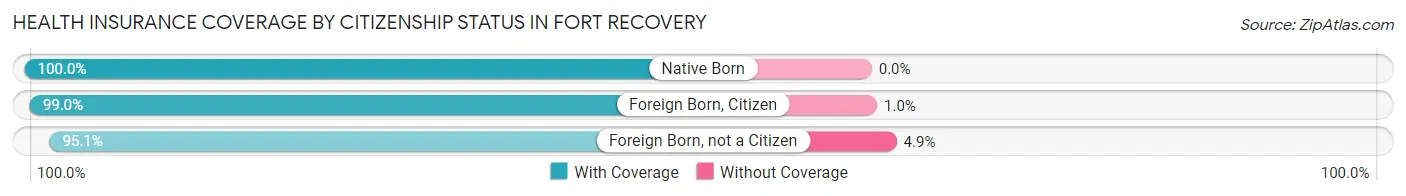
| Citizenship Status | With Coverage | Without Coverage |
| Native Born | 154 (100.0%) | 0 (0.0%) |
| Foreign Born, Citizen | 475 (99.0%) | 5 (1.0%) |
| Foreign Born, not a Citizen | 175 (95.1%) | 9 (4.9%) |
Health Insurance Coverage by Household Income in Fort Recovery
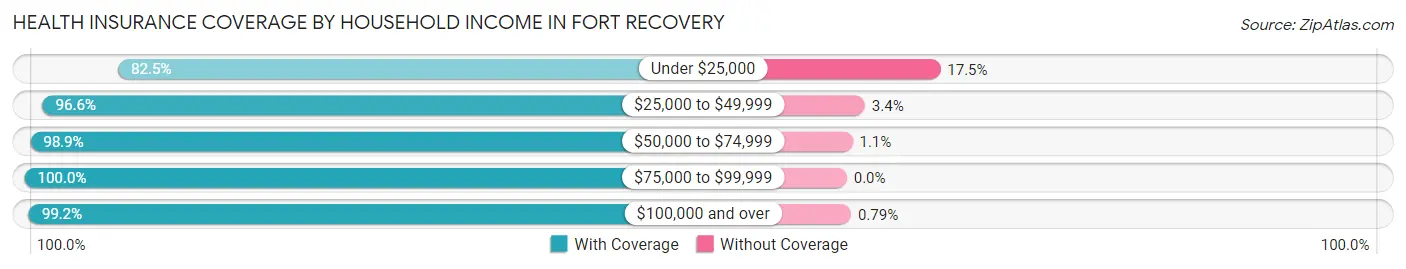
| Household Income | With Coverage | Without Coverage |
| Under $25,000 | 127 (82.5%) | 27 (17.5%) |
| $25,000 to $49,999 | 171 (96.6%) | 6 (3.4%) |
| $50,000 to $74,999 | 278 (98.9%) | 3 (1.1%) |
| $75,000 to $99,999 | 335 (100.0%) | 0 (0.0%) |
| $100,000 and over | 1,000 (99.2%) | 8 (0.8%) |
Public vs Private Health Insurance Coverage by Age in Fort Recovery
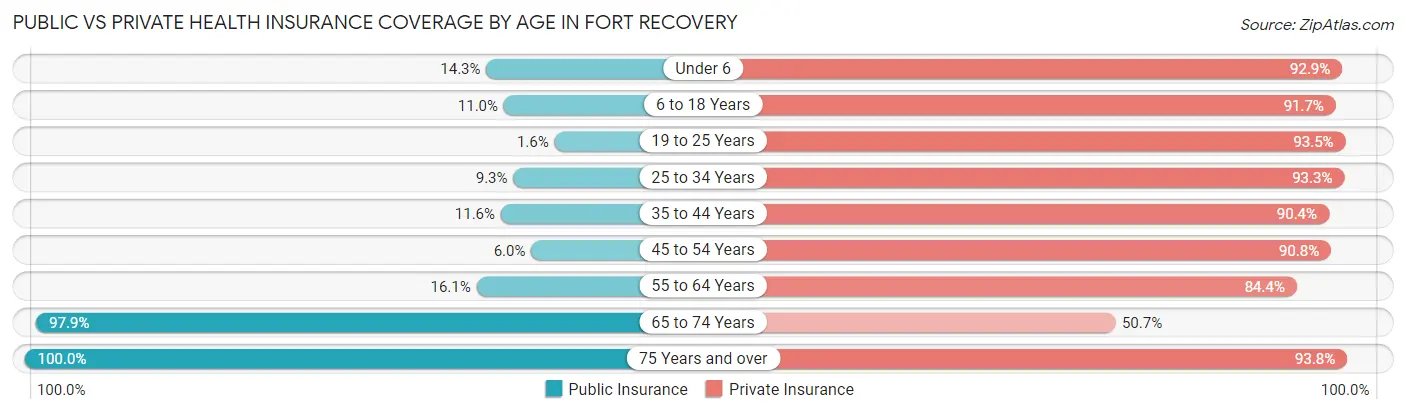
| Age Bracket | Public Insurance | Private Insurance |
| Under 6 | 22 (14.3%) | 143 (92.9%) |
| 6 to 18 Years | 53 (11.0%) | 440 (91.7%) |
| 19 to 25 Years | 3 (1.6%) | 172 (93.5%) |
| 25 to 34 Years | 22 (9.3%) | 221 (93.2%) |
| 35 to 44 Years | 29 (11.6%) | 226 (90.4%) |
| 45 to 54 Years | 11 (5.9%) | 168 (90.8%) |
| 55 to 64 Years | 29 (16.1%) | 152 (84.4%) |
| 65 to 74 Years | 137 (97.9%) | 71 (50.7%) |
| 75 Years and over | 145 (100.0%) | 136 (93.8%) |
| Total | 451 (23.1%) | 1,729 (88.4%) |
Disability Status by Sex by Age in Fort Recovery
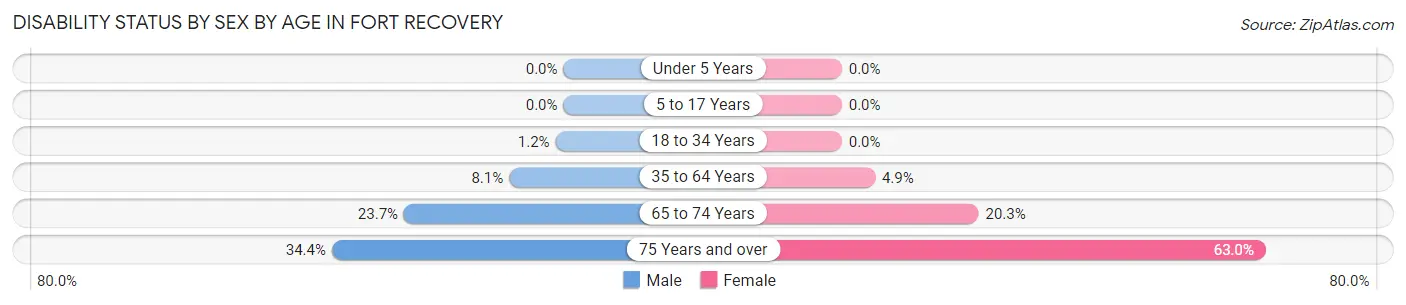
| Age Bracket | Male | Female |
| Under 5 Years | 0 (0.0%) | 0 (0.0%) |
| 5 to 17 Years | 0 (0.0%) | 0 (0.0%) |
| 18 to 34 Years | 3 (1.2%) | 0 (0.0%) |
| 35 to 64 Years | 25 (8.1%) | 15 (4.9%) |
| 65 to 74 Years | 18 (23.7%) | 13 (20.3%) |
| 75 Years and over | 22 (34.4%) | 51 (63.0%) |
Disability Class by Sex by Age in Fort Recovery
Disability Class: Hearing Difficulty
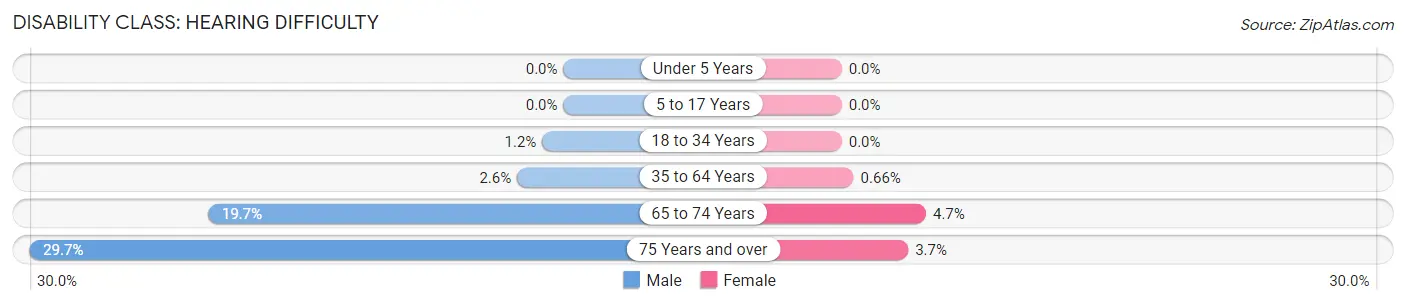
| Age Bracket | Male | Female |
| Under 5 Years | 0 (0.0%) | 0 (0.0%) |
| 5 to 17 Years | 0 (0.0%) | 0 (0.0%) |
| 18 to 34 Years | 3 (1.2%) | 0 (0.0%) |
| 35 to 64 Years | 8 (2.6%) | 2 (0.7%) |
| 65 to 74 Years | 15 (19.7%) | 3 (4.7%) |
| 75 Years and over | 19 (29.7%) | 3 (3.7%) |
Disability Class: Vision Difficulty
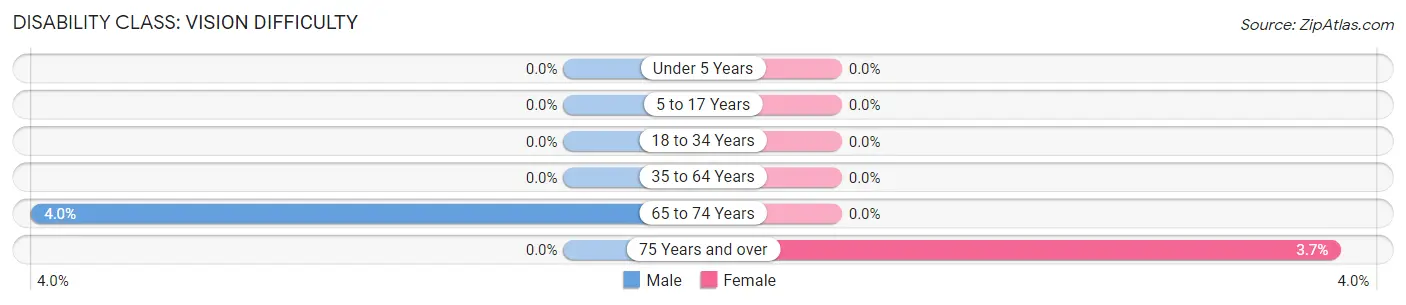
| Age Bracket | Male | Female |
| Under 5 Years | 0 (0.0%) | 0 (0.0%) |
| 5 to 17 Years | 0 (0.0%) | 0 (0.0%) |
| 18 to 34 Years | 0 (0.0%) | 0 (0.0%) |
| 35 to 64 Years | 0 (0.0%) | 0 (0.0%) |
| 65 to 74 Years | 3 (4.0%) | 0 (0.0%) |
| 75 Years and over | 0 (0.0%) | 3 (3.7%) |
Disability Class: Cognitive Difficulty
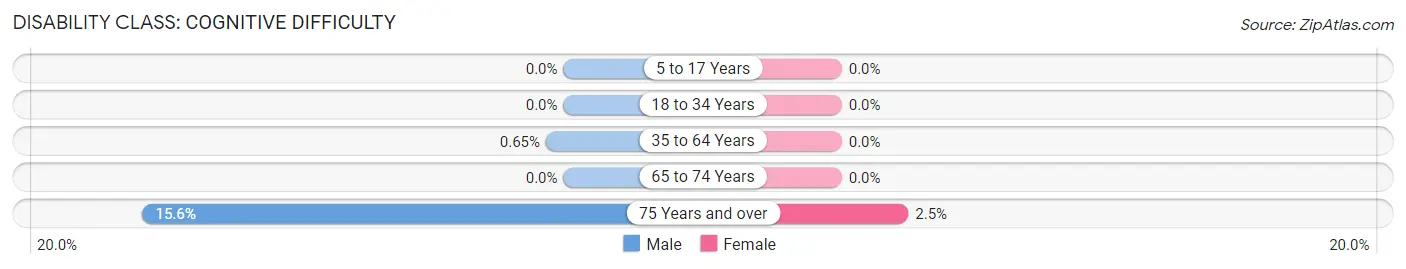
| Age Bracket | Male | Female |
| 5 to 17 Years | 0 (0.0%) | 0 (0.0%) |
| 18 to 34 Years | 0 (0.0%) | 0 (0.0%) |
| 35 to 64 Years | 2 (0.6%) | 0 (0.0%) |
| 65 to 74 Years | 0 (0.0%) | 0 (0.0%) |
| 75 Years and over | 10 (15.6%) | 2 (2.5%) |
Disability Class: Ambulatory Difficulty
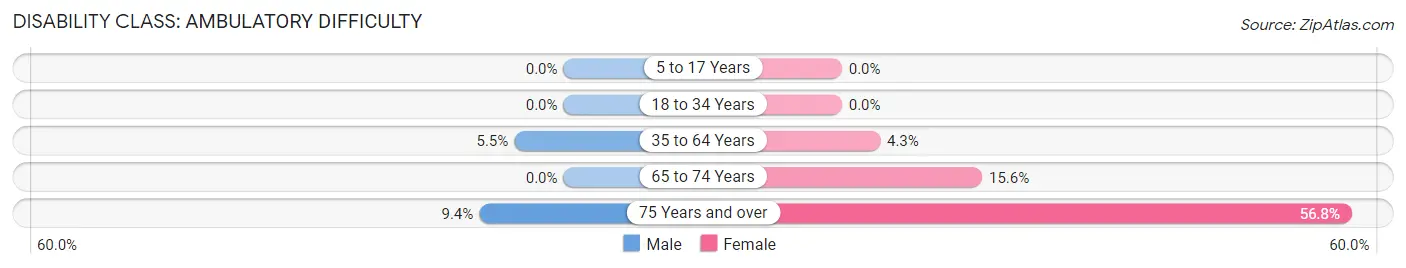
| Age Bracket | Male | Female |
| 5 to 17 Years | 0 (0.0%) | 0 (0.0%) |
| 18 to 34 Years | 0 (0.0%) | 0 (0.0%) |
| 35 to 64 Years | 17 (5.5%) | 13 (4.3%) |
| 65 to 74 Years | 0 (0.0%) | 10 (15.6%) |
| 75 Years and over | 6 (9.4%) | 46 (56.8%) |
Disability Class: Self-Care Difficulty
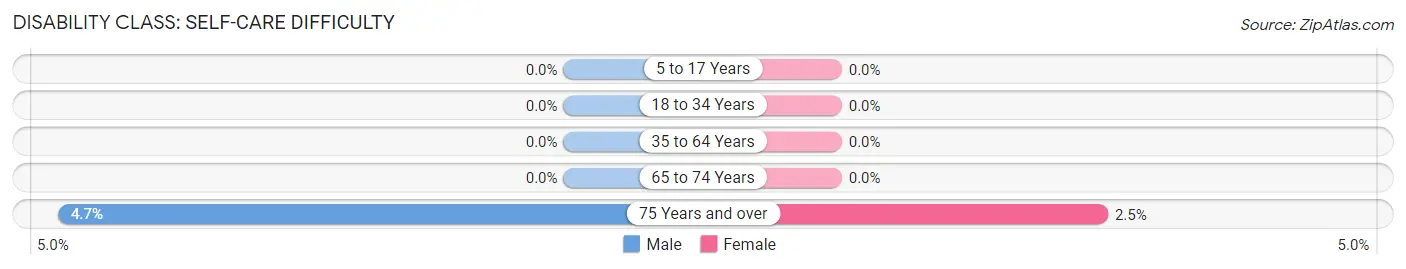
| Age Bracket | Male | Female |
| 5 to 17 Years | 0 (0.0%) | 0 (0.0%) |
| 18 to 34 Years | 0 (0.0%) | 0 (0.0%) |
| 35 to 64 Years | 0 (0.0%) | 0 (0.0%) |
| 65 to 74 Years | 0 (0.0%) | 0 (0.0%) |
| 75 Years and over | 3 (4.7%) | 2 (2.5%) |
Technology Access in Fort Recovery
Computing Device Access in Fort Recovery
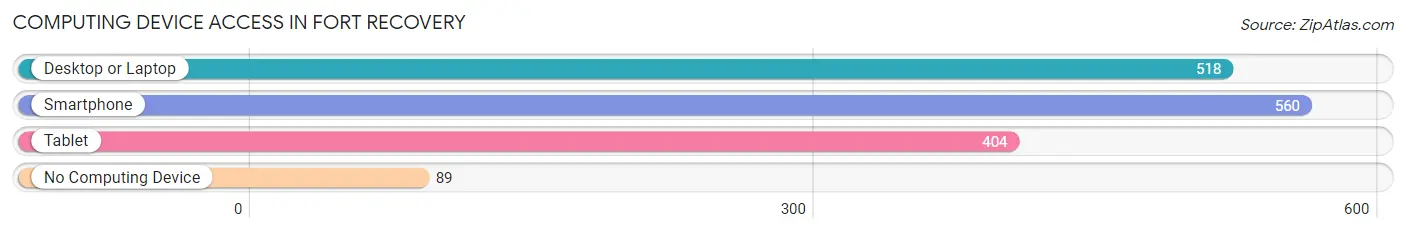
| Device Type | # Households | % Households |
| Desktop or Laptop | 518 | 74.5% |
| Smartphone | 560 | 80.6% |
| Tablet | 404 | 58.1% |
| No Computing Device | 89 | 12.8% |
| Total | 695 | 100.0% |
Internet Access in Fort Recovery
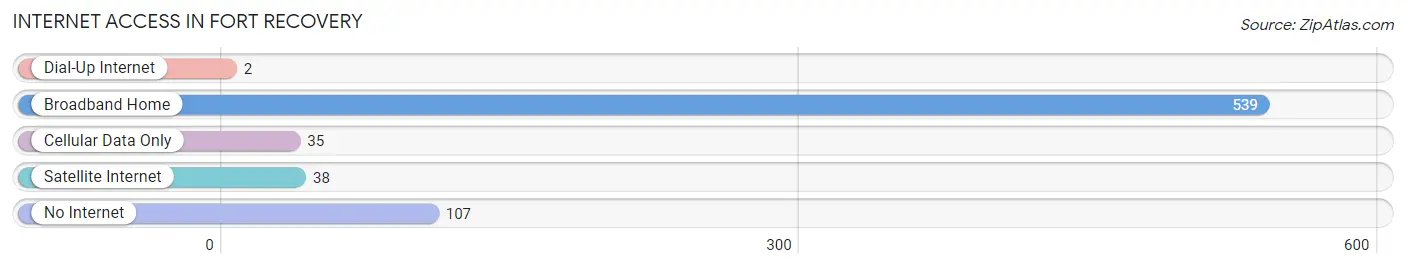
| Internet Type | # Households | % Households |
| Dial-Up Internet | 2 | 0.3% |
| Broadband Home | 539 | 77.5% |
| Cellular Data Only | 35 | 5.0% |
| Satellite Internet | 38 | 5.5% |
| No Internet | 107 | 15.4% |
| Total | 695 | 100.0% |
Fort Recovery Summary
History
Fort Recovery is a small village located in Mercer County, Ohio. It is situated on the banks of the Wabash River, and is the county seat of Mercer County. The village was founded in 1812 by General William Henry Harrison, who named it after the nearby fort he had built in 1793. The fort was built to protect the settlers from Native American attacks, and was the site of two major battles during the Northwest Indian War.
The first battle, known as the Battle of Fort Recovery, took place in 1794 and was a victory for the United States. The second battle, known as the Battle of Wabash, took place in 1812 and was a victory for the Native Americans. After the war, the fort was abandoned and the village of Fort Recovery was established.
The village grew slowly over the years, and by the mid-1800s it had become a thriving community. It was home to several businesses, including a sawmill, a gristmill, a blacksmith shop, and a general store. The village also had a post office, a school, and a church.
In the late 1800s, the village began to decline as the railroad bypassed it. The population decreased and many of the businesses closed. However, the village was revitalized in the early 1900s when the Wabash River was dammed to create a reservoir. This provided the village with a new source of water and electricity, and the population began to grow again.
Today, Fort Recovery is a small village with a population of around 1,500 people. It is home to several businesses, including a grocery store, a hardware store, a bank, and several restaurants. The village also has a post office, a library, and a museum.
Geography
Fort Recovery is located in Mercer County, Ohio, on the banks of the Wabash River. The village is situated at the intersection of State Route 49 and State Route 118. The village is surrounded by farmland and is located approximately 30 miles from the city of Dayton.
The terrain around Fort Recovery is mostly flat, with some rolling hills. The village is located in the Great Black Swamp region of Ohio, and the surrounding area is mostly covered in wetlands and swamps. The Wabash River runs through the village, and there are several small lakes and ponds in the area.
Economy
The economy of Fort Recovery is largely based on agriculture. The surrounding area is mostly farmland, and the village is home to several farms and agricultural businesses. The village also has several small businesses, including a grocery store, a hardware store, a bank, and several restaurants.
The village is also home to several manufacturing businesses, including a plastics factory and a metal fabrication plant. The village is also home to a small airport, which serves as a hub for private and corporate aircraft.
Demographics
As of the 2010 census, the population of Fort Recovery was 1,521. The racial makeup of the village was 97.3% White, 0.7% African American, 0.2% Native American, 0.2% Asian, 0.2% from other races, and 1.6% from two or more races. Hispanic or Latino of any race were 0.7% of the population.
The median household income in Fort Recovery was $45,938, and the median family income was $51,250. The per capita income for the village was $20,945. About 8.3% of families and 10.2% of the population were below the poverty line, including 14.2% of those under age 18 and 6.2% of those age 65 or over.
Common Questions
What is the Total Population of Fort Recovery?
Total Population of Fort Recovery is 1,955.
What is the Total Male Population of Fort Recovery?
Total Male Population of Fort Recovery is 1,007.
What is the Total Female Population of Fort Recovery?
Total Female Population of Fort Recovery is 948.
What is the Ratio of Males per 100 Females in Fort Recovery?
There are 106.22 Males per 100 Females in Fort Recovery.
What is the Ratio of Females per 100 Males in Fort Recovery?
There are 94.14 Females per 100 Males in Fort Recovery.
What is the Median Population Age in Fort Recovery?
Median Population Age in Fort Recovery is 31.5 Years.
What is the Average Family Size in Fort Recovery
Average Family Size in Fort Recovery is 3.6 People.
What is the Average Household Size in Fort Recovery
Average Household Size in Fort Recovery is 2.8 People.
What is Per Capita Income in Fort Recovery?
Per Capita income in Fort Recovery is $30,407.
What is the Median Family Income in Fort Recovery?
Median Family Income in Fort Recovery is $92,829.
What is the Median Household income in Fort Recovery?
Median Household Income in Fort Recovery is $64,013.
What is Income or Wage Gap in Fort Recovery?
Income or Wage Gap in Fort Recovery is 25.3%.
Women in Fort Recovery earn 74.7 cents for every dollar earned by a man.
What is Inequality or Gini Index in Fort Recovery?
Inequality or Gini Index in Fort Recovery is 0.37.
How Large is the Labor Force in Fort Recovery?
There are 1,034 People in the Labor Forcein in Fort Recovery.
What is the Percentage of People in the Labor Force in Fort Recovery?
70.3% of People are in the Labor Force in Fort Recovery.
What is the Unemployment Rate in Fort Recovery?
Unemployment Rate in Fort Recovery is 2.6%.