Zip Codes with the Most Immigrants from Colombia in Millstone Township, NJ
RELATED REPORTS & OPTIONS
Colombia
Millstone Township
Compare Zip Codes
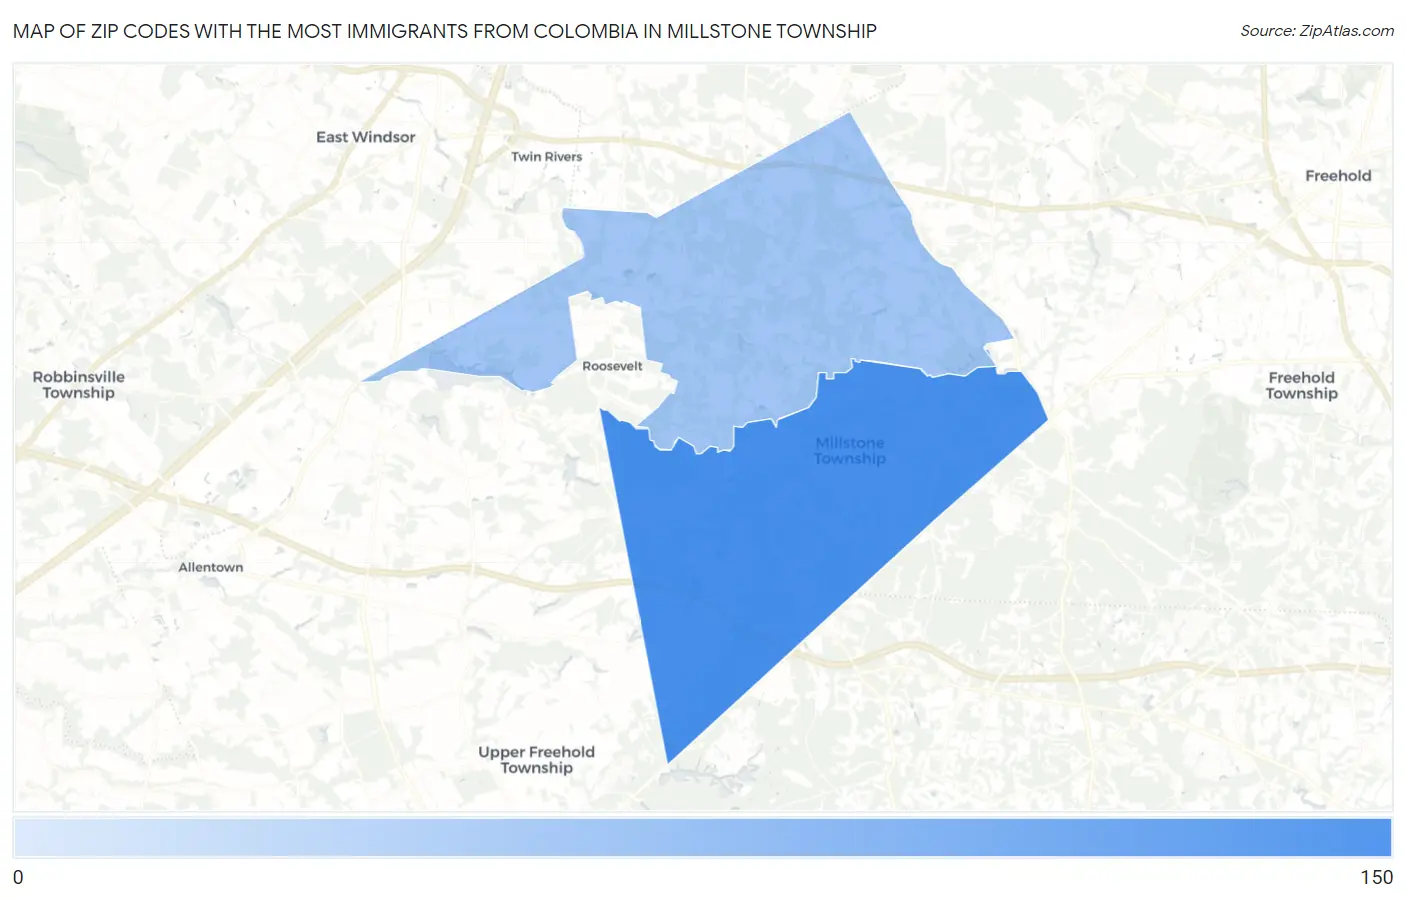
Map of Zip Codes with the Most Immigrants from Colombia in Millstone Township
0
150
Zip Codes with the Most Immigrants from Colombia in Millstone Township, NJ
| Zip Code | Colombia | vs State | vs National | |
| 1. | 08510 | 127 | 90,817(0.14%)#144 | 860,787(0.01%)#1,391 |
| 2. | 08535 | 6 | 90,817(0.01%)#363 | 860,787(0.00%)#6,475 |
1
Common Questions
What are the Top Zip Codes with the Most Immigrants from Colombia in Millstone Township, NJ?
Top Zip Codes with the Most Immigrants from Colombia in Millstone Township, NJ are:
What zip code has the Most Immigrants from Colombia in Millstone Township, NJ?
08510 has the Most Immigrants from Colombia in Millstone Township, NJ with 127.
What is the Total Immigrants from Colombia in New Jersey?
Total Immigrants from Colombia in New Jersey is 90,817.
What is the Total Immigrants from Colombia in the United States?
Total Immigrants from Colombia in the United States is 860,787.