Lake Royale, NC
Lake Royale Map
Lake Royale Overview
3,358
TOTAL POPULATION
1,766
MALE POPULATION
1,592
FEMALE POPULATION
110.93
MALES / 100 FEMALES
90.15
FEMALES / 100 MALES
41.0
MEDIAN AGE
2.7
AVG FAMILY SIZE
2.4
AVG HOUSEHOLD SIZE
$37,432
PER CAPITA INCOME
$100,545
AVG FAMILY INCOME
$100,239
AVG HOUSEHOLD INCOME
46.8%
WAGE / INCOME GAP [ % ]
53.2¢/ $1
WAGE / INCOME GAP [ $ ]
0.36
INEQUALITY / GINI INDEX
1,585
LABOR FORCE [ PEOPLE ]
57.5%
PERCENT IN LABOR FORCE
2.0%
UNEMPLOYMENT RATE
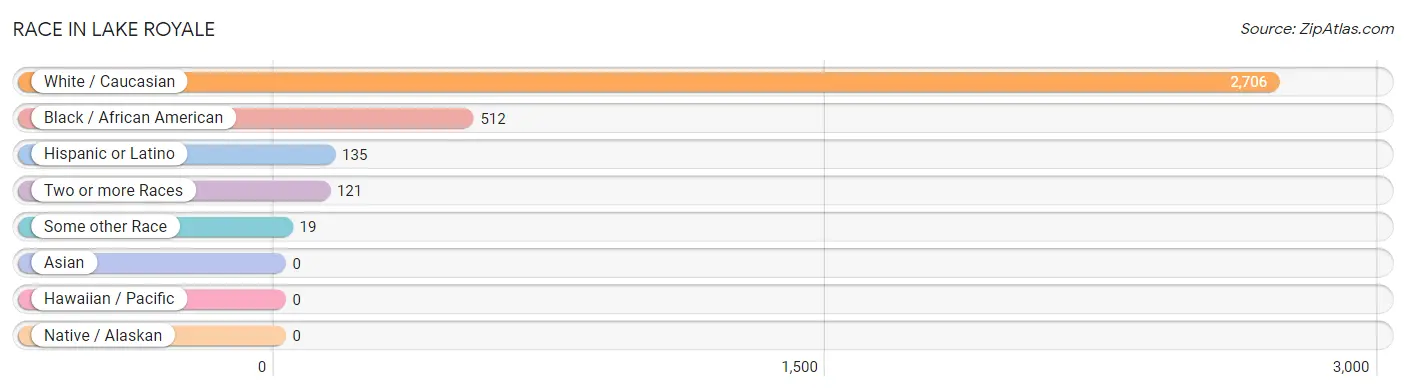
Race in Lake Royale
The most populous races in Lake Royale are White / Caucasian (2,706 | 80.6%), Black / African American (512 | 15.2%), and Hispanic or Latino (135 | 4.0%).
| Race | # Population | % Population |
| Asian | 0 | 0.0% |
| Black / African American | 512 | 15.2% |
| Hawaiian / Pacific | 0 | 0.0% |
| Hispanic or Latino | 135 | 4.0% |
| Native / Alaskan | 0 | 0.0% |
| White / Caucasian | 2,706 | 80.6% |
| Two or more Races | 121 | 3.6% |
| Some other Race | 19 | 0.6% |
| Total | 3,358 | 100.0% |
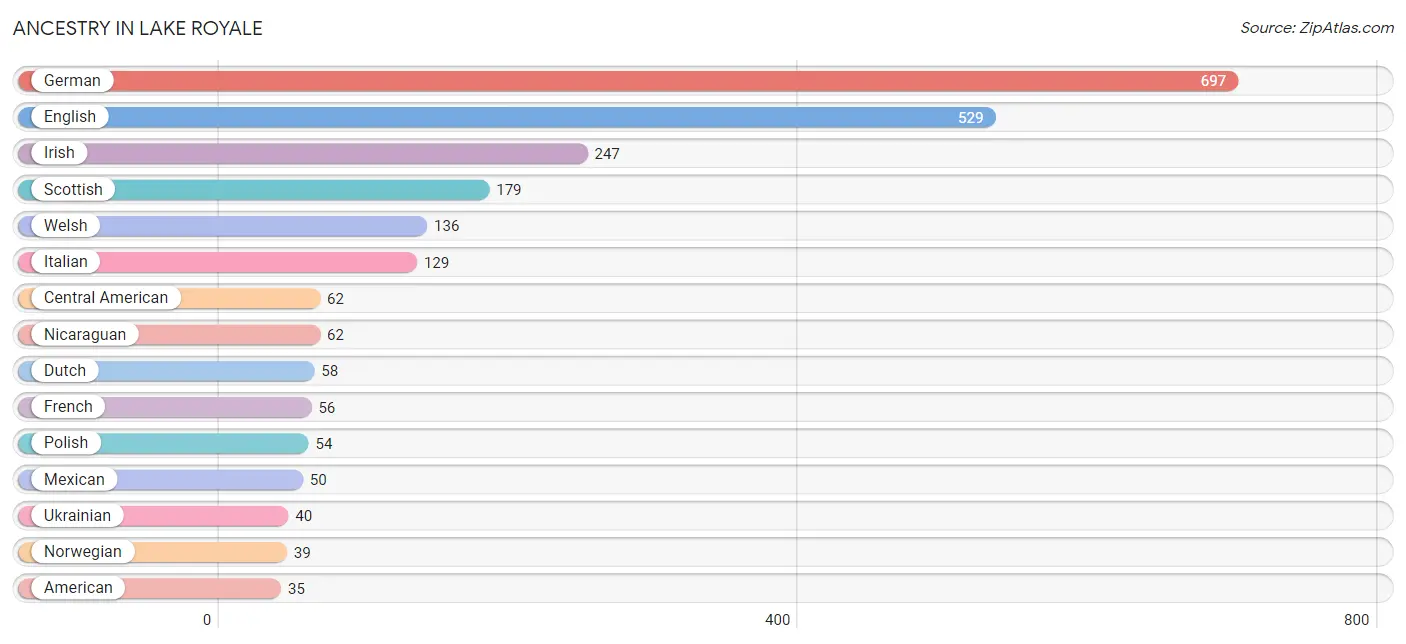
Ancestry in Lake Royale
The most populous ancestries reported in Lake Royale are German (697 | 20.8%), English (529 | 15.8%), Irish (247 | 7.4%), Scottish (179 | 5.3%), and Welsh (136 | 4.1%), together accounting for 53.2% of all Lake Royale residents.
| Ancestry | # Population | % Population |
| American | 35 | 1.0% |
| Argentinean | 23 | 0.7% |
| Central American | 62 | 1.8% |
| Cherokee | 5 | 0.2% |
| Dutch | 58 | 1.7% |
| English | 529 | 15.8% |
| European | 19 | 0.6% |
| French | 56 | 1.7% |
| French Canadian | 13 | 0.4% |
| German | 697 | 20.8% |
| Irish | 247 | 7.4% |
| Italian | 129 | 3.8% |
| Mexican | 50 | 1.5% |
| Nicaraguan | 62 | 1.8% |
| Norwegian | 39 | 1.2% |
| Polish | 54 | 1.6% |
| Scotch-Irish | 15 | 0.4% |
| Scottish | 179 | 5.3% |
| South American | 23 | 0.7% |
| Ukrainian | 40 | 1.2% |
| Welsh | 136 | 4.1% | View All 21 Rows |
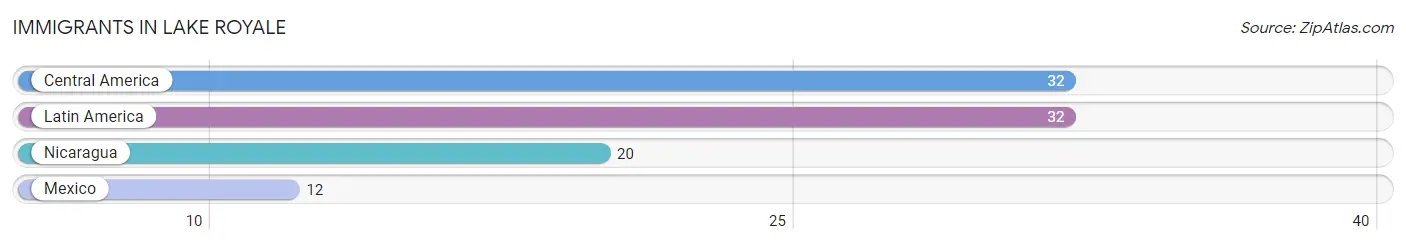
Immigrants in Lake Royale
The most numerous immigrant groups reported in Lake Royale came from Central America (32 | 0.9%), Latin America (32 | 0.9%), Nicaragua (20 | 0.6%), and Mexico (12 | 0.4%), together accounting for 2.9% of all Lake Royale residents.
| Immigration Origin | # Population | % Population |
| Central America | 32 | 0.9% |
| Latin America | 32 | 0.9% |
| Mexico | 12 | 0.4% |
| Nicaragua | 20 | 0.6% | View All 4 Rows |
Sex and Age in Lake Royale
Sex and Age in Lake Royale
The most populous age groups in Lake Royale are 10 to 14 Years (205 | 11.6%) for men and 35 to 39 Years (213 | 13.4%) for women.
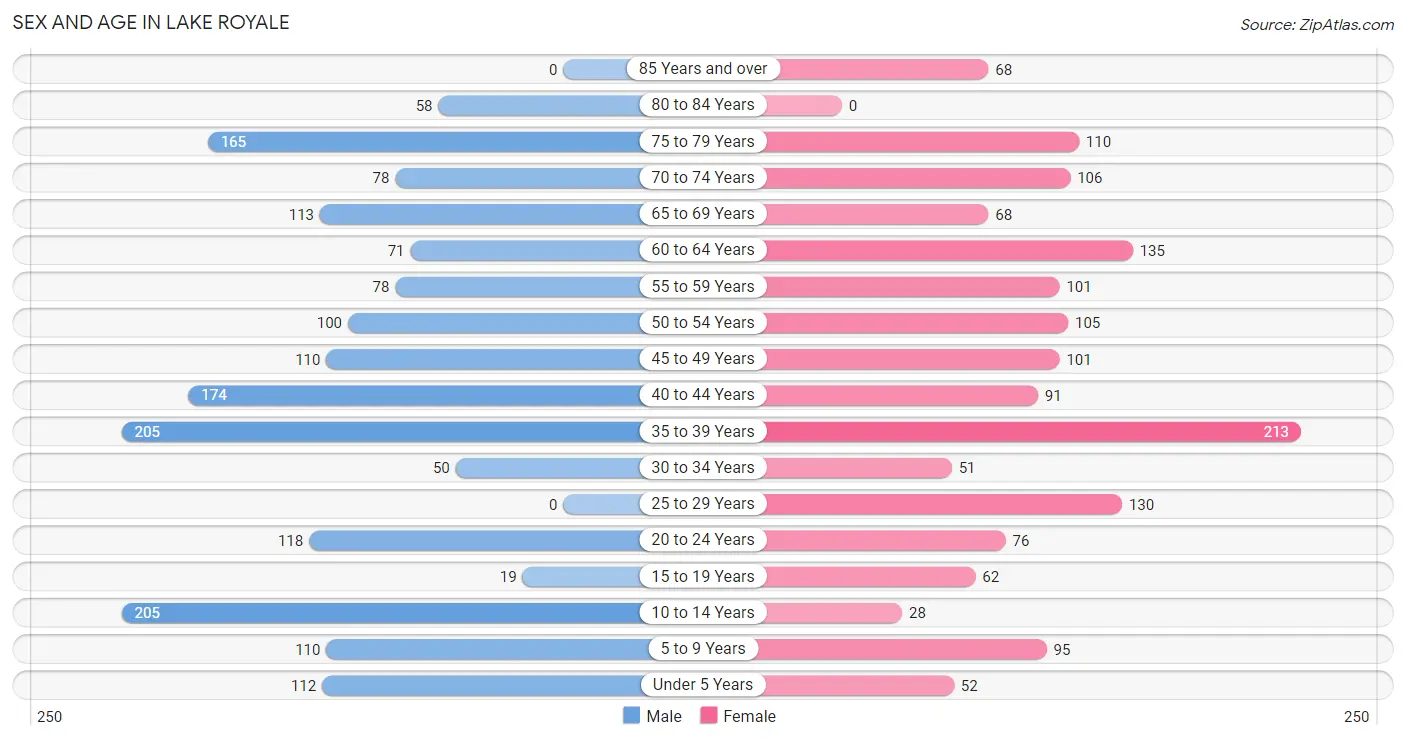
| Age Bracket | Male | Female |
| Under 5 Years | 112 (6.3%) | 52 (3.3%) |
| 5 to 9 Years | 110 (6.2%) | 95 (6.0%) |
| 10 to 14 Years | 205 (11.6%) | 28 (1.8%) |
| 15 to 19 Years | 19 (1.1%) | 62 (3.9%) |
| 20 to 24 Years | 118 (6.7%) | 76 (4.8%) |
| 25 to 29 Years | 0 (0.0%) | 130 (8.2%) |
| 30 to 34 Years | 50 (2.8%) | 51 (3.2%) |
| 35 to 39 Years | 205 (11.6%) | 213 (13.4%) |
| 40 to 44 Years | 174 (9.9%) | 91 (5.7%) |
| 45 to 49 Years | 110 (6.2%) | 101 (6.3%) |
| 50 to 54 Years | 100 (5.7%) | 105 (6.6%) |
| 55 to 59 Years | 78 (4.4%) | 101 (6.3%) |
| 60 to 64 Years | 71 (4.0%) | 135 (8.5%) |
| 65 to 69 Years | 113 (6.4%) | 68 (4.3%) |
| 70 to 74 Years | 78 (4.4%) | 106 (6.7%) |
| 75 to 79 Years | 165 (9.3%) | 110 (6.9%) |
| 80 to 84 Years | 58 (3.3%) | 0 (0.0%) |
| 85 Years and over | 0 (0.0%) | 68 (4.3%) |
| Total | 1,766 (100.0%) | 1,592 (100.0%) |
Families and Households in Lake Royale
Median Family Size in Lake Royale
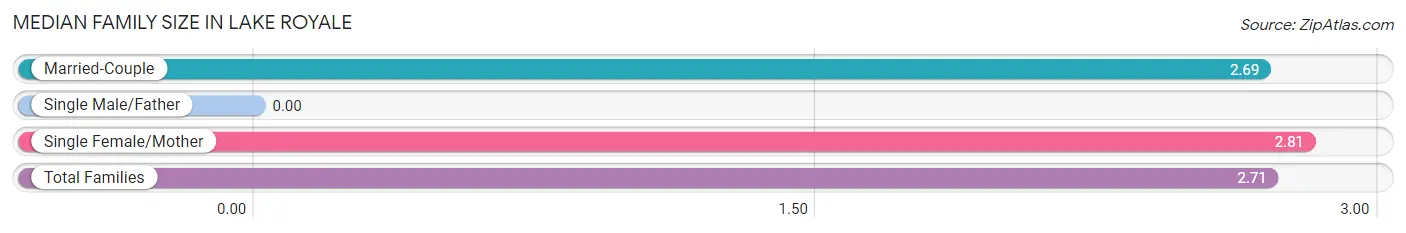
| Family Type | # Families | Family Size |
| Married-Couple | 904 (87.1%) | 2.69 |
| Single Male/Father | 0 (0.0%) | - |
| Single Female/Mother | 134 (12.9%) | 2.81 |
| Total Families | 1,038 (100.0%) | 2.71 |
Median Household Size in Lake Royale
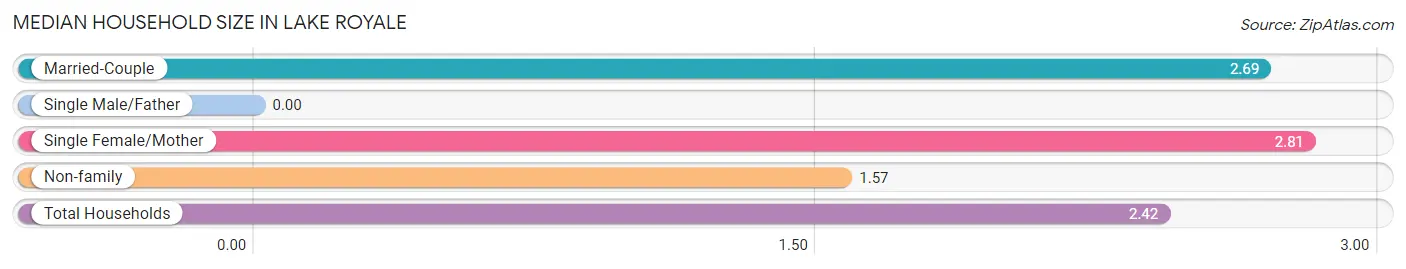
| Household Type | # Households | Household Size |
| Married-Couple | 904 (65.1%) | 2.69 |
| Single Male/Father | 0 (0.0%) | - |
| Single Female/Mother | 134 (9.7%) | 2.81 |
| Non-family | 351 (25.3%) | 1.57 |
| Total Households | 1,389 (100.0%) | 2.42 |
Household Size by Marriage Status in Lake Royale
Out of a total of 1,389 households in Lake Royale, 1,038 (74.7%) are family households, while 351 (25.3%) are nonfamily households. The most numerous type of family households are 2-person households, comprising 574, and the most common type of nonfamily households are 1-person households, comprising 232.
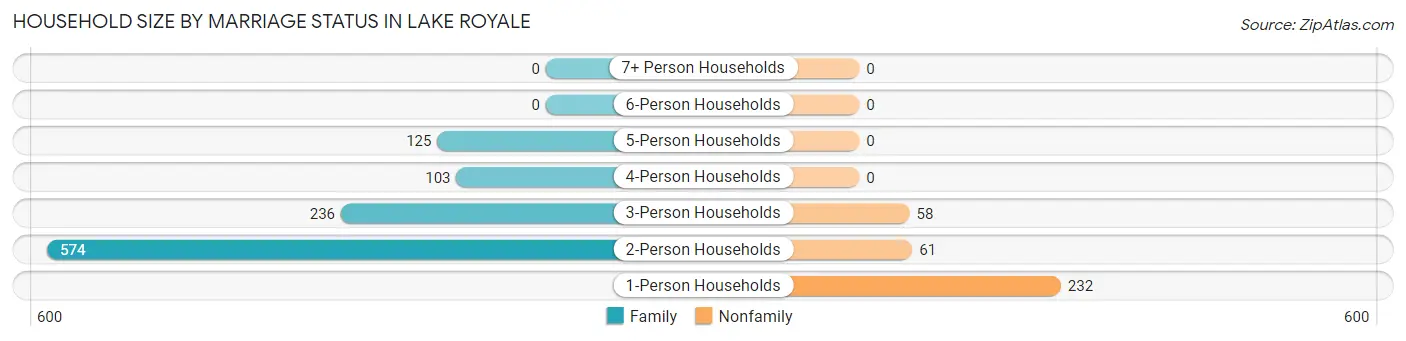
| Household Size | Family Households | Nonfamily Households |
| 1-Person Households | - | 232 (16.7%) |
| 2-Person Households | 574 (41.3%) | 61 (4.4%) |
| 3-Person Households | 236 (17.0%) | 58 (4.2%) |
| 4-Person Households | 103 (7.4%) | 0 (0.0%) |
| 5-Person Households | 125 (9.0%) | 0 (0.0%) |
| 6-Person Households | 0 (0.0%) | 0 (0.0%) |
| 7+ Person Households | 0 (0.0%) | 0 (0.0%) |
| Total | 1,038 (74.7%) | 351 (25.3%) |
Female Fertility in Lake Royale
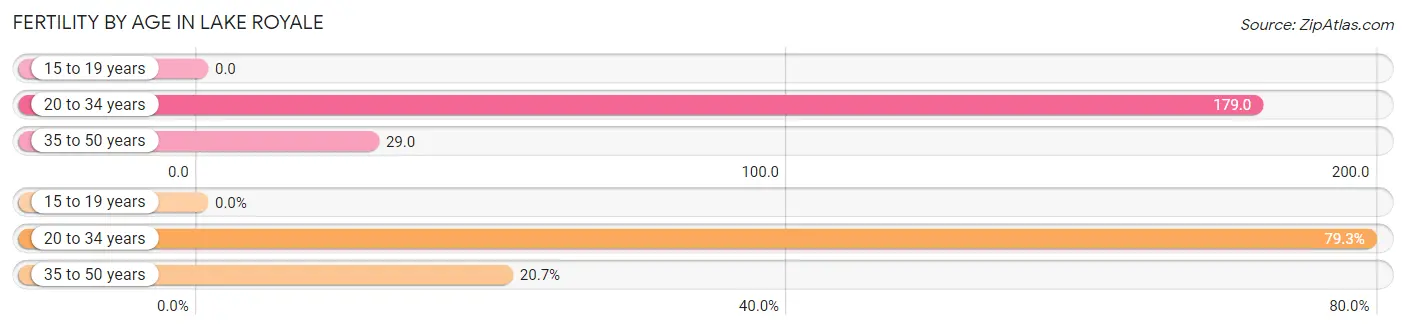
Fertility by Age in Lake Royale
Average fertility rate in Lake Royale is 79.0 births per 1,000 women. Women in the age bracket of 20 to 34 years have the highest fertility rate with 179.0 births per 1,000 women. Women in the age bracket of 20 to 34 years acount for 79.3% of all women with births.
| Age Bracket | Women with Births | Births / 1,000 Women |
| 15 to 19 years | 0 (0.0%) | 0.0 |
| 20 to 34 years | 46 (79.3%) | 179.0 |
| 35 to 50 years | 12 (20.7%) | 29.0 |
| Total | 58 (100.0%) | 79.0 |
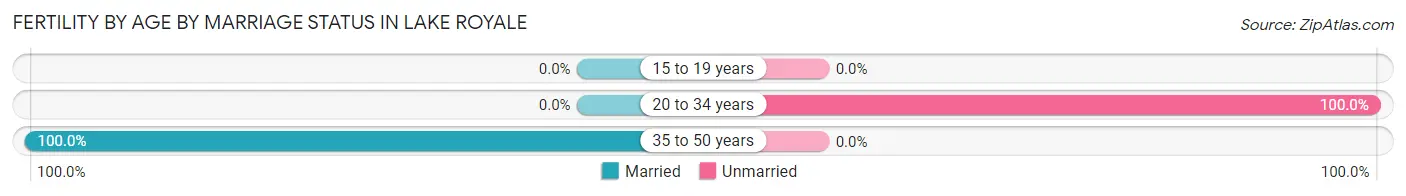
Fertility by Age by Marriage Status in Lake Royale
20.7% of women with births (58) in Lake Royale are married. The highest percentage of unmarried women with births falls into 20 to 34 years age bracket with 100.0% of them unmarried at the time of birth, while the lowest percentage of unmarried women with births belong to 35 to 50 years age bracket with 0.0% of them unmarried.
| Age Bracket | Married | Unmarried |
| 15 to 19 years | 0 (0.0%) | 0 (0.0%) |
| 20 to 34 years | 0 (0.0%) | 46 (100.0%) |
| 35 to 50 years | 12 (100.0%) | 0 (0.0%) |
| Total | 12 (20.7%) | 46 (79.3%) |
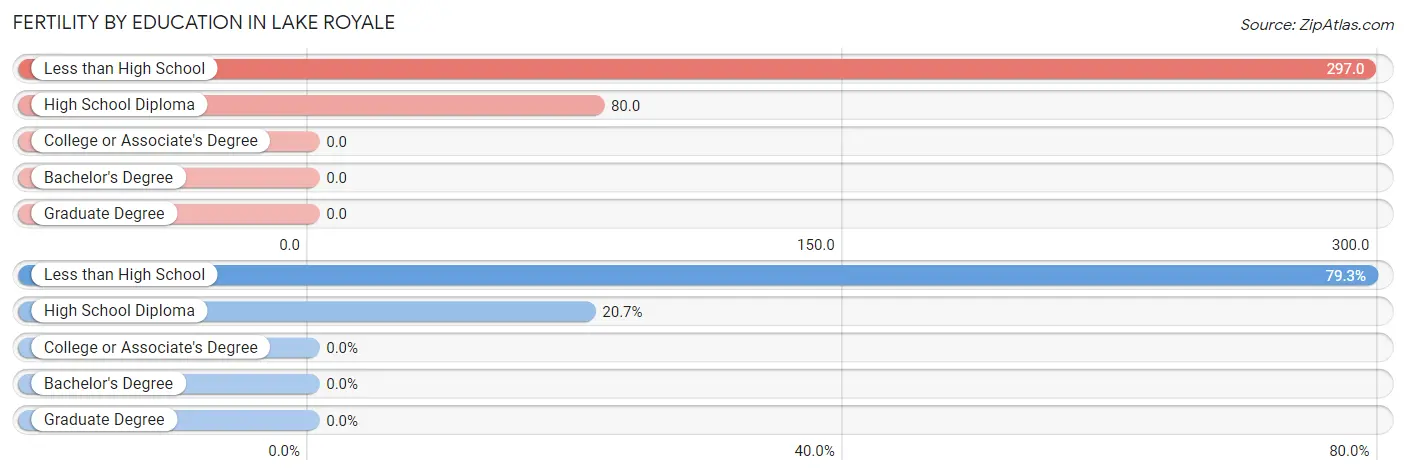
Fertility by Education in Lake Royale
| Educational Attainment | Women with Births | Births / 1,000 Women |
| Less than High School | 46 (79.3%) | 297.0 |
| High School Diploma | 12 (20.7%) | 80.0 |
| College or Associate's Degree | 0 (0.0%) | 0.0 |
| Bachelor's Degree | 0 (0.0%) | 0.0 |
| Graduate Degree | 0 (0.0%) | 0.0 |
| Total | 58 (100.0%) | 79.0 |
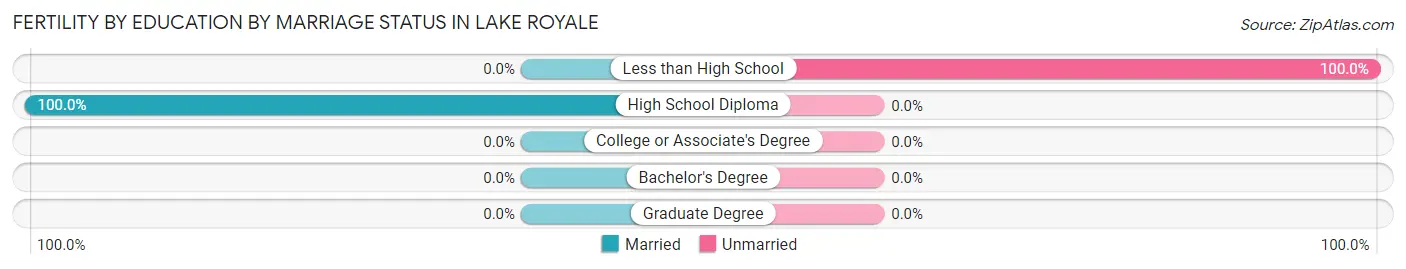
Fertility by Education by Marriage Status in Lake Royale
79.3% of women with births in Lake Royale are unmarried. Women with the educational attainment of high school diploma are most likely to be married with 100.0% of them married at childbirth, while women with the educational attainment of less than high school are least likely to be married with 100.0% of them unmarried at childbirth.
| Educational Attainment | Married | Unmarried |
| Less than High School | 0 (0.0%) | 46 (100.0%) |
| High School Diploma | 12 (100.0%) | 0 (0.0%) |
| College or Associate's Degree | 0 (0.0%) | 0 (0.0%) |
| Bachelor's Degree | 0 (0.0%) | 0 (0.0%) |
| Graduate Degree | 0 (0.0%) | 0 (0.0%) |
| Total | 12 (20.7%) | 46 (79.3%) |
Income in Lake Royale
Income Overview in Lake Royale
Per Capita Income in Lake Royale is $37,432, while median incomes of families and households are $100,545 and $100,239 respectively.
| Characteristic | Number | Measure |
| Per Capita Income | 3,358 | $37,432 |
| Median Family Income | 1,038 | $100,545 |
| Mean Family Income | 1,038 | $97,489 |
| Median Household Income | 1,389 | $100,239 |
| Mean Household Income | 1,389 | $90,670 |
| Income Deficit | 1,038 | $0 |
| Wage / Income Gap (%) | 3,358 | 46.78% |
| Wage / Income Gap ($) | 3,358 | 53.22¢ per $1 |
| Gini / Inequality Index | 3,358 | 0.36 |
Earnings by Sex in Lake Royale
Average Earnings in Lake Royale are $50,395, $56,000 for men and $29,802 for women, a difference of 46.8%.
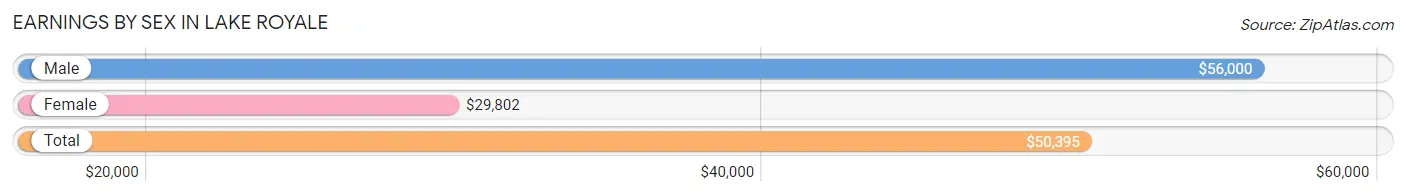
| Sex | Number | Average Earnings |
| Male | 842 (50.7%) | $56,000 |
| Female | 817 (49.2%) | $29,802 |
| Total | 1,659 (100.0%) | $50,395 |
Earnings by Sex by Income Bracket in Lake Royale
The most common earnings brackets in Lake Royale are $100,000+ for men (188 | 22.3%) and $50,000 to $54,999 for women (165 | 20.2%).
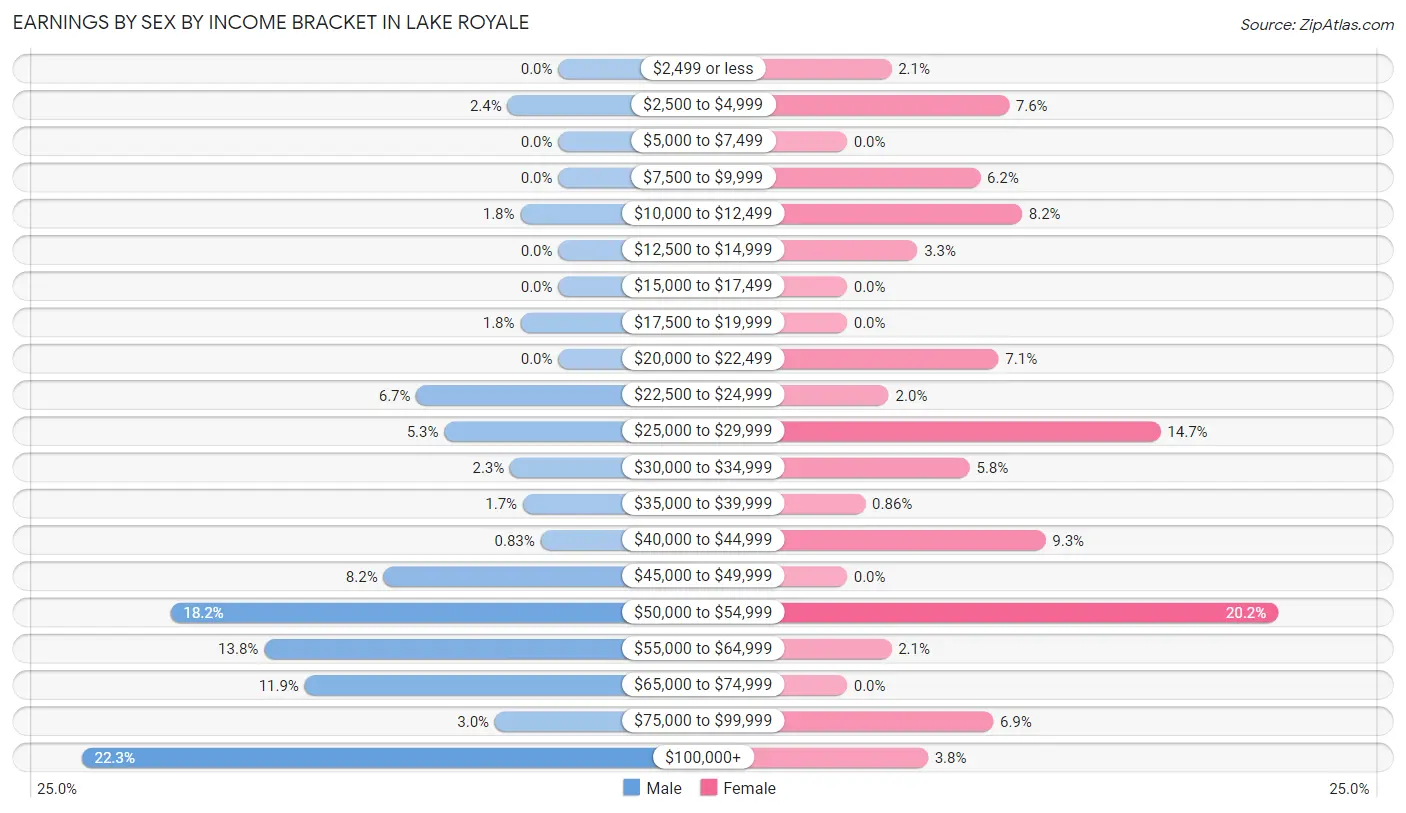
| Income | Male | Female |
| $2,499 or less | 0 (0.0%) | 17 (2.1%) |
| $2,500 to $4,999 | 20 (2.4%) | 62 (7.6%) |
| $5,000 to $7,499 | 0 (0.0%) | 0 (0.0%) |
| $7,500 to $9,999 | 0 (0.0%) | 51 (6.2%) |
| $10,000 to $12,499 | 15 (1.8%) | 67 (8.2%) |
| $12,500 to $14,999 | 0 (0.0%) | 27 (3.3%) |
| $15,000 to $17,499 | 0 (0.0%) | 0 (0.0%) |
| $17,500 to $19,999 | 15 (1.8%) | 0 (0.0%) |
| $20,000 to $22,499 | 0 (0.0%) | 58 (7.1%) |
| $22,500 to $24,999 | 56 (6.7%) | 16 (2.0%) |
| $25,000 to $29,999 | 45 (5.3%) | 120 (14.7%) |
| $30,000 to $34,999 | 19 (2.3%) | 47 (5.8%) |
| $35,000 to $39,999 | 14 (1.7%) | 7 (0.9%) |
| $40,000 to $44,999 | 7 (0.8%) | 76 (9.3%) |
| $45,000 to $49,999 | 69 (8.2%) | 0 (0.0%) |
| $50,000 to $54,999 | 153 (18.2%) | 165 (20.2%) |
| $55,000 to $64,999 | 116 (13.8%) | 17 (2.1%) |
| $65,000 to $74,999 | 100 (11.9%) | 0 (0.0%) |
| $75,000 to $99,999 | 25 (3.0%) | 56 (6.9%) |
| $100,000+ | 188 (22.3%) | 31 (3.8%) |
| Total | 842 (100.0%) | 817 (100.0%) |
Earnings by Sex by Educational Attainment in Lake Royale
Average earnings in Lake Royale are $62,159 for men and $29,188 for women, a difference of 53.0%. Men with an educational attainment of graduate degree enjoy the highest average annual earnings of $108,218, while those with high school diploma education earn the least with $54,755. Women with an educational attainment of graduate degree earn the most with the average annual earnings of $85,682, while those with high school diploma education have the smallest earnings of $28,654.
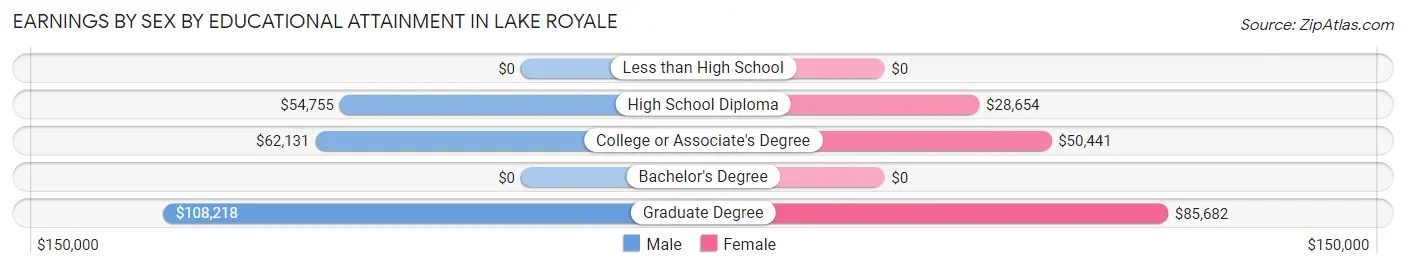
| Educational Attainment | Male Income | Female Income |
| Less than High School | - | - |
| High School Diploma | $54,755 | $28,654 |
| College or Associate's Degree | $62,131 | $50,441 |
| Bachelor's Degree | - | - |
| Graduate Degree | $108,218 | $85,682 |
| Total | $62,159 | $29,188 |
Family Income in Lake Royale
Family Income Brackets in Lake Royale
According to the Lake Royale family income data, there are 389 families falling into the $100,000 to $149,999 income range, which is the most common income bracket and makes up 37.5% of all families.
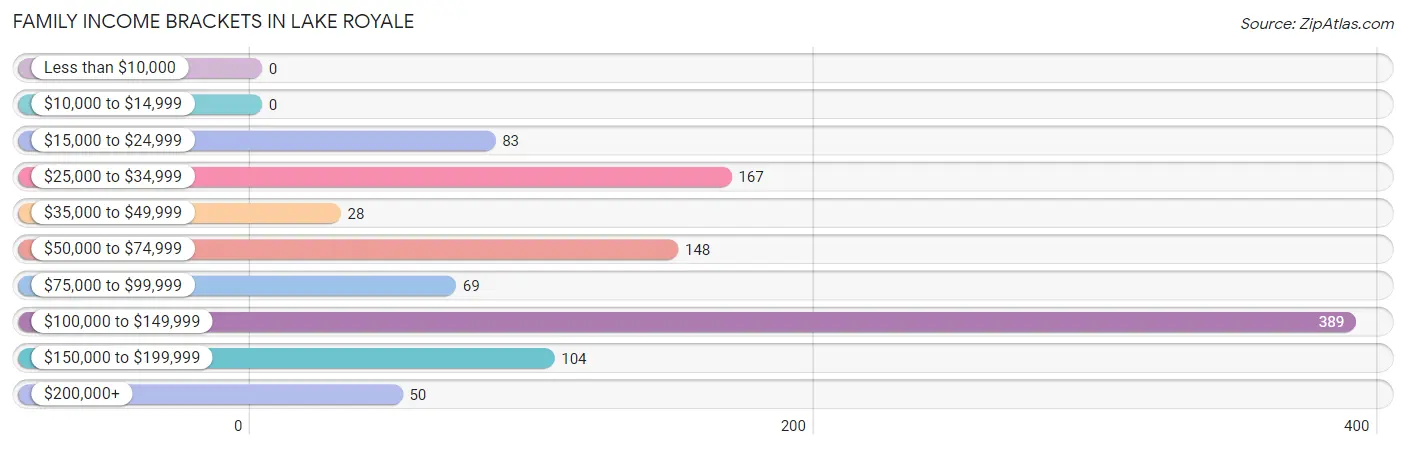
| Income Bracket | # Families | % Families |
| Less than $10,000 | 0 | 0.0% |
| $10,000 to $14,999 | 0 | 0.0% |
| $15,000 to $24,999 | 83 | 8.0% |
| $25,000 to $34,999 | 167 | 16.1% |
| $35,000 to $49,999 | 28 | 2.7% |
| $50,000 to $74,999 | 148 | 14.3% |
| $75,000 to $99,999 | 69 | 6.6% |
| $100,000 to $149,999 | 389 | 37.5% |
| $150,000 to $199,999 | 104 | 10.0% |
| $200,000+ | 50 | 4.8% |
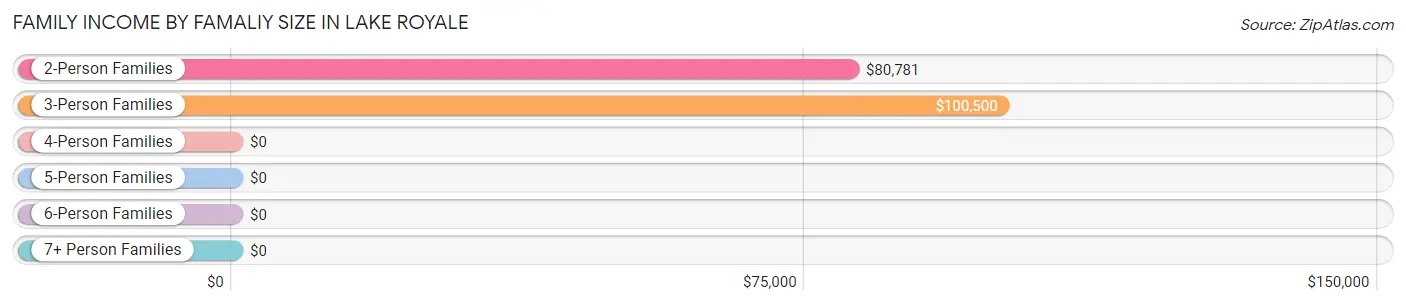
Family Income by Famaliy Size in Lake Royale
3-person families (236 | 22.7%) account for the highest median family income in Lake Royale with $100,500 per family, while 2-person families (574 | 55.3%) have the highest median income of $40,390 per family member.
| Income Bracket | # Families | Median Income |
| 2-Person Families | 574 (55.3%) | $80,781 |
| 3-Person Families | 236 (22.7%) | $100,500 |
| 4-Person Families | 103 (9.9%) | $0 |
| 5-Person Families | 125 (12.0%) | $0 |
| 6-Person Families | 0 (0.0%) | $0 |
| 7+ Person Families | 0 (0.0%) | $0 |
| Total | 1,038 (100.0%) | $100,545 |
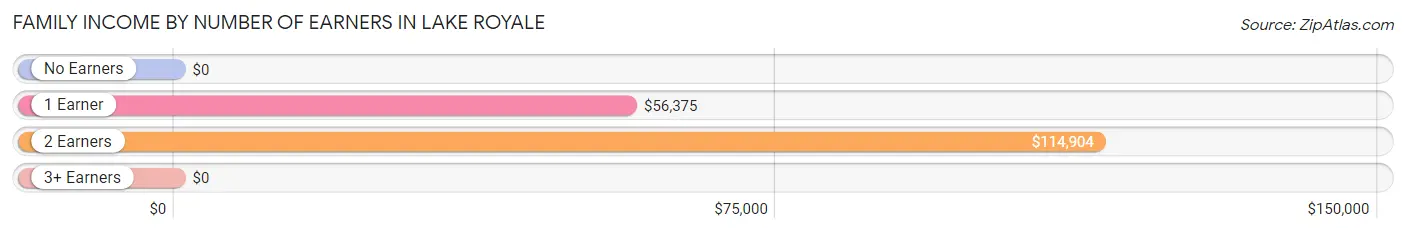
Family Income by Number of Earners in Lake Royale
| Number of Earners | # Families | Median Income |
| No Earners | 296 (28.5%) | $0 |
| 1 Earner | 288 (27.8%) | $56,375 |
| 2 Earners | 425 (40.9%) | $114,904 |
| 3+ Earners | 29 (2.8%) | $0 |
| Total | 1,038 (100.0%) | $100,545 |
Household Income in Lake Royale
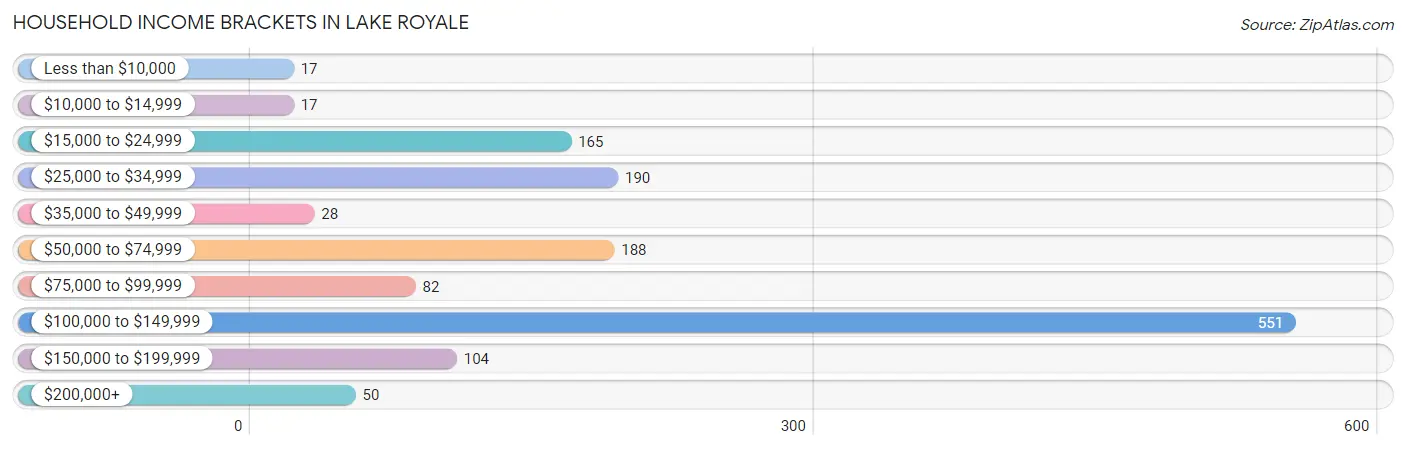
Household Income Brackets in Lake Royale
With 551 households falling in the category, the $100,000 to $149,999 income range is the most frequent in Lake Royale, accounting for 39.7% of all households. In contrast, only 17 households (1.2%) fall into the less than $10,000 income bracket, making it the least populous group.
| Income Bracket | # Households | % Households |
| Less than $10,000 | 17 | 1.2% |
| $10,000 to $14,999 | 17 | 1.2% |
| $15,000 to $24,999 | 165 | 11.9% |
| $25,000 to $34,999 | 190 | 13.7% |
| $35,000 to $49,999 | 28 | 2.0% |
| $50,000 to $74,999 | 188 | 13.5% |
| $75,000 to $99,999 | 82 | 5.9% |
| $100,000 to $149,999 | 551 | 39.7% |
| $150,000 to $199,999 | 104 | 7.5% |
| $200,000+ | 50 | 3.6% |
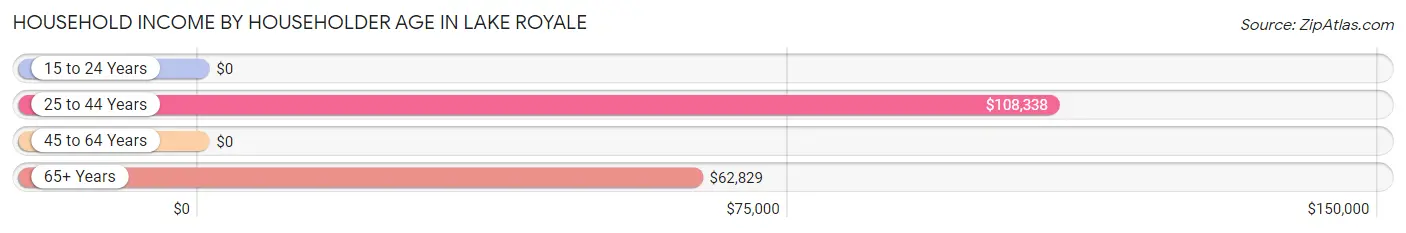
Household Income by Householder Age in Lake Royale
The median household income in Lake Royale is $100,239, with the highest median household income of $108,338 found in the 25 to 44 years age bracket for the primary householder. A total of 405 households (29.2%) fall into this category. Meanwhile, the 15 to 24 years age bracket for the primary householder has the lowest median household income of $0, with 71 households (5.1%) in this group.
| Income Bracket | # Households | Median Income |
| 15 to 24 Years | 71 (5.1%) | $0 |
| 25 to 44 Years | 405 (29.2%) | $108,338 |
| 45 to 64 Years | 472 (34.0%) | $0 |
| 65+ Years | 441 (31.8%) | $62,829 |
| Total | 1,389 (100.0%) | $100,239 |
Poverty in Lake Royale
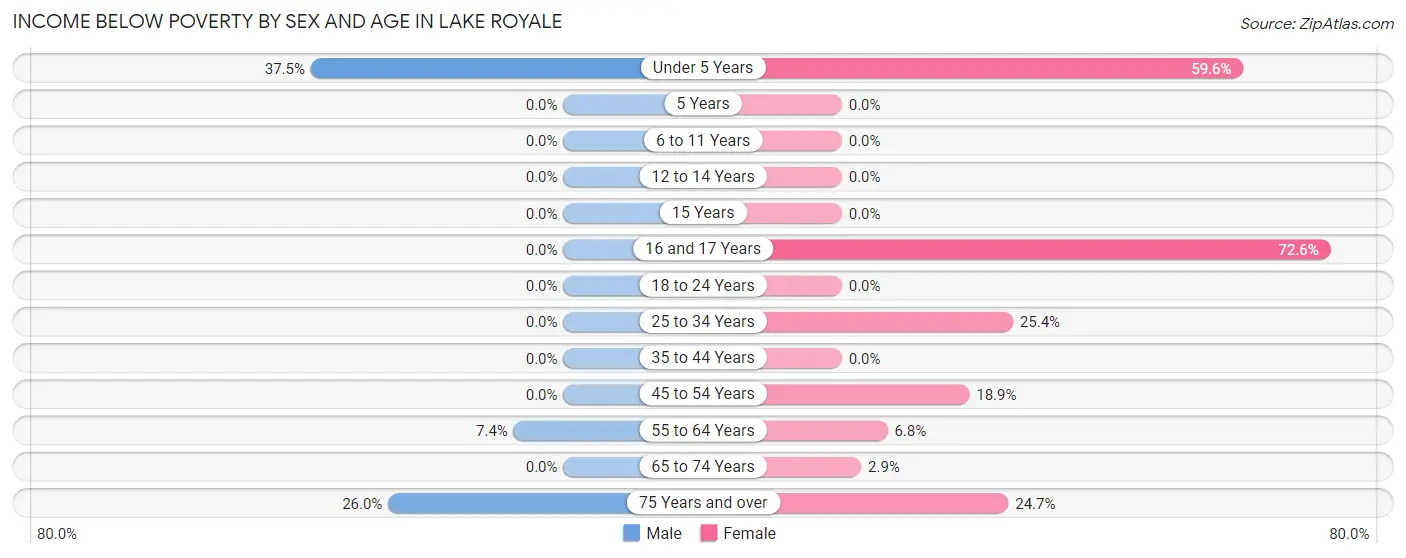
Income Below Poverty by Sex and Age in Lake Royale
With 6.3% poverty level for males and 14.2% for females among the residents of Lake Royale, under 5 year old males and 16 and 17 year old females are the most vulnerable to poverty, with 42 males (37.5%) and 45 females (72.6%) in their respective age groups living below the poverty level.
| Age Bracket | Male | Female |
| Under 5 Years | 42 (37.5%) | 31 (59.6%) |
| 5 Years | 0 (0.0%) | 0 (0.0%) |
| 6 to 11 Years | 0 (0.0%) | 0 (0.0%) |
| 12 to 14 Years | 0 (0.0%) | 0 (0.0%) |
| 15 Years | 0 (0.0%) | 0 (0.0%) |
| 16 and 17 Years | 0 (0.0%) | 45 (72.6%) |
| 18 to 24 Years | 0 (0.0%) | 0 (0.0%) |
| 25 to 34 Years | 0 (0.0%) | 46 (25.4%) |
| 35 to 44 Years | 0 (0.0%) | 0 (0.0%) |
| 45 to 54 Years | 0 (0.0%) | 39 (18.9%) |
| 55 to 64 Years | 11 (7.4%) | 16 (6.8%) |
| 65 to 74 Years | 0 (0.0%) | 5 (2.9%) |
| 75 Years and over | 58 (26.0%) | 44 (24.7%) |
| Total | 111 (6.3%) | 226 (14.2%) |
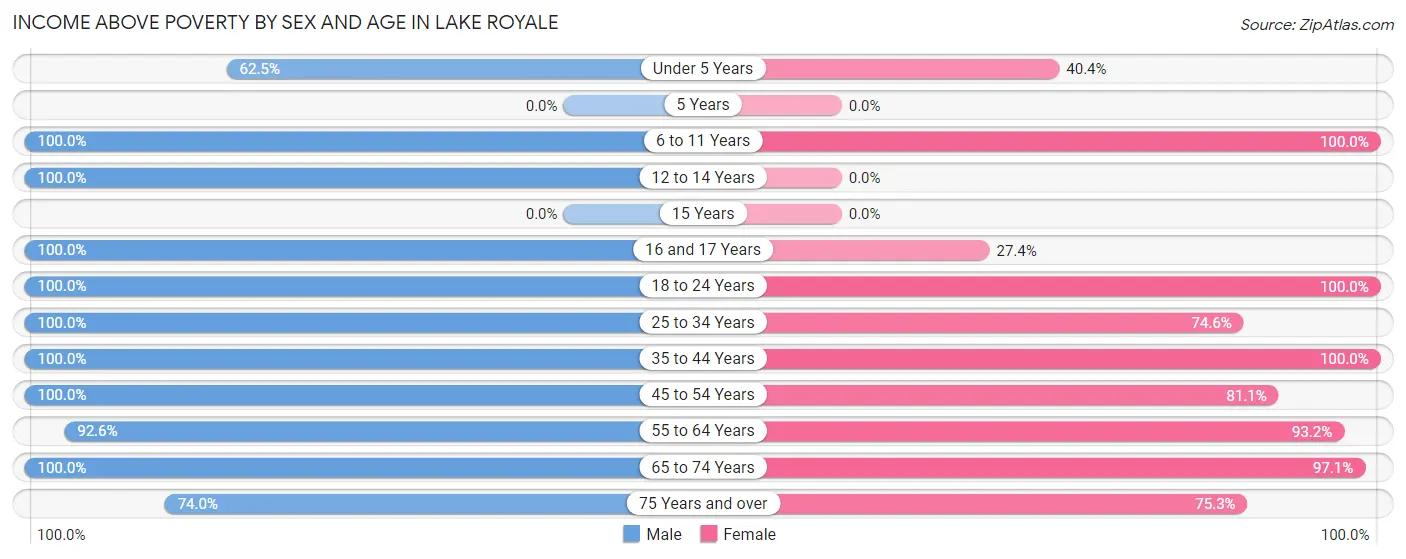
Income Above Poverty by Sex and Age in Lake Royale
According to the poverty statistics in Lake Royale, males aged 6 to 11 years and females aged 6 to 11 years are the age groups that are most secure financially, with 100.0% of males and 100.0% of females in these age groups living above the poverty line.
| Age Bracket | Male | Female |
| Under 5 Years | 70 (62.5%) | 21 (40.4%) |
| 5 Years | 0 (0.0%) | 0 (0.0%) |
| 6 to 11 Years | 296 (100.0%) | 123 (100.0%) |
| 12 to 14 Years | 19 (100.0%) | 0 (0.0%) |
| 15 Years | 0 (0.0%) | 0 (0.0%) |
| 16 and 17 Years | 19 (100.0%) | 17 (27.4%) |
| 18 to 24 Years | 118 (100.0%) | 76 (100.0%) |
| 25 to 34 Years | 50 (100.0%) | 135 (74.6%) |
| 35 to 44 Years | 379 (100.0%) | 304 (100.0%) |
| 45 to 54 Years | 210 (100.0%) | 167 (81.1%) |
| 55 to 64 Years | 138 (92.6%) | 220 (93.2%) |
| 65 to 74 Years | 191 (100.0%) | 169 (97.1%) |
| 75 Years and over | 165 (74.0%) | 134 (75.3%) |
| Total | 1,655 (93.7%) | 1,366 (85.8%) |
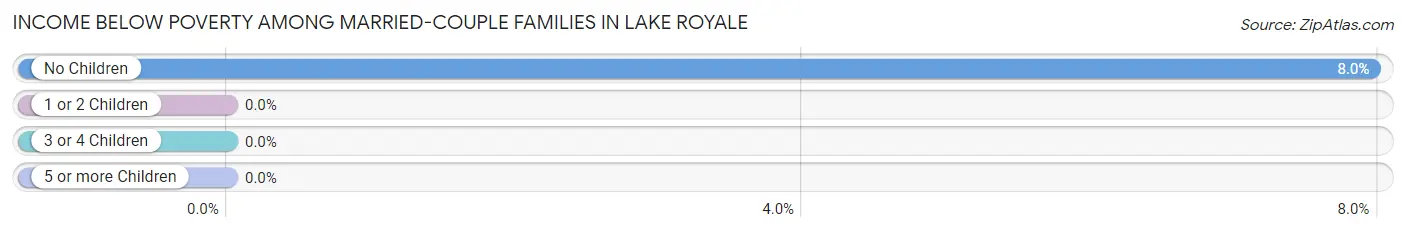
Income Below Poverty Among Married-Couple Families in Lake Royale
The poverty statistics for married-couple families in Lake Royale show that 4.9% or 44 of the total 904 families live below the poverty line. Families with no children have the highest poverty rate of 8.0%, comprising of 44 families. On the other hand, families with 1 or 2 children have the lowest poverty rate of 0.0%, which includes 0 families.
| Children | Above Poverty | Below Poverty |
| No Children | 509 (92.0%) | 44 (8.0%) |
| 1 or 2 Children | 282 (100.0%) | 0 (0.0%) |
| 3 or 4 Children | 69 (100.0%) | 0 (0.0%) |
| 5 or more Children | 0 (0.0%) | 0 (0.0%) |
| Total | 860 (95.1%) | 44 (4.9%) |
Income Below Poverty Among Single-Parent Households in Lake Royale
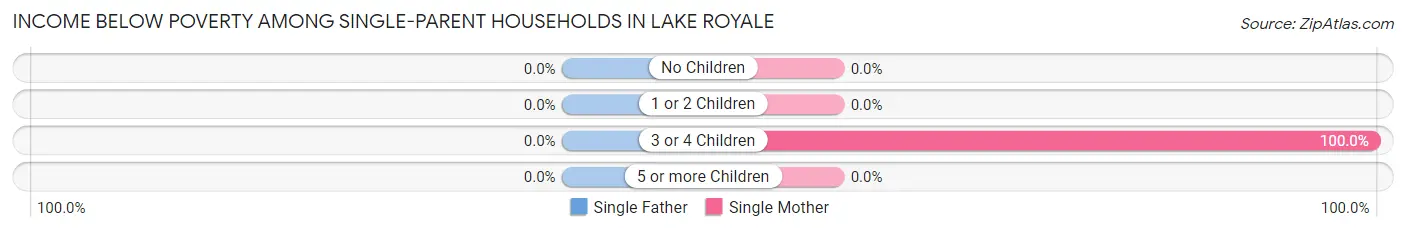
| Children | Single Father | Single Mother |
| No Children | 0 (0.0%) | 0 (0.0%) |
| 1 or 2 Children | 0 (0.0%) | 0 (0.0%) |
| 3 or 4 Children | 0 (0.0%) | 39 (100.0%) |
| 5 or more Children | 0 (0.0%) | 0 (0.0%) |
| Total | 0 (0.0%) | 39 (29.1%) |
Income Below Poverty Among Married-Couple vs Single-Parent Households in Lake Royale
The poverty data for Lake Royale shows that 44 of the married-couple family households (4.9%) and 39 of the single-parent households (29.1%) are living below the poverty level. Within the married-couple family households, those with no children have the highest poverty rate, with 44 households (8.0%) falling below the poverty line. Among the single-parent households, those with 3 or 4 children have the highest poverty rate, with 39 household (100.0%) living below poverty.
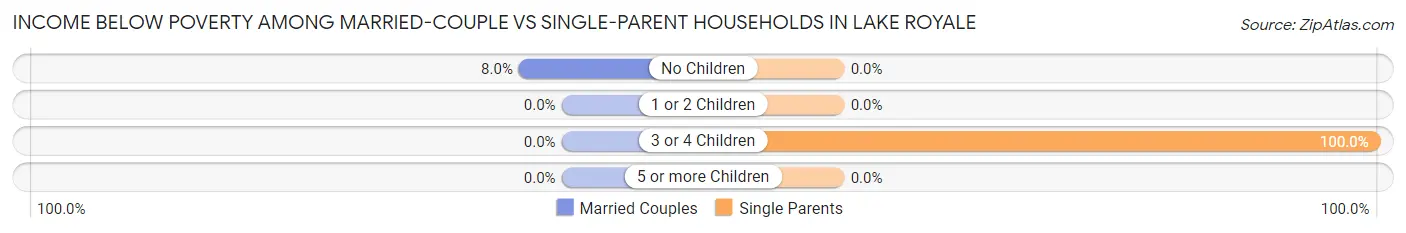
| Children | Married-Couple Families | Single-Parent Households |
| No Children | 44 (8.0%) | 0 (0.0%) |
| 1 or 2 Children | 0 (0.0%) | 0 (0.0%) |
| 3 or 4 Children | 0 (0.0%) | 39 (100.0%) |
| 5 or more Children | 0 (0.0%) | 0 (0.0%) |
| Total | 44 (4.9%) | 39 (29.1%) |
Employment Characteristics in Lake Royale
Employment by Class of Employer in Lake Royale
Among the 1,508 employed individuals in Lake Royale, private company employees (1,160 | 76.9%), self-employed (not incorporated) (108 | 7.2%), and local government employees (63 | 4.2%) make up the most common classes of employment.
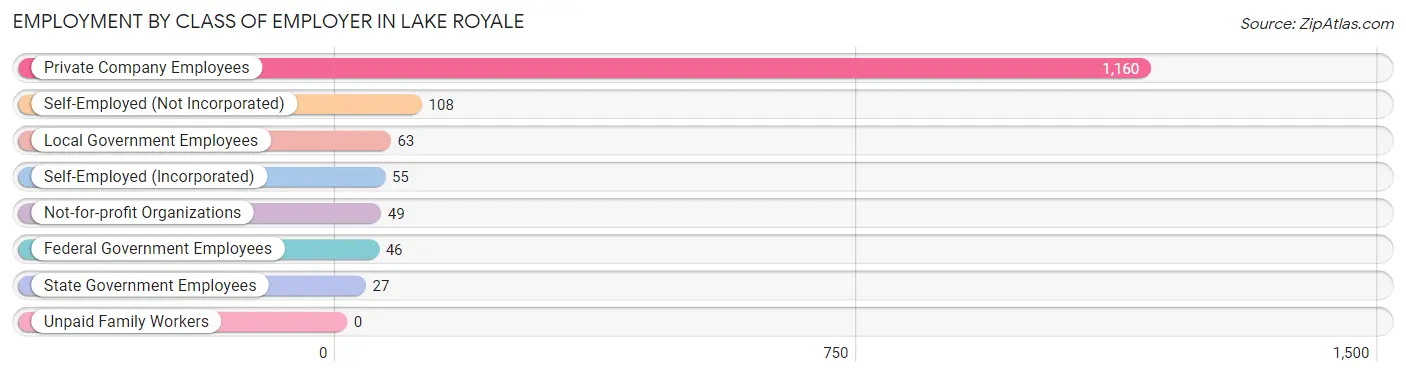
| Employer Class | # Employees | % Employees |
| Private Company Employees | 1,160 | 76.9% |
| Self-Employed (Incorporated) | 55 | 3.6% |
| Self-Employed (Not Incorporated) | 108 | 7.2% |
| Not-for-profit Organizations | 49 | 3.3% |
| Local Government Employees | 63 | 4.2% |
| State Government Employees | 27 | 1.8% |
| Federal Government Employees | 46 | 3.0% |
| Unpaid Family Workers | 0 | 0.0% |
| Total | 1,508 | 100.0% |
Employment Status by Age in Lake Royale
According to the labor force statistics for Lake Royale, out of the total population over 16 years of age (2,756), 57.5% or 1,585 individuals are in the labor force, with 2.0% or 32 of them unemployed. The age group with the highest labor force participation rate is 20 to 24 years, with 100.0% or 194 individuals in the labor force. Within the labor force, the 60 to 64 years age range has the highest percentage of unemployed individuals, with 18.5% or 31 of them being unemployed.
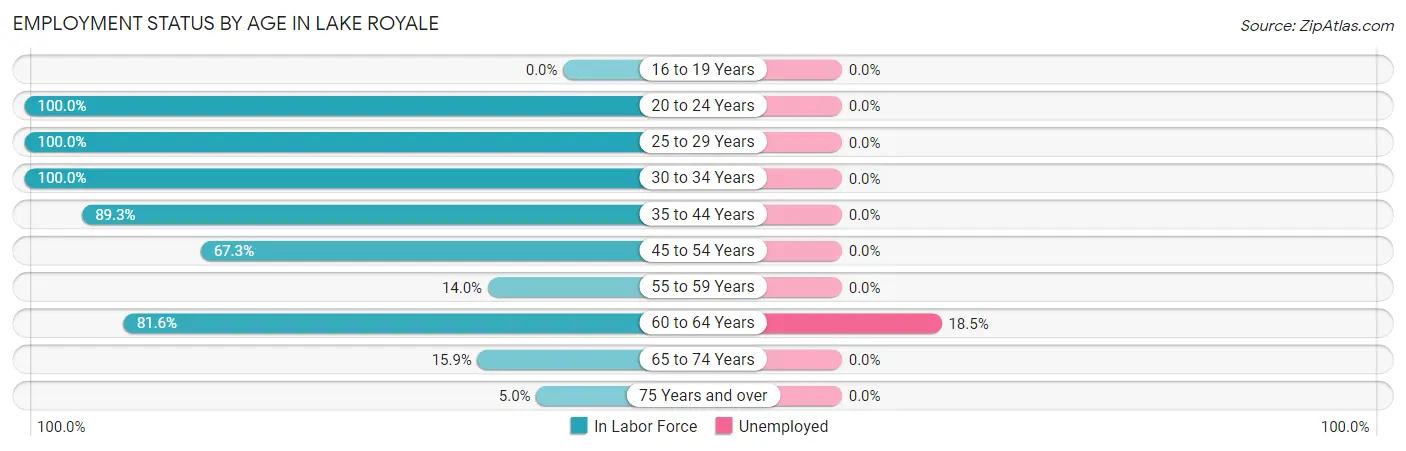
| Age Bracket | In Labor Force | Unemployed |
| 16 to 19 Years | 0 (0.0%) | 0 (0.0%) |
| 20 to 24 Years | 194 (100.0%) | 0 (0.0%) |
| 25 to 29 Years | 130 (100.0%) | 0 (0.0%) |
| 30 to 34 Years | 101 (100.0%) | 0 (0.0%) |
| 35 to 44 Years | 610 (89.3%) | 0 (0.0%) |
| 45 to 54 Years | 280 (67.3%) | 0 (0.0%) |
| 55 to 59 Years | 25 (14.0%) | 0 (0.0%) |
| 60 to 64 Years | 168 (81.6%) | 31 (18.5%) |
| 65 to 74 Years | 58 (15.9%) | 0 (0.0%) |
| 75 Years and over | 20 (5.0%) | 0 (0.0%) |
| Total | 1,585 (57.5%) | 32 (2.0%) |
Employment Status by Educational Attainment in Lake Royale
According to labor force statistics for Lake Royale, 76.6% of individuals (1,314) out of the total population between 25 and 64 years of age (1,715) are in the labor force, with 2.4% or 32 of them being unemployed. The group with the highest labor force participation rate are those with the educational attainment of high school diploma, with 94.3% or 574 individuals in the labor force. Within the labor force, individuals with bachelor's degree or higher education have the highest percentage of unemployment, with 6.0% or 16 of them being unemployed.
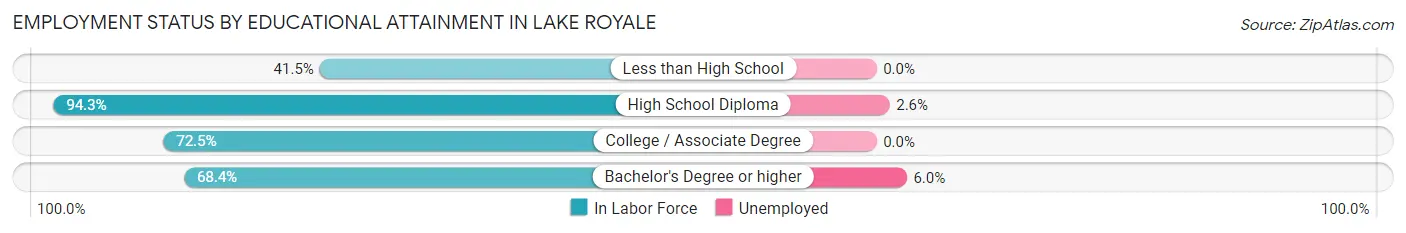
| Educational Attainment | In Labor Force | Unemployed |
| Less than High School | 61 (41.5%) | 0 (0.0%) |
| High School Diploma | 574 (94.3%) | 16 (2.6%) |
| College / Associate Degree | 411 (72.5%) | 0 (0.0%) |
| Bachelor's Degree or higher | 268 (68.4%) | 24 (6.0%) |
| Total | 1,314 (76.6%) | 41 (2.4%) |
Employment Occupations by Sex in Lake Royale
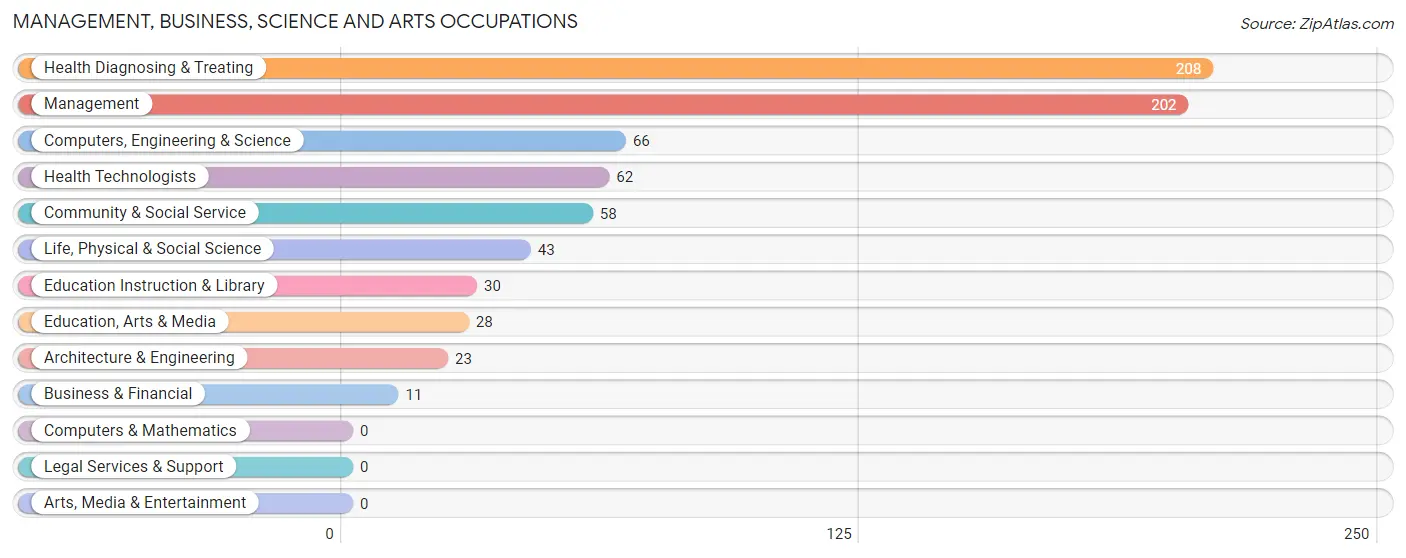
Management, Business, Science and Arts Occupations
The most common Management, Business, Science and Arts occupations in Lake Royale are Health Diagnosing & Treating (208 | 13.4%), Management (202 | 13.0%), Computers, Engineering & Science (66 | 4.2%), Health Technologists (62 | 4.0%), and Community & Social Service (58 | 3.7%).
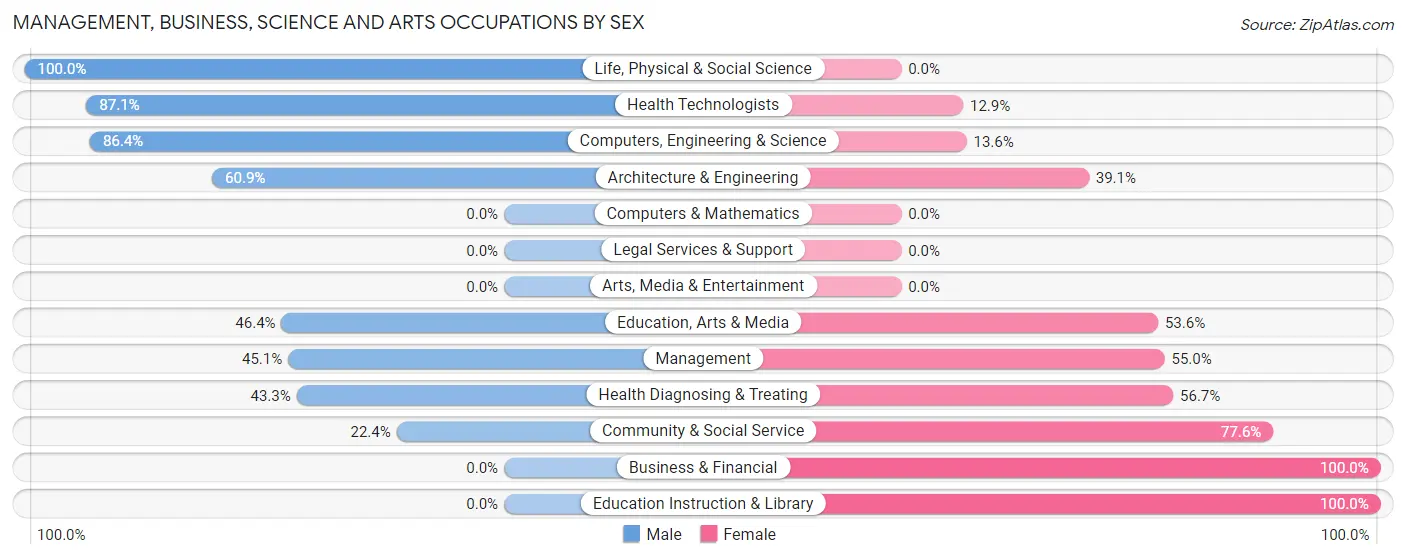
Management, Business, Science and Arts Occupations by Sex
Within the Management, Business, Science and Arts occupations in Lake Royale, the most male-oriented occupations are Life, Physical & Social Science (100.0%), Health Technologists (87.1%), and Computers, Engineering & Science (86.4%), while the most female-oriented occupations are Business & Financial (100.0%), Education Instruction & Library (100.0%), and Community & Social Service (77.6%).
| Occupation | Male | Female |
| Management | 91 (45.1%) | 111 (54.9%) |
| Business & Financial | 0 (0.0%) | 11 (100.0%) |
| Computers, Engineering & Science | 57 (86.4%) | 9 (13.6%) |
| Computers & Mathematics | 0 (0.0%) | 0 (0.0%) |
| Architecture & Engineering | 14 (60.9%) | 9 (39.1%) |
| Life, Physical & Social Science | 43 (100.0%) | 0 (0.0%) |
| Community & Social Service | 13 (22.4%) | 45 (77.6%) |
| Education, Arts & Media | 13 (46.4%) | 15 (53.6%) |
| Legal Services & Support | 0 (0.0%) | 0 (0.0%) |
| Education Instruction & Library | 0 (0.0%) | 30 (100.0%) |
| Arts, Media & Entertainment | 0 (0.0%) | 0 (0.0%) |
| Health Diagnosing & Treating | 90 (43.3%) | 118 (56.7%) |
| Health Technologists | 54 (87.1%) | 8 (12.9%) |
| Total (Category) | 251 (46.1%) | 294 (53.9%) |
| Total (Overall) | 771 (49.6%) | 784 (50.4%) |
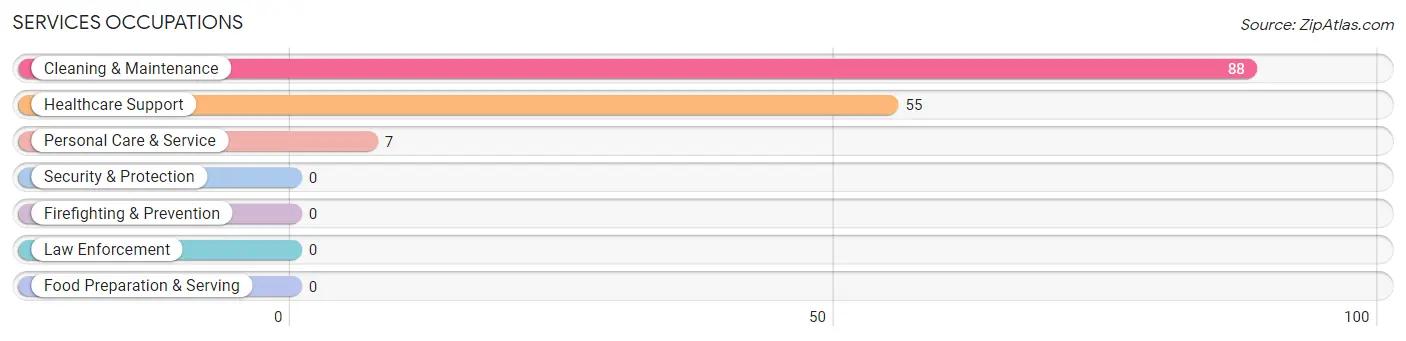
Services Occupations
The most common Services occupations in Lake Royale are Cleaning & Maintenance (88 | 5.7%), Healthcare Support (55 | 3.5%), and Personal Care & Service (7 | 0.4%).
Services Occupations by Sex
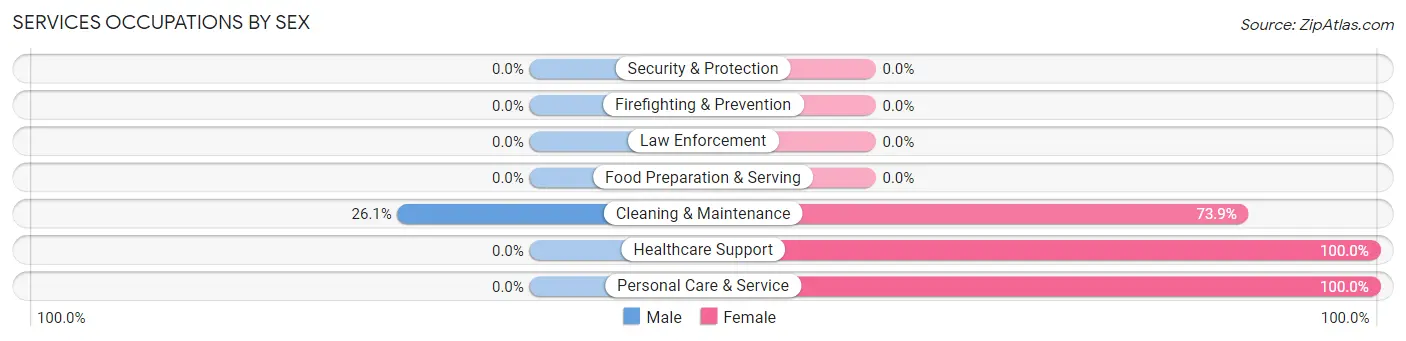
| Occupation | Male | Female |
| Healthcare Support | 0 (0.0%) | 55 (100.0%) |
| Security & Protection | 0 (0.0%) | 0 (0.0%) |
| Firefighting & Prevention | 0 (0.0%) | 0 (0.0%) |
| Law Enforcement | 0 (0.0%) | 0 (0.0%) |
| Food Preparation & Serving | 0 (0.0%) | 0 (0.0%) |
| Cleaning & Maintenance | 23 (26.1%) | 65 (73.9%) |
| Personal Care & Service | 0 (0.0%) | 7 (100.0%) |
| Total (Category) | 23 (15.3%) | 127 (84.7%) |
| Total (Overall) | 771 (49.6%) | 784 (50.4%) |
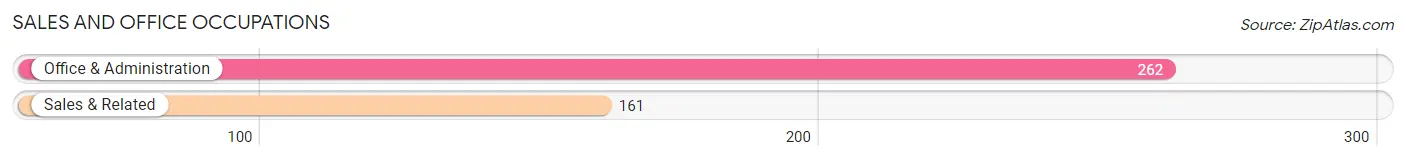
Sales and Office Occupations
The most common Sales and Office occupations in Lake Royale are Office & Administration (262 | 16.9%), and Sales & Related (161 | 10.3%).
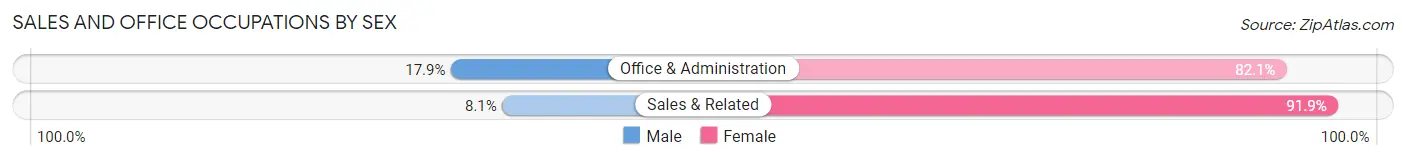
Sales and Office Occupations by Sex
| Occupation | Male | Female |
| Sales & Related | 13 (8.1%) | 148 (91.9%) |
| Office & Administration | 47 (17.9%) | 215 (82.1%) |
| Total (Category) | 60 (14.2%) | 363 (85.8%) |
| Total (Overall) | 771 (49.6%) | 784 (50.4%) |
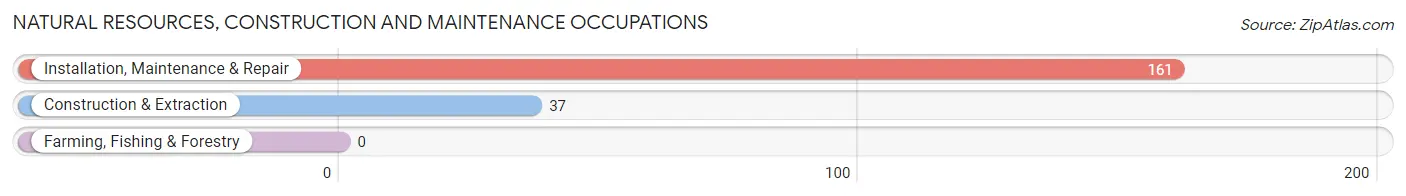
Natural Resources, Construction and Maintenance Occupations
The most common Natural Resources, Construction and Maintenance occupations in Lake Royale are Installation, Maintenance & Repair (161 | 10.3%), and Construction & Extraction (37 | 2.4%).
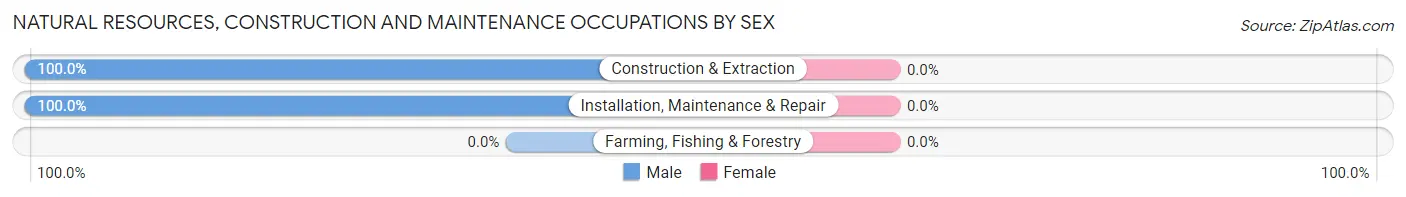
Natural Resources, Construction and Maintenance Occupations by Sex
| Occupation | Male | Female |
| Farming, Fishing & Forestry | 0 (0.0%) | 0 (0.0%) |
| Construction & Extraction | 37 (100.0%) | 0 (0.0%) |
| Installation, Maintenance & Repair | 161 (100.0%) | 0 (0.0%) |
| Total (Category) | 198 (100.0%) | 0 (0.0%) |
| Total (Overall) | 771 (49.6%) | 784 (50.4%) |
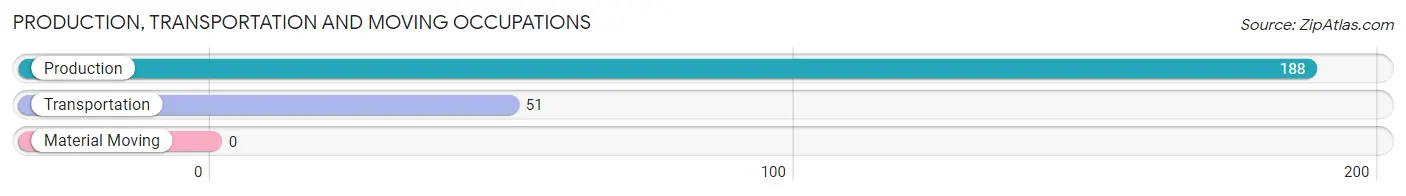
Production, Transportation and Moving Occupations
The most common Production, Transportation and Moving occupations in Lake Royale are Production (188 | 12.1%), and Transportation (51 | 3.3%).
Production, Transportation and Moving Occupations by Sex
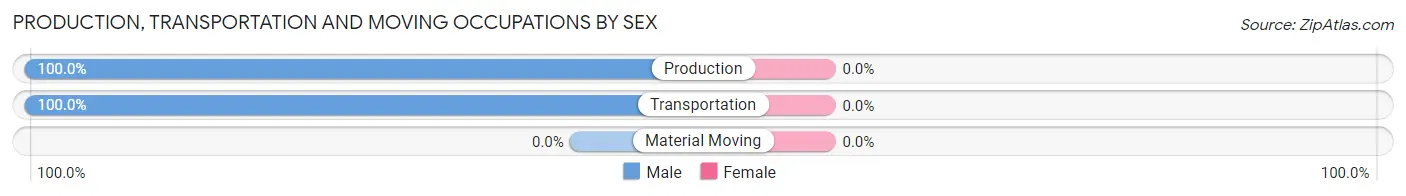
| Occupation | Male | Female |
| Production | 188 (100.0%) | 0 (0.0%) |
| Transportation | 51 (100.0%) | 0 (0.0%) |
| Material Moving | 0 (0.0%) | 0 (0.0%) |
| Total (Category) | 239 (100.0%) | 0 (0.0%) |
| Total (Overall) | 771 (49.6%) | 784 (50.4%) |
Employment Industries by Sex in Lake Royale
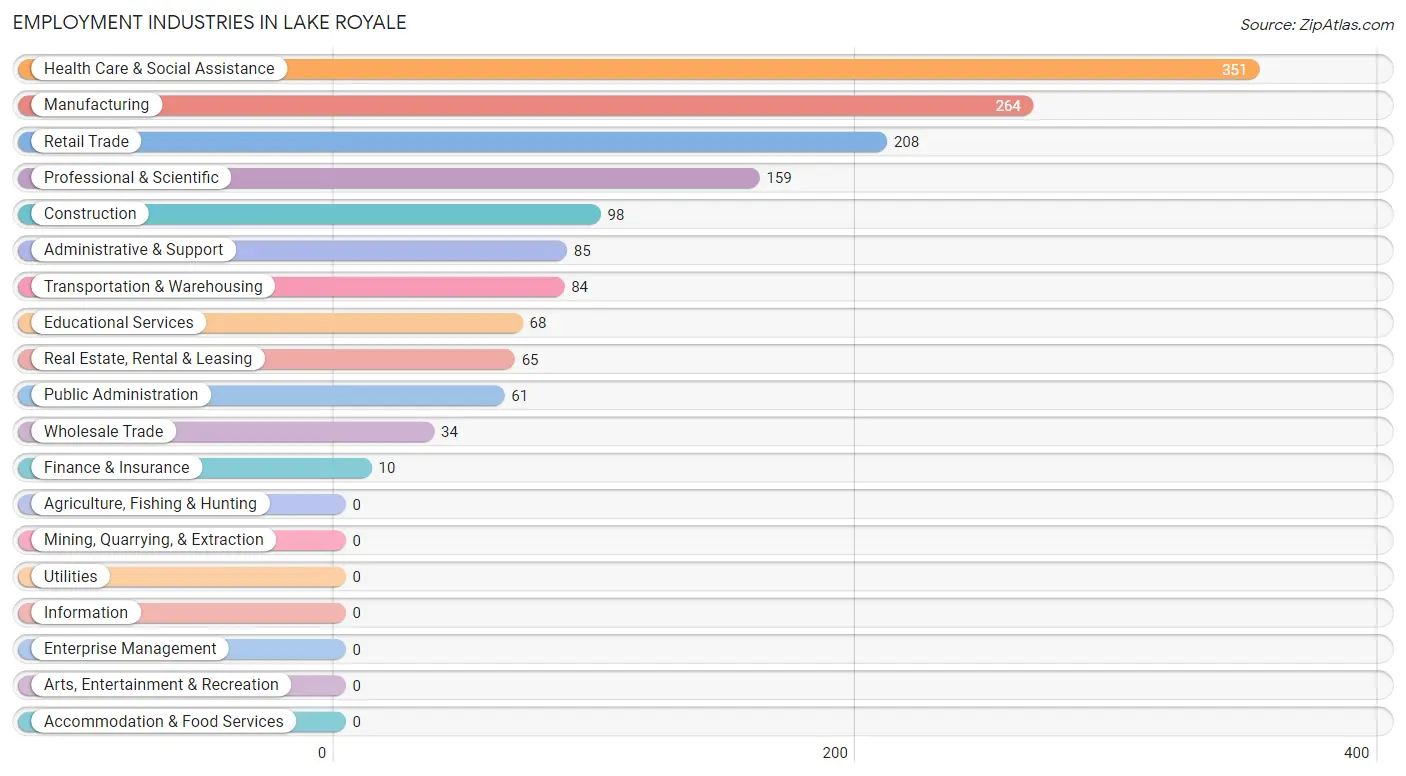
Employment Industries in Lake Royale
The major employment industries in Lake Royale include Health Care & Social Assistance (351 | 22.6%), Manufacturing (264 | 17.0%), Retail Trade (208 | 13.4%), Professional & Scientific (159 | 10.2%), and Construction (98 | 6.3%).
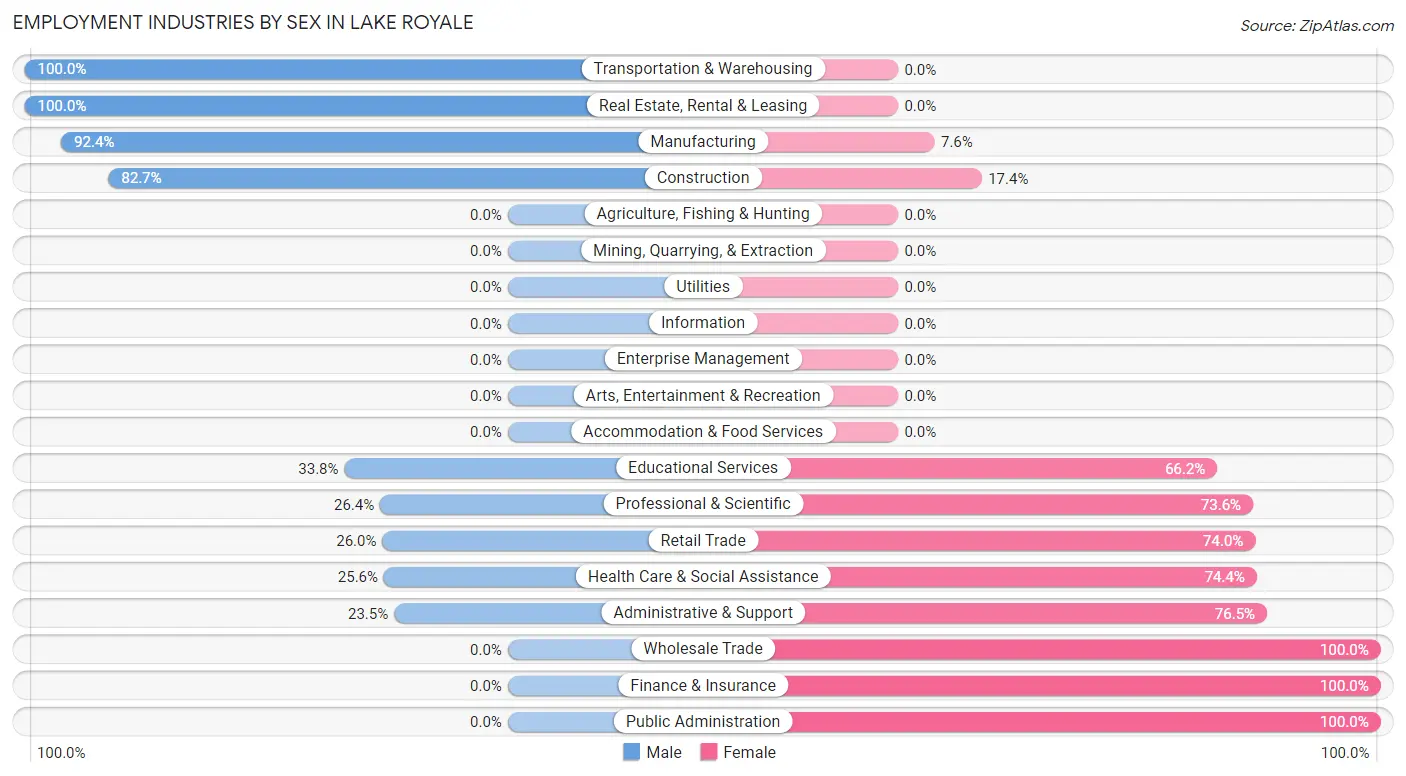
Employment Industries by Sex in Lake Royale
The Lake Royale industries that see more men than women are Transportation & Warehousing (100.0%), Real Estate, Rental & Leasing (100.0%), and Manufacturing (92.4%), whereas the industries that tend to have a higher number of women are Wholesale Trade (100.0%), Finance & Insurance (100.0%), and Public Administration (100.0%).
| Industry | Male | Female |
| Agriculture, Fishing & Hunting | 0 (0.0%) | 0 (0.0%) |
| Mining, Quarrying, & Extraction | 0 (0.0%) | 0 (0.0%) |
| Construction | 81 (82.7%) | 17 (17.3%) |
| Manufacturing | 244 (92.4%) | 20 (7.6%) |
| Wholesale Trade | 0 (0.0%) | 34 (100.0%) |
| Retail Trade | 54 (26.0%) | 154 (74.0%) |
| Transportation & Warehousing | 84 (100.0%) | 0 (0.0%) |
| Utilities | 0 (0.0%) | 0 (0.0%) |
| Information | 0 (0.0%) | 0 (0.0%) |
| Finance & Insurance | 0 (0.0%) | 10 (100.0%) |
| Real Estate, Rental & Leasing | 65 (100.0%) | 0 (0.0%) |
| Professional & Scientific | 42 (26.4%) | 117 (73.6%) |
| Enterprise Management | 0 (0.0%) | 0 (0.0%) |
| Administrative & Support | 20 (23.5%) | 65 (76.5%) |
| Educational Services | 23 (33.8%) | 45 (66.2%) |
| Health Care & Social Assistance | 90 (25.6%) | 261 (74.4%) |
| Arts, Entertainment & Recreation | 0 (0.0%) | 0 (0.0%) |
| Accommodation & Food Services | 0 (0.0%) | 0 (0.0%) |
| Public Administration | 0 (0.0%) | 61 (100.0%) |
| Total | 771 (49.6%) | 784 (50.4%) |
Education in Lake Royale
School Enrollment in Lake Royale
The most common levels of schooling among the 566 students in Lake Royale are middle school (205 | 36.2%), elementary school (178 | 31.5%), and high school (81 | 14.3%).
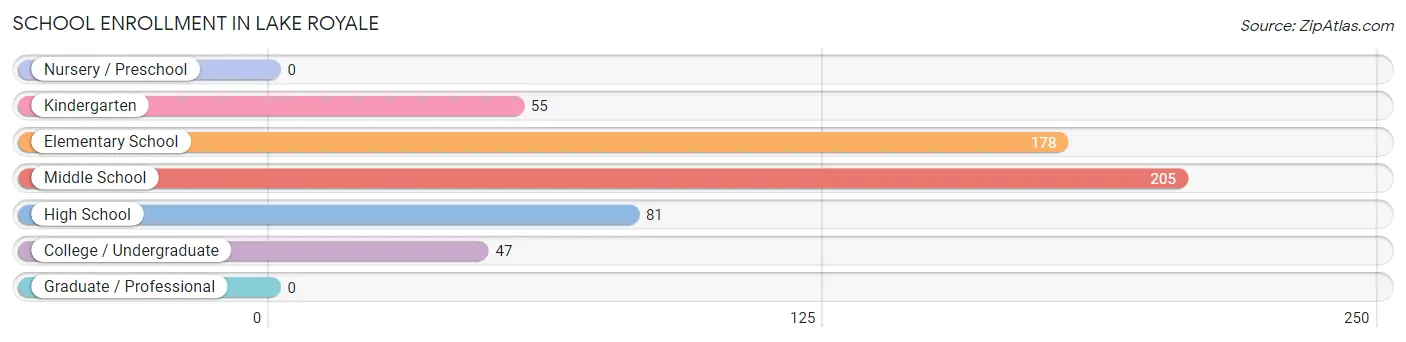
| School Level | # Students | % Students |
| Nursery / Preschool | 0 | 0.0% |
| Kindergarten | 55 | 9.7% |
| Elementary School | 178 | 31.5% |
| Middle School | 205 | 36.2% |
| High School | 81 | 14.3% |
| College / Undergraduate | 47 | 8.3% |
| Graduate / Professional | 0 | 0.0% |
| Total | 566 | 100.0% |
School Enrollment by Age by Funding Source in Lake Royale
Out of a total of 566 students who are enrolled in schools in Lake Royale, 245 (43.3%) attend a private institution, while the remaining 321 (56.7%) are enrolled in public schools. The age group of 10 to 14 year olds has the highest likelihood of being enrolled in private schools, with 186 (79.8% in the age bracket) enrolled. Conversely, the age group of 15 to 17 year olds has the lowest likelihood of being enrolled in a private school, with 81 (100.0% in the age bracket) attending a public institution.
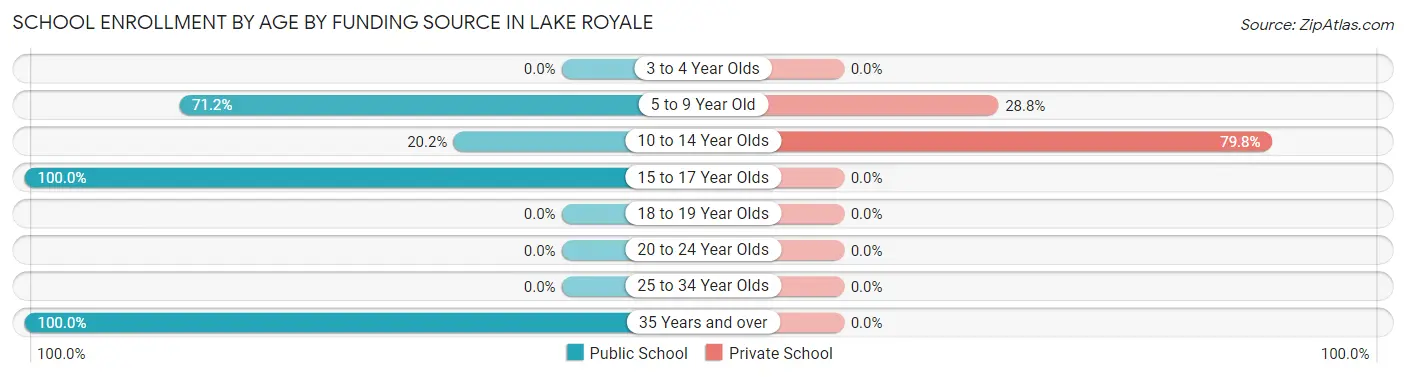
| Age Bracket | Public School | Private School |
| 3 to 4 Year Olds | 0 (0.0%) | 0 (0.0%) |
| 5 to 9 Year Old | 146 (71.2%) | 59 (28.8%) |
| 10 to 14 Year Olds | 47 (20.2%) | 186 (79.8%) |
| 15 to 17 Year Olds | 81 (100.0%) | 0 (0.0%) |
| 18 to 19 Year Olds | 0 (0.0%) | 0 (0.0%) |
| 20 to 24 Year Olds | 0 (0.0%) | 0 (0.0%) |
| 25 to 34 Year Olds | 0 (0.0%) | 0 (0.0%) |
| 35 Years and over | 47 (100.0%) | 0 (0.0%) |
| Total | 321 (56.7%) | 245 (43.3%) |
Educational Attainment by Field of Study in Lake Royale
Business (116 | 18.4%), social sciences (113 | 18.0%), education (90 | 14.3%), bio, nature & agricultural (75 | 11.9%), and psychology (51 | 8.1%) are the most common fields of study among 629 individuals in Lake Royale who have obtained a bachelor's degree or higher.
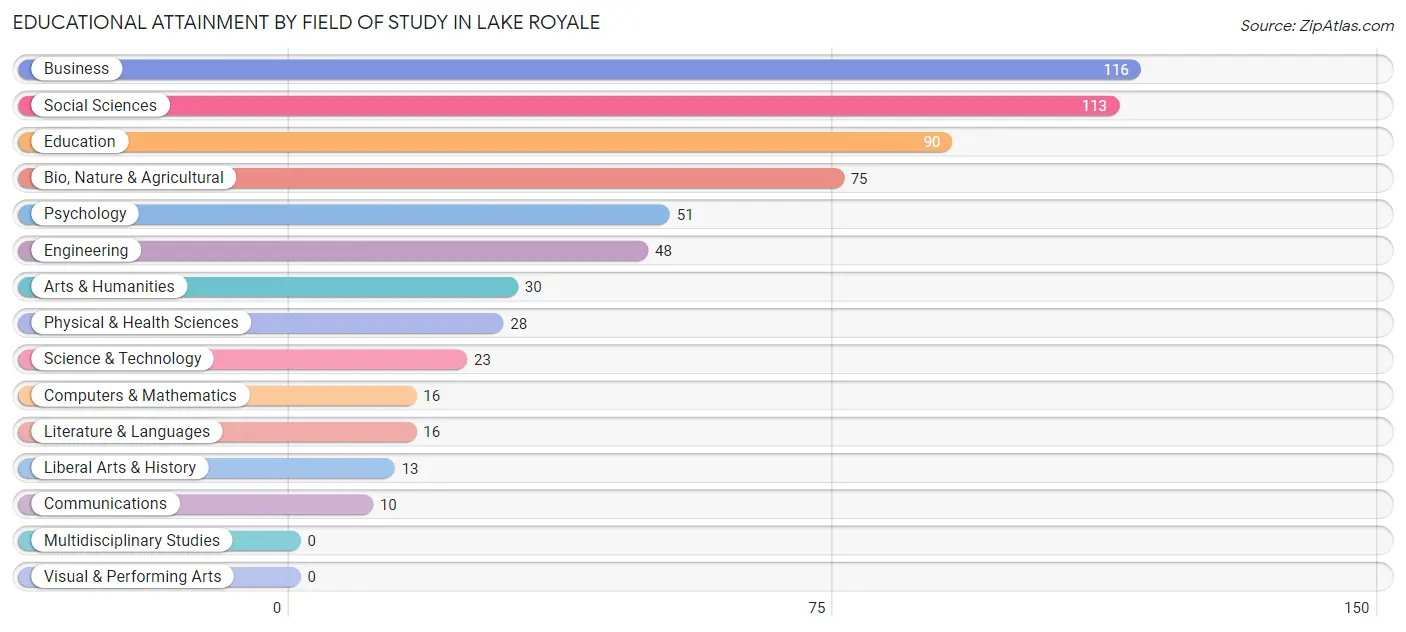
| Field of Study | # Graduates | % Graduates |
| Computers & Mathematics | 16 | 2.5% |
| Bio, Nature & Agricultural | 75 | 11.9% |
| Physical & Health Sciences | 28 | 4.4% |
| Psychology | 51 | 8.1% |
| Social Sciences | 113 | 18.0% |
| Engineering | 48 | 7.6% |
| Multidisciplinary Studies | 0 | 0.0% |
| Science & Technology | 23 | 3.7% |
| Business | 116 | 18.4% |
| Education | 90 | 14.3% |
| Literature & Languages | 16 | 2.5% |
| Liberal Arts & History | 13 | 2.1% |
| Visual & Performing Arts | 0 | 0.0% |
| Communications | 10 | 1.6% |
| Arts & Humanities | 30 | 4.8% |
| Total | 629 | 100.0% |
Transportation & Commute in Lake Royale
Vehicle Availability by Sex in Lake Royale
The most prevalent vehicle ownership categories in Lake Royale are males with 2 vehicles (335, accounting for 43.4%) and females with 2 vehicles (185, making up 45.5%).
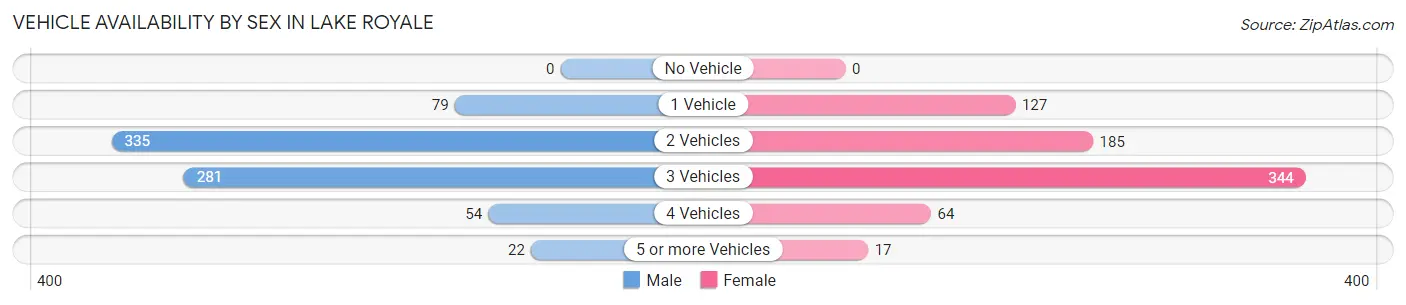
| Vehicles Available | Male | Female |
| No Vehicle | 0 (0.0%) | 0 (0.0%) |
| 1 Vehicle | 79 (10.2%) | 127 (17.2%) |
| 2 Vehicles | 335 (43.4%) | 185 (25.1%) |
| 3 Vehicles | 281 (36.4%) | 344 (46.7%) |
| 4 Vehicles | 54 (7.0%) | 64 (8.7%) |
| 5 or more Vehicles | 22 (2.9%) | 17 (2.3%) |
| Total | 771 (100.0%) | 737 (100.0%) |
Commute Time in Lake Royale
The most frequently occuring commute durations in Lake Royale are 20 to 24 minutes (348 commuters, 23.5%), 60 to 89 minutes (304 commuters, 20.5%), and 30 to 34 minutes (290 commuters, 19.6%).
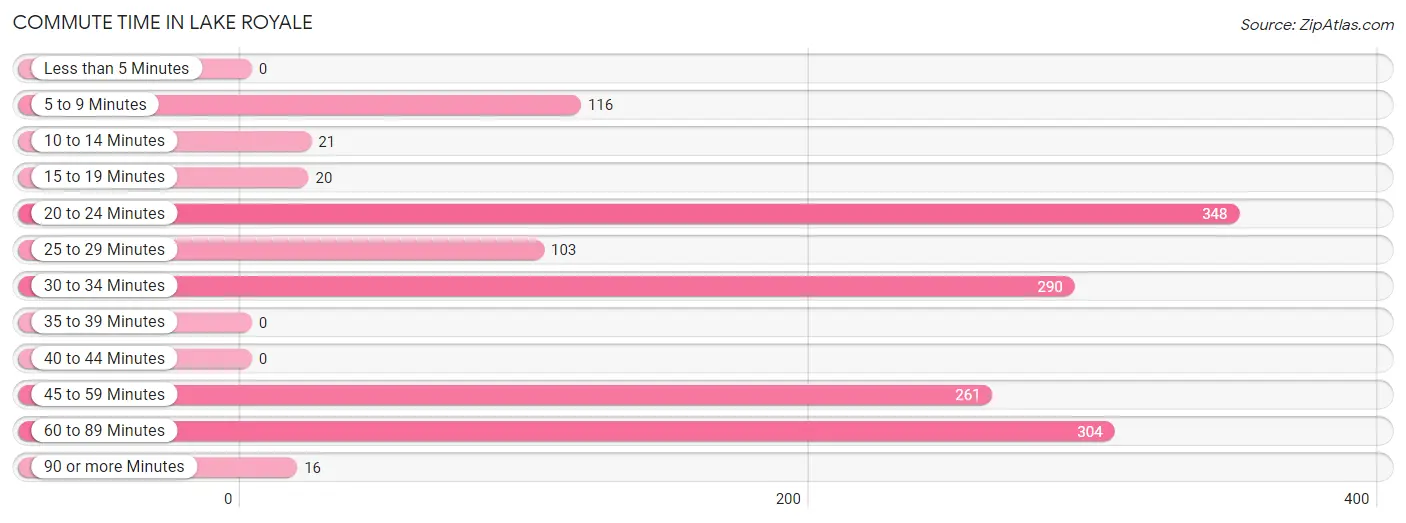
| Commute Time | # Commuters | % Commuters |
| Less than 5 Minutes | 0 | 0.0% |
| 5 to 9 Minutes | 116 | 7.8% |
| 10 to 14 Minutes | 21 | 1.4% |
| 15 to 19 Minutes | 20 | 1.3% |
| 20 to 24 Minutes | 348 | 23.5% |
| 25 to 29 Minutes | 103 | 7.0% |
| 30 to 34 Minutes | 290 | 19.6% |
| 35 to 39 Minutes | 0 | 0.0% |
| 40 to 44 Minutes | 0 | 0.0% |
| 45 to 59 Minutes | 261 | 17.6% |
| 60 to 89 Minutes | 304 | 20.5% |
| 90 or more Minutes | 16 | 1.1% |
Commute Time by Sex in Lake Royale
The most common commute times in Lake Royale are 20 to 24 minutes (190 commuters, 25.3%) for males and 20 to 24 minutes (158 commuters, 21.7%) for females.
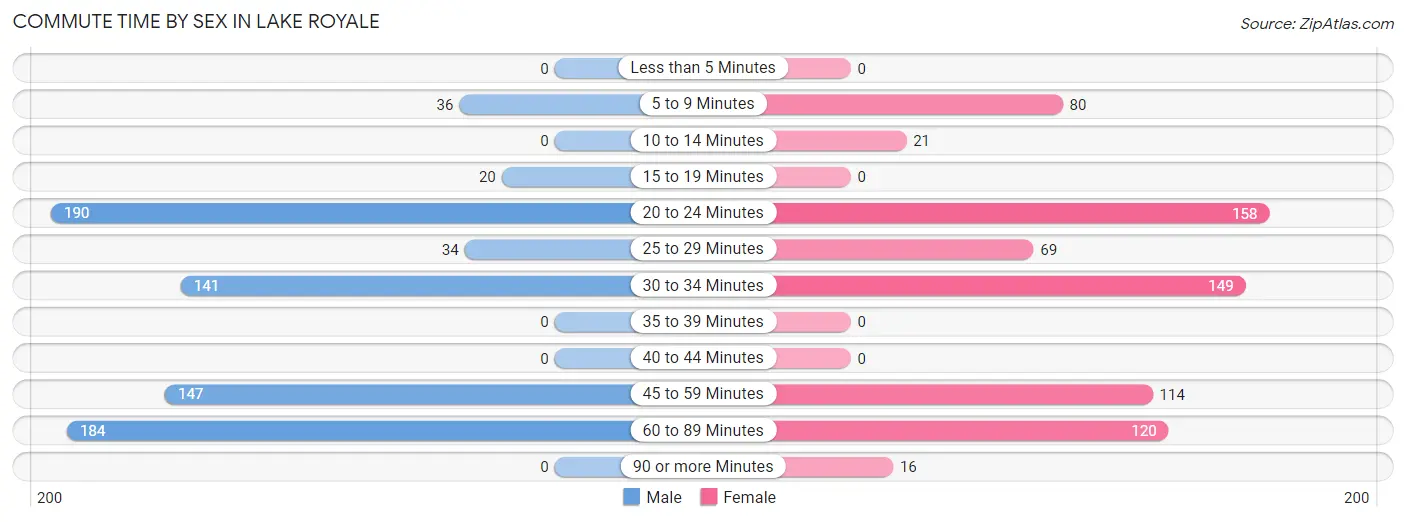
| Commute Time | Male | Female |
| Less than 5 Minutes | 0 (0.0%) | 0 (0.0%) |
| 5 to 9 Minutes | 36 (4.8%) | 80 (11.0%) |
| 10 to 14 Minutes | 0 (0.0%) | 21 (2.9%) |
| 15 to 19 Minutes | 20 (2.7%) | 0 (0.0%) |
| 20 to 24 Minutes | 190 (25.3%) | 158 (21.7%) |
| 25 to 29 Minutes | 34 (4.5%) | 69 (9.5%) |
| 30 to 34 Minutes | 141 (18.8%) | 149 (20.5%) |
| 35 to 39 Minutes | 0 (0.0%) | 0 (0.0%) |
| 40 to 44 Minutes | 0 (0.0%) | 0 (0.0%) |
| 45 to 59 Minutes | 147 (19.6%) | 114 (15.7%) |
| 60 to 89 Minutes | 184 (24.5%) | 120 (16.5%) |
| 90 or more Minutes | 0 (0.0%) | 16 (2.2%) |
Time of Departure to Work by Sex in Lake Royale
The most frequent times of departure to work in Lake Royale are 6:00 AM to 6:29 AM (149, 19.8%) for males and 7:00 AM to 7:29 AM (274, 37.7%) for females.
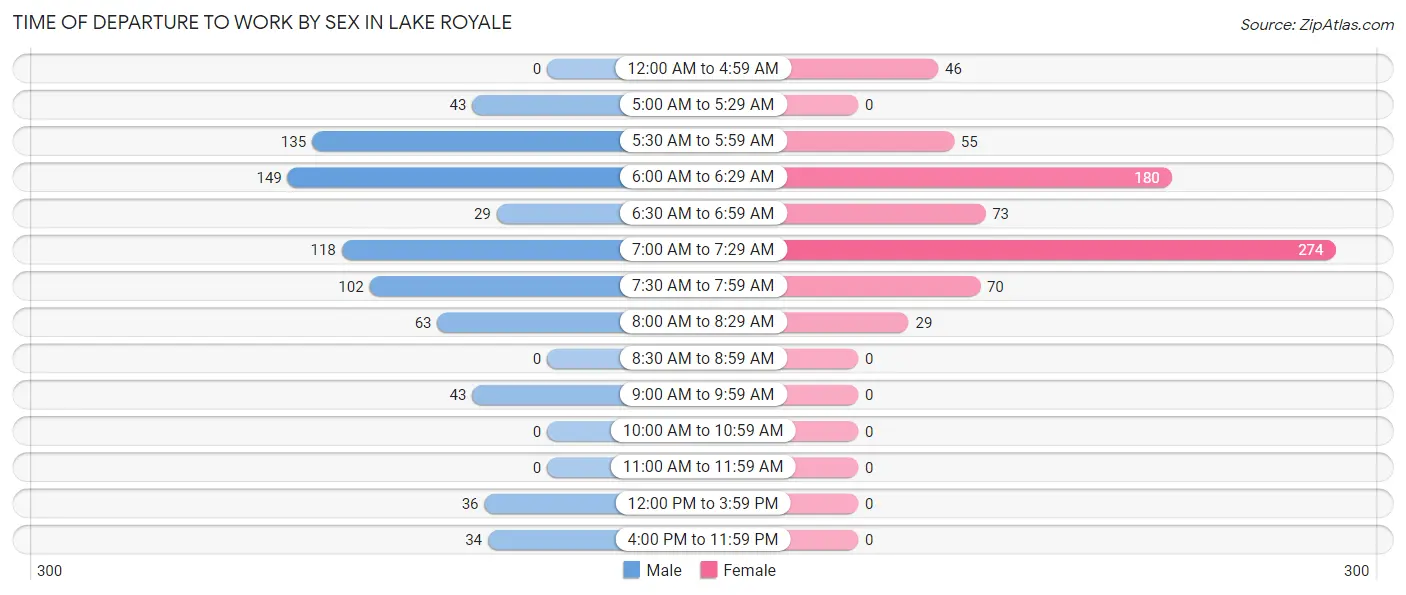
| Time of Departure | Male | Female |
| 12:00 AM to 4:59 AM | 0 (0.0%) | 46 (6.3%) |
| 5:00 AM to 5:29 AM | 43 (5.7%) | 0 (0.0%) |
| 5:30 AM to 5:59 AM | 135 (17.9%) | 55 (7.6%) |
| 6:00 AM to 6:29 AM | 149 (19.8%) | 180 (24.8%) |
| 6:30 AM to 6:59 AM | 29 (3.9%) | 73 (10.0%) |
| 7:00 AM to 7:29 AM | 118 (15.7%) | 274 (37.7%) |
| 7:30 AM to 7:59 AM | 102 (13.6%) | 70 (9.6%) |
| 8:00 AM to 8:29 AM | 63 (8.4%) | 29 (4.0%) |
| 8:30 AM to 8:59 AM | 0 (0.0%) | 0 (0.0%) |
| 9:00 AM to 9:59 AM | 43 (5.7%) | 0 (0.0%) |
| 10:00 AM to 10:59 AM | 0 (0.0%) | 0 (0.0%) |
| 11:00 AM to 11:59 AM | 0 (0.0%) | 0 (0.0%) |
| 12:00 PM to 3:59 PM | 36 (4.8%) | 0 (0.0%) |
| 4:00 PM to 11:59 PM | 34 (4.5%) | 0 (0.0%) |
| Total | 752 (100.0%) | 727 (100.0%) |
Housing Occupancy in Lake Royale
Occupancy by Ownership in Lake Royale
Of the total 1,389 dwellings in Lake Royale, owner-occupied units account for 1,151 (82.9%), while renter-occupied units make up 238 (17.1%).
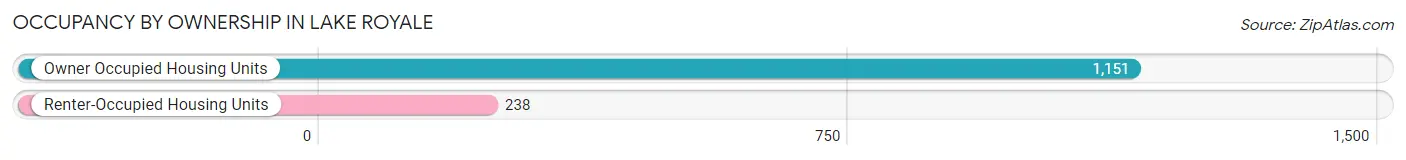
| Occupancy | # Housing Units | % Housing Units |
| Owner Occupied Housing Units | 1,151 | 82.9% |
| Renter-Occupied Housing Units | 238 | 17.1% |
| Total Occupied Housing Units | 1,389 | 100.0% |
Occupancy by Household Size in Lake Royale
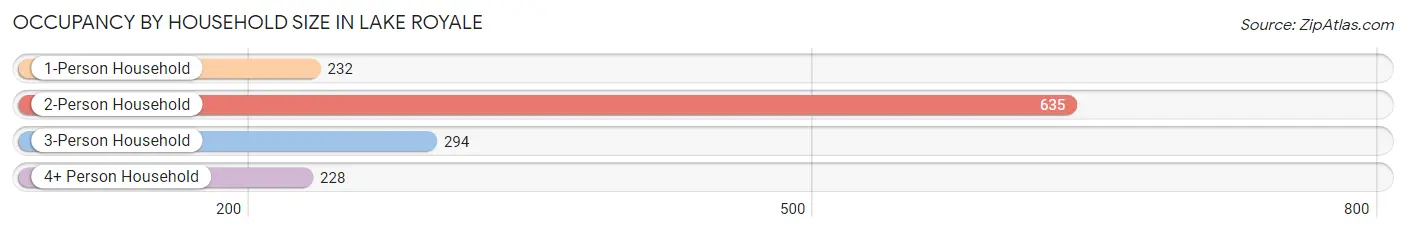
| Household Size | # Housing Units | % Housing Units |
| 1-Person Household | 232 | 16.7% |
| 2-Person Household | 635 | 45.7% |
| 3-Person Household | 294 | 21.2% |
| 4+ Person Household | 228 | 16.4% |
| Total Housing Units | 1,389 | 100.0% |
Occupancy by Ownership by Household Size in Lake Royale
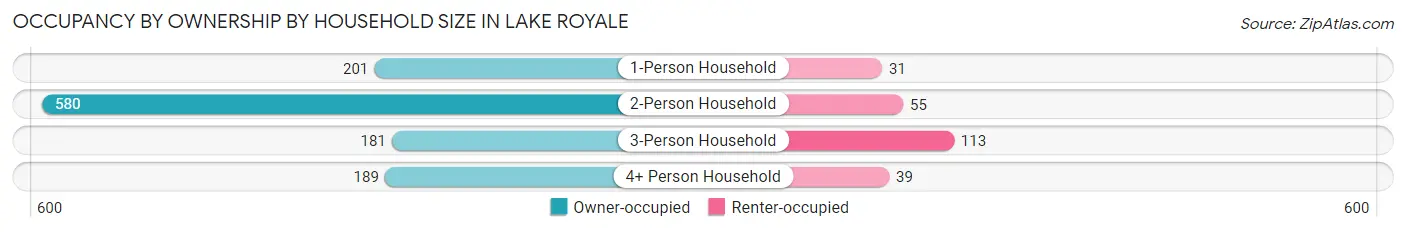
| Household Size | Owner-occupied | Renter-occupied |
| 1-Person Household | 201 (86.6%) | 31 (13.4%) |
| 2-Person Household | 580 (91.3%) | 55 (8.7%) |
| 3-Person Household | 181 (61.6%) | 113 (38.4%) |
| 4+ Person Household | 189 (82.9%) | 39 (17.1%) |
| Total Housing Units | 1,151 (82.9%) | 238 (17.1%) |
Occupancy by Educational Attainment in Lake Royale
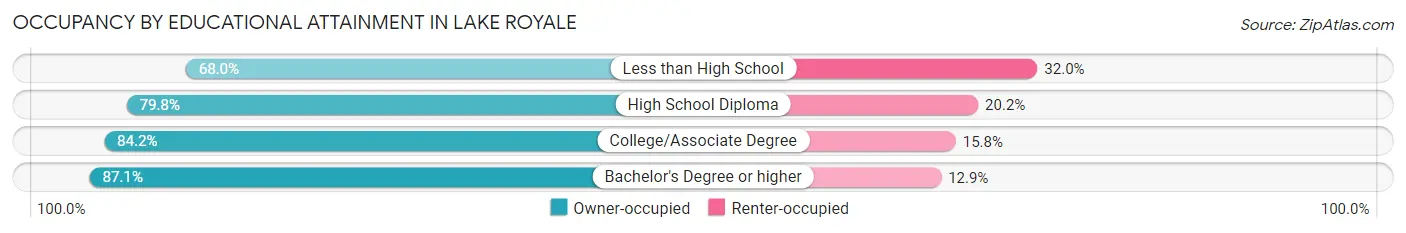
| Household Size | Owner-occupied | Renter-occupied |
| Less than High School | 83 (68.0%) | 39 (32.0%) |
| High School Diploma | 217 (79.8%) | 55 (20.2%) |
| College/Associate Degree | 459 (84.2%) | 86 (15.8%) |
| Bachelor's Degree or higher | 392 (87.1%) | 58 (12.9%) |
Occupancy by Age of Householder in Lake Royale
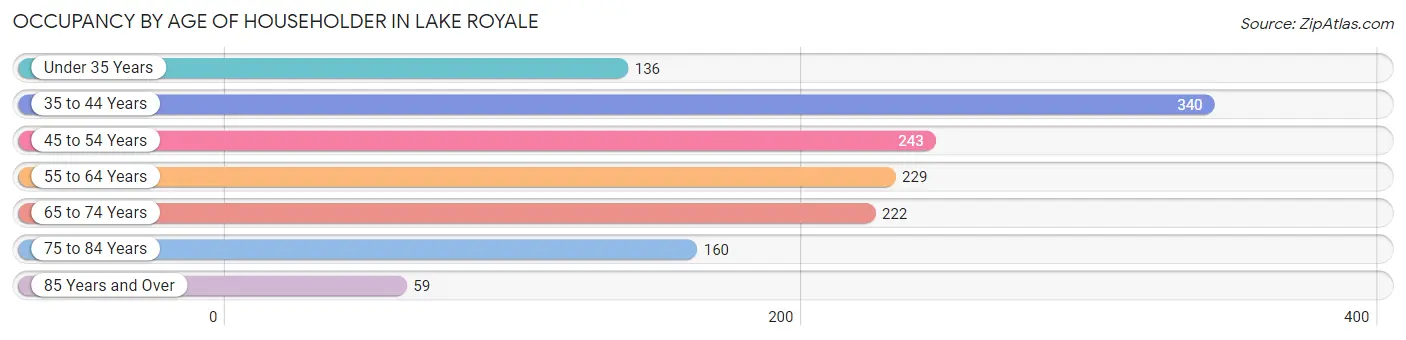
| Age Bracket | # Households | % Households |
| Under 35 Years | 136 | 9.8% |
| 35 to 44 Years | 340 | 24.5% |
| 45 to 54 Years | 243 | 17.5% |
| 55 to 64 Years | 229 | 16.5% |
| 65 to 74 Years | 222 | 16.0% |
| 75 to 84 Years | 160 | 11.5% |
| 85 Years and Over | 59 | 4.3% |
| Total | 1,389 | 100.0% |
Housing Finances in Lake Royale
Median Income by Occupancy in Lake Royale
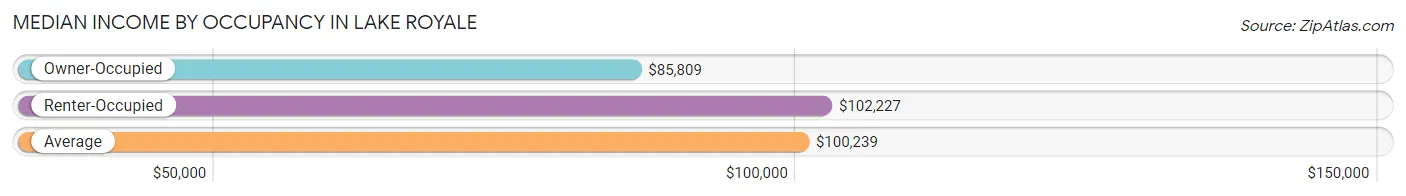
| Occupancy Type | # Households | Median Income |
| Owner-Occupied | 1,151 (82.9%) | $85,809 |
| Renter-Occupied | 238 (17.1%) | $102,227 |
| Average | 1,389 (100.0%) | $100,239 |
Occupancy by Householder Income Bracket in Lake Royale
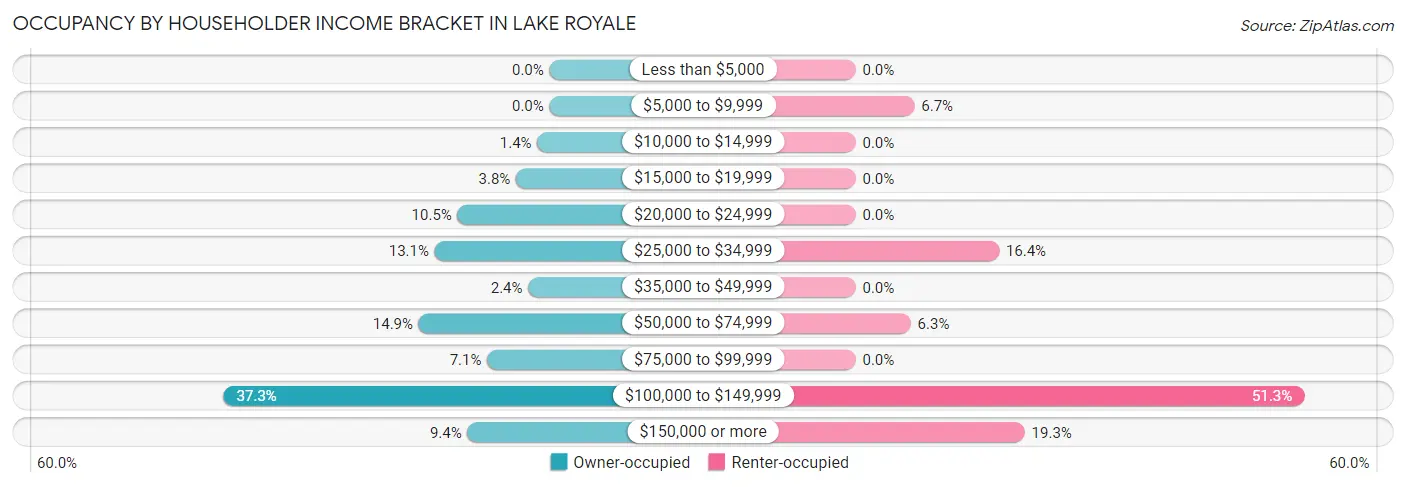
| Income Bracket | Owner-occupied | Renter-occupied |
| Less than $5,000 | 0 (0.0%) | 0 (0.0%) |
| $5,000 to $9,999 | 0 (0.0%) | 16 (6.7%) |
| $10,000 to $14,999 | 16 (1.4%) | 0 (0.0%) |
| $15,000 to $19,999 | 44 (3.8%) | 0 (0.0%) |
| $20,000 to $24,999 | 121 (10.5%) | 0 (0.0%) |
| $25,000 to $34,999 | 151 (13.1%) | 39 (16.4%) |
| $35,000 to $49,999 | 28 (2.4%) | 0 (0.0%) |
| $50,000 to $74,999 | 172 (14.9%) | 15 (6.3%) |
| $75,000 to $99,999 | 82 (7.1%) | 0 (0.0%) |
| $100,000 to $149,999 | 429 (37.3%) | 122 (51.3%) |
| $150,000 or more | 108 (9.4%) | 46 (19.3%) |
| Total | 1,151 (100.0%) | 238 (100.0%) |
Monthly Housing Cost Tiers in Lake Royale
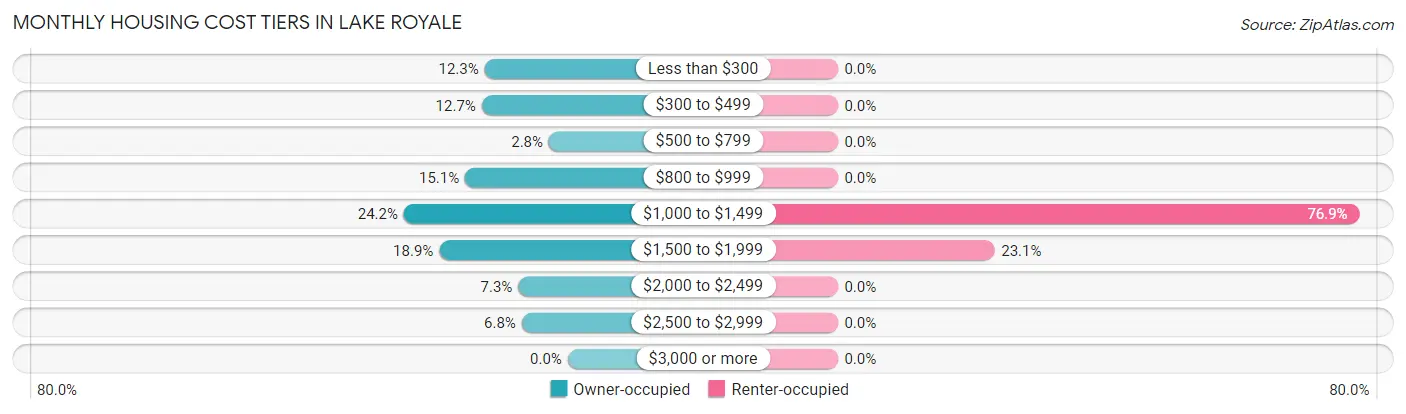
| Monthly Cost | Owner-occupied | Renter-occupied |
| Less than $300 | 141 (12.2%) | 0 (0.0%) |
| $300 to $499 | 146 (12.7%) | 0 (0.0%) |
| $500 to $799 | 32 (2.8%) | 0 (0.0%) |
| $800 to $999 | 174 (15.1%) | 0 (0.0%) |
| $1,000 to $1,499 | 278 (24.1%) | 183 (76.9%) |
| $1,500 to $1,999 | 218 (18.9%) | 55 (23.1%) |
| $2,000 to $2,499 | 84 (7.3%) | 0 (0.0%) |
| $2,500 to $2,999 | 78 (6.8%) | 0 (0.0%) |
| $3,000 or more | 0 (0.0%) | 0 (0.0%) |
| Total | 1,151 (100.0%) | 238 (100.0%) |
Physical Housing Characteristics in Lake Royale
Housing Structures in Lake Royale
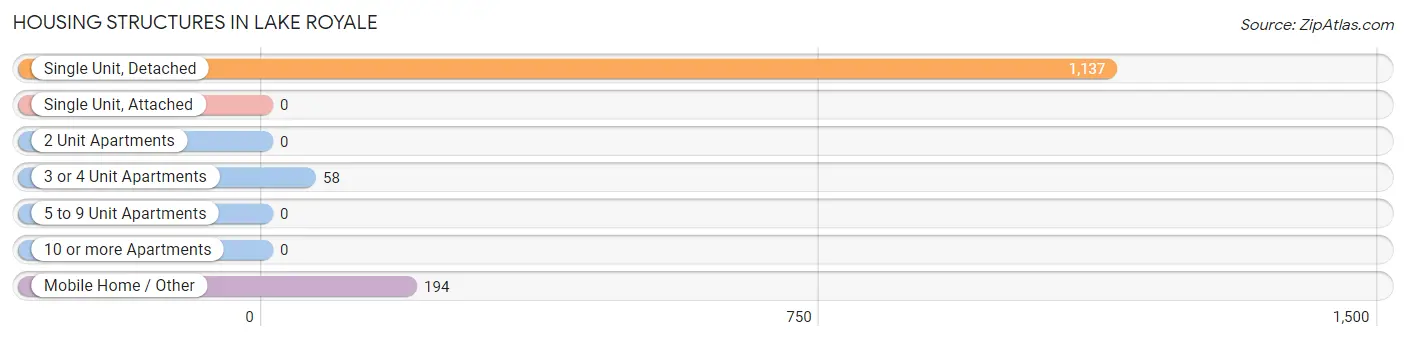
| Structure Type | # Housing Units | % Housing Units |
| Single Unit, Detached | 1,137 | 81.9% |
| Single Unit, Attached | 0 | 0.0% |
| 2 Unit Apartments | 0 | 0.0% |
| 3 or 4 Unit Apartments | 58 | 4.2% |
| 5 to 9 Unit Apartments | 0 | 0.0% |
| 10 or more Apartments | 0 | 0.0% |
| Mobile Home / Other | 194 | 14.0% |
| Total | 1,389 | 100.0% |
Housing Structures by Occupancy in Lake Royale
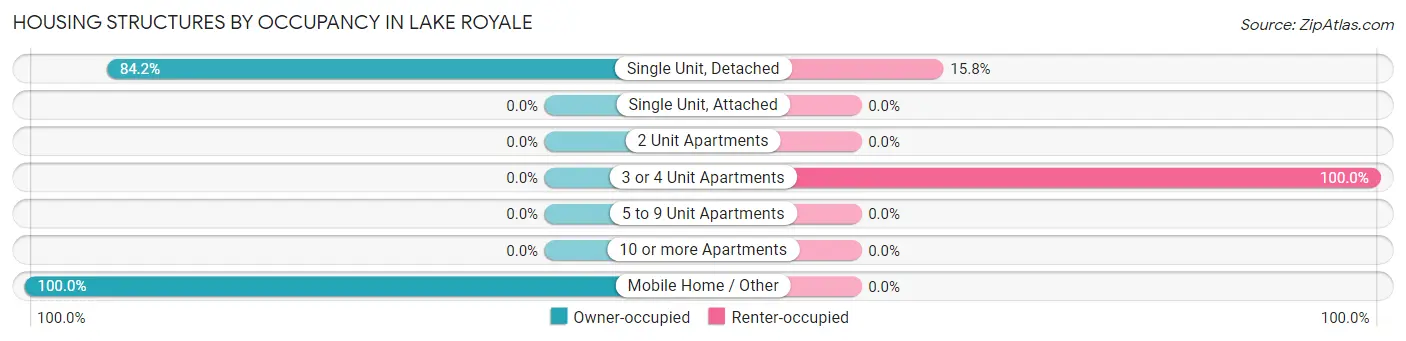
| Structure Type | Owner-occupied | Renter-occupied |
| Single Unit, Detached | 957 (84.2%) | 180 (15.8%) |
| Single Unit, Attached | 0 (0.0%) | 0 (0.0%) |
| 2 Unit Apartments | 0 (0.0%) | 0 (0.0%) |
| 3 or 4 Unit Apartments | 0 (0.0%) | 58 (100.0%) |
| 5 to 9 Unit Apartments | 0 (0.0%) | 0 (0.0%) |
| 10 or more Apartments | 0 (0.0%) | 0 (0.0%) |
| Mobile Home / Other | 194 (100.0%) | 0 (0.0%) |
| Total | 1,151 (82.9%) | 238 (17.1%) |
Housing Structures by Number of Rooms in Lake Royale
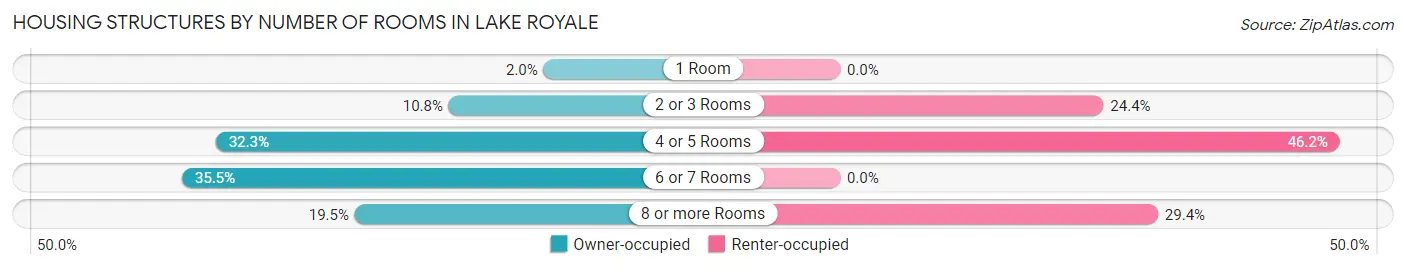
| Number of Rooms | Owner-occupied | Renter-occupied |
| 1 Room | 23 (2.0%) | 0 (0.0%) |
| 2 or 3 Rooms | 124 (10.8%) | 58 (24.4%) |
| 4 or 5 Rooms | 372 (32.3%) | 110 (46.2%) |
| 6 or 7 Rooms | 408 (35.4%) | 0 (0.0%) |
| 8 or more Rooms | 224 (19.5%) | 70 (29.4%) |
| Total | 1,151 (100.0%) | 238 (100.0%) |
Housing Structure by Heating Type in Lake Royale
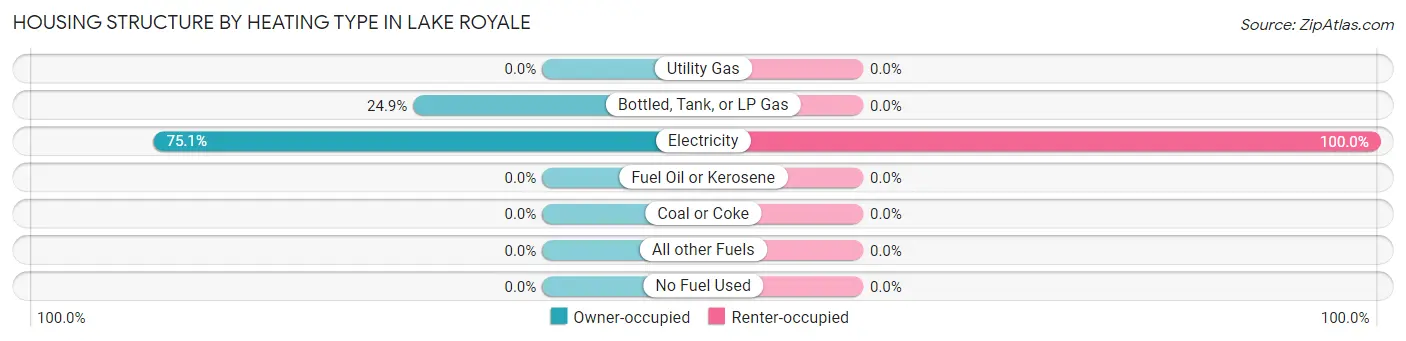
| Heating Type | Owner-occupied | Renter-occupied |
| Utility Gas | 0 (0.0%) | 0 (0.0%) |
| Bottled, Tank, or LP Gas | 287 (24.9%) | 0 (0.0%) |
| Electricity | 864 (75.1%) | 238 (100.0%) |
| Fuel Oil or Kerosene | 0 (0.0%) | 0 (0.0%) |
| Coal or Coke | 0 (0.0%) | 0 (0.0%) |
| All other Fuels | 0 (0.0%) | 0 (0.0%) |
| No Fuel Used | 0 (0.0%) | 0 (0.0%) |
| Total | 1,151 (100.0%) | 238 (100.0%) |
Household Vehicle Usage in Lake Royale
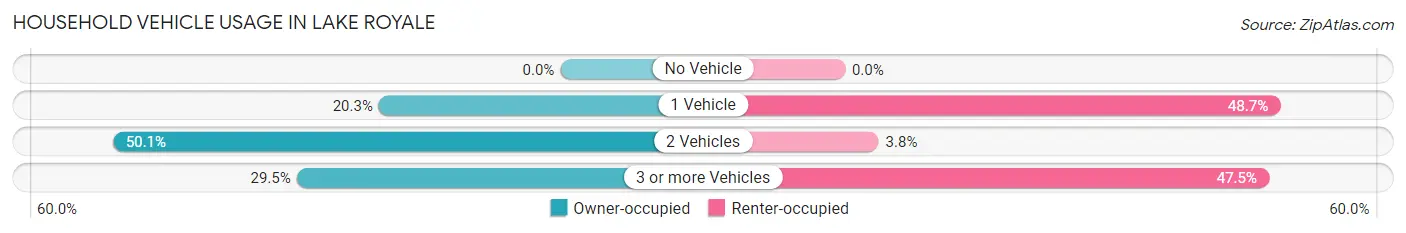
| Vehicles per Household | Owner-occupied | Renter-occupied |
| No Vehicle | 0 (0.0%) | 0 (0.0%) |
| 1 Vehicle | 234 (20.3%) | 116 (48.7%) |
| 2 Vehicles | 577 (50.1%) | 9 (3.8%) |
| 3 or more Vehicles | 340 (29.5%) | 113 (47.5%) |
| Total | 1,151 (100.0%) | 238 (100.0%) |
Real Estate & Mortgages in Lake Royale
Real Estate and Mortgage Overview in Lake Royale
| Characteristic | Without Mortgage | With Mortgage |
| Housing Units | 355 | 796 |
| Median Property Value | - | - |
| Median Household Income | - | - |
| Monthly Housing Costs | $345 | $0 |
| Real Estate Taxes | - | - |
Property Value by Mortgage Status in Lake Royale
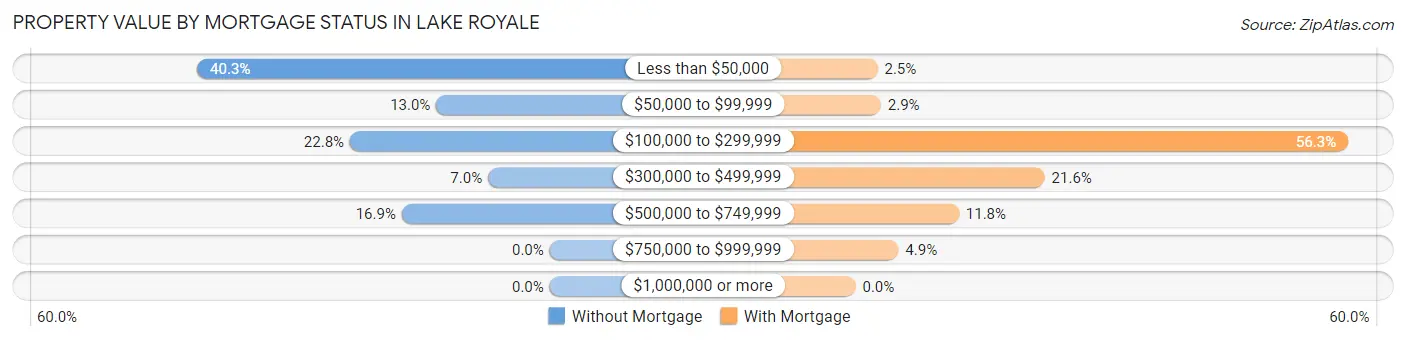
| Property Value | Without Mortgage | With Mortgage |
| Less than $50,000 | 143 (40.3%) | 20 (2.5%) |
| $50,000 to $99,999 | 46 (13.0%) | 23 (2.9%) |
| $100,000 to $299,999 | 81 (22.8%) | 448 (56.3%) |
| $300,000 to $499,999 | 25 (7.0%) | 172 (21.6%) |
| $500,000 to $749,999 | 60 (16.9%) | 94 (11.8%) |
| $750,000 to $999,999 | 0 (0.0%) | 39 (4.9%) |
| $1,000,000 or more | 0 (0.0%) | 0 (0.0%) |
| Total | 355 (100.0%) | 796 (100.0%) |
Household Income by Mortgage Status in Lake Royale
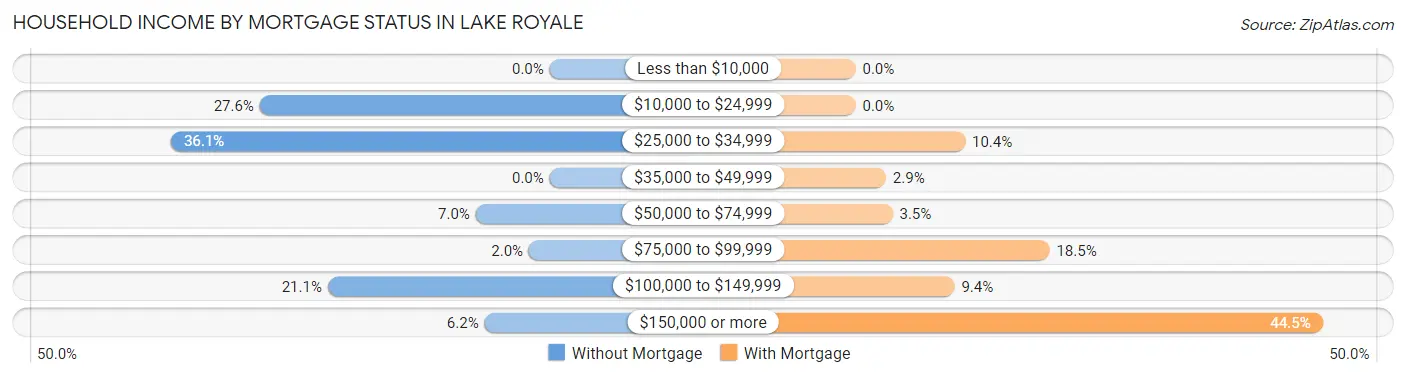
| Household Income | Without Mortgage | With Mortgage |
| Less than $10,000 | 0 (0.0%) | 0 (0.0%) |
| $10,000 to $24,999 | 98 (27.6%) | 0 (0.0%) |
| $25,000 to $34,999 | 128 (36.1%) | 83 (10.4%) |
| $35,000 to $49,999 | 0 (0.0%) | 23 (2.9%) |
| $50,000 to $74,999 | 25 (7.0%) | 28 (3.5%) |
| $75,000 to $99,999 | 7 (2.0%) | 147 (18.5%) |
| $100,000 to $149,999 | 75 (21.1%) | 75 (9.4%) |
| $150,000 or more | 22 (6.2%) | 354 (44.5%) |
| Total | 355 (100.0%) | 796 (100.0%) |
Property Value to Household Income Ratio in Lake Royale
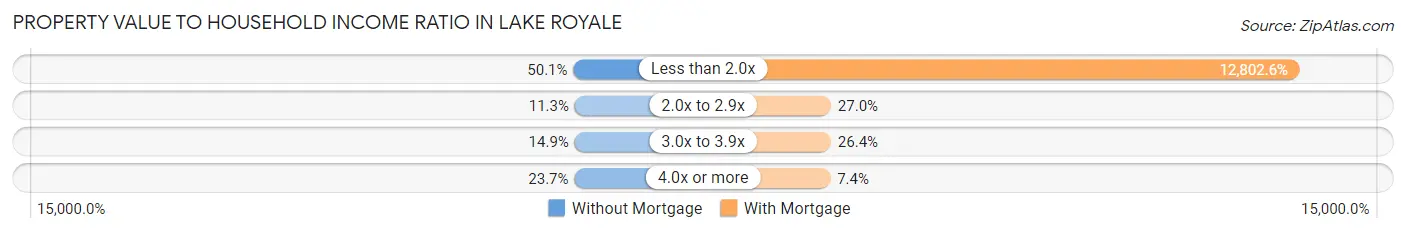
| Value-to-Income Ratio | Without Mortgage | With Mortgage |
| Less than 2.0x | 178 (50.1%) | 101,909 (12,802.6%) |
| 2.0x to 2.9x | 40 (11.3%) | 215 (27.0%) |
| 3.0x to 3.9x | 53 (14.9%) | 210 (26.4%) |
| 4.0x or more | 84 (23.7%) | 59 (7.4%) |
| Total | 355 (100.0%) | 796 (100.0%) |
Real Estate Taxes by Mortgage Status in Lake Royale
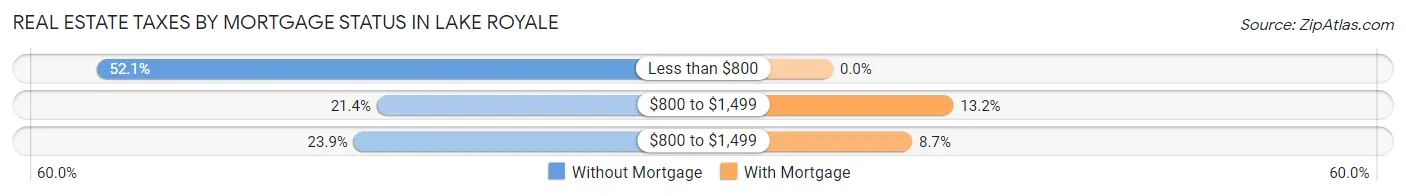
| Property Taxes | Without Mortgage | With Mortgage |
| Less than $800 | 185 (52.1%) | 0 (0.0%) |
| $800 to $1,499 | 76 (21.4%) | 105 (13.2%) |
| $800 to $1,499 | 85 (23.9%) | 69 (8.7%) |
| Total | 355 (100.0%) | 796 (100.0%) |
Health & Disability in Lake Royale
Health Insurance Coverage by Age in Lake Royale
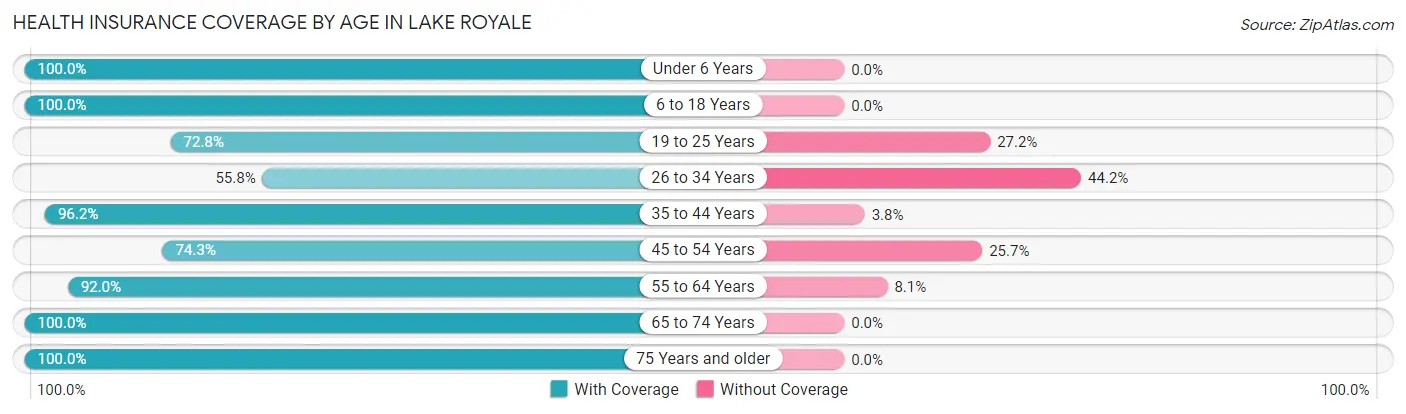
| Age Bracket | With Coverage | Without Coverage |
| Under 6 Years | 164 (100.0%) | 0 (0.0%) |
| 6 to 18 Years | 519 (100.0%) | 0 (0.0%) |
| 19 to 25 Years | 222 (72.8%) | 83 (27.2%) |
| 26 to 34 Years | 67 (55.8%) | 53 (44.2%) |
| 35 to 44 Years | 657 (96.2%) | 26 (3.8%) |
| 45 to 54 Years | 309 (74.3%) | 107 (25.7%) |
| 55 to 64 Years | 354 (91.9%) | 31 (8.1%) |
| 65 to 74 Years | 365 (100.0%) | 0 (0.0%) |
| 75 Years and older | 401 (100.0%) | 0 (0.0%) |
| Total | 3,058 (91.1%) | 300 (8.9%) |
Health Insurance Coverage by Citizenship Status in Lake Royale
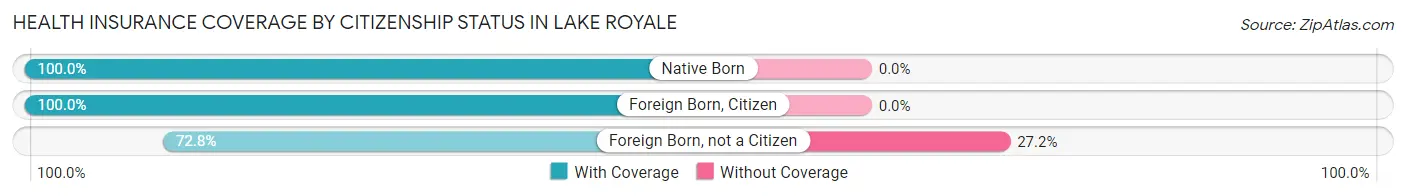
| Citizenship Status | With Coverage | Without Coverage |
| Native Born | 164 (100.0%) | 0 (0.0%) |
| Foreign Born, Citizen | 519 (100.0%) | 0 (0.0%) |
| Foreign Born, not a Citizen | 222 (72.8%) | 83 (27.2%) |
Health Insurance Coverage by Household Income in Lake Royale
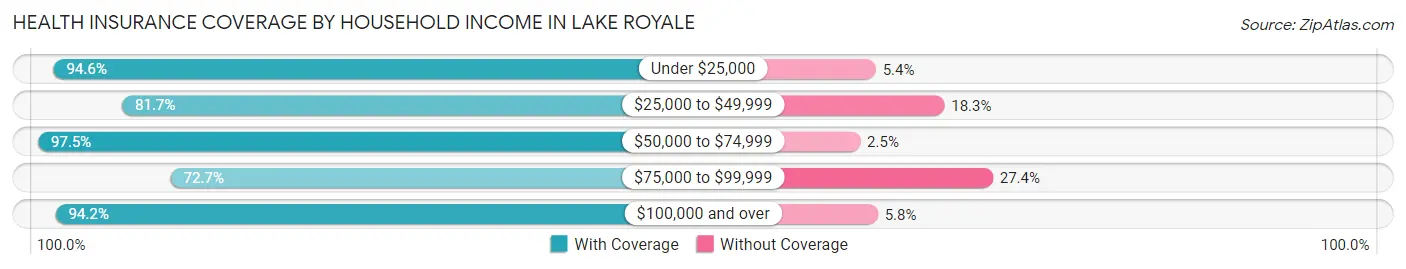
| Household Income | With Coverage | Without Coverage |
| Under $25,000 | 279 (94.6%) | 16 (5.4%) |
| $25,000 to $49,999 | 479 (81.7%) | 107 (18.3%) |
| $50,000 to $74,999 | 429 (97.5%) | 11 (2.5%) |
| $75,000 to $99,999 | 162 (72.7%) | 61 (27.4%) |
| $100,000 and over | 1,709 (94.2%) | 105 (5.8%) |
Public vs Private Health Insurance Coverage by Age in Lake Royale
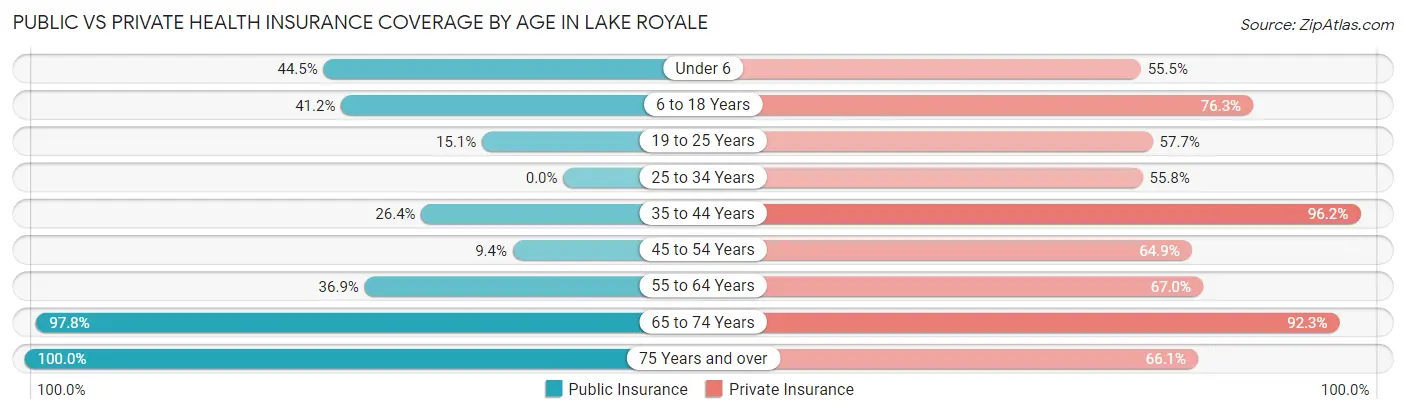
| Age Bracket | Public Insurance | Private Insurance |
| Under 6 | 73 (44.5%) | 91 (55.5%) |
| 6 to 18 Years | 214 (41.2%) | 396 (76.3%) |
| 19 to 25 Years | 46 (15.1%) | 176 (57.7%) |
| 25 to 34 Years | 0 (0.0%) | 67 (55.8%) |
| 35 to 44 Years | 180 (26.4%) | 657 (96.2%) |
| 45 to 54 Years | 39 (9.4%) | 270 (64.9%) |
| 55 to 64 Years | 142 (36.9%) | 258 (67.0%) |
| 65 to 74 Years | 357 (97.8%) | 337 (92.3%) |
| 75 Years and over | 401 (100.0%) | 265 (66.1%) |
| Total | 1,452 (43.2%) | 2,517 (75.0%) |
Disability Status by Sex by Age in Lake Royale
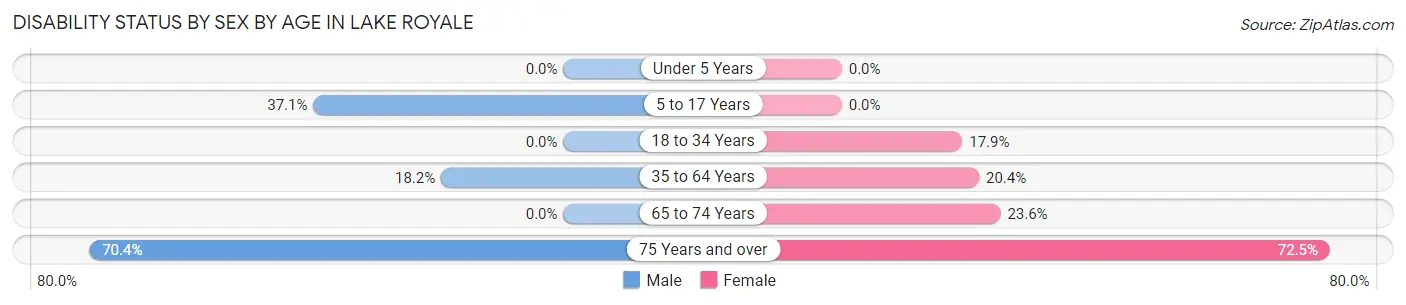
| Age Bracket | Male | Female |
| Under 5 Years | 0 (0.0%) | 0 (0.0%) |
| 5 to 17 Years | 124 (37.1%) | 0 (0.0%) |
| 18 to 34 Years | 0 (0.0%) | 46 (17.9%) |
| 35 to 64 Years | 134 (18.2%) | 152 (20.4%) |
| 65 to 74 Years | 0 (0.0%) | 41 (23.6%) |
| 75 Years and over | 157 (70.4%) | 129 (72.5%) |
Disability Class by Sex by Age in Lake Royale
Disability Class: Hearing Difficulty
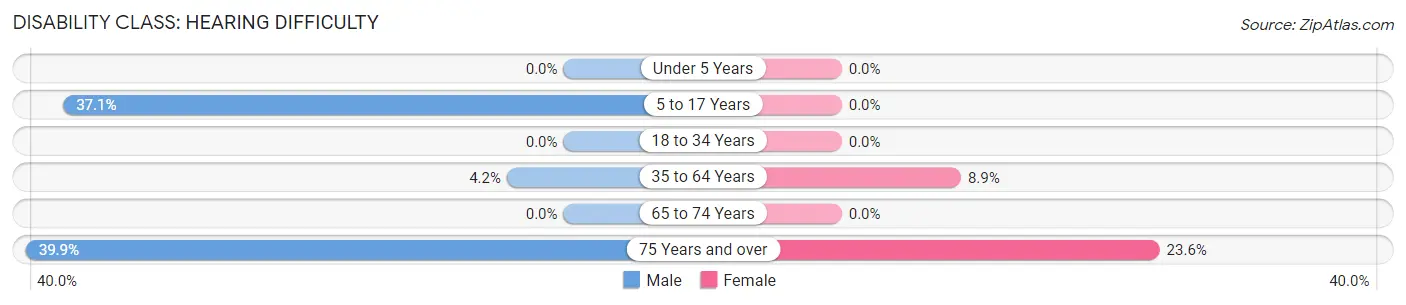
| Age Bracket | Male | Female |
| Under 5 Years | 0 (0.0%) | 0 (0.0%) |
| 5 to 17 Years | 124 (37.1%) | 0 (0.0%) |
| 18 to 34 Years | 0 (0.0%) | 0 (0.0%) |
| 35 to 64 Years | 31 (4.2%) | 66 (8.8%) |
| 65 to 74 Years | 0 (0.0%) | 0 (0.0%) |
| 75 Years and over | 89 (39.9%) | 42 (23.6%) |
Disability Class: Vision Difficulty
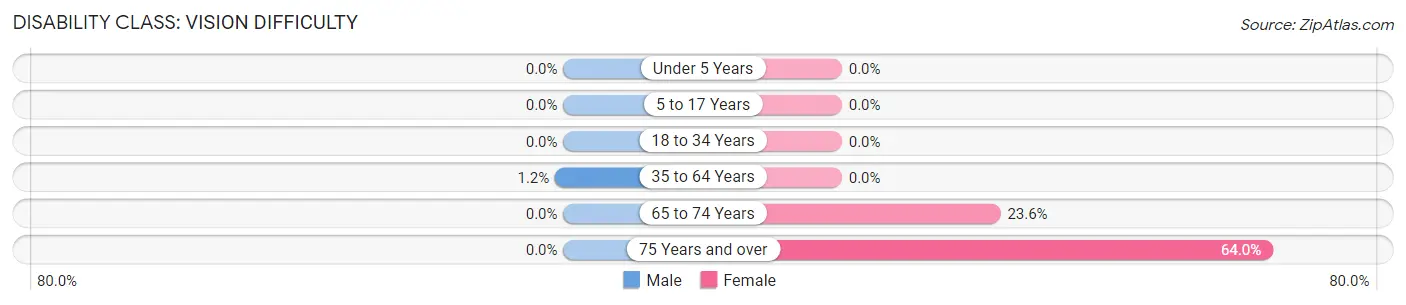
| Age Bracket | Male | Female |
| Under 5 Years | 0 (0.0%) | 0 (0.0%) |
| 5 to 17 Years | 0 (0.0%) | 0 (0.0%) |
| 18 to 34 Years | 0 (0.0%) | 0 (0.0%) |
| 35 to 64 Years | 9 (1.2%) | 0 (0.0%) |
| 65 to 74 Years | 0 (0.0%) | 41 (23.6%) |
| 75 Years and over | 0 (0.0%) | 114 (64.0%) |
Disability Class: Cognitive Difficulty
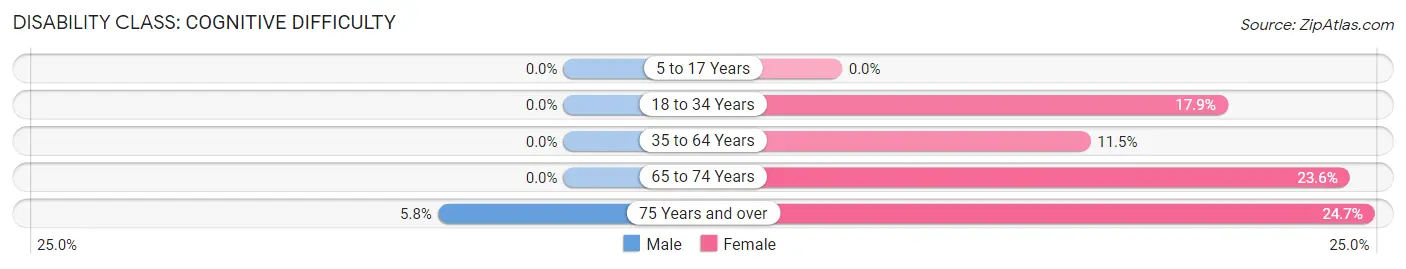
| Age Bracket | Male | Female |
| 5 to 17 Years | 0 (0.0%) | 0 (0.0%) |
| 18 to 34 Years | 0 (0.0%) | 46 (17.9%) |
| 35 to 64 Years | 0 (0.0%) | 86 (11.5%) |
| 65 to 74 Years | 0 (0.0%) | 41 (23.6%) |
| 75 Years and over | 13 (5.8%) | 44 (24.7%) |
Disability Class: Ambulatory Difficulty
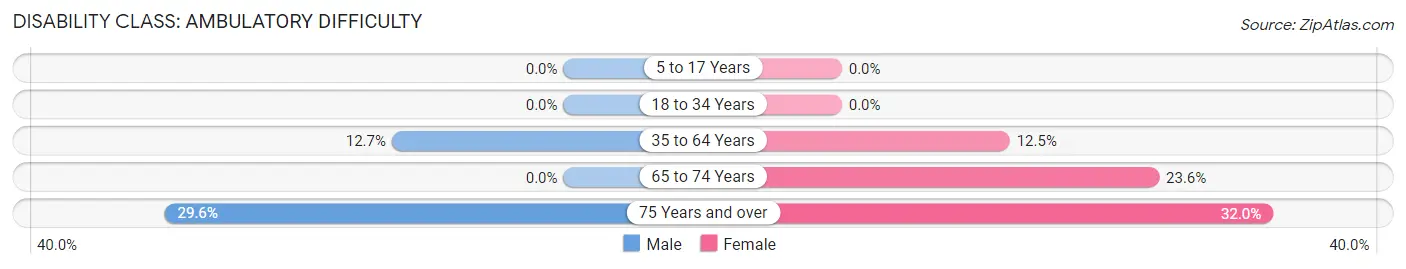
| Age Bracket | Male | Female |
| 5 to 17 Years | 0 (0.0%) | 0 (0.0%) |
| 18 to 34 Years | 0 (0.0%) | 0 (0.0%) |
| 35 to 64 Years | 94 (12.7%) | 93 (12.5%) |
| 65 to 74 Years | 0 (0.0%) | 41 (23.6%) |
| 75 Years and over | 66 (29.6%) | 57 (32.0%) |
Disability Class: Self-Care Difficulty
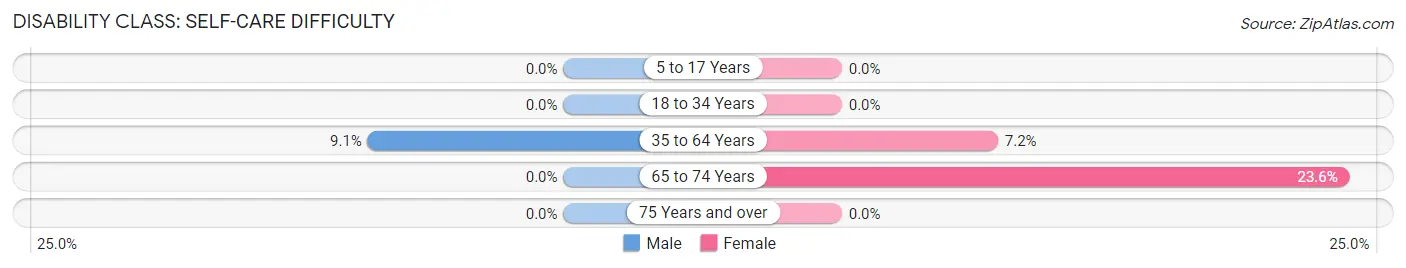
| Age Bracket | Male | Female |
| 5 to 17 Years | 0 (0.0%) | 0 (0.0%) |
| 18 to 34 Years | 0 (0.0%) | 0 (0.0%) |
| 35 to 64 Years | 67 (9.1%) | 54 (7.2%) |
| 65 to 74 Years | 0 (0.0%) | 41 (23.6%) |
| 75 Years and over | 0 (0.0%) | 0 (0.0%) |
Technology Access in Lake Royale
Computing Device Access in Lake Royale
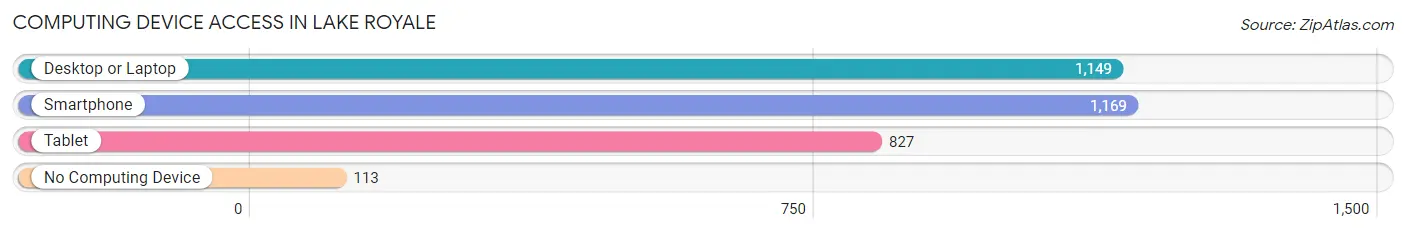
| Device Type | # Households | % Households |
| Desktop or Laptop | 1,149 | 82.7% |
| Smartphone | 1,169 | 84.2% |
| Tablet | 827 | 59.5% |
| No Computing Device | 113 | 8.1% |
| Total | 1,389 | 100.0% |
Internet Access in Lake Royale
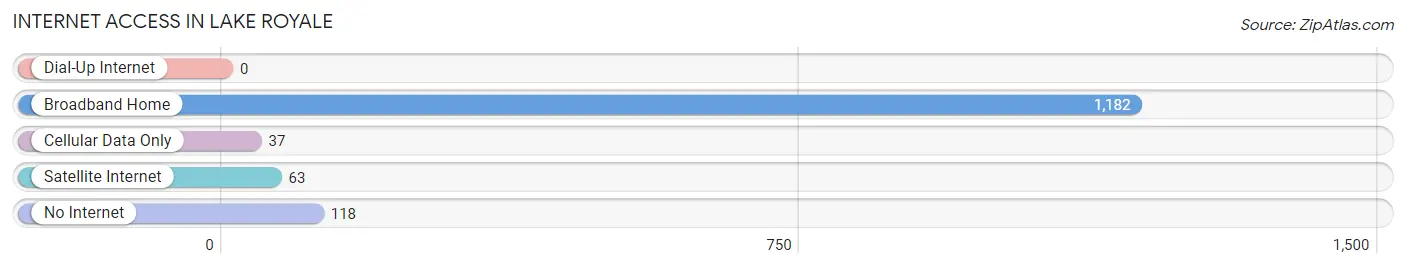
| Internet Type | # Households | % Households |
| Dial-Up Internet | 0 | 0.0% |
| Broadband Home | 1,182 | 85.1% |
| Cellular Data Only | 37 | 2.7% |
| Satellite Internet | 63 | 4.5% |
| No Internet | 118 | 8.5% |
| Total | 1,389 | 100.0% |
Lake Royale Summary
History
Lake Royale is a private gated community located in Franklin County, North Carolina. It is situated on a 2,000-acre lake and is home to over 1,000 families. The community was founded in the late 1960s by a group of investors who wanted to create a private lakefront community. The original plan was to build a resort-style community with a golf course, marina, and other amenities. The first homes were built in the early 1970s and the community has grown steadily since then.
The community was named after the lake, which was originally known as Lake Royale. The lake was created in the late 1800s when a dam was built on the Neuse River. The lake was used for recreational activities such as fishing and boating. In the early 1900s, the lake was used for hydroelectric power generation.
Geography
Lake Royale is located in Franklin County, North Carolina. It is situated on a 2,000-acre lake and is surrounded by the Neuse River. The lake is fed by several creeks and streams, including the Little River, which flows into the lake from the north. The lake is also fed by the Tar River, which flows into the lake from the south. The lake is approximately 10 miles long and 1.5 miles wide.
The community is located in a rural area and is surrounded by forests and farmland. The nearest town is Louisburg, which is approximately 10 miles away. The nearest major city is Raleigh, which is approximately 50 miles away.
Economy
The economy of Lake Royale is largely based on tourism and recreation. The community is home to several resorts and marinas, which attract visitors from all over the country. The lake is also popular for fishing, boating, and other recreational activities.
The community also has several businesses, including restaurants, convenience stores, and other retail establishments. The community also has a golf course, which attracts golfers from all over the region.
Demographics
As of the 2010 census, the population of Lake Royale was 1,093. The racial makeup of the community was 94.3% White, 2.2% African American, 0.3% Native American, 0.7% Asian, 0.1% Pacific Islander, and 2.4% from other races. The median household income was $50,000 and the median family income was $54,000.
Conclusion
Lake Royale is a private gated community located in Franklin County, North Carolina. It is situated on a 2,000-acre lake and is home to over 1,000 families. The community was founded in the late 1960s and has grown steadily since then. The economy of Lake Royale is largely based on tourism and recreation, and the community is home to several resorts and marinas. The population of Lake Royale was 1,093 as of the 2010 census, and the median household income was $50,000.
Common Questions
What is the Total Population of Lake Royale?
Total Population of Lake Royale is 3,358.
What is the Total Male Population of Lake Royale?
Total Male Population of Lake Royale is 1,766.
What is the Total Female Population of Lake Royale?
Total Female Population of Lake Royale is 1,592.
What is the Ratio of Males per 100 Females in Lake Royale?
There are 110.93 Males per 100 Females in Lake Royale.
What is the Ratio of Females per 100 Males in Lake Royale?
There are 90.15 Females per 100 Males in Lake Royale.
What is the Median Population Age in Lake Royale?
Median Population Age in Lake Royale is 41.0 Years.
What is the Average Family Size in Lake Royale
Average Family Size in Lake Royale is 2.7 People.
What is the Average Household Size in Lake Royale
Average Household Size in Lake Royale is 2.4 People.
What is Per Capita Income in Lake Royale?
Per Capita income in Lake Royale is $37,432.
What is the Median Family Income in Lake Royale?
Median Family Income in Lake Royale is $100,545.
What is the Median Household income in Lake Royale?
Median Household Income in Lake Royale is $100,239.
What is Income or Wage Gap in Lake Royale?
Income or Wage Gap in Lake Royale is 46.8%.
Women in Lake Royale earn 53.2 cents for every dollar earned by a man.
What is Inequality or Gini Index in Lake Royale?
Inequality or Gini Index in Lake Royale is 0.36.
How Large is the Labor Force in Lake Royale?
There are 1,585 People in the Labor Forcein in Lake Royale.
What is the Percentage of People in the Labor Force in Lake Royale?
57.5% of People are in the Labor Force in Lake Royale.
What is the Unemployment Rate in Lake Royale?
Unemployment Rate in Lake Royale is 2.0%.