Red Cross, NC
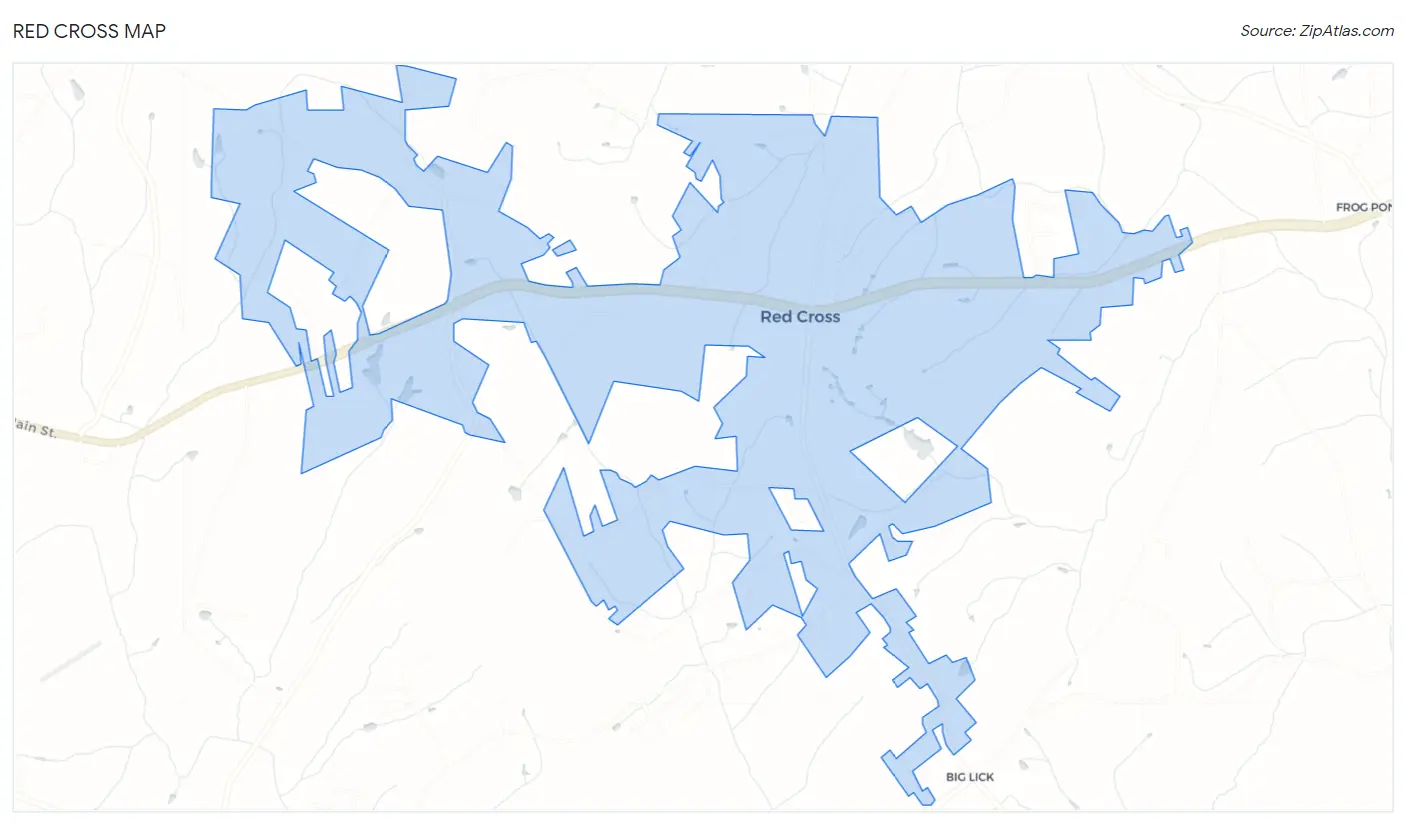
Red Cross Map
Red Cross Overview
677
TOTAL POPULATION
318
MALE POPULATION
359
FEMALE POPULATION
88.58
MALES / 100 FEMALES
112.89
FEMALES / 100 MALES
51.3
MEDIAN AGE
2.7
AVG FAMILY SIZE
2.2
AVG HOUSEHOLD SIZE
$31,036
PER CAPITA INCOME
$75,000
AVG FAMILY INCOME
$51,250
AVG HOUSEHOLD INCOME
41.4%
WAGE / INCOME GAP [ % ]
58.6¢/ $1
WAGE / INCOME GAP [ $ ]
0.41
INEQUALITY / GINI INDEX
349
LABOR FORCE [ PEOPLE ]
60.8%
PERCENT IN LABOR FORCE
4.9%
UNEMPLOYMENT RATE
Red Cross Area Codes
Race in Red Cross
The most populous races in Red Cross are White / Caucasian (651 | 96.2%), Hispanic or Latino (25 | 3.7%), and Hawaiian / Pacific (13 | 1.9%).
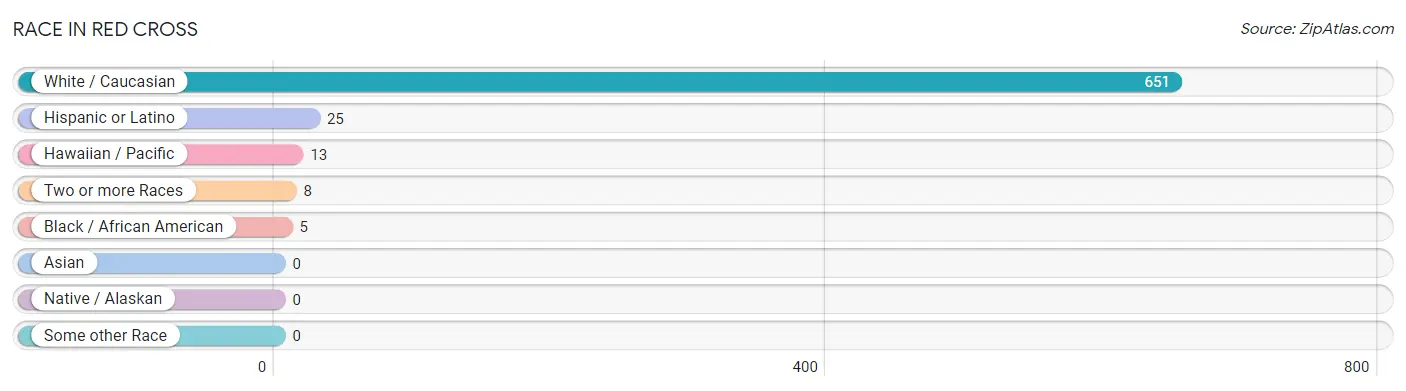
| Race | # Population | % Population |
| Asian | 0 | 0.0% |
| Black / African American | 5 | 0.7% |
| Hawaiian / Pacific | 13 | 1.9% |
| Hispanic or Latino | 25 | 3.7% |
| Native / Alaskan | 0 | 0.0% |
| White / Caucasian | 651 | 96.2% |
| Two or more Races | 8 | 1.2% |
| Some other Race | 0 | 0.0% |
| Total | 677 | 100.0% |
Ancestry in Red Cross
The most populous ancestries reported in Red Cross are English (130 | 19.2%), American (111 | 16.4%), German (81 | 12.0%), Irish (47 | 6.9%), and Scotch-Irish (21 | 3.1%), together accounting for 57.6% of all Red Cross residents.
| Ancestry | # Population | % Population |
| American | 111 | 16.4% |
| Brazilian | 3 | 0.4% |
| Central American | 12 | 1.8% |
| Dutch | 11 | 1.6% |
| English | 130 | 19.2% |
| French | 6 | 0.9% |
| German | 81 | 12.0% |
| Guamanian / Chamorro | 13 | 1.9% |
| Honduran | 12 | 1.8% |
| Irish | 47 | 6.9% |
| Lithuanian | 1 | 0.2% |
| Mexican | 13 | 1.9% |
| Russian | 1 | 0.2% |
| Scotch-Irish | 21 | 3.1% |
| Scottish | 16 | 2.4% |
| Welsh | 2 | 0.3% | View All 16 Rows |
Immigrants in Red Cross
The most numerous immigrant groups reported in Red Cross came from Latin America (7 | 1.0%), Central America (4 | 0.6%), Honduras (4 | 0.6%), Brazil (3 | 0.4%), and South America (3 | 0.4%), together accounting for 3.1% of all Red Cross residents.
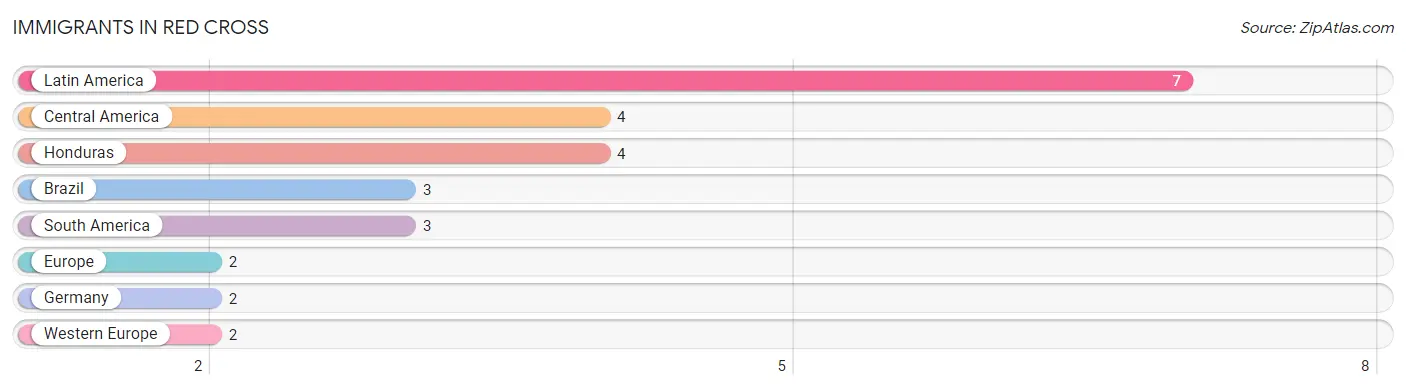
| Immigration Origin | # Population | % Population |
| Brazil | 3 | 0.4% |
| Central America | 4 | 0.6% |
| Europe | 2 | 0.3% |
| Germany | 2 | 0.3% |
| Honduras | 4 | 0.6% |
| Latin America | 7 | 1.0% |
| South America | 3 | 0.4% |
| Western Europe | 2 | 0.3% | View All 8 Rows |
Sex and Age in Red Cross
Sex and Age in Red Cross
The most populous age groups in Red Cross are 15 to 19 Years (41 | 12.9%) for men and 65 to 69 Years (39 | 10.9%) for women.
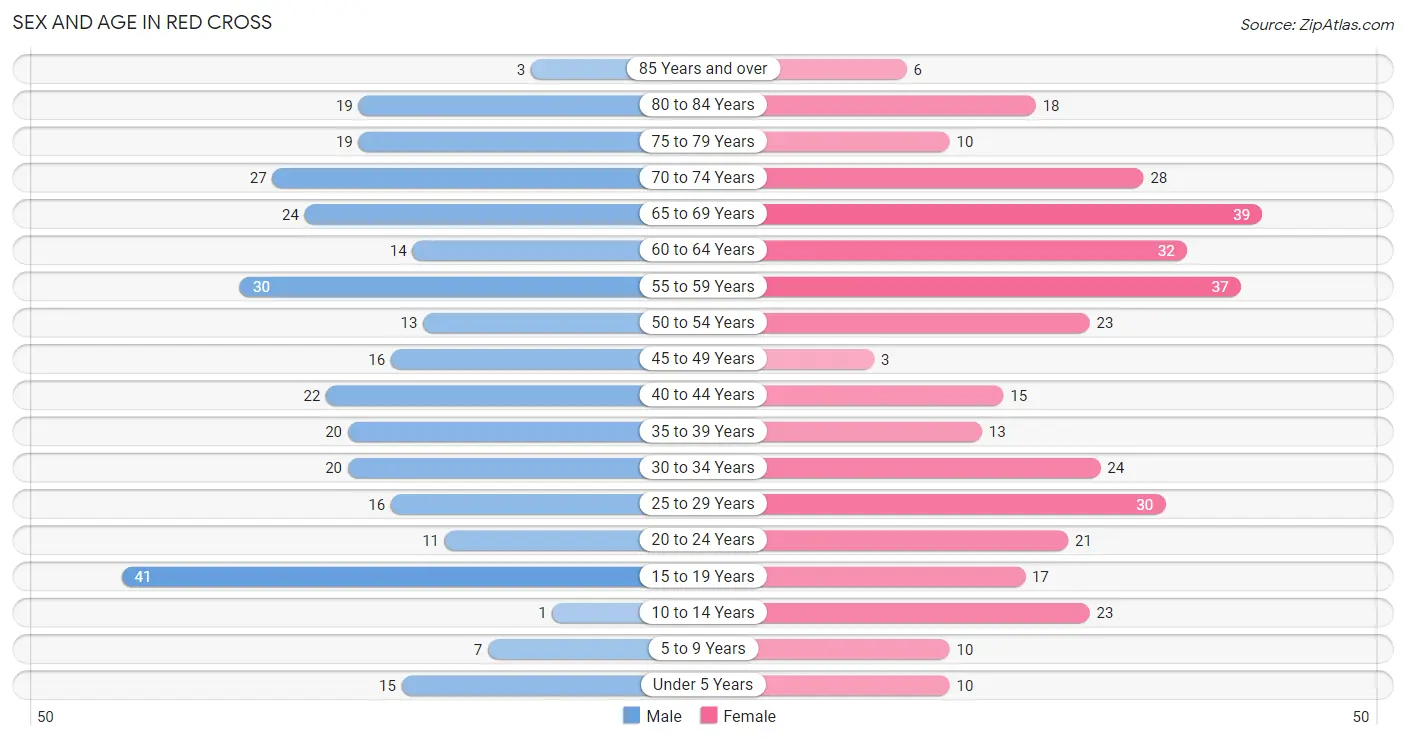
| Age Bracket | Male | Female |
| Under 5 Years | 15 (4.7%) | 10 (2.8%) |
| 5 to 9 Years | 7 (2.2%) | 10 (2.8%) |
| 10 to 14 Years | 1 (0.3%) | 23 (6.4%) |
| 15 to 19 Years | 41 (12.9%) | 17 (4.7%) |
| 20 to 24 Years | 11 (3.5%) | 21 (5.9%) |
| 25 to 29 Years | 16 (5.0%) | 30 (8.4%) |
| 30 to 34 Years | 20 (6.3%) | 24 (6.7%) |
| 35 to 39 Years | 20 (6.3%) | 13 (3.6%) |
| 40 to 44 Years | 22 (6.9%) | 15 (4.2%) |
| 45 to 49 Years | 16 (5.0%) | 3 (0.8%) |
| 50 to 54 Years | 13 (4.1%) | 23 (6.4%) |
| 55 to 59 Years | 30 (9.4%) | 37 (10.3%) |
| 60 to 64 Years | 14 (4.4%) | 32 (8.9%) |
| 65 to 69 Years | 24 (7.5%) | 39 (10.9%) |
| 70 to 74 Years | 27 (8.5%) | 28 (7.8%) |
| 75 to 79 Years | 19 (6.0%) | 10 (2.8%) |
| 80 to 84 Years | 19 (6.0%) | 18 (5.0%) |
| 85 Years and over | 3 (0.9%) | 6 (1.7%) |
| Total | 318 (100.0%) | 359 (100.0%) |
Families and Households in Red Cross
Median Family Size in Red Cross
The median family size in Red Cross is 2.71 persons per family, with married-couple families (160 | 87.9%) accounting for the largest median family size of 2.74 persons per family. On the other hand, single male/father families (13 | 7.1%) represent the smallest median family size with 2.31 persons per family.
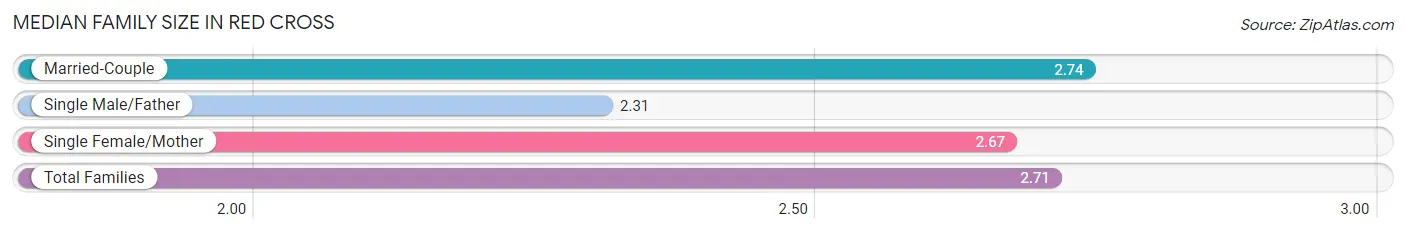
| Family Type | # Families | Family Size |
| Married-Couple | 160 (87.9%) | 2.74 |
| Single Male/Father | 13 (7.1%) | 2.31 |
| Single Female/Mother | 9 (5.0%) | 2.67 |
| Total Families | 182 (100.0%) | 2.71 |
Median Household Size in Red Cross
The median household size in Red Cross is 2.23 persons per household, with married-couple households (160 | 52.6%) accounting for the largest median household size of 2.74 persons per household. non-family households (122 | 40.1%) represent the smallest median household size with 1.50 persons per household.
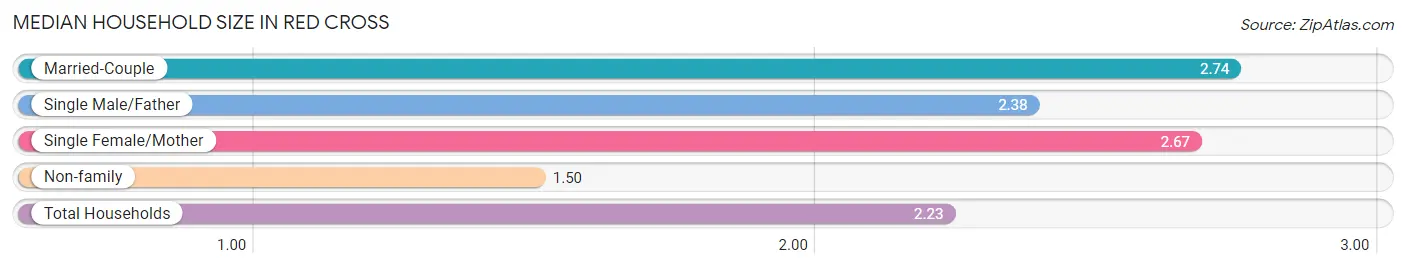
| Household Type | # Households | Household Size |
| Married-Couple | 160 (52.6%) | 2.74 |
| Single Male/Father | 13 (4.3%) | 2.38 |
| Single Female/Mother | 9 (3.0%) | 2.67 |
| Non-family | 122 (40.1%) | 1.50 |
| Total Households | 304 (100.0%) | 2.23 |
Household Size by Marriage Status in Red Cross
Out of a total of 304 households in Red Cross, 182 (59.9%) are family households, while 122 (40.1%) are nonfamily households. The most numerous type of family households are 2-person households, comprising 121, and the most common type of nonfamily households are 1-person households, comprising 79.

| Household Size | Family Households | Nonfamily Households |
| 1-Person Households | - | 79 (26.0%) |
| 2-Person Households | 121 (39.8%) | 34 (11.2%) |
| 3-Person Households | 28 (9.2%) | 9 (3.0%) |
| 4-Person Households | 26 (8.6%) | 0 (0.0%) |
| 5-Person Households | 6 (2.0%) | 0 (0.0%) |
| 6-Person Households | 1 (0.3%) | 0 (0.0%) |
| 7+ Person Households | 0 (0.0%) | 0 (0.0%) |
| Total | 182 (59.9%) | 122 (40.1%) |
Female Fertility in Red Cross
Fertility by Age in Red Cross
Average fertility rate in Red Cross is 33.0 births per 1,000 women. Women in the age bracket of 35 to 50 years have the highest fertility rate with 65.0 births per 1,000 women. Women in the age bracket of 20 to 34 years acount for 50.0% of all women with births.
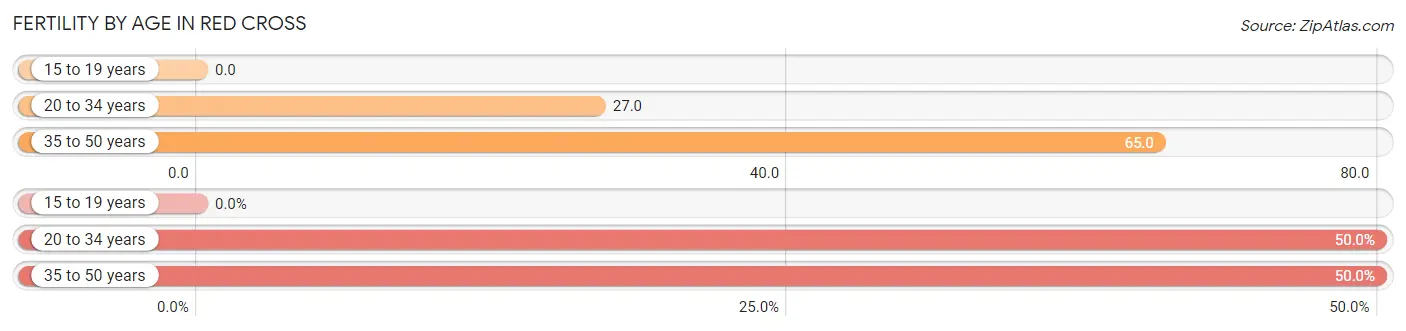
| Age Bracket | Women with Births | Births / 1,000 Women |
| 15 to 19 years | 0 (0.0%) | 0.0 |
| 20 to 34 years | 2 (50.0%) | 27.0 |
| 35 to 50 years | 2 (50.0%) | 65.0 |
| Total | 4 (100.0%) | 33.0 |
Fertility by Age by Marriage Status in Red Cross
50.0% of women with births (4) in Red Cross are married. The highest percentage of unmarried women with births falls into 35 to 50 years age bracket with 100.0% of them unmarried at the time of birth, while the lowest percentage of unmarried women with births belong to 20 to 34 years age bracket with 0.0% of them unmarried.
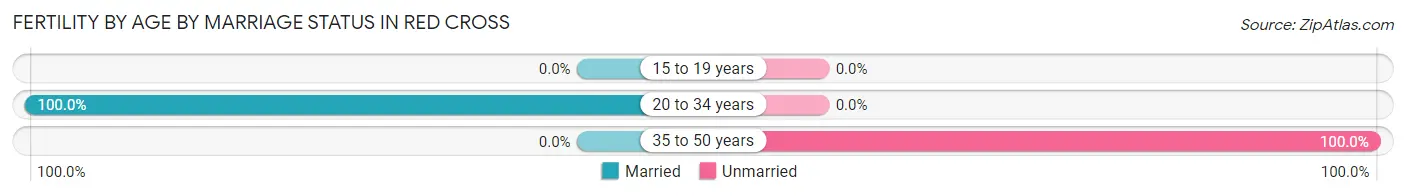
| Age Bracket | Married | Unmarried |
| 15 to 19 years | 0 (0.0%) | 0 (0.0%) |
| 20 to 34 years | 2 (100.0%) | 0 (0.0%) |
| 35 to 50 years | 0 (0.0%) | 2 (100.0%) |
| Total | 2 (50.0%) | 2 (50.0%) |
Fertility by Education in Red Cross
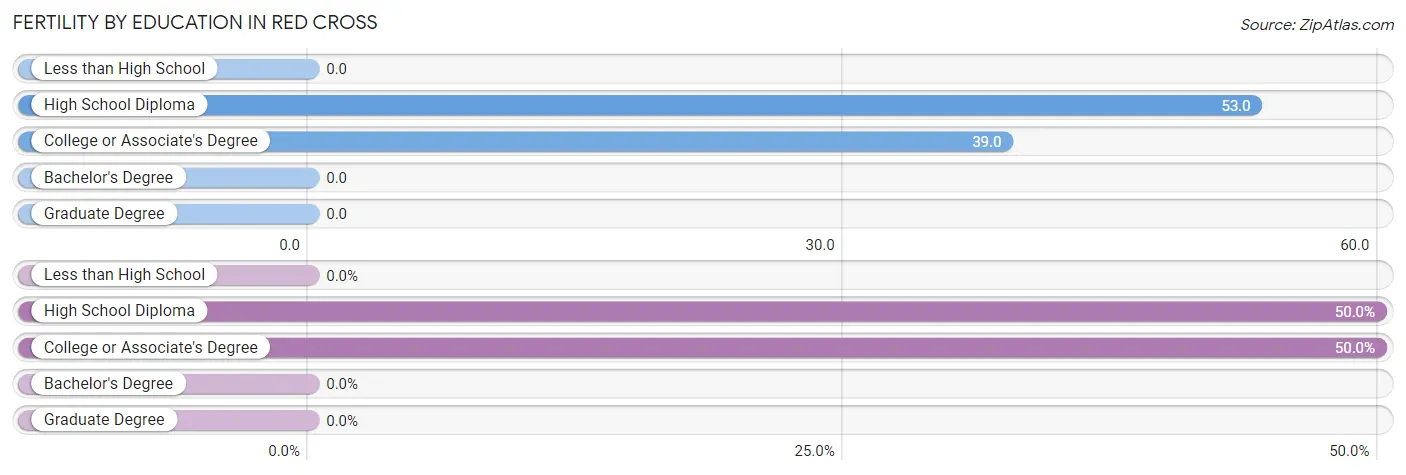
| Educational Attainment | Women with Births | Births / 1,000 Women |
| Less than High School | 0 (0.0%) | 0.0 |
| High School Diploma | 2 (50.0%) | 53.0 |
| College or Associate's Degree | 2 (50.0%) | 39.0 |
| Bachelor's Degree | 0 (0.0%) | 0.0 |
| Graduate Degree | 0 (0.0%) | 0.0 |
| Total | 4 (100.0%) | 33.0 |
Fertility by Education by Marriage Status in Red Cross
50.0% of women with births in Red Cross are unmarried. Women with the educational attainment of college or associate's degree are most likely to be married with 100.0% of them married at childbirth, while women with the educational attainment of high school diploma are least likely to be married with 100.0% of them unmarried at childbirth.
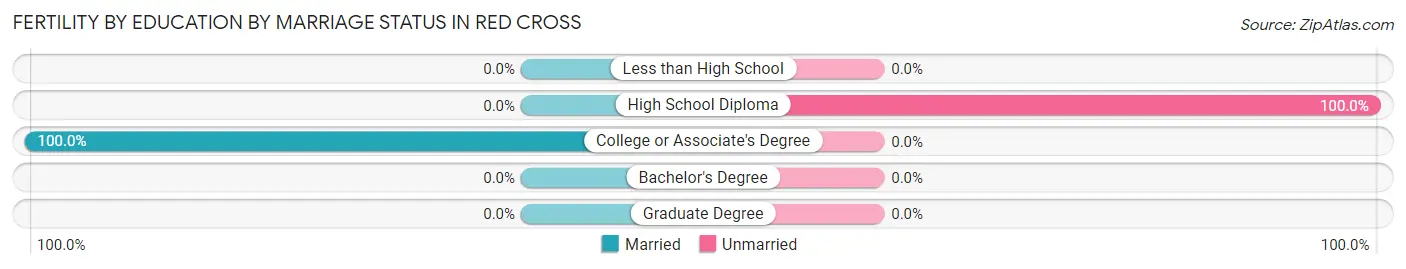
| Educational Attainment | Married | Unmarried |
| Less than High School | 0 (0.0%) | 0 (0.0%) |
| High School Diploma | 0 (0.0%) | 2 (100.0%) |
| College or Associate's Degree | 2 (100.0%) | 0 (0.0%) |
| Bachelor's Degree | 0 (0.0%) | 0 (0.0%) |
| Graduate Degree | 0 (0.0%) | 0 (0.0%) |
| Total | 2 (50.0%) | 2 (50.0%) |
Income in Red Cross
Income Overview in Red Cross
Per Capita Income in Red Cross is $31,036, while median incomes of families and households are $75,000 and $51,250 respectively.
| Characteristic | Number | Measure |
| Per Capita Income | 677 | $31,036 |
| Median Family Income | 182 | $75,000 |
| Mean Family Income | 182 | $92,824 |
| Median Household Income | 304 | $51,250 |
| Mean Household Income | 304 | $68,903 |
| Income Deficit | 182 | $0 |
| Wage / Income Gap (%) | 677 | 41.37% |
| Wage / Income Gap ($) | 677 | 58.63¢ per $1 |
| Gini / Inequality Index | 677 | 0.41 |
Earnings by Sex in Red Cross
Average Earnings in Red Cross are $31,528, $43,438 for men and $25,469 for women, a difference of 41.4%.
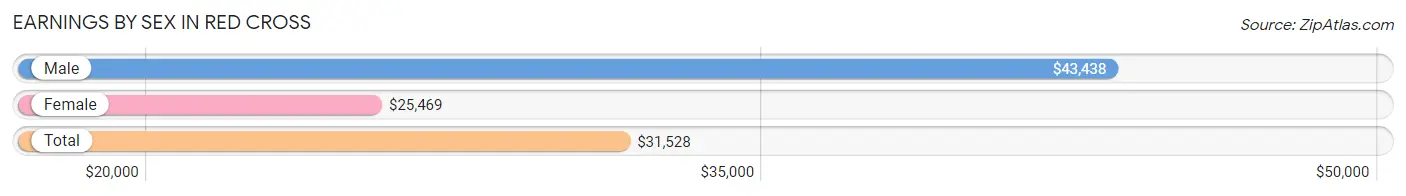
| Sex | Number | Average Earnings |
| Male | 179 (50.6%) | $43,438 |
| Female | 175 (49.4%) | $25,469 |
| Total | 354 (100.0%) | $31,528 |
Earnings by Sex by Income Bracket in Red Cross
The most common earnings brackets in Red Cross are $20,000 to $22,499 for men (28 | 15.6%) and $65,000 to $74,999 for women (21 | 12.0%).
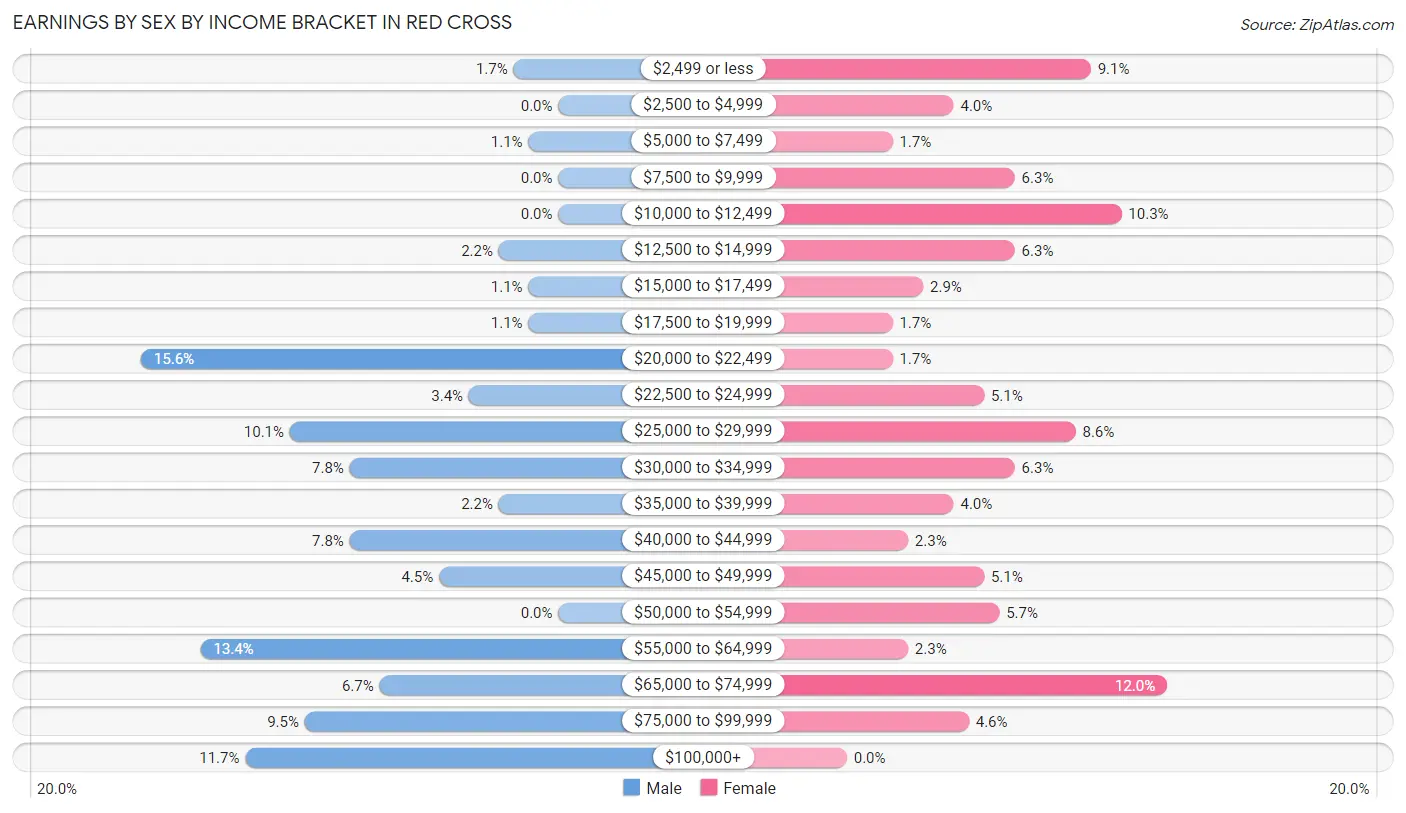
| Income | Male | Female |
| $2,499 or less | 3 (1.7%) | 16 (9.1%) |
| $2,500 to $4,999 | 0 (0.0%) | 7 (4.0%) |
| $5,000 to $7,499 | 2 (1.1%) | 3 (1.7%) |
| $7,500 to $9,999 | 0 (0.0%) | 11 (6.3%) |
| $10,000 to $12,499 | 0 (0.0%) | 18 (10.3%) |
| $12,500 to $14,999 | 4 (2.2%) | 11 (6.3%) |
| $15,000 to $17,499 | 2 (1.1%) | 5 (2.9%) |
| $17,500 to $19,999 | 2 (1.1%) | 3 (1.7%) |
| $20,000 to $22,499 | 28 (15.6%) | 3 (1.7%) |
| $22,500 to $24,999 | 6 (3.4%) | 9 (5.1%) |
| $25,000 to $29,999 | 18 (10.1%) | 15 (8.6%) |
| $30,000 to $34,999 | 14 (7.8%) | 11 (6.3%) |
| $35,000 to $39,999 | 4 (2.2%) | 7 (4.0%) |
| $40,000 to $44,999 | 14 (7.8%) | 4 (2.3%) |
| $45,000 to $49,999 | 8 (4.5%) | 9 (5.1%) |
| $50,000 to $54,999 | 0 (0.0%) | 10 (5.7%) |
| $55,000 to $64,999 | 24 (13.4%) | 4 (2.3%) |
| $65,000 to $74,999 | 12 (6.7%) | 21 (12.0%) |
| $75,000 to $99,999 | 17 (9.5%) | 8 (4.6%) |
| $100,000+ | 21 (11.7%) | 0 (0.0%) |
| Total | 179 (100.0%) | 175 (100.0%) |
Earnings by Sex by Educational Attainment in Red Cross
Average earnings in Red Cross are $45,625 for men and $30,278 for women, a difference of 33.6%. Men with an educational attainment of bachelor's degree enjoy the highest average annual earnings of $56,042, while those with high school diploma education earn the least with $38,333. Women with an educational attainment of bachelor's degree earn the most with the average annual earnings of $54,167, while those with college or associate's degree education have the smallest earnings of $20,833.
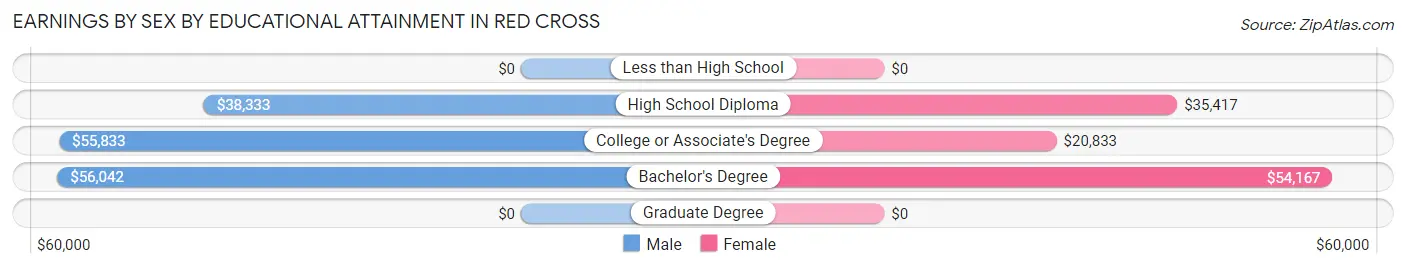
| Educational Attainment | Male Income | Female Income |
| Less than High School | - | - |
| High School Diploma | $38,333 | $35,417 |
| College or Associate's Degree | $55,833 | $20,833 |
| Bachelor's Degree | $56,042 | $54,167 |
| Graduate Degree | - | - |
| Total | $45,625 | $30,278 |
Family Income in Red Cross
Family Income Brackets in Red Cross
According to the Red Cross family income data, there are 42 families falling into the $50,000 to $74,999 income range, which is the most common income bracket and makes up 23.1% of all families.
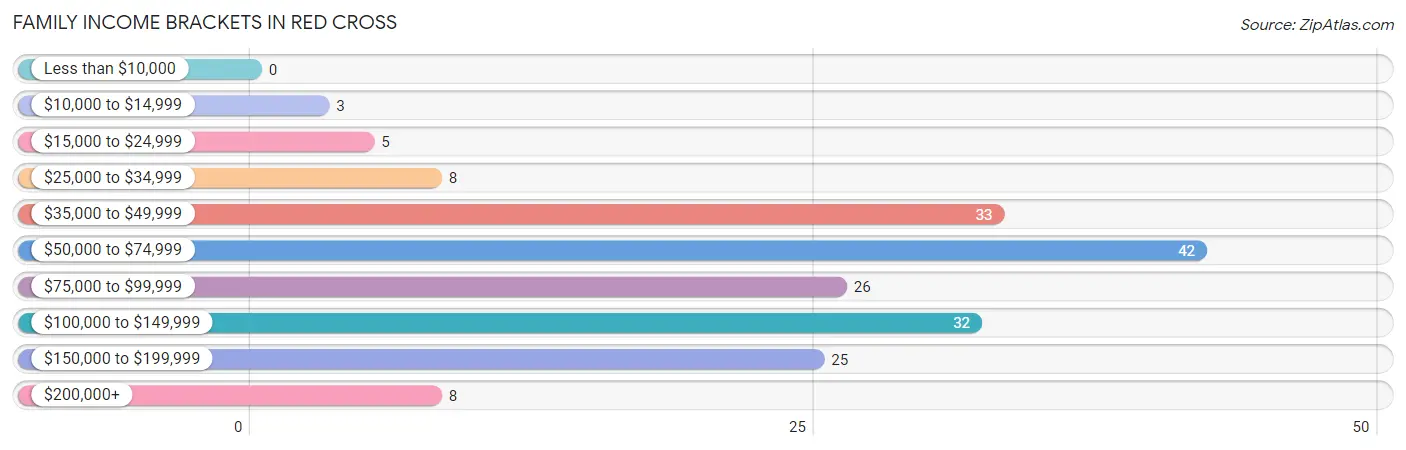
| Income Bracket | # Families | % Families |
| Less than $10,000 | 0 | 0.0% |
| $10,000 to $14,999 | 3 | 1.6% |
| $15,000 to $24,999 | 5 | 2.7% |
| $25,000 to $34,999 | 8 | 4.4% |
| $35,000 to $49,999 | 33 | 18.1% |
| $50,000 to $74,999 | 42 | 23.1% |
| $75,000 to $99,999 | 26 | 14.3% |
| $100,000 to $149,999 | 32 | 17.6% |
| $150,000 to $199,999 | 25 | 13.7% |
| $200,000+ | 8 | 4.4% |
Family Income by Famaliy Size in Red Cross
5-person families (7 | 3.8%) account for the highest median family income in Red Cross with $148,750 per family, while 3-person families (28 | 15.4%) have the highest median income of $40,417 per family member.
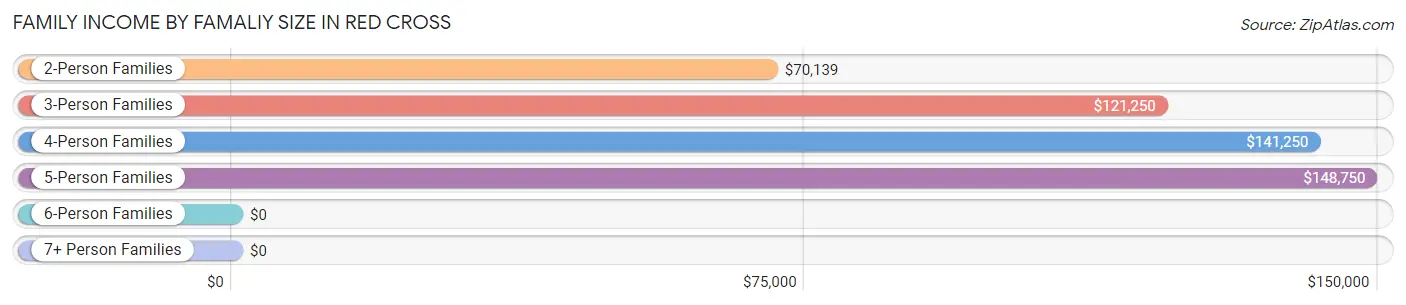
| Income Bracket | # Families | Median Income |
| 2-Person Families | 121 (66.5%) | $70,139 |
| 3-Person Families | 28 (15.4%) | $121,250 |
| 4-Person Families | 26 (14.3%) | $141,250 |
| 5-Person Families | 7 (3.8%) | $148,750 |
| 6-Person Families | 0 (0.0%) | $0 |
| 7+ Person Families | 0 (0.0%) | $0 |
| Total | 182 (100.0%) | $75,000 |
Family Income by Number of Earners in Red Cross
The median family income in Red Cross is $75,000, with families comprising 3+ earners (28) having the highest median family income of $151,667, while families with no earners (69) have the lowest median family income of $48,523, accounting for 15.4% and 37.9% of families, respectively.
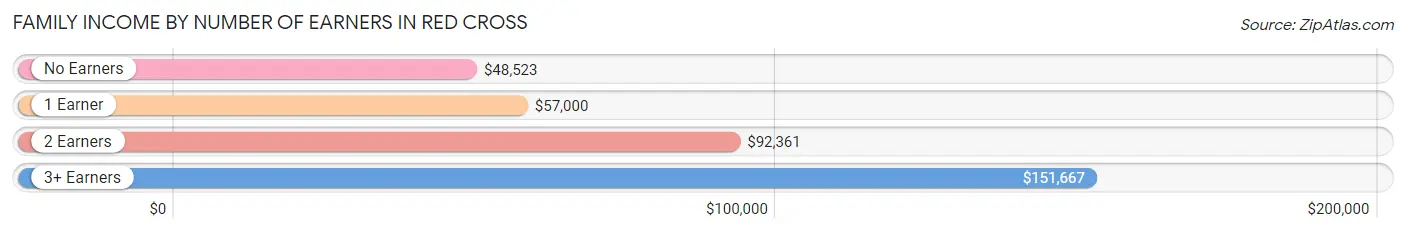
| Number of Earners | # Families | Median Income |
| No Earners | 69 (37.9%) | $48,523 |
| 1 Earner | 18 (9.9%) | $57,000 |
| 2 Earners | 67 (36.8%) | $92,361 |
| 3+ Earners | 28 (15.4%) | $151,667 |
| Total | 182 (100.0%) | $75,000 |
Household Income in Red Cross
Household Income Brackets in Red Cross
With 61 households falling in the category, the $35,000 to $49,999 income range is the most frequent in Red Cross, accounting for 20.1% of all households. In contrast, only 8 households (2.6%) fall into the $10,000 to $14,999 income bracket, making it the least populous group.
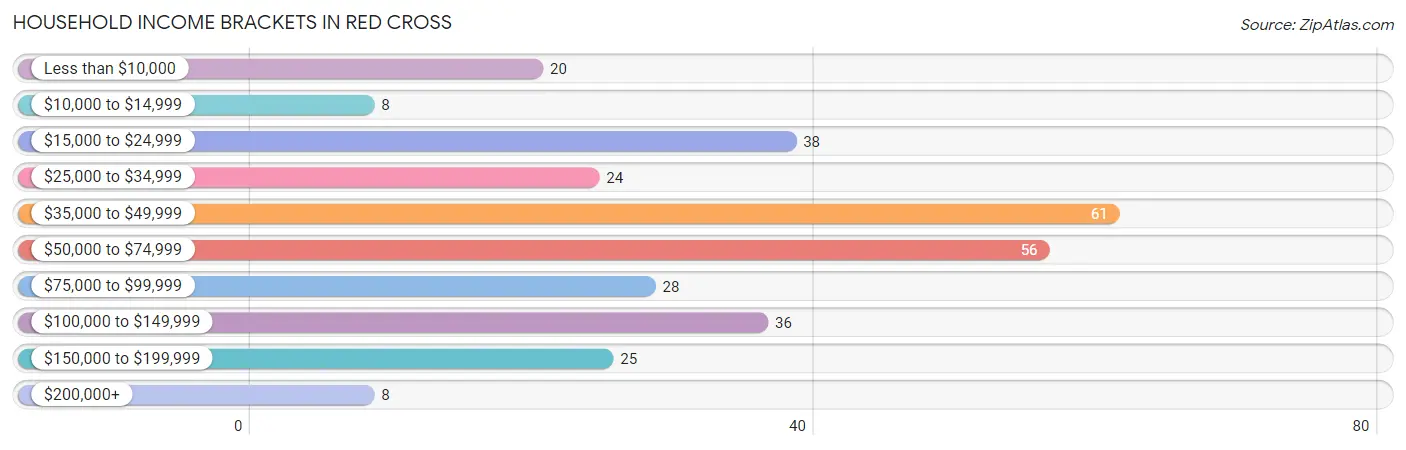
| Income Bracket | # Households | % Households |
| Less than $10,000 | 20 | 6.6% |
| $10,000 to $14,999 | 8 | 2.6% |
| $15,000 to $24,999 | 38 | 12.5% |
| $25,000 to $34,999 | 24 | 7.9% |
| $35,000 to $49,999 | 61 | 20.1% |
| $50,000 to $74,999 | 56 | 18.4% |
| $75,000 to $99,999 | 28 | 9.2% |
| $100,000 to $149,999 | 36 | 11.8% |
| $150,000 to $199,999 | 25 | 8.2% |
| $200,000+ | 8 | 2.6% |
Household Income by Householder Age in Red Cross
The median household income in Red Cross is $51,250, with the highest median household income of $73,625 found in the 45 to 64 years age bracket for the primary householder. A total of 89 households (29.3%) fall into this category.
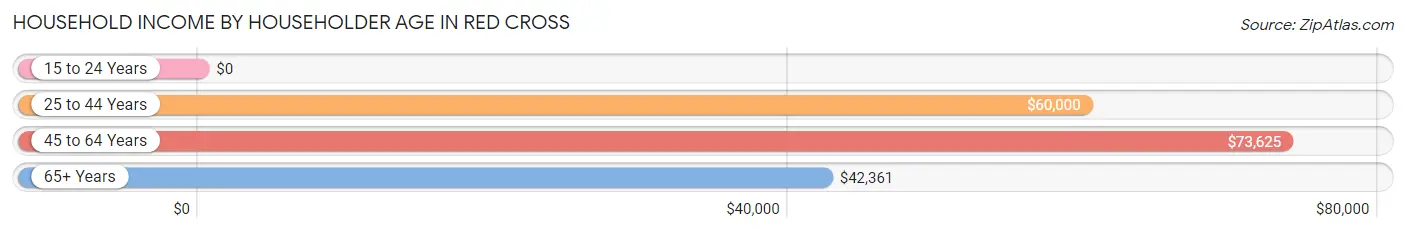
| Income Bracket | # Households | Median Income |
| 15 to 24 Years | 0 (0.0%) | $0 |
| 25 to 44 Years | 74 (24.3%) | $60,000 |
| 45 to 64 Years | 89 (29.3%) | $73,625 |
| 65+ Years | 141 (46.4%) | $42,361 |
| Total | 304 (100.0%) | $51,250 |
Poverty in Red Cross
Income Below Poverty by Sex and Age in Red Cross
With 3.2% poverty level for males and 16.3% for females among the residents of Red Cross, under 5 year old males and 15 year old females are the most vulnerable to poverty, with 2 males (20.0%) and 2 females (100.0%) in their respective age groups living below the poverty level.
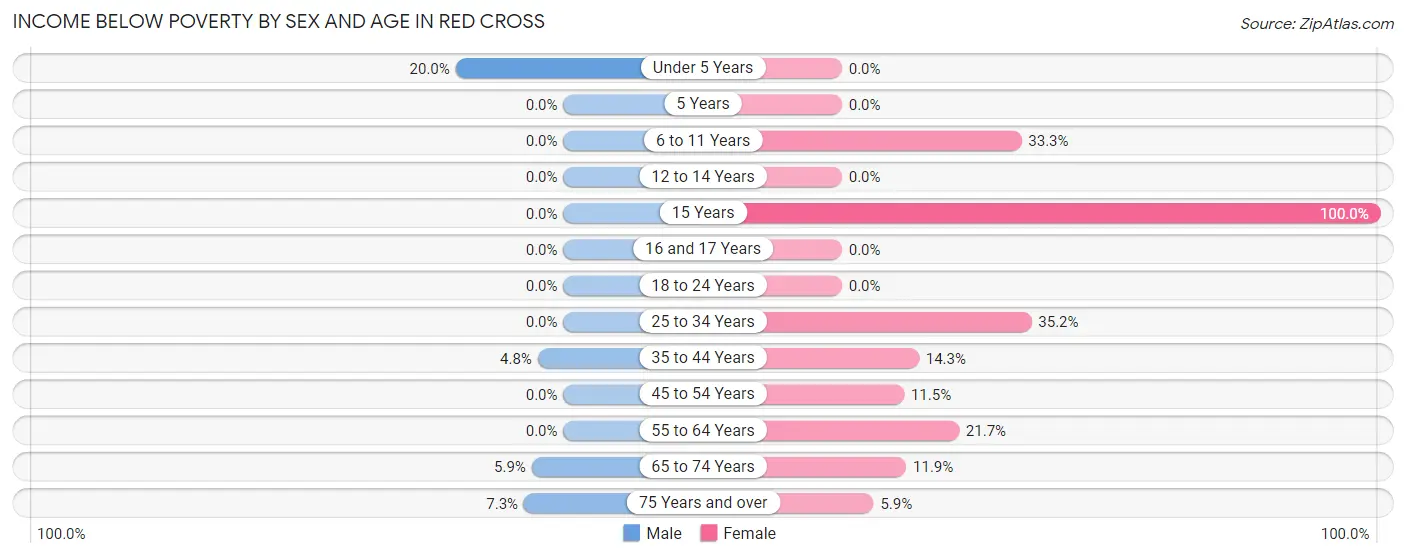
| Age Bracket | Male | Female |
| Under 5 Years | 2 (20.0%) | 0 (0.0%) |
| 5 Years | 0 (0.0%) | 0 (0.0%) |
| 6 to 11 Years | 0 (0.0%) | 4 (33.3%) |
| 12 to 14 Years | 0 (0.0%) | 0 (0.0%) |
| 15 Years | 0 (0.0%) | 2 (100.0%) |
| 16 and 17 Years | 0 (0.0%) | 0 (0.0%) |
| 18 to 24 Years | 0 (0.0%) | 0 (0.0%) |
| 25 to 34 Years | 0 (0.0%) | 19 (35.2%) |
| 35 to 44 Years | 2 (4.8%) | 4 (14.3%) |
| 45 to 54 Years | 0 (0.0%) | 3 (11.5%) |
| 55 to 64 Years | 0 (0.0%) | 15 (21.7%) |
| 65 to 74 Years | 3 (5.9%) | 8 (11.9%) |
| 75 Years and over | 3 (7.3%) | 2 (5.9%) |
| Total | 10 (3.2%) | 57 (16.3%) |
Income Above Poverty by Sex and Age in Red Cross
According to the poverty statistics in Red Cross, males aged 6 to 11 years and females aged under 5 years are the age groups that are most secure financially, with 100.0% of males and 100.0% of females in these age groups living above the poverty line.
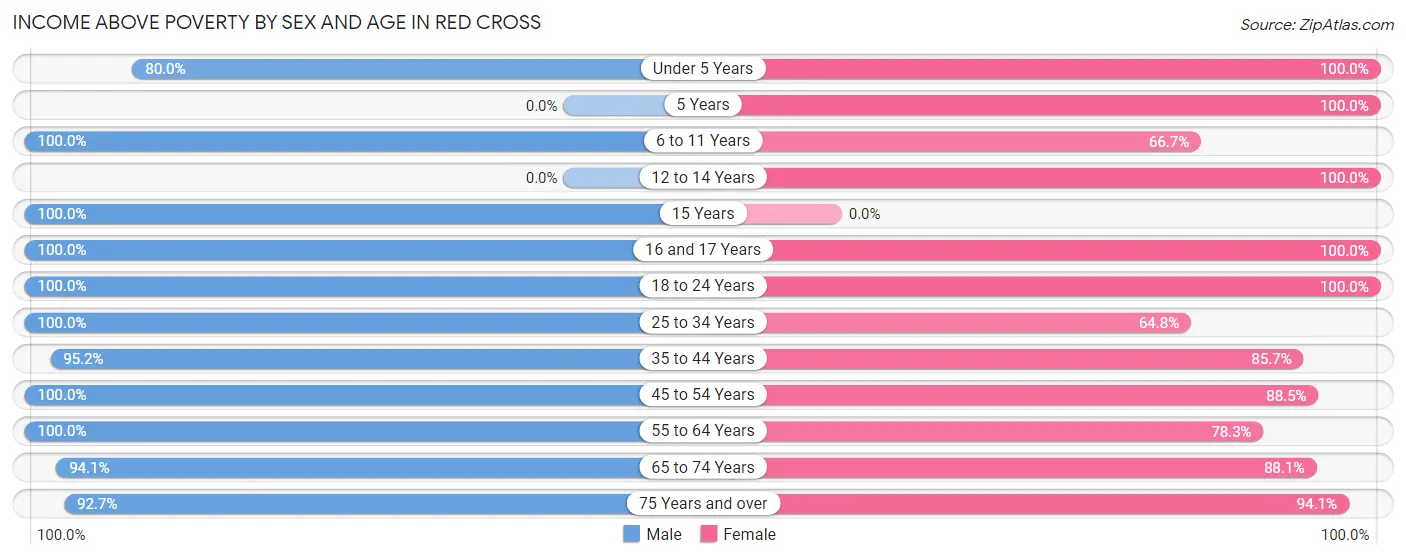
| Age Bracket | Male | Female |
| Under 5 Years | 8 (80.0%) | 10 (100.0%) |
| 5 Years | 0 (0.0%) | 5 (100.0%) |
| 6 to 11 Years | 8 (100.0%) | 8 (66.7%) |
| 12 to 14 Years | 0 (0.0%) | 6 (100.0%) |
| 15 Years | 35 (100.0%) | 0 (0.0%) |
| 16 and 17 Years | 2 (100.0%) | 13 (100.0%) |
| 18 to 24 Years | 15 (100.0%) | 23 (100.0%) |
| 25 to 34 Years | 36 (100.0%) | 35 (64.8%) |
| 35 to 44 Years | 40 (95.2%) | 24 (85.7%) |
| 45 to 54 Years | 29 (100.0%) | 23 (88.5%) |
| 55 to 64 Years | 44 (100.0%) | 54 (78.3%) |
| 65 to 74 Years | 48 (94.1%) | 59 (88.1%) |
| 75 Years and over | 38 (92.7%) | 32 (94.1%) |
| Total | 303 (96.8%) | 292 (83.7%) |
Income Below Poverty Among Married-Couple Families in Red Cross
The poverty statistics for married-couple families in Red Cross show that 3.1% or 5 of the total 160 families live below the poverty line. Families with 3 or 4 children have the highest poverty rate of 40.0%, comprising of 2 families. On the other hand, families with 1 or 2 children have the lowest poverty rate of 0.0%, which includes 0 families.

| Children | Above Poverty | Below Poverty |
| No Children | 119 (97.5%) | 3 (2.5%) |
| 1 or 2 Children | 33 (100.0%) | 0 (0.0%) |
| 3 or 4 Children | 3 (60.0%) | 2 (40.0%) |
| 5 or more Children | 0 (0.0%) | 0 (0.0%) |
| Total | 155 (96.9%) | 5 (3.1%) |
Income Below Poverty Among Single-Parent Households in Red Cross
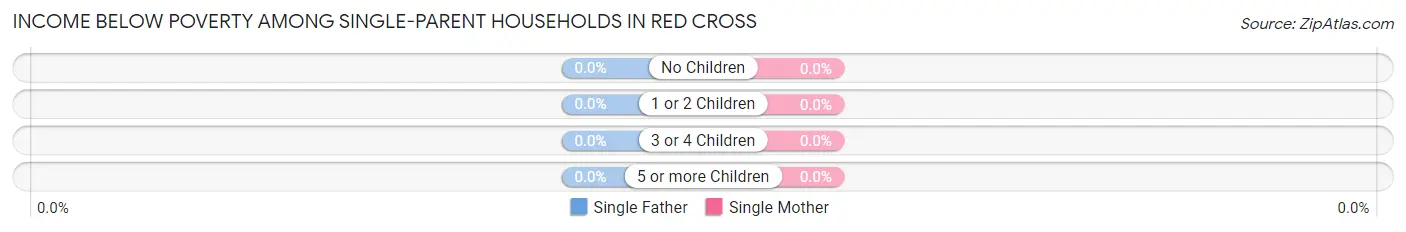
| Children | Single Father | Single Mother |
| No Children | 0 (0.0%) | 0 (0.0%) |
| 1 or 2 Children | 0 (0.0%) | 0 (0.0%) |
| 3 or 4 Children | 0 (0.0%) | 0 (0.0%) |
| 5 or more Children | 0 (0.0%) | 0 (0.0%) |
| Total | 0 (0.0%) | 0 (0.0%) |
Income Below Poverty Among Married-Couple vs Single-Parent Households in Red Cross
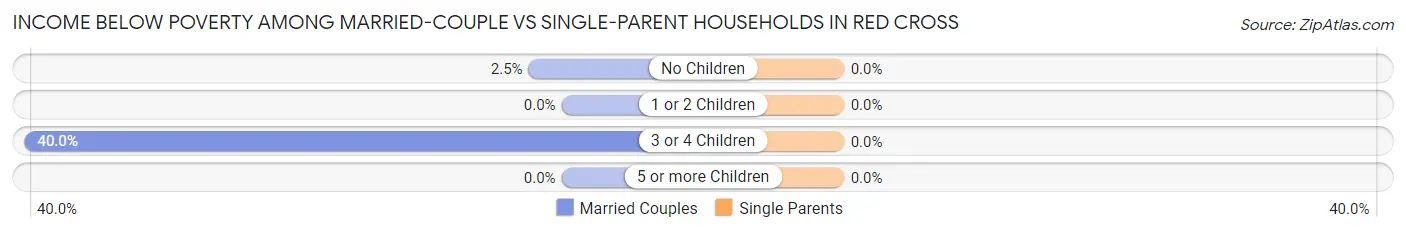
| Children | Married-Couple Families | Single-Parent Households |
| No Children | 3 (2.5%) | 0 (0.0%) |
| 1 or 2 Children | 0 (0.0%) | 0 (0.0%) |
| 3 or 4 Children | 2 (40.0%) | 0 (0.0%) |
| 5 or more Children | 0 (0.0%) | 0 (0.0%) |
| Total | 5 (3.1%) | 0 (0.0%) |
Employment Characteristics in Red Cross
Employment by Class of Employer in Red Cross
Among the 324 employed individuals in Red Cross, private company employees (254 | 78.4%), local government employees (26 | 8.0%), and self-employed (not incorporated) (18 | 5.6%) make up the most common classes of employment.
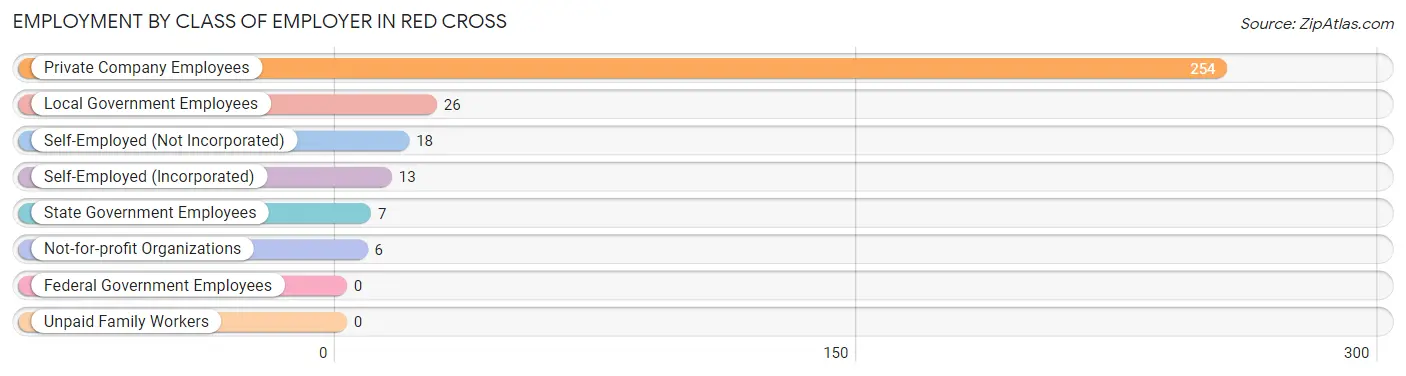
| Employer Class | # Employees | % Employees |
| Private Company Employees | 254 | 78.4% |
| Self-Employed (Incorporated) | 13 | 4.0% |
| Self-Employed (Not Incorporated) | 18 | 5.6% |
| Not-for-profit Organizations | 6 | 1.8% |
| Local Government Employees | 26 | 8.0% |
| State Government Employees | 7 | 2.2% |
| Federal Government Employees | 0 | 0.0% |
| Unpaid Family Workers | 0 | 0.0% |
| Total | 324 | 100.0% |
Employment Status by Age in Red Cross
According to the labor force statistics for Red Cross, out of the total population over 16 years of age (574), 60.8% or 349 individuals are in the labor force, with 4.9% or 17 of them unemployed. The age group with the highest labor force participation rate is 35 to 44 years, with 97.1% or 68 individuals in the labor force. Within the labor force, the 16 to 19 years age range has the highest percentage of unemployed individuals, with 41.2% or 7 of them being unemployed.
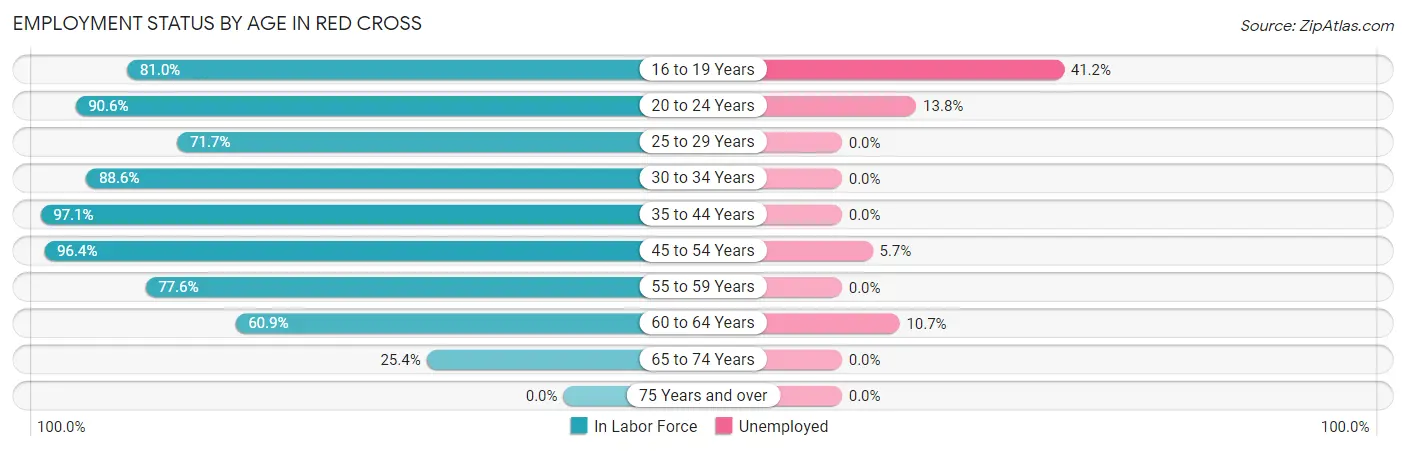
| Age Bracket | In Labor Force | Unemployed |
| 16 to 19 Years | 17 (81.0%) | 7 (41.2%) |
| 20 to 24 Years | 29 (90.6%) | 4 (13.8%) |
| 25 to 29 Years | 33 (71.7%) | 0 (0.0%) |
| 30 to 34 Years | 39 (88.6%) | 0 (0.0%) |
| 35 to 44 Years | 68 (97.1%) | 0 (0.0%) |
| 45 to 54 Years | 53 (96.4%) | 3 (5.7%) |
| 55 to 59 Years | 52 (77.6%) | 0 (0.0%) |
| 60 to 64 Years | 28 (60.9%) | 3 (10.7%) |
| 65 to 74 Years | 30 (25.4%) | 0 (0.0%) |
| 75 Years and over | 0 (0.0%) | 0 (0.0%) |
| Total | 349 (60.8%) | 17 (4.9%) |
Employment Status by Educational Attainment in Red Cross
According to labor force statistics for Red Cross, 83.2% of individuals (273) out of the total population between 25 and 64 years of age (328) are in the labor force, with 2.2% or 6 of them being unemployed. The group with the highest labor force participation rate are those with the educational attainment of college / associate degree, with 93.3% or 125 individuals in the labor force. Within the labor force, individuals with high school diploma education have the highest percentage of unemployment, with 3.1% or 3 of them being unemployed.
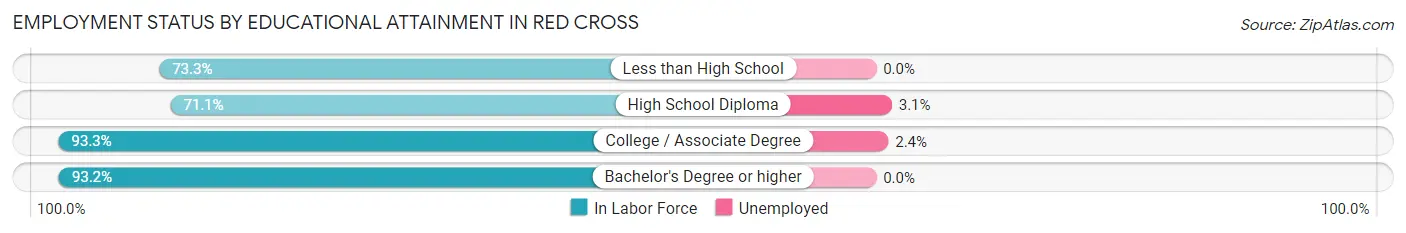
| Educational Attainment | In Labor Force | Unemployed |
| Less than High School | 11 (73.3%) | 0 (0.0%) |
| High School Diploma | 96 (71.1%) | 4 (3.1%) |
| College / Associate Degree | 125 (93.3%) | 3 (2.4%) |
| Bachelor's Degree or higher | 41 (93.2%) | 0 (0.0%) |
| Total | 273 (83.2%) | 7 (2.2%) |
Employment Occupations by Sex in Red Cross
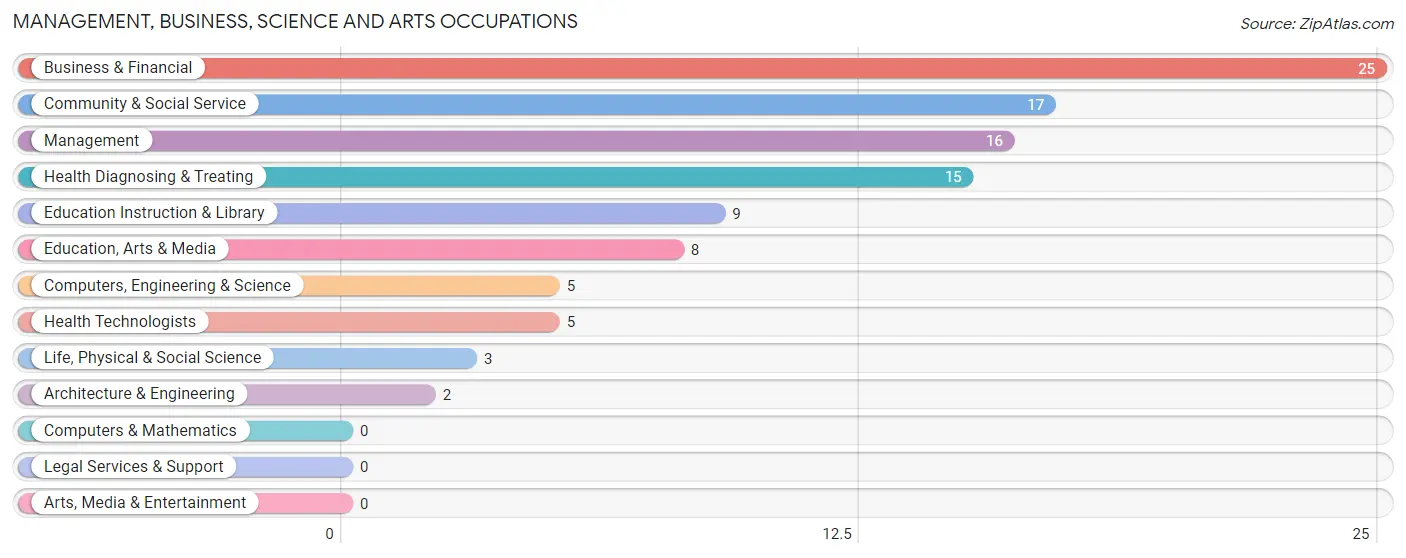
Management, Business, Science and Arts Occupations
The most common Management, Business, Science and Arts occupations in Red Cross are Business & Financial (25 | 7.5%), Community & Social Service (17 | 5.1%), Management (16 | 4.8%), Health Diagnosing & Treating (15 | 4.5%), and Education Instruction & Library (9 | 2.7%).
Management, Business, Science and Arts Occupations by Sex
Within the Management, Business, Science and Arts occupations in Red Cross, the most male-oriented occupations are Architecture & Engineering (100.0%), Management (81.2%), and Computers, Engineering & Science (40.0%), while the most female-oriented occupations are Life, Physical & Social Science (100.0%), Education, Arts & Media (100.0%), and Health Technologists (100.0%).
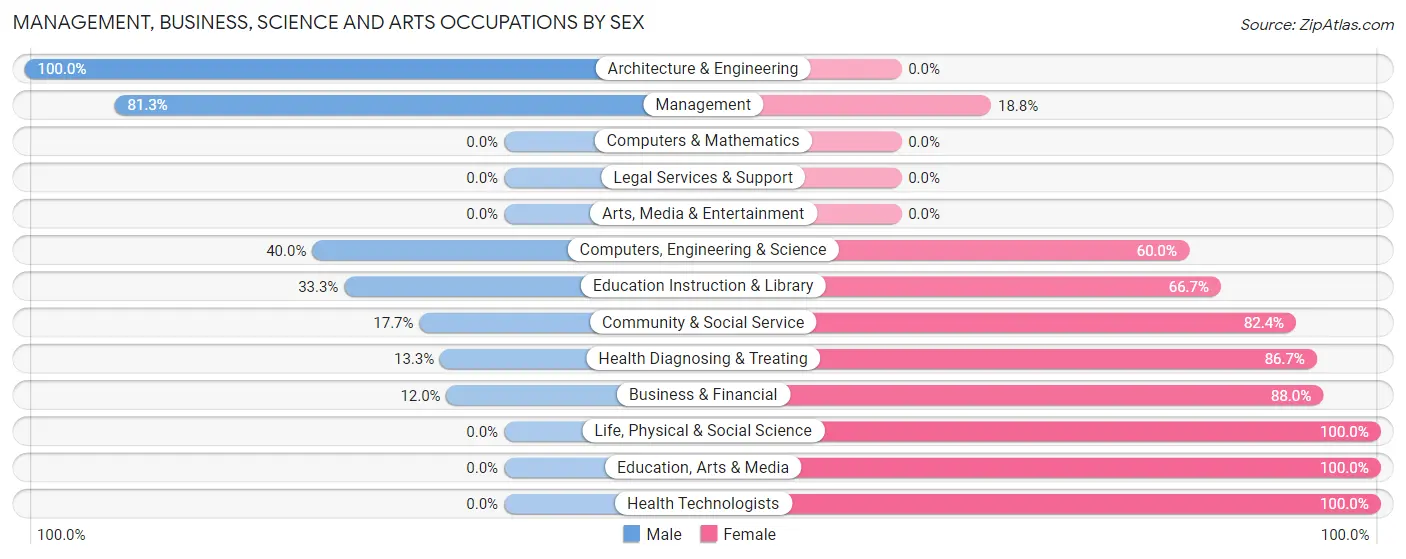
| Occupation | Male | Female |
| Management | 13 (81.2%) | 3 (18.8%) |
| Business & Financial | 3 (12.0%) | 22 (88.0%) |
| Computers, Engineering & Science | 2 (40.0%) | 3 (60.0%) |
| Computers & Mathematics | 0 (0.0%) | 0 (0.0%) |
| Architecture & Engineering | 2 (100.0%) | 0 (0.0%) |
| Life, Physical & Social Science | 0 (0.0%) | 3 (100.0%) |
| Community & Social Service | 3 (17.6%) | 14 (82.4%) |
| Education, Arts & Media | 0 (0.0%) | 8 (100.0%) |
| Legal Services & Support | 0 (0.0%) | 0 (0.0%) |
| Education Instruction & Library | 3 (33.3%) | 6 (66.7%) |
| Arts, Media & Entertainment | 0 (0.0%) | 0 (0.0%) |
| Health Diagnosing & Treating | 2 (13.3%) | 13 (86.7%) |
| Health Technologists | 0 (0.0%) | 5 (100.0%) |
| Total (Category) | 23 (29.5%) | 55 (70.5%) |
| Total (Overall) | 170 (51.2%) | 162 (48.8%) |
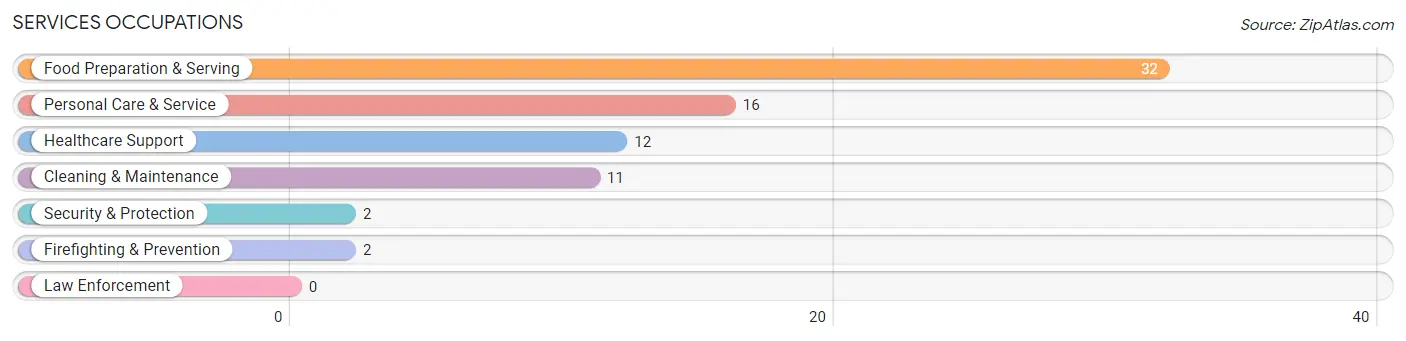
Services Occupations
The most common Services occupations in Red Cross are Food Preparation & Serving (32 | 9.6%), Personal Care & Service (16 | 4.8%), Healthcare Support (12 | 3.6%), Cleaning & Maintenance (11 | 3.3%), and Security & Protection (2 | 0.6%).
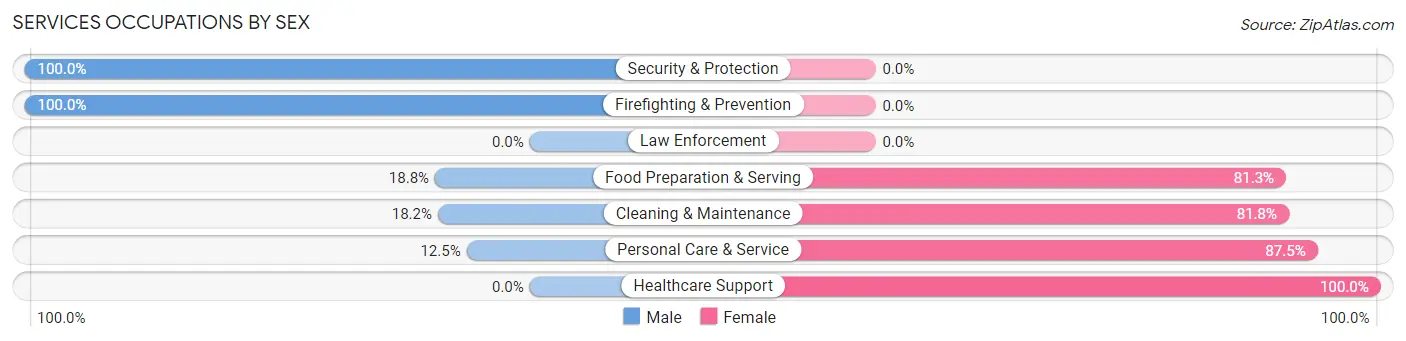
Services Occupations by Sex
Within the Services occupations in Red Cross, the most male-oriented occupations are Security & Protection (100.0%), Firefighting & Prevention (100.0%), and Food Preparation & Serving (18.8%), while the most female-oriented occupations are Healthcare Support (100.0%), Personal Care & Service (87.5%), and Cleaning & Maintenance (81.8%).
| Occupation | Male | Female |
| Healthcare Support | 0 (0.0%) | 12 (100.0%) |
| Security & Protection | 2 (100.0%) | 0 (0.0%) |
| Firefighting & Prevention | 2 (100.0%) | 0 (0.0%) |
| Law Enforcement | 0 (0.0%) | 0 (0.0%) |
| Food Preparation & Serving | 6 (18.8%) | 26 (81.2%) |
| Cleaning & Maintenance | 2 (18.2%) | 9 (81.8%) |
| Personal Care & Service | 2 (12.5%) | 14 (87.5%) |
| Total (Category) | 12 (16.4%) | 61 (83.6%) |
| Total (Overall) | 170 (51.2%) | 162 (48.8%) |
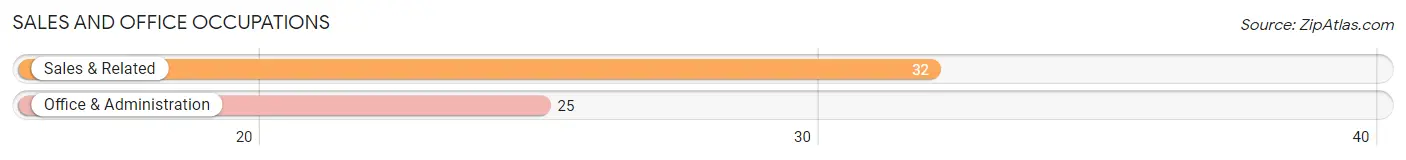
Sales and Office Occupations
The most common Sales and Office occupations in Red Cross are Sales & Related (32 | 9.6%), and Office & Administration (25 | 7.5%).
Sales and Office Occupations by Sex
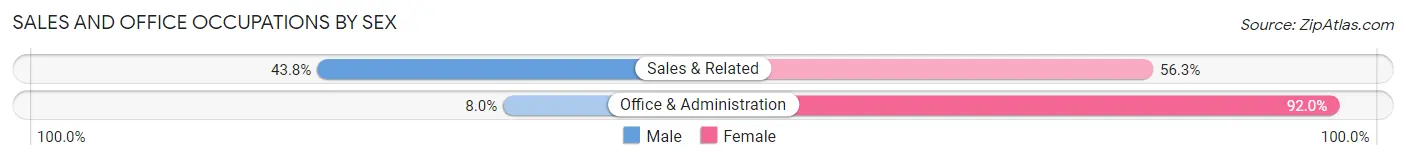
| Occupation | Male | Female |
| Sales & Related | 14 (43.8%) | 18 (56.2%) |
| Office & Administration | 2 (8.0%) | 23 (92.0%) |
| Total (Category) | 16 (28.1%) | 41 (71.9%) |
| Total (Overall) | 170 (51.2%) | 162 (48.8%) |
Natural Resources, Construction and Maintenance Occupations
The most common Natural Resources, Construction and Maintenance occupations in Red Cross are Construction & Extraction (25 | 7.5%), Farming, Fishing & Forestry (22 | 6.6%), and Installation, Maintenance & Repair (21 | 6.3%).
Natural Resources, Construction and Maintenance Occupations by Sex
| Occupation | Male | Female |
| Farming, Fishing & Forestry | 22 (100.0%) | 0 (0.0%) |
| Construction & Extraction | 25 (100.0%) | 0 (0.0%) |
| Installation, Maintenance & Repair | 21 (100.0%) | 0 (0.0%) |
| Total (Category) | 68 (100.0%) | 0 (0.0%) |
| Total (Overall) | 170 (51.2%) | 162 (48.8%) |
Production, Transportation and Moving Occupations
The most common Production, Transportation and Moving occupations in Red Cross are Production (39 | 11.7%), Transportation (11 | 3.3%), and Material Moving (6 | 1.8%).
Production, Transportation and Moving Occupations by Sex
| Occupation | Male | Female |
| Production | 39 (100.0%) | 0 (0.0%) |
| Transportation | 8 (72.7%) | 3 (27.3%) |
| Material Moving | 4 (66.7%) | 2 (33.3%) |
| Total (Category) | 51 (91.1%) | 5 (8.9%) |
| Total (Overall) | 170 (51.2%) | 162 (48.8%) |
Employment Industries by Sex in Red Cross
Employment Industries in Red Cross
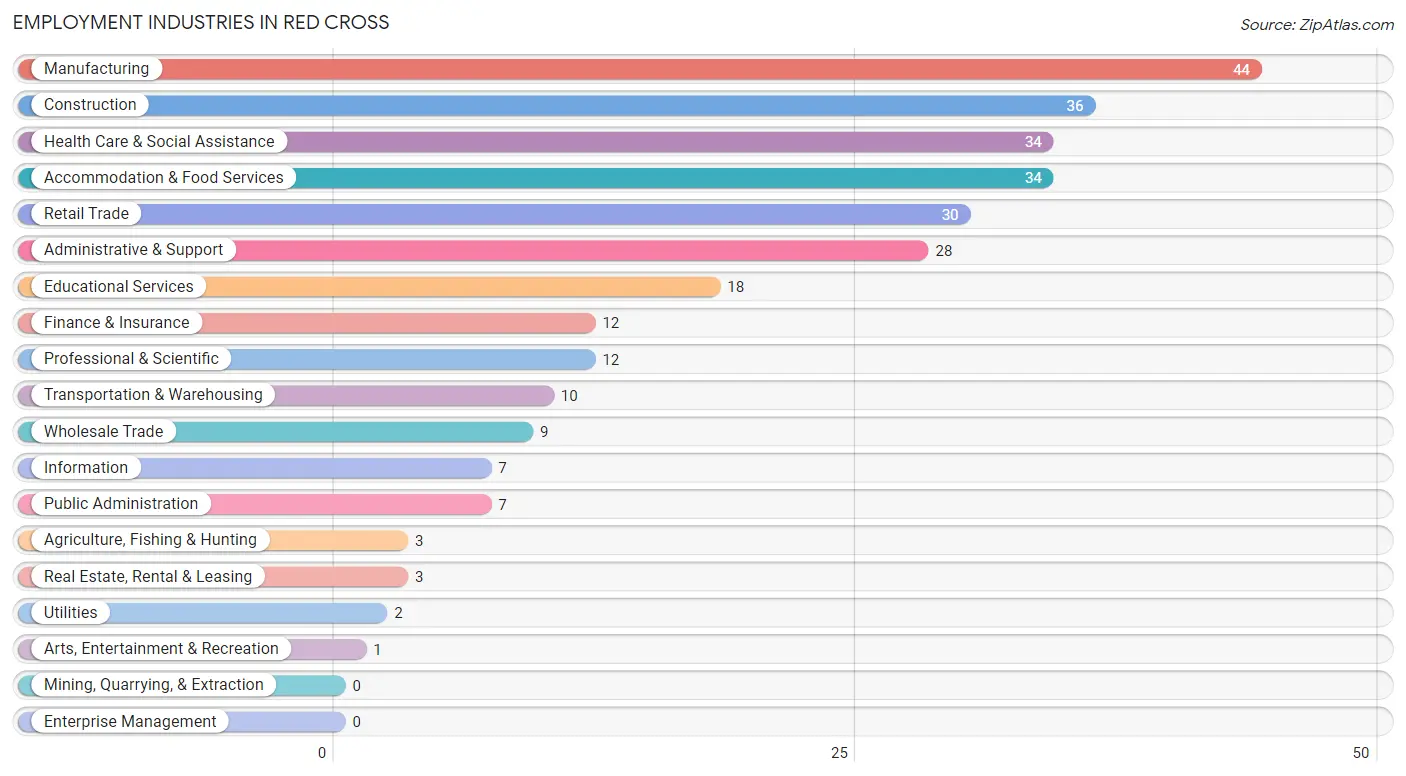
The major employment industries in Red Cross include Manufacturing (44 | 13.3%), Construction (36 | 10.8%), Health Care & Social Assistance (34 | 10.2%), Accommodation & Food Services (34 | 10.2%), and Retail Trade (30 | 9.0%).
Employment Industries by Sex in Red Cross
The Red Cross industries that see more men than women are Wholesale Trade (100.0%), Utilities (100.0%), and Real Estate, Rental & Leasing (100.0%), whereas the industries that tend to have a higher number of women are Agriculture, Fishing & Hunting (100.0%), Health Care & Social Assistance (100.0%), and Professional & Scientific (91.7%).
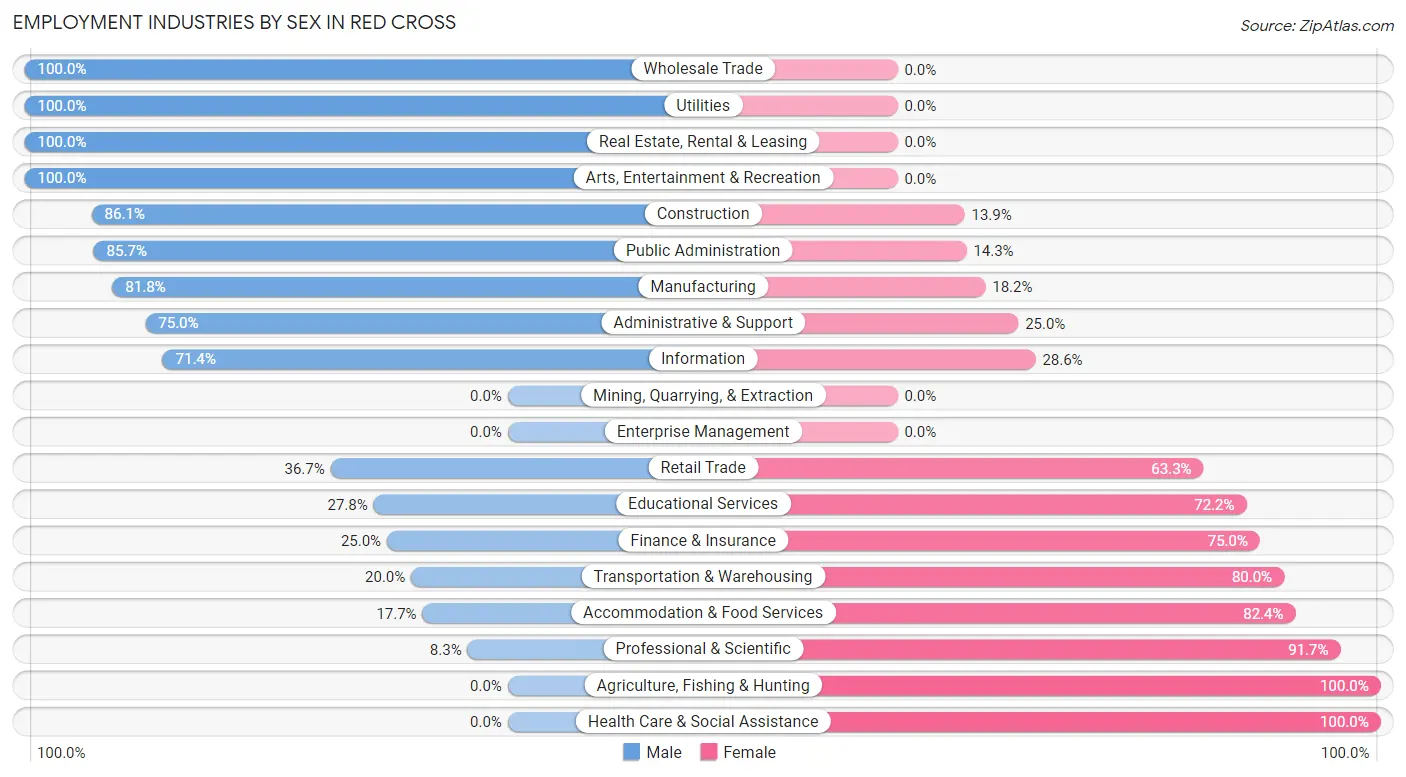
| Industry | Male | Female |
| Agriculture, Fishing & Hunting | 0 (0.0%) | 3 (100.0%) |
| Mining, Quarrying, & Extraction | 0 (0.0%) | 0 (0.0%) |
| Construction | 31 (86.1%) | 5 (13.9%) |
| Manufacturing | 36 (81.8%) | 8 (18.2%) |
| Wholesale Trade | 9 (100.0%) | 0 (0.0%) |
| Retail Trade | 11 (36.7%) | 19 (63.3%) |
| Transportation & Warehousing | 2 (20.0%) | 8 (80.0%) |
| Utilities | 2 (100.0%) | 0 (0.0%) |
| Information | 5 (71.4%) | 2 (28.6%) |
| Finance & Insurance | 3 (25.0%) | 9 (75.0%) |
| Real Estate, Rental & Leasing | 3 (100.0%) | 0 (0.0%) |
| Professional & Scientific | 1 (8.3%) | 11 (91.7%) |
| Enterprise Management | 0 (0.0%) | 0 (0.0%) |
| Administrative & Support | 21 (75.0%) | 7 (25.0%) |
| Educational Services | 5 (27.8%) | 13 (72.2%) |
| Health Care & Social Assistance | 0 (0.0%) | 34 (100.0%) |
| Arts, Entertainment & Recreation | 1 (100.0%) | 0 (0.0%) |
| Accommodation & Food Services | 6 (17.6%) | 28 (82.4%) |
| Public Administration | 6 (85.7%) | 1 (14.3%) |
| Total | 170 (51.2%) | 162 (48.8%) |
Education in Red Cross
School Enrollment in Red Cross
The most common levels of schooling among the 127 students in Red Cross are high school (54 | 42.5%), college / undergraduate (27 | 21.3%), and middle school (22 | 17.3%).

| School Level | # Students | % Students |
| Nursery / Preschool | 7 | 5.5% |
| Kindergarten | 3 | 2.4% |
| Elementary School | 12 | 9.5% |
| Middle School | 22 | 17.3% |
| High School | 54 | 42.5% |
| College / Undergraduate | 27 | 21.3% |
| Graduate / Professional | 2 | 1.6% |
| Total | 127 | 100.0% |
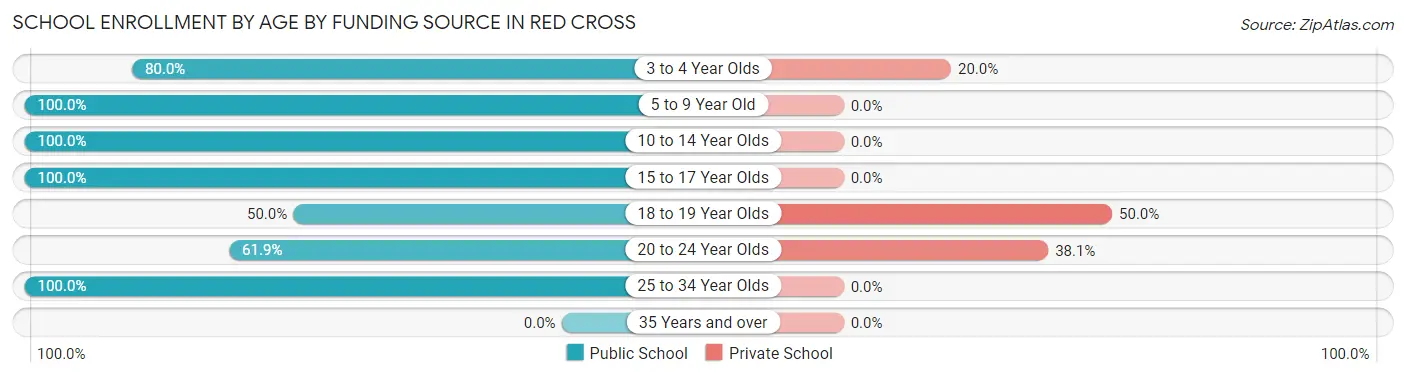
School Enrollment by Age by Funding Source in Red Cross
Out of a total of 127 students who are enrolled in schools in Red Cross, 11 (8.7%) attend a private institution, while the remaining 116 (91.3%) are enrolled in public schools. The age group of 18 to 19 year olds has the highest likelihood of being enrolled in private schools, with 2 (50.0% in the age bracket) enrolled. Conversely, the age group of 5 to 9 year old has the lowest likelihood of being enrolled in a private school, with 17 (100.0% in the age bracket) attending a public institution.
| Age Bracket | Public School | Private School |
| 3 to 4 Year Olds | 4 (80.0%) | 1 (20.0%) |
| 5 to 9 Year Old | 17 (100.0%) | 0 (0.0%) |
| 10 to 14 Year Olds | 24 (100.0%) | 0 (0.0%) |
| 15 to 17 Year Olds | 52 (100.0%) | 0 (0.0%) |
| 18 to 19 Year Olds | 2 (50.0%) | 2 (50.0%) |
| 20 to 24 Year Olds | 13 (61.9%) | 8 (38.1%) |
| 25 to 34 Year Olds | 4 (100.0%) | 0 (0.0%) |
| 35 Years and over | 0 (0.0%) | 0 (0.0%) |
| Total | 116 (91.3%) | 11 (8.7%) |
Educational Attainment by Field of Study in Red Cross
Business (12 | 21.8%), education (12 | 21.8%), bio, nature & agricultural (10 | 18.2%), science & technology (6 | 10.9%), and social sciences (4 | 7.3%) are the most common fields of study among 55 individuals in Red Cross who have obtained a bachelor's degree or higher.
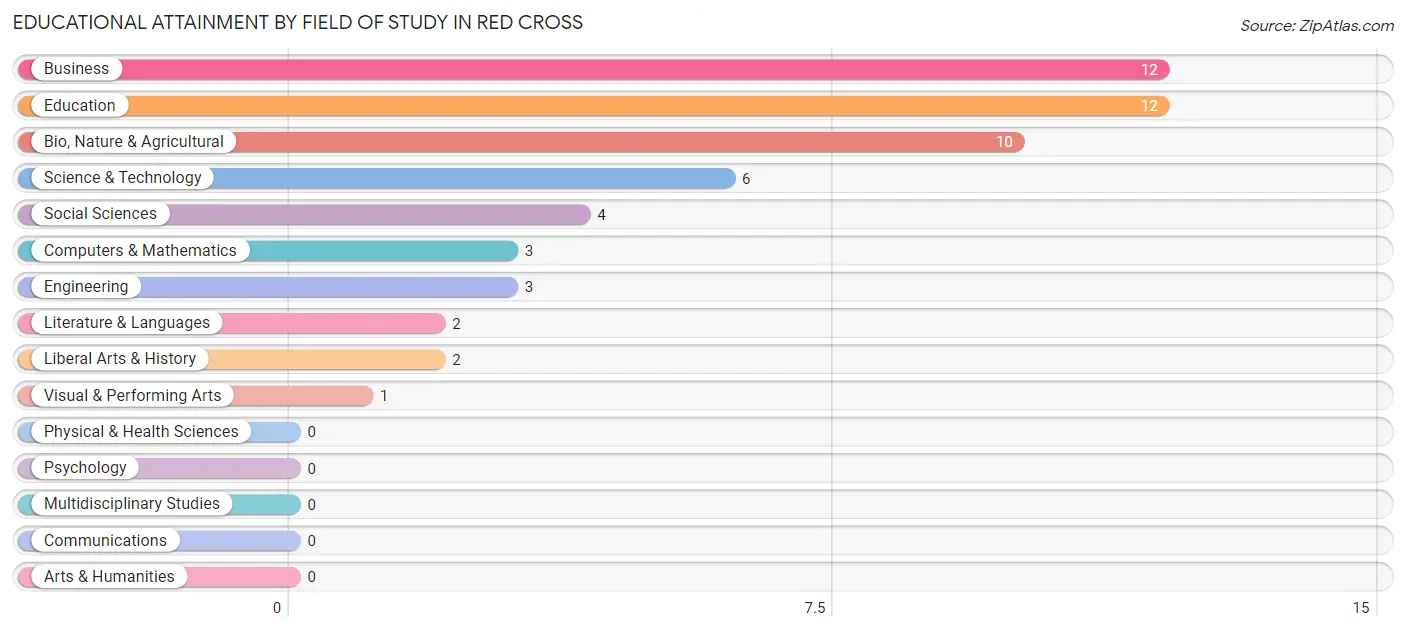
| Field of Study | # Graduates | % Graduates |
| Computers & Mathematics | 3 | 5.4% |
| Bio, Nature & Agricultural | 10 | 18.2% |
| Physical & Health Sciences | 0 | 0.0% |
| Psychology | 0 | 0.0% |
| Social Sciences | 4 | 7.3% |
| Engineering | 3 | 5.4% |
| Multidisciplinary Studies | 0 | 0.0% |
| Science & Technology | 6 | 10.9% |
| Business | 12 | 21.8% |
| Education | 12 | 21.8% |
| Literature & Languages | 2 | 3.6% |
| Liberal Arts & History | 2 | 3.6% |
| Visual & Performing Arts | 1 | 1.8% |
| Communications | 0 | 0.0% |
| Arts & Humanities | 0 | 0.0% |
| Total | 55 | 100.0% |
Transportation & Commute in Red Cross
Vehicle Availability by Sex in Red Cross
The most prevalent vehicle ownership categories in Red Cross are males with 2 vehicles (51, accounting for 30.0%) and females with 2 vehicles (36, making up 33.1%).
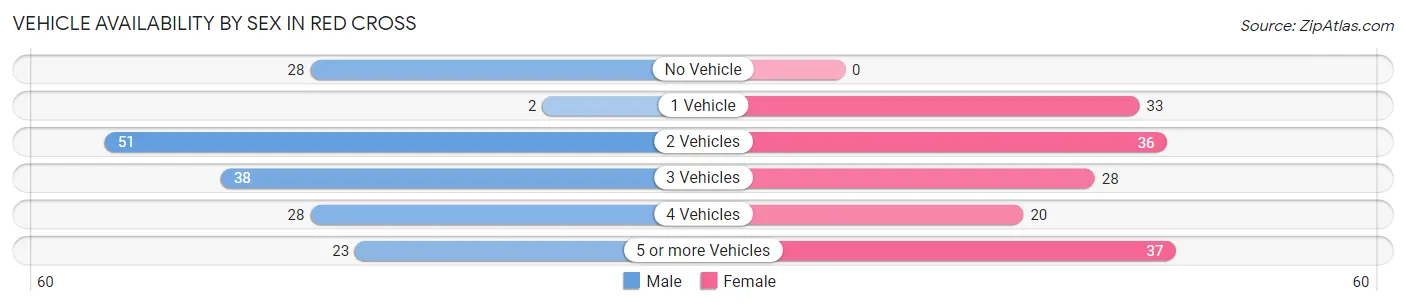
| Vehicles Available | Male | Female |
| No Vehicle | 28 (16.5%) | 0 (0.0%) |
| 1 Vehicle | 2 (1.2%) | 33 (21.4%) |
| 2 Vehicles | 51 (30.0%) | 36 (23.4%) |
| 3 Vehicles | 38 (22.4%) | 28 (18.2%) |
| 4 Vehicles | 28 (16.5%) | 20 (13.0%) |
| 5 or more Vehicles | 23 (13.5%) | 37 (24.0%) |
| Total | 170 (100.0%) | 154 (100.0%) |
Commute Time in Red Cross
The most frequently occuring commute durations in Red Cross are 20 to 24 minutes (56 commuters, 18.4%), 5 to 9 minutes (52 commuters, 17.1%), and 45 to 59 minutes (52 commuters, 17.1%).
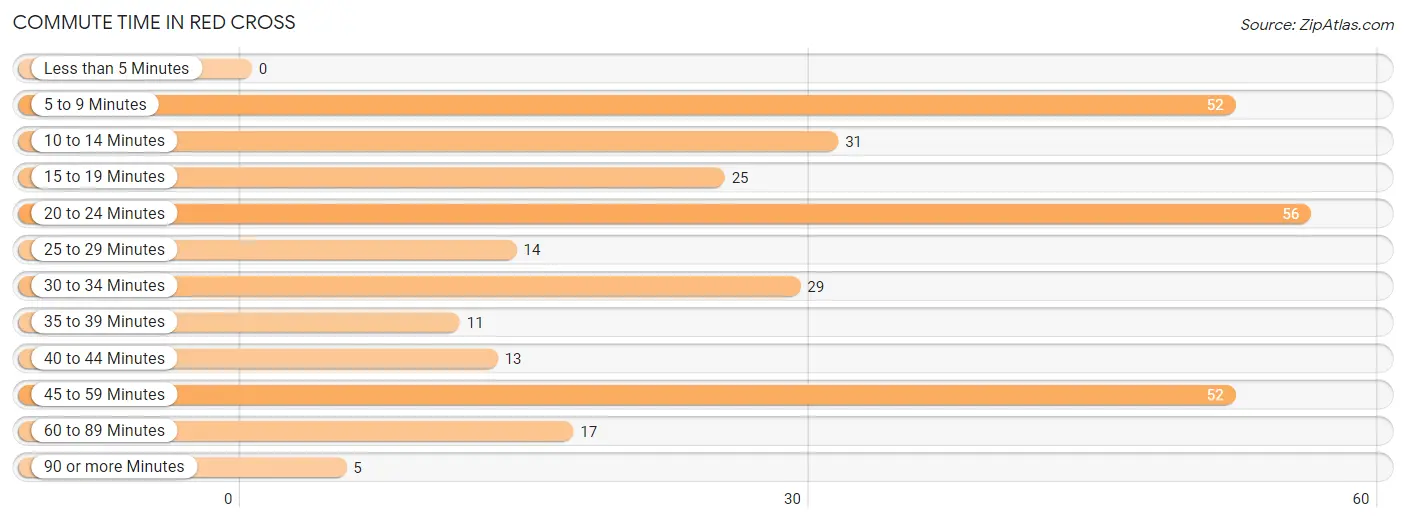
| Commute Time | # Commuters | % Commuters |
| Less than 5 Minutes | 0 | 0.0% |
| 5 to 9 Minutes | 52 | 17.1% |
| 10 to 14 Minutes | 31 | 10.2% |
| 15 to 19 Minutes | 25 | 8.2% |
| 20 to 24 Minutes | 56 | 18.4% |
| 25 to 29 Minutes | 14 | 4.6% |
| 30 to 34 Minutes | 29 | 9.5% |
| 35 to 39 Minutes | 11 | 3.6% |
| 40 to 44 Minutes | 13 | 4.3% |
| 45 to 59 Minutes | 52 | 17.1% |
| 60 to 89 Minutes | 17 | 5.6% |
| 90 or more Minutes | 5 | 1.6% |
Commute Time by Sex in Red Cross
The most common commute times in Red Cross are 5 to 9 minutes (34 commuters, 21.0%) for males and 20 to 24 minutes (42 commuters, 29.4%) for females.
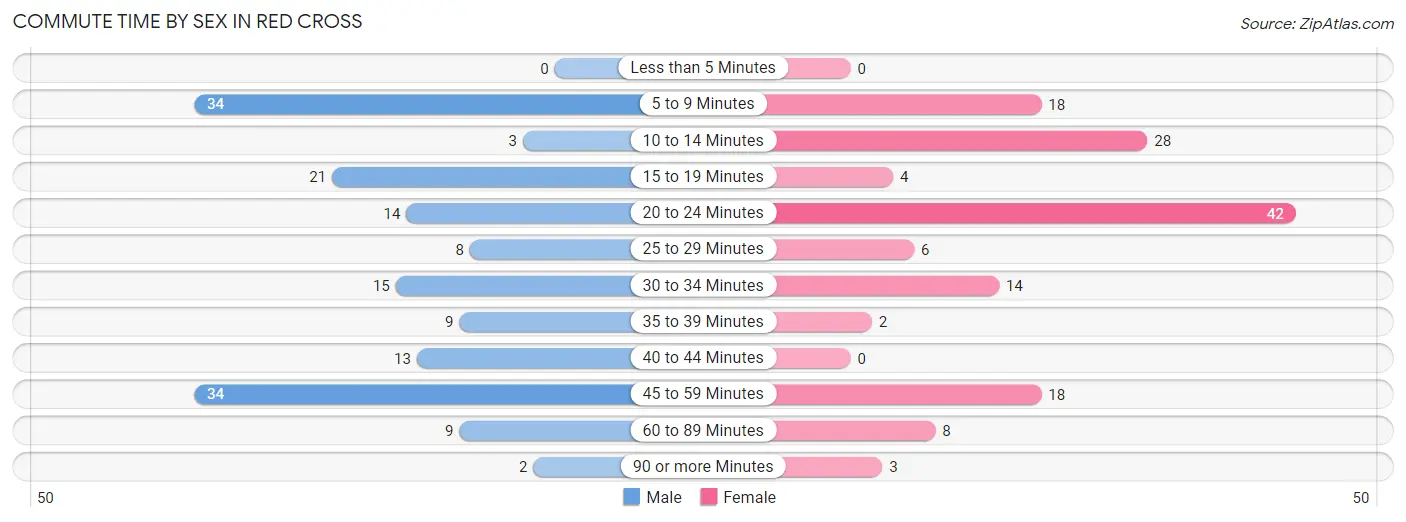
| Commute Time | Male | Female |
| Less than 5 Minutes | 0 (0.0%) | 0 (0.0%) |
| 5 to 9 Minutes | 34 (21.0%) | 18 (12.6%) |
| 10 to 14 Minutes | 3 (1.8%) | 28 (19.6%) |
| 15 to 19 Minutes | 21 (13.0%) | 4 (2.8%) |
| 20 to 24 Minutes | 14 (8.6%) | 42 (29.4%) |
| 25 to 29 Minutes | 8 (4.9%) | 6 (4.2%) |
| 30 to 34 Minutes | 15 (9.3%) | 14 (9.8%) |
| 35 to 39 Minutes | 9 (5.6%) | 2 (1.4%) |
| 40 to 44 Minutes | 13 (8.0%) | 0 (0.0%) |
| 45 to 59 Minutes | 34 (21.0%) | 18 (12.6%) |
| 60 to 89 Minutes | 9 (5.6%) | 8 (5.6%) |
| 90 or more Minutes | 2 (1.2%) | 3 (2.1%) |
Time of Departure to Work by Sex in Red Cross
The most frequent times of departure to work in Red Cross are 6:30 AM to 6:59 AM (53, 32.7%) for males and 7:30 AM to 7:59 AM (38, 26.6%) for females.
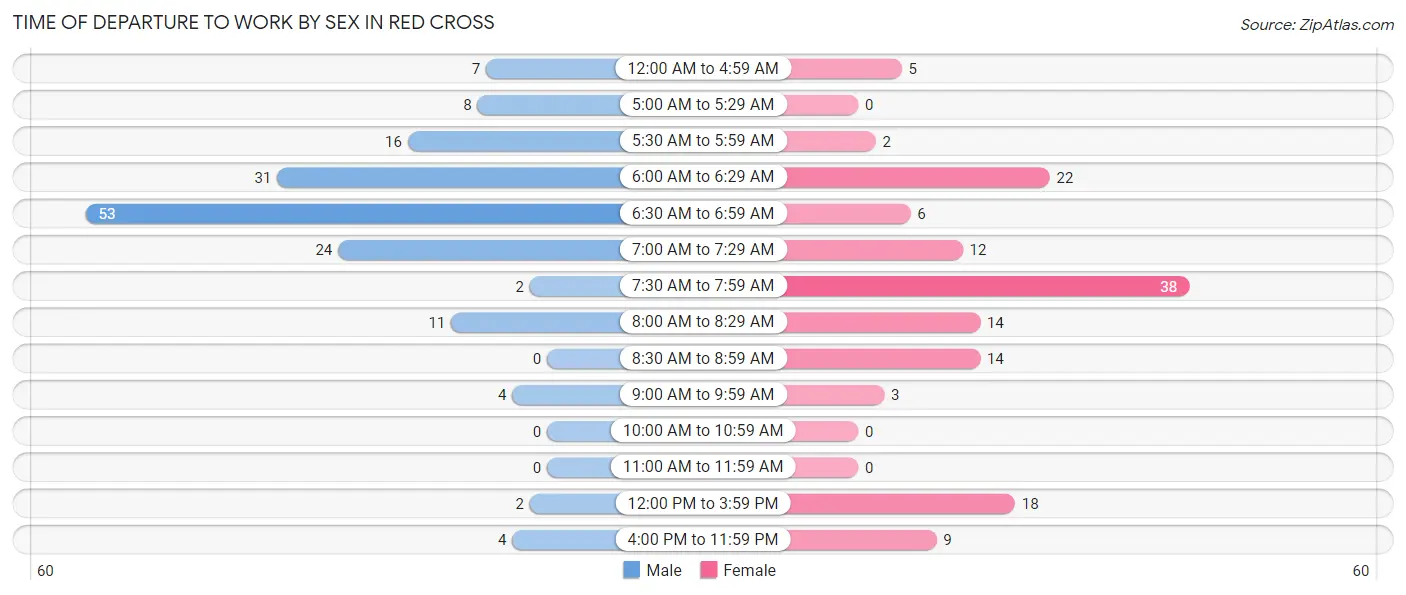
| Time of Departure | Male | Female |
| 12:00 AM to 4:59 AM | 7 (4.3%) | 5 (3.5%) |
| 5:00 AM to 5:29 AM | 8 (4.9%) | 0 (0.0%) |
| 5:30 AM to 5:59 AM | 16 (9.9%) | 2 (1.4%) |
| 6:00 AM to 6:29 AM | 31 (19.1%) | 22 (15.4%) |
| 6:30 AM to 6:59 AM | 53 (32.7%) | 6 (4.2%) |
| 7:00 AM to 7:29 AM | 24 (14.8%) | 12 (8.4%) |
| 7:30 AM to 7:59 AM | 2 (1.2%) | 38 (26.6%) |
| 8:00 AM to 8:29 AM | 11 (6.8%) | 14 (9.8%) |
| 8:30 AM to 8:59 AM | 0 (0.0%) | 14 (9.8%) |
| 9:00 AM to 9:59 AM | 4 (2.5%) | 3 (2.1%) |
| 10:00 AM to 10:59 AM | 0 (0.0%) | 0 (0.0%) |
| 11:00 AM to 11:59 AM | 0 (0.0%) | 0 (0.0%) |
| 12:00 PM to 3:59 PM | 2 (1.2%) | 18 (12.6%) |
| 4:00 PM to 11:59 PM | 4 (2.5%) | 9 (6.3%) |
| Total | 162 (100.0%) | 143 (100.0%) |
Housing Occupancy in Red Cross
Occupancy by Ownership in Red Cross
Of the total 304 dwellings in Red Cross, owner-occupied units account for 222 (73.0%), while renter-occupied units make up 82 (27.0%).
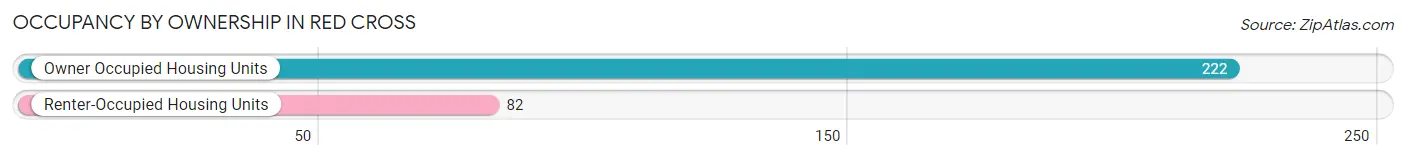
| Occupancy | # Housing Units | % Housing Units |
| Owner Occupied Housing Units | 222 | 73.0% |
| Renter-Occupied Housing Units | 82 | 27.0% |
| Total Occupied Housing Units | 304 | 100.0% |
Occupancy by Household Size in Red Cross
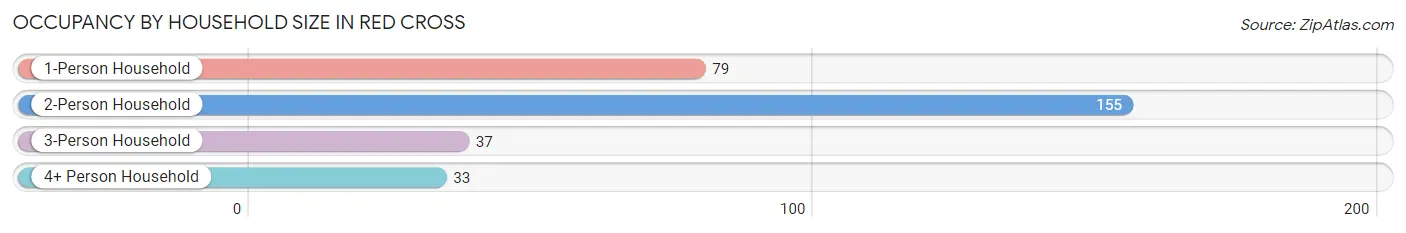
| Household Size | # Housing Units | % Housing Units |
| 1-Person Household | 79 | 26.0% |
| 2-Person Household | 155 | 51.0% |
| 3-Person Household | 37 | 12.2% |
| 4+ Person Household | 33 | 10.9% |
| Total Housing Units | 304 | 100.0% |
Occupancy by Ownership by Household Size in Red Cross
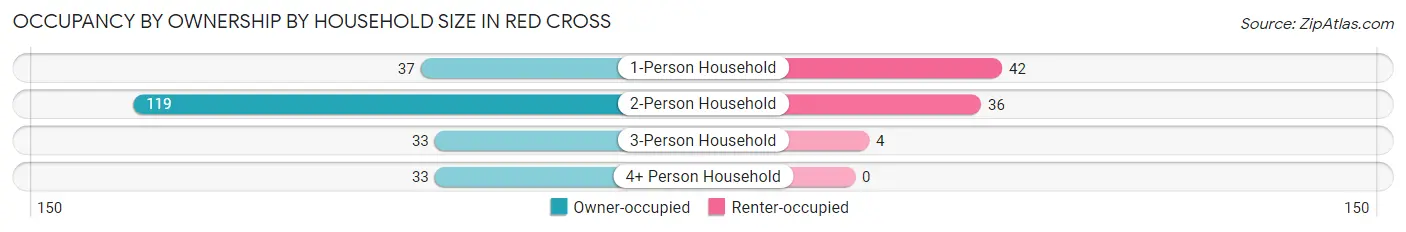
| Household Size | Owner-occupied | Renter-occupied |
| 1-Person Household | 37 (46.8%) | 42 (53.2%) |
| 2-Person Household | 119 (76.8%) | 36 (23.2%) |
| 3-Person Household | 33 (89.2%) | 4 (10.8%) |
| 4+ Person Household | 33 (100.0%) | 0 (0.0%) |
| Total Housing Units | 222 (73.0%) | 82 (27.0%) |
Occupancy by Educational Attainment in Red Cross
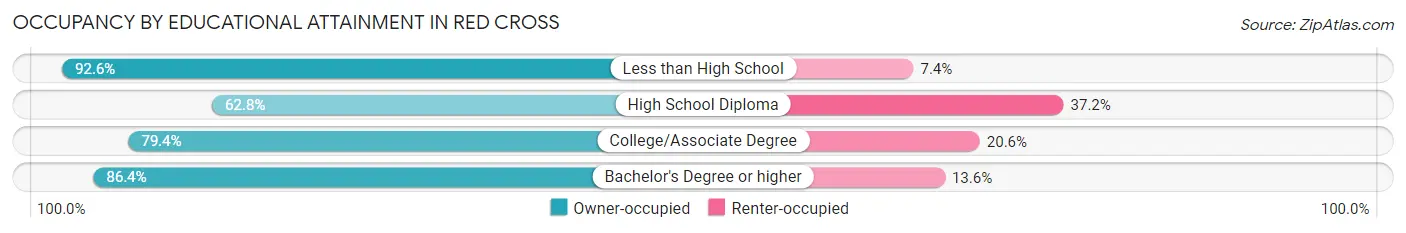
| Household Size | Owner-occupied | Renter-occupied |
| Less than High School | 25 (92.6%) | 2 (7.4%) |
| High School Diploma | 93 (62.8%) | 55 (37.2%) |
| College/Associate Degree | 85 (79.4%) | 22 (20.6%) |
| Bachelor's Degree or higher | 19 (86.4%) | 3 (13.6%) |
Occupancy by Age of Householder in Red Cross
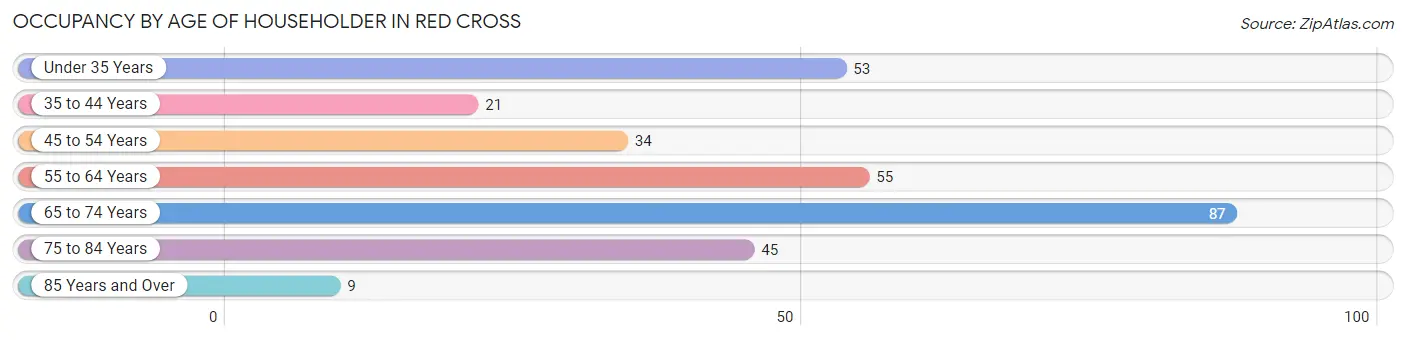
| Age Bracket | # Households | % Households |
| Under 35 Years | 53 | 17.4% |
| 35 to 44 Years | 21 | 6.9% |
| 45 to 54 Years | 34 | 11.2% |
| 55 to 64 Years | 55 | 18.1% |
| 65 to 74 Years | 87 | 28.6% |
| 75 to 84 Years | 45 | 14.8% |
| 85 Years and Over | 9 | 3.0% |
| Total | 304 | 100.0% |
Housing Finances in Red Cross
Median Income by Occupancy in Red Cross
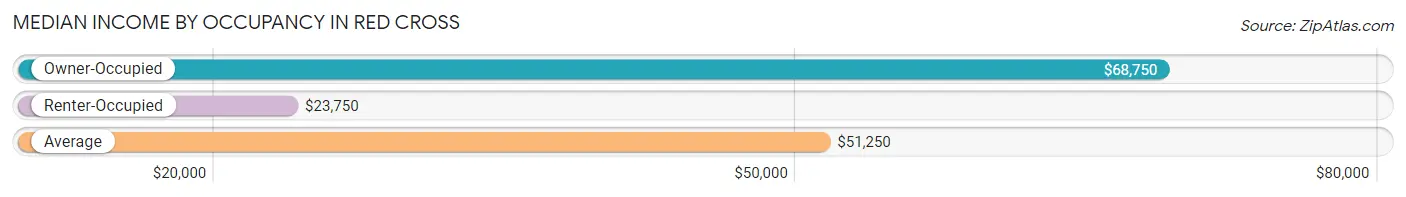
| Occupancy Type | # Households | Median Income |
| Owner-Occupied | 222 (73.0%) | $68,750 |
| Renter-Occupied | 82 (27.0%) | $23,750 |
| Average | 304 (100.0%) | $51,250 |
Occupancy by Householder Income Bracket in Red Cross
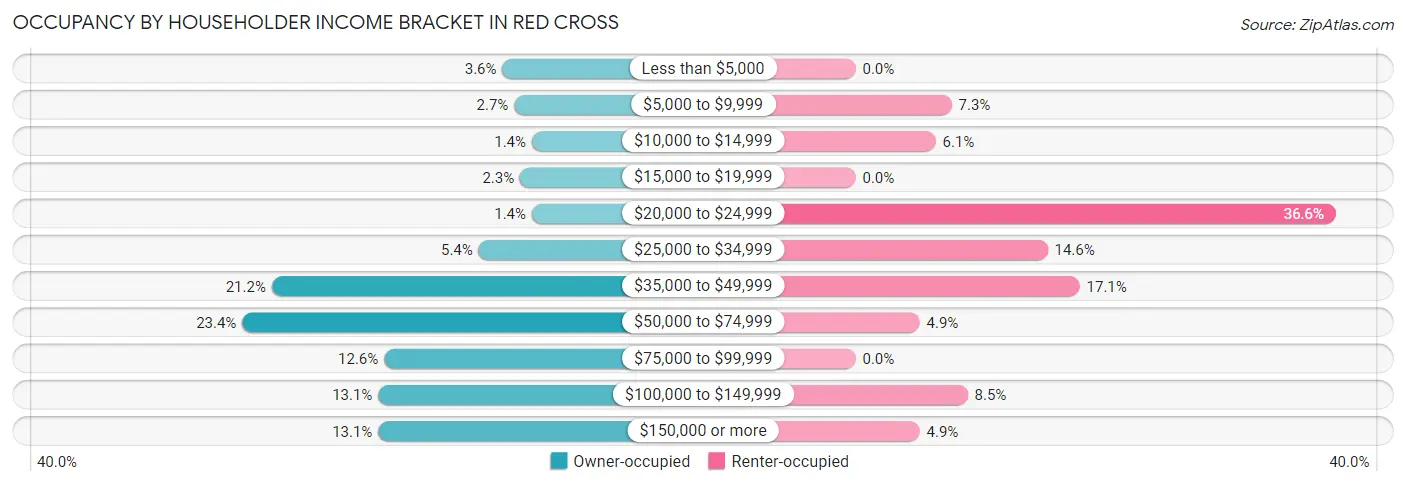
| Income Bracket | Owner-occupied | Renter-occupied |
| Less than $5,000 | 8 (3.6%) | 0 (0.0%) |
| $5,000 to $9,999 | 6 (2.7%) | 6 (7.3%) |
| $10,000 to $14,999 | 3 (1.3%) | 5 (6.1%) |
| $15,000 to $19,999 | 5 (2.2%) | 0 (0.0%) |
| $20,000 to $24,999 | 3 (1.3%) | 30 (36.6%) |
| $25,000 to $34,999 | 12 (5.4%) | 12 (14.6%) |
| $35,000 to $49,999 | 47 (21.2%) | 14 (17.1%) |
| $50,000 to $74,999 | 52 (23.4%) | 4 (4.9%) |
| $75,000 to $99,999 | 28 (12.6%) | 0 (0.0%) |
| $100,000 to $149,999 | 29 (13.1%) | 7 (8.5%) |
| $150,000 or more | 29 (13.1%) | 4 (4.9%) |
| Total | 222 (100.0%) | 82 (100.0%) |
Monthly Housing Cost Tiers in Red Cross
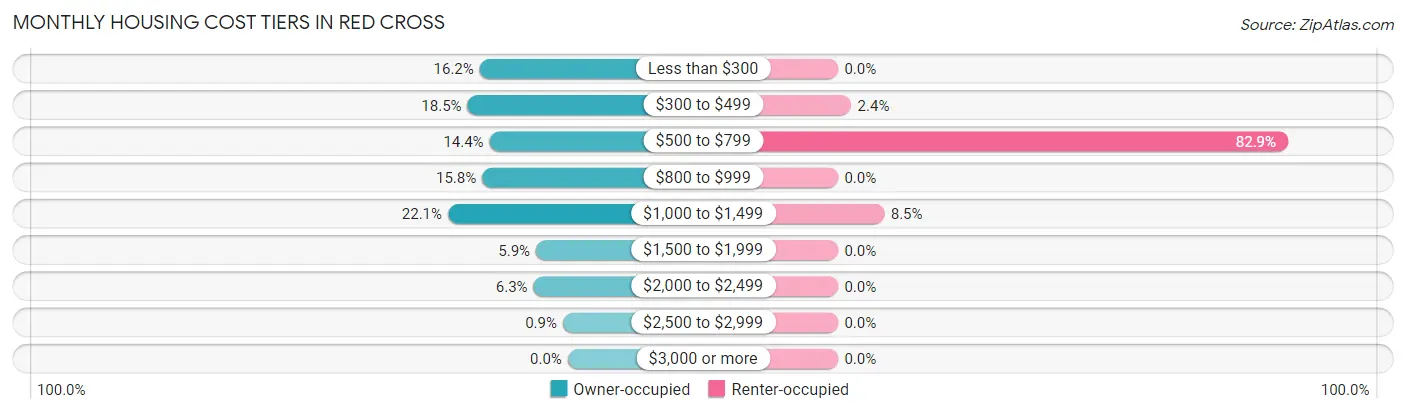
| Monthly Cost | Owner-occupied | Renter-occupied |
| Less than $300 | 36 (16.2%) | 0 (0.0%) |
| $300 to $499 | 41 (18.5%) | 2 (2.4%) |
| $500 to $799 | 32 (14.4%) | 68 (82.9%) |
| $800 to $999 | 35 (15.8%) | 0 (0.0%) |
| $1,000 to $1,499 | 49 (22.1%) | 7 (8.5%) |
| $1,500 to $1,999 | 13 (5.9%) | 0 (0.0%) |
| $2,000 to $2,499 | 14 (6.3%) | 0 (0.0%) |
| $2,500 to $2,999 | 2 (0.9%) | 0 (0.0%) |
| $3,000 or more | 0 (0.0%) | 0 (0.0%) |
| Total | 222 (100.0%) | 82 (100.0%) |
Physical Housing Characteristics in Red Cross
Housing Structures in Red Cross
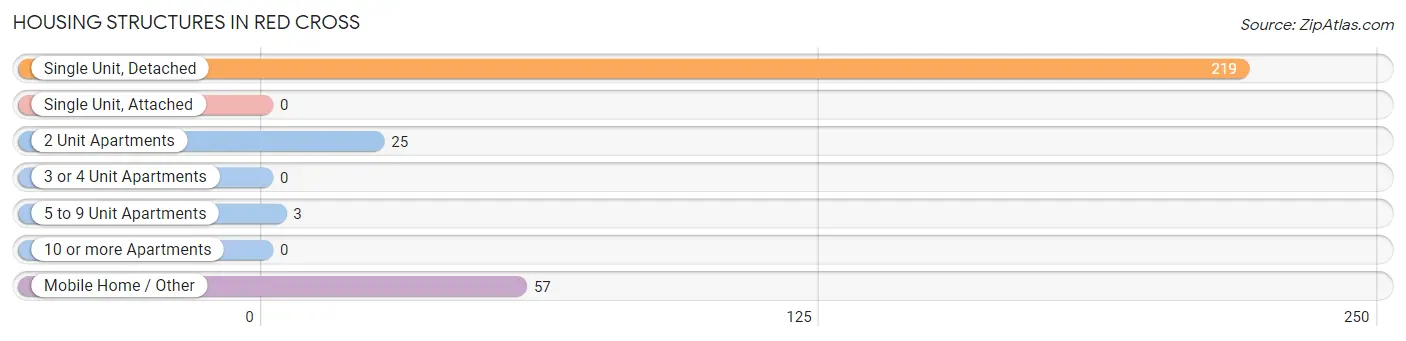
| Structure Type | # Housing Units | % Housing Units |
| Single Unit, Detached | 219 | 72.0% |
| Single Unit, Attached | 0 | 0.0% |
| 2 Unit Apartments | 25 | 8.2% |
| 3 or 4 Unit Apartments | 0 | 0.0% |
| 5 to 9 Unit Apartments | 3 | 1.0% |
| 10 or more Apartments | 0 | 0.0% |
| Mobile Home / Other | 57 | 18.8% |
| Total | 304 | 100.0% |
Housing Structures by Occupancy in Red Cross
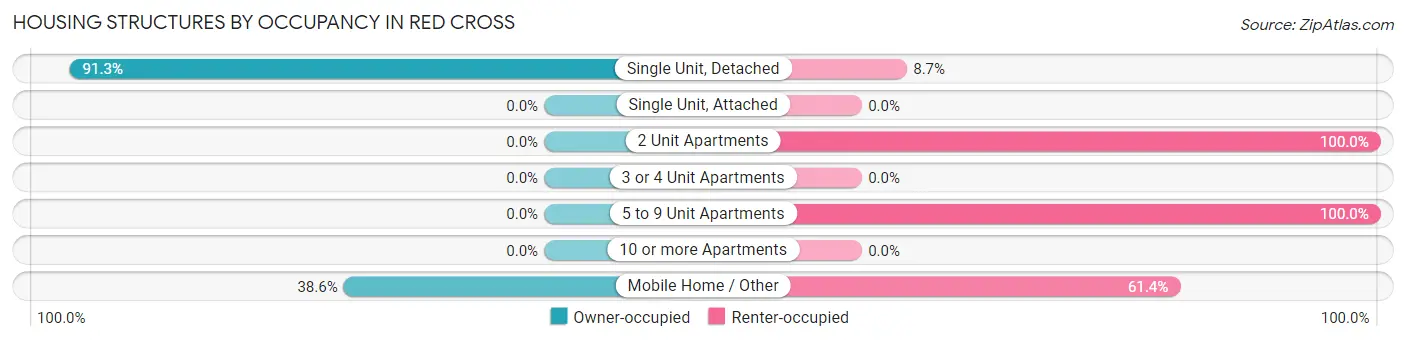
| Structure Type | Owner-occupied | Renter-occupied |
| Single Unit, Detached | 200 (91.3%) | 19 (8.7%) |
| Single Unit, Attached | 0 (0.0%) | 0 (0.0%) |
| 2 Unit Apartments | 0 (0.0%) | 25 (100.0%) |
| 3 or 4 Unit Apartments | 0 (0.0%) | 0 (0.0%) |
| 5 to 9 Unit Apartments | 0 (0.0%) | 3 (100.0%) |
| 10 or more Apartments | 0 (0.0%) | 0 (0.0%) |
| Mobile Home / Other | 22 (38.6%) | 35 (61.4%) |
| Total | 222 (73.0%) | 82 (27.0%) |
Housing Structures by Number of Rooms in Red Cross
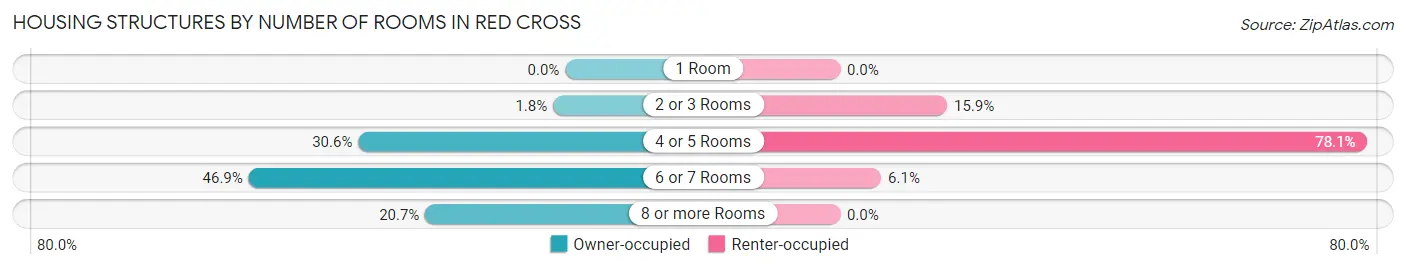
| Number of Rooms | Owner-occupied | Renter-occupied |
| 1 Room | 0 (0.0%) | 0 (0.0%) |
| 2 or 3 Rooms | 4 (1.8%) | 13 (15.9%) |
| 4 or 5 Rooms | 68 (30.6%) | 64 (78.0%) |
| 6 or 7 Rooms | 104 (46.9%) | 5 (6.1%) |
| 8 or more Rooms | 46 (20.7%) | 0 (0.0%) |
| Total | 222 (100.0%) | 82 (100.0%) |
Housing Structure by Heating Type in Red Cross
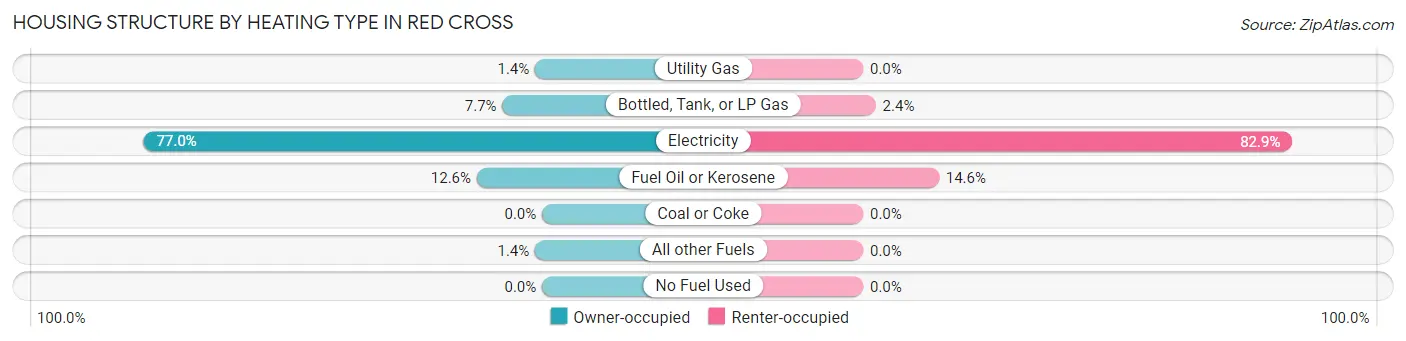
| Heating Type | Owner-occupied | Renter-occupied |
| Utility Gas | 3 (1.3%) | 0 (0.0%) |
| Bottled, Tank, or LP Gas | 17 (7.7%) | 2 (2.4%) |
| Electricity | 171 (77.0%) | 68 (82.9%) |
| Fuel Oil or Kerosene | 28 (12.6%) | 12 (14.6%) |
| Coal or Coke | 0 (0.0%) | 0 (0.0%) |
| All other Fuels | 3 (1.3%) | 0 (0.0%) |
| No Fuel Used | 0 (0.0%) | 0 (0.0%) |
| Total | 222 (100.0%) | 82 (100.0%) |
Household Vehicle Usage in Red Cross
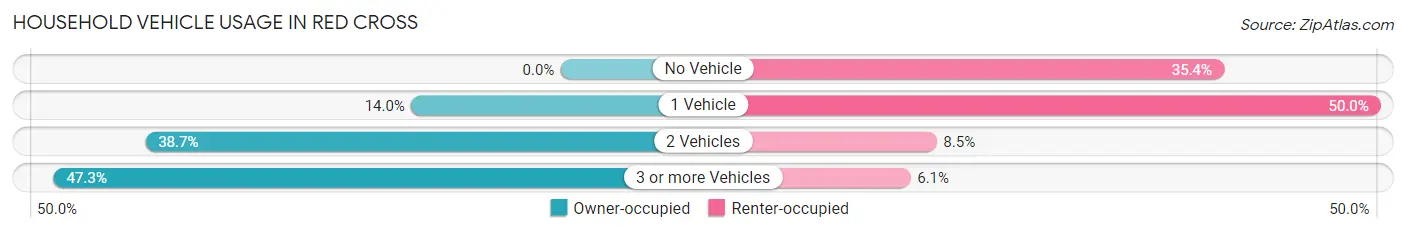
| Vehicles per Household | Owner-occupied | Renter-occupied |
| No Vehicle | 0 (0.0%) | 29 (35.4%) |
| 1 Vehicle | 31 (14.0%) | 41 (50.0%) |
| 2 Vehicles | 86 (38.7%) | 7 (8.5%) |
| 3 or more Vehicles | 105 (47.3%) | 5 (6.1%) |
| Total | 222 (100.0%) | 82 (100.0%) |
Real Estate & Mortgages in Red Cross
Real Estate and Mortgage Overview in Red Cross
| Characteristic | Without Mortgage | With Mortgage |
| Housing Units | 115 | 107 |
| Median Property Value | $197,500 | $199,100 |
| Median Household Income | $49,712 | $20 |
| Monthly Housing Costs | $379 | $0 |
| Real Estate Taxes | $1,280 | $7 |
Property Value by Mortgage Status in Red Cross
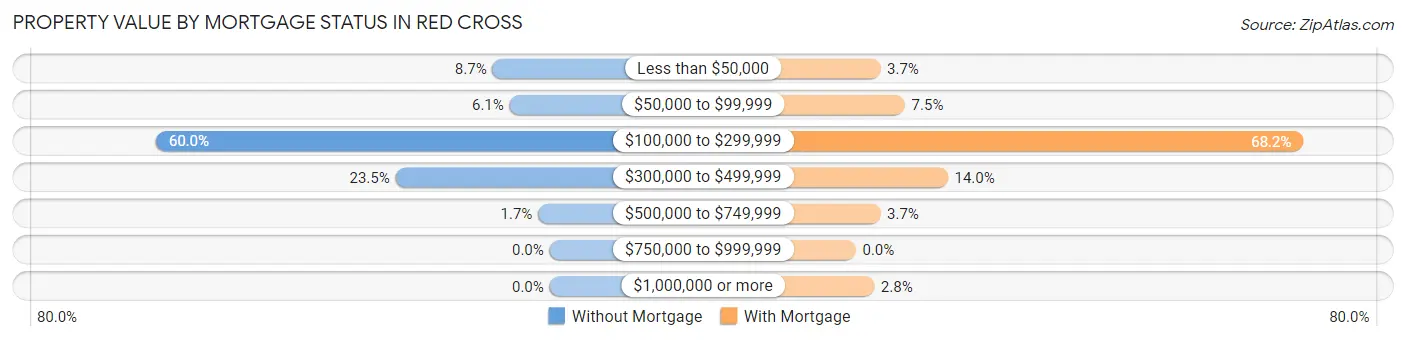
| Property Value | Without Mortgage | With Mortgage |
| Less than $50,000 | 10 (8.7%) | 4 (3.7%) |
| $50,000 to $99,999 | 7 (6.1%) | 8 (7.5%) |
| $100,000 to $299,999 | 69 (60.0%) | 73 (68.2%) |
| $300,000 to $499,999 | 27 (23.5%) | 15 (14.0%) |
| $500,000 to $749,999 | 2 (1.7%) | 4 (3.7%) |
| $750,000 to $999,999 | 0 (0.0%) | 0 (0.0%) |
| $1,000,000 or more | 0 (0.0%) | 3 (2.8%) |
| Total | 115 (100.0%) | 107 (100.0%) |
Household Income by Mortgage Status in Red Cross
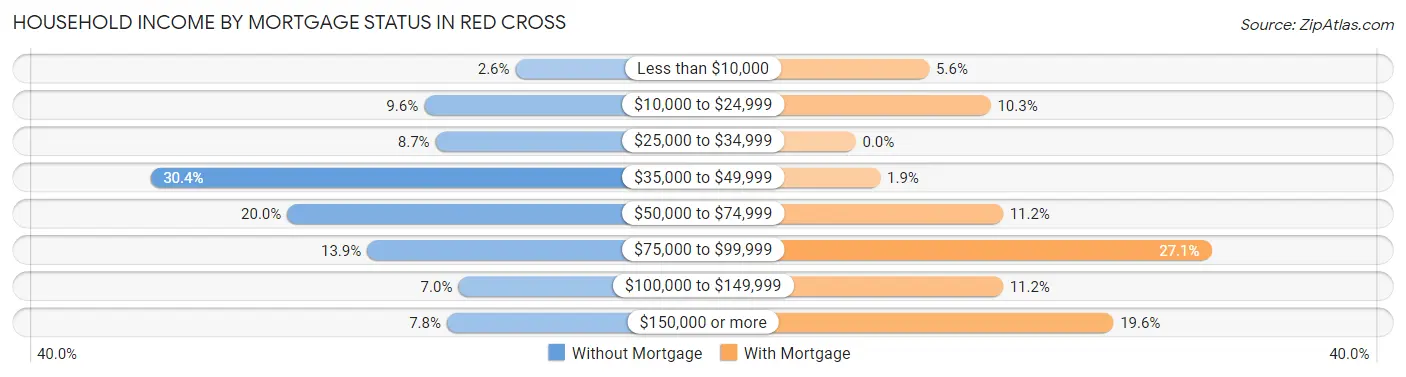
| Household Income | Without Mortgage | With Mortgage |
| Less than $10,000 | 3 (2.6%) | 6 (5.6%) |
| $10,000 to $24,999 | 11 (9.6%) | 11 (10.3%) |
| $25,000 to $34,999 | 10 (8.7%) | 0 (0.0%) |
| $35,000 to $49,999 | 35 (30.4%) | 2 (1.9%) |
| $50,000 to $74,999 | 23 (20.0%) | 12 (11.2%) |
| $75,000 to $99,999 | 16 (13.9%) | 29 (27.1%) |
| $100,000 to $149,999 | 8 (7.0%) | 12 (11.2%) |
| $150,000 or more | 9 (7.8%) | 21 (19.6%) |
| Total | 115 (100.0%) | 107 (100.0%) |
Property Value to Household Income Ratio in Red Cross
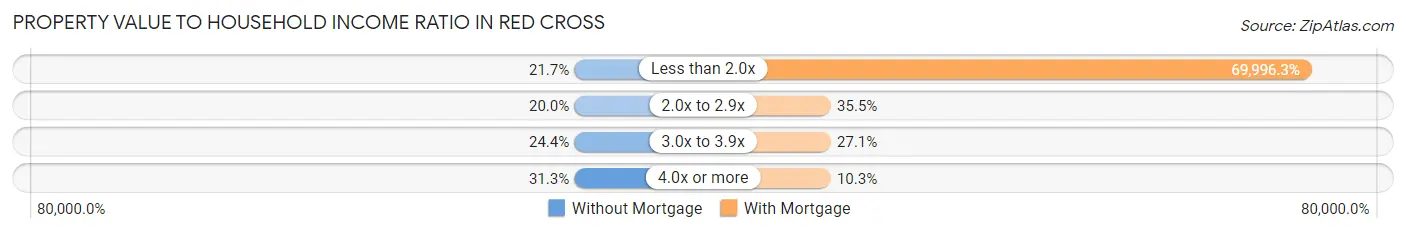
| Value-to-Income Ratio | Without Mortgage | With Mortgage |
| Less than 2.0x | 25 (21.7%) | 74,896 (69,996.3%) |
| 2.0x to 2.9x | 23 (20.0%) | 38 (35.5%) |
| 3.0x to 3.9x | 28 (24.3%) | 29 (27.1%) |
| 4.0x or more | 36 (31.3%) | 11 (10.3%) |
| Total | 115 (100.0%) | 107 (100.0%) |
Real Estate Taxes by Mortgage Status in Red Cross
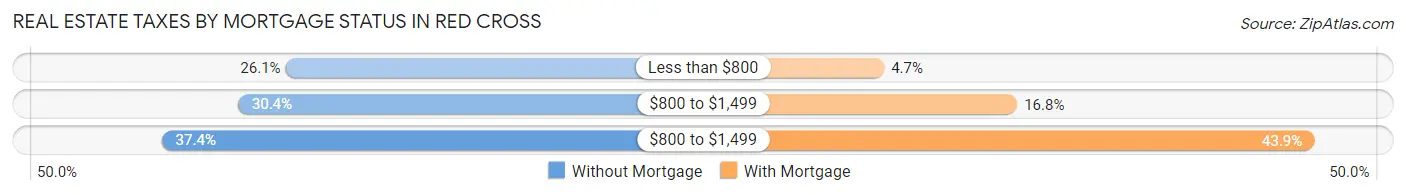
| Property Taxes | Without Mortgage | With Mortgage |
| Less than $800 | 30 (26.1%) | 5 (4.7%) |
| $800 to $1,499 | 35 (30.4%) | 18 (16.8%) |
| $800 to $1,499 | 43 (37.4%) | 47 (43.9%) |
| Total | 115 (100.0%) | 107 (100.0%) |
Health & Disability in Red Cross
Health Insurance Coverage by Age in Red Cross
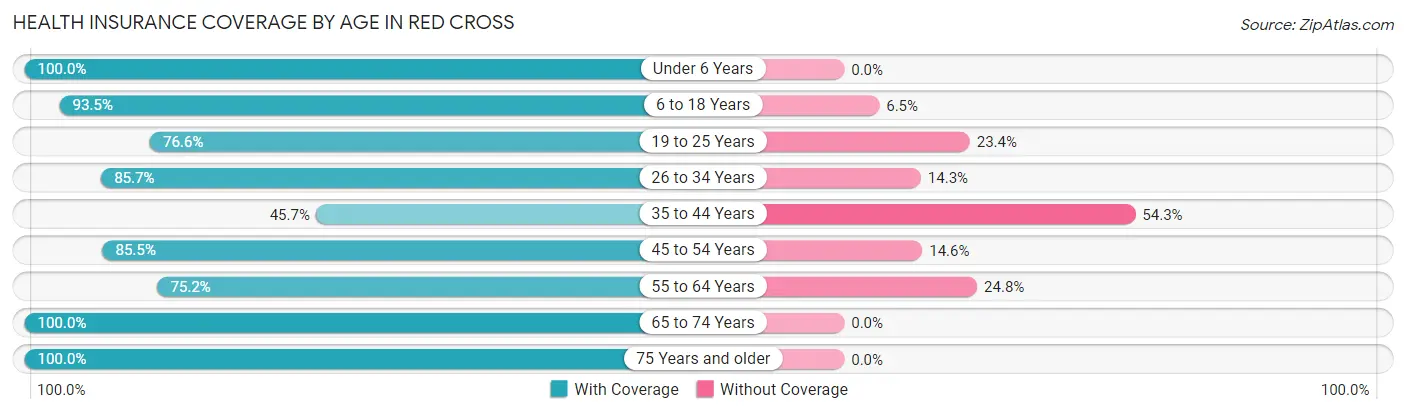
| Age Bracket | With Coverage | Without Coverage |
| Under 6 Years | 30 (100.0%) | 0 (0.0%) |
| 6 to 18 Years | 86 (93.5%) | 6 (6.5%) |
| 19 to 25 Years | 36 (76.6%) | 11 (23.4%) |
| 26 to 34 Years | 66 (85.7%) | 11 (14.3%) |
| 35 to 44 Years | 32 (45.7%) | 38 (54.3%) |
| 45 to 54 Years | 47 (85.5%) | 8 (14.5%) |
| 55 to 64 Years | 85 (75.2%) | 28 (24.8%) |
| 65 to 74 Years | 118 (100.0%) | 0 (0.0%) |
| 75 Years and older | 75 (100.0%) | 0 (0.0%) |
| Total | 575 (84.9%) | 102 (15.1%) |
Health Insurance Coverage by Citizenship Status in Red Cross
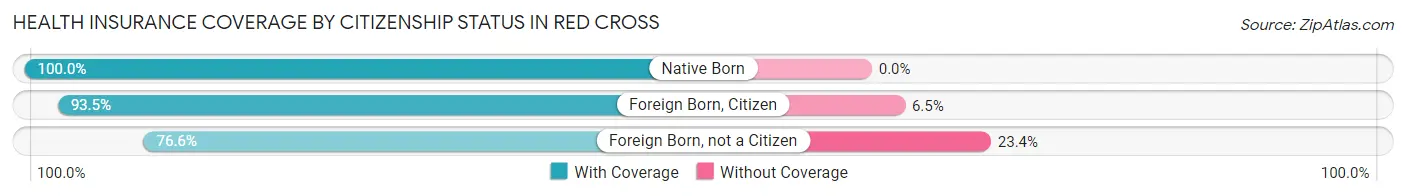
| Citizenship Status | With Coverage | Without Coverage |
| Native Born | 30 (100.0%) | 0 (0.0%) |
| Foreign Born, Citizen | 86 (93.5%) | 6 (6.5%) |
| Foreign Born, not a Citizen | 36 (76.6%) | 11 (23.4%) |
Health Insurance Coverage by Household Income in Red Cross
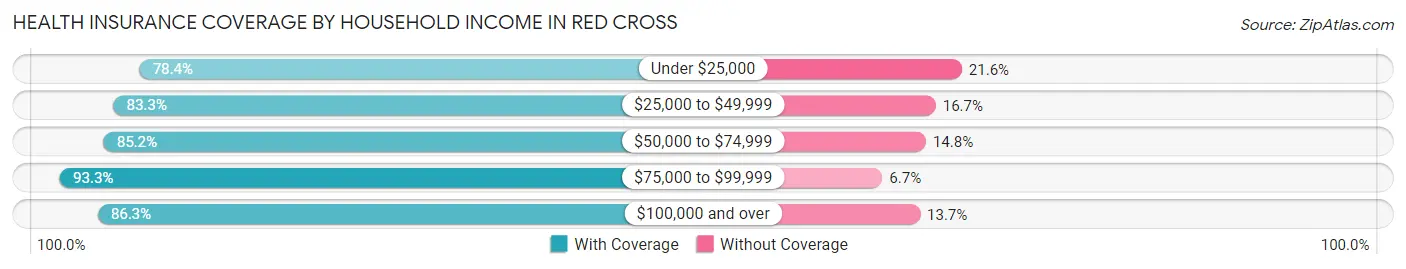
| Household Income | With Coverage | Without Coverage |
| Under $25,000 | 80 (78.4%) | 22 (21.6%) |
| $25,000 to $49,999 | 110 (83.3%) | 22 (16.7%) |
| $50,000 to $74,999 | 109 (85.2%) | 19 (14.8%) |
| $75,000 to $99,999 | 56 (93.3%) | 4 (6.7%) |
| $100,000 and over | 220 (86.3%) | 35 (13.7%) |
Public vs Private Health Insurance Coverage by Age in Red Cross
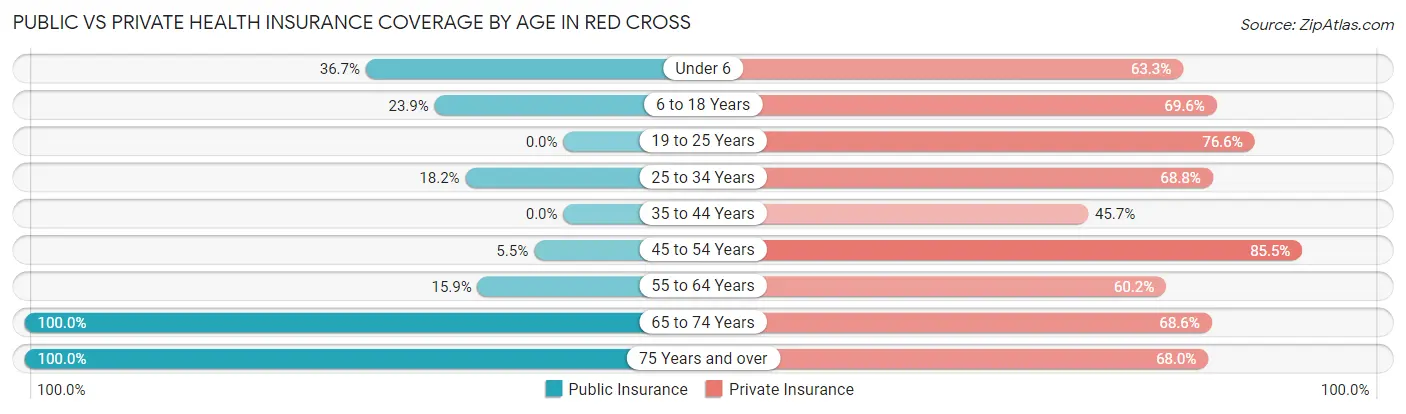
| Age Bracket | Public Insurance | Private Insurance |
| Under 6 | 11 (36.7%) | 19 (63.3%) |
| 6 to 18 Years | 22 (23.9%) | 64 (69.6%) |
| 19 to 25 Years | 0 (0.0%) | 36 (76.6%) |
| 25 to 34 Years | 14 (18.2%) | 53 (68.8%) |
| 35 to 44 Years | 0 (0.0%) | 32 (45.7%) |
| 45 to 54 Years | 3 (5.4%) | 47 (85.5%) |
| 55 to 64 Years | 18 (15.9%) | 68 (60.2%) |
| 65 to 74 Years | 118 (100.0%) | 81 (68.6%) |
| 75 Years and over | 75 (100.0%) | 51 (68.0%) |
| Total | 261 (38.6%) | 451 (66.6%) |
Disability Status by Sex by Age in Red Cross
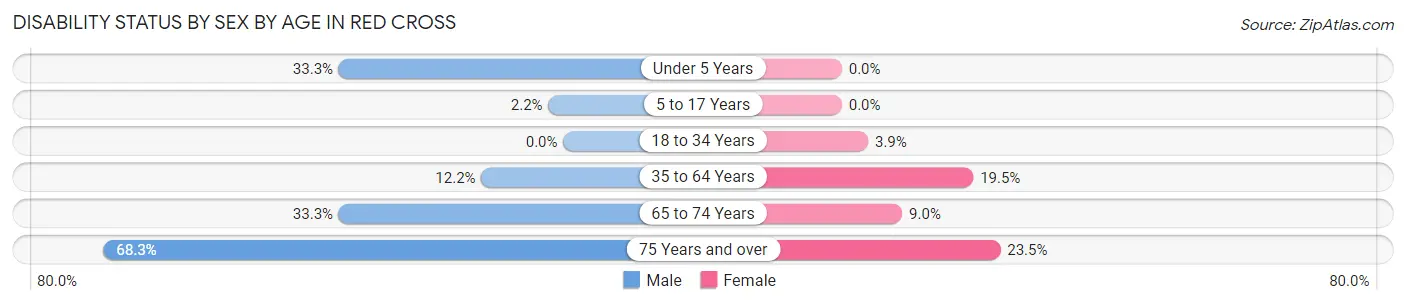
| Age Bracket | Male | Female |
| Under 5 Years | 5 (33.3%) | 0 (0.0%) |
| 5 to 17 Years | 1 (2.2%) | 0 (0.0%) |
| 18 to 34 Years | 0 (0.0%) | 3 (3.9%) |
| 35 to 64 Years | 14 (12.2%) | 24 (19.5%) |
| 65 to 74 Years | 17 (33.3%) | 6 (9.0%) |
| 75 Years and over | 28 (68.3%) | 8 (23.5%) |
Disability Class by Sex by Age in Red Cross
Disability Class: Hearing Difficulty
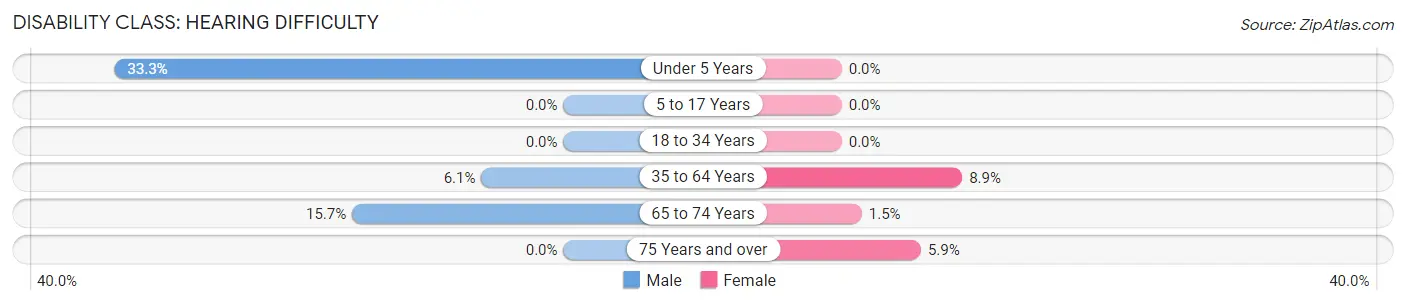
| Age Bracket | Male | Female |
| Under 5 Years | 5 (33.3%) | 0 (0.0%) |
| 5 to 17 Years | 0 (0.0%) | 0 (0.0%) |
| 18 to 34 Years | 0 (0.0%) | 0 (0.0%) |
| 35 to 64 Years | 7 (6.1%) | 11 (8.9%) |
| 65 to 74 Years | 8 (15.7%) | 1 (1.5%) |
| 75 Years and over | 0 (0.0%) | 2 (5.9%) |
Disability Class: Vision Difficulty
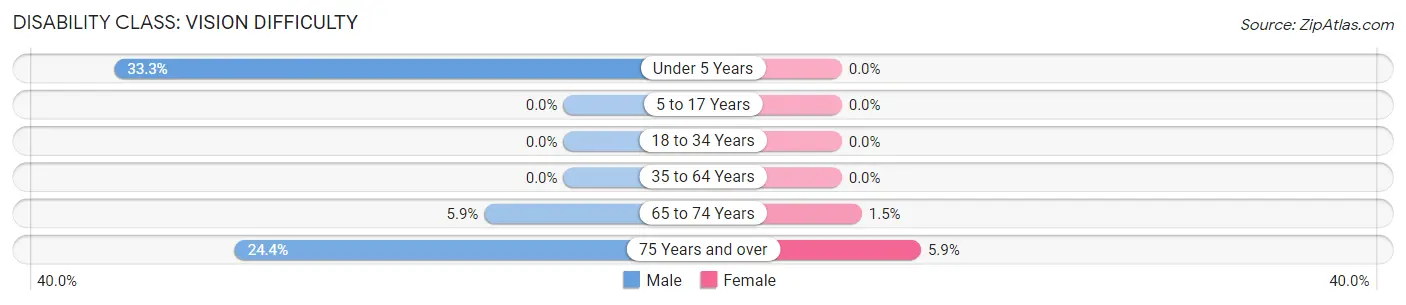
| Age Bracket | Male | Female |
| Under 5 Years | 5 (33.3%) | 0 (0.0%) |
| 5 to 17 Years | 0 (0.0%) | 0 (0.0%) |
| 18 to 34 Years | 0 (0.0%) | 0 (0.0%) |
| 35 to 64 Years | 0 (0.0%) | 0 (0.0%) |
| 65 to 74 Years | 3 (5.9%) | 1 (1.5%) |
| 75 Years and over | 10 (24.4%) | 2 (5.9%) |
Disability Class: Cognitive Difficulty
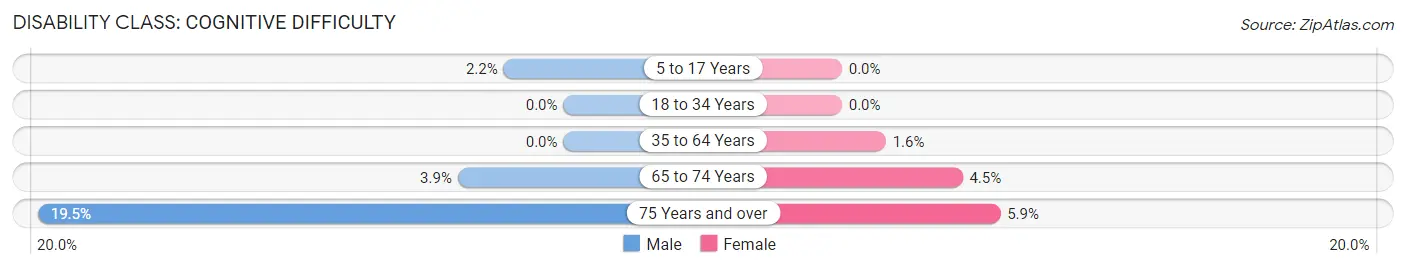
| Age Bracket | Male | Female |
| 5 to 17 Years | 1 (2.2%) | 0 (0.0%) |
| 18 to 34 Years | 0 (0.0%) | 0 (0.0%) |
| 35 to 64 Years | 0 (0.0%) | 2 (1.6%) |
| 65 to 74 Years | 2 (3.9%) | 3 (4.5%) |
| 75 Years and over | 8 (19.5%) | 2 (5.9%) |
Disability Class: Ambulatory Difficulty
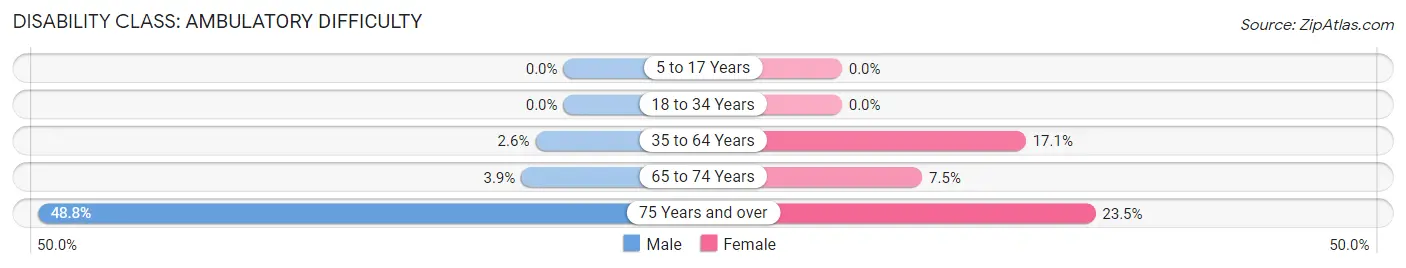
| Age Bracket | Male | Female |
| 5 to 17 Years | 0 (0.0%) | 0 (0.0%) |
| 18 to 34 Years | 0 (0.0%) | 0 (0.0%) |
| 35 to 64 Years | 3 (2.6%) | 21 (17.1%) |
| 65 to 74 Years | 2 (3.9%) | 5 (7.5%) |
| 75 Years and over | 20 (48.8%) | 8 (23.5%) |
Disability Class: Self-Care Difficulty
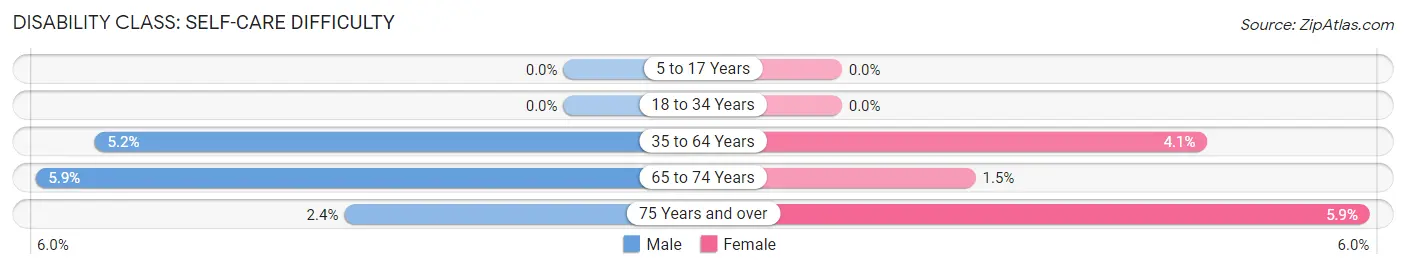
| Age Bracket | Male | Female |
| 5 to 17 Years | 0 (0.0%) | 0 (0.0%) |
| 18 to 34 Years | 0 (0.0%) | 0 (0.0%) |
| 35 to 64 Years | 6 (5.2%) | 5 (4.1%) |
| 65 to 74 Years | 3 (5.9%) | 1 (1.5%) |
| 75 Years and over | 1 (2.4%) | 2 (5.9%) |
Technology Access in Red Cross
Computing Device Access in Red Cross
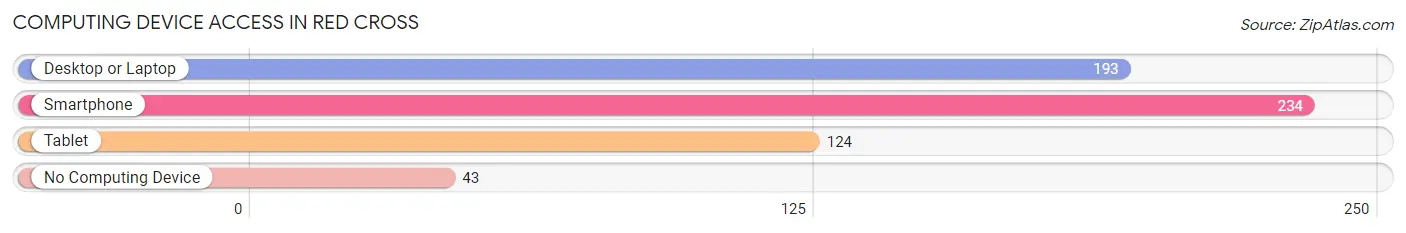
| Device Type | # Households | % Households |
| Desktop or Laptop | 193 | 63.5% |
| Smartphone | 234 | 77.0% |
| Tablet | 124 | 40.8% |
| No Computing Device | 43 | 14.1% |
| Total | 304 | 100.0% |
Internet Access in Red Cross
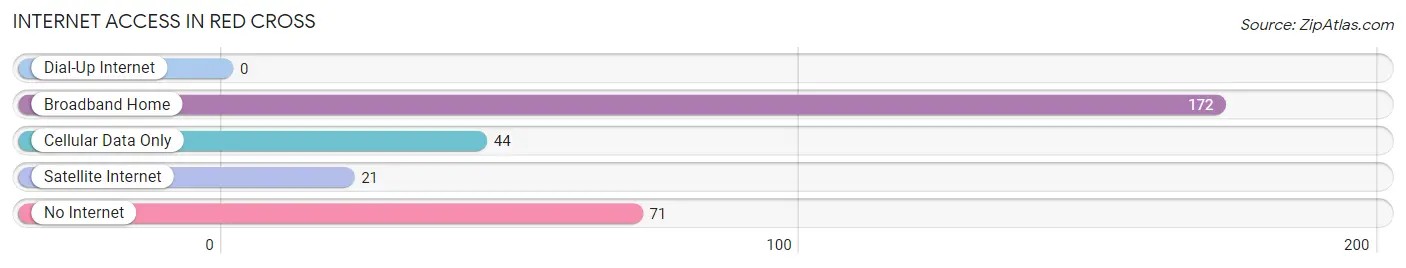
| Internet Type | # Households | % Households |
| Dial-Up Internet | 0 | 0.0% |
| Broadband Home | 172 | 56.6% |
| Cellular Data Only | 44 | 14.5% |
| Satellite Internet | 21 | 6.9% |
| No Internet | 71 | 23.4% |
| Total | 304 | 100.0% |
Red Cross Summary
Cross
The American Red Cross is a humanitarian organization that provides emergency assistance, disaster relief, and education in the United States and around the world. It is one of the most well-known and respected charitable organizations in the world. Founded in 1881 by Clara Barton, the Red Cross has grown to become a global leader in providing relief to those affected by natural disasters, armed conflicts, and other crises.
The Red Cross is a non-profit organization that is supported by donations from individuals, corporations, and foundations. It is governed by a Board of Governors and is led by a CEO and President. The organization is divided into five regions: the National Capital Region, the Central Region, the Southern Region, the Western Region, and the International Region.
The Red Cross provides a variety of services, including disaster relief, health and safety training, blood services, international services, and support for military families. It also provides assistance to those affected by natural disasters, such as hurricanes, floods, and earthquakes. The organization also works to prevent and alleviate human suffering in times of crisis.
In addition to providing relief and assistance, the Red Cross also works to educate the public about disaster preparedness and response. It offers a variety of courses and programs to help individuals and communities prepare for and respond to disasters. The organization also works to promote volunteerism and encourages individuals to get involved in their local communities.
North Carolina
North Carolina is a state located in the southeastern United States. It is bordered by South Carolina, Georgia, Tennessee, Virginia, and the Atlantic Ocean. The state is divided into 100 counties and has a population of approximately 10 million people.
North Carolina has a diverse geography, ranging from the Appalachian Mountains in the west to the Outer Banks in the east. The state is home to a variety of climates, from humid subtropical in the east to temperate in the west.
North Carolina has a rich history, dating back to the early 1600s when the first English settlers arrived. The state was one of the original 13 colonies and was the site of the first English settlement in the New World. North Carolina was also the site of the first successful powered flight, which took place in 1903.
North Carolina has a strong economy, with a gross domestic product of over $500 billion. The state is home to a variety of industries, including agriculture, manufacturing, technology, and tourism. The state is also home to several major universities, including Duke University, the University of North Carolina at Chapel Hill, and North Carolina State University.
North Carolina has a diverse population, with a variety of ethnic and racial backgrounds. The state has a large African American population, as well as a significant Hispanic population. The state also has a large Native American population, with the Lumbee tribe being the largest.
Demographics
As of the 2000 census, the population of North Carolina was 8,049,313. The population was spread out with 24.3% under the age of 18, 11.3% from 18 to 24, 30.2% from 25 to 44, 21.3% from 45 to 64, and 12.9% who were 65 years of age or older. The median age was 34 years.
The racial makeup of the state was 68.5% White, 22.4% African American, 0.4% Native American, 1.9% Asian, 0.1% Pacific Islander, 4.7% from other races, and 2.0% from two or more races. Hispanic or Latino of any race were 8.3% of the population.
The median income for a household in the state was $41,225, and the median income for a family was $50,051. The per capita income for the state was $21,837. About 11.2% of families and 15.3% of the population were below the poverty line, including 19.7% of those under age 18 and 11.2% of those age 65 or over.
Common Questions
What is the Total Population of Red Cross?
Total Population of Red Cross is 677.
What is the Total Male Population of Red Cross?
Total Male Population of Red Cross is 318.
What is the Total Female Population of Red Cross?
Total Female Population of Red Cross is 359.
What is the Ratio of Males per 100 Females in Red Cross?
There are 88.58 Males per 100 Females in Red Cross.
What is the Ratio of Females per 100 Males in Red Cross?
There are 112.89 Females per 100 Males in Red Cross.
What is the Median Population Age in Red Cross?
Median Population Age in Red Cross is 51.3 Years.
What is the Average Family Size in Red Cross
Average Family Size in Red Cross is 2.7 People.
What is the Average Household Size in Red Cross
Average Household Size in Red Cross is 2.2 People.
What is Per Capita Income in Red Cross?
Per Capita income in Red Cross is $31,036.
What is the Median Family Income in Red Cross?
Median Family Income in Red Cross is $75,000.
What is the Median Household income in Red Cross?
Median Household Income in Red Cross is $51,250.
What is Income or Wage Gap in Red Cross?
Income or Wage Gap in Red Cross is 41.4%.
Women in Red Cross earn 58.6 cents for every dollar earned by a man.
What is Inequality or Gini Index in Red Cross?
Inequality or Gini Index in Red Cross is 0.41.
How Large is the Labor Force in Red Cross?
There are 349 People in the Labor Forcein in Red Cross.
What is the Percentage of People in the Labor Force in Red Cross?
60.8% of People are in the Labor Force in Red Cross.
What is the Unemployment Rate in Red Cross?
Unemployment Rate in Red Cross is 4.9%.