West Marion, NC
West Marion Map
West Marion Overview
916
TOTAL POPULATION
455
MALE POPULATION
461
FEMALE POPULATION
98.70
MALES / 100 FEMALES
101.32
FEMALES / 100 MALES
49.2
MEDIAN AGE
2.5
AVG FAMILY SIZE
1.8
AVG HOUSEHOLD SIZE
$27,662
PER CAPITA INCOME
$52,188
AVG FAMILY INCOME
$40,231
AVG HOUSEHOLD INCOME
16.4%
WAGE / INCOME GAP [ % ]
83.6¢/ $1
WAGE / INCOME GAP [ $ ]
0.39
INEQUALITY / GINI INDEX
380
LABOR FORCE [ PEOPLE ]
45.6%
PERCENT IN LABOR FORCE
8.4%
UNEMPLOYMENT RATE
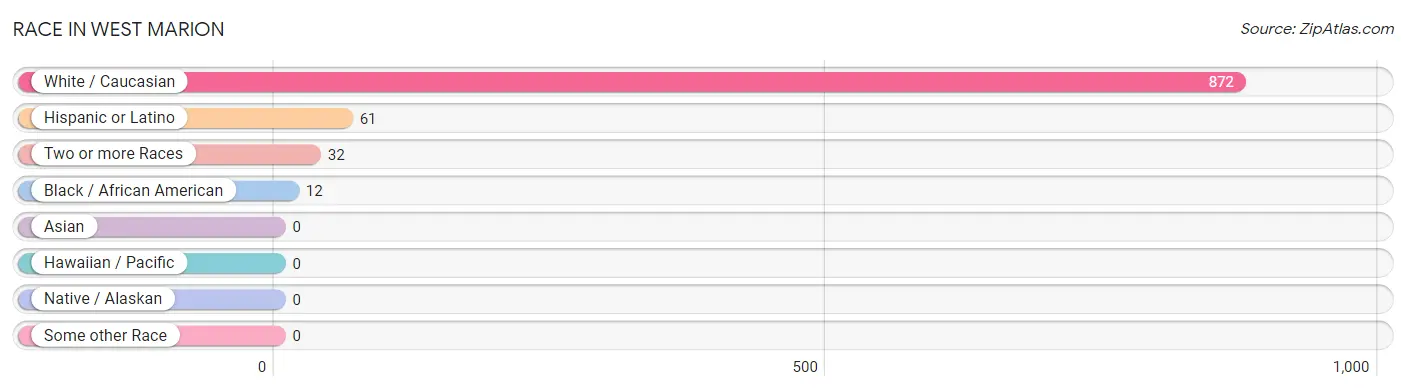
Race in West Marion
The most populous races in West Marion are White / Caucasian (872 | 95.2%), Hispanic or Latino (61 | 6.7%), and Two or more Races (32 | 3.5%).
| Race | # Population | % Population |
| Asian | 0 | 0.0% |
| Black / African American | 12 | 1.3% |
| Hawaiian / Pacific | 0 | 0.0% |
| Hispanic or Latino | 61 | 6.7% |
| Native / Alaskan | 0 | 0.0% |
| White / Caucasian | 872 | 95.2% |
| Two or more Races | 32 | 3.5% |
| Some other Race | 0 | 0.0% |
| Total | 916 | 100.0% |
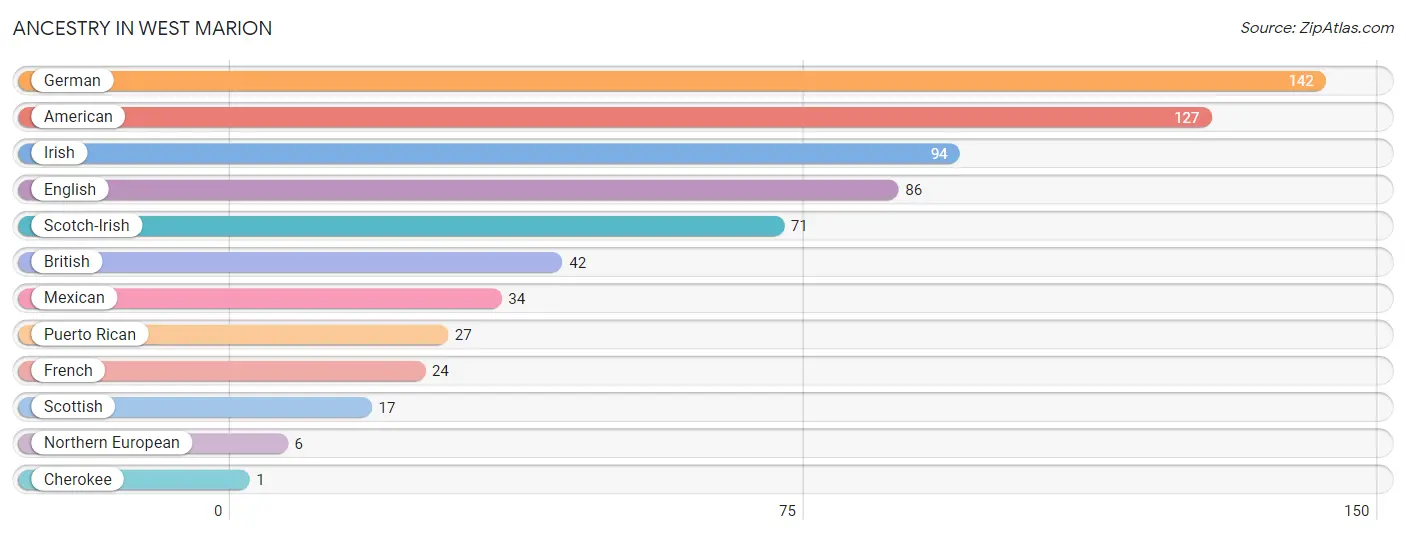
Ancestry in West Marion
The most populous ancestries reported in West Marion are German (142 | 15.5%), American (127 | 13.9%), Irish (94 | 10.3%), English (86 | 9.4%), and Scotch-Irish (71 | 7.7%), together accounting for 56.8% of all West Marion residents.
| Ancestry | # Population | % Population |
| American | 127 | 13.9% |
| British | 42 | 4.6% |
| Cherokee | 1 | 0.1% |
| English | 86 | 9.4% |
| French | 24 | 2.6% |
| German | 142 | 15.5% |
| Irish | 94 | 10.3% |
| Mexican | 34 | 3.7% |
| Northern European | 6 | 0.7% |
| Puerto Rican | 27 | 2.9% |
| Scotch-Irish | 71 | 7.7% |
| Scottish | 17 | 1.9% | View All 12 Rows |
Immigrants in West Marion

| Immigration Origin | # Population | % Population | View All 0 Rows |
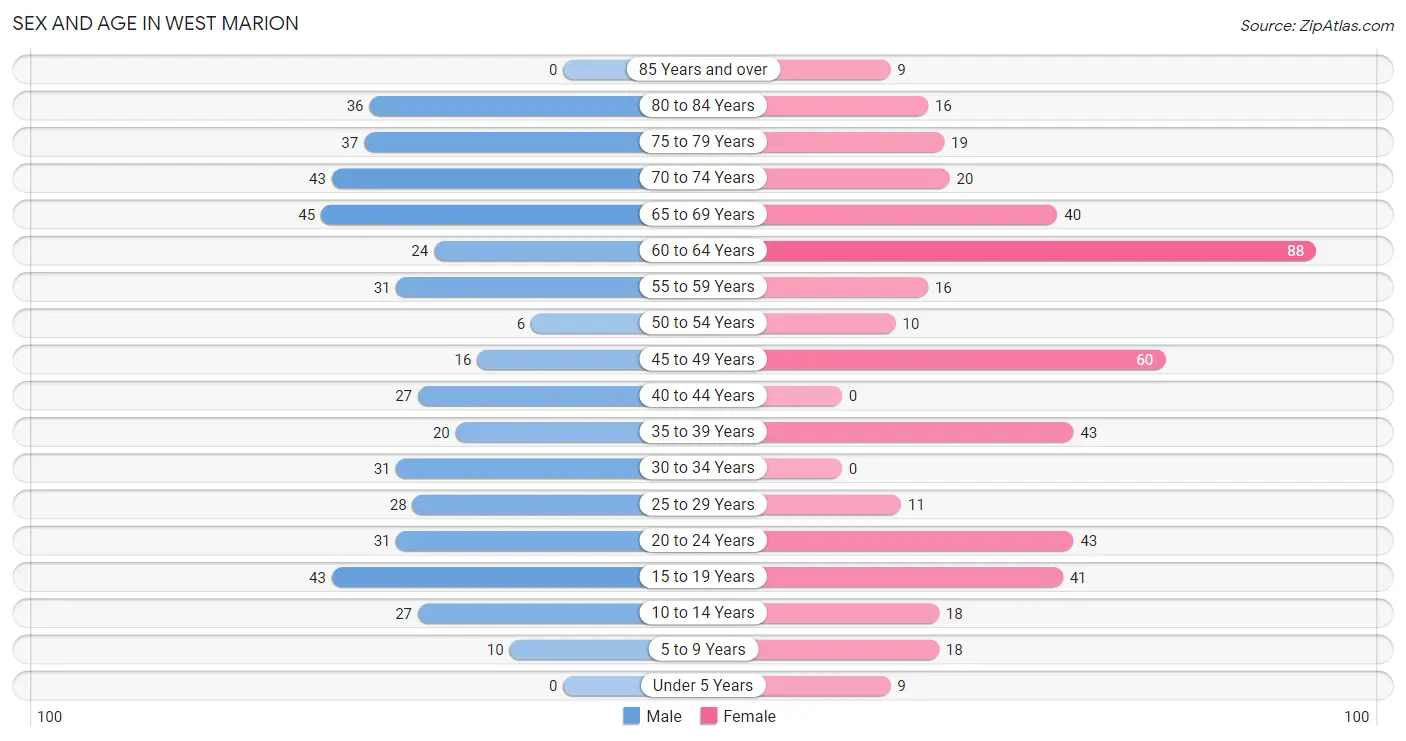
Sex and Age in West Marion
Sex and Age in West Marion
The most populous age groups in West Marion are 65 to 69 Years (45 | 9.9%) for men and 60 to 64 Years (88 | 19.1%) for women.
| Age Bracket | Male | Female |
| Under 5 Years | 0 (0.0%) | 9 (1.9%) |
| 5 to 9 Years | 10 (2.2%) | 18 (3.9%) |
| 10 to 14 Years | 27 (5.9%) | 18 (3.9%) |
| 15 to 19 Years | 43 (9.5%) | 41 (8.9%) |
| 20 to 24 Years | 31 (6.8%) | 43 (9.3%) |
| 25 to 29 Years | 28 (6.1%) | 11 (2.4%) |
| 30 to 34 Years | 31 (6.8%) | 0 (0.0%) |
| 35 to 39 Years | 20 (4.4%) | 43 (9.3%) |
| 40 to 44 Years | 27 (5.9%) | 0 (0.0%) |
| 45 to 49 Years | 16 (3.5%) | 60 (13.0%) |
| 50 to 54 Years | 6 (1.3%) | 10 (2.2%) |
| 55 to 59 Years | 31 (6.8%) | 16 (3.5%) |
| 60 to 64 Years | 24 (5.3%) | 88 (19.1%) |
| 65 to 69 Years | 45 (9.9%) | 40 (8.7%) |
| 70 to 74 Years | 43 (9.5%) | 20 (4.3%) |
| 75 to 79 Years | 37 (8.1%) | 19 (4.1%) |
| 80 to 84 Years | 36 (7.9%) | 16 (3.5%) |
| 85 Years and over | 0 (0.0%) | 9 (1.9%) |
| Total | 455 (100.0%) | 461 (100.0%) |
Families and Households in West Marion
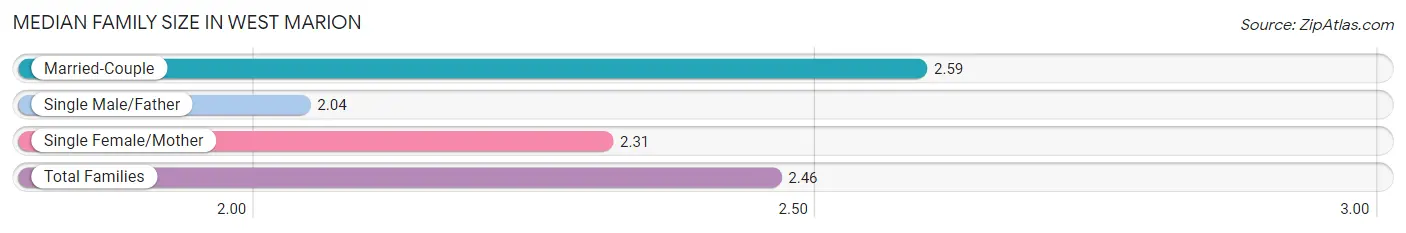
Median Family Size in West Marion
The median family size in West Marion is 2.46 persons per family, with married-couple families (161 | 63.9%) accounting for the largest median family size of 2.59 persons per family. On the other hand, single male/father families (27 | 10.7%) represent the smallest median family size with 2.04 persons per family.
| Family Type | # Families | Family Size |
| Married-Couple | 161 (63.9%) | 2.59 |
| Single Male/Father | 27 (10.7%) | 2.04 |
| Single Female/Mother | 64 (25.4%) | 2.31 |
| Total Families | 252 (100.0%) | 2.46 |
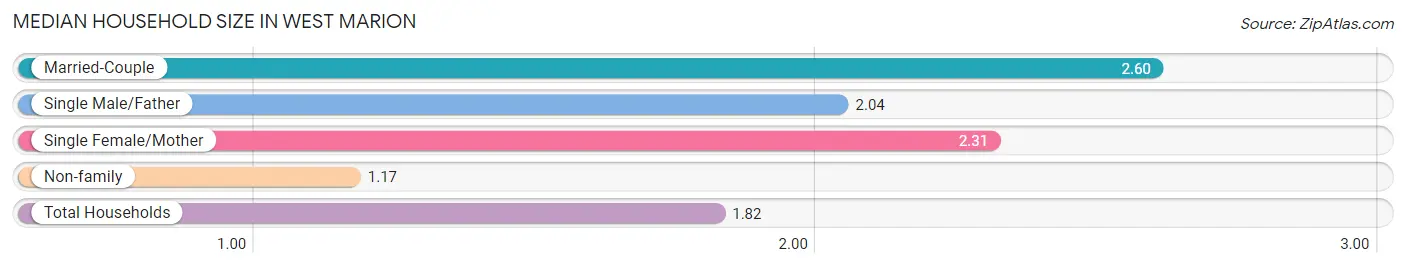
Median Household Size in West Marion
The median household size in West Marion is 1.82 persons per household, with married-couple households (161 | 32.0%) accounting for the largest median household size of 2.6 persons per household. non-family households (251 | 49.9%) represent the smallest median household size with 1.17 persons per household.
| Household Type | # Households | Household Size |
| Married-Couple | 161 (32.0%) | 2.60 |
| Single Male/Father | 27 (5.4%) | 2.04 |
| Single Female/Mother | 64 (12.7%) | 2.31 |
| Non-family | 251 (49.9%) | 1.17 |
| Total Households | 503 (100.0%) | 1.82 |
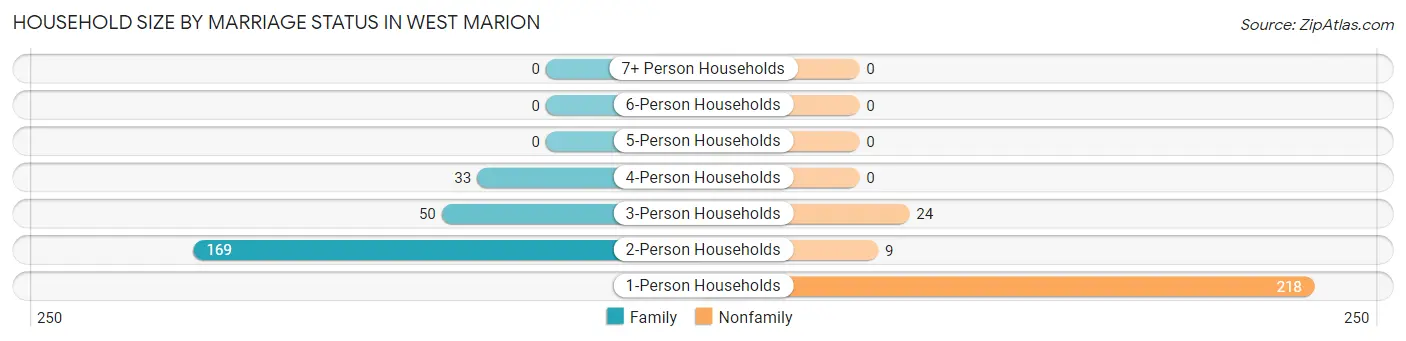
Household Size by Marriage Status in West Marion
Out of a total of 503 households in West Marion, 252 (50.1%) are family households, while 251 (49.9%) are nonfamily households. The most numerous type of family households are 2-person households, comprising 169, and the most common type of nonfamily households are 1-person households, comprising 218.
| Household Size | Family Households | Nonfamily Households |
| 1-Person Households | - | 218 (43.3%) |
| 2-Person Households | 169 (33.6%) | 9 (1.8%) |
| 3-Person Households | 50 (9.9%) | 24 (4.8%) |
| 4-Person Households | 33 (6.6%) | 0 (0.0%) |
| 5-Person Households | 0 (0.0%) | 0 (0.0%) |
| 6-Person Households | 0 (0.0%) | 0 (0.0%) |
| 7+ Person Households | 0 (0.0%) | 0 (0.0%) |
| Total | 252 (50.1%) | 251 (49.9%) |
Female Fertility in West Marion
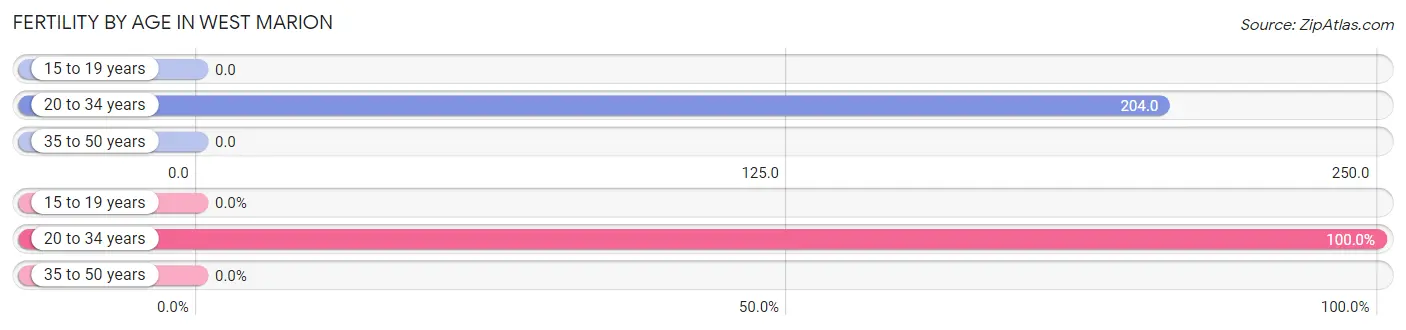
Fertility by Age in West Marion
Average fertility rate in West Marion is 56.0 births per 1,000 women. Women in the age bracket of 20 to 34 years have the highest fertility rate with 204.0 births per 1,000 women. Women in the age bracket of 20 to 34 years acount for 100.0% of all women with births.
| Age Bracket | Women with Births | Births / 1,000 Women |
| 15 to 19 years | 0 (0.0%) | 0.0 |
| 20 to 34 years | 11 (100.0%) | 204.0 |
| 35 to 50 years | 0 (0.0%) | 0.0 |
| Total | 11 (100.0%) | 56.0 |
Fertility by Age by Marriage Status in West Marion
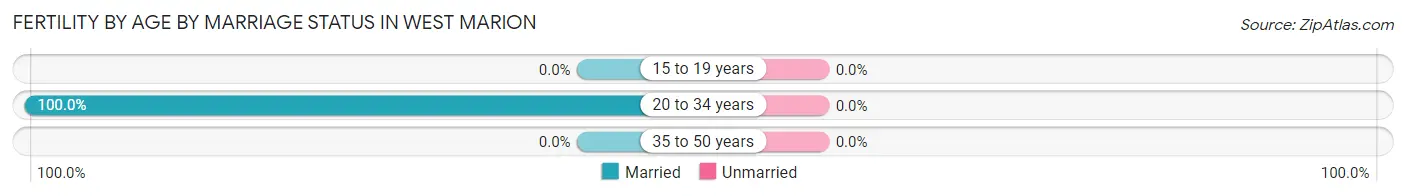
| Age Bracket | Married | Unmarried |
| 15 to 19 years | 0 (0.0%) | 0 (0.0%) |
| 20 to 34 years | 11 (100.0%) | 0 (0.0%) |
| 35 to 50 years | 0 (0.0%) | 0 (0.0%) |
| Total | 11 (100.0%) | 0 (0.0%) |
Fertility by Education in West Marion
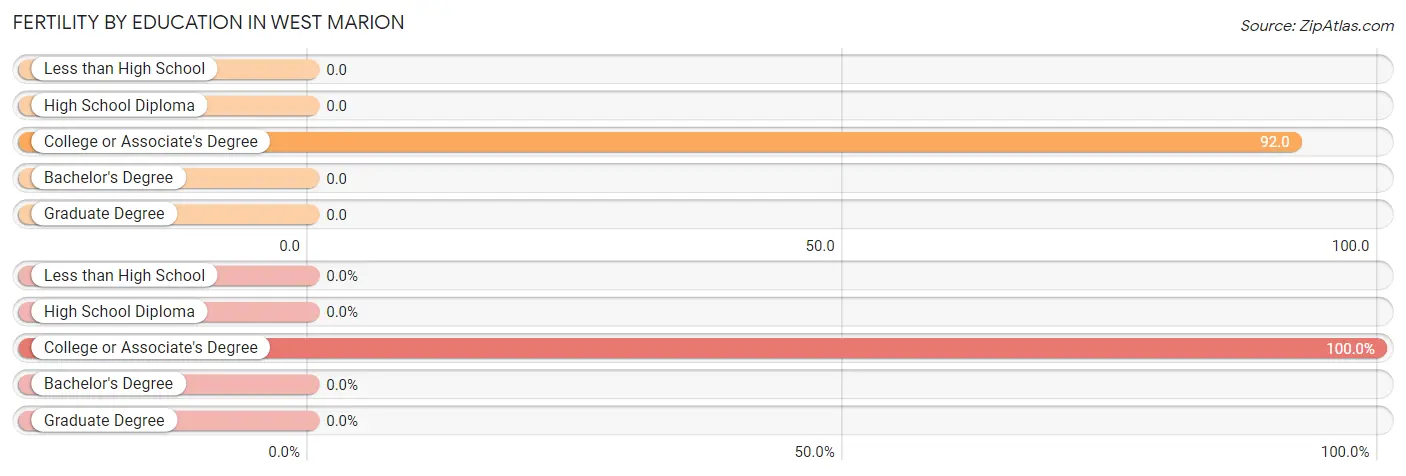
| Educational Attainment | Women with Births | Births / 1,000 Women |
| Less than High School | 0 (0.0%) | 0.0 |
| High School Diploma | 0 (0.0%) | 0.0 |
| College or Associate's Degree | 11 (100.0%) | 92.0 |
| Bachelor's Degree | 0 (0.0%) | 0.0 |
| Graduate Degree | 0 (0.0%) | 0.0 |
| Total | 11 (100.0%) | 56.0 |
Fertility by Education by Marriage Status in West Marion
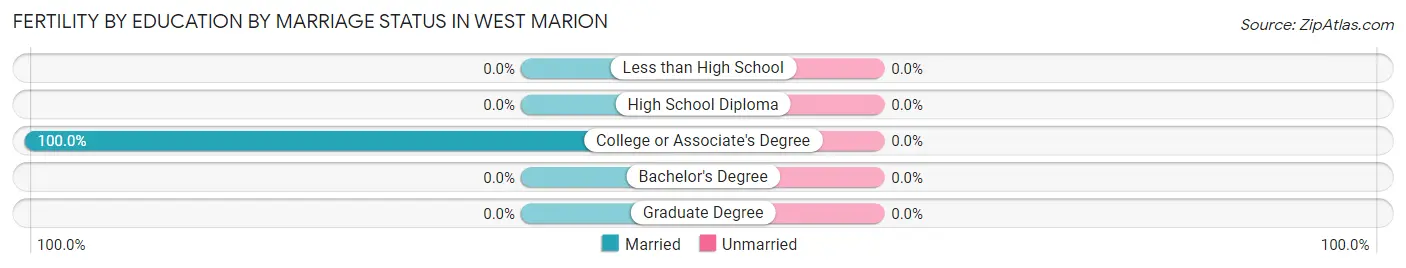
| Educational Attainment | Married | Unmarried |
| Less than High School | 0 (0.0%) | 0 (0.0%) |
| High School Diploma | 0 (0.0%) | 0 (0.0%) |
| College or Associate's Degree | 11 (100.0%) | 0 (0.0%) |
| Bachelor's Degree | 0 (0.0%) | 0 (0.0%) |
| Graduate Degree | 0 (0.0%) | 0 (0.0%) |
| Total | 11 (100.0%) | 0 (0.0%) |
Income in West Marion
Income Overview in West Marion
Per Capita Income in West Marion is $27,662, while median incomes of families and households are $52,188 and $40,231 respectively.
| Characteristic | Number | Measure |
| Per Capita Income | 916 | $27,662 |
| Median Family Income | 252 | $52,188 |
| Mean Family Income | 252 | $61,660 |
| Median Household Income | 503 | $40,231 |
| Mean Household Income | 503 | $50,597 |
| Income Deficit | 252 | $0 |
| Wage / Income Gap (%) | 916 | 16.40% |
| Wage / Income Gap ($) | 916 | 83.60¢ per $1 |
| Gini / Inequality Index | 916 | 0.39 |
Earnings by Sex in West Marion
Average Earnings in West Marion are $31,250, $29,441 for men and $35,216 for women, a difference of 16.4%.
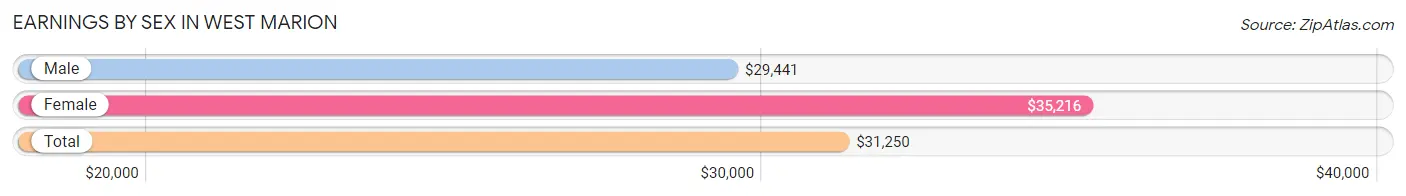
| Sex | Number | Average Earnings |
| Male | 177 (46.1%) | $29,441 |
| Female | 207 (53.9%) | $35,216 |
| Total | 384 (100.0%) | $31,250 |
Earnings by Sex by Income Bracket in West Marion
The most common earnings brackets in West Marion are $25,000 to $29,999 for men (47 | 26.6%) and $45,000 to $49,999 for women (43 | 20.8%).
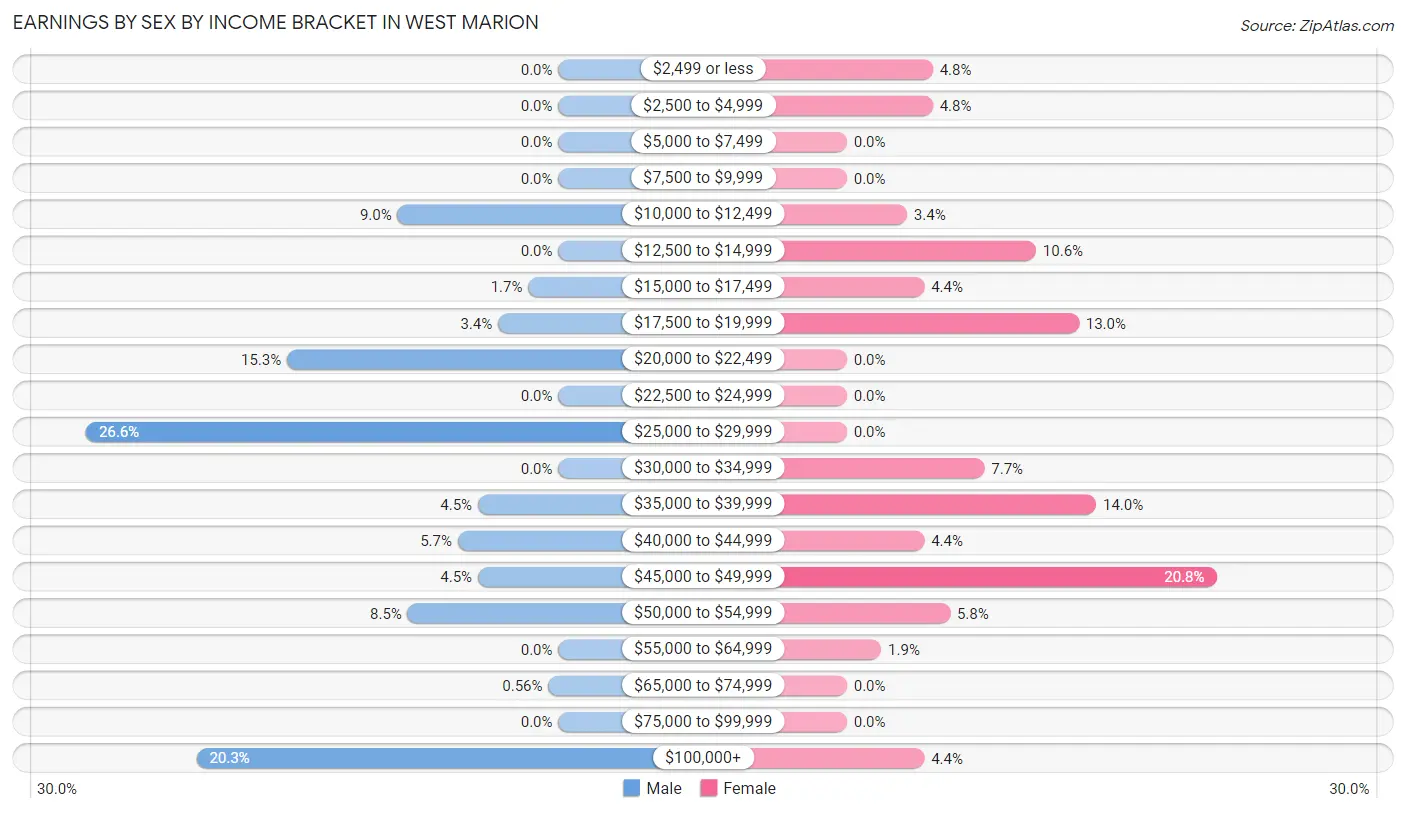
| Income | Male | Female |
| $2,499 or less | 0 (0.0%) | 10 (4.8%) |
| $2,500 to $4,999 | 0 (0.0%) | 10 (4.8%) |
| $5,000 to $7,499 | 0 (0.0%) | 0 (0.0%) |
| $7,500 to $9,999 | 0 (0.0%) | 0 (0.0%) |
| $10,000 to $12,499 | 16 (9.0%) | 7 (3.4%) |
| $12,500 to $14,999 | 0 (0.0%) | 22 (10.6%) |
| $15,000 to $17,499 | 3 (1.7%) | 9 (4.3%) |
| $17,500 to $19,999 | 6 (3.4%) | 27 (13.0%) |
| $20,000 to $22,499 | 27 (15.2%) | 0 (0.0%) |
| $22,500 to $24,999 | 0 (0.0%) | 0 (0.0%) |
| $25,000 to $29,999 | 47 (26.6%) | 0 (0.0%) |
| $30,000 to $34,999 | 0 (0.0%) | 16 (7.7%) |
| $35,000 to $39,999 | 8 (4.5%) | 29 (14.0%) |
| $40,000 to $44,999 | 10 (5.7%) | 9 (4.3%) |
| $45,000 to $49,999 | 8 (4.5%) | 43 (20.8%) |
| $50,000 to $54,999 | 15 (8.5%) | 12 (5.8%) |
| $55,000 to $64,999 | 0 (0.0%) | 4 (1.9%) |
| $65,000 to $74,999 | 1 (0.6%) | 0 (0.0%) |
| $75,000 to $99,999 | 0 (0.0%) | 0 (0.0%) |
| $100,000+ | 36 (20.3%) | 9 (4.3%) |
| Total | 177 (100.0%) | 207 (100.0%) |
Earnings by Sex by Educational Attainment in West Marion
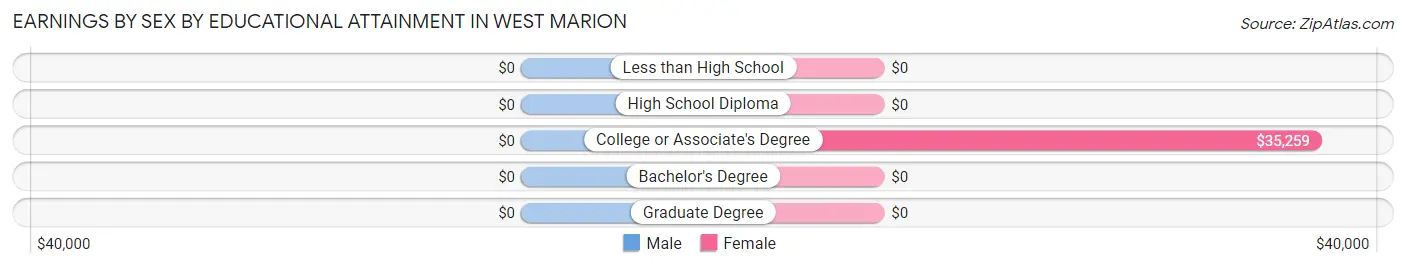
| Educational Attainment | Male Income | Female Income |
| Less than High School | - | - |
| High School Diploma | - | - |
| College or Associate's Degree | - | - |
| Bachelor's Degree | - | - |
| Graduate Degree | - | - |
| Total | $39,063 | $30,938 |
Family Income in West Marion
Family Income Brackets in West Marion
According to the West Marion family income data, there are 73 families falling into the $50,000 to $74,999 income range, which is the most common income bracket and makes up 29.0% of all families.
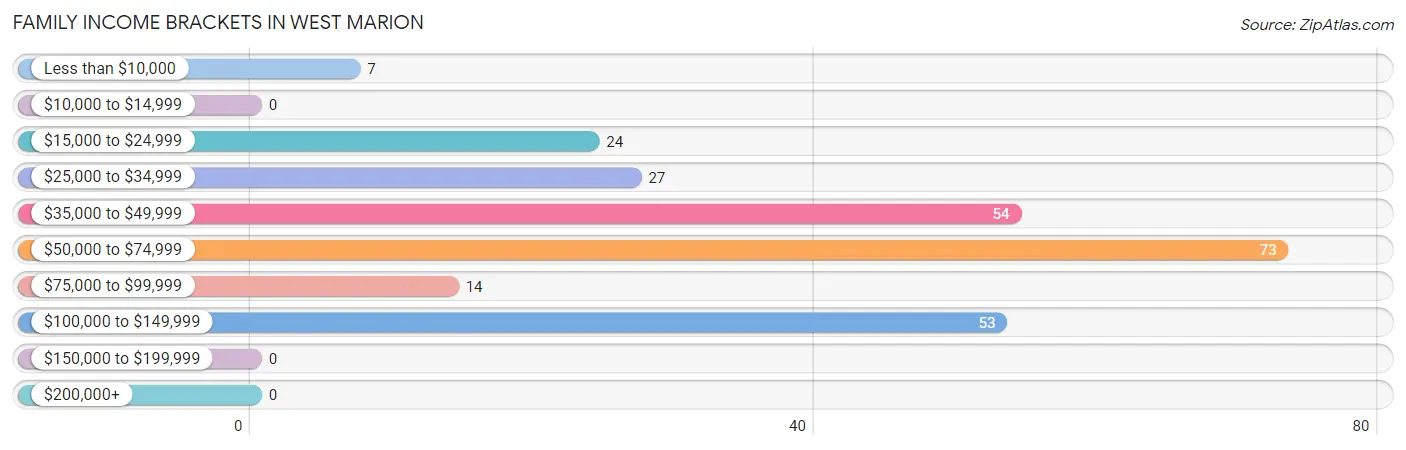
| Income Bracket | # Families | % Families |
| Less than $10,000 | 7 | 2.8% |
| $10,000 to $14,999 | 0 | 0.0% |
| $15,000 to $24,999 | 24 | 9.5% |
| $25,000 to $34,999 | 27 | 10.7% |
| $35,000 to $49,999 | 54 | 21.4% |
| $50,000 to $74,999 | 73 | 29.0% |
| $75,000 to $99,999 | 14 | 5.6% |
| $100,000 to $149,999 | 53 | 21.0% |
| $150,000 to $199,999 | 0 | 0.0% |
| $200,000+ | 0 | 0.0% |
Family Income by Famaliy Size in West Marion
3-person families (53 | 21.0%) account for the highest median family income in West Marion with $118,688 per family, while 3-person families (53 | 21.0%) have the highest median income of $39,563 per family member.
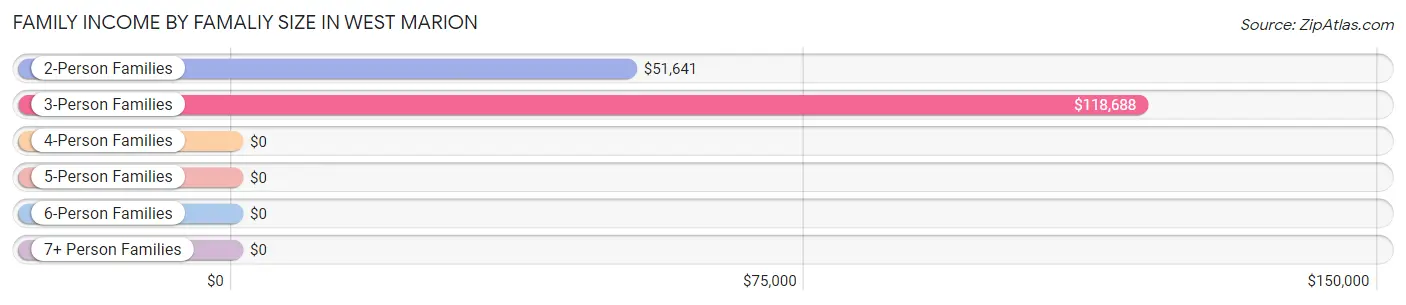
| Income Bracket | # Families | Median Income |
| 2-Person Families | 169 (67.1%) | $51,641 |
| 3-Person Families | 53 (21.0%) | $118,688 |
| 4-Person Families | 30 (11.9%) | $0 |
| 5-Person Families | 0 (0.0%) | $0 |
| 6-Person Families | 0 (0.0%) | $0 |
| 7+ Person Families | 0 (0.0%) | $0 |
| Total | 252 (100.0%) | $52,188 |
Family Income by Number of Earners in West Marion
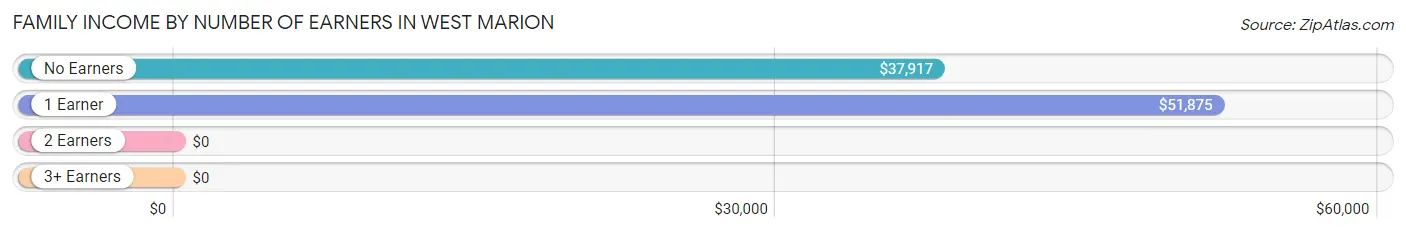
| Number of Earners | # Families | Median Income |
| No Earners | 85 (33.7%) | $37,917 |
| 1 Earner | 69 (27.4%) | $51,875 |
| 2 Earners | 98 (38.9%) | $0 |
| 3+ Earners | 0 (0.0%) | $0 |
| Total | 252 (100.0%) | $52,188 |
Household Income in West Marion
Household Income Brackets in West Marion
With 121 households falling in the category, the $15,000 to $24,999 income range is the most frequent in West Marion, accounting for 24.1% of all households.
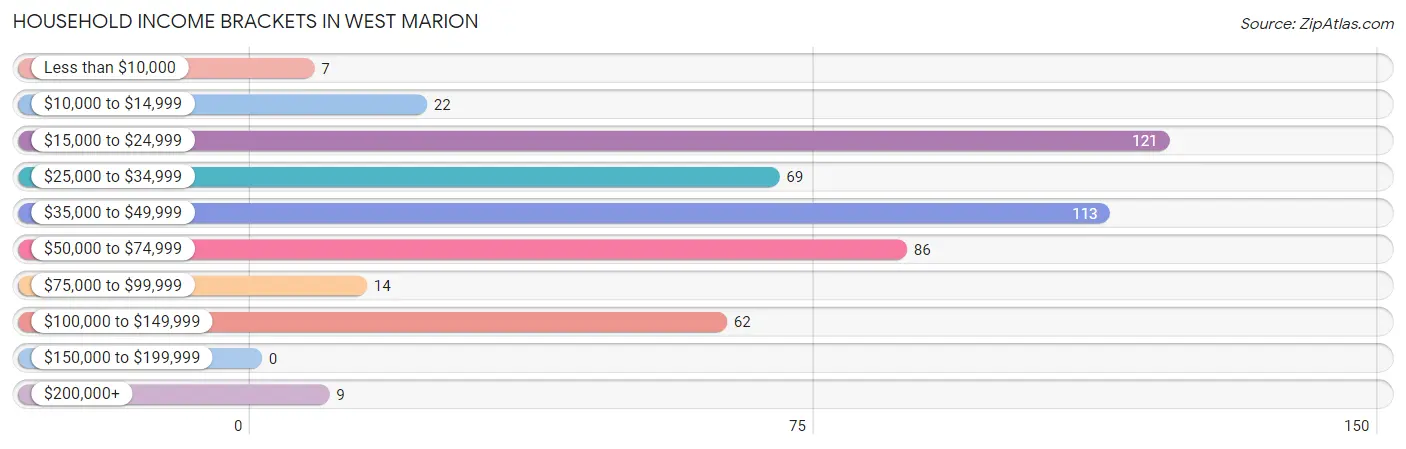
| Income Bracket | # Households | % Households |
| Less than $10,000 | 7 | 1.4% |
| $10,000 to $14,999 | 22 | 4.4% |
| $15,000 to $24,999 | 121 | 24.1% |
| $25,000 to $34,999 | 69 | 13.7% |
| $35,000 to $49,999 | 113 | 22.5% |
| $50,000 to $74,999 | 86 | 17.1% |
| $75,000 to $99,999 | 14 | 2.8% |
| $100,000 to $149,999 | 62 | 12.3% |
| $150,000 to $199,999 | 0 | 0.0% |
| $200,000+ | 9 | 1.8% |
Household Income by Householder Age in West Marion
The median household income in West Marion is $40,231, with the highest median household income of $55,550 found in the 45 to 64 years age bracket for the primary householder. A total of 159 households (31.6%) fall into this category. Meanwhile, the 15 to 24 years age bracket for the primary householder has the lowest median household income of $0, with 61 households (12.1%) in this group.
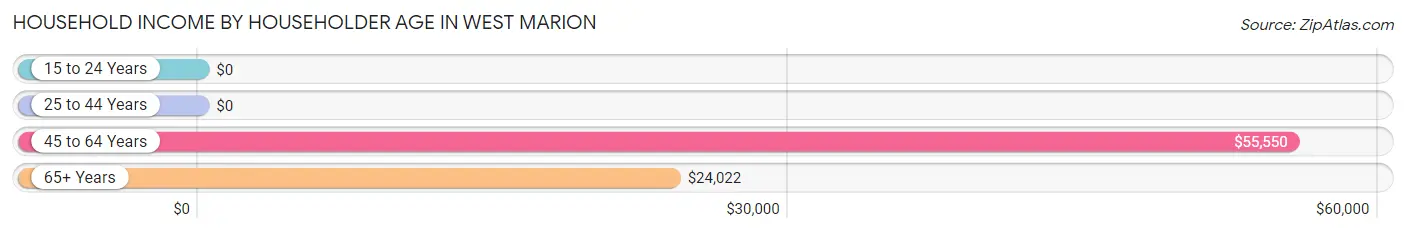
| Income Bracket | # Households | Median Income |
| 15 to 24 Years | 61 (12.1%) | $0 |
| 25 to 44 Years | 81 (16.1%) | $0 |
| 45 to 64 Years | 159 (31.6%) | $55,550 |
| 65+ Years | 202 (40.2%) | $24,022 |
| Total | 503 (100.0%) | $40,231 |
Poverty in West Marion
Income Below Poverty by Sex and Age in West Marion
With 12.3% poverty level for males and 15.4% for females among the residents of West Marion, 6 to 11 year old males and 6 to 11 year old females are the most vulnerable to poverty, with 17 males (100.0%) and 18 females (100.0%) in their respective age groups living below the poverty level.
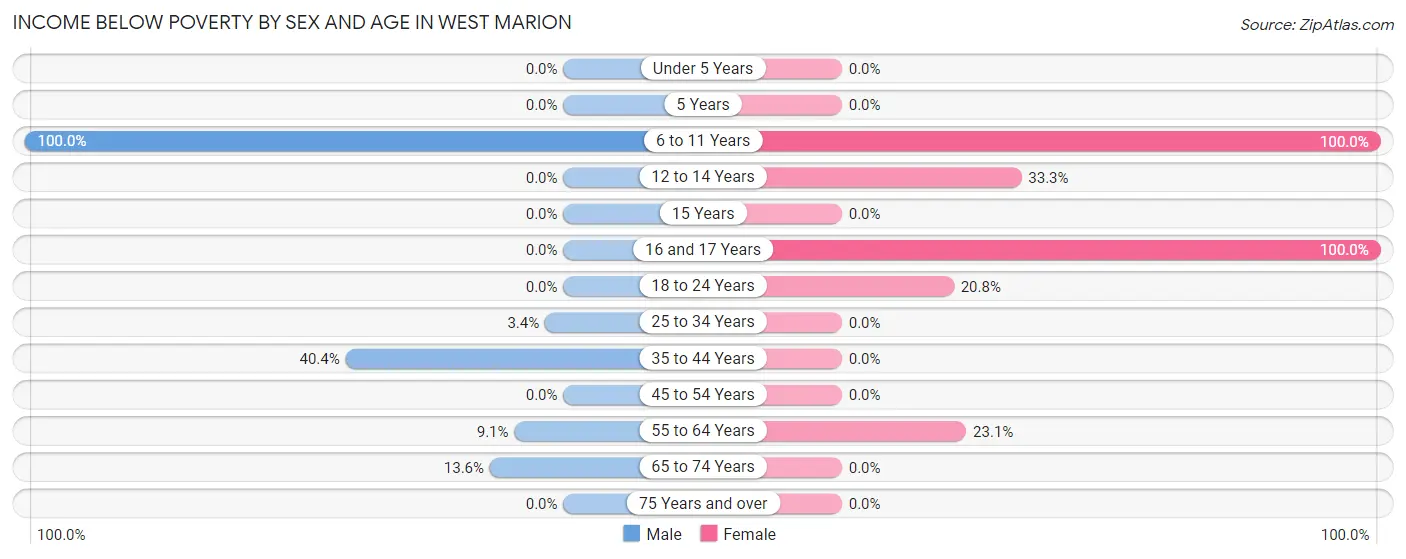
| Age Bracket | Male | Female |
| Under 5 Years | 0 (0.0%) | 0 (0.0%) |
| 5 Years | 0 (0.0%) | 0 (0.0%) |
| 6 to 11 Years | 17 (100.0%) | 18 (100.0%) |
| 12 to 14 Years | 0 (0.0%) | 6 (33.3%) |
| 15 Years | 0 (0.0%) | 0 (0.0%) |
| 16 and 17 Years | 0 (0.0%) | 7 (100.0%) |
| 18 to 24 Years | 0 (0.0%) | 16 (20.8%) |
| 25 to 34 Years | 2 (3.4%) | 0 (0.0%) |
| 35 to 44 Years | 19 (40.4%) | 0 (0.0%) |
| 45 to 54 Years | 0 (0.0%) | 0 (0.0%) |
| 55 to 64 Years | 5 (9.1%) | 24 (23.1%) |
| 65 to 74 Years | 12 (13.6%) | 0 (0.0%) |
| 75 Years and over | 0 (0.0%) | 0 (0.0%) |
| Total | 55 (12.3%) | 71 (15.4%) |
Income Above Poverty by Sex and Age in West Marion
According to the poverty statistics in West Marion, males aged 5 years and females aged under 5 years are the age groups that are most secure financially, with 100.0% of males and 100.0% of females in these age groups living above the poverty line.
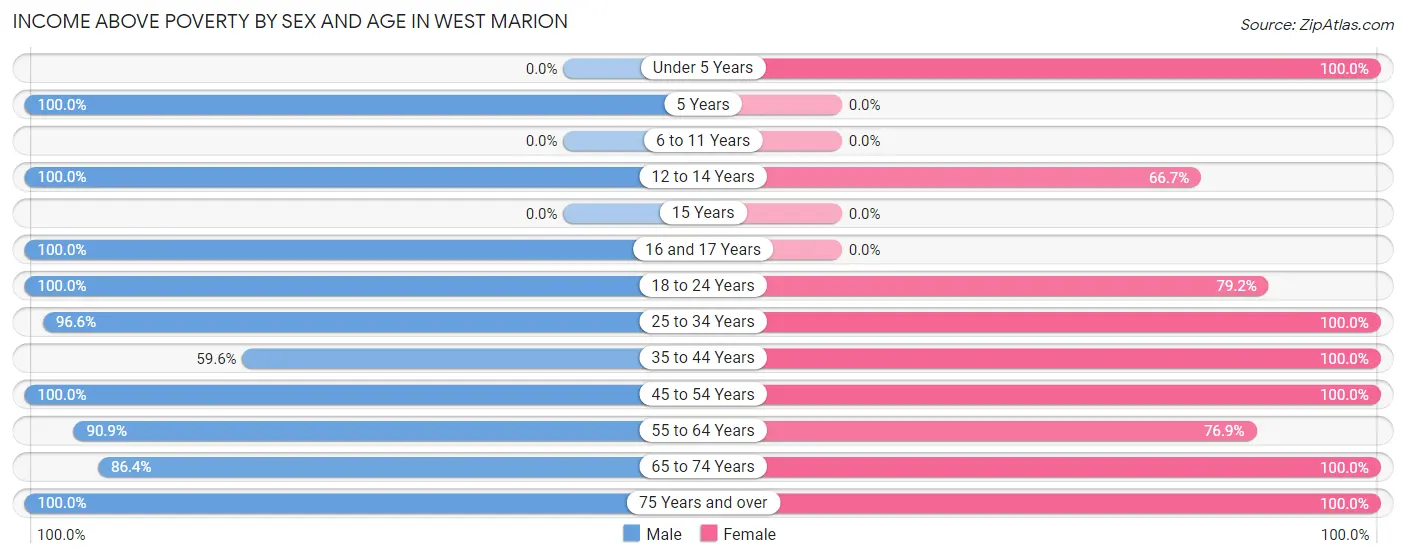
| Age Bracket | Male | Female |
| Under 5 Years | 0 (0.0%) | 9 (100.0%) |
| 5 Years | 10 (100.0%) | 0 (0.0%) |
| 6 to 11 Years | 0 (0.0%) | 0 (0.0%) |
| 12 to 14 Years | 3 (100.0%) | 12 (66.7%) |
| 15 Years | 0 (0.0%) | 0 (0.0%) |
| 16 and 17 Years | 36 (100.0%) | 0 (0.0%) |
| 18 to 24 Years | 38 (100.0%) | 61 (79.2%) |
| 25 to 34 Years | 57 (96.6%) | 11 (100.0%) |
| 35 to 44 Years | 28 (59.6%) | 43 (100.0%) |
| 45 to 54 Years | 22 (100.0%) | 70 (100.0%) |
| 55 to 64 Years | 50 (90.9%) | 80 (76.9%) |
| 65 to 74 Years | 76 (86.4%) | 60 (100.0%) |
| 75 Years and over | 73 (100.0%) | 44 (100.0%) |
| Total | 393 (87.7%) | 390 (84.6%) |
Income Below Poverty Among Married-Couple Families in West Marion
The poverty statistics for married-couple families in West Marion show that 16.2% or 26 of the total 161 families live below the poverty line. Families with 1 or 2 children have the highest poverty rate of 27.5%, comprising of 19 families. On the other hand, families with no children have the lowest poverty rate of 7.6%, which includes 7 families.
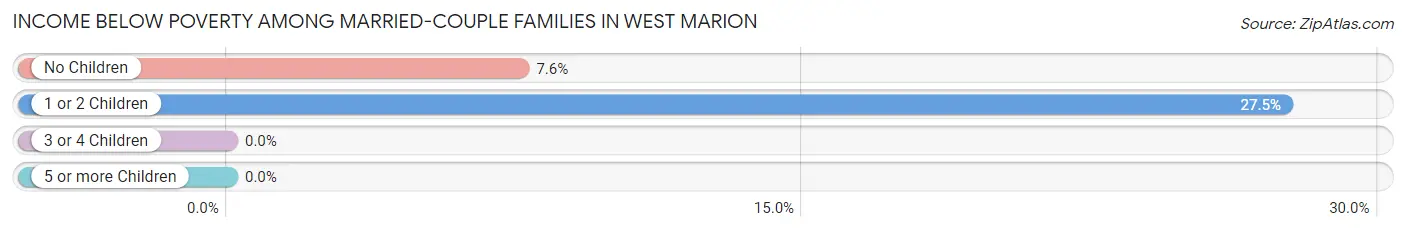
| Children | Above Poverty | Below Poverty |
| No Children | 85 (92.4%) | 7 (7.6%) |
| 1 or 2 Children | 50 (72.5%) | 19 (27.5%) |
| 3 or 4 Children | 0 (0.0%) | 0 (0.0%) |
| 5 or more Children | 0 (0.0%) | 0 (0.0%) |
| Total | 135 (83.9%) | 26 (16.2%) |
Income Below Poverty Among Single-Parent Households in West Marion
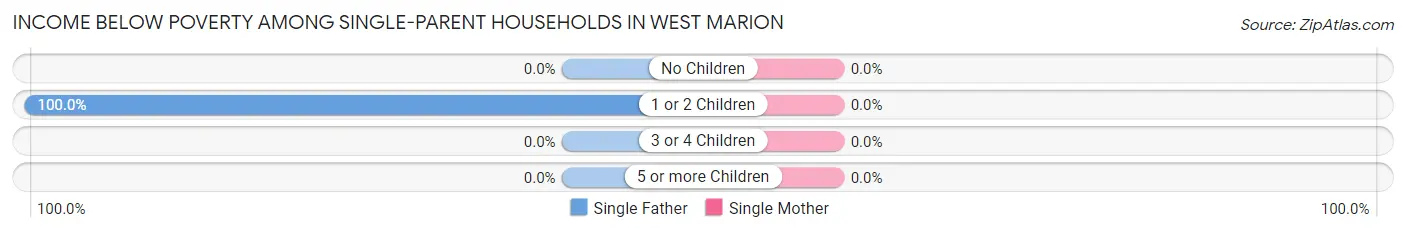
| Children | Single Father | Single Mother |
| No Children | 0 (0.0%) | 0 (0.0%) |
| 1 or 2 Children | 5 (100.0%) | 0 (0.0%) |
| 3 or 4 Children | 0 (0.0%) | 0 (0.0%) |
| 5 or more Children | 0 (0.0%) | 0 (0.0%) |
| Total | 5 (18.5%) | 0 (0.0%) |
Income Below Poverty Among Married-Couple vs Single-Parent Households in West Marion
The poverty data for West Marion shows that 26 of the married-couple family households (16.2%) and 5 of the single-parent households (5.5%) are living below the poverty level. Within the married-couple family households, those with 1 or 2 children have the highest poverty rate, with 19 households (27.5%) falling below the poverty line. Among the single-parent households, those with 1 or 2 children have the highest poverty rate, with 5 household (38.5%) living below poverty.
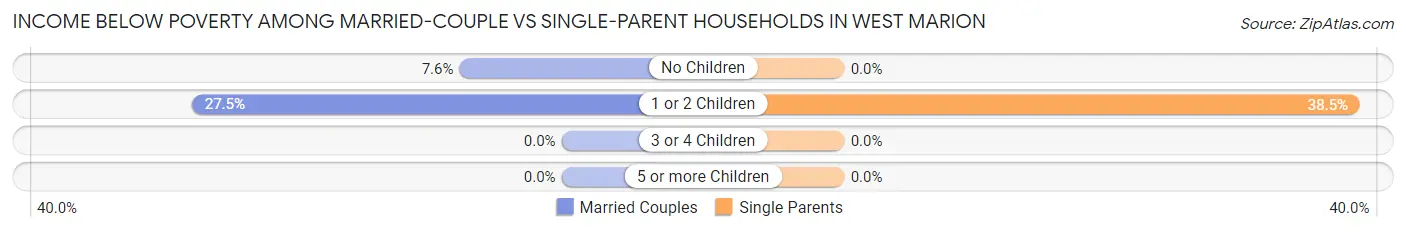
| Children | Married-Couple Families | Single-Parent Households |
| No Children | 7 (7.6%) | 0 (0.0%) |
| 1 or 2 Children | 19 (27.5%) | 5 (38.5%) |
| 3 or 4 Children | 0 (0.0%) | 0 (0.0%) |
| 5 or more Children | 0 (0.0%) | 0 (0.0%) |
| Total | 26 (16.2%) | 5 (5.5%) |
Employment Characteristics in West Marion
Employment by Class of Employer in West Marion
Among the 339 employed individuals in West Marion, private company employees (255 | 75.2%), self-employed (not incorporated) (31 | 9.1%), and state government employees (29 | 8.6%) make up the most common classes of employment.
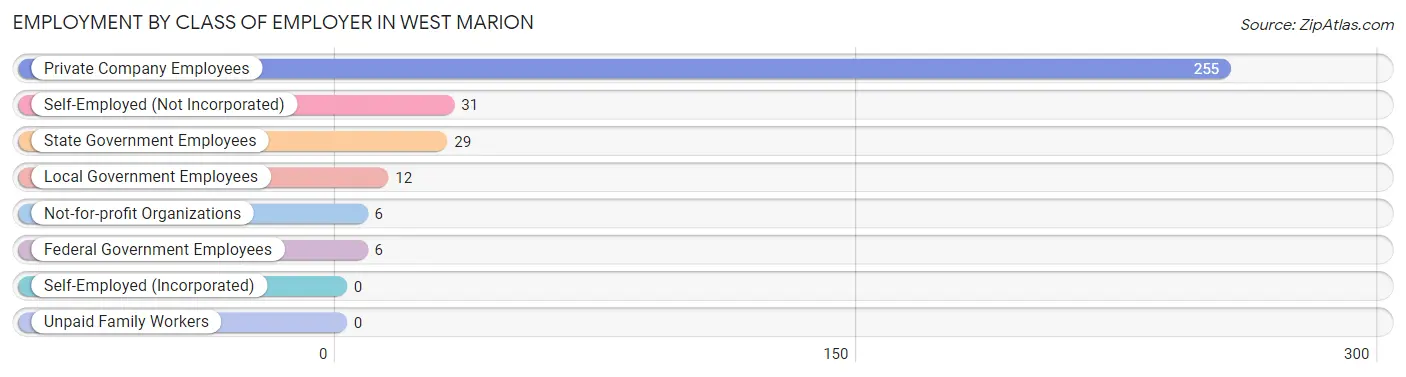
| Employer Class | # Employees | % Employees |
| Private Company Employees | 255 | 75.2% |
| Self-Employed (Incorporated) | 0 | 0.0% |
| Self-Employed (Not Incorporated) | 31 | 9.1% |
| Not-for-profit Organizations | 6 | 1.8% |
| Local Government Employees | 12 | 3.5% |
| State Government Employees | 29 | 8.6% |
| Federal Government Employees | 6 | 1.8% |
| Unpaid Family Workers | 0 | 0.0% |
| Total | 339 | 100.0% |
Employment Status by Age in West Marion
According to the labor force statistics for West Marion, out of the total population over 16 years of age (834), 45.6% or 380 individuals are in the labor force, with 8.4% or 32 of them unemployed. The age group with the highest labor force participation rate is 20 to 24 years, with 100.0% or 74 individuals in the labor force. Within the labor force, the 55 to 59 years age range has the highest percentage of unemployed individuals, with 48.5% or 16 of them being unemployed.
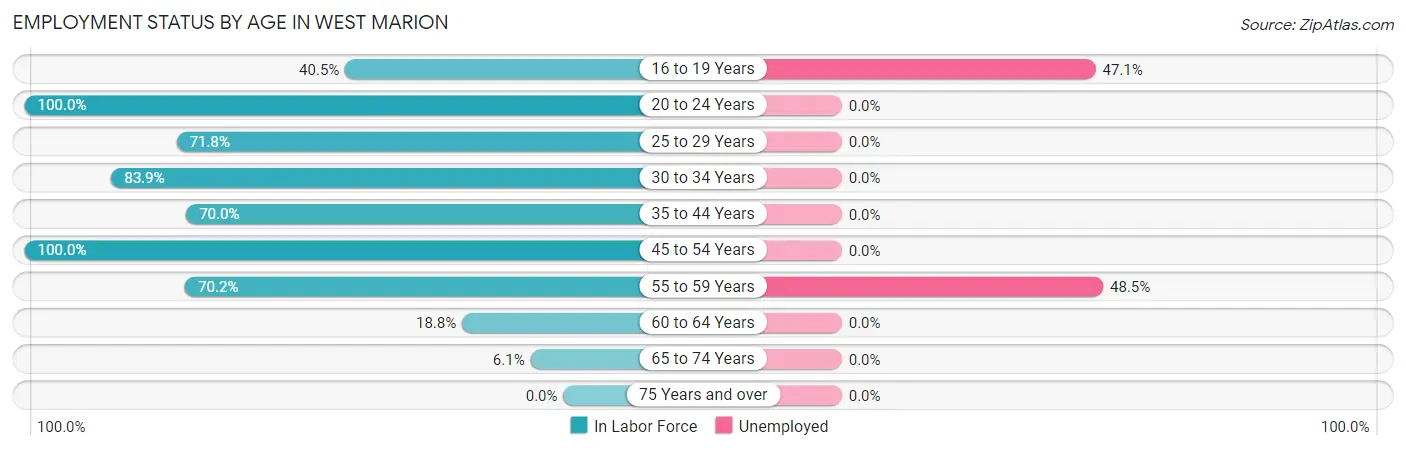
| Age Bracket | In Labor Force | Unemployed |
| 16 to 19 Years | 34 (40.5%) | 16 (47.1%) |
| 20 to 24 Years | 74 (100.0%) | 0 (0.0%) |
| 25 to 29 Years | 28 (71.8%) | 0 (0.0%) |
| 30 to 34 Years | 26 (83.9%) | 0 (0.0%) |
| 35 to 44 Years | 63 (70.0%) | 0 (0.0%) |
| 45 to 54 Years | 92 (100.0%) | 0 (0.0%) |
| 55 to 59 Years | 33 (70.2%) | 16 (48.5%) |
| 60 to 64 Years | 21 (18.8%) | 0 (0.0%) |
| 65 to 74 Years | 9 (6.1%) | 0 (0.0%) |
| 75 Years and over | 0 (0.0%) | 0 (0.0%) |
| Total | 380 (45.6%) | 32 (8.4%) |
Employment Status by Educational Attainment in West Marion
According to labor force statistics for West Marion, 64.0% of individuals (263) out of the total population between 25 and 64 years of age (411) are in the labor force, with 6.1% or 16 of them being unemployed. The group with the highest labor force participation rate are those with the educational attainment of bachelor's degree or higher, with 100.0% or 30 individuals in the labor force. Within the labor force, individuals with college / associate degree education have the highest percentage of unemployment, with 10.4% or 16 of them being unemployed.
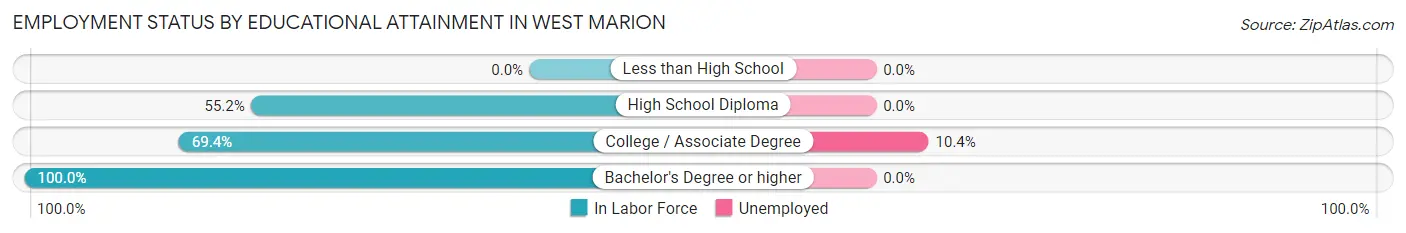
| Educational Attainment | In Labor Force | Unemployed |
| Less than High School | 0 (0.0%) | 0 (0.0%) |
| High School Diploma | 79 (55.2%) | 0 (0.0%) |
| College / Associate Degree | 154 (69.4%) | 23 (10.4%) |
| Bachelor's Degree or higher | 30 (100.0%) | 0 (0.0%) |
| Total | 263 (64.0%) | 25 (6.1%) |
Employment Occupations by Sex in West Marion
Management, Business, Science and Arts Occupations
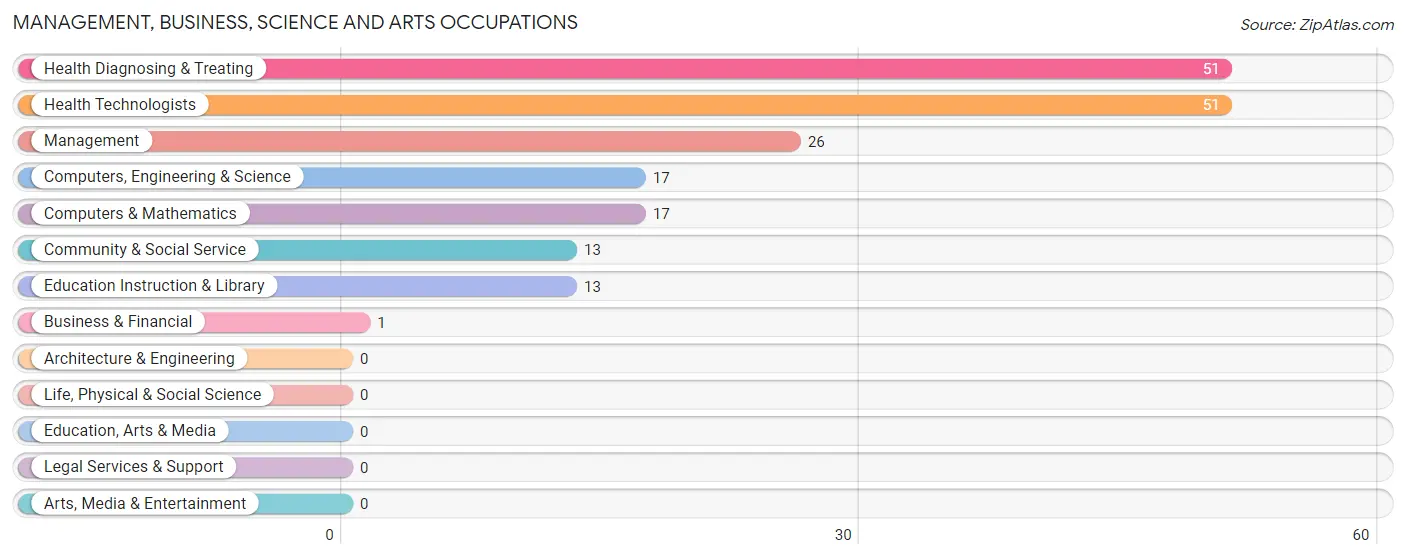
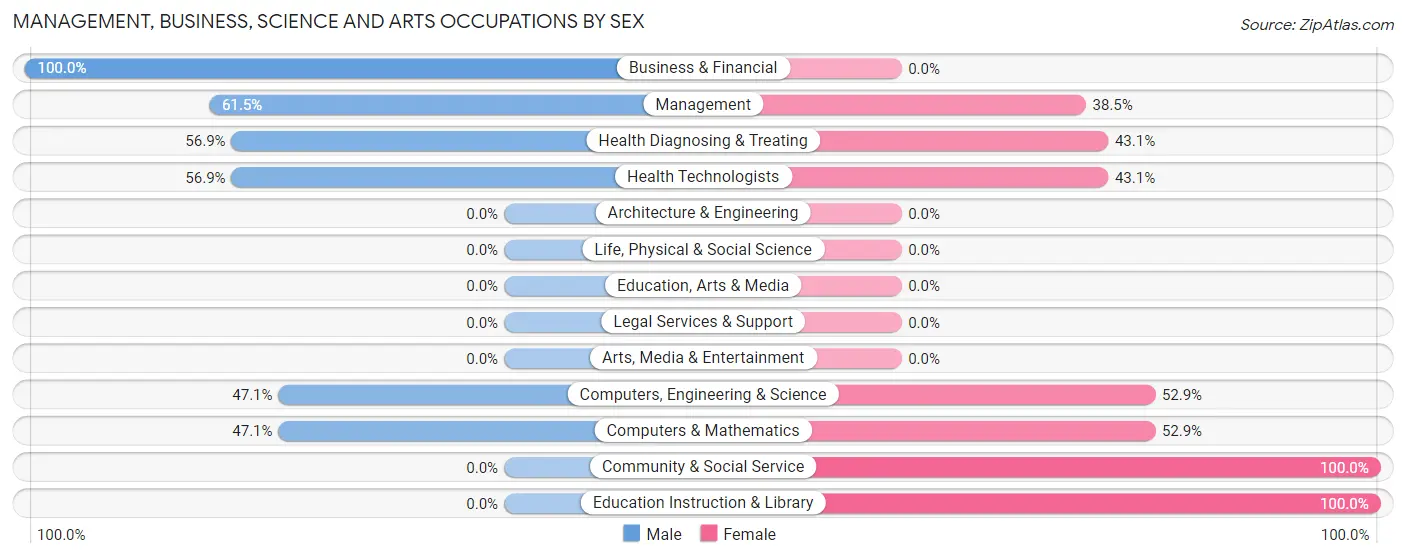
The most common Management, Business, Science and Arts occupations in West Marion are Health Diagnosing & Treating (51 | 14.7%), Health Technologists (51 | 14.7%), Management (26 | 7.5%), Computers, Engineering & Science (17 | 4.9%), and Computers & Mathematics (17 | 4.9%).
Management, Business, Science and Arts Occupations by Sex
Within the Management, Business, Science and Arts occupations in West Marion, the most male-oriented occupations are Business & Financial (100.0%), Management (61.5%), and Health Diagnosing & Treating (56.9%), while the most female-oriented occupations are Community & Social Service (100.0%), Education Instruction & Library (100.0%), and Computers, Engineering & Science (52.9%).
| Occupation | Male | Female |
| Management | 16 (61.5%) | 10 (38.5%) |
| Business & Financial | 1 (100.0%) | 0 (0.0%) |
| Computers, Engineering & Science | 8 (47.1%) | 9 (52.9%) |
| Computers & Mathematics | 8 (47.1%) | 9 (52.9%) |
| Architecture & Engineering | 0 (0.0%) | 0 (0.0%) |
| Life, Physical & Social Science | 0 (0.0%) | 0 (0.0%) |
| Community & Social Service | 0 (0.0%) | 13 (100.0%) |
| Education, Arts & Media | 0 (0.0%) | 0 (0.0%) |
| Legal Services & Support | 0 (0.0%) | 0 (0.0%) |
| Education Instruction & Library | 0 (0.0%) | 13 (100.0%) |
| Arts, Media & Entertainment | 0 (0.0%) | 0 (0.0%) |
| Health Diagnosing & Treating | 29 (56.9%) | 22 (43.1%) |
| Health Technologists | 29 (56.9%) | 22 (43.1%) |
| Total (Category) | 54 (50.0%) | 54 (50.0%) |
| Total (Overall) | 158 (45.4%) | 190 (54.6%) |
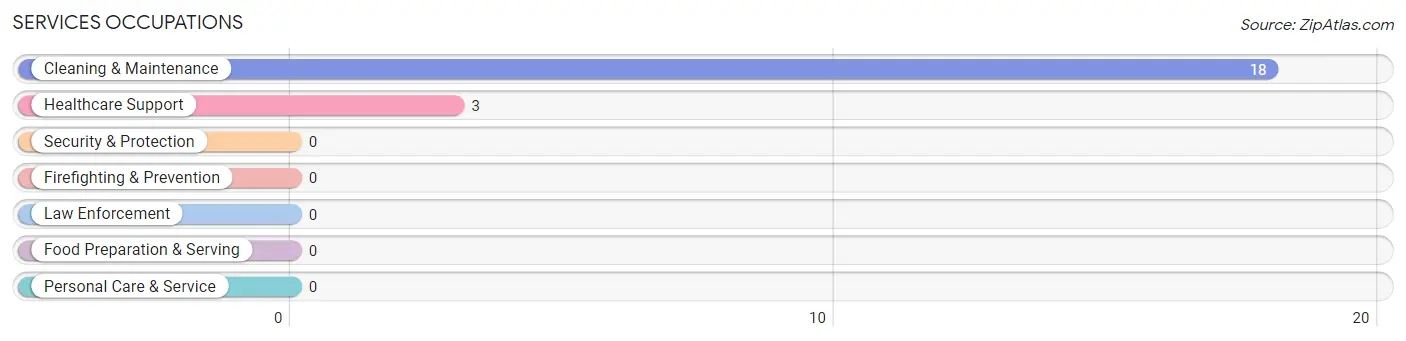
Services Occupations
The most common Services occupations in West Marion are Cleaning & Maintenance (18 | 5.2%), and Healthcare Support (3 | 0.9%).
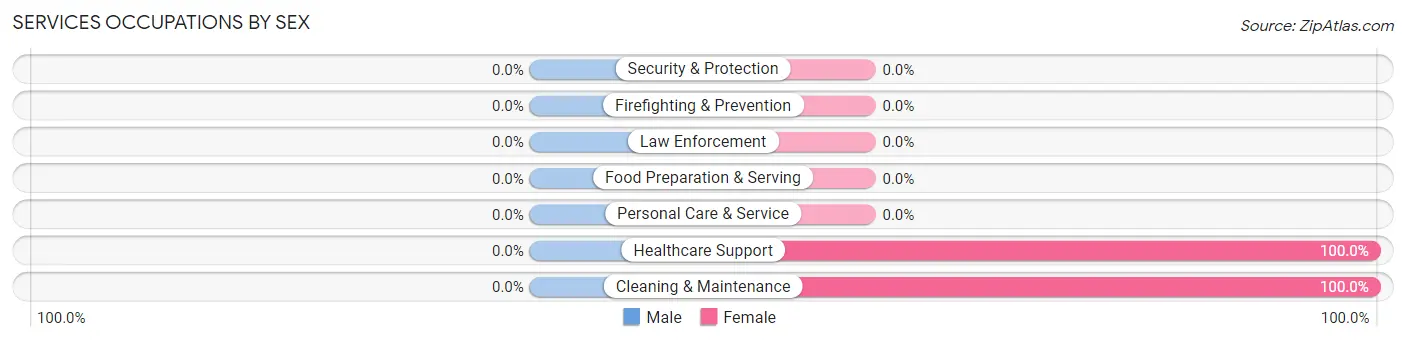
Services Occupations by Sex
| Occupation | Male | Female |
| Healthcare Support | 0 (0.0%) | 3 (100.0%) |
| Security & Protection | 0 (0.0%) | 0 (0.0%) |
| Firefighting & Prevention | 0 (0.0%) | 0 (0.0%) |
| Law Enforcement | 0 (0.0%) | 0 (0.0%) |
| Food Preparation & Serving | 0 (0.0%) | 0 (0.0%) |
| Cleaning & Maintenance | 0 (0.0%) | 18 (100.0%) |
| Personal Care & Service | 0 (0.0%) | 0 (0.0%) |
| Total (Category) | 0 (0.0%) | 21 (100.0%) |
| Total (Overall) | 158 (45.4%) | 190 (54.6%) |
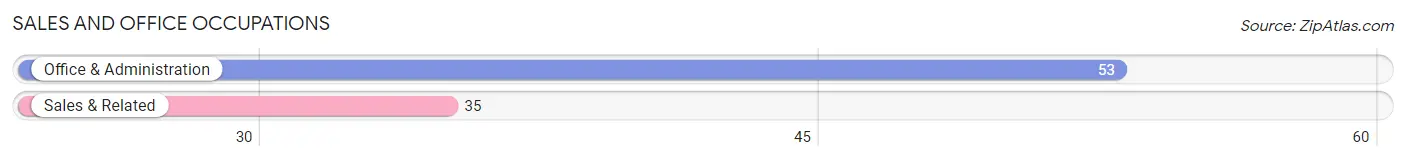
Sales and Office Occupations
The most common Sales and Office occupations in West Marion are Office & Administration (53 | 15.2%), and Sales & Related (35 | 10.1%).
Sales and Office Occupations by Sex
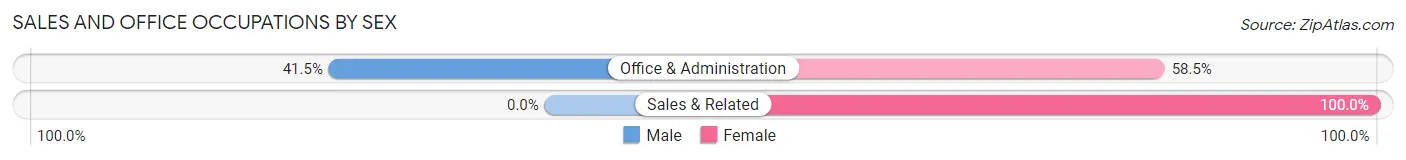
| Occupation | Male | Female |
| Sales & Related | 0 (0.0%) | 35 (100.0%) |
| Office & Administration | 22 (41.5%) | 31 (58.5%) |
| Total (Category) | 22 (25.0%) | 66 (75.0%) |
| Total (Overall) | 158 (45.4%) | 190 (54.6%) |
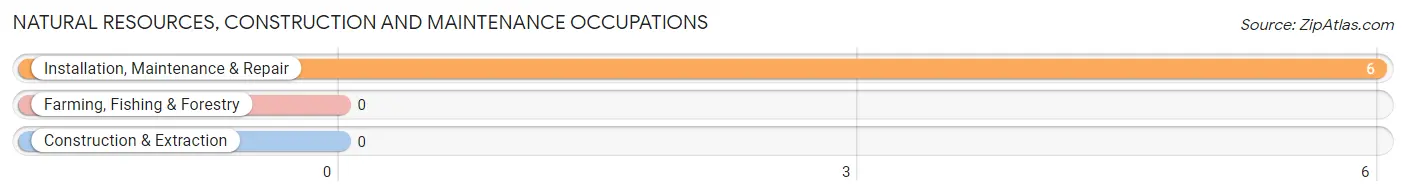
Natural Resources, Construction and Maintenance Occupations
The most common Natural Resources, Construction and Maintenance occupations in West Marion are , and Installation, Maintenance & Repair (6 | 1.7%).
Natural Resources, Construction and Maintenance Occupations by Sex
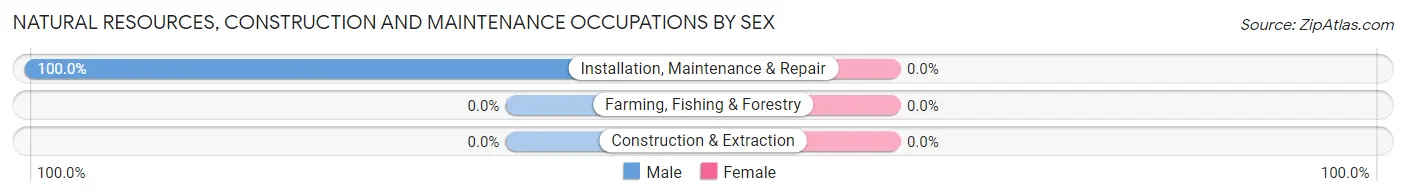
| Occupation | Male | Female |
| Farming, Fishing & Forestry | 0 (0.0%) | 0 (0.0%) |
| Construction & Extraction | 0 (0.0%) | 0 (0.0%) |
| Installation, Maintenance & Repair | 6 (100.0%) | 0 (0.0%) |
| Total (Category) | 6 (100.0%) | 0 (0.0%) |
| Total (Overall) | 158 (45.4%) | 190 (54.6%) |
Production, Transportation and Moving Occupations
The most common Production, Transportation and Moving occupations in West Marion are Production (59 | 17.0%), Material Moving (58 | 16.7%), and Transportation (8 | 2.3%).
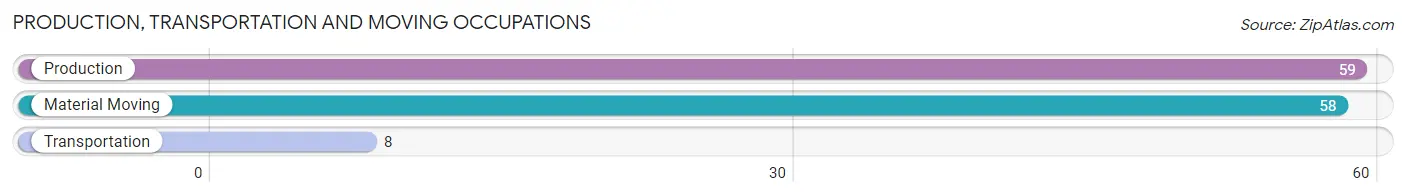
Production, Transportation and Moving Occupations by Sex
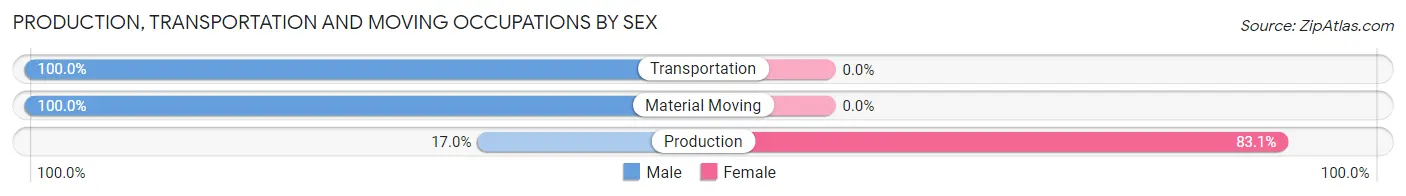
| Occupation | Male | Female |
| Production | 10 (17.0%) | 49 (83.1%) |
| Transportation | 8 (100.0%) | 0 (0.0%) |
| Material Moving | 58 (100.0%) | 0 (0.0%) |
| Total (Category) | 76 (60.8%) | 49 (39.2%) |
| Total (Overall) | 158 (45.4%) | 190 (54.6%) |
Employment Industries by Sex in West Marion
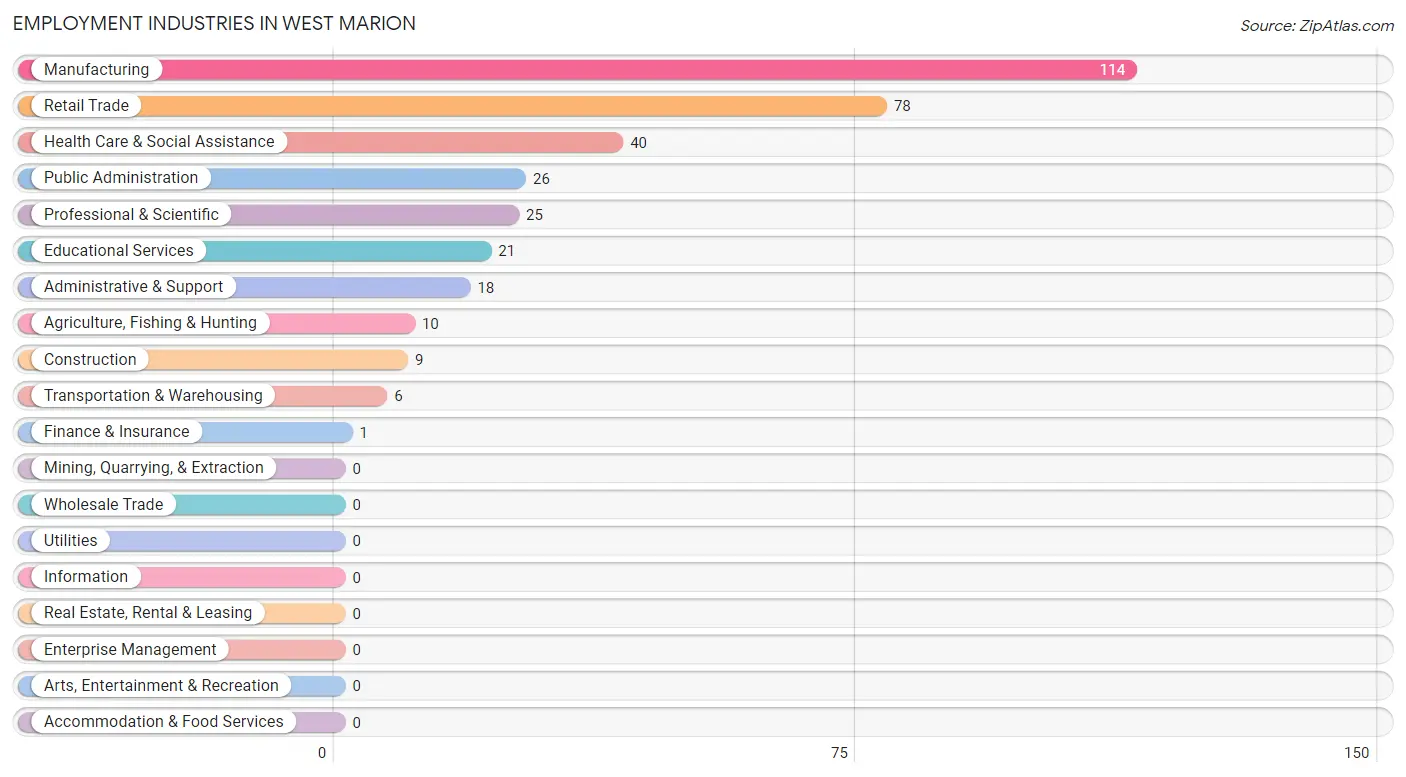
Employment Industries in West Marion
The major employment industries in West Marion include Manufacturing (114 | 32.8%), Retail Trade (78 | 22.4%), Health Care & Social Assistance (40 | 11.5%), Public Administration (26 | 7.5%), and Professional & Scientific (25 | 7.2%).
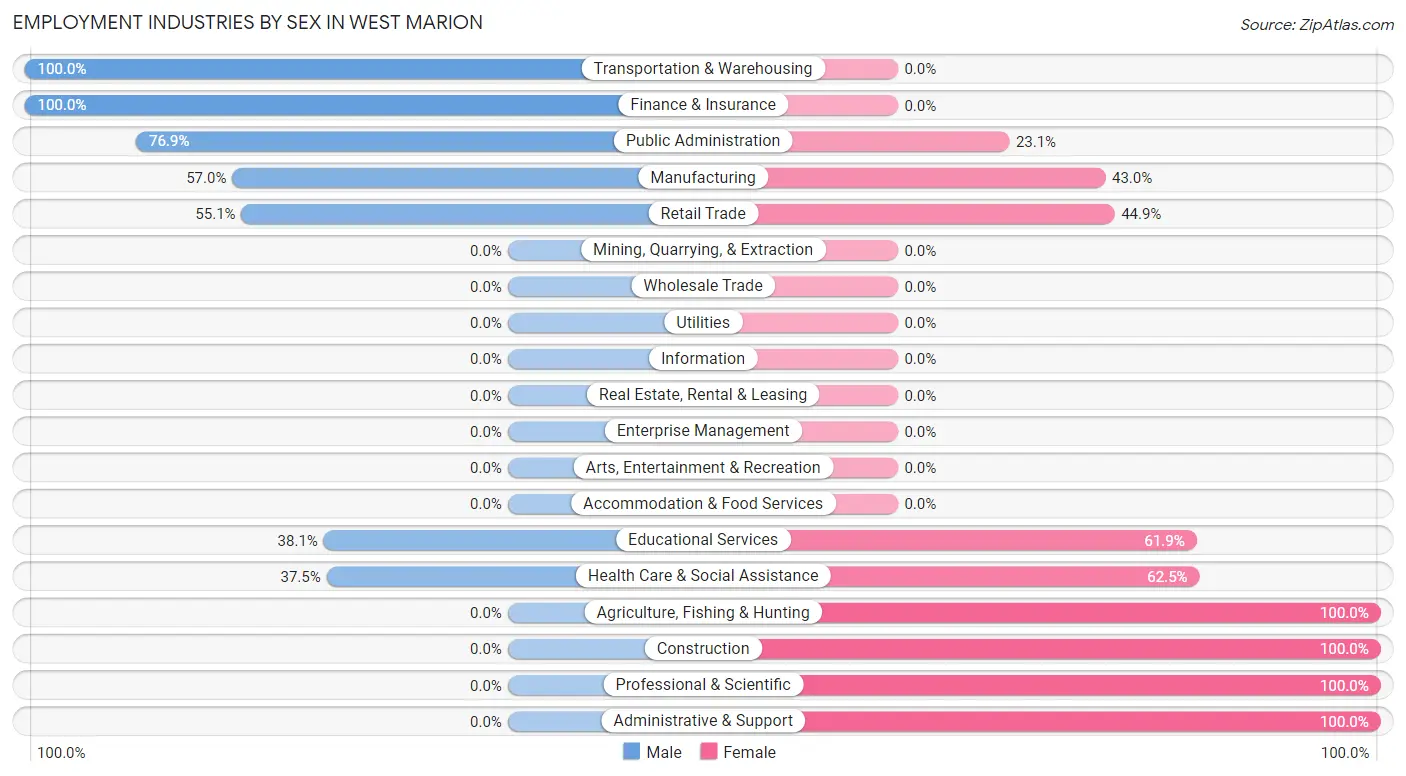
Employment Industries by Sex in West Marion
The West Marion industries that see more men than women are Transportation & Warehousing (100.0%), Finance & Insurance (100.0%), and Public Administration (76.9%), whereas the industries that tend to have a higher number of women are Agriculture, Fishing & Hunting (100.0%), Construction (100.0%), and Professional & Scientific (100.0%).
| Industry | Male | Female |
| Agriculture, Fishing & Hunting | 0 (0.0%) | 10 (100.0%) |
| Mining, Quarrying, & Extraction | 0 (0.0%) | 0 (0.0%) |
| Construction | 0 (0.0%) | 9 (100.0%) |
| Manufacturing | 65 (57.0%) | 49 (43.0%) |
| Wholesale Trade | 0 (0.0%) | 0 (0.0%) |
| Retail Trade | 43 (55.1%) | 35 (44.9%) |
| Transportation & Warehousing | 6 (100.0%) | 0 (0.0%) |
| Utilities | 0 (0.0%) | 0 (0.0%) |
| Information | 0 (0.0%) | 0 (0.0%) |
| Finance & Insurance | 1 (100.0%) | 0 (0.0%) |
| Real Estate, Rental & Leasing | 0 (0.0%) | 0 (0.0%) |
| Professional & Scientific | 0 (0.0%) | 25 (100.0%) |
| Enterprise Management | 0 (0.0%) | 0 (0.0%) |
| Administrative & Support | 0 (0.0%) | 18 (100.0%) |
| Educational Services | 8 (38.1%) | 13 (61.9%) |
| Health Care & Social Assistance | 15 (37.5%) | 25 (62.5%) |
| Arts, Entertainment & Recreation | 0 (0.0%) | 0 (0.0%) |
| Accommodation & Food Services | 0 (0.0%) | 0 (0.0%) |
| Public Administration | 20 (76.9%) | 6 (23.1%) |
| Total | 158 (45.4%) | 190 (54.6%) |
Education in West Marion
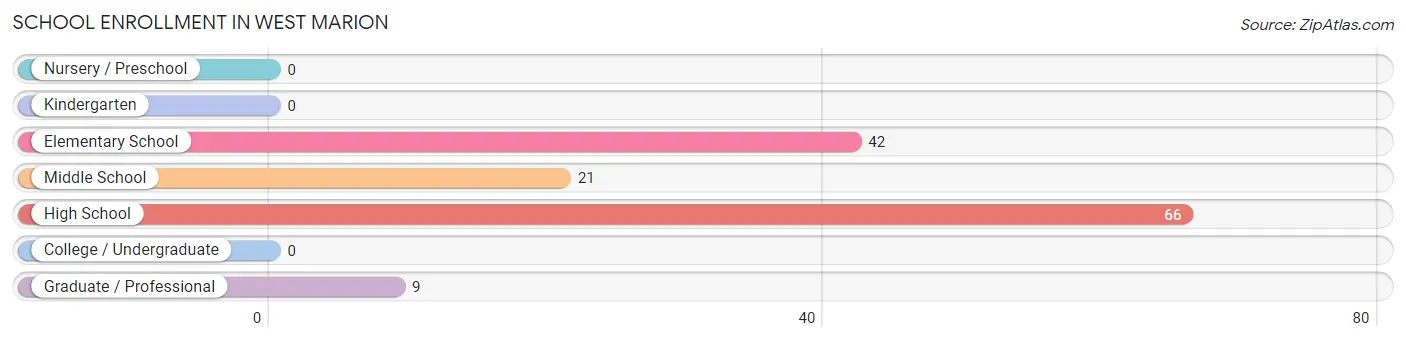
School Enrollment in West Marion
The most common levels of schooling among the 138 students in West Marion are high school (66 | 47.8%), elementary school (42 | 30.4%), and middle school (21 | 15.2%).
| School Level | # Students | % Students |
| Nursery / Preschool | 0 | 0.0% |
| Kindergarten | 0 | 0.0% |
| Elementary School | 42 | 30.4% |
| Middle School | 21 | 15.2% |
| High School | 66 | 47.8% |
| College / Undergraduate | 0 | 0.0% |
| Graduate / Professional | 9 | 6.5% |
| Total | 138 | 100.0% |
School Enrollment by Age by Funding Source in West Marion
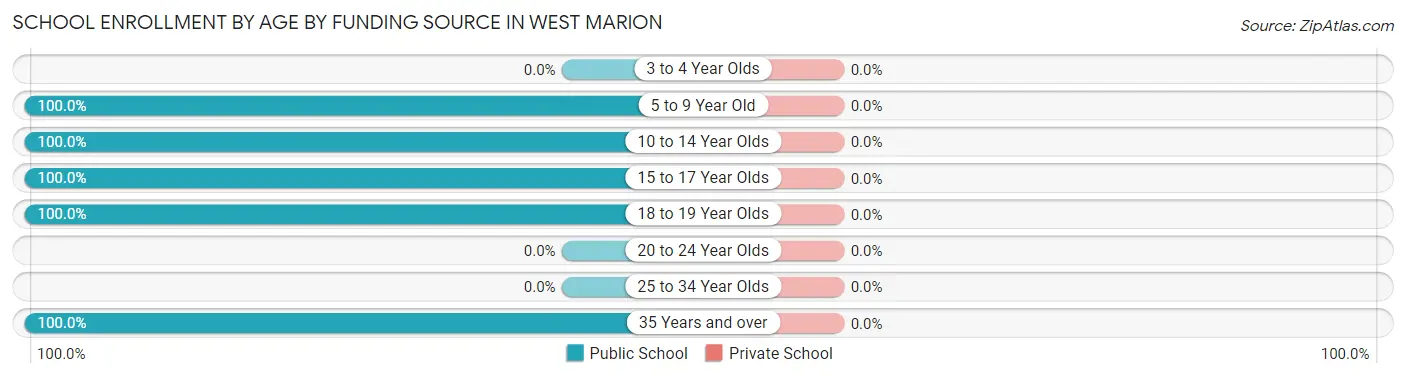
| Age Bracket | Public School | Private School |
| 3 to 4 Year Olds | 0 (0.0%) | 0 (0.0%) |
| 5 to 9 Year Old | 18 (100.0%) | 0 (0.0%) |
| 10 to 14 Year Olds | 45 (100.0%) | 0 (0.0%) |
| 15 to 17 Year Olds | 43 (100.0%) | 0 (0.0%) |
| 18 to 19 Year Olds | 23 (100.0%) | 0 (0.0%) |
| 20 to 24 Year Olds | 0 (0.0%) | 0 (0.0%) |
| 25 to 34 Year Olds | 0 (0.0%) | 0 (0.0%) |
| 35 Years and over | 9 (100.0%) | 0 (0.0%) |
| Total | 138 (100.0%) | 0 (0.0%) |
Educational Attainment by Field of Study in West Marion
Science & technology (25 | 35.2%), bio, nature & agricultural (16 | 22.5%), education (13 | 18.3%), arts & humanities (9 | 12.7%), and business (8 | 11.3%) are the most common fields of study among 71 individuals in West Marion who have obtained a bachelor's degree or higher.
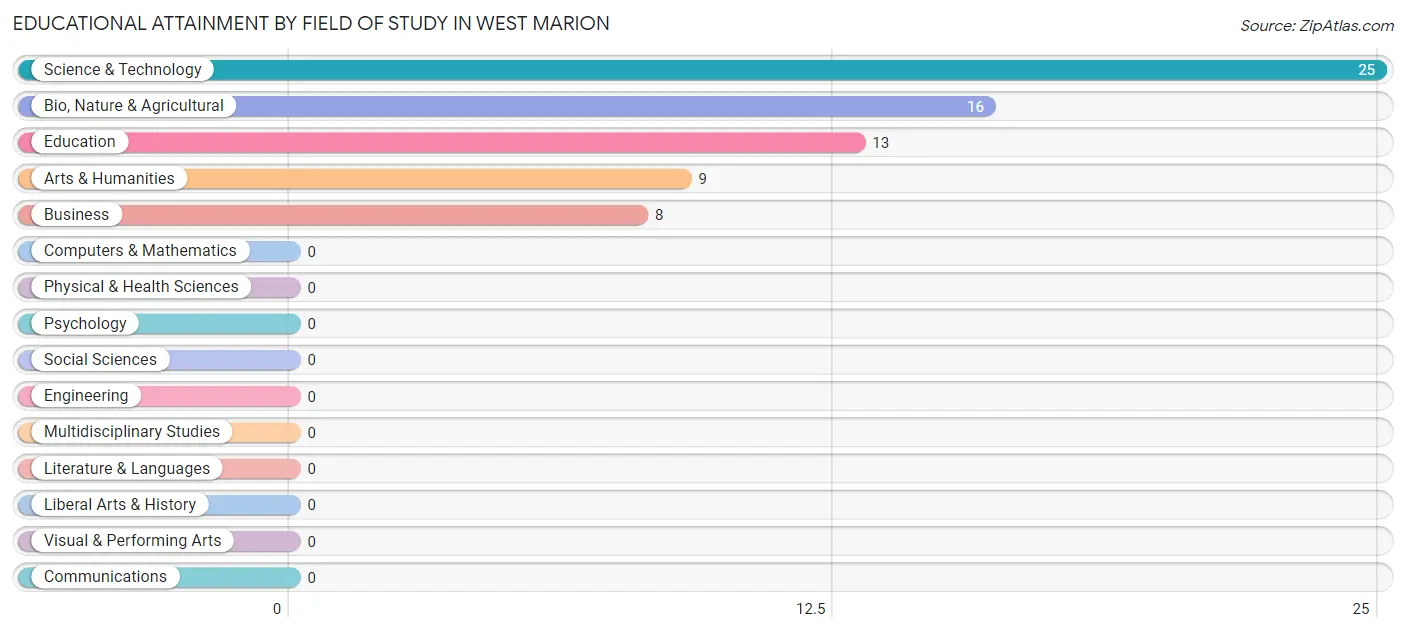
| Field of Study | # Graduates | % Graduates |
| Computers & Mathematics | 0 | 0.0% |
| Bio, Nature & Agricultural | 16 | 22.5% |
| Physical & Health Sciences | 0 | 0.0% |
| Psychology | 0 | 0.0% |
| Social Sciences | 0 | 0.0% |
| Engineering | 0 | 0.0% |
| Multidisciplinary Studies | 0 | 0.0% |
| Science & Technology | 25 | 35.2% |
| Business | 8 | 11.3% |
| Education | 13 | 18.3% |
| Literature & Languages | 0 | 0.0% |
| Liberal Arts & History | 0 | 0.0% |
| Visual & Performing Arts | 0 | 0.0% |
| Communications | 0 | 0.0% |
| Arts & Humanities | 9 | 12.7% |
| Total | 71 | 100.0% |
Transportation & Commute in West Marion
Vehicle Availability by Sex in West Marion
The most prevalent vehicle ownership categories in West Marion are males with 2 vehicles (97, accounting for 61.4%) and females with 2 vehicles (67, making up 53.6%).
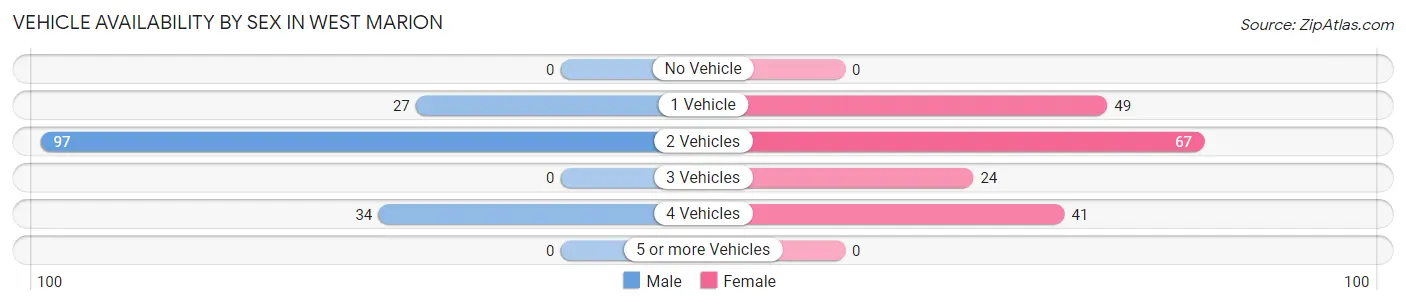
| Vehicles Available | Male | Female |
| No Vehicle | 0 (0.0%) | 0 (0.0%) |
| 1 Vehicle | 27 (17.1%) | 49 (27.1%) |
| 2 Vehicles | 97 (61.4%) | 67 (37.0%) |
| 3 Vehicles | 0 (0.0%) | 24 (13.3%) |
| 4 Vehicles | 34 (21.5%) | 41 (22.7%) |
| 5 or more Vehicles | 0 (0.0%) | 0 (0.0%) |
| Total | 158 (100.0%) | 181 (100.0%) |
Commute Time in West Marion
The most frequently occuring commute durations in West Marion are 10 to 14 minutes (101 commuters, 31.3%), 15 to 19 minutes (65 commuters, 20.1%), and 20 to 24 minutes (53 commuters, 16.4%).
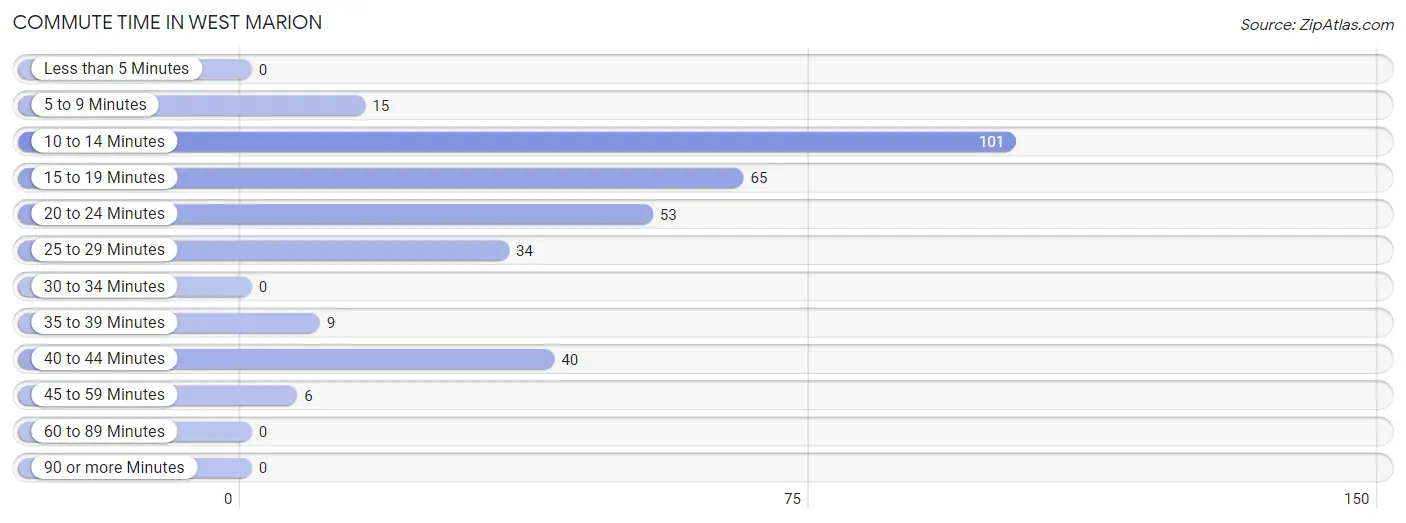
| Commute Time | # Commuters | % Commuters |
| Less than 5 Minutes | 0 | 0.0% |
| 5 to 9 Minutes | 15 | 4.6% |
| 10 to 14 Minutes | 101 | 31.3% |
| 15 to 19 Minutes | 65 | 20.1% |
| 20 to 24 Minutes | 53 | 16.4% |
| 25 to 29 Minutes | 34 | 10.5% |
| 30 to 34 Minutes | 0 | 0.0% |
| 35 to 39 Minutes | 9 | 2.8% |
| 40 to 44 Minutes | 40 | 12.4% |
| 45 to 59 Minutes | 6 | 1.9% |
| 60 to 89 Minutes | 0 | 0.0% |
| 90 or more Minutes | 0 | 0.0% |
Commute Time by Sex in West Marion
The most common commute times in West Marion are 15 to 19 minutes (47 commuters, 29.7%) for males and 10 to 14 minutes (58 commuters, 35.1%) for females.
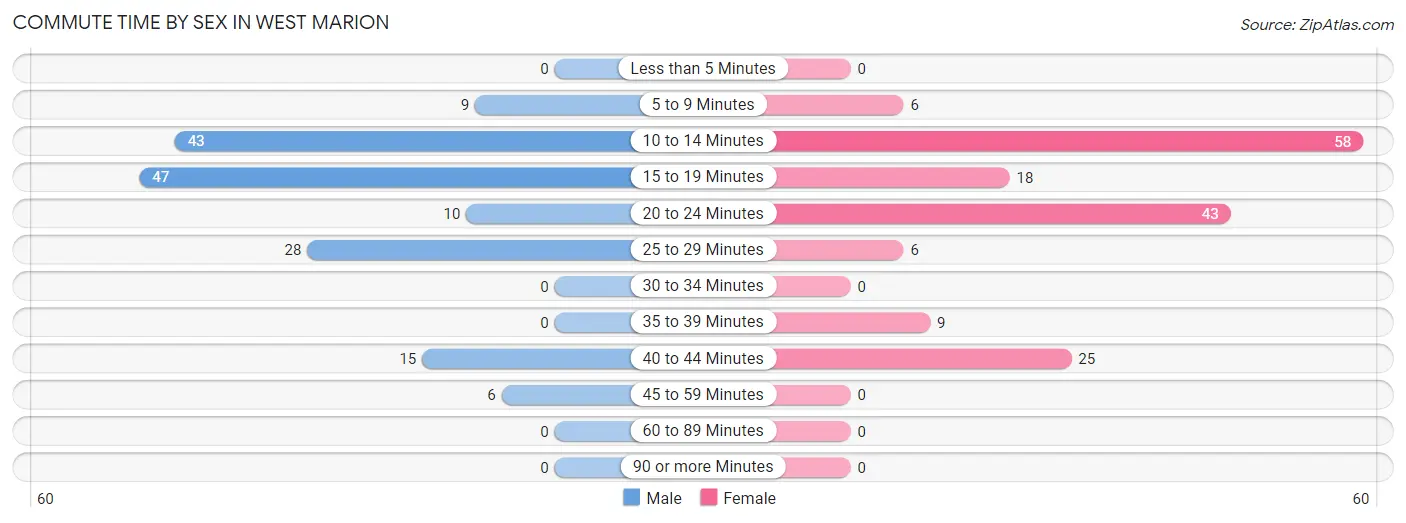
| Commute Time | Male | Female |
| Less than 5 Minutes | 0 (0.0%) | 0 (0.0%) |
| 5 to 9 Minutes | 9 (5.7%) | 6 (3.6%) |
| 10 to 14 Minutes | 43 (27.2%) | 58 (35.1%) |
| 15 to 19 Minutes | 47 (29.7%) | 18 (10.9%) |
| 20 to 24 Minutes | 10 (6.3%) | 43 (26.1%) |
| 25 to 29 Minutes | 28 (17.7%) | 6 (3.6%) |
| 30 to 34 Minutes | 0 (0.0%) | 0 (0.0%) |
| 35 to 39 Minutes | 0 (0.0%) | 9 (5.4%) |
| 40 to 44 Minutes | 15 (9.5%) | 25 (15.1%) |
| 45 to 59 Minutes | 6 (3.8%) | 0 (0.0%) |
| 60 to 89 Minutes | 0 (0.0%) | 0 (0.0%) |
| 90 or more Minutes | 0 (0.0%) | 0 (0.0%) |
Time of Departure to Work by Sex in West Marion
The most frequent times of departure to work in West Marion are 7:00 AM to 7:29 AM (52, 32.9%) for males and 7:00 AM to 7:29 AM (66, 40.0%) for females.
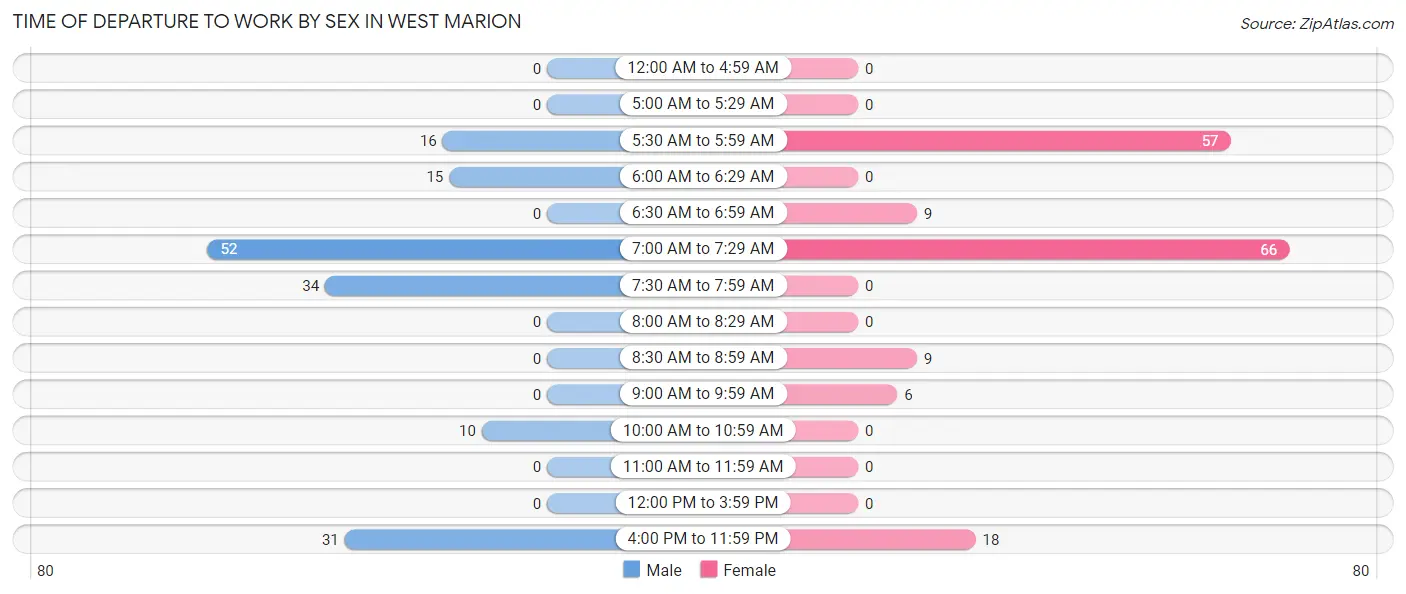
| Time of Departure | Male | Female |
| 12:00 AM to 4:59 AM | 0 (0.0%) | 0 (0.0%) |
| 5:00 AM to 5:29 AM | 0 (0.0%) | 0 (0.0%) |
| 5:30 AM to 5:59 AM | 16 (10.1%) | 57 (34.5%) |
| 6:00 AM to 6:29 AM | 15 (9.5%) | 0 (0.0%) |
| 6:30 AM to 6:59 AM | 0 (0.0%) | 9 (5.4%) |
| 7:00 AM to 7:29 AM | 52 (32.9%) | 66 (40.0%) |
| 7:30 AM to 7:59 AM | 34 (21.5%) | 0 (0.0%) |
| 8:00 AM to 8:29 AM | 0 (0.0%) | 0 (0.0%) |
| 8:30 AM to 8:59 AM | 0 (0.0%) | 9 (5.4%) |
| 9:00 AM to 9:59 AM | 0 (0.0%) | 6 (3.6%) |
| 10:00 AM to 10:59 AM | 10 (6.3%) | 0 (0.0%) |
| 11:00 AM to 11:59 AM | 0 (0.0%) | 0 (0.0%) |
| 12:00 PM to 3:59 PM | 0 (0.0%) | 0 (0.0%) |
| 4:00 PM to 11:59 PM | 31 (19.6%) | 18 (10.9%) |
| Total | 158 (100.0%) | 165 (100.0%) |
Housing Occupancy in West Marion
Occupancy by Ownership in West Marion
Of the total 503 dwellings in West Marion, owner-occupied units account for 362 (72.0%), while renter-occupied units make up 141 (28.0%).
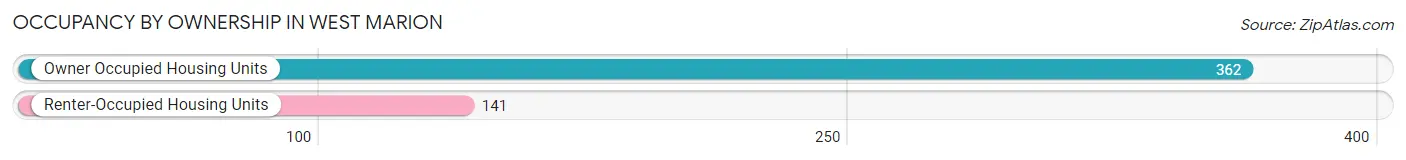
| Occupancy | # Housing Units | % Housing Units |
| Owner Occupied Housing Units | 362 | 72.0% |
| Renter-Occupied Housing Units | 141 | 28.0% |
| Total Occupied Housing Units | 503 | 100.0% |
Occupancy by Household Size in West Marion
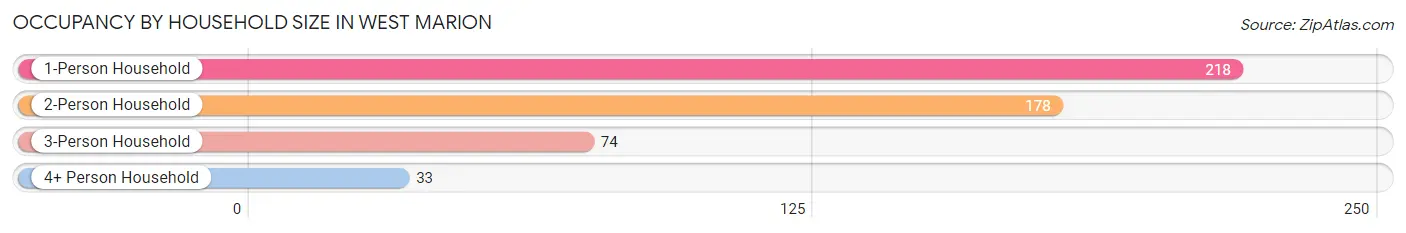
| Household Size | # Housing Units | % Housing Units |
| 1-Person Household | 218 | 43.3% |
| 2-Person Household | 178 | 35.4% |
| 3-Person Household | 74 | 14.7% |
| 4+ Person Household | 33 | 6.6% |
| Total Housing Units | 503 | 100.0% |
Occupancy by Ownership by Household Size in West Marion
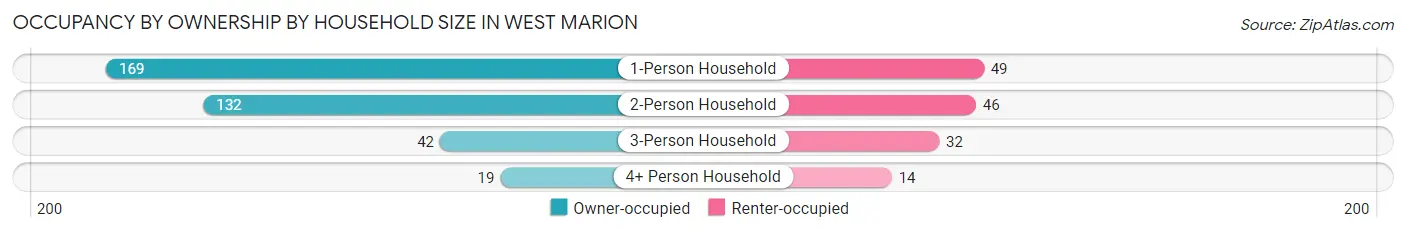
| Household Size | Owner-occupied | Renter-occupied |
| 1-Person Household | 169 (77.5%) | 49 (22.5%) |
| 2-Person Household | 132 (74.2%) | 46 (25.8%) |
| 3-Person Household | 42 (56.8%) | 32 (43.2%) |
| 4+ Person Household | 19 (57.6%) | 14 (42.4%) |
| Total Housing Units | 362 (72.0%) | 141 (28.0%) |
Occupancy by Educational Attainment in West Marion
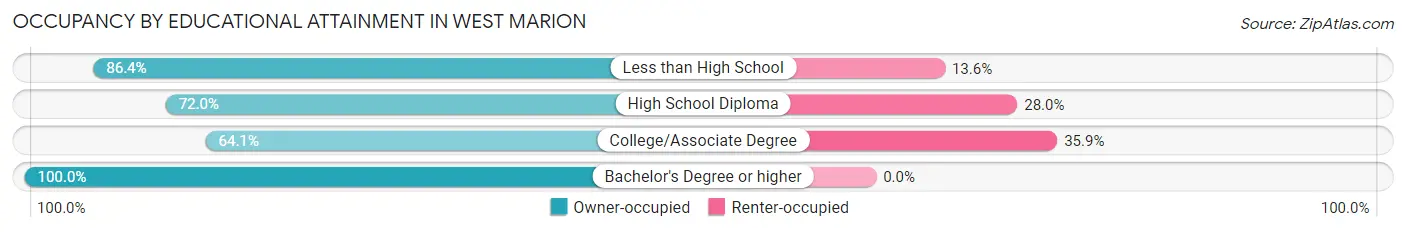
| Household Size | Owner-occupied | Renter-occupied |
| Less than High School | 19 (86.4%) | 3 (13.6%) |
| High School Diploma | 139 (72.0%) | 54 (28.0%) |
| College/Associate Degree | 150 (64.1%) | 84 (35.9%) |
| Bachelor's Degree or higher | 54 (100.0%) | 0 (0.0%) |
Occupancy by Age of Householder in West Marion
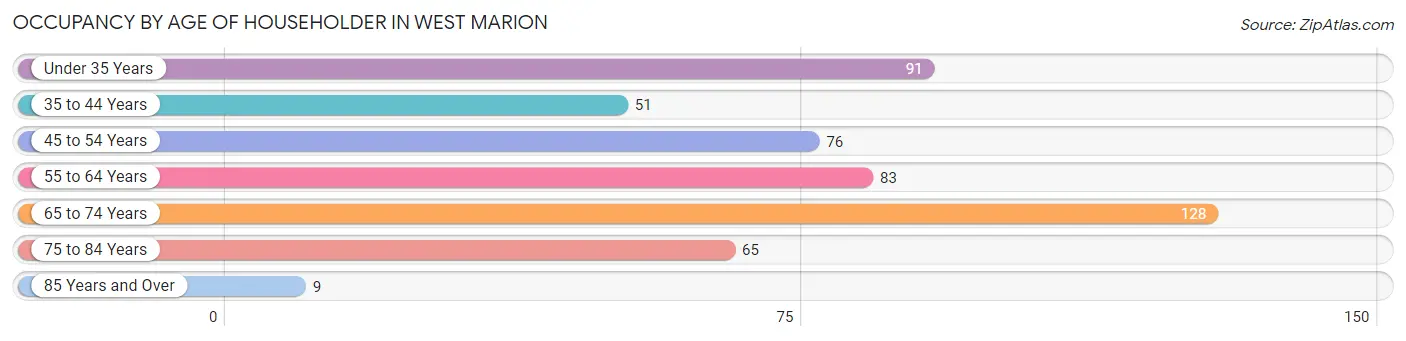
| Age Bracket | # Households | % Households |
| Under 35 Years | 91 | 18.1% |
| 35 to 44 Years | 51 | 10.1% |
| 45 to 54 Years | 76 | 15.1% |
| 55 to 64 Years | 83 | 16.5% |
| 65 to 74 Years | 128 | 25.5% |
| 75 to 84 Years | 65 | 12.9% |
| 85 Years and Over | 9 | 1.8% |
| Total | 503 | 100.0% |
Housing Finances in West Marion
Median Income by Occupancy in West Marion
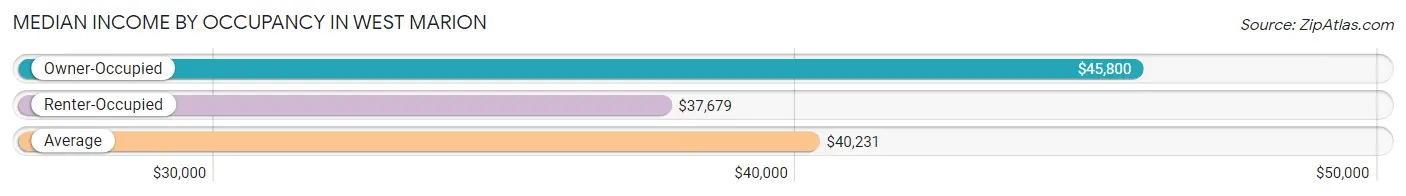
| Occupancy Type | # Households | Median Income |
| Owner-Occupied | 362 (72.0%) | $45,800 |
| Renter-Occupied | 141 (28.0%) | $37,679 |
| Average | 503 (100.0%) | $40,231 |
Occupancy by Householder Income Bracket in West Marion
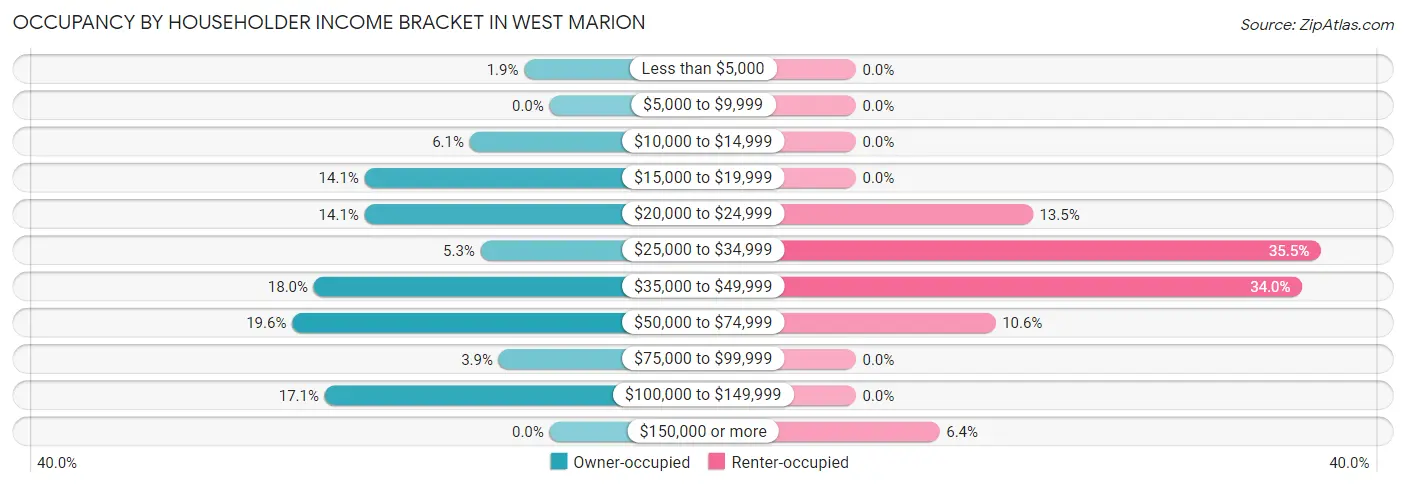
| Income Bracket | Owner-occupied | Renter-occupied |
| Less than $5,000 | 7 (1.9%) | 0 (0.0%) |
| $5,000 to $9,999 | 0 (0.0%) | 0 (0.0%) |
| $10,000 to $14,999 | 22 (6.1%) | 0 (0.0%) |
| $15,000 to $19,999 | 51 (14.1%) | 0 (0.0%) |
| $20,000 to $24,999 | 51 (14.1%) | 19 (13.5%) |
| $25,000 to $34,999 | 19 (5.2%) | 50 (35.5%) |
| $35,000 to $49,999 | 65 (18.0%) | 48 (34.0%) |
| $50,000 to $74,999 | 71 (19.6%) | 15 (10.6%) |
| $75,000 to $99,999 | 14 (3.9%) | 0 (0.0%) |
| $100,000 to $149,999 | 62 (17.1%) | 0 (0.0%) |
| $150,000 or more | 0 (0.0%) | 9 (6.4%) |
| Total | 362 (100.0%) | 141 (100.0%) |
Monthly Housing Cost Tiers in West Marion
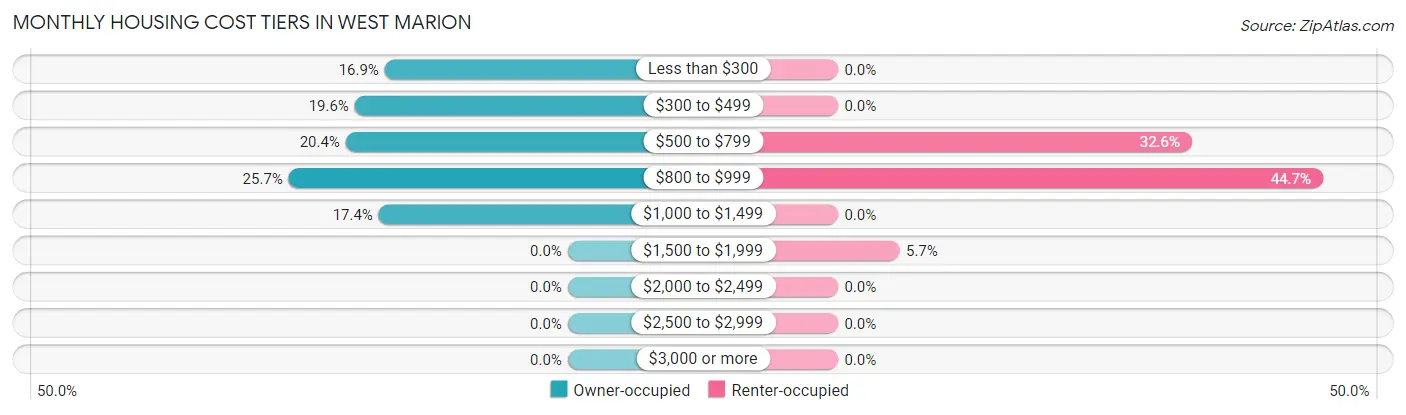
| Monthly Cost | Owner-occupied | Renter-occupied |
| Less than $300 | 61 (16.9%) | 0 (0.0%) |
| $300 to $499 | 71 (19.6%) | 0 (0.0%) |
| $500 to $799 | 74 (20.4%) | 46 (32.6%) |
| $800 to $999 | 93 (25.7%) | 63 (44.7%) |
| $1,000 to $1,499 | 63 (17.4%) | 0 (0.0%) |
| $1,500 to $1,999 | 0 (0.0%) | 8 (5.7%) |
| $2,000 to $2,499 | 0 (0.0%) | 0 (0.0%) |
| $2,500 to $2,999 | 0 (0.0%) | 0 (0.0%) |
| $3,000 or more | 0 (0.0%) | 0 (0.0%) |
| Total | 362 (100.0%) | 141 (100.0%) |
Physical Housing Characteristics in West Marion
Housing Structures in West Marion
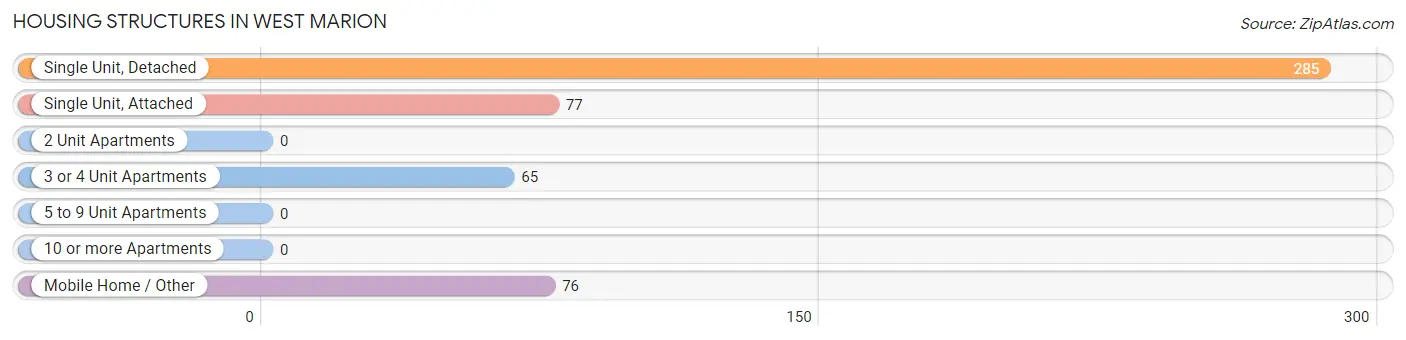
| Structure Type | # Housing Units | % Housing Units |
| Single Unit, Detached | 285 | 56.7% |
| Single Unit, Attached | 77 | 15.3% |
| 2 Unit Apartments | 0 | 0.0% |
| 3 or 4 Unit Apartments | 65 | 12.9% |
| 5 to 9 Unit Apartments | 0 | 0.0% |
| 10 or more Apartments | 0 | 0.0% |
| Mobile Home / Other | 76 | 15.1% |
| Total | 503 | 100.0% |
Housing Structures by Occupancy in West Marion
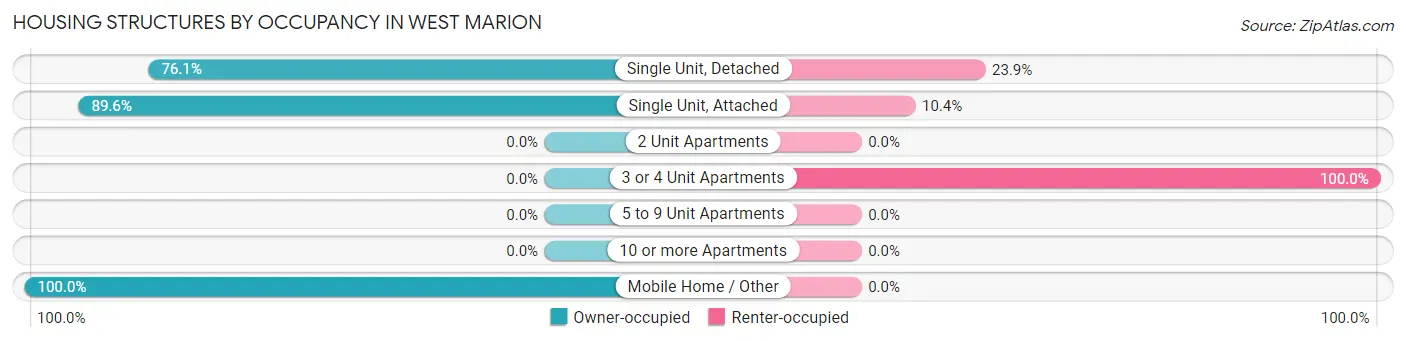
| Structure Type | Owner-occupied | Renter-occupied |
| Single Unit, Detached | 217 (76.1%) | 68 (23.9%) |
| Single Unit, Attached | 69 (89.6%) | 8 (10.4%) |
| 2 Unit Apartments | 0 (0.0%) | 0 (0.0%) |
| 3 or 4 Unit Apartments | 0 (0.0%) | 65 (100.0%) |
| 5 to 9 Unit Apartments | 0 (0.0%) | 0 (0.0%) |
| 10 or more Apartments | 0 (0.0%) | 0 (0.0%) |
| Mobile Home / Other | 76 (100.0%) | 0 (0.0%) |
| Total | 362 (72.0%) | 141 (28.0%) |
Housing Structures by Number of Rooms in West Marion
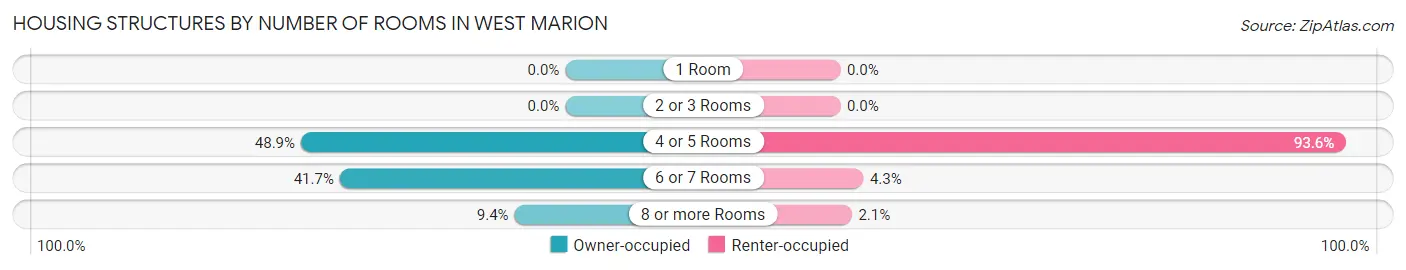
| Number of Rooms | Owner-occupied | Renter-occupied |
| 1 Room | 0 (0.0%) | 0 (0.0%) |
| 2 or 3 Rooms | 0 (0.0%) | 0 (0.0%) |
| 4 or 5 Rooms | 177 (48.9%) | 132 (93.6%) |
| 6 or 7 Rooms | 151 (41.7%) | 6 (4.3%) |
| 8 or more Rooms | 34 (9.4%) | 3 (2.1%) |
| Total | 362 (100.0%) | 141 (100.0%) |
Housing Structure by Heating Type in West Marion
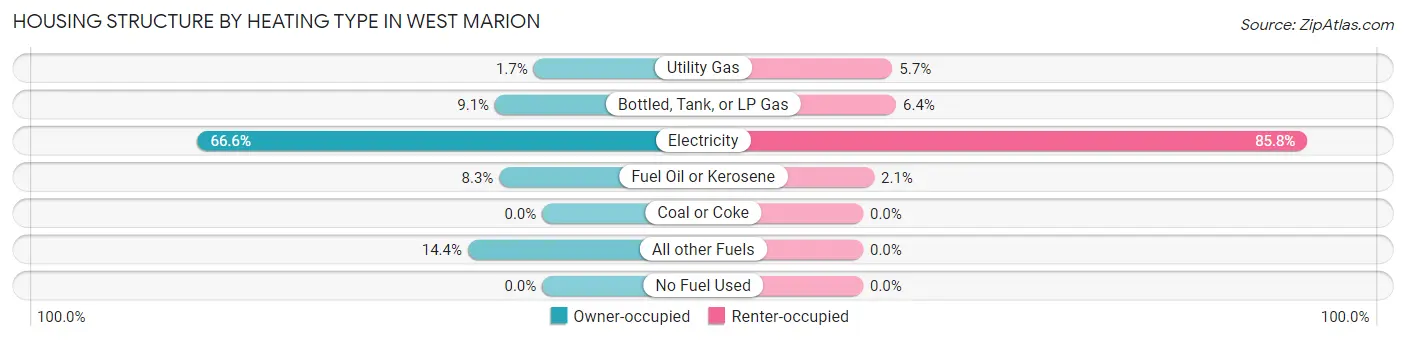
| Heating Type | Owner-occupied | Renter-occupied |
| Utility Gas | 6 (1.7%) | 8 (5.7%) |
| Bottled, Tank, or LP Gas | 33 (9.1%) | 9 (6.4%) |
| Electricity | 241 (66.6%) | 121 (85.8%) |
| Fuel Oil or Kerosene | 30 (8.3%) | 3 (2.1%) |
| Coal or Coke | 0 (0.0%) | 0 (0.0%) |
| All other Fuels | 52 (14.4%) | 0 (0.0%) |
| No Fuel Used | 0 (0.0%) | 0 (0.0%) |
| Total | 362 (100.0%) | 141 (100.0%) |
Household Vehicle Usage in West Marion
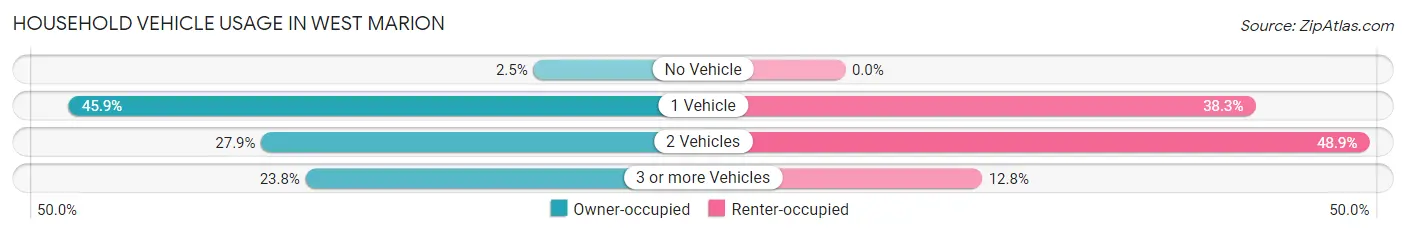
| Vehicles per Household | Owner-occupied | Renter-occupied |
| No Vehicle | 9 (2.5%) | 0 (0.0%) |
| 1 Vehicle | 166 (45.9%) | 54 (38.3%) |
| 2 Vehicles | 101 (27.9%) | 69 (48.9%) |
| 3 or more Vehicles | 86 (23.8%) | 18 (12.8%) |
| Total | 362 (100.0%) | 141 (100.0%) |
Real Estate & Mortgages in West Marion
Real Estate and Mortgage Overview in West Marion
| Characteristic | Without Mortgage | With Mortgage |
| Housing Units | 138 | 224 |
| Median Property Value | $85,000 | $154,100 |
| Median Household Income | - | - |
| Monthly Housing Costs | $352 | $0 |
| Real Estate Taxes | $400 | $0 |
Property Value by Mortgage Status in West Marion
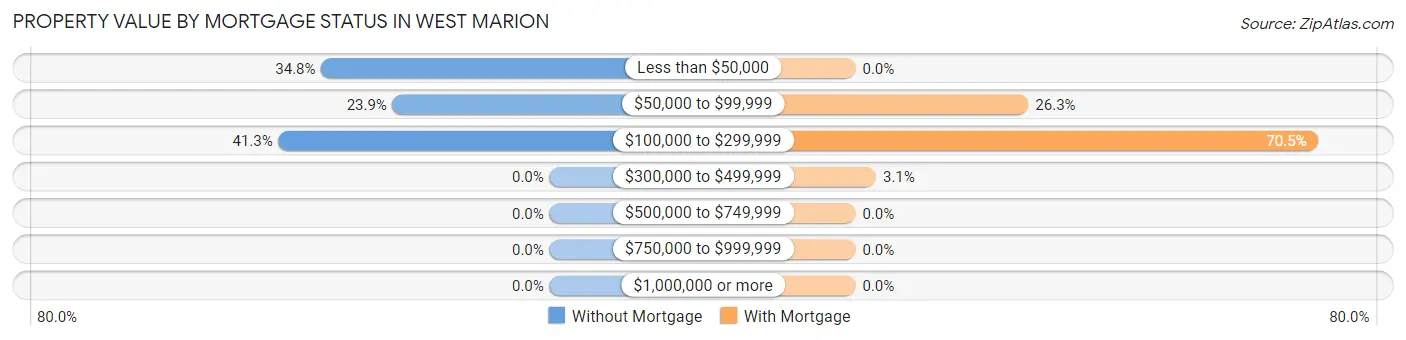
| Property Value | Without Mortgage | With Mortgage |
| Less than $50,000 | 48 (34.8%) | 0 (0.0%) |
| $50,000 to $99,999 | 33 (23.9%) | 59 (26.3%) |
| $100,000 to $299,999 | 57 (41.3%) | 158 (70.5%) |
| $300,000 to $499,999 | 0 (0.0%) | 7 (3.1%) |
| $500,000 to $749,999 | 0 (0.0%) | 0 (0.0%) |
| $750,000 to $999,999 | 0 (0.0%) | 0 (0.0%) |
| $1,000,000 or more | 0 (0.0%) | 0 (0.0%) |
| Total | 138 (100.0%) | 224 (100.0%) |
Household Income by Mortgage Status in West Marion
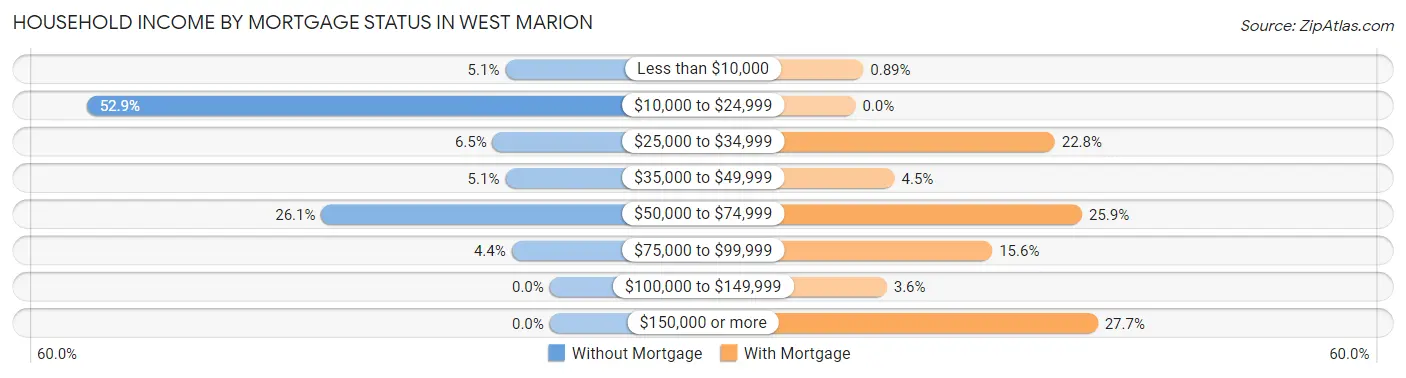
| Household Income | Without Mortgage | With Mortgage |
| Less than $10,000 | 7 (5.1%) | 2 (0.9%) |
| $10,000 to $24,999 | 73 (52.9%) | 0 (0.0%) |
| $25,000 to $34,999 | 9 (6.5%) | 51 (22.8%) |
| $35,000 to $49,999 | 7 (5.1%) | 10 (4.5%) |
| $50,000 to $74,999 | 36 (26.1%) | 58 (25.9%) |
| $75,000 to $99,999 | 6 (4.3%) | 35 (15.6%) |
| $100,000 to $149,999 | 0 (0.0%) | 8 (3.6%) |
| $150,000 or more | 0 (0.0%) | 62 (27.7%) |
| Total | 138 (100.0%) | 224 (100.0%) |
Property Value to Household Income Ratio in West Marion
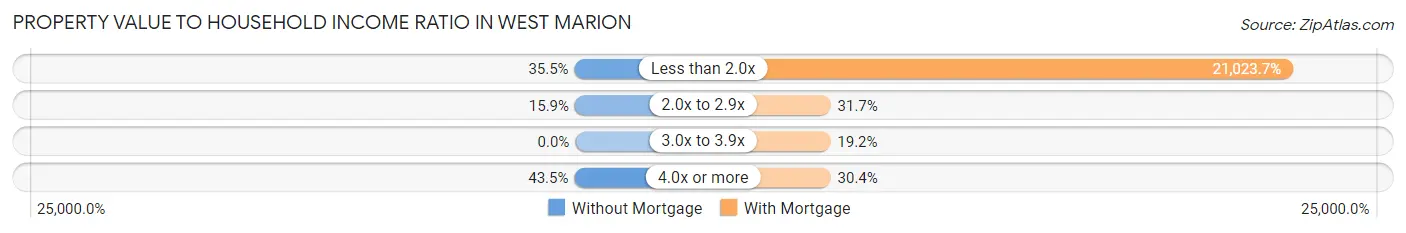
| Value-to-Income Ratio | Without Mortgage | With Mortgage |
| Less than 2.0x | 49 (35.5%) | 47,093 (21,023.7%) |
| 2.0x to 2.9x | 22 (15.9%) | 71 (31.7%) |
| 3.0x to 3.9x | 0 (0.0%) | 43 (19.2%) |
| 4.0x or more | 60 (43.5%) | 68 (30.4%) |
| Total | 138 (100.0%) | 224 (100.0%) |
Real Estate Taxes by Mortgage Status in West Marion
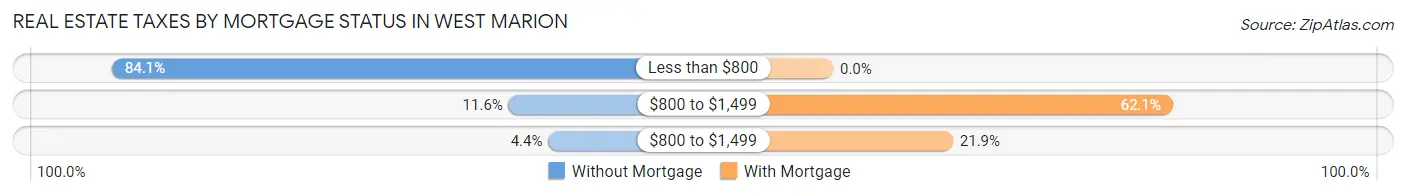
| Property Taxes | Without Mortgage | With Mortgage |
| Less than $800 | 116 (84.1%) | 0 (0.0%) |
| $800 to $1,499 | 16 (11.6%) | 139 (62.1%) |
| $800 to $1,499 | 6 (4.3%) | 49 (21.9%) |
| Total | 138 (100.0%) | 224 (100.0%) |
Health & Disability in West Marion
Health Insurance Coverage by Age in West Marion
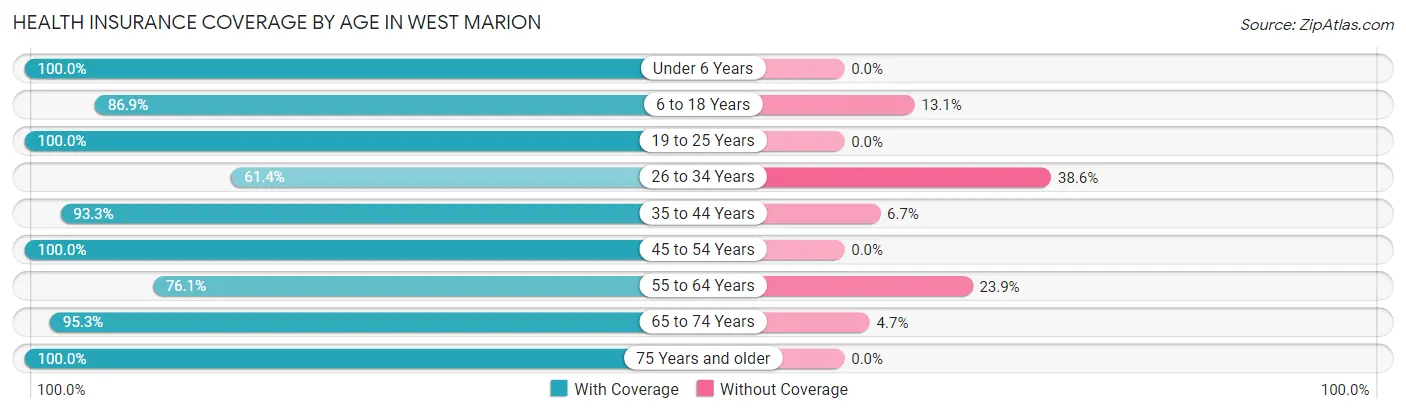
| Age Bracket | With Coverage | Without Coverage |
| Under 6 Years | 19 (100.0%) | 0 (0.0%) |
| 6 to 18 Years | 106 (86.9%) | 16 (13.1%) |
| 19 to 25 Years | 99 (100.0%) | 0 (0.0%) |
| 26 to 34 Years | 43 (61.4%) | 27 (38.6%) |
| 35 to 44 Years | 84 (93.3%) | 6 (6.7%) |
| 45 to 54 Years | 92 (100.0%) | 0 (0.0%) |
| 55 to 64 Years | 121 (76.1%) | 38 (23.9%) |
| 65 to 74 Years | 141 (95.3%) | 7 (4.7%) |
| 75 Years and older | 117 (100.0%) | 0 (0.0%) |
| Total | 822 (89.7%) | 94 (10.3%) |
Health Insurance Coverage by Citizenship Status in West Marion
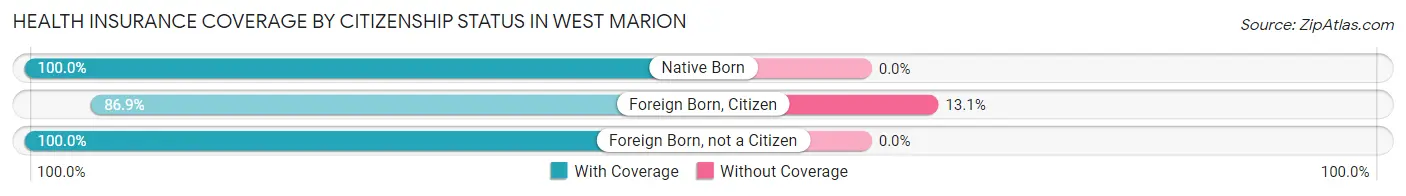
| Citizenship Status | With Coverage | Without Coverage |
| Native Born | 19 (100.0%) | 0 (0.0%) |
| Foreign Born, Citizen | 106 (86.9%) | 16 (13.1%) |
| Foreign Born, not a Citizen | 99 (100.0%) | 0 (0.0%) |
Health Insurance Coverage by Household Income in West Marion
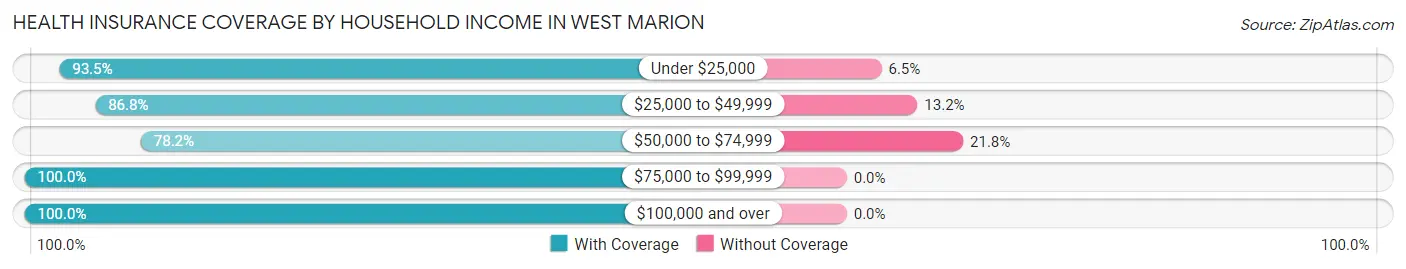
| Household Income | With Coverage | Without Coverage |
| Under $25,000 | 201 (93.5%) | 14 (6.5%) |
| $25,000 to $49,999 | 269 (86.8%) | 41 (13.2%) |
| $50,000 to $74,999 | 140 (78.2%) | 39 (21.8%) |
| $75,000 to $99,999 | 42 (100.0%) | 0 (0.0%) |
| $100,000 and over | 170 (100.0%) | 0 (0.0%) |
Public vs Private Health Insurance Coverage by Age in West Marion
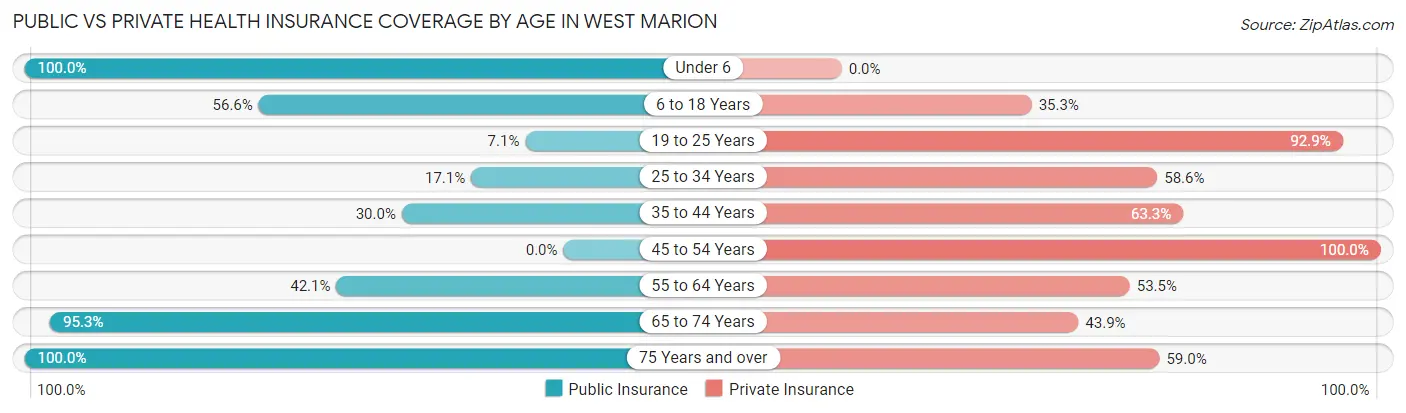
| Age Bracket | Public Insurance | Private Insurance |
| Under 6 | 19 (100.0%) | 0 (0.0%) |
| 6 to 18 Years | 69 (56.6%) | 43 (35.2%) |
| 19 to 25 Years | 7 (7.1%) | 92 (92.9%) |
| 25 to 34 Years | 12 (17.1%) | 41 (58.6%) |
| 35 to 44 Years | 27 (30.0%) | 57 (63.3%) |
| 45 to 54 Years | 0 (0.0%) | 92 (100.0%) |
| 55 to 64 Years | 67 (42.1%) | 85 (53.5%) |
| 65 to 74 Years | 141 (95.3%) | 65 (43.9%) |
| 75 Years and over | 117 (100.0%) | 69 (59.0%) |
| Total | 459 (50.1%) | 544 (59.4%) |
Disability Status by Sex by Age in West Marion
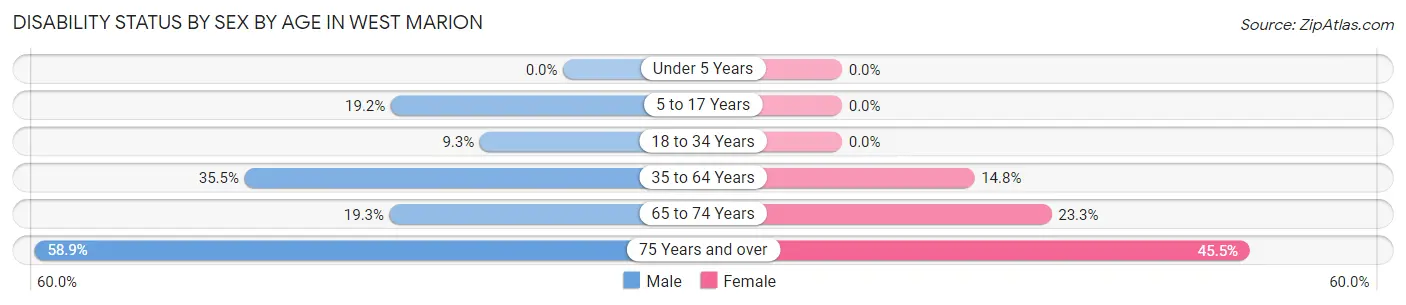
| Age Bracket | Male | Female |
| Under 5 Years | 0 (0.0%) | 0 (0.0%) |
| 5 to 17 Years | 14 (19.2%) | 0 (0.0%) |
| 18 to 34 Years | 9 (9.3%) | 0 (0.0%) |
| 35 to 64 Years | 44 (35.5%) | 32 (14.7%) |
| 65 to 74 Years | 17 (19.3%) | 14 (23.3%) |
| 75 Years and over | 43 (58.9%) | 20 (45.5%) |
Disability Class by Sex by Age in West Marion
Disability Class: Hearing Difficulty
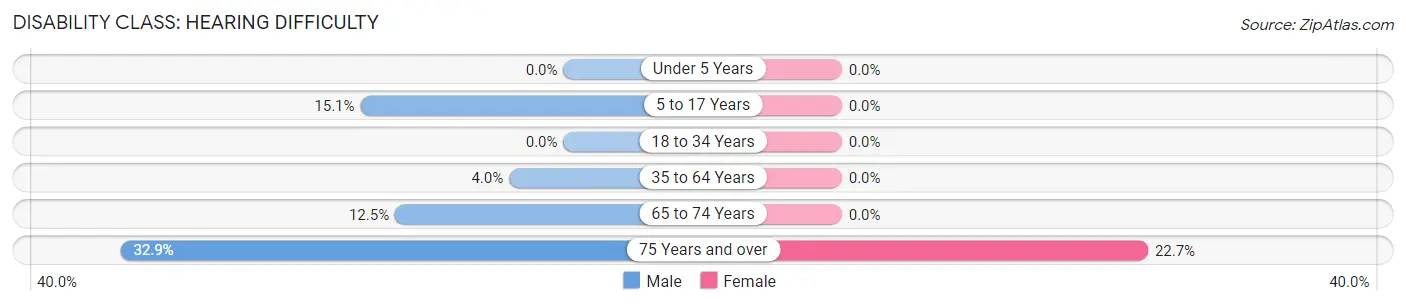
| Age Bracket | Male | Female |
| Under 5 Years | 0 (0.0%) | 0 (0.0%) |
| 5 to 17 Years | 11 (15.1%) | 0 (0.0%) |
| 18 to 34 Years | 0 (0.0%) | 0 (0.0%) |
| 35 to 64 Years | 5 (4.0%) | 0 (0.0%) |
| 65 to 74 Years | 11 (12.5%) | 0 (0.0%) |
| 75 Years and over | 24 (32.9%) | 10 (22.7%) |
Disability Class: Vision Difficulty
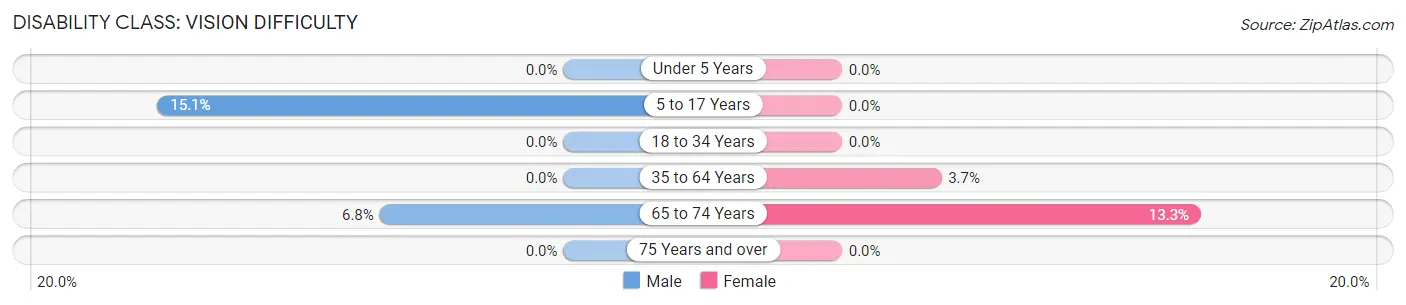
| Age Bracket | Male | Female |
| Under 5 Years | 0 (0.0%) | 0 (0.0%) |
| 5 to 17 Years | 11 (15.1%) | 0 (0.0%) |
| 18 to 34 Years | 0 (0.0%) | 0 (0.0%) |
| 35 to 64 Years | 0 (0.0%) | 8 (3.7%) |
| 65 to 74 Years | 6 (6.8%) | 8 (13.3%) |
| 75 Years and over | 0 (0.0%) | 0 (0.0%) |
Disability Class: Cognitive Difficulty
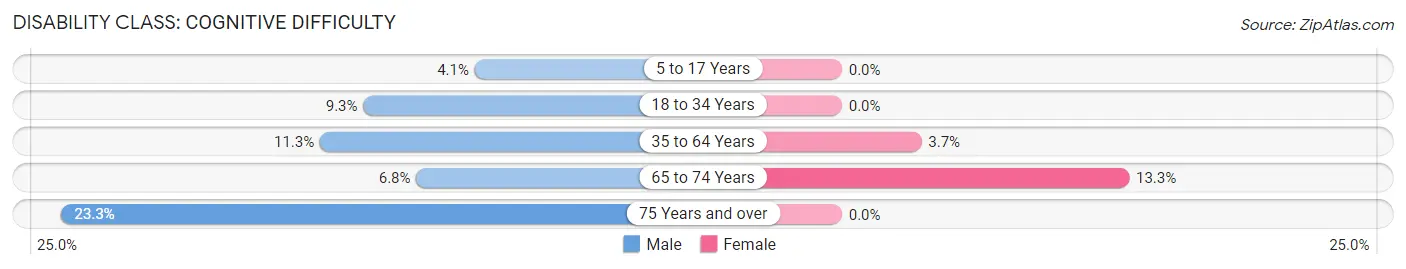
| Age Bracket | Male | Female |
| 5 to 17 Years | 3 (4.1%) | 0 (0.0%) |
| 18 to 34 Years | 9 (9.3%) | 0 (0.0%) |
| 35 to 64 Years | 14 (11.3%) | 8 (3.7%) |
| 65 to 74 Years | 6 (6.8%) | 8 (13.3%) |
| 75 Years and over | 17 (23.3%) | 0 (0.0%) |
Disability Class: Ambulatory Difficulty
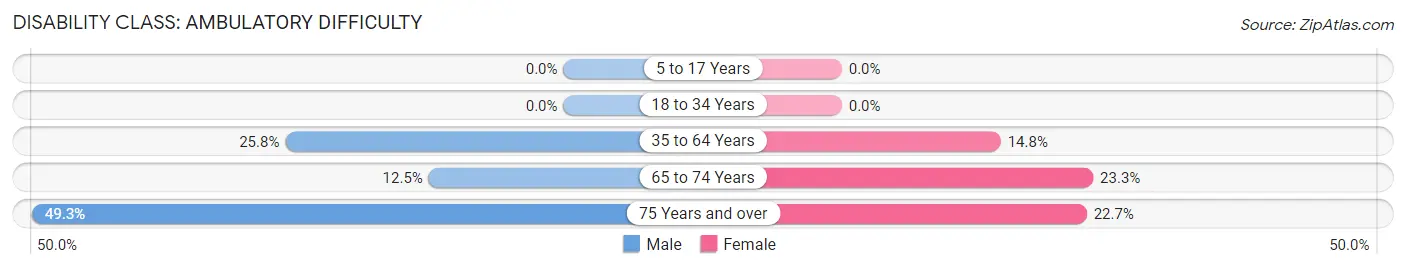
| Age Bracket | Male | Female |
| 5 to 17 Years | 0 (0.0%) | 0 (0.0%) |
| 18 to 34 Years | 0 (0.0%) | 0 (0.0%) |
| 35 to 64 Years | 32 (25.8%) | 32 (14.7%) |
| 65 to 74 Years | 11 (12.5%) | 14 (23.3%) |
| 75 Years and over | 36 (49.3%) | 10 (22.7%) |
Disability Class: Self-Care Difficulty
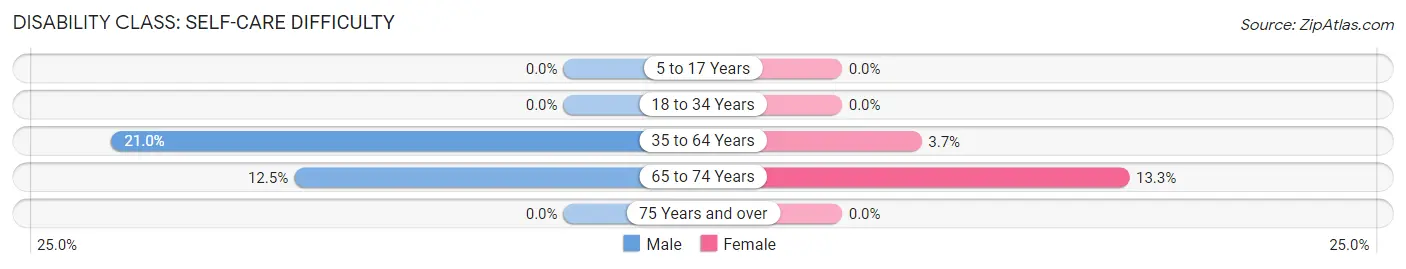
| Age Bracket | Male | Female |
| 5 to 17 Years | 0 (0.0%) | 0 (0.0%) |
| 18 to 34 Years | 0 (0.0%) | 0 (0.0%) |
| 35 to 64 Years | 26 (21.0%) | 8 (3.7%) |
| 65 to 74 Years | 11 (12.5%) | 8 (13.3%) |
| 75 Years and over | 0 (0.0%) | 0 (0.0%) |
Technology Access in West Marion
Computing Device Access in West Marion
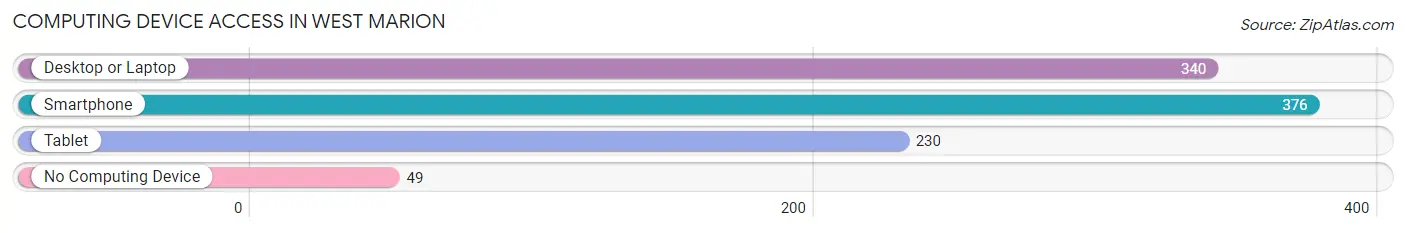
| Device Type | # Households | % Households |
| Desktop or Laptop | 340 | 67.6% |
| Smartphone | 376 | 74.8% |
| Tablet | 230 | 45.7% |
| No Computing Device | 49 | 9.7% |
| Total | 503 | 100.0% |
Internet Access in West Marion
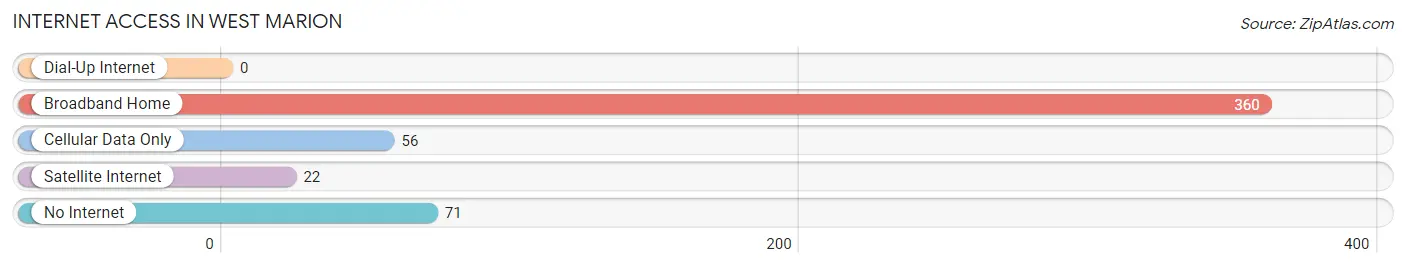
| Internet Type | # Households | % Households |
| Dial-Up Internet | 0 | 0.0% |
| Broadband Home | 360 | 71.6% |
| Cellular Data Only | 56 | 11.1% |
| Satellite Internet | 22 | 4.4% |
| No Internet | 71 | 14.1% |
| Total | 503 | 100.0% |
West Marion Summary
Marion, North Carolina is a small town located in McDowell County in the foothills of the Appalachian Mountains. It is situated in the western part of the state, approximately 40 miles east of Asheville. The town was founded in 1844 and was named after General Francis Marion, a Revolutionary War hero. The town has a population of approximately 2,000 people and is the county seat of McDowell County.
Geography
Marion is located in the foothills of the Appalachian Mountains, in the western part of North Carolina. The town is situated at an elevation of 1,400 feet and is surrounded by the Blue Ridge Mountains to the east and the Great Smoky Mountains to the west. The town is located on the Catawba River, which is a major tributary of the Yadkin River. The town is also located near Lake James, which is a popular recreational area.
The climate in Marion is mild and humid, with temperatures ranging from the low 30s in the winter to the mid-80s in the summer. The town receives an average of 45 inches of precipitation per year, with most of it falling in the form of rain.
Economy
Marion’s economy is largely based on agriculture and tourism. The town is home to several farms, which produce a variety of crops, including corn, soybeans, wheat, and hay. The town is also home to several wineries, which produce a variety of wines.
The town is also home to several manufacturing companies, which produce a variety of products, including furniture, textiles, and automotive parts. The town is also home to several retail stores, which sell a variety of goods, including clothing, jewelry, and home goods.
Demographics
As of the 2010 census, Marion had a population of 2,000 people. The racial makeup of the town was 95.2% White, 1.7% African American, 0.7% Native American, 0.3% Asian, 0.1% Pacific Islander, and 1.9% from other races. The median household income in Marion was $30,000, and the median family income was $35,000.
The town is home to several churches, including the First Baptist Church, the First Presbyterian Church, and the First United Methodist Church. The town is also home to several schools, including Marion Elementary School, Marion Middle School, and Marion High School.
Conclusion
Marion, North Carolina is a small town located in McDowell County in the foothills of the Appalachian Mountains. It is situated in the western part of the state, approximately 40 miles east of Asheville. The town was founded in 1844 and was named after General Francis Marion, a Revolutionary War hero. The town has a population of approximately 2,000 people and is the county seat of McDowell County. The town’s economy is largely based on agriculture and tourism, and the town is home to several churches, schools, and retail stores. The town has a mild and humid climate, with temperatures ranging from the low 30s in the winter to the mid-80s in the summer.
Common Questions
What is the Total Population of West Marion?
Total Population of West Marion is 916.
What is the Total Male Population of West Marion?
Total Male Population of West Marion is 455.
What is the Total Female Population of West Marion?
Total Female Population of West Marion is 461.
What is the Ratio of Males per 100 Females in West Marion?
There are 98.70 Males per 100 Females in West Marion.
What is the Ratio of Females per 100 Males in West Marion?
There are 101.32 Females per 100 Males in West Marion.
What is the Median Population Age in West Marion?
Median Population Age in West Marion is 49.2 Years.
What is the Average Family Size in West Marion
Average Family Size in West Marion is 2.5 People.
What is the Average Household Size in West Marion
Average Household Size in West Marion is 1.8 People.
What is Per Capita Income in West Marion?
Per Capita income in West Marion is $27,662.
What is the Median Family Income in West Marion?
Median Family Income in West Marion is $52,188.
What is the Median Household income in West Marion?
Median Household Income in West Marion is $40,231.
What is Income or Wage Gap in West Marion?
Income or Wage Gap in West Marion is 16.4%.
Women in West Marion earn 83.6 cents for every dollar earned by a man.
What is Inequality or Gini Index in West Marion?
Inequality or Gini Index in West Marion is 0.39.
How Large is the Labor Force in West Marion?
There are 380 People in the Labor Forcein in West Marion.
What is the Percentage of People in the Labor Force in West Marion?
45.6% of People are in the Labor Force in West Marion.
What is the Unemployment Rate in West Marion?
Unemployment Rate in West Marion is 8.4%.