Elizabethtown, NC
Elizabethtown Map
Elizabethtown Overview
3,304
TOTAL POPULATION
1,590
MALE POPULATION
1,714
FEMALE POPULATION
92.77
MALES / 100 FEMALES
107.80
FEMALES / 100 MALES
47.3
MEDIAN AGE
2.7
AVG FAMILY SIZE
1.9
AVG HOUSEHOLD SIZE
$19,372
PER CAPITA INCOME
$35,407
AVG FAMILY INCOME
$24,081
AVG HOUSEHOLD INCOME
49.2%
WAGE / INCOME GAP [ % ]
50.8¢/ $1
WAGE / INCOME GAP [ $ ]
0.53
INEQUALITY / GINI INDEX
1,161
LABOR FORCE [ PEOPLE ]
41.3%
PERCENT IN LABOR FORCE
Elizabethtown Zip Codes
Elizabethtown Area Codes
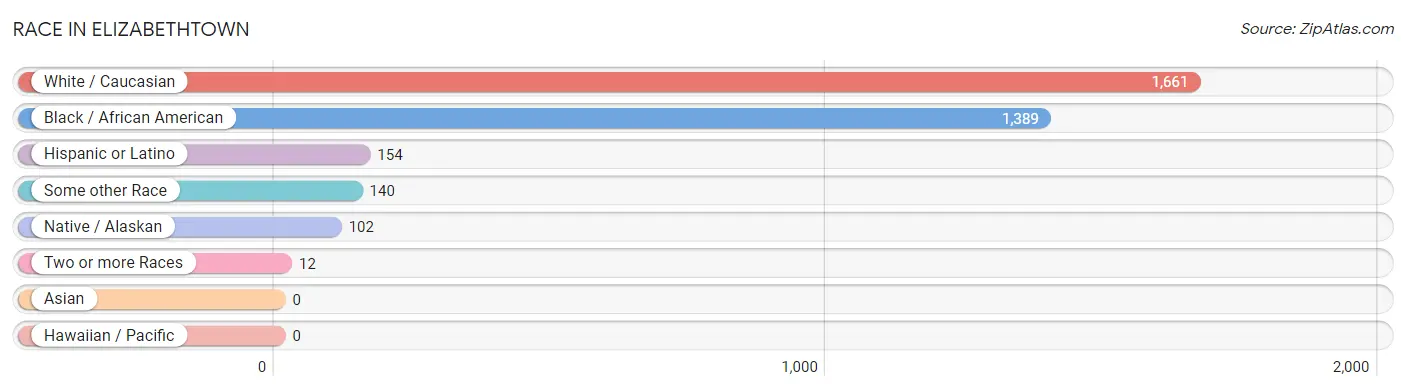
Race in Elizabethtown
The most populous races in Elizabethtown are White / Caucasian (1,661 | 50.3%), Black / African American (1,389 | 42.0%), and Hispanic or Latino (154 | 4.7%).
| Race | # Population | % Population |
| Asian | 0 | 0.0% |
| Black / African American | 1,389 | 42.0% |
| Hawaiian / Pacific | 0 | 0.0% |
| Hispanic or Latino | 154 | 4.7% |
| Native / Alaskan | 102 | 3.1% |
| White / Caucasian | 1,661 | 50.3% |
| Two or more Races | 12 | 0.4% |
| Some other Race | 140 | 4.2% |
| Total | 3,304 | 100.0% |
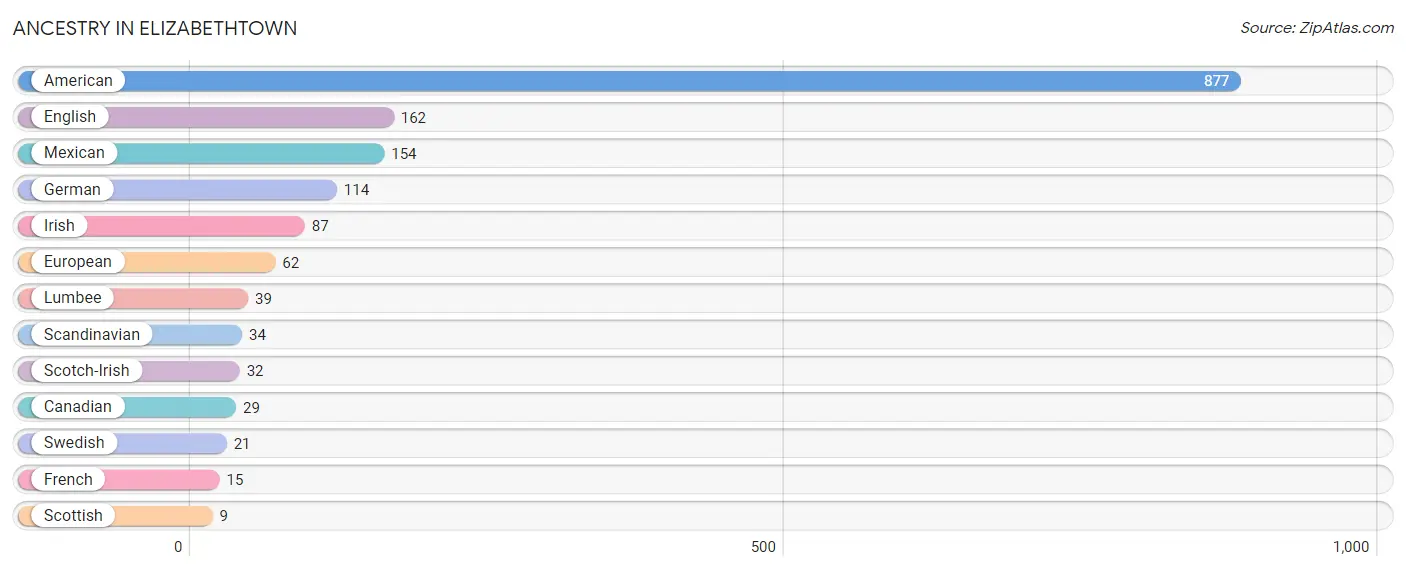
Ancestry in Elizabethtown
The most populous ancestries reported in Elizabethtown are American (877 | 26.5%), English (162 | 4.9%), Mexican (154 | 4.7%), German (114 | 3.5%), and Irish (87 | 2.6%), together accounting for 42.2% of all Elizabethtown residents.
| Ancestry | # Population | % Population |
| American | 877 | 26.5% |
| Canadian | 29 | 0.9% |
| English | 162 | 4.9% |
| European | 62 | 1.9% |
| French | 15 | 0.4% |
| German | 114 | 3.5% |
| Irish | 87 | 2.6% |
| Lumbee | 39 | 1.2% |
| Mexican | 154 | 4.7% |
| Scandinavian | 34 | 1.0% |
| Scotch-Irish | 32 | 1.0% |
| Scottish | 9 | 0.3% |
| Swedish | 21 | 0.6% | View All 13 Rows |
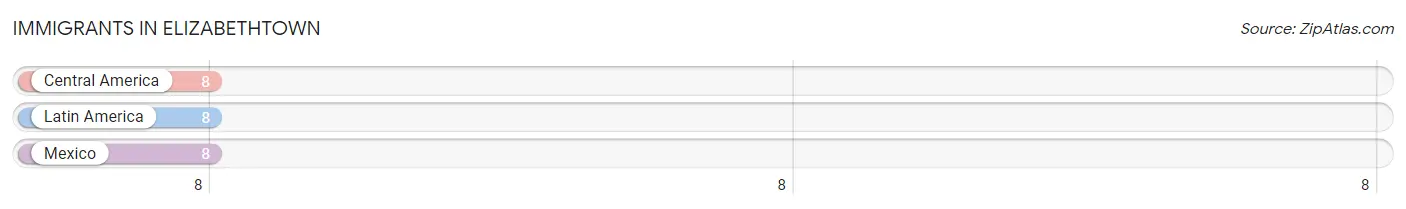
Immigrants in Elizabethtown
The most numerous immigrant groups reported in Elizabethtown came from Central America (8 | 0.2%), Latin America (8 | 0.2%), and Mexico (8 | 0.2%), together accounting for 0.7% of all Elizabethtown residents.
| Immigration Origin | # Population | % Population |
| Central America | 8 | 0.2% |
| Latin America | 8 | 0.2% |
| Mexico | 8 | 0.2% | View All 3 Rows |
Sex and Age in Elizabethtown
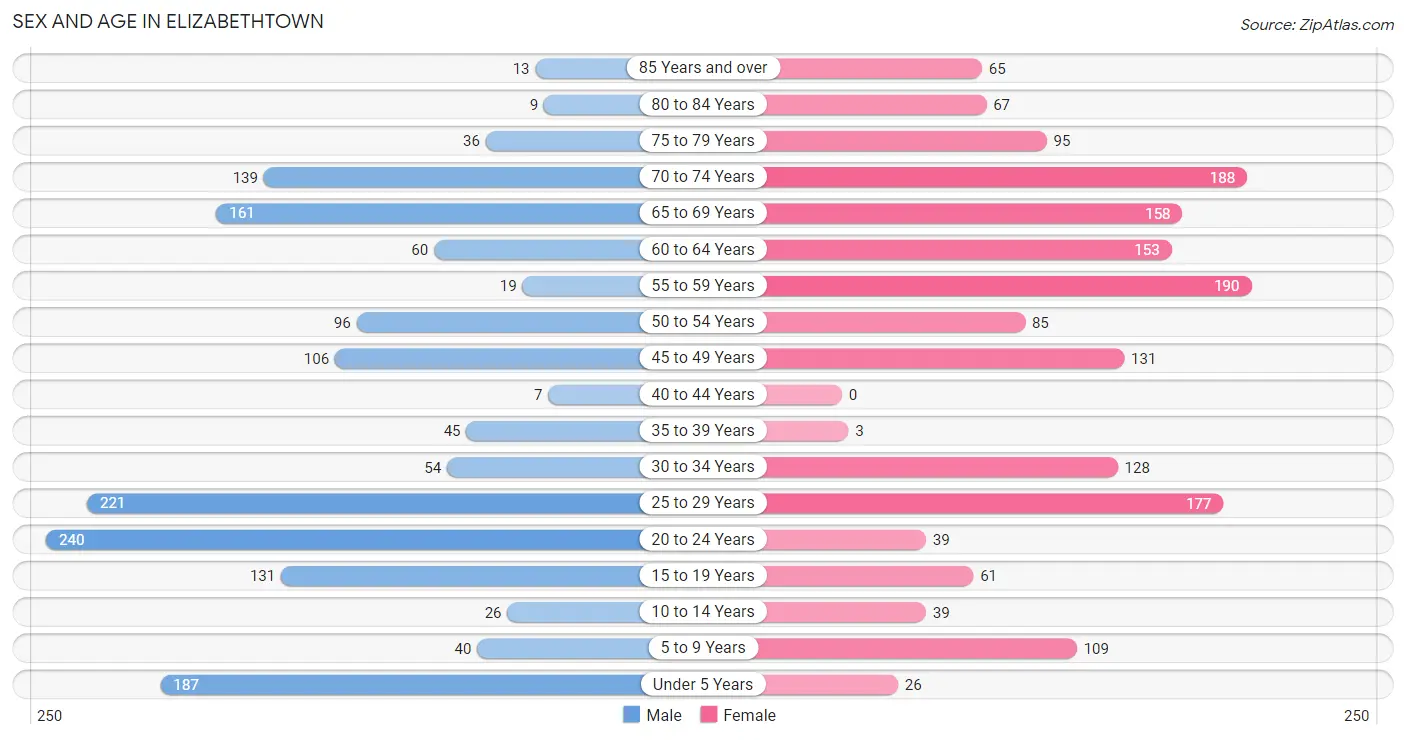
Sex and Age in Elizabethtown
The most populous age groups in Elizabethtown are 20 to 24 Years (240 | 15.1%) for men and 55 to 59 Years (190 | 11.1%) for women.
| Age Bracket | Male | Female |
| Under 5 Years | 187 (11.8%) | 26 (1.5%) |
| 5 to 9 Years | 40 (2.5%) | 109 (6.4%) |
| 10 to 14 Years | 26 (1.6%) | 39 (2.3%) |
| 15 to 19 Years | 131 (8.2%) | 61 (3.6%) |
| 20 to 24 Years | 240 (15.1%) | 39 (2.3%) |
| 25 to 29 Years | 221 (13.9%) | 177 (10.3%) |
| 30 to 34 Years | 54 (3.4%) | 128 (7.5%) |
| 35 to 39 Years | 45 (2.8%) | 3 (0.2%) |
| 40 to 44 Years | 7 (0.4%) | 0 (0.0%) |
| 45 to 49 Years | 106 (6.7%) | 131 (7.6%) |
| 50 to 54 Years | 96 (6.0%) | 85 (5.0%) |
| 55 to 59 Years | 19 (1.2%) | 190 (11.1%) |
| 60 to 64 Years | 60 (3.8%) | 153 (8.9%) |
| 65 to 69 Years | 161 (10.1%) | 158 (9.2%) |
| 70 to 74 Years | 139 (8.7%) | 188 (11.0%) |
| 75 to 79 Years | 36 (2.3%) | 95 (5.5%) |
| 80 to 84 Years | 9 (0.6%) | 67 (3.9%) |
| 85 Years and over | 13 (0.8%) | 65 (3.8%) |
| Total | 1,590 (100.0%) | 1,714 (100.0%) |
Families and Households in Elizabethtown
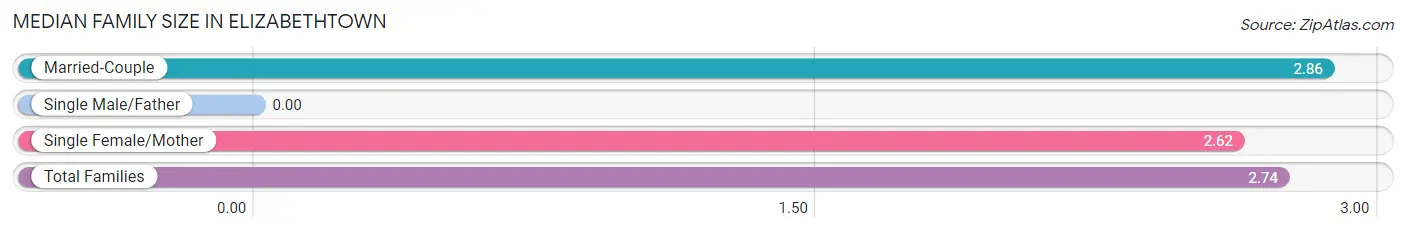
Median Family Size in Elizabethtown
| Family Type | # Families | Family Size |
| Married-Couple | 354 (48.9%) | 2.86 |
| Single Male/Father | 0 (0.0%) | - |
| Single Female/Mother | 370 (51.1%) | 2.62 |
| Total Families | 724 (100.0%) | 2.74 |
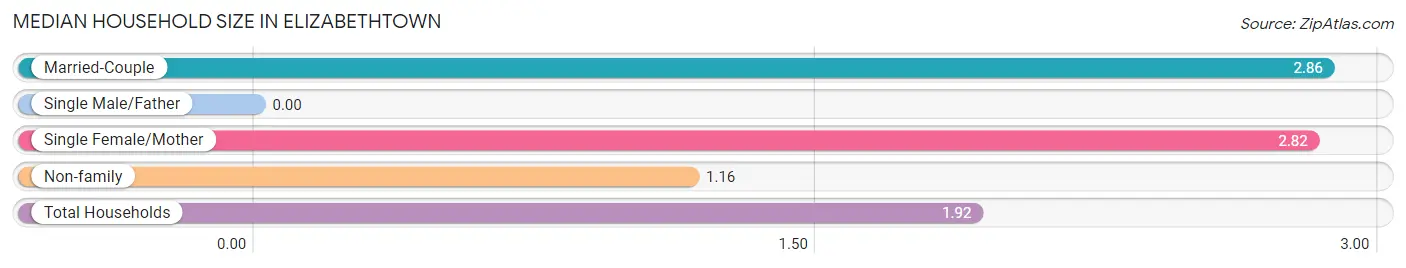
Median Household Size in Elizabethtown
| Household Type | # Households | Household Size |
| Married-Couple | 354 (22.2%) | 2.86 |
| Single Male/Father | 0 (0.0%) | - |
| Single Female/Mother | 370 (23.2%) | 2.82 |
| Non-family | 870 (54.6%) | 1.16 |
| Total Households | 1,594 (100.0%) | 1.92 |
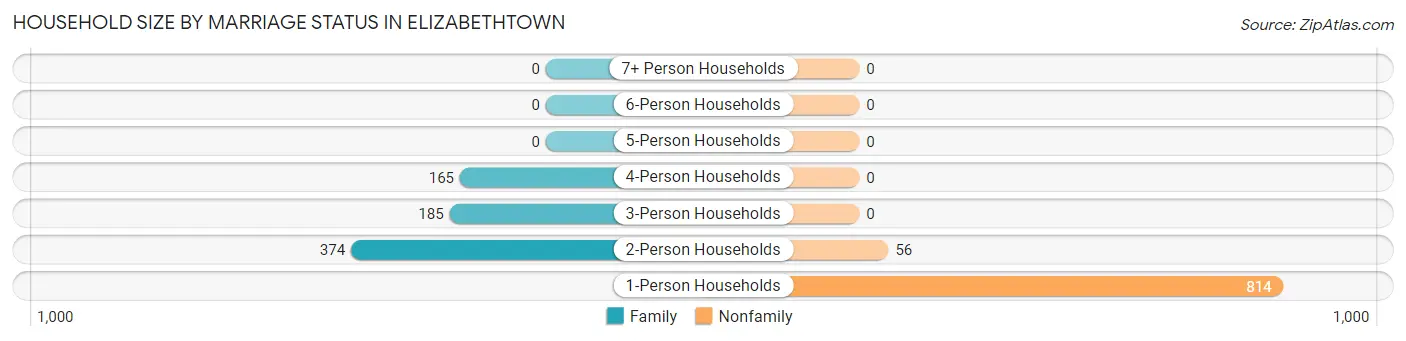
Household Size by Marriage Status in Elizabethtown
Out of a total of 1,594 households in Elizabethtown, 724 (45.4%) are family households, while 870 (54.6%) are nonfamily households. The most numerous type of family households are 2-person households, comprising 374, and the most common type of nonfamily households are 1-person households, comprising 814.
| Household Size | Family Households | Nonfamily Households |
| 1-Person Households | - | 814 (51.1%) |
| 2-Person Households | 374 (23.5%) | 56 (3.5%) |
| 3-Person Households | 185 (11.6%) | 0 (0.0%) |
| 4-Person Households | 165 (10.3%) | 0 (0.0%) |
| 5-Person Households | 0 (0.0%) | 0 (0.0%) |
| 6-Person Households | 0 (0.0%) | 0 (0.0%) |
| 7+ Person Households | 0 (0.0%) | 0 (0.0%) |
| Total | 724 (45.4%) | 870 (54.6%) |
Female Fertility in Elizabethtown
Fertility by Age in Elizabethtown
Average fertility rate in Elizabethtown is 85.0 births per 1,000 women. Women in the age bracket of 20 to 34 years have the highest fertility rate with 137.0 births per 1,000 women. Women in the age bracket of 20 to 34 years acount for 100.0% of all women with births.
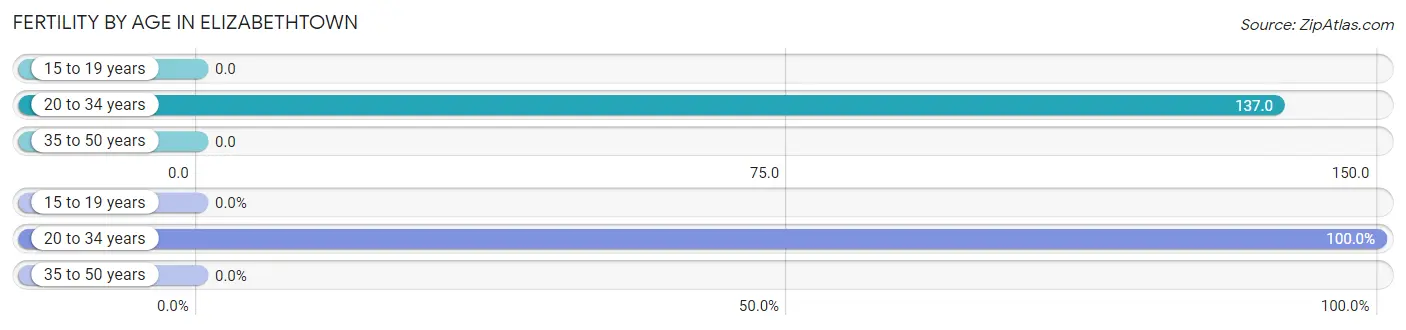
| Age Bracket | Women with Births | Births / 1,000 Women |
| 15 to 19 years | 0 (0.0%) | 0.0 |
| 20 to 34 years | 47 (100.0%) | 137.0 |
| 35 to 50 years | 0 (0.0%) | 0.0 |
| Total | 47 (100.0%) | 85.0 |
Fertility by Age by Marriage Status in Elizabethtown
14.9% of women with births (47) in Elizabethtown are married. The highest percentage of unmarried women with births falls into 20 to 34 years age bracket with 85.1% of them unmarried at the time of birth, while the lowest percentage of unmarried women with births belong to 20 to 34 years age bracket with 85.1% of them unmarried.
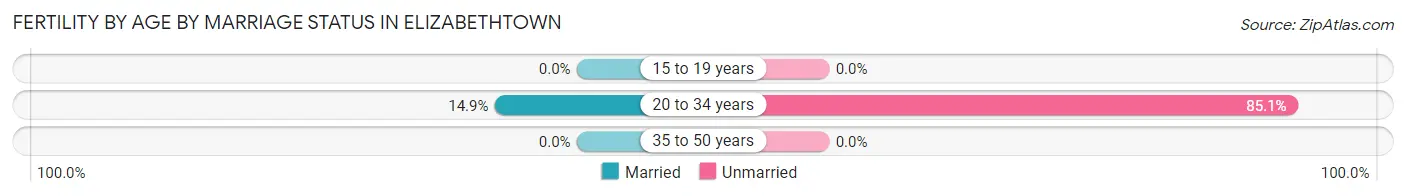
| Age Bracket | Married | Unmarried |
| 15 to 19 years | 0 (0.0%) | 0 (0.0%) |
| 20 to 34 years | 7 (14.9%) | 40 (85.1%) |
| 35 to 50 years | 0 (0.0%) | 0 (0.0%) |
| Total | 7 (14.9%) | 40 (85.1%) |
Fertility by Education in Elizabethtown
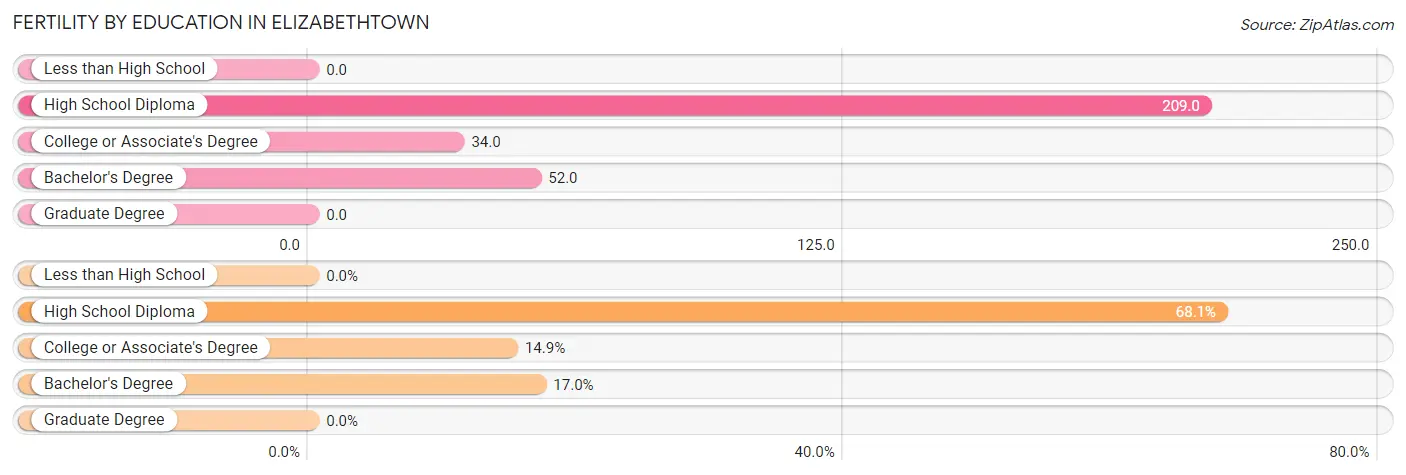
| Educational Attainment | Women with Births | Births / 1,000 Women |
| Less than High School | 0 (0.0%) | 0.0 |
| High School Diploma | 32 (68.1%) | 209.0 |
| College or Associate's Degree | 7 (14.9%) | 34.0 |
| Bachelor's Degree | 8 (17.0%) | 52.0 |
| Graduate Degree | 0 (0.0%) | 0.0 |
| Total | 47 (100.0%) | 85.0 |
Fertility by Education by Marriage Status in Elizabethtown
85.1% of women with births in Elizabethtown are unmarried. Women with the educational attainment of college or associate's degree are most likely to be married with 100.0% of them married at childbirth, while women with the educational attainment of high school diploma are least likely to be married with 100.0% of them unmarried at childbirth.
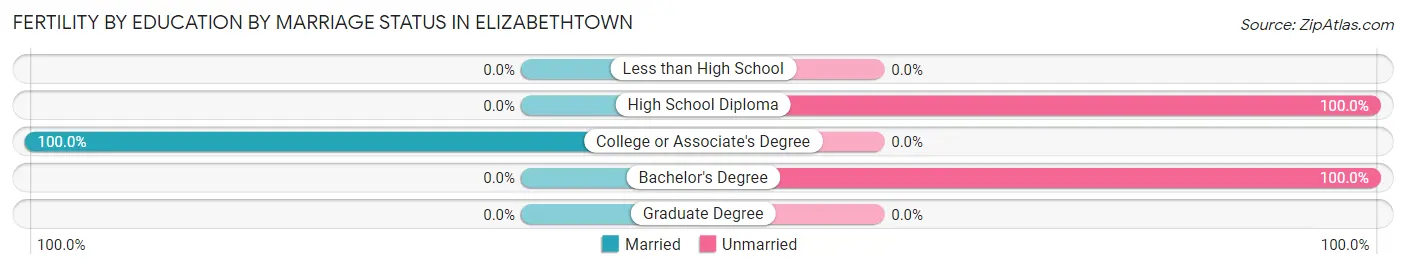
| Educational Attainment | Married | Unmarried |
| Less than High School | 0 (0.0%) | 0 (0.0%) |
| High School Diploma | 0 (0.0%) | 32 (100.0%) |
| College or Associate's Degree | 7 (100.0%) | 0 (0.0%) |
| Bachelor's Degree | 0 (0.0%) | 8 (100.0%) |
| Graduate Degree | 0 (0.0%) | 0 (0.0%) |
| Total | 7 (14.9%) | 40 (85.1%) |
Income in Elizabethtown
Income Overview in Elizabethtown
Per Capita Income in Elizabethtown is $19,372, while median incomes of families and households are $35,407 and $24,081 respectively.
| Characteristic | Number | Measure |
| Per Capita Income | 3,304 | $19,372 |
| Median Family Income | 724 | $35,407 |
| Mean Family Income | 724 | $52,657 |
| Median Household Income | 1,594 | $24,081 |
| Mean Household Income | 1,594 | $37,686 |
| Income Deficit | 724 | $0 |
| Wage / Income Gap (%) | 3,304 | 49.20% |
| Wage / Income Gap ($) | 3,304 | 50.80¢ per $1 |
| Gini / Inequality Index | 3,304 | 0.53 |
Earnings by Sex in Elizabethtown
Average Earnings in Elizabethtown are $17,007, $16,017 for men and $31,532 for women, a difference of 49.2%.
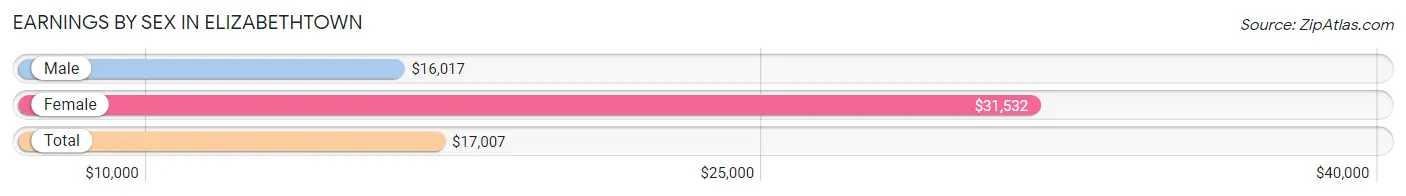
| Sex | Number | Average Earnings |
| Male | 821 (62.4%) | $16,017 |
| Female | 495 (37.6%) | $31,532 |
| Total | 1,316 (100.0%) | $17,007 |
Earnings by Sex by Income Bracket in Elizabethtown
The most common earnings brackets in Elizabethtown are $15,000 to $17,499 for men (166 | 20.2%) and $15,000 to $17,499 for women (113 | 22.8%).
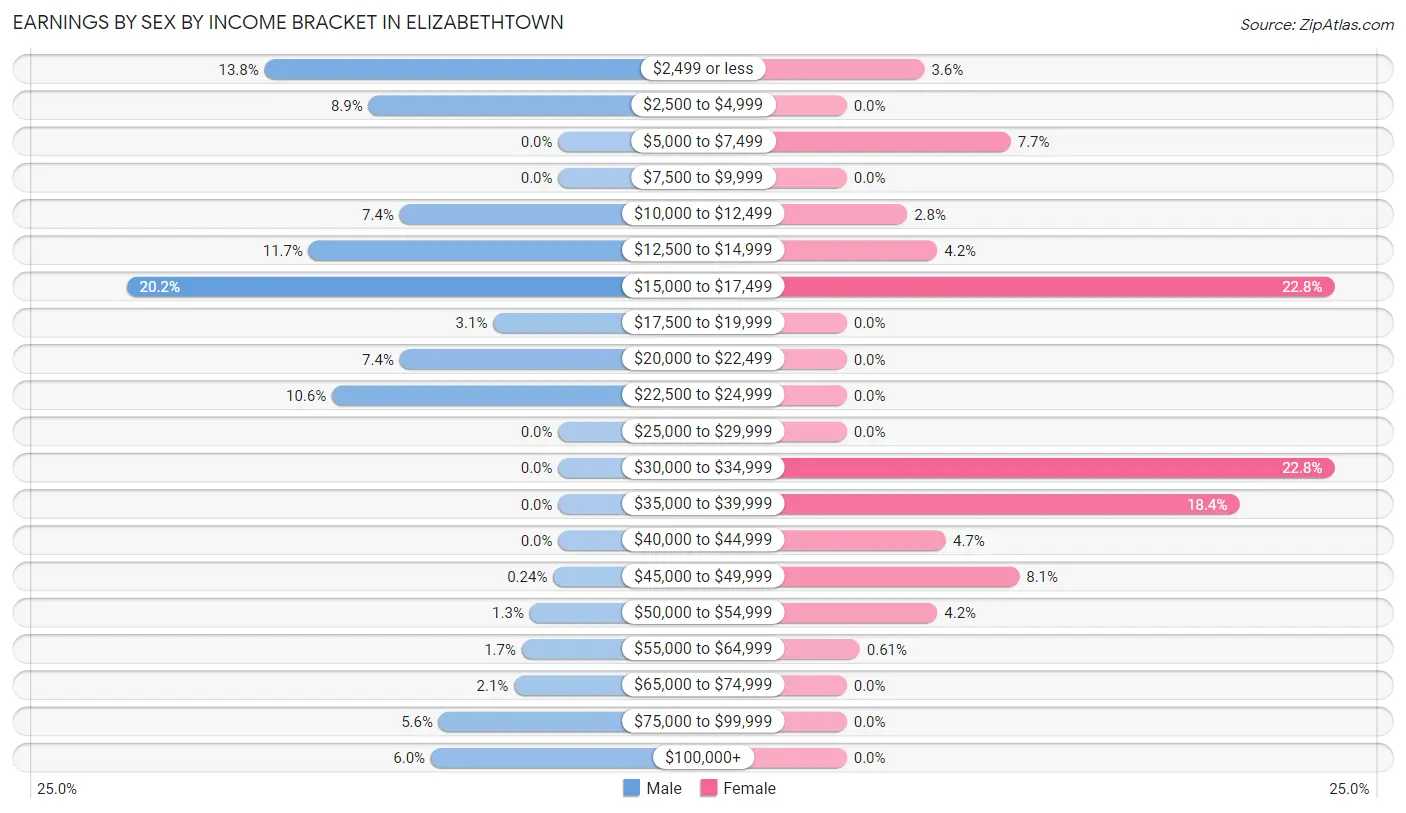
| Income | Male | Female |
| $2,499 or less | 113 (13.8%) | 18 (3.6%) |
| $2,500 to $4,999 | 73 (8.9%) | 0 (0.0%) |
| $5,000 to $7,499 | 0 (0.0%) | 38 (7.7%) |
| $7,500 to $9,999 | 0 (0.0%) | 0 (0.0%) |
| $10,000 to $12,499 | 61 (7.4%) | 14 (2.8%) |
| $12,500 to $14,999 | 96 (11.7%) | 21 (4.2%) |
| $15,000 to $17,499 | 166 (20.2%) | 113 (22.8%) |
| $17,500 to $19,999 | 25 (3.0%) | 0 (0.0%) |
| $20,000 to $22,499 | 61 (7.4%) | 0 (0.0%) |
| $22,500 to $24,999 | 87 (10.6%) | 0 (0.0%) |
| $25,000 to $29,999 | 0 (0.0%) | 0 (0.0%) |
| $30,000 to $34,999 | 0 (0.0%) | 113 (22.8%) |
| $35,000 to $39,999 | 0 (0.0%) | 91 (18.4%) |
| $40,000 to $44,999 | 0 (0.0%) | 23 (4.6%) |
| $45,000 to $49,999 | 2 (0.2%) | 40 (8.1%) |
| $50,000 to $54,999 | 11 (1.3%) | 21 (4.2%) |
| $55,000 to $64,999 | 14 (1.7%) | 3 (0.6%) |
| $65,000 to $74,999 | 17 (2.1%) | 0 (0.0%) |
| $75,000 to $99,999 | 46 (5.6%) | 0 (0.0%) |
| $100,000+ | 49 (6.0%) | 0 (0.0%) |
| Total | 821 (100.0%) | 495 (100.0%) |
Earnings by Sex by Educational Attainment in Elizabethtown
Average earnings in Elizabethtown are $21,045 for men and $31,655 for women, a difference of 33.5%. Men with an educational attainment of less than high school enjoy the highest average annual earnings of $23,865, while those with less than high school education earn the least with $23,865. Women with an educational attainment of bachelor's degree earn the most with the average annual earnings of $39,948, while those with high school diploma education have the smallest earnings of $15,495.
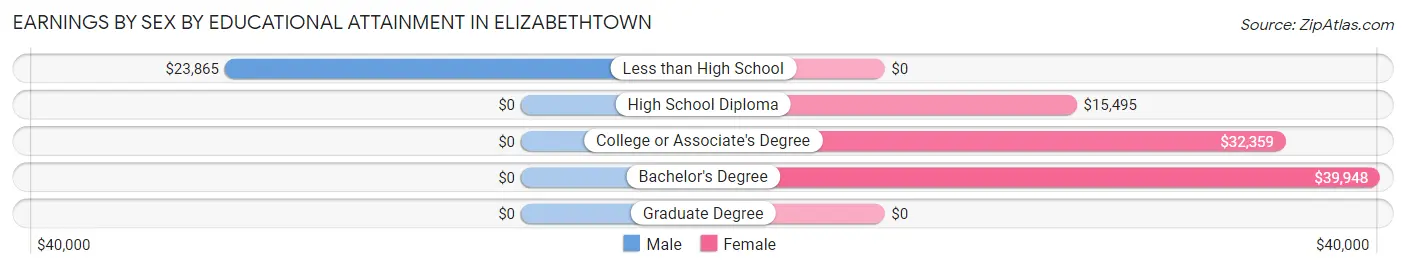
| Educational Attainment | Male Income | Female Income |
| Less than High School | $23,865 | $0 |
| High School Diploma | - | - |
| College or Associate's Degree | - | - |
| Bachelor's Degree | - | - |
| Graduate Degree | - | - |
| Total | $21,045 | $31,655 |
Family Income in Elizabethtown
Family Income Brackets in Elizabethtown
According to the Elizabethtown family income data, there are 158 families falling into the $35,000 to $49,999 income range, which is the most common income bracket and makes up 21.8% of all families. Conversely, the $150,000 to $199,999 income bracket is the least frequent group with only 21 families (2.9%) belonging to this category.
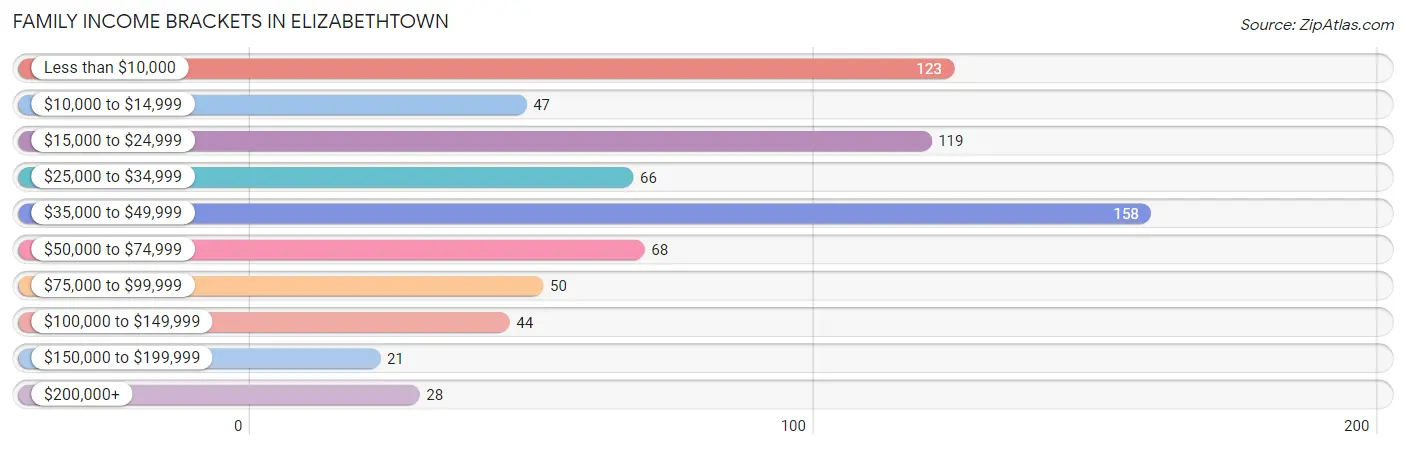
| Income Bracket | # Families | % Families |
| Less than $10,000 | 123 | 17.0% |
| $10,000 to $14,999 | 47 | 6.5% |
| $15,000 to $24,999 | 119 | 16.4% |
| $25,000 to $34,999 | 66 | 9.1% |
| $35,000 to $49,999 | 158 | 21.8% |
| $50,000 to $74,999 | 68 | 9.4% |
| $75,000 to $99,999 | 50 | 6.9% |
| $100,000 to $149,999 | 44 | 6.1% |
| $150,000 to $199,999 | 21 | 2.9% |
| $200,000+ | 28 | 3.9% |
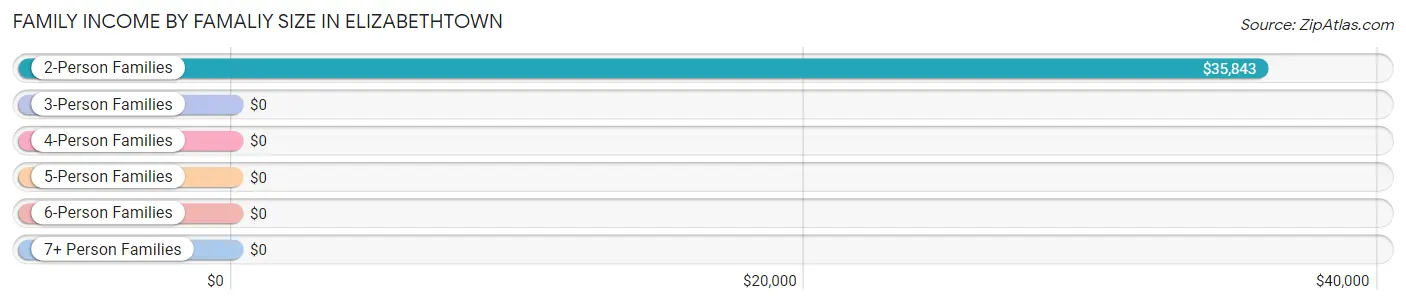
Family Income by Famaliy Size in Elizabethtown
2-person families (445 | 61.5%) account for the highest median family income in Elizabethtown with $35,843 per family, while 2-person families (445 | 61.5%) have the highest median income of $17,922 per family member.
| Income Bracket | # Families | Median Income |
| 2-Person Families | 445 (61.5%) | $35,843 |
| 3-Person Families | 114 (15.8%) | $0 |
| 4-Person Families | 165 (22.8%) | $0 |
| 5-Person Families | 0 (0.0%) | $0 |
| 6-Person Families | 0 (0.0%) | $0 |
| 7+ Person Families | 0 (0.0%) | $0 |
| Total | 724 (100.0%) | $35,407 |
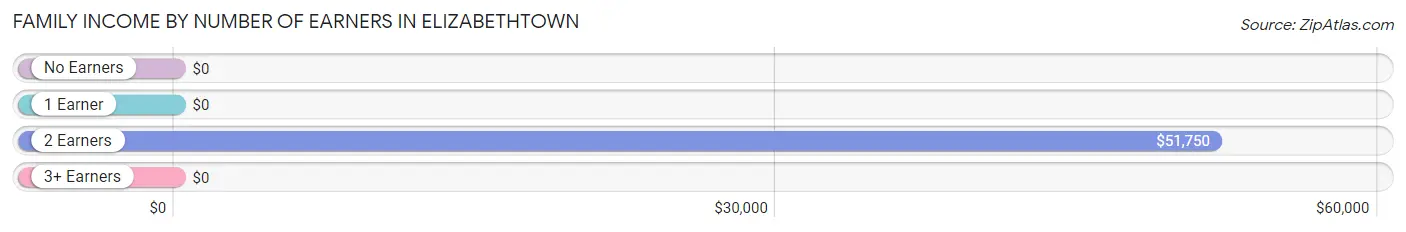
Family Income by Number of Earners in Elizabethtown
| Number of Earners | # Families | Median Income |
| No Earners | 272 (37.6%) | $0 |
| 1 Earner | 286 (39.5%) | $0 |
| 2 Earners | 145 (20.0%) | $51,750 |
| 3+ Earners | 21 (2.9%) | $0 |
| Total | 724 (100.0%) | $35,407 |
Household Income in Elizabethtown
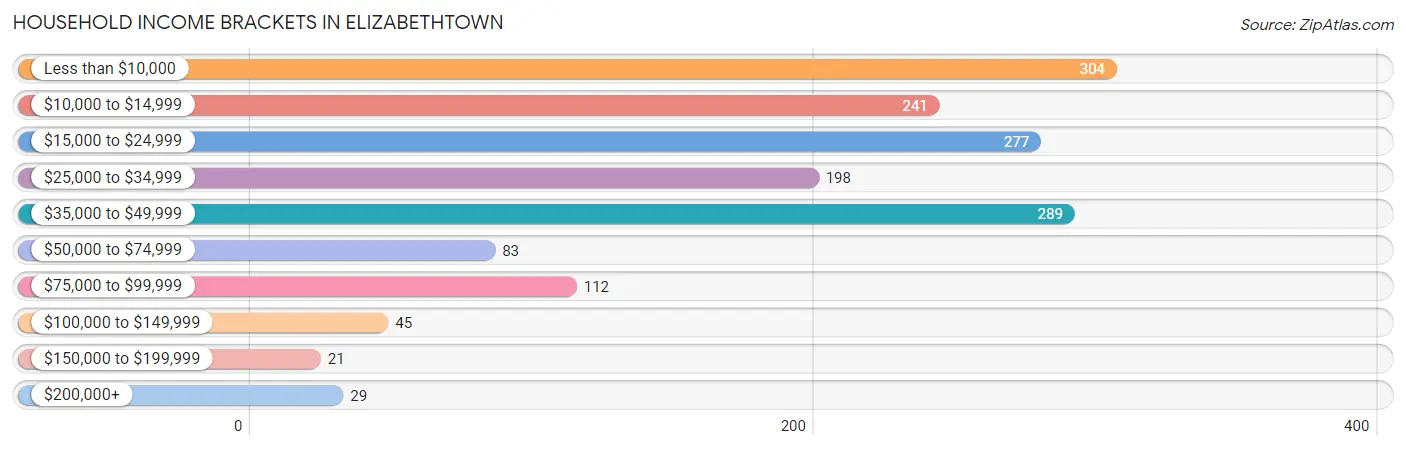
Household Income Brackets in Elizabethtown
With 304 households falling in the category, the less than $10,000 income range is the most frequent in Elizabethtown, accounting for 19.1% of all households. In contrast, only 21 households (1.3%) fall into the $150,000 to $199,999 income bracket, making it the least populous group.
| Income Bracket | # Households | % Households |
| Less than $10,000 | 304 | 19.1% |
| $10,000 to $14,999 | 241 | 15.1% |
| $15,000 to $24,999 | 277 | 17.4% |
| $25,000 to $34,999 | 198 | 12.4% |
| $35,000 to $49,999 | 289 | 18.1% |
| $50,000 to $74,999 | 83 | 5.2% |
| $75,000 to $99,999 | 112 | 7.0% |
| $100,000 to $149,999 | 45 | 2.8% |
| $150,000 to $199,999 | 21 | 1.3% |
| $200,000+ | 29 | 1.8% |
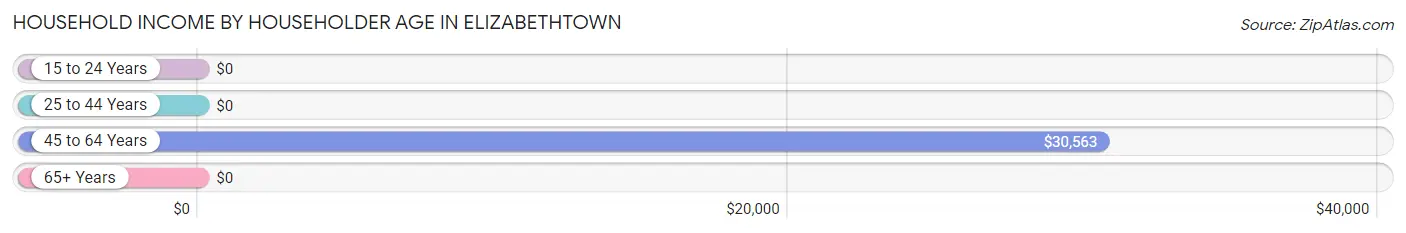
Household Income by Householder Age in Elizabethtown
The median household income in Elizabethtown is $24,081, with the highest median household income of $30,563 found in the 45 to 64 years age bracket for the primary householder. A total of 686 households (43.0%) fall into this category. Meanwhile, the 15 to 24 years age bracket for the primary householder has the lowest median household income of $0, with 39 households (2.5%) in this group.
| Income Bracket | # Households | Median Income |
| 15 to 24 Years | 39 (2.5%) | $0 |
| 25 to 44 Years | 303 (19.0%) | $0 |
| 45 to 64 Years | 686 (43.0%) | $30,563 |
| 65+ Years | 566 (35.5%) | $0 |
| Total | 1,594 (100.0%) | $24,081 |
Poverty in Elizabethtown
Income Below Poverty by Sex and Age in Elizabethtown
With 31.9% poverty level for males and 51.5% for females among the residents of Elizabethtown, 12 to 14 year old males and 6 to 11 year old females are the most vulnerable to poverty, with 26 males (100.0%) and 109 females (100.0%) in their respective age groups living below the poverty level.
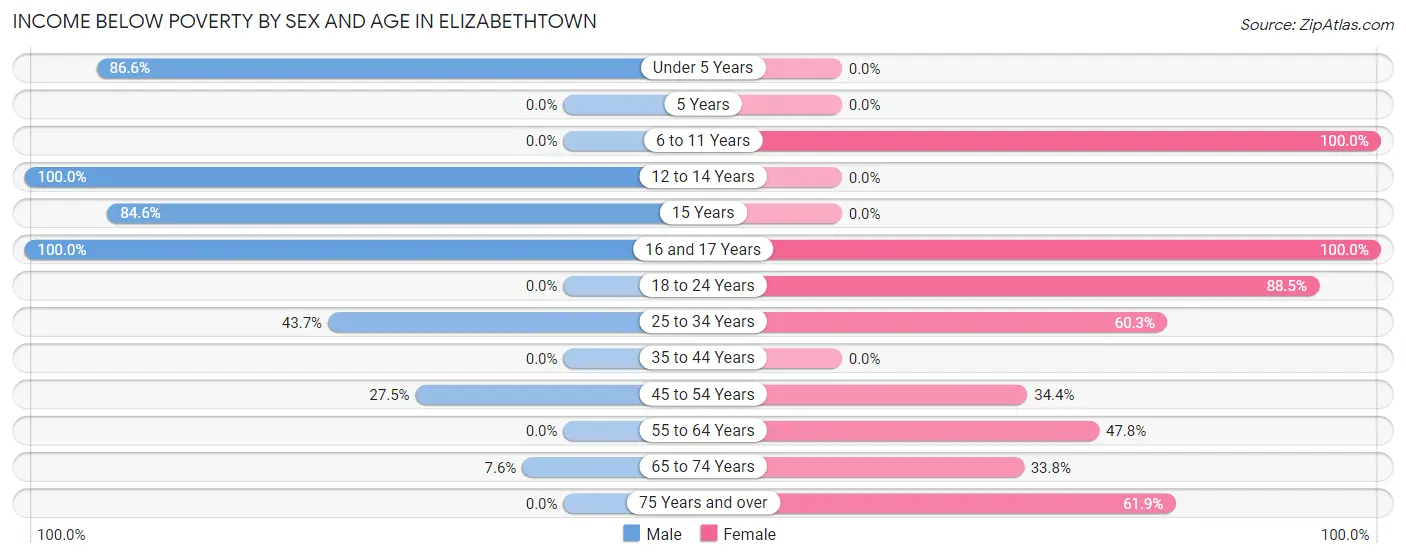
| Age Bracket | Male | Female |
| Under 5 Years | 162 (86.6%) | 0 (0.0%) |
| 5 Years | 0 (0.0%) | 0 (0.0%) |
| 6 to 11 Years | 0 (0.0%) | 109 (100.0%) |
| 12 to 14 Years | 26 (100.0%) | 0 (0.0%) |
| 15 Years | 55 (84.6%) | 0 (0.0%) |
| 16 and 17 Years | 39 (100.0%) | 39 (100.0%) |
| 18 to 24 Years | 0 (0.0%) | 54 (88.5%) |
| 25 to 34 Years | 111 (43.7%) | 184 (60.3%) |
| 35 to 44 Years | 0 (0.0%) | 0 (0.0%) |
| 45 to 54 Years | 53 (27.5%) | 73 (34.4%) |
| 55 to 64 Years | 0 (0.0%) | 159 (47.7%) |
| 65 to 74 Years | 22 (7.6%) | 104 (33.8%) |
| 75 Years and over | 0 (0.0%) | 99 (61.9%) |
| Total | 468 (31.9%) | 821 (51.5%) |
Income Above Poverty by Sex and Age in Elizabethtown
According to the poverty statistics in Elizabethtown, males aged 6 to 11 years and females aged under 5 years are the age groups that are most secure financially, with 100.0% of males and 100.0% of females in these age groups living above the poverty line.
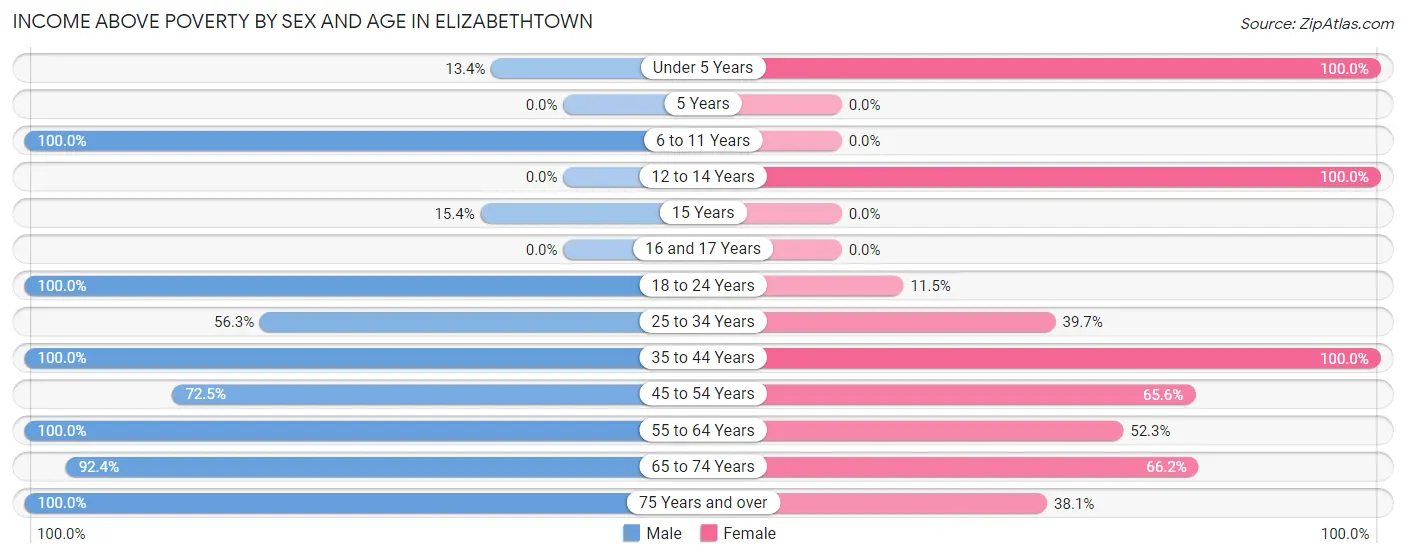
| Age Bracket | Male | Female |
| Under 5 Years | 25 (13.4%) | 26 (100.0%) |
| 5 Years | 0 (0.0%) | 0 (0.0%) |
| 6 to 11 Years | 40 (100.0%) | 0 (0.0%) |
| 12 to 14 Years | 0 (0.0%) | 39 (100.0%) |
| 15 Years | 10 (15.4%) | 0 (0.0%) |
| 16 and 17 Years | 0 (0.0%) | 0 (0.0%) |
| 18 to 24 Years | 259 (100.0%) | 7 (11.5%) |
| 25 to 34 Years | 143 (56.3%) | 121 (39.7%) |
| 35 to 44 Years | 36 (100.0%) | 3 (100.0%) |
| 45 to 54 Years | 140 (72.5%) | 139 (65.6%) |
| 55 to 64 Years | 58 (100.0%) | 174 (52.2%) |
| 65 to 74 Years | 266 (92.4%) | 204 (66.2%) |
| 75 Years and over | 24 (100.0%) | 61 (38.1%) |
| Total | 1,001 (68.1%) | 774 (48.5%) |
Income Below Poverty Among Married-Couple Families in Elizabethtown
The poverty statistics for married-couple families in Elizabethtown show that 12.1% or 43 of the total 354 families live below the poverty line. Families with 1 or 2 children have the highest poverty rate of 20.2%, comprising of 27 families. On the other hand, families with no children have the lowest poverty rate of 7.3%, which includes 16 families.
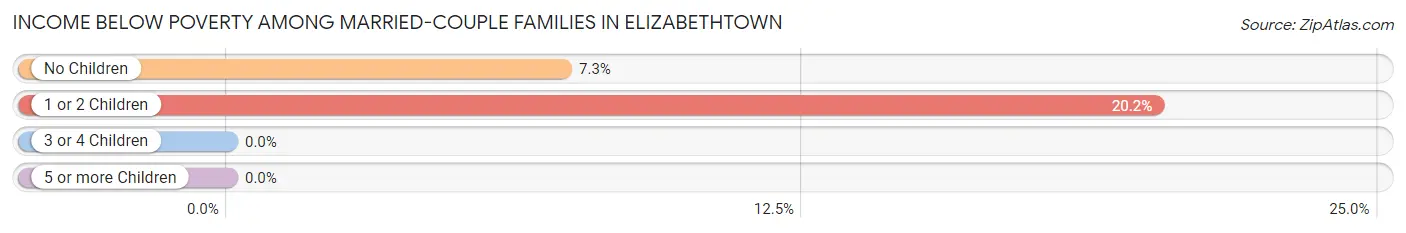
| Children | Above Poverty | Below Poverty |
| No Children | 204 (92.7%) | 16 (7.3%) |
| 1 or 2 Children | 107 (79.8%) | 27 (20.2%) |
| 3 or 4 Children | 0 (0.0%) | 0 (0.0%) |
| 5 or more Children | 0 (0.0%) | 0 (0.0%) |
| Total | 311 (87.8%) | 43 (12.1%) |
Income Below Poverty Among Single-Parent Households in Elizabethtown
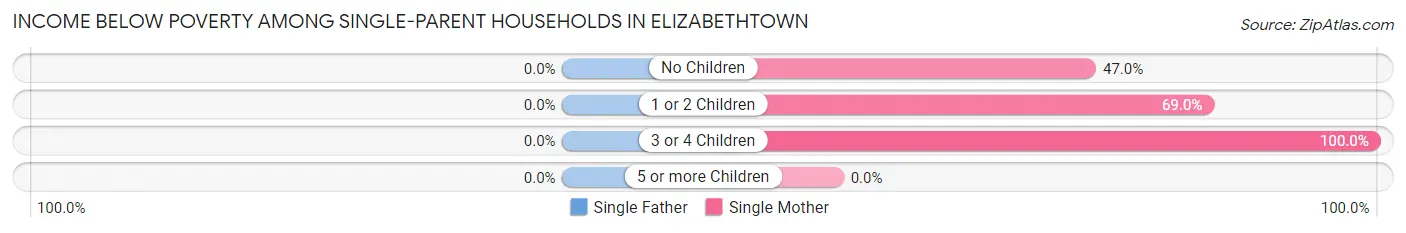
| Children | Single Father | Single Mother |
| No Children | 0 (0.0%) | 55 (47.0%) |
| 1 or 2 Children | 0 (0.0%) | 138 (69.0%) |
| 3 or 4 Children | 0 (0.0%) | 53 (100.0%) |
| 5 or more Children | 0 (0.0%) | 0 (0.0%) |
| Total | 0 (0.0%) | 246 (66.5%) |
Income Below Poverty Among Married-Couple vs Single-Parent Households in Elizabethtown
The poverty data for Elizabethtown shows that 43 of the married-couple family households (12.1%) and 246 of the single-parent households (66.5%) are living below the poverty level. Within the married-couple family households, those with 1 or 2 children have the highest poverty rate, with 27 households (20.2%) falling below the poverty line. Among the single-parent households, those with 3 or 4 children have the highest poverty rate, with 53 household (100.0%) living below poverty.
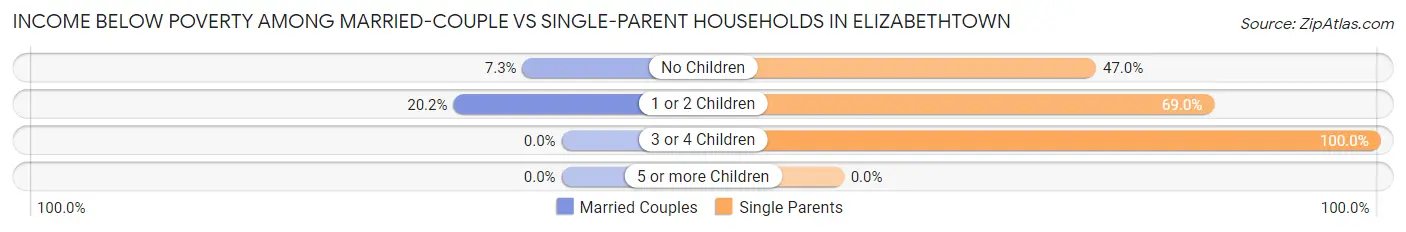
| Children | Married-Couple Families | Single-Parent Households |
| No Children | 16 (7.3%) | 55 (47.0%) |
| 1 or 2 Children | 27 (20.2%) | 138 (69.0%) |
| 3 or 4 Children | 0 (0.0%) | 53 (100.0%) |
| 5 or more Children | 0 (0.0%) | 0 (0.0%) |
| Total | 43 (12.1%) | 246 (66.5%) |
Employment Characteristics in Elizabethtown
Employment by Class of Employer in Elizabethtown
Among the 1,021 employed individuals in Elizabethtown, private company employees (690 | 67.6%), state government employees (195 | 19.1%), and local government employees (102 | 10.0%) make up the most common classes of employment.
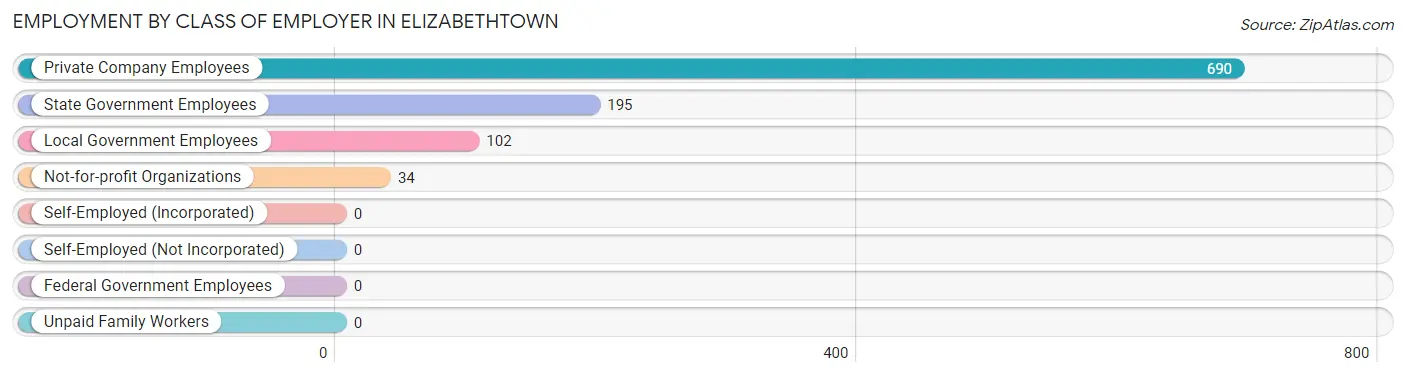
| Employer Class | # Employees | % Employees |
| Private Company Employees | 690 | 67.6% |
| Self-Employed (Incorporated) | 0 | 0.0% |
| Self-Employed (Not Incorporated) | 0 | 0.0% |
| Not-for-profit Organizations | 34 | 3.3% |
| Local Government Employees | 102 | 10.0% |
| State Government Employees | 195 | 19.1% |
| Federal Government Employees | 0 | 0.0% |
| Unpaid Family Workers | 0 | 0.0% |
| Total | 1,021 | 100.0% |
Employment Status by Age in Elizabethtown
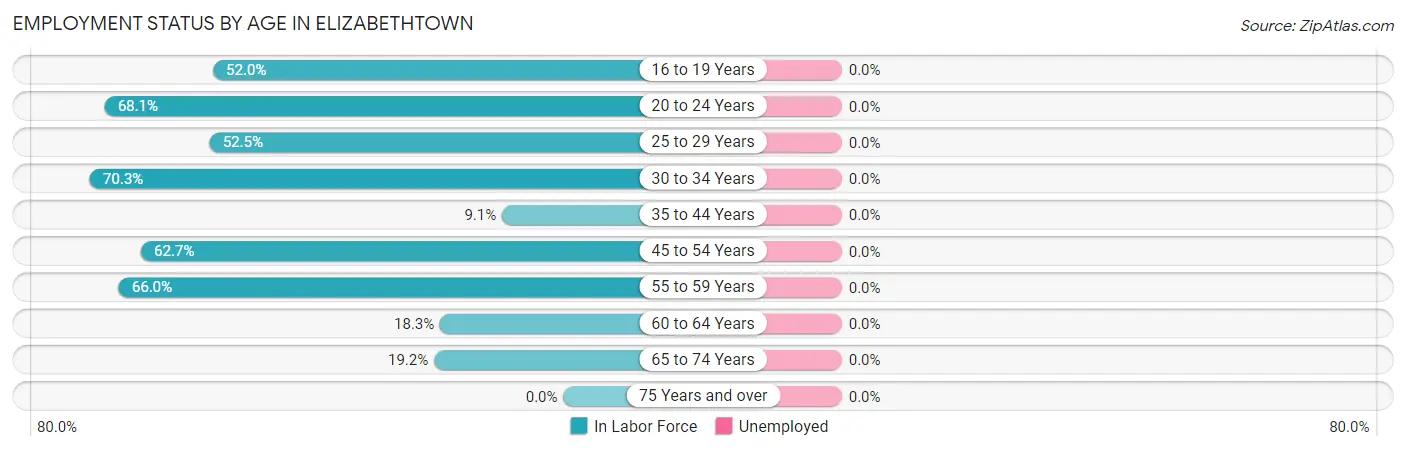
| Age Bracket | In Labor Force | Unemployed |
| 16 to 19 Years | 66 (52.0%) | 0 (0.0%) |
| 20 to 24 Years | 190 (68.1%) | 0 (0.0%) |
| 25 to 29 Years | 209 (52.5%) | 0 (0.0%) |
| 30 to 34 Years | 128 (70.3%) | 0 (0.0%) |
| 35 to 44 Years | 5 (9.1%) | 0 (0.0%) |
| 45 to 54 Years | 262 (62.7%) | 0 (0.0%) |
| 55 to 59 Years | 138 (66.0%) | 0 (0.0%) |
| 60 to 64 Years | 39 (18.3%) | 0 (0.0%) |
| 65 to 74 Years | 124 (19.2%) | 0 (0.0%) |
| 75 Years and over | 0 (0.0%) | 0 (0.0%) |
| Total | 1,161 (41.3%) | 0 (0.0%) |
Employment Status by Educational Attainment in Elizabethtown
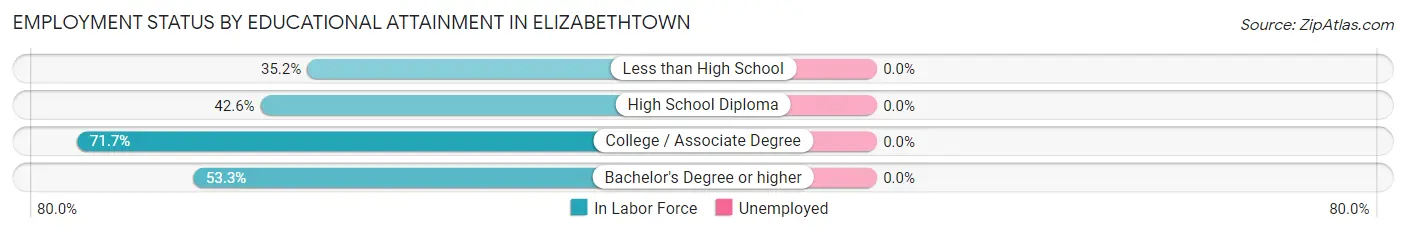
| Educational Attainment | In Labor Force | Unemployed |
| Less than High School | 87 (35.2%) | 0 (0.0%) |
| High School Diploma | 186 (42.6%) | 0 (0.0%) |
| College / Associate Degree | 337 (71.7%) | 0 (0.0%) |
| Bachelor's Degree or higher | 171 (53.3%) | 0 (0.0%) |
| Total | 780 (52.9%) | 0 (0.0%) |
Employment Occupations by Sex in Elizabethtown
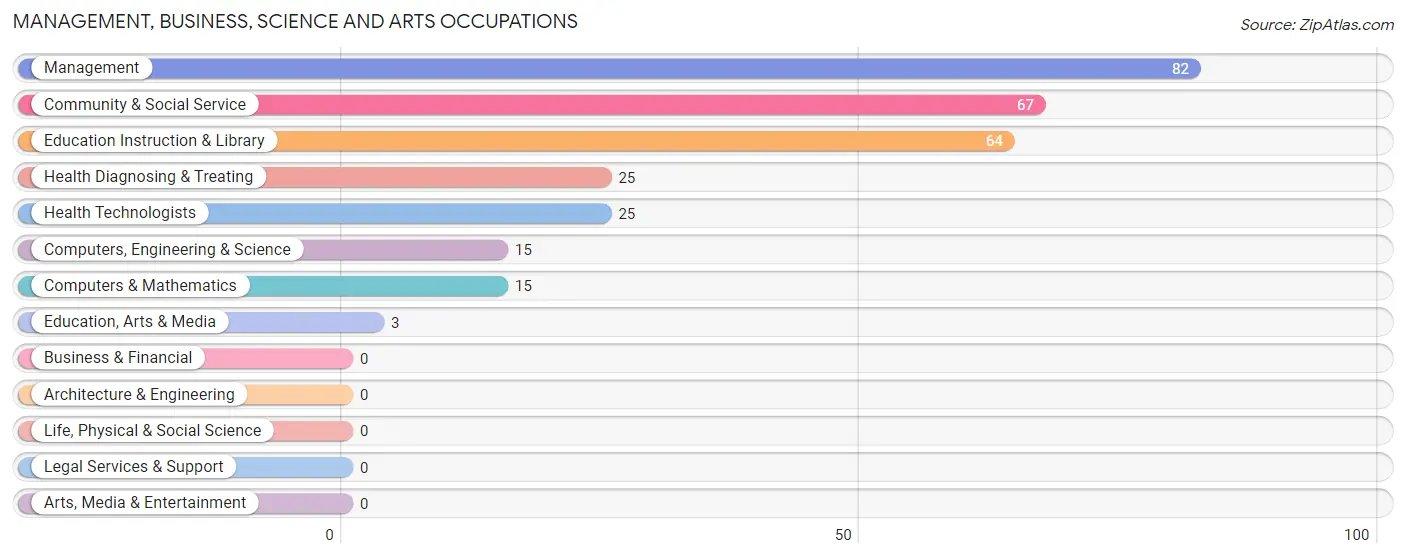
Management, Business, Science and Arts Occupations
The most common Management, Business, Science and Arts occupations in Elizabethtown are Management (82 | 7.1%), Community & Social Service (67 | 5.8%), Education Instruction & Library (64 | 5.5%), Health Diagnosing & Treating (25 | 2.1%), and Health Technologists (25 | 2.1%).
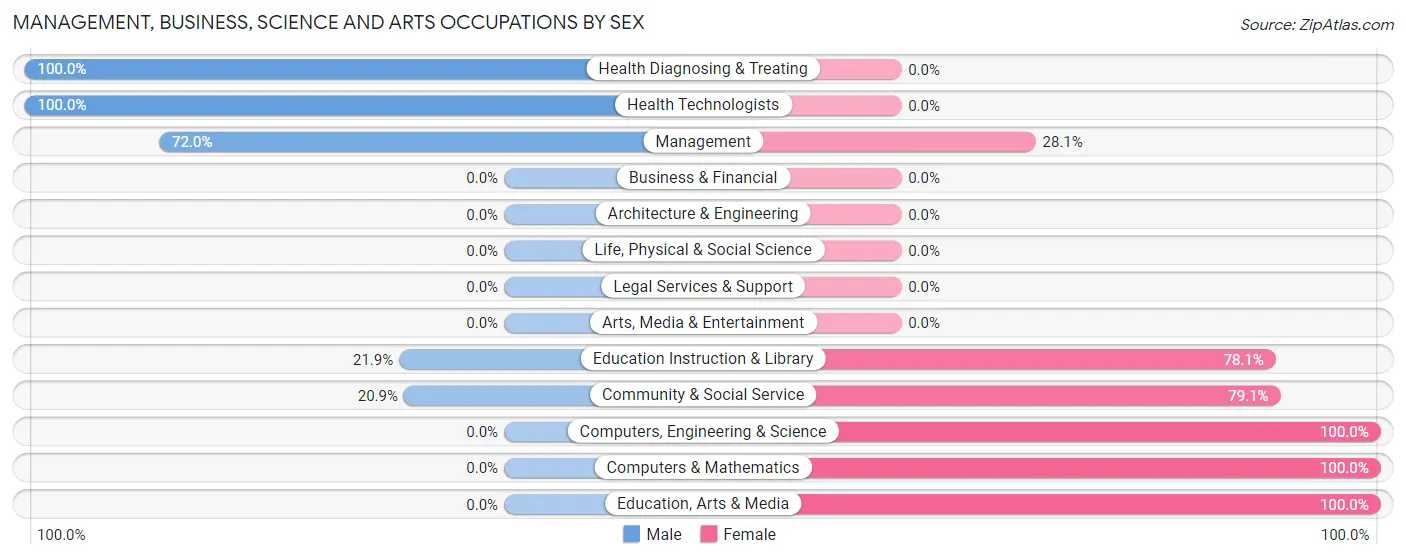
Management, Business, Science and Arts Occupations by Sex
Within the Management, Business, Science and Arts occupations in Elizabethtown, the most male-oriented occupations are Health Diagnosing & Treating (100.0%), Health Technologists (100.0%), and Management (72.0%), while the most female-oriented occupations are Computers, Engineering & Science (100.0%), Computers & Mathematics (100.0%), and Education, Arts & Media (100.0%).
| Occupation | Male | Female |
| Management | 59 (72.0%) | 23 (28.1%) |
| Business & Financial | 0 (0.0%) | 0 (0.0%) |
| Computers, Engineering & Science | 0 (0.0%) | 15 (100.0%) |
| Computers & Mathematics | 0 (0.0%) | 15 (100.0%) |
| Architecture & Engineering | 0 (0.0%) | 0 (0.0%) |
| Life, Physical & Social Science | 0 (0.0%) | 0 (0.0%) |
| Community & Social Service | 14 (20.9%) | 53 (79.1%) |
| Education, Arts & Media | 0 (0.0%) | 3 (100.0%) |
| Legal Services & Support | 0 (0.0%) | 0 (0.0%) |
| Education Instruction & Library | 14 (21.9%) | 50 (78.1%) |
| Arts, Media & Entertainment | 0 (0.0%) | 0 (0.0%) |
| Health Diagnosing & Treating | 25 (100.0%) | 0 (0.0%) |
| Health Technologists | 25 (100.0%) | 0 (0.0%) |
| Total (Category) | 98 (51.8%) | 91 (48.1%) |
| Total (Overall) | 708 (61.0%) | 453 (39.0%) |
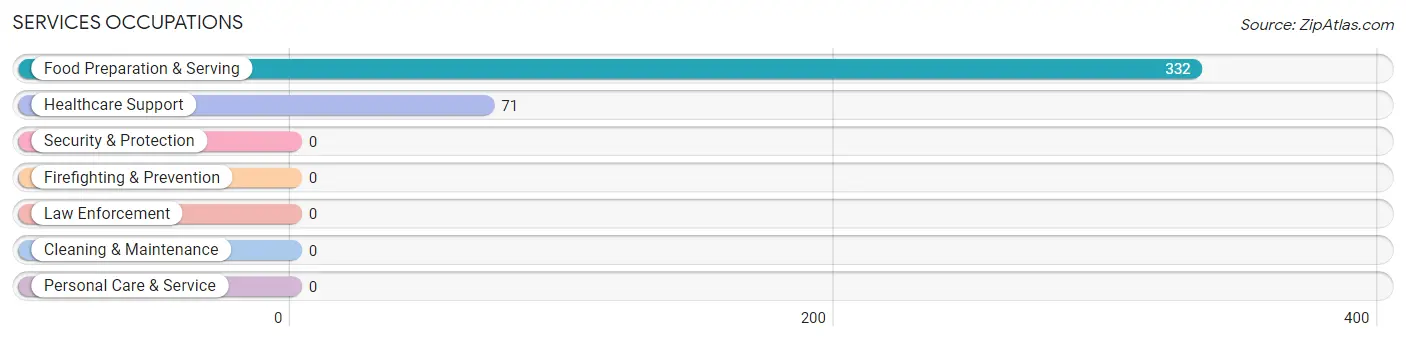
Services Occupations
The most common Services occupations in Elizabethtown are Food Preparation & Serving (332 | 28.6%), and Healthcare Support (71 | 6.1%).
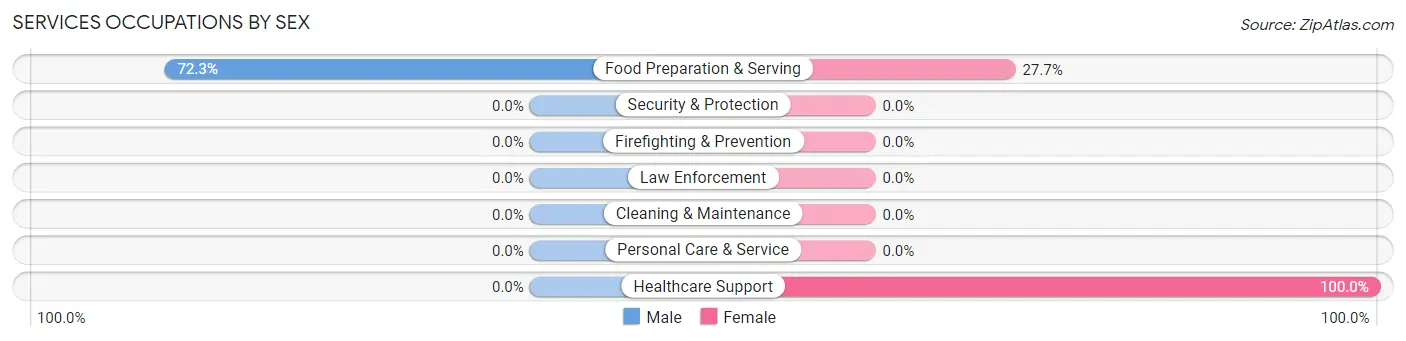
Services Occupations by Sex
| Occupation | Male | Female |
| Healthcare Support | 0 (0.0%) | 71 (100.0%) |
| Security & Protection | 0 (0.0%) | 0 (0.0%) |
| Firefighting & Prevention | 0 (0.0%) | 0 (0.0%) |
| Law Enforcement | 0 (0.0%) | 0 (0.0%) |
| Food Preparation & Serving | 240 (72.3%) | 92 (27.7%) |
| Cleaning & Maintenance | 0 (0.0%) | 0 (0.0%) |
| Personal Care & Service | 0 (0.0%) | 0 (0.0%) |
| Total (Category) | 240 (59.6%) | 163 (40.5%) |
| Total (Overall) | 708 (61.0%) | 453 (39.0%) |
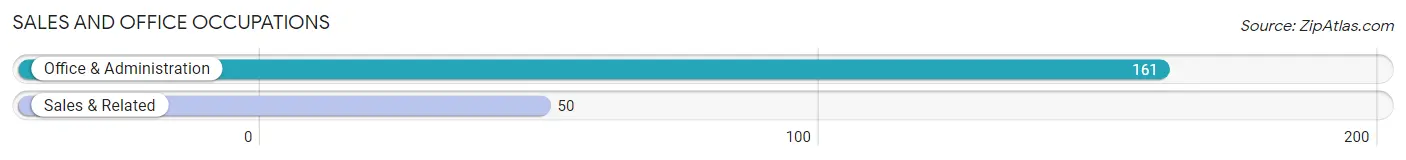
Sales and Office Occupations
The most common Sales and Office occupations in Elizabethtown are Office & Administration (161 | 13.9%), and Sales & Related (50 | 4.3%).
Sales and Office Occupations by Sex
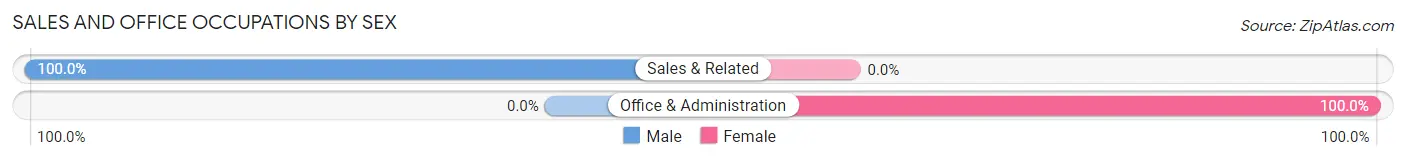
| Occupation | Male | Female |
| Sales & Related | 50 (100.0%) | 0 (0.0%) |
| Office & Administration | 0 (0.0%) | 161 (100.0%) |
| Total (Category) | 50 (23.7%) | 161 (76.3%) |
| Total (Overall) | 708 (61.0%) | 453 (39.0%) |
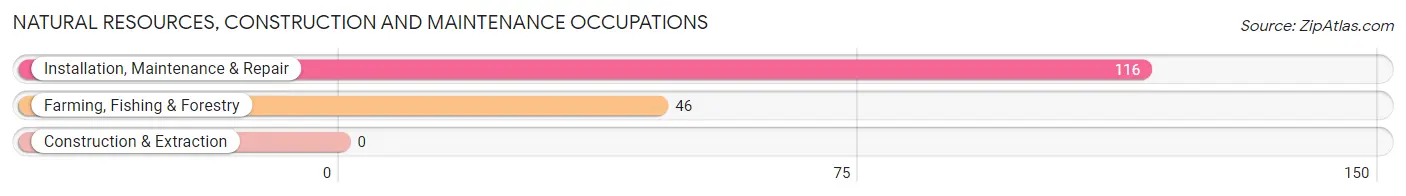
Natural Resources, Construction and Maintenance Occupations
The most common Natural Resources, Construction and Maintenance occupations in Elizabethtown are Installation, Maintenance & Repair (116 | 10.0%), and Farming, Fishing & Forestry (46 | 4.0%).
Natural Resources, Construction and Maintenance Occupations by Sex
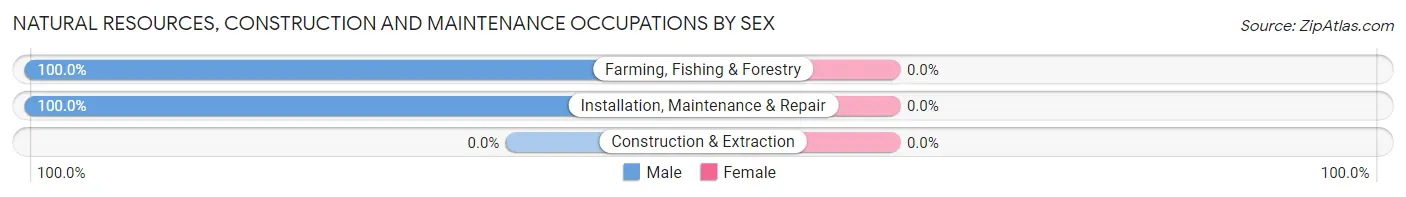
| Occupation | Male | Female |
| Farming, Fishing & Forestry | 46 (100.0%) | 0 (0.0%) |
| Construction & Extraction | 0 (0.0%) | 0 (0.0%) |
| Installation, Maintenance & Repair | 116 (100.0%) | 0 (0.0%) |
| Total (Category) | 162 (100.0%) | 0 (0.0%) |
| Total (Overall) | 708 (61.0%) | 453 (39.0%) |
Production, Transportation and Moving Occupations
The most common Production, Transportation and Moving occupations in Elizabethtown are Production (84 | 7.2%), Transportation (73 | 6.3%), and Material Moving (39 | 3.4%).
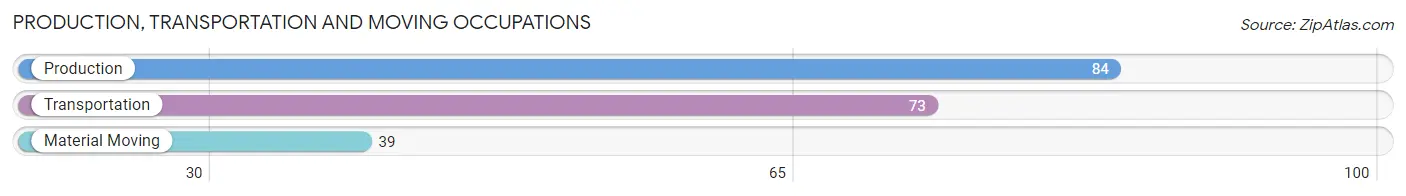
Production, Transportation and Moving Occupations by Sex
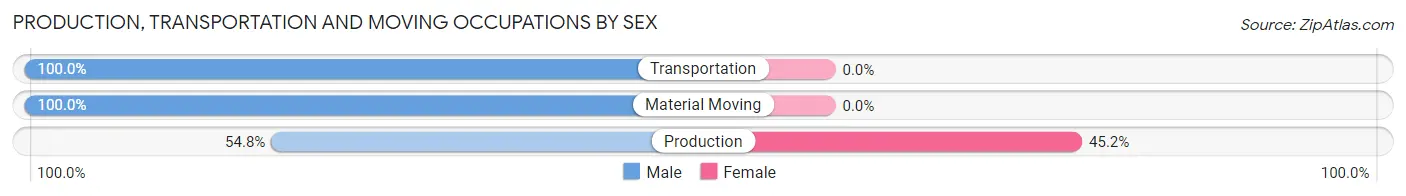
| Occupation | Male | Female |
| Production | 46 (54.8%) | 38 (45.2%) |
| Transportation | 73 (100.0%) | 0 (0.0%) |
| Material Moving | 39 (100.0%) | 0 (0.0%) |
| Total (Category) | 158 (80.6%) | 38 (19.4%) |
| Total (Overall) | 708 (61.0%) | 453 (39.0%) |
Employment Industries by Sex in Elizabethtown
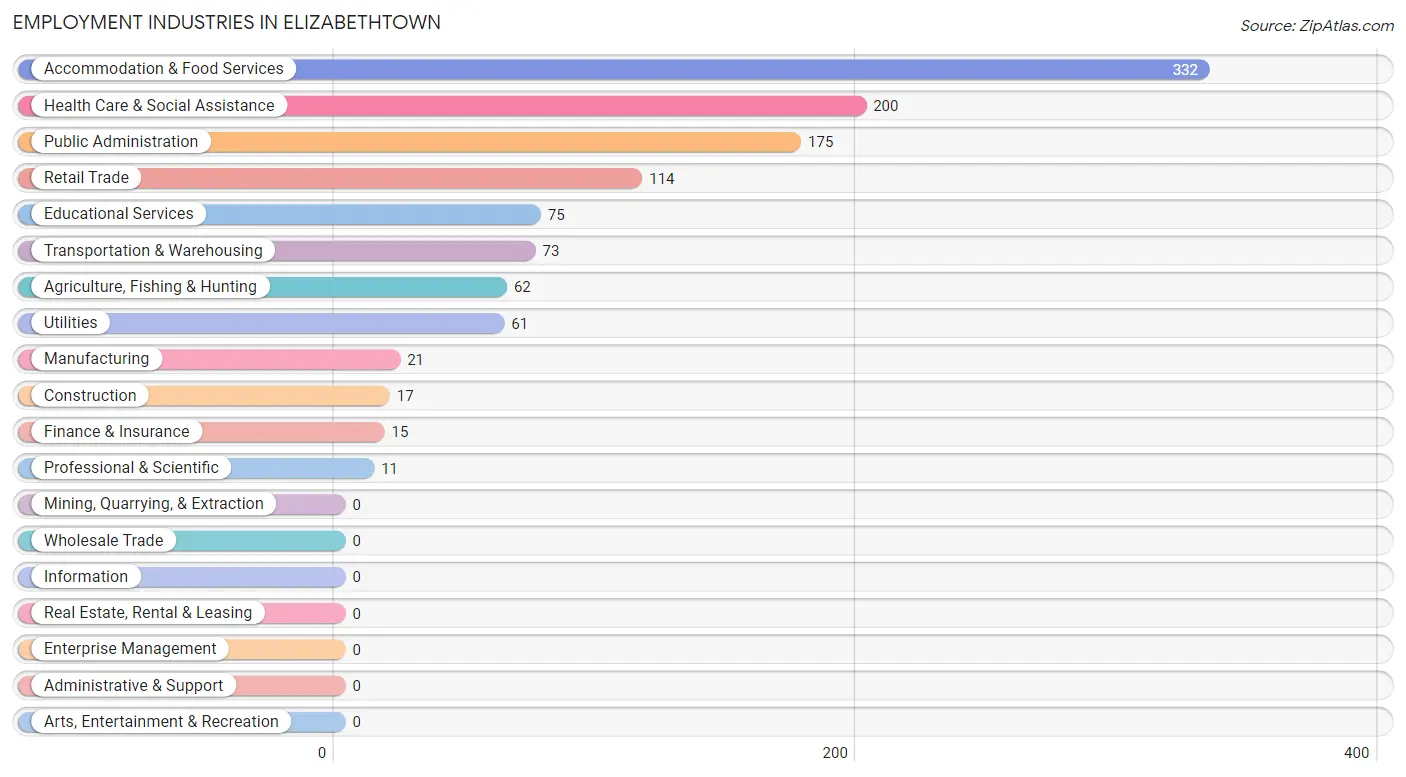
Employment Industries in Elizabethtown
The major employment industries in Elizabethtown include Accommodation & Food Services (332 | 28.6%), Health Care & Social Assistance (200 | 17.2%), Public Administration (175 | 15.1%), Retail Trade (114 | 9.8%), and Educational Services (75 | 6.5%).
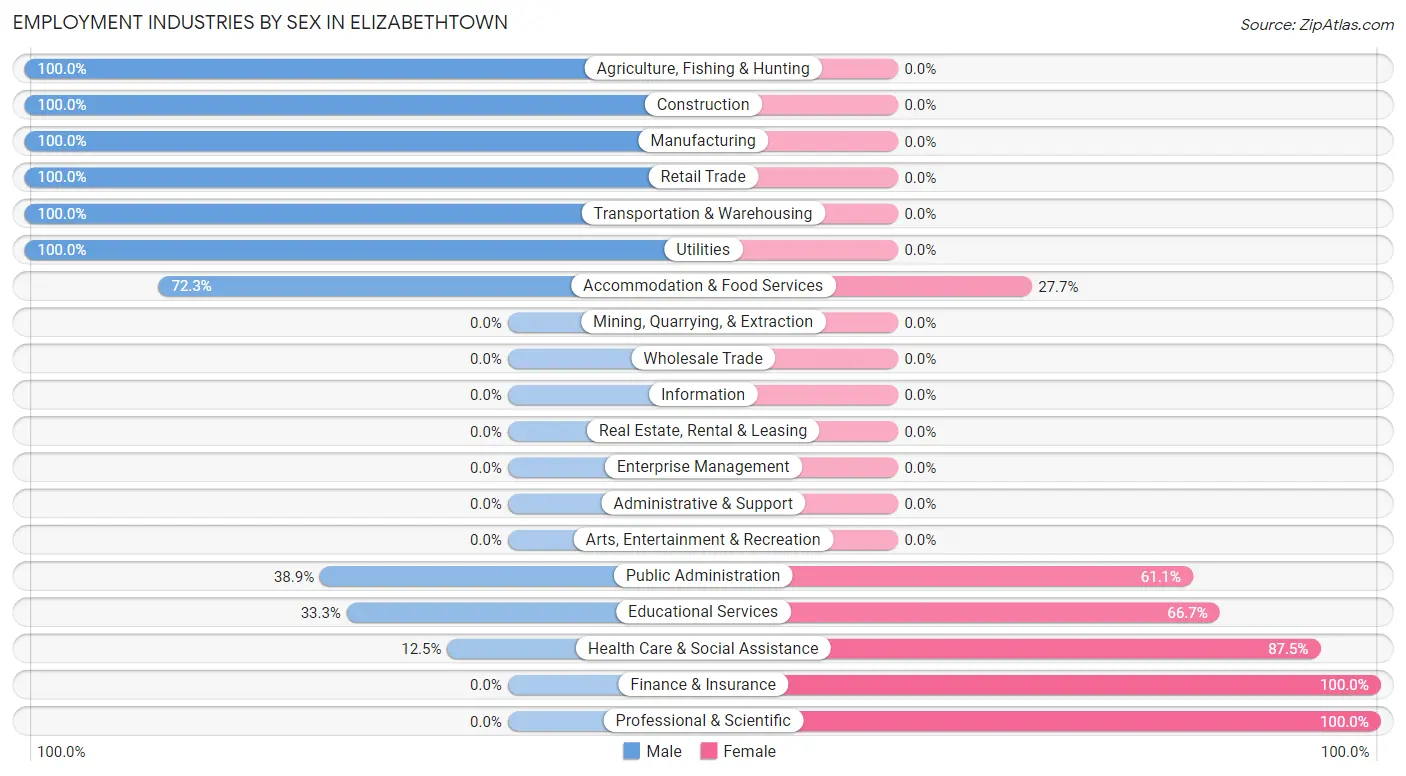
Employment Industries by Sex in Elizabethtown
The Elizabethtown industries that see more men than women are Agriculture, Fishing & Hunting (100.0%), Construction (100.0%), and Manufacturing (100.0%), whereas the industries that tend to have a higher number of women are Finance & Insurance (100.0%), Professional & Scientific (100.0%), and Health Care & Social Assistance (87.5%).
| Industry | Male | Female |
| Agriculture, Fishing & Hunting | 62 (100.0%) | 0 (0.0%) |
| Mining, Quarrying, & Extraction | 0 (0.0%) | 0 (0.0%) |
| Construction | 17 (100.0%) | 0 (0.0%) |
| Manufacturing | 21 (100.0%) | 0 (0.0%) |
| Wholesale Trade | 0 (0.0%) | 0 (0.0%) |
| Retail Trade | 114 (100.0%) | 0 (0.0%) |
| Transportation & Warehousing | 73 (100.0%) | 0 (0.0%) |
| Utilities | 61 (100.0%) | 0 (0.0%) |
| Information | 0 (0.0%) | 0 (0.0%) |
| Finance & Insurance | 0 (0.0%) | 15 (100.0%) |
| Real Estate, Rental & Leasing | 0 (0.0%) | 0 (0.0%) |
| Professional & Scientific | 0 (0.0%) | 11 (100.0%) |
| Enterprise Management | 0 (0.0%) | 0 (0.0%) |
| Administrative & Support | 0 (0.0%) | 0 (0.0%) |
| Educational Services | 25 (33.3%) | 50 (66.7%) |
| Health Care & Social Assistance | 25 (12.5%) | 175 (87.5%) |
| Arts, Entertainment & Recreation | 0 (0.0%) | 0 (0.0%) |
| Accommodation & Food Services | 240 (72.3%) | 92 (27.7%) |
| Public Administration | 68 (38.9%) | 107 (61.1%) |
| Total | 708 (61.0%) | 453 (39.0%) |
Education in Elizabethtown
School Enrollment in Elizabethtown
The most common levels of schooling among the 601 students in Elizabethtown are college / undergraduate (183 | 30.4%), high school (170 | 28.3%), and elementary school (149 | 24.8%).
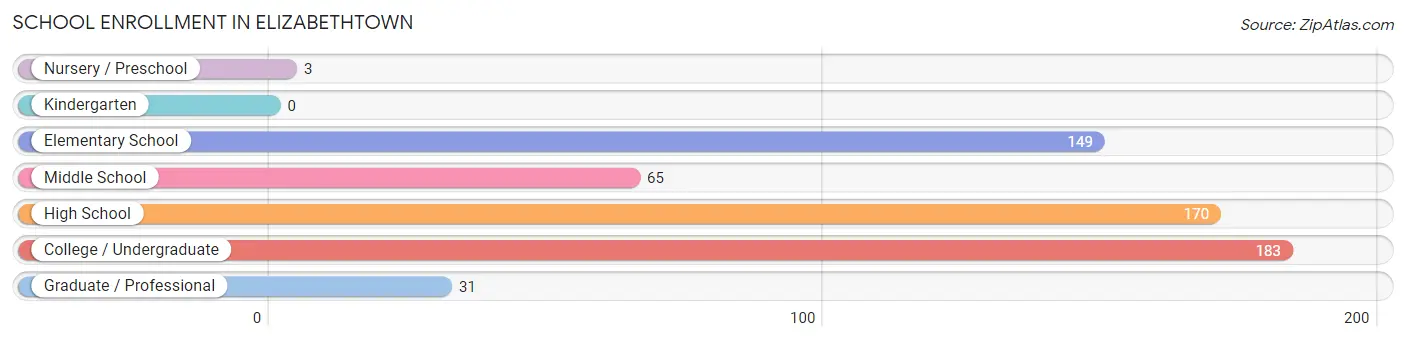
| School Level | # Students | % Students |
| Nursery / Preschool | 3 | 0.5% |
| Kindergarten | 0 | 0.0% |
| Elementary School | 149 | 24.8% |
| Middle School | 65 | 10.8% |
| High School | 170 | 28.3% |
| College / Undergraduate | 183 | 30.4% |
| Graduate / Professional | 31 | 5.2% |
| Total | 601 | 100.0% |
School Enrollment by Age by Funding Source in Elizabethtown
Out of a total of 601 students who are enrolled in schools in Elizabethtown, 61 (10.1%) attend a private institution, while the remaining 540 (89.9%) are enrolled in public schools. The age group of 10 to 14 year olds has the highest likelihood of being enrolled in private schools, with 38 (58.5% in the age bracket) enrolled. Conversely, the age group of 3 to 4 year olds has the lowest likelihood of being enrolled in a private school, with 3 (100.0% in the age bracket) attending a public institution.
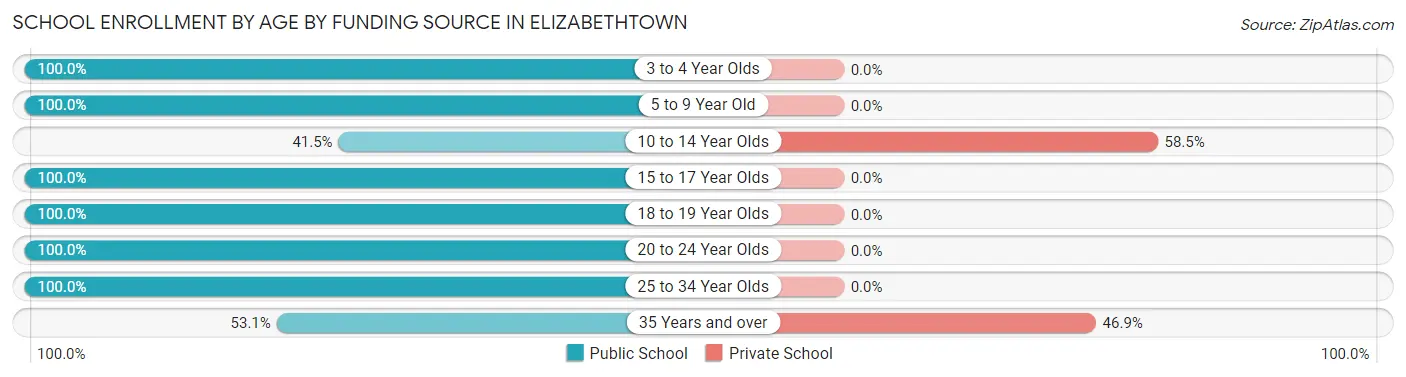
| Age Bracket | Public School | Private School |
| 3 to 4 Year Olds | 3 (100.0%) | 0 (0.0%) |
| 5 to 9 Year Old | 149 (100.0%) | 0 (0.0%) |
| 10 to 14 Year Olds | 27 (41.5%) | 38 (58.5%) |
| 15 to 17 Year Olds | 143 (100.0%) | 0 (0.0%) |
| 18 to 19 Year Olds | 49 (100.0%) | 0 (0.0%) |
| 20 to 24 Year Olds | 89 (100.0%) | 0 (0.0%) |
| 25 to 34 Year Olds | 54 (100.0%) | 0 (0.0%) |
| 35 Years and over | 26 (53.1%) | 23 (46.9%) |
| Total | 540 (89.9%) | 61 (10.1%) |
Educational Attainment by Field of Study in Elizabethtown
Arts & humanities (107 | 21.6%), education (105 | 21.2%), science & technology (81 | 16.4%), business (78 | 15.8%), and bio, nature & agricultural (54 | 10.9%) are the most common fields of study among 495 individuals in Elizabethtown who have obtained a bachelor's degree or higher.
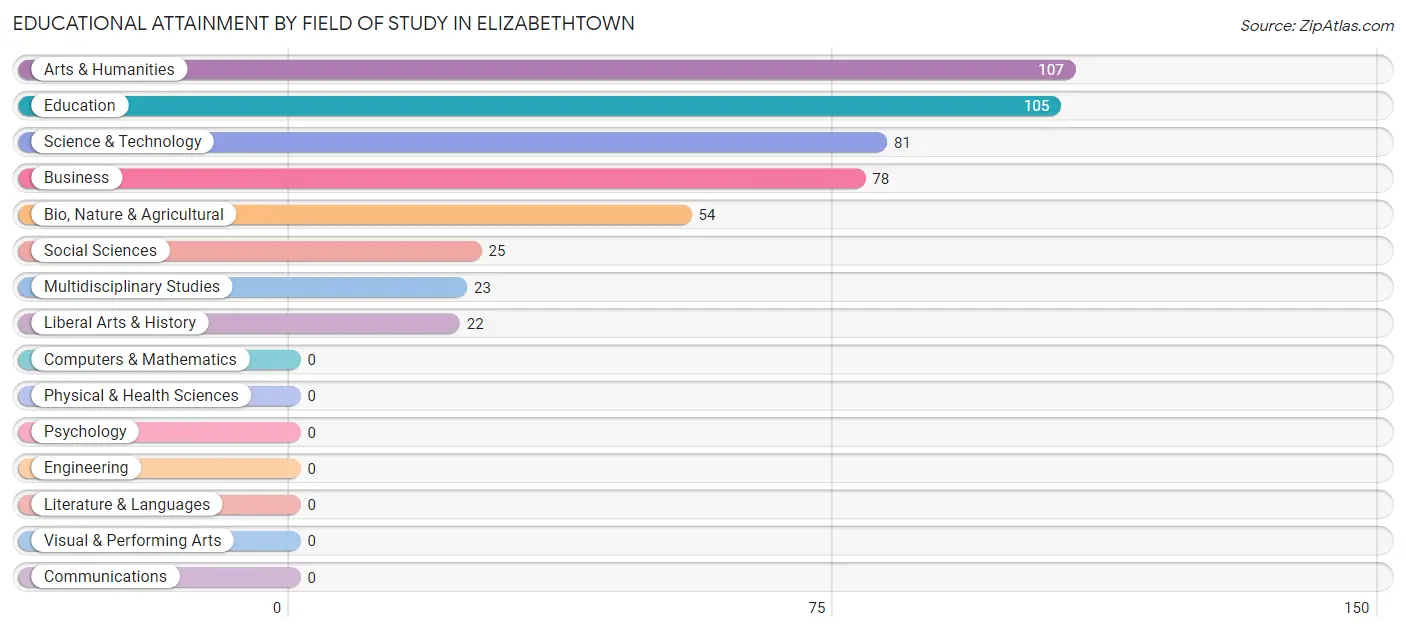
| Field of Study | # Graduates | % Graduates |
| Computers & Mathematics | 0 | 0.0% |
| Bio, Nature & Agricultural | 54 | 10.9% |
| Physical & Health Sciences | 0 | 0.0% |
| Psychology | 0 | 0.0% |
| Social Sciences | 25 | 5.1% |
| Engineering | 0 | 0.0% |
| Multidisciplinary Studies | 23 | 4.6% |
| Science & Technology | 81 | 16.4% |
| Business | 78 | 15.8% |
| Education | 105 | 21.2% |
| Literature & Languages | 0 | 0.0% |
| Liberal Arts & History | 22 | 4.4% |
| Visual & Performing Arts | 0 | 0.0% |
| Communications | 0 | 0.0% |
| Arts & Humanities | 107 | 21.6% |
| Total | 495 | 100.0% |
Transportation & Commute in Elizabethtown
Vehicle Availability by Sex in Elizabethtown
The most prevalent vehicle ownership categories in Elizabethtown are males with 1 vehicle (250, accounting for 44.0%) and females with 1 vehicle (269, making up 55.2%).
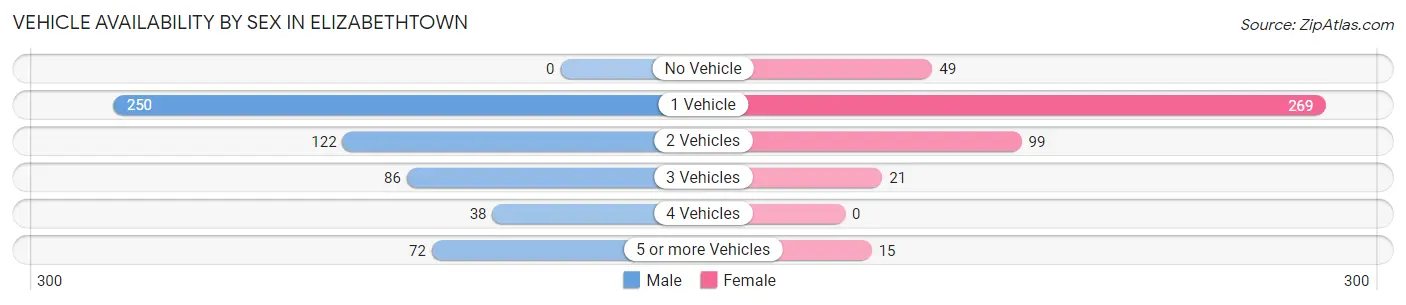
| Vehicles Available | Male | Female |
| No Vehicle | 0 (0.0%) | 49 (10.8%) |
| 1 Vehicle | 250 (44.0%) | 269 (59.4%) |
| 2 Vehicles | 122 (21.5%) | 99 (21.8%) |
| 3 Vehicles | 86 (15.1%) | 21 (4.6%) |
| 4 Vehicles | 38 (6.7%) | 0 (0.0%) |
| 5 or more Vehicles | 72 (12.7%) | 15 (3.3%) |
| Total | 568 (100.0%) | 453 (100.0%) |
Commute Time in Elizabethtown
The most frequently occuring commute durations in Elizabethtown are 5 to 9 minutes (261 commuters, 25.6%), 45 to 59 minutes (189 commuters, 18.5%), and 10 to 14 minutes (174 commuters, 17.0%).
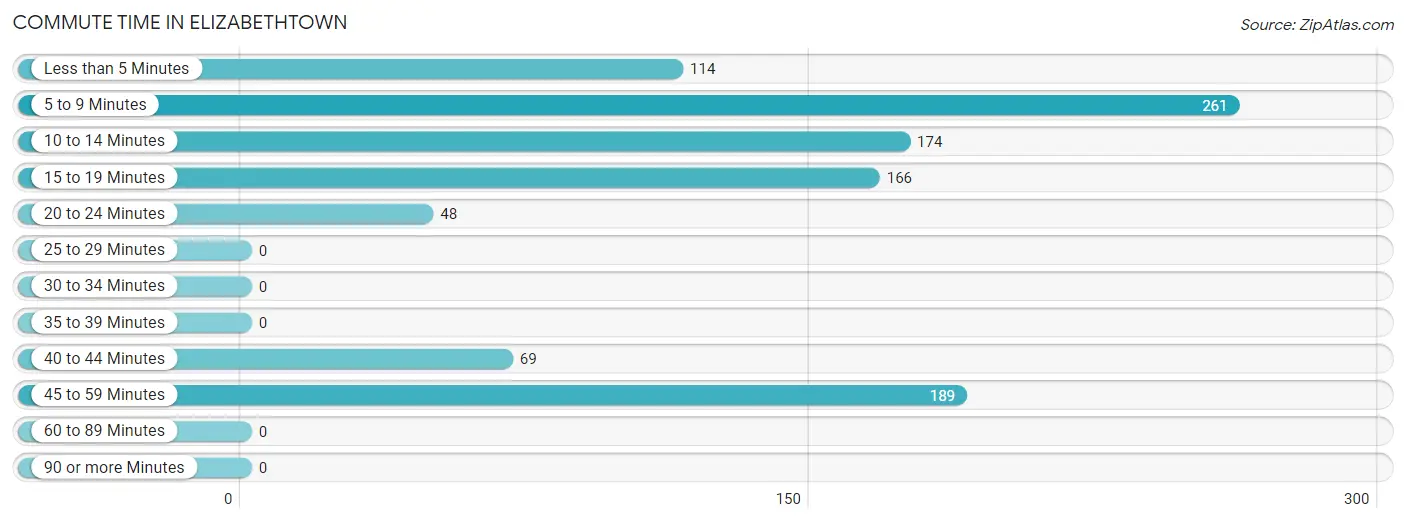
| Commute Time | # Commuters | % Commuters |
| Less than 5 Minutes | 114 | 11.2% |
| 5 to 9 Minutes | 261 | 25.6% |
| 10 to 14 Minutes | 174 | 17.0% |
| 15 to 19 Minutes | 166 | 16.3% |
| 20 to 24 Minutes | 48 | 4.7% |
| 25 to 29 Minutes | 0 | 0.0% |
| 30 to 34 Minutes | 0 | 0.0% |
| 35 to 39 Minutes | 0 | 0.0% |
| 40 to 44 Minutes | 69 | 6.8% |
| 45 to 59 Minutes | 189 | 18.5% |
| 60 to 89 Minutes | 0 | 0.0% |
| 90 or more Minutes | 0 | 0.0% |
Commute Time by Sex in Elizabethtown
The most common commute times in Elizabethtown are 15 to 19 minutes (166 commuters, 29.2%) for males and 5 to 9 minutes (168 commuters, 37.1%) for females.
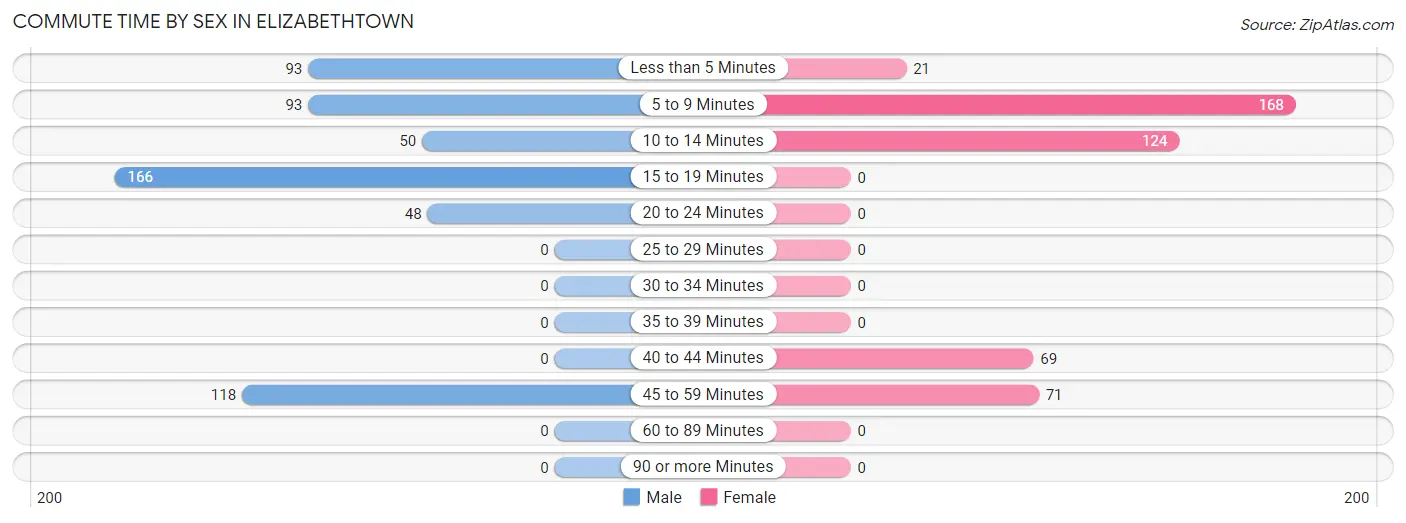
| Commute Time | Male | Female |
| Less than 5 Minutes | 93 (16.4%) | 21 (4.6%) |
| 5 to 9 Minutes | 93 (16.4%) | 168 (37.1%) |
| 10 to 14 Minutes | 50 (8.8%) | 124 (27.4%) |
| 15 to 19 Minutes | 166 (29.2%) | 0 (0.0%) |
| 20 to 24 Minutes | 48 (8.5%) | 0 (0.0%) |
| 25 to 29 Minutes | 0 (0.0%) | 0 (0.0%) |
| 30 to 34 Minutes | 0 (0.0%) | 0 (0.0%) |
| 35 to 39 Minutes | 0 (0.0%) | 0 (0.0%) |
| 40 to 44 Minutes | 0 (0.0%) | 69 (15.2%) |
| 45 to 59 Minutes | 118 (20.8%) | 71 (15.7%) |
| 60 to 89 Minutes | 0 (0.0%) | 0 (0.0%) |
| 90 or more Minutes | 0 (0.0%) | 0 (0.0%) |
Time of Departure to Work by Sex in Elizabethtown
The most frequent times of departure to work in Elizabethtown are 4:00 PM to 11:59 PM (132, 23.2%) for males and 7:30 AM to 7:59 AM (231, 51.0%) for females.
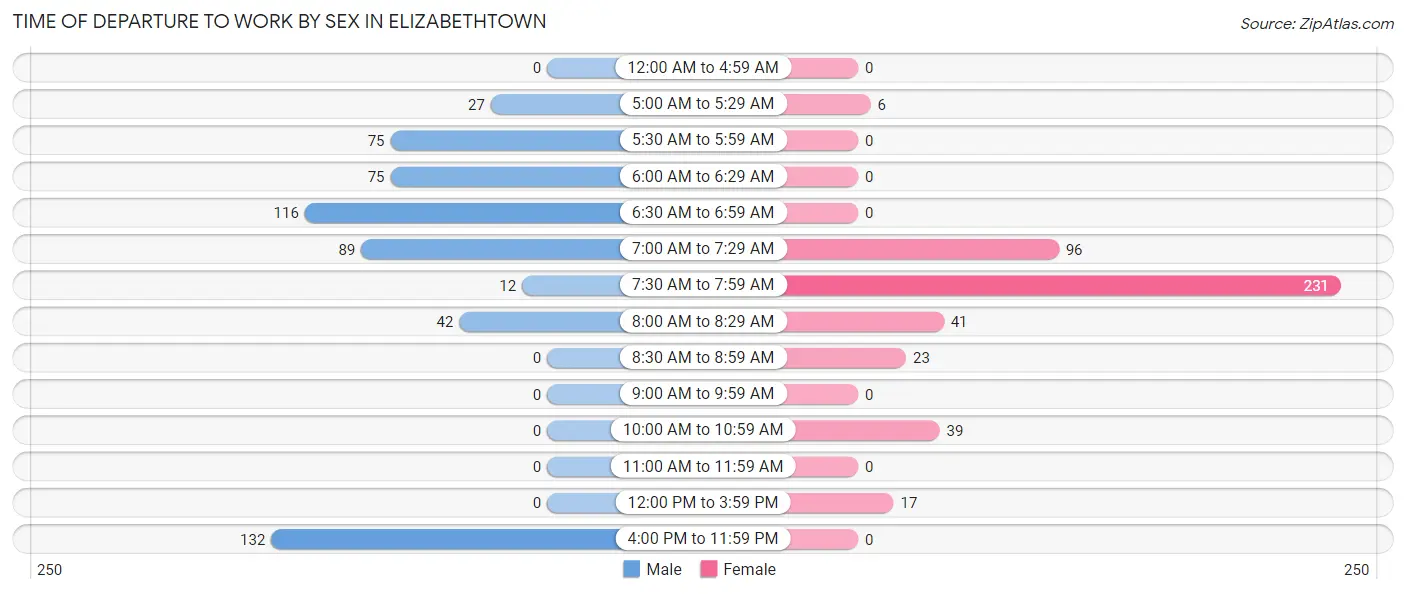
| Time of Departure | Male | Female |
| 12:00 AM to 4:59 AM | 0 (0.0%) | 0 (0.0%) |
| 5:00 AM to 5:29 AM | 27 (4.8%) | 6 (1.3%) |
| 5:30 AM to 5:59 AM | 75 (13.2%) | 0 (0.0%) |
| 6:00 AM to 6:29 AM | 75 (13.2%) | 0 (0.0%) |
| 6:30 AM to 6:59 AM | 116 (20.4%) | 0 (0.0%) |
| 7:00 AM to 7:29 AM | 89 (15.7%) | 96 (21.2%) |
| 7:30 AM to 7:59 AM | 12 (2.1%) | 231 (51.0%) |
| 8:00 AM to 8:29 AM | 42 (7.4%) | 41 (9.0%) |
| 8:30 AM to 8:59 AM | 0 (0.0%) | 23 (5.1%) |
| 9:00 AM to 9:59 AM | 0 (0.0%) | 0 (0.0%) |
| 10:00 AM to 10:59 AM | 0 (0.0%) | 39 (8.6%) |
| 11:00 AM to 11:59 AM | 0 (0.0%) | 0 (0.0%) |
| 12:00 PM to 3:59 PM | 0 (0.0%) | 17 (3.7%) |
| 4:00 PM to 11:59 PM | 132 (23.2%) | 0 (0.0%) |
| Total | 568 (100.0%) | 453 (100.0%) |
Housing Occupancy in Elizabethtown
Occupancy by Ownership in Elizabethtown
Of the total 1,594 dwellings in Elizabethtown, owner-occupied units account for 872 (54.7%), while renter-occupied units make up 722 (45.3%).
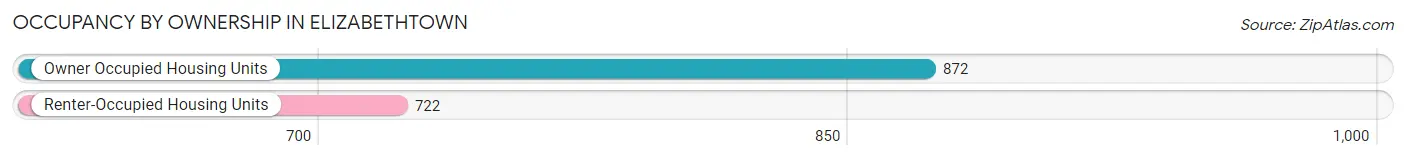
| Occupancy | # Housing Units | % Housing Units |
| Owner Occupied Housing Units | 872 | 54.7% |
| Renter-Occupied Housing Units | 722 | 45.3% |
| Total Occupied Housing Units | 1,594 | 100.0% |
Occupancy by Household Size in Elizabethtown
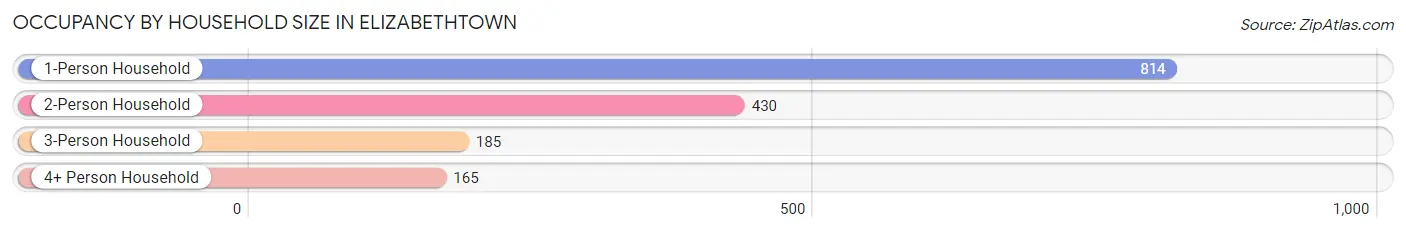
| Household Size | # Housing Units | % Housing Units |
| 1-Person Household | 814 | 51.1% |
| 2-Person Household | 430 | 27.0% |
| 3-Person Household | 185 | 11.6% |
| 4+ Person Household | 165 | 10.3% |
| Total Housing Units | 1,594 | 100.0% |
Occupancy by Ownership by Household Size in Elizabethtown
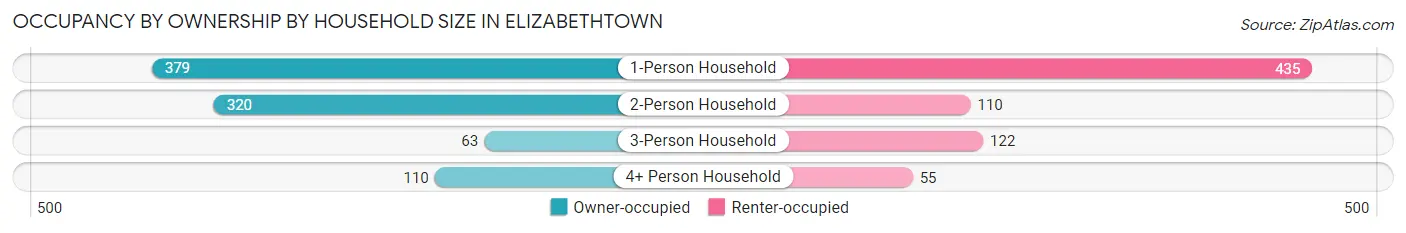
| Household Size | Owner-occupied | Renter-occupied |
| 1-Person Household | 379 (46.6%) | 435 (53.4%) |
| 2-Person Household | 320 (74.4%) | 110 (25.6%) |
| 3-Person Household | 63 (34.1%) | 122 (65.9%) |
| 4+ Person Household | 110 (66.7%) | 55 (33.3%) |
| Total Housing Units | 872 (54.7%) | 722 (45.3%) |
Occupancy by Educational Attainment in Elizabethtown
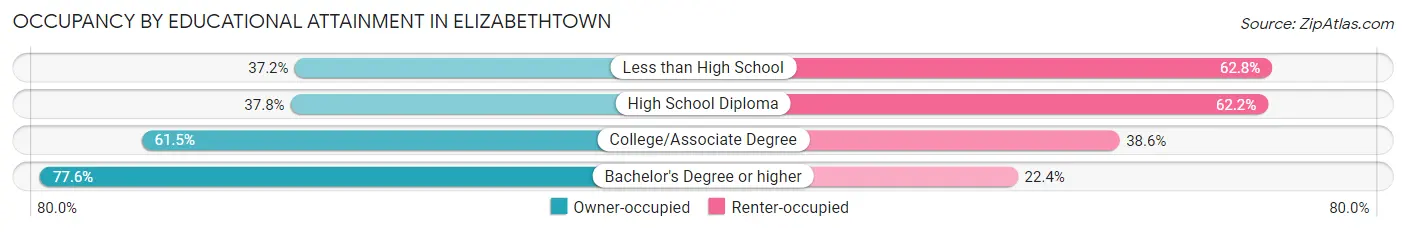
| Household Size | Owner-occupied | Renter-occupied |
| Less than High School | 80 (37.2%) | 135 (62.8%) |
| High School Diploma | 182 (37.8%) | 299 (62.2%) |
| College/Associate Degree | 330 (61.5%) | 207 (38.6%) |
| Bachelor's Degree or higher | 280 (77.6%) | 81 (22.4%) |
Occupancy by Age of Householder in Elizabethtown
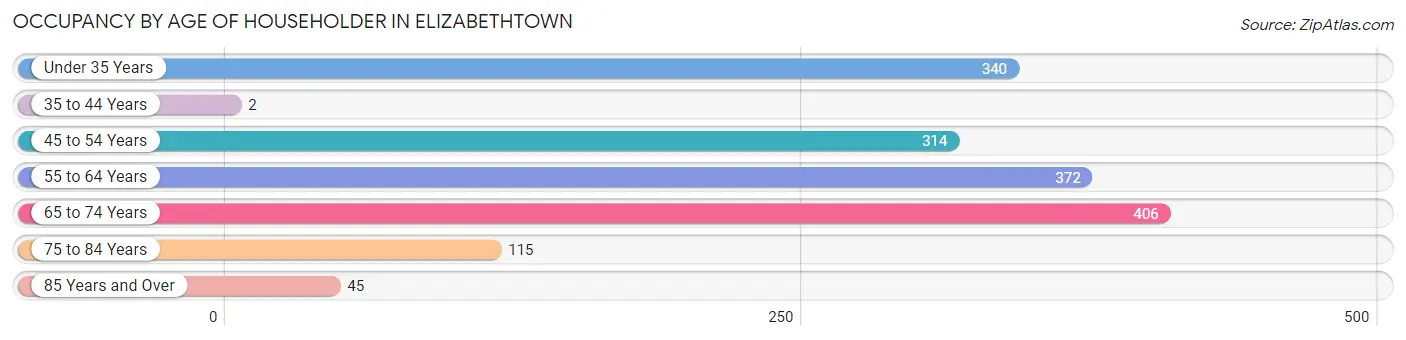
| Age Bracket | # Households | % Households |
| Under 35 Years | 340 | 21.3% |
| 35 to 44 Years | 2 | 0.1% |
| 45 to 54 Years | 314 | 19.7% |
| 55 to 64 Years | 372 | 23.3% |
| 65 to 74 Years | 406 | 25.5% |
| 75 to 84 Years | 115 | 7.2% |
| 85 Years and Over | 45 | 2.8% |
| Total | 1,594 | 100.0% |
Housing Finances in Elizabethtown
Median Income by Occupancy in Elizabethtown
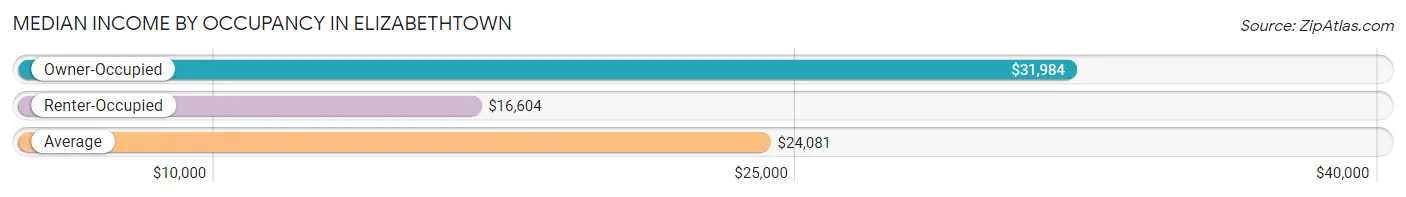
| Occupancy Type | # Households | Median Income |
| Owner-Occupied | 872 (54.7%) | $31,984 |
| Renter-Occupied | 722 (45.3%) | $16,604 |
| Average | 1,594 (100.0%) | $24,081 |
Occupancy by Householder Income Bracket in Elizabethtown
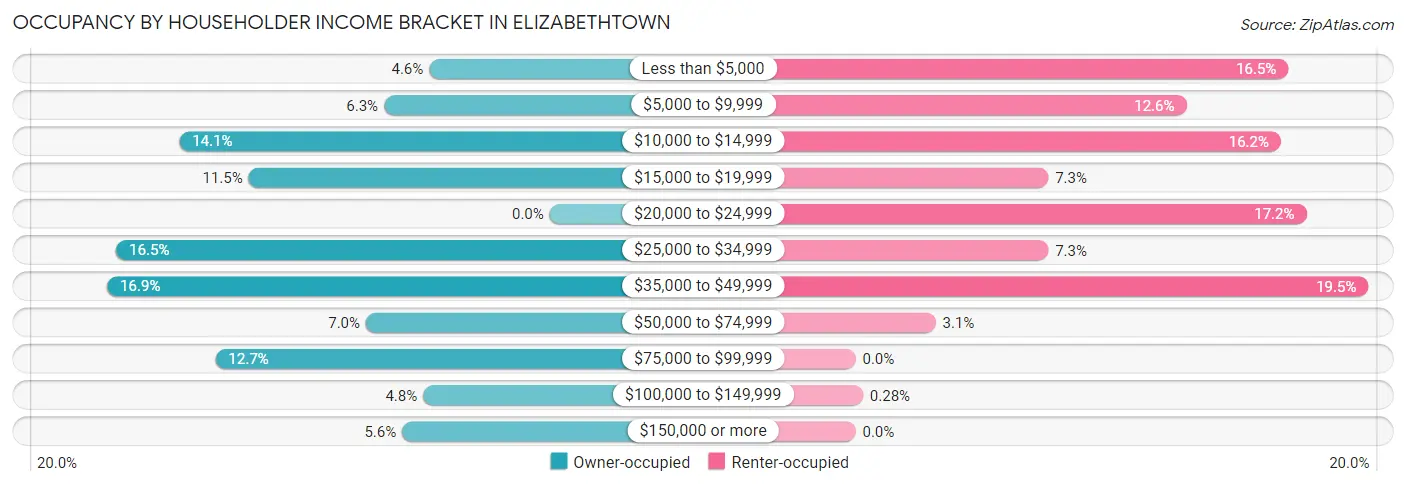
| Income Bracket | Owner-occupied | Renter-occupied |
| Less than $5,000 | 40 (4.6%) | 119 (16.5%) |
| $5,000 to $9,999 | 55 (6.3%) | 91 (12.6%) |
| $10,000 to $14,999 | 123 (14.1%) | 117 (16.2%) |
| $15,000 to $19,999 | 100 (11.5%) | 53 (7.3%) |
| $20,000 to $24,999 | 0 (0.0%) | 124 (17.2%) |
| $25,000 to $34,999 | 144 (16.5%) | 53 (7.3%) |
| $35,000 to $49,999 | 147 (16.9%) | 141 (19.5%) |
| $50,000 to $74,999 | 61 (7.0%) | 22 (3.0%) |
| $75,000 to $99,999 | 111 (12.7%) | 0 (0.0%) |
| $100,000 to $149,999 | 42 (4.8%) | 2 (0.3%) |
| $150,000 or more | 49 (5.6%) | 0 (0.0%) |
| Total | 872 (100.0%) | 722 (100.0%) |
Monthly Housing Cost Tiers in Elizabethtown
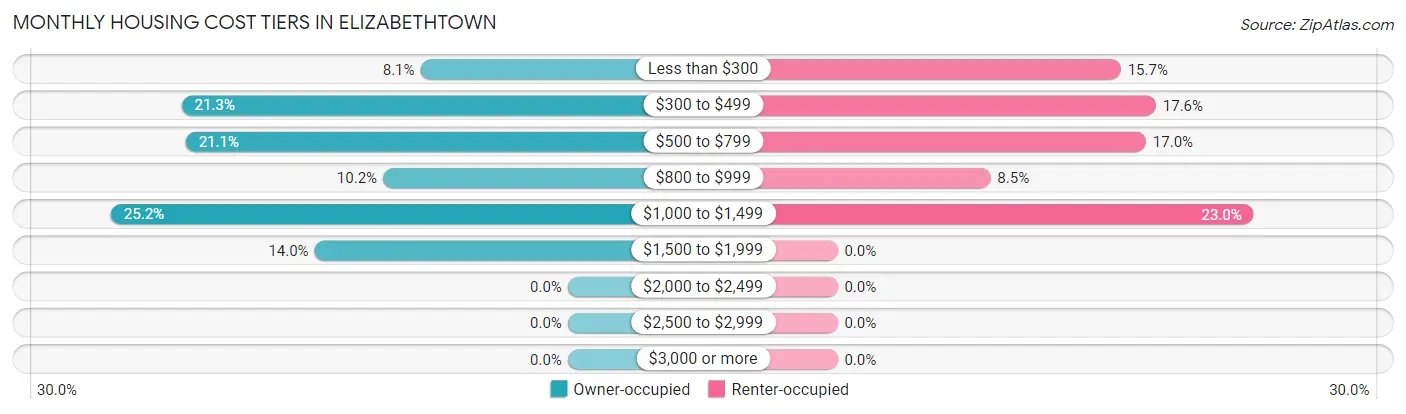
| Monthly Cost | Owner-occupied | Renter-occupied |
| Less than $300 | 71 (8.1%) | 113 (15.7%) |
| $300 to $499 | 186 (21.3%) | 127 (17.6%) |
| $500 to $799 | 184 (21.1%) | 123 (17.0%) |
| $800 to $999 | 89 (10.2%) | 61 (8.5%) |
| $1,000 to $1,499 | 220 (25.2%) | 166 (23.0%) |
| $1,500 to $1,999 | 122 (14.0%) | 0 (0.0%) |
| $2,000 to $2,499 | 0 (0.0%) | 0 (0.0%) |
| $2,500 to $2,999 | 0 (0.0%) | 0 (0.0%) |
| $3,000 or more | 0 (0.0%) | 0 (0.0%) |
| Total | 872 (100.0%) | 722 (100.0%) |
Physical Housing Characteristics in Elizabethtown
Housing Structures in Elizabethtown
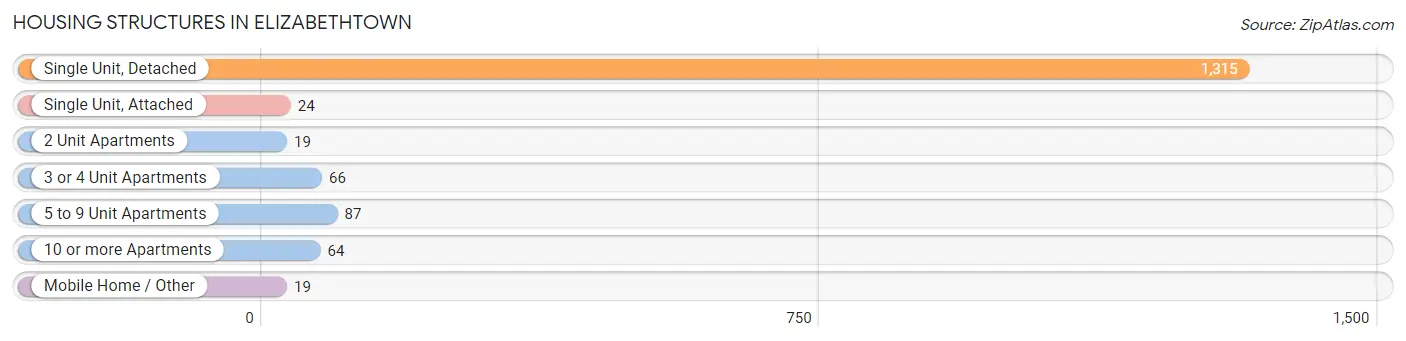
| Structure Type | # Housing Units | % Housing Units |
| Single Unit, Detached | 1,315 | 82.5% |
| Single Unit, Attached | 24 | 1.5% |
| 2 Unit Apartments | 19 | 1.2% |
| 3 or 4 Unit Apartments | 66 | 4.1% |
| 5 to 9 Unit Apartments | 87 | 5.5% |
| 10 or more Apartments | 64 | 4.0% |
| Mobile Home / Other | 19 | 1.2% |
| Total | 1,594 | 100.0% |
Housing Structures by Occupancy in Elizabethtown
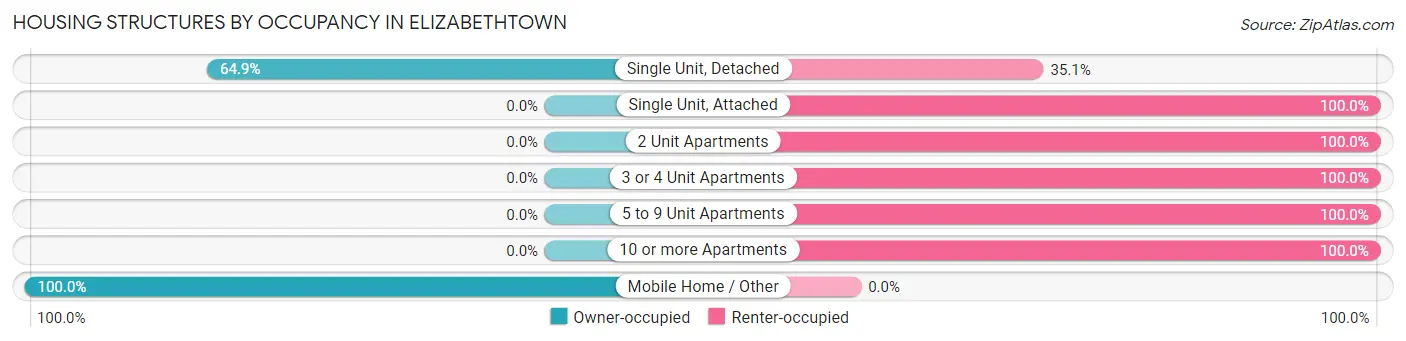
| Structure Type | Owner-occupied | Renter-occupied |
| Single Unit, Detached | 853 (64.9%) | 462 (35.1%) |
| Single Unit, Attached | 0 (0.0%) | 24 (100.0%) |
| 2 Unit Apartments | 0 (0.0%) | 19 (100.0%) |
| 3 or 4 Unit Apartments | 0 (0.0%) | 66 (100.0%) |
| 5 to 9 Unit Apartments | 0 (0.0%) | 87 (100.0%) |
| 10 or more Apartments | 0 (0.0%) | 64 (100.0%) |
| Mobile Home / Other | 19 (100.0%) | 0 (0.0%) |
| Total | 872 (54.7%) | 722 (45.3%) |
Housing Structures by Number of Rooms in Elizabethtown
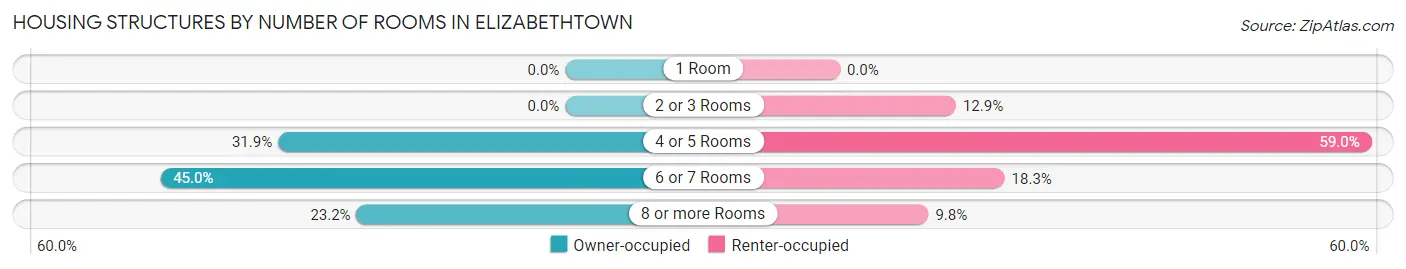
| Number of Rooms | Owner-occupied | Renter-occupied |
| 1 Room | 0 (0.0%) | 0 (0.0%) |
| 2 or 3 Rooms | 0 (0.0%) | 93 (12.9%) |
| 4 or 5 Rooms | 278 (31.9%) | 426 (59.0%) |
| 6 or 7 Rooms | 392 (45.0%) | 132 (18.3%) |
| 8 or more Rooms | 202 (23.2%) | 71 (9.8%) |
| Total | 872 (100.0%) | 722 (100.0%) |
Housing Structure by Heating Type in Elizabethtown
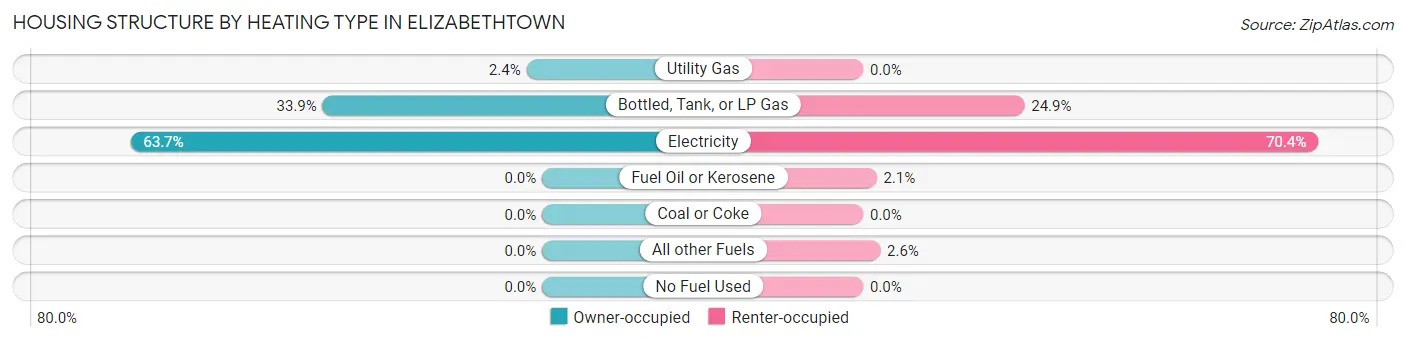
| Heating Type | Owner-occupied | Renter-occupied |
| Utility Gas | 21 (2.4%) | 0 (0.0%) |
| Bottled, Tank, or LP Gas | 296 (33.9%) | 180 (24.9%) |
| Electricity | 555 (63.6%) | 508 (70.4%) |
| Fuel Oil or Kerosene | 0 (0.0%) | 15 (2.1%) |
| Coal or Coke | 0 (0.0%) | 0 (0.0%) |
| All other Fuels | 0 (0.0%) | 19 (2.6%) |
| No Fuel Used | 0 (0.0%) | 0 (0.0%) |
| Total | 872 (100.0%) | 722 (100.0%) |
Household Vehicle Usage in Elizabethtown
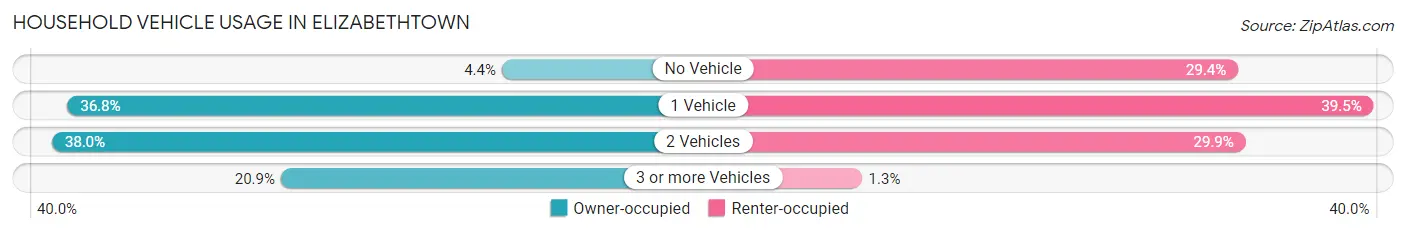
| Vehicles per Household | Owner-occupied | Renter-occupied |
| No Vehicle | 38 (4.4%) | 212 (29.4%) |
| 1 Vehicle | 321 (36.8%) | 285 (39.5%) |
| 2 Vehicles | 331 (38.0%) | 216 (29.9%) |
| 3 or more Vehicles | 182 (20.9%) | 9 (1.3%) |
| Total | 872 (100.0%) | 722 (100.0%) |
Real Estate & Mortgages in Elizabethtown
Real Estate and Mortgage Overview in Elizabethtown
| Characteristic | Without Mortgage | With Mortgage |
| Housing Units | 484 | 388 |
| Median Property Value | $151,300 | $158,000 |
| Median Household Income | $30,211 | $21 |
| Monthly Housing Costs | $466 | $0 |
| Real Estate Taxes | $961 | $0 |
Property Value by Mortgage Status in Elizabethtown
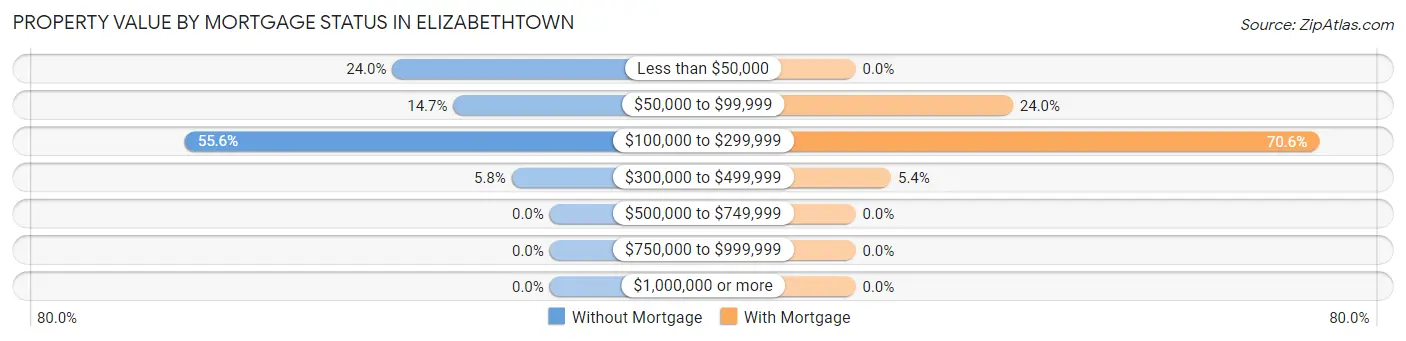
| Property Value | Without Mortgage | With Mortgage |
| Less than $50,000 | 116 (24.0%) | 0 (0.0%) |
| $50,000 to $99,999 | 71 (14.7%) | 93 (24.0%) |
| $100,000 to $299,999 | 269 (55.6%) | 274 (70.6%) |
| $300,000 to $499,999 | 28 (5.8%) | 21 (5.4%) |
| $500,000 to $749,999 | 0 (0.0%) | 0 (0.0%) |
| $750,000 to $999,999 | 0 (0.0%) | 0 (0.0%) |
| $1,000,000 or more | 0 (0.0%) | 0 (0.0%) |
| Total | 484 (100.0%) | 388 (100.0%) |
Household Income by Mortgage Status in Elizabethtown
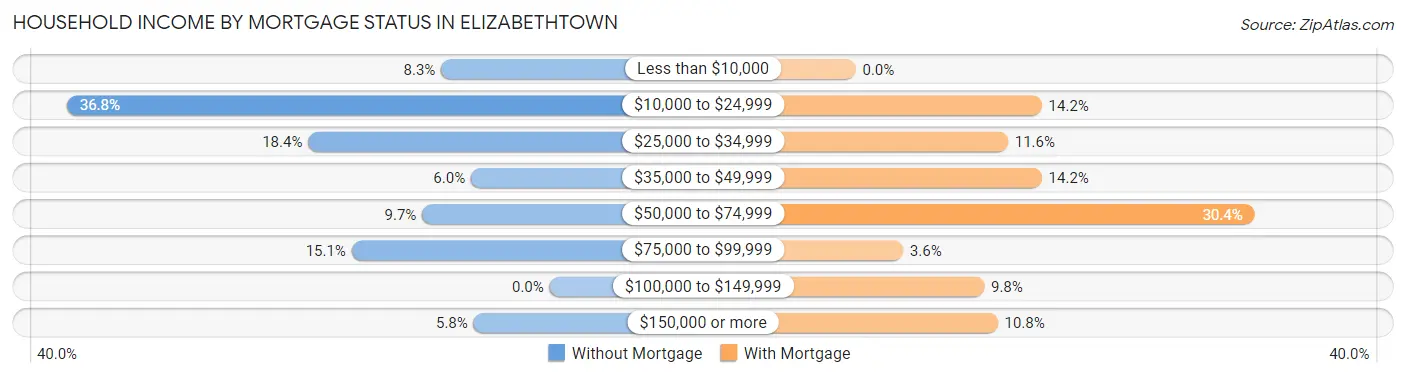
| Household Income | Without Mortgage | With Mortgage |
| Less than $10,000 | 40 (8.3%) | 0 (0.0%) |
| $10,000 to $24,999 | 178 (36.8%) | 55 (14.2%) |
| $25,000 to $34,999 | 89 (18.4%) | 45 (11.6%) |
| $35,000 to $49,999 | 29 (6.0%) | 55 (14.2%) |
| $50,000 to $74,999 | 47 (9.7%) | 118 (30.4%) |
| $75,000 to $99,999 | 73 (15.1%) | 14 (3.6%) |
| $100,000 to $149,999 | 0 (0.0%) | 38 (9.8%) |
| $150,000 or more | 28 (5.8%) | 42 (10.8%) |
| Total | 484 (100.0%) | 388 (100.0%) |
Property Value to Household Income Ratio in Elizabethtown
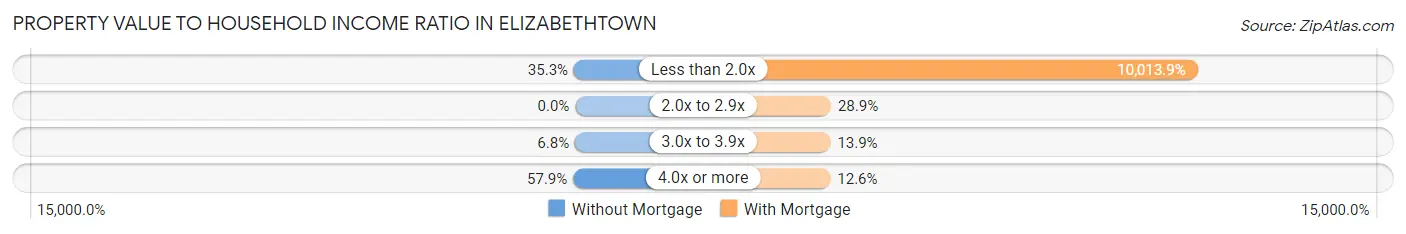
| Value-to-Income Ratio | Without Mortgage | With Mortgage |
| Less than 2.0x | 171 (35.3%) | 38,854 (10,013.9%) |
| 2.0x to 2.9x | 0 (0.0%) | 112 (28.9%) |
| 3.0x to 3.9x | 33 (6.8%) | 54 (13.9%) |
| 4.0x or more | 280 (57.9%) | 49 (12.6%) |
| Total | 484 (100.0%) | 388 (100.0%) |
Real Estate Taxes by Mortgage Status in Elizabethtown
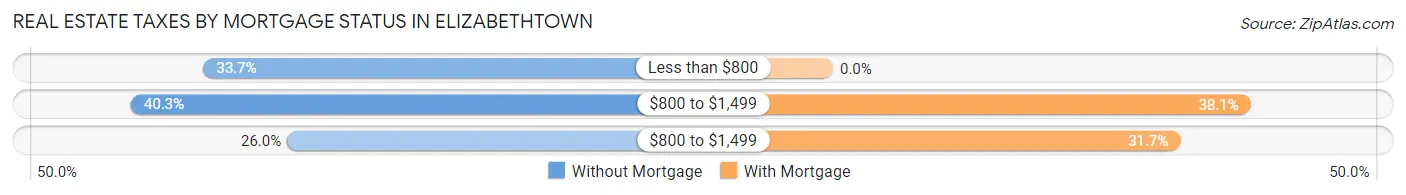
| Property Taxes | Without Mortgage | With Mortgage |
| Less than $800 | 163 (33.7%) | 0 (0.0%) |
| $800 to $1,499 | 195 (40.3%) | 148 (38.1%) |
| $800 to $1,499 | 126 (26.0%) | 123 (31.7%) |
| Total | 484 (100.0%) | 388 (100.0%) |
Health & Disability in Elizabethtown
Health Insurance Coverage by Age in Elizabethtown
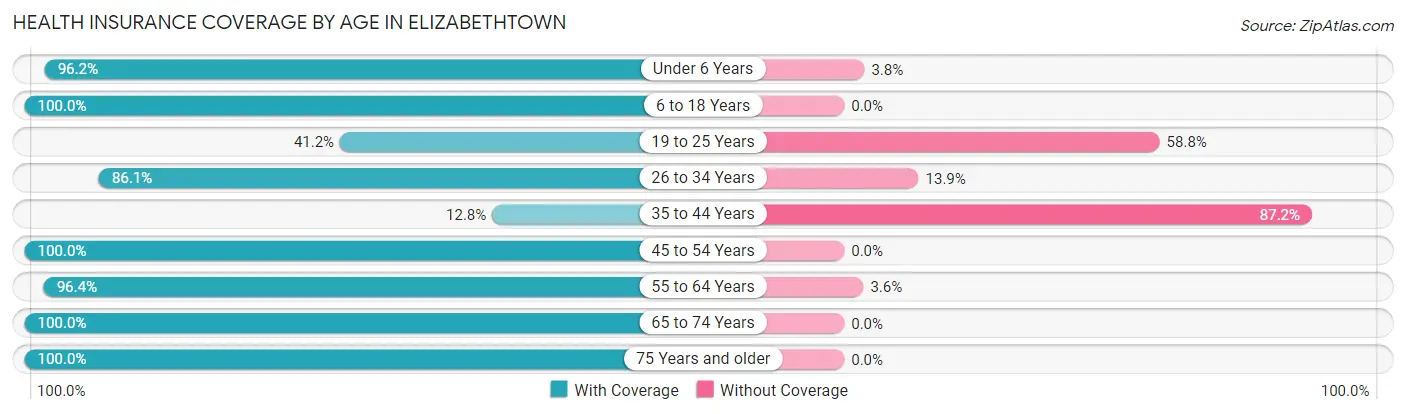
| Age Bracket | With Coverage | Without Coverage |
| Under 6 Years | 205 (96.2%) | 8 (3.8%) |
| 6 to 18 Years | 384 (100.0%) | 0 (0.0%) |
| 19 to 25 Years | 131 (41.2%) | 187 (58.8%) |
| 26 to 34 Years | 460 (86.1%) | 74 (13.9%) |
| 35 to 44 Years | 5 (12.8%) | 34 (87.2%) |
| 45 to 54 Years | 405 (100.0%) | 0 (0.0%) |
| 55 to 64 Years | 377 (96.4%) | 14 (3.6%) |
| 65 to 74 Years | 596 (100.0%) | 0 (0.0%) |
| 75 Years and older | 184 (100.0%) | 0 (0.0%) |
| Total | 2,747 (89.6%) | 317 (10.3%) |
Health Insurance Coverage by Citizenship Status in Elizabethtown
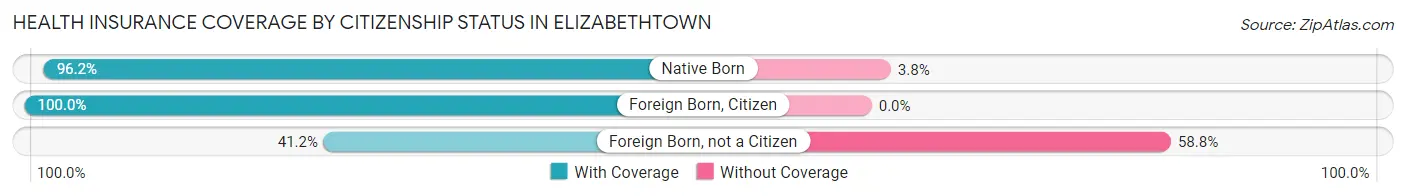
| Citizenship Status | With Coverage | Without Coverage |
| Native Born | 205 (96.2%) | 8 (3.8%) |
| Foreign Born, Citizen | 384 (100.0%) | 0 (0.0%) |
| Foreign Born, not a Citizen | 131 (41.2%) | 187 (58.8%) |
Health Insurance Coverage by Household Income in Elizabethtown
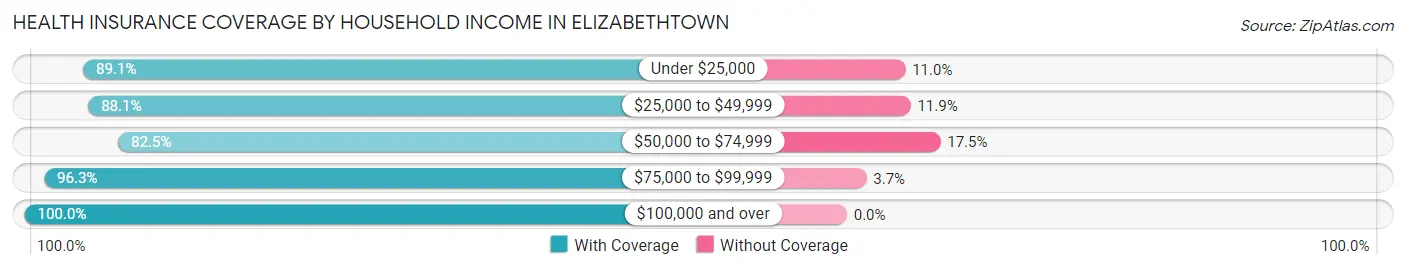
| Household Income | With Coverage | Without Coverage |
| Under $25,000 | 1,318 (89.0%) | 162 (11.0%) |
| $25,000 to $49,999 | 731 (88.1%) | 99 (11.9%) |
| $50,000 to $74,999 | 226 (82.5%) | 48 (17.5%) |
| $75,000 to $99,999 | 210 (96.3%) | 8 (3.7%) |
| $100,000 and over | 262 (100.0%) | 0 (0.0%) |
Public vs Private Health Insurance Coverage by Age in Elizabethtown
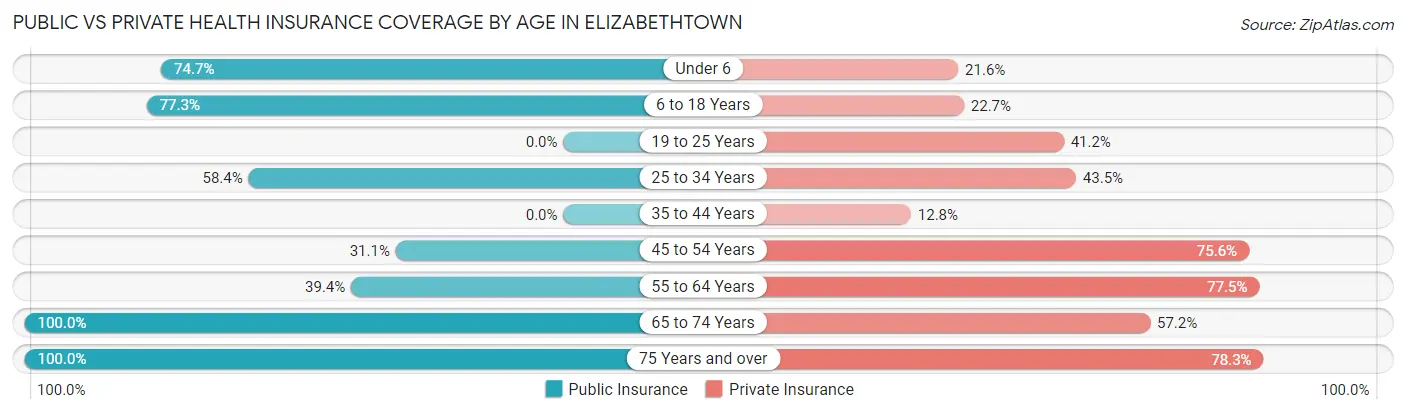
| Age Bracket | Public Insurance | Private Insurance |
| Under 6 | 159 (74.7%) | 46 (21.6%) |
| 6 to 18 Years | 297 (77.3%) | 87 (22.7%) |
| 19 to 25 Years | 0 (0.0%) | 131 (41.2%) |
| 25 to 34 Years | 312 (58.4%) | 232 (43.4%) |
| 35 to 44 Years | 0 (0.0%) | 5 (12.8%) |
| 45 to 54 Years | 126 (31.1%) | 306 (75.6%) |
| 55 to 64 Years | 154 (39.4%) | 303 (77.5%) |
| 65 to 74 Years | 596 (100.0%) | 341 (57.2%) |
| 75 Years and over | 184 (100.0%) | 144 (78.3%) |
| Total | 1,828 (59.7%) | 1,595 (52.1%) |
Disability Status by Sex by Age in Elizabethtown
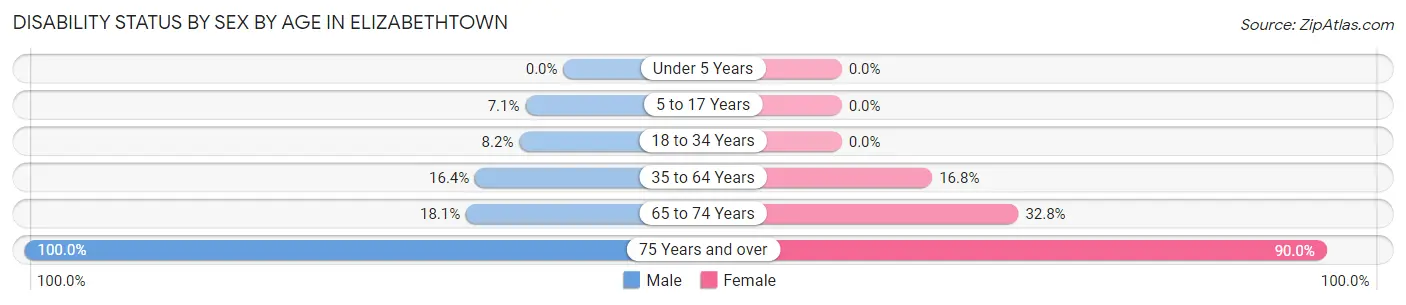
| Age Bracket | Male | Female |
| Under 5 Years | 0 (0.0%) | 0 (0.0%) |
| 5 to 17 Years | 12 (7.1%) | 0 (0.0%) |
| 18 to 34 Years | 42 (8.2%) | 0 (0.0%) |
| 35 to 64 Years | 47 (16.4%) | 92 (16.8%) |
| 65 to 74 Years | 52 (18.1%) | 101 (32.8%) |
| 75 Years and over | 24 (100.0%) | 144 (90.0%) |
Disability Class by Sex by Age in Elizabethtown
Disability Class: Hearing Difficulty
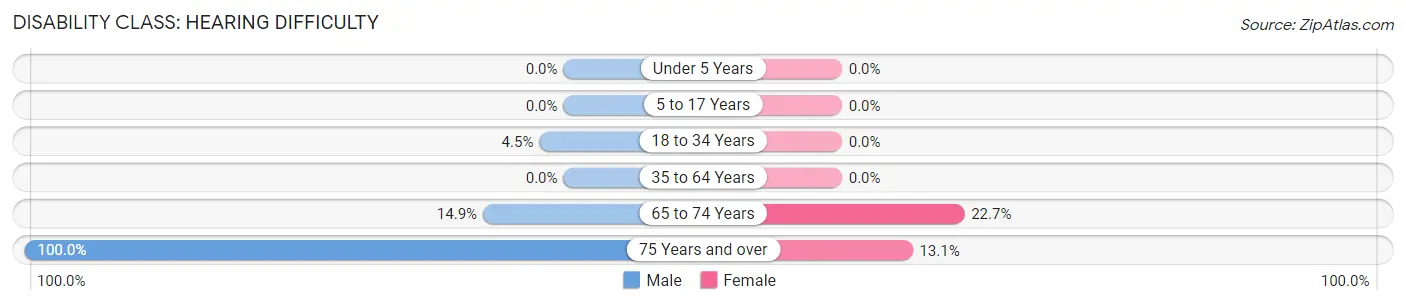
| Age Bracket | Male | Female |
| Under 5 Years | 0 (0.0%) | 0 (0.0%) |
| 5 to 17 Years | 0 (0.0%) | 0 (0.0%) |
| 18 to 34 Years | 23 (4.5%) | 0 (0.0%) |
| 35 to 64 Years | 0 (0.0%) | 0 (0.0%) |
| 65 to 74 Years | 43 (14.9%) | 70 (22.7%) |
| 75 Years and over | 24 (100.0%) | 21 (13.1%) |
Disability Class: Vision Difficulty
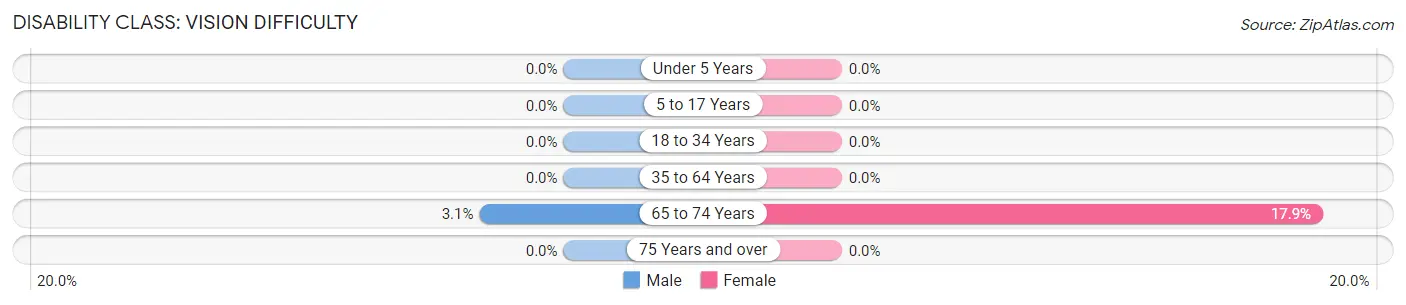
| Age Bracket | Male | Female |
| Under 5 Years | 0 (0.0%) | 0 (0.0%) |
| 5 to 17 Years | 0 (0.0%) | 0 (0.0%) |
| 18 to 34 Years | 0 (0.0%) | 0 (0.0%) |
| 35 to 64 Years | 0 (0.0%) | 0 (0.0%) |
| 65 to 74 Years | 9 (3.1%) | 55 (17.9%) |
| 75 Years and over | 0 (0.0%) | 0 (0.0%) |
Disability Class: Cognitive Difficulty
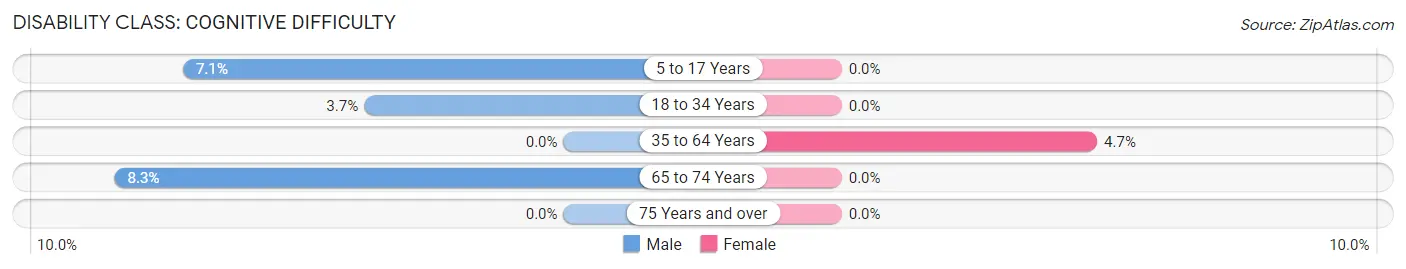
| Age Bracket | Male | Female |
| 5 to 17 Years | 12 (7.1%) | 0 (0.0%) |
| 18 to 34 Years | 19 (3.7%) | 0 (0.0%) |
| 35 to 64 Years | 0 (0.0%) | 26 (4.7%) |
| 65 to 74 Years | 24 (8.3%) | 0 (0.0%) |
| 75 Years and over | 0 (0.0%) | 0 (0.0%) |
Disability Class: Ambulatory Difficulty
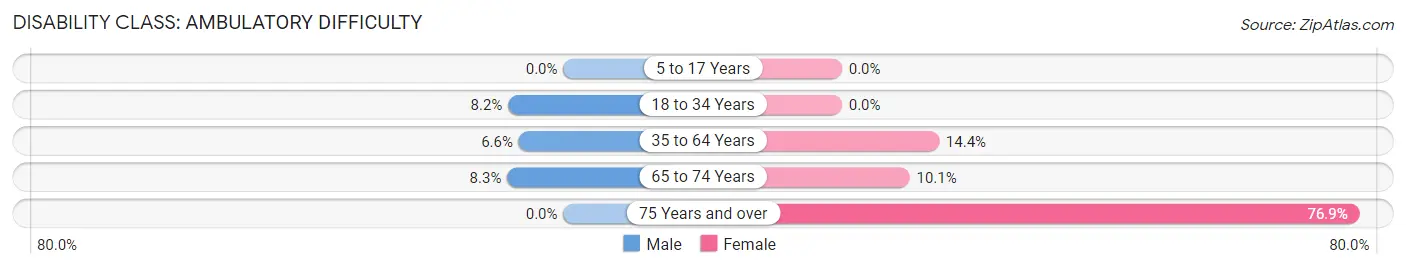
| Age Bracket | Male | Female |
| 5 to 17 Years | 0 (0.0%) | 0 (0.0%) |
| 18 to 34 Years | 42 (8.2%) | 0 (0.0%) |
| 35 to 64 Years | 19 (6.6%) | 79 (14.4%) |
| 65 to 74 Years | 24 (8.3%) | 31 (10.1%) |
| 75 Years and over | 0 (0.0%) | 123 (76.9%) |
Disability Class: Self-Care Difficulty
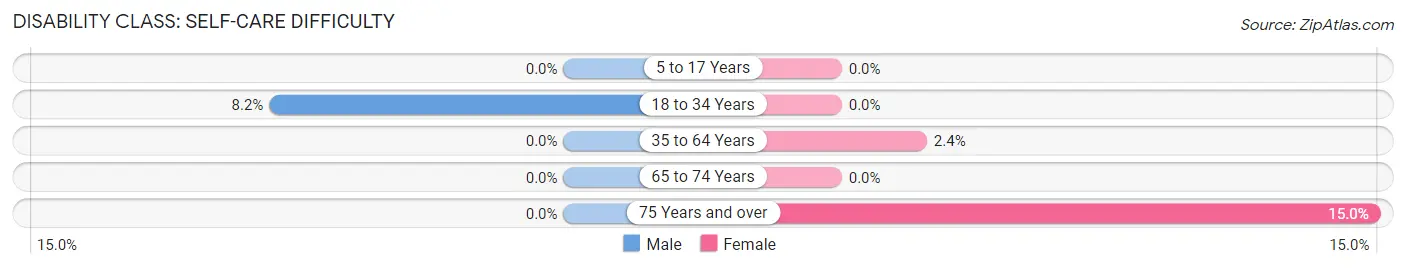
| Age Bracket | Male | Female |
| 5 to 17 Years | 0 (0.0%) | 0 (0.0%) |
| 18 to 34 Years | 42 (8.2%) | 0 (0.0%) |
| 35 to 64 Years | 0 (0.0%) | 13 (2.4%) |
| 65 to 74 Years | 0 (0.0%) | 0 (0.0%) |
| 75 Years and over | 0 (0.0%) | 24 (15.0%) |
Technology Access in Elizabethtown
Computing Device Access in Elizabethtown
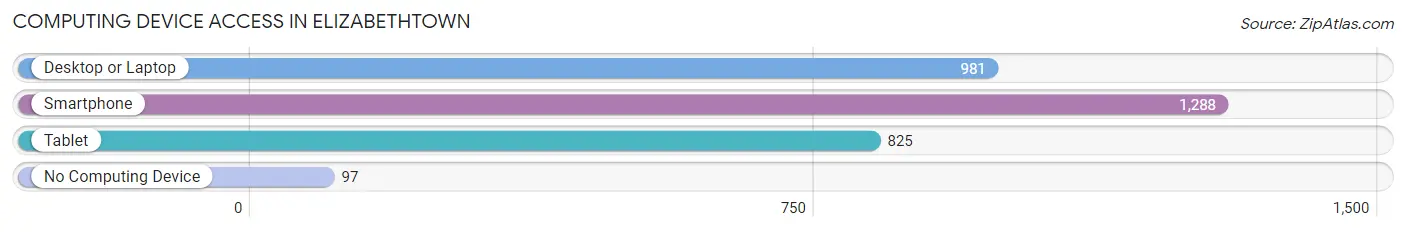
| Device Type | # Households | % Households |
| Desktop or Laptop | 981 | 61.5% |
| Smartphone | 1,288 | 80.8% |
| Tablet | 825 | 51.8% |
| No Computing Device | 97 | 6.1% |
| Total | 1,594 | 100.0% |
Internet Access in Elizabethtown
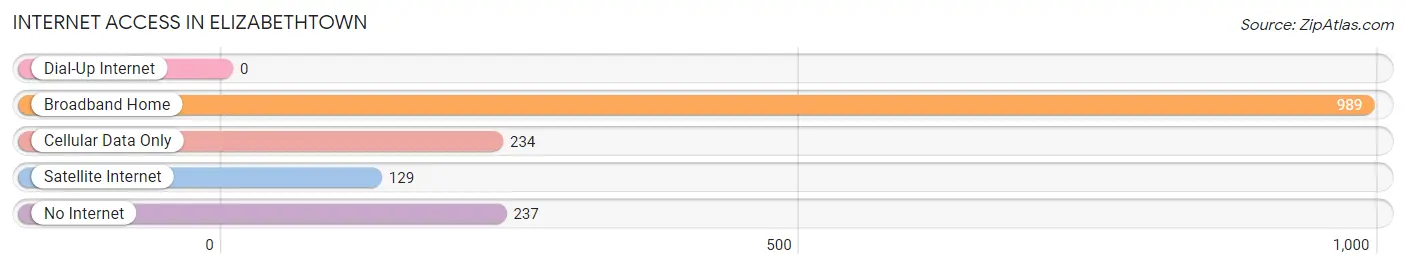
| Internet Type | # Households | % Households |
| Dial-Up Internet | 0 | 0.0% |
| Broadband Home | 989 | 62.1% |
| Cellular Data Only | 234 | 14.7% |
| Satellite Internet | 129 | 8.1% |
| No Internet | 237 | 14.9% |
| Total | 1,594 | 100.0% |
Elizabethtown Summary
Elizabethtown is a small town located in Bladen County, North Carolina. It is situated on the banks of the Cape Fear River, approximately 40 miles south of Wilmington. The town was founded in 1773 and is the oldest town in Bladen County. It is also the county seat. The population of Elizabethtown was 2,717 at the 2010 census.
Geography
Elizabethtown is located at 34°35'25" North, 78°37'45" West (34.590278, -78.629167). According to the United States Census Bureau, the town has a total area of 2.2 square miles (5.7 km2), all of it land.
The town is located in the southeastern corner of Bladen County, near the border with Columbus County. It is situated on the banks of the Cape Fear River, approximately 40 miles south of Wilmington. The town is surrounded by a number of small towns and villages, including White Oak, Bladenboro, and Dublin.
History
Elizabethtown was founded in 1773 by a group of settlers from Scotland and Ireland. The town was named after Elizabeth, the wife of one of the settlers. The town was originally located on the east side of the Cape Fear River, but was moved to its current location in 1790.
The town was an important trading center during the early 19th century, and was the site of a major battle during the American Civil War. The town was occupied by Union forces in 1865, and was the site of a major Confederate surrender.
Economy
Elizabethtown is a small town with a limited economy. The town is home to a number of small businesses, including restaurants, retail stores, and service providers. The town is also home to a number of manufacturing companies, including a furniture factory and a textile mill.
The town is also home to a number of agricultural operations, including poultry farms, hog farms, and vegetable farms. The town is also home to a number of timber operations.
Demographics
As of the 2010 census, there were 2,717 people, 1,093 households, and 717 families residing in the town. The population density was 1,220.7 people per square mile (471.2/km2). There were 1,223 housing units at an average density of 545.2 per square mile (210.9/km2). The racial makeup of the town was 68.2% White, 28.2% African American, 0.3% Native American, 0.7% Asian, 0.1% Pacific Islander, 0.7% from other races, and 1.8% from two or more races. Hispanic or Latino of any race were 2.2% of the population.
There were 1,093 households, out of which 28.2% had children under the age of 18 living with them, 43.2% were married couples living together, 17.2% had a female householder with no husband present, and 34.2% were non-families. 29.2% of all households were made up of individuals, and 13.2% had someone living alone who was 65 years of age or older. The average household size was 2.45 and the average family size was 3.02.
In the town, the population was spread out, with 24.2% under the age of 18, 8.2% from 18 to 24, 25.2% from 25 to 44, 25.2% from 45 to 64, and 17.2% who were 65 years of age or older. The median age was 39 years. For every 100 females, there were 87.2 males. For every 100 females age 18 and over, there were 82.2 males.
The median income for a household in the town was $27,917, and the median income for a family was $35,000. Males had a median income of $27,917 versus $20,000 for females. The per capita income for the town was $14,917. About 17.2% of families and 20.2% of the population were below the poverty line, including 28.2% of those under age 18 and 16.2% of those age 65 or over.
Common Questions
What is the Total Population of Elizabethtown?
Total Population of Elizabethtown is 3,304.
What is the Total Male Population of Elizabethtown?
Total Male Population of Elizabethtown is 1,590.
What is the Total Female Population of Elizabethtown?
Total Female Population of Elizabethtown is 1,714.
What is the Ratio of Males per 100 Females in Elizabethtown?
There are 92.77 Males per 100 Females in Elizabethtown.
What is the Ratio of Females per 100 Males in Elizabethtown?
There are 107.80 Females per 100 Males in Elizabethtown.
What is the Median Population Age in Elizabethtown?
Median Population Age in Elizabethtown is 47.3 Years.
What is the Average Family Size in Elizabethtown
Average Family Size in Elizabethtown is 2.7 People.
What is the Average Household Size in Elizabethtown
Average Household Size in Elizabethtown is 1.9 People.
What is Per Capita Income in Elizabethtown?
Per Capita income in Elizabethtown is $19,372.
What is the Median Family Income in Elizabethtown?
Median Family Income in Elizabethtown is $35,407.
What is the Median Household income in Elizabethtown?
Median Household Income in Elizabethtown is $24,081.
What is Income or Wage Gap in Elizabethtown?
Income or Wage Gap in Elizabethtown is 49.2%.
Women in Elizabethtown earn 50.8 cents for every dollar earned by a man.
What is Inequality or Gini Index in Elizabethtown?
Inequality or Gini Index in Elizabethtown is 0.53.
How Large is the Labor Force in Elizabethtown?
There are 1,161 People in the Labor Forcein in Elizabethtown.
What is the Percentage of People in the Labor Force in Elizabethtown?
41.3% of People are in the Labor Force in Elizabethtown.