Eyota, MN
Eyota Map
Eyota Overview
2,090
TOTAL POPULATION
967
MALE POPULATION
1,123
FEMALE POPULATION
86.11
MALES / 100 FEMALES
116.13
FEMALES / 100 MALES
35.5
MEDIAN AGE
3.1
AVG FAMILY SIZE
2.5
AVG HOUSEHOLD SIZE
$37,774
PER CAPITA INCOME
$97,321
AVG FAMILY INCOME
$81,103
AVG HOUSEHOLD INCOME
29.0%
WAGE / INCOME GAP [ % ]
71.0¢/ $1
WAGE / INCOME GAP [ $ ]
0.40
INEQUALITY / GINI INDEX
1,085
LABOR FORCE [ PEOPLE ]
70.7%
PERCENT IN LABOR FORCE
1.8%
UNEMPLOYMENT RATE
Eyota Zip Codes
Eyota Area Codes
Race in Eyota
The most populous races in Eyota are White / Caucasian (2,005 | 95.9%), Hispanic or Latino (100 | 4.8%), and Black / African American (33 | 1.6%).
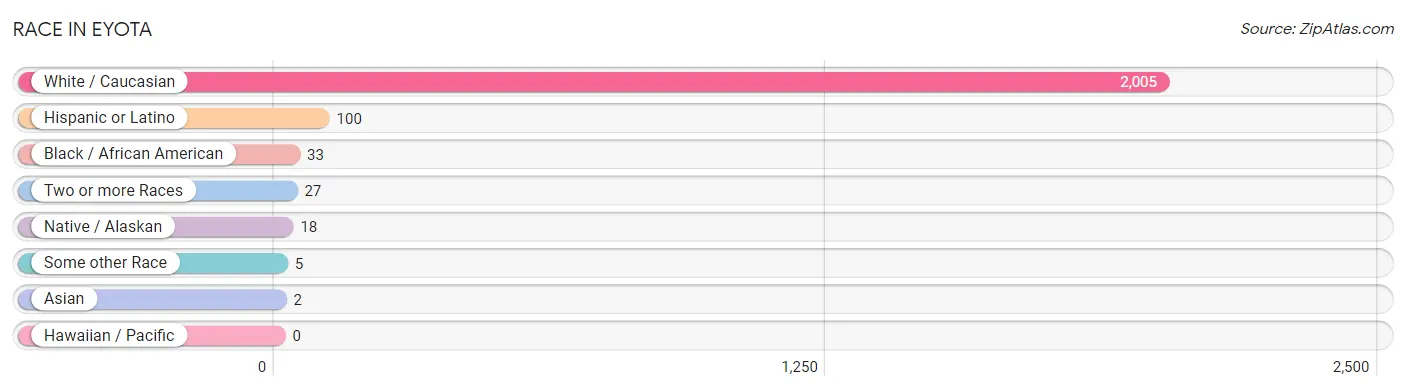
| Race | # Population | % Population |
| Asian | 2 | 0.1% |
| Black / African American | 33 | 1.6% |
| Hawaiian / Pacific | 0 | 0.0% |
| Hispanic or Latino | 100 | 4.8% |
| Native / Alaskan | 18 | 0.9% |
| White / Caucasian | 2,005 | 95.9% |
| Two or more Races | 27 | 1.3% |
| Some other Race | 5 | 0.2% |
| Total | 2,090 | 100.0% |
Ancestry in Eyota
The most populous ancestries reported in Eyota are German (637 | 30.5%), Irish (282 | 13.5%), Norwegian (227 | 10.9%), English (135 | 6.5%), and Mexican (100 | 4.8%), together accounting for 66.1% of all Eyota residents.
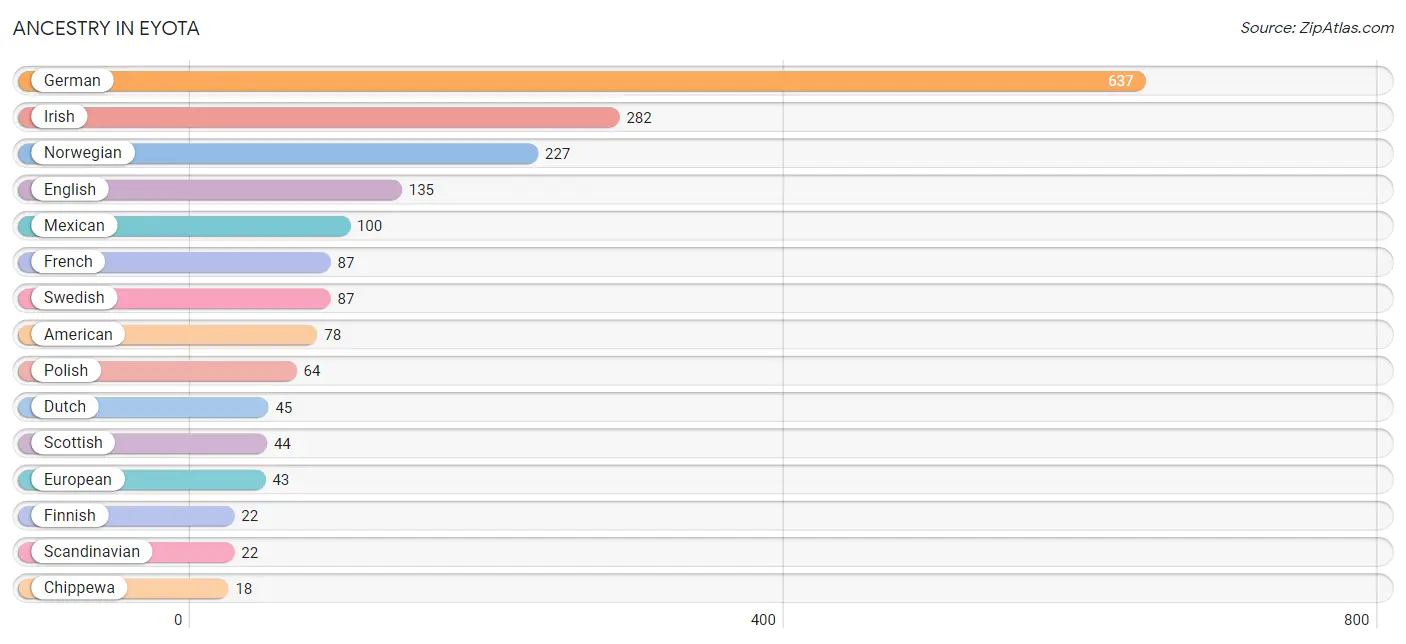
| Ancestry | # Population | % Population |
| American | 78 | 3.7% |
| British | 5 | 0.2% |
| Chippewa | 18 | 0.9% |
| Czech | 16 | 0.8% |
| Danish | 9 | 0.4% |
| Dutch | 45 | 2.1% |
| Eastern European | 4 | 0.2% |
| English | 135 | 6.5% |
| European | 43 | 2.1% |
| Finnish | 22 | 1.1% |
| French | 87 | 4.2% |
| French Canadian | 2 | 0.1% |
| German | 637 | 30.5% |
| Hungarian | 2 | 0.1% |
| Irish | 282 | 13.5% |
| Italian | 15 | 0.7% |
| Japanese | 1 | 0.1% |
| Korean | 3 | 0.1% |
| Luxembourger | 15 | 0.7% |
| Mexican | 100 | 4.8% |
| Norwegian | 227 | 10.9% |
| Polish | 64 | 3.1% |
| Scandinavian | 22 | 1.1% |
| Scotch-Irish | 6 | 0.3% |
| Scottish | 44 | 2.1% |
| Swedish | 87 | 4.2% |
| Swiss | 3 | 0.1% |
| Thai | 6 | 0.3% |
| Ukrainian | 5 | 0.2% |
| Welsh | 2 | 0.1% | View All 30 Rows |
Immigrants in Eyota
The most numerous immigrant groups reported in Eyota came from Central America (5 | 0.2%), Latin America (5 | 0.2%), Mexico (5 | 0.2%), Africa (4 | 0.2%), and Asia (4 | 0.2%), together accounting for 1.1% of all Eyota residents.
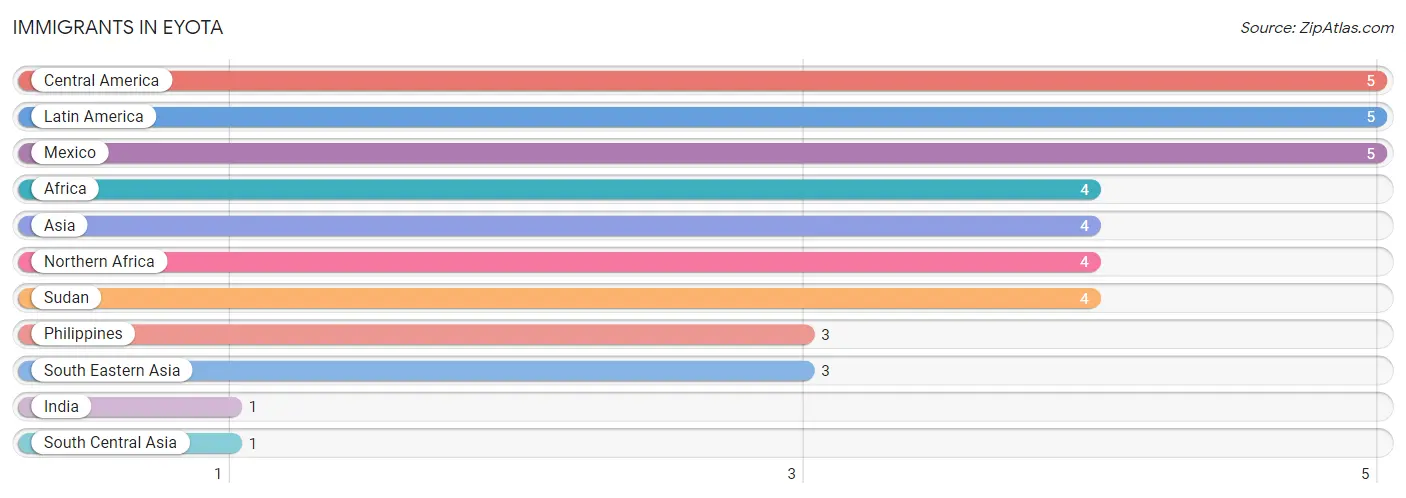
| Immigration Origin | # Population | % Population |
| Africa | 4 | 0.2% |
| Asia | 4 | 0.2% |
| Central America | 5 | 0.2% |
| India | 1 | 0.1% |
| Latin America | 5 | 0.2% |
| Mexico | 5 | 0.2% |
| Northern Africa | 4 | 0.2% |
| Philippines | 3 | 0.1% |
| South Central Asia | 1 | 0.1% |
| South Eastern Asia | 3 | 0.1% |
| Sudan | 4 | 0.2% | View All 11 Rows |
Sex and Age in Eyota
Sex and Age in Eyota
The most populous age groups in Eyota are 10 to 14 Years (92 | 9.5%) for men and Under 5 Years (119 | 10.6%) for women.
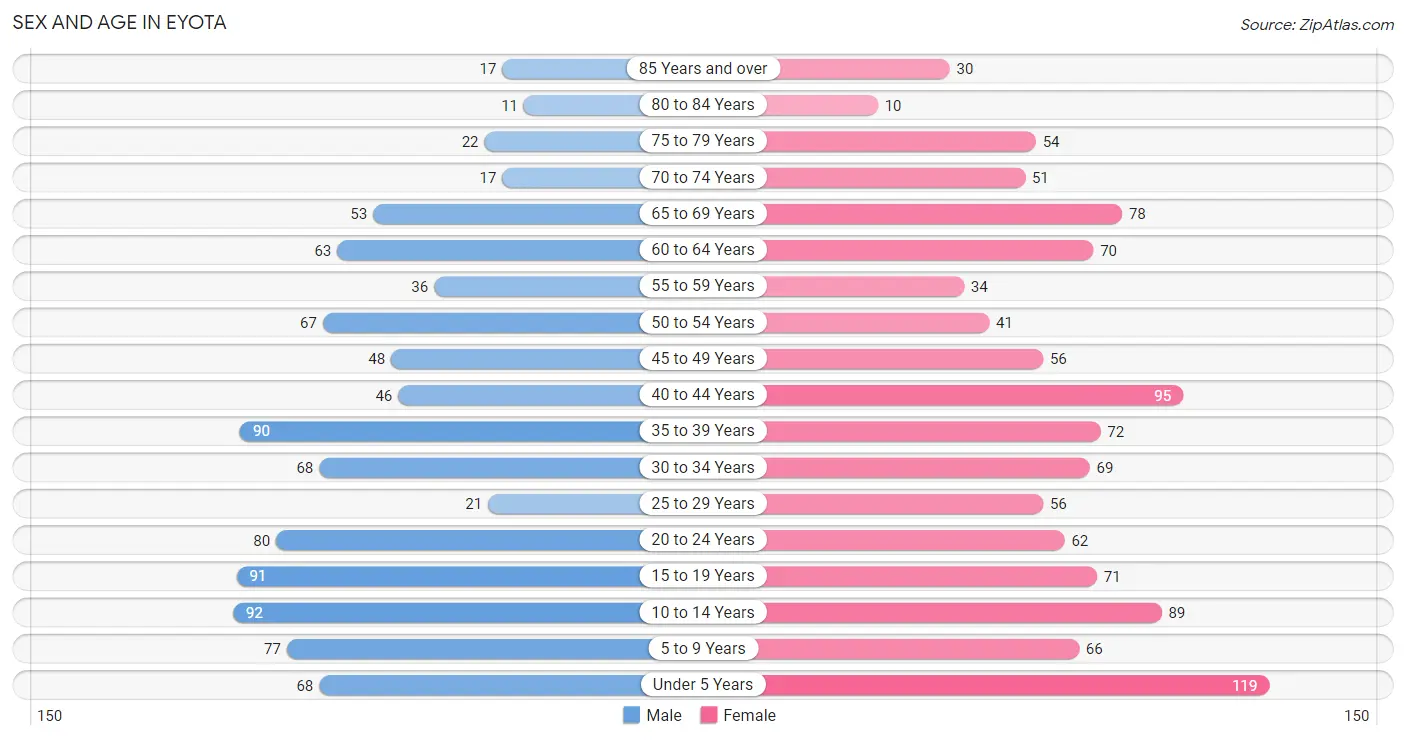
| Age Bracket | Male | Female |
| Under 5 Years | 68 (7.0%) | 119 (10.6%) |
| 5 to 9 Years | 77 (8.0%) | 66 (5.9%) |
| 10 to 14 Years | 92 (9.5%) | 89 (7.9%) |
| 15 to 19 Years | 91 (9.4%) | 71 (6.3%) |
| 20 to 24 Years | 80 (8.3%) | 62 (5.5%) |
| 25 to 29 Years | 21 (2.2%) | 56 (5.0%) |
| 30 to 34 Years | 68 (7.0%) | 69 (6.1%) |
| 35 to 39 Years | 90 (9.3%) | 72 (6.4%) |
| 40 to 44 Years | 46 (4.8%) | 95 (8.5%) |
| 45 to 49 Years | 48 (5.0%) | 56 (5.0%) |
| 50 to 54 Years | 67 (6.9%) | 41 (3.6%) |
| 55 to 59 Years | 36 (3.7%) | 34 (3.0%) |
| 60 to 64 Years | 63 (6.5%) | 70 (6.2%) |
| 65 to 69 Years | 53 (5.5%) | 78 (7.0%) |
| 70 to 74 Years | 17 (1.8%) | 51 (4.5%) |
| 75 to 79 Years | 22 (2.3%) | 54 (4.8%) |
| 80 to 84 Years | 11 (1.1%) | 10 (0.9%) |
| 85 Years and over | 17 (1.8%) | 30 (2.7%) |
| Total | 967 (100.0%) | 1,123 (100.0%) |
Families and Households in Eyota
Median Family Size in Eyota
The median family size in Eyota is 3.11 persons per family, with single female/mother families (61 | 11.1%) accounting for the largest median family size of 3.54 persons per family. On the other hand, single male/father families (40 | 7.2%) represent the smallest median family size with 2.28 persons per family.
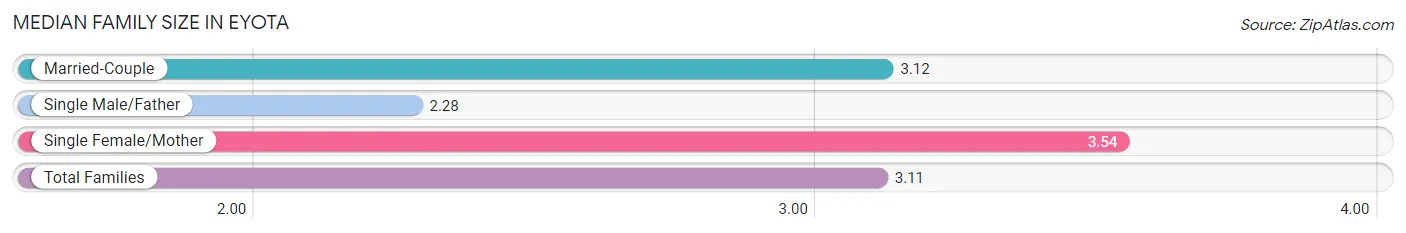
| Family Type | # Families | Family Size |
| Married-Couple | 451 (81.7%) | 3.12 |
| Single Male/Father | 40 (7.2%) | 2.28 |
| Single Female/Mother | 61 (11.1%) | 3.54 |
| Total Families | 552 (100.0%) | 3.11 |
Median Household Size in Eyota
The median household size in Eyota is 2.50 persons per household, with single female/mother households (61 | 7.4%) accounting for the largest median household size of 3.77 persons per household. non-family households (273 | 33.1%) represent the smallest median household size with 1.20 persons per household.
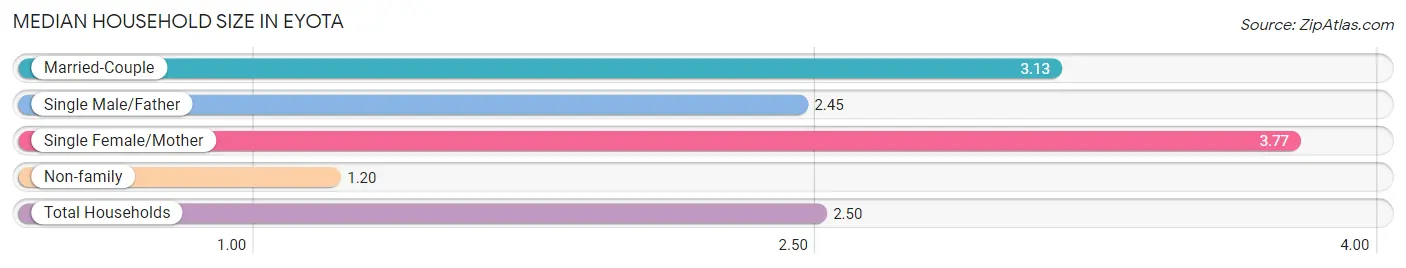
| Household Type | # Households | Household Size |
| Married-Couple | 451 (54.7%) | 3.13 |
| Single Male/Father | 40 (4.9%) | 2.45 |
| Single Female/Mother | 61 (7.4%) | 3.77 |
| Non-family | 273 (33.1%) | 1.20 |
| Total Households | 825 (100.0%) | 2.50 |
Household Size by Marriage Status in Eyota
Out of a total of 825 households in Eyota, 552 (66.9%) are family households, while 273 (33.1%) are nonfamily households. The most numerous type of family households are 2-person households, comprising 267, and the most common type of nonfamily households are 1-person households, comprising 223.

| Household Size | Family Households | Nonfamily Households |
| 1-Person Households | - | 223 (27.0%) |
| 2-Person Households | 267 (32.4%) | 40 (4.9%) |
| 3-Person Households | 67 (8.1%) | 10 (1.2%) |
| 4-Person Households | 157 (19.0%) | 0 (0.0%) |
| 5-Person Households | 40 (4.9%) | 0 (0.0%) |
| 6-Person Households | 15 (1.8%) | 0 (0.0%) |
| 7+ Person Households | 6 (0.7%) | 0 (0.0%) |
| Total | 552 (66.9%) | 273 (33.1%) |
Female Fertility in Eyota
Fertility by Age in Eyota
Average fertility rate in Eyota is 32.0 births per 1,000 women. Women in the age bracket of 20 to 34 years have the highest fertility rate with 86.0 births per 1,000 women. Women in the age bracket of 20 to 34 years acount for 100.0% of all women with births.
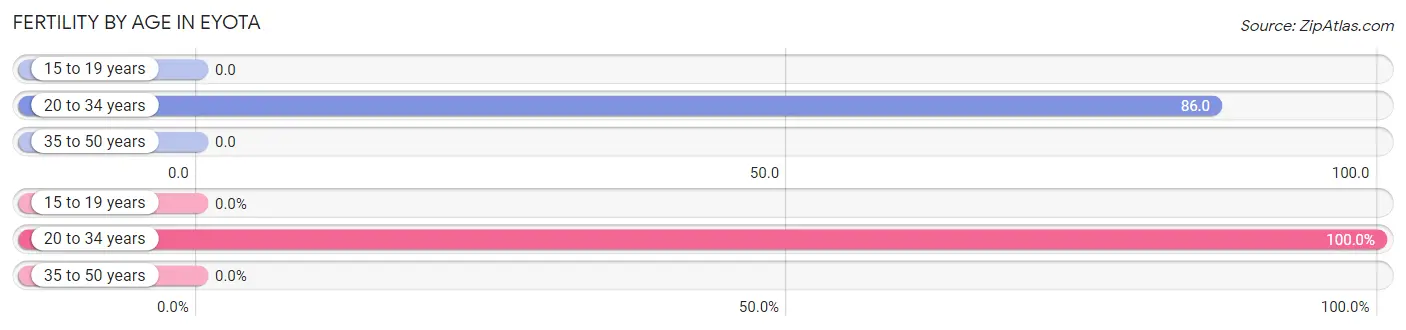
| Age Bracket | Women with Births | Births / 1,000 Women |
| 15 to 19 years | 0 (0.0%) | 0.0 |
| 20 to 34 years | 16 (100.0%) | 86.0 |
| 35 to 50 years | 0 (0.0%) | 0.0 |
| Total | 16 (100.0%) | 32.0 |
Fertility by Age by Marriage Status in Eyota
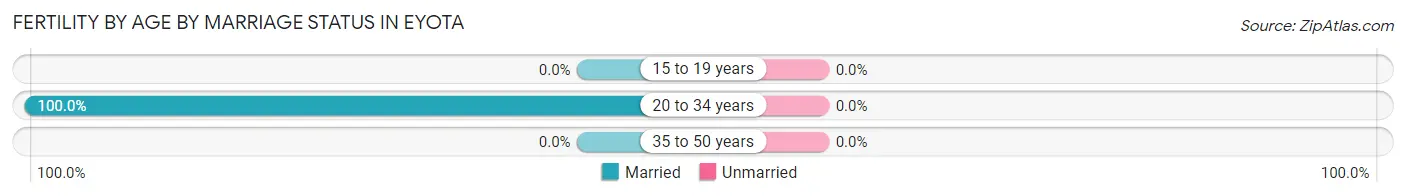
| Age Bracket | Married | Unmarried |
| 15 to 19 years | 0 (0.0%) | 0 (0.0%) |
| 20 to 34 years | 16 (100.0%) | 0 (0.0%) |
| 35 to 50 years | 0 (0.0%) | 0 (0.0%) |
| Total | 16 (100.0%) | 0 (0.0%) |
Fertility by Education in Eyota
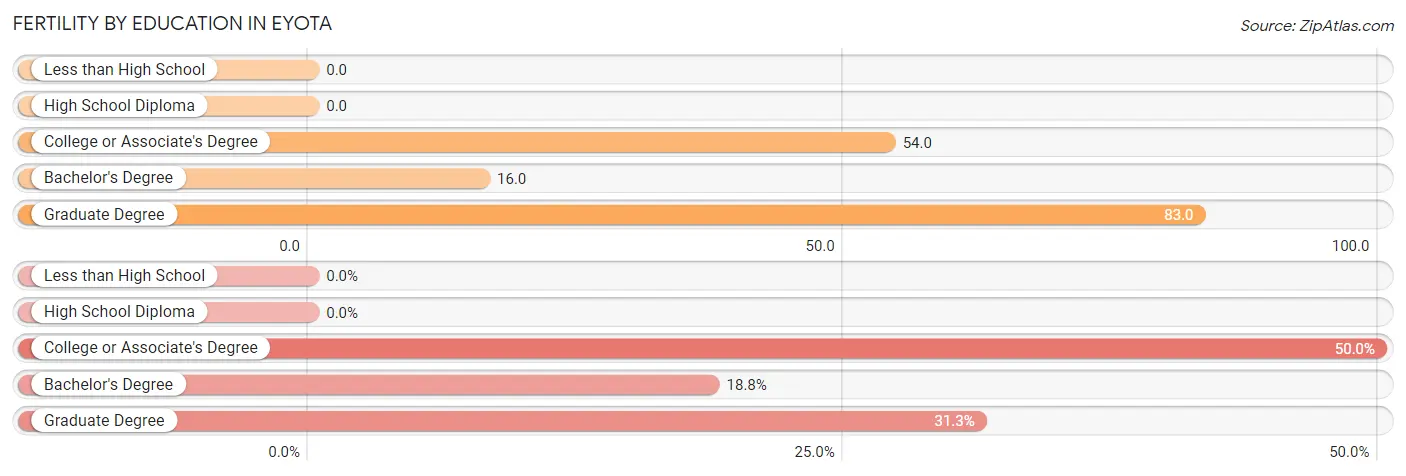
| Educational Attainment | Women with Births | Births / 1,000 Women |
| Less than High School | 0 (0.0%) | 0.0 |
| High School Diploma | 0 (0.0%) | 0.0 |
| College or Associate's Degree | 8 (50.0%) | 54.0 |
| Bachelor's Degree | 3 (18.8%) | 16.0 |
| Graduate Degree | 5 (31.2%) | 83.0 |
| Total | 16 (100.0%) | 32.0 |
Fertility by Education by Marriage Status in Eyota
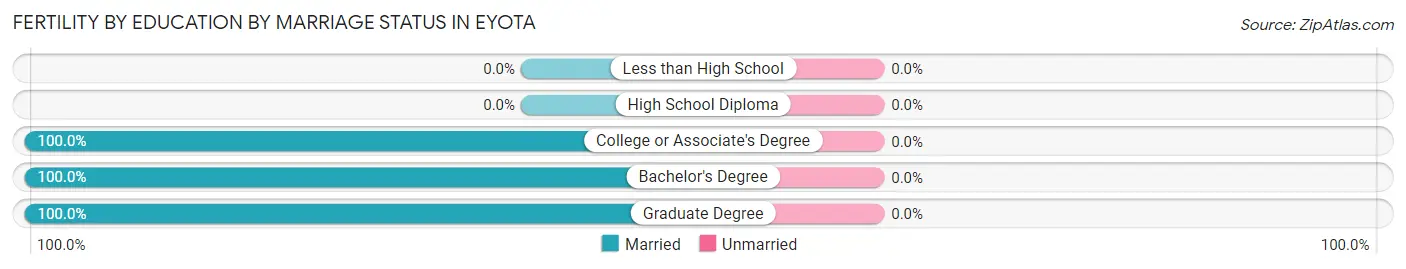
| Educational Attainment | Married | Unmarried |
| Less than High School | 0 (0.0%) | 0 (0.0%) |
| High School Diploma | 0 (0.0%) | 0 (0.0%) |
| College or Associate's Degree | 8 (100.0%) | 0 (0.0%) |
| Bachelor's Degree | 3 (100.0%) | 0 (0.0%) |
| Graduate Degree | 5 (100.0%) | 0 (0.0%) |
| Total | 16 (100.0%) | 0 (0.0%) |
Income in Eyota
Income Overview in Eyota
Per Capita Income in Eyota is $37,774, while median incomes of families and households are $97,321 and $81,103 respectively.
| Characteristic | Number | Measure |
| Per Capita Income | 2,090 | $37,774 |
| Median Family Income | 552 | $97,321 |
| Mean Family Income | 552 | $123,179 |
| Median Household Income | 825 | $81,103 |
| Mean Household Income | 825 | $97,783 |
| Income Deficit | 552 | $0 |
| Wage / Income Gap (%) | 2,090 | 29.03% |
| Wage / Income Gap ($) | 2,090 | 70.97¢ per $1 |
| Gini / Inequality Index | 2,090 | 0.40 |
Earnings by Sex in Eyota
Average Earnings in Eyota are $50,264, $55,455 for men and $39,356 for women, a difference of 29.0%.
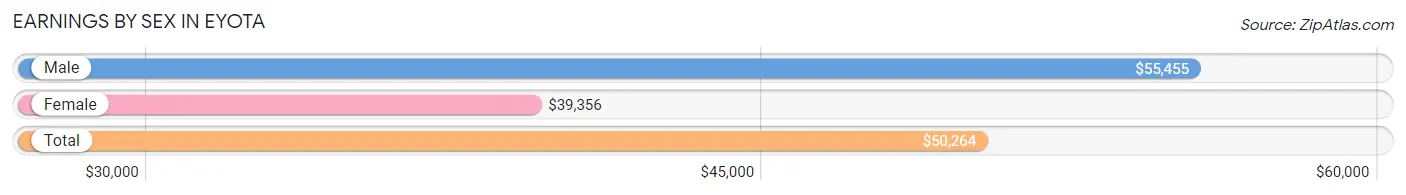
| Sex | Number | Average Earnings |
| Male | 546 (47.3%) | $55,455 |
| Female | 609 (52.7%) | $39,356 |
| Total | 1,155 (100.0%) | $50,264 |
Earnings by Sex by Income Bracket in Eyota
The most common earnings brackets in Eyota are $75,000 to $99,999 for men (117 | 21.4%) and $75,000 to $99,999 for women (78 | 12.8%).
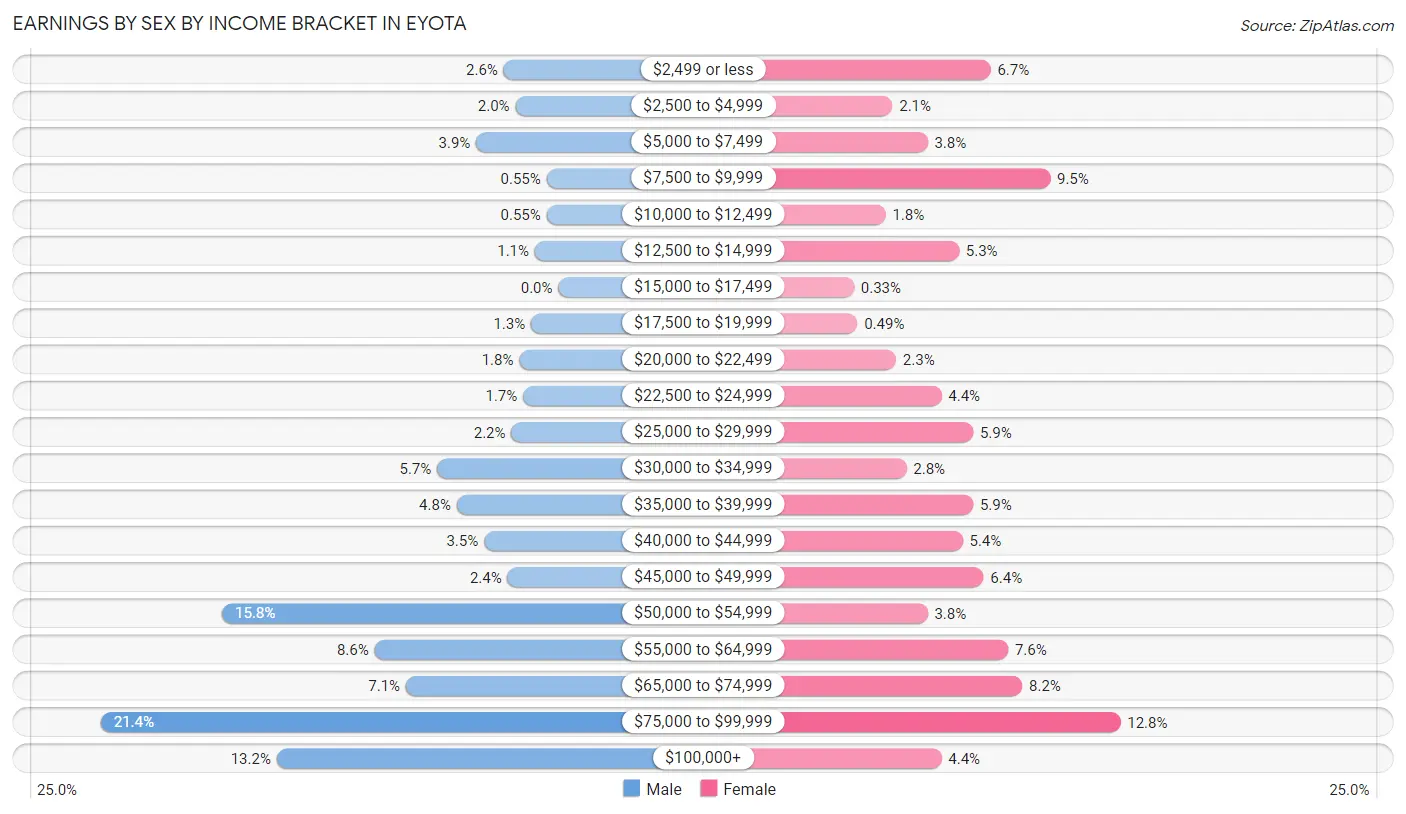
| Income | Male | Female |
| $2,499 or less | 14 (2.6%) | 41 (6.7%) |
| $2,500 to $4,999 | 11 (2.0%) | 13 (2.1%) |
| $5,000 to $7,499 | 21 (3.8%) | 23 (3.8%) |
| $7,500 to $9,999 | 3 (0.5%) | 58 (9.5%) |
| $10,000 to $12,499 | 3 (0.5%) | 11 (1.8%) |
| $12,500 to $14,999 | 6 (1.1%) | 32 (5.2%) |
| $15,000 to $17,499 | 0 (0.0%) | 2 (0.3%) |
| $17,500 to $19,999 | 7 (1.3%) | 3 (0.5%) |
| $20,000 to $22,499 | 10 (1.8%) | 14 (2.3%) |
| $22,500 to $24,999 | 9 (1.7%) | 27 (4.4%) |
| $25,000 to $29,999 | 12 (2.2%) | 36 (5.9%) |
| $30,000 to $34,999 | 31 (5.7%) | 17 (2.8%) |
| $35,000 to $39,999 | 26 (4.8%) | 36 (5.9%) |
| $40,000 to $44,999 | 19 (3.5%) | 33 (5.4%) |
| $45,000 to $49,999 | 13 (2.4%) | 39 (6.4%) |
| $50,000 to $54,999 | 86 (15.8%) | 23 (3.8%) |
| $55,000 to $64,999 | 47 (8.6%) | 46 (7.5%) |
| $65,000 to $74,999 | 39 (7.1%) | 50 (8.2%) |
| $75,000 to $99,999 | 117 (21.4%) | 78 (12.8%) |
| $100,000+ | 72 (13.2%) | 27 (4.4%) |
| Total | 546 (100.0%) | 609 (100.0%) |
Earnings by Sex by Educational Attainment in Eyota
Average earnings in Eyota are $66,042 for men and $45,781 for women, a difference of 30.7%. Men with an educational attainment of graduate degree enjoy the highest average annual earnings of $112,500, while those with less than high school education earn the least with $32,115. Women with an educational attainment of graduate degree earn the most with the average annual earnings of $67,031, while those with high school diploma education have the smallest earnings of $26,875.

| Educational Attainment | Male Income | Female Income |
| Less than High School | $32,115 | $0 |
| High School Diploma | $71,538 | $26,875 |
| College or Associate's Degree | $66,111 | $40,682 |
| Bachelor's Degree | $57,500 | $55,000 |
| Graduate Degree | $112,500 | $67,031 |
| Total | $66,042 | $45,781 |
Family Income in Eyota
Family Income Brackets in Eyota
According to the Eyota family income data, there are 156 families falling into the $100,000 to $149,999 income range, which is the most common income bracket and makes up 28.3% of all families.
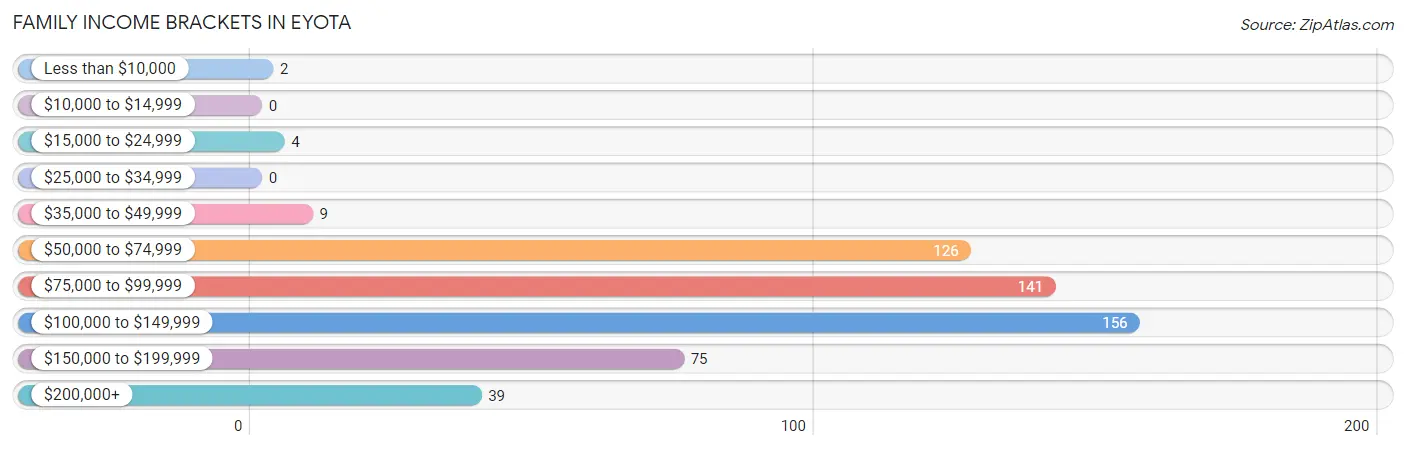
| Income Bracket | # Families | % Families |
| Less than $10,000 | 2 | 0.4% |
| $10,000 to $14,999 | 0 | 0.0% |
| $15,000 to $24,999 | 4 | 0.7% |
| $25,000 to $34,999 | 0 | 0.0% |
| $35,000 to $49,999 | 9 | 1.6% |
| $50,000 to $74,999 | 126 | 22.8% |
| $75,000 to $99,999 | 141 | 25.5% |
| $100,000 to $149,999 | 156 | 28.3% |
| $150,000 to $199,999 | 75 | 13.6% |
| $200,000+ | 39 | 7.1% |
Family Income by Famaliy Size in Eyota
3-person families (70 | 12.7%) account for the highest median family income in Eyota with $171,500 per family, while 3-person families (70 | 12.7%) have the highest median income of $57,167 per family member.
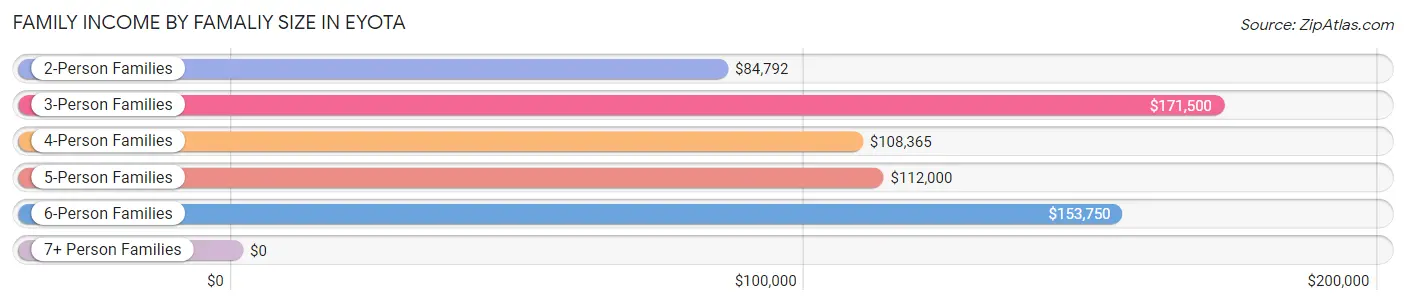
| Income Bracket | # Families | Median Income |
| 2-Person Families | 271 (49.1%) | $84,792 |
| 3-Person Families | 70 (12.7%) | $171,500 |
| 4-Person Families | 157 (28.4%) | $108,365 |
| 5-Person Families | 36 (6.5%) | $112,000 |
| 6-Person Families | 12 (2.2%) | $153,750 |
| 7+ Person Families | 6 (1.1%) | $0 |
| Total | 552 (100.0%) | $97,321 |
Family Income by Number of Earners in Eyota
The median family income in Eyota is $97,321, with families comprising 3+ earners (68) having the highest median family income of $178,611, while families with no earners (46) have the lowest median family income of $85,104, accounting for 12.3% and 8.3% of families, respectively.
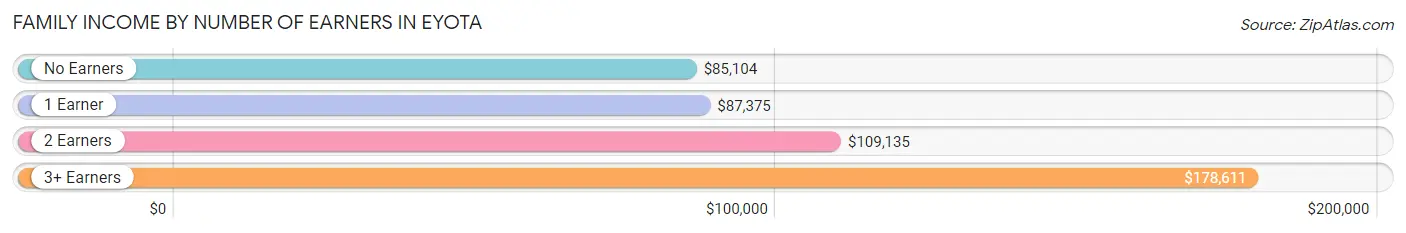
| Number of Earners | # Families | Median Income |
| No Earners | 46 (8.3%) | $85,104 |
| 1 Earner | 115 (20.8%) | $87,375 |
| 2 Earners | 323 (58.5%) | $109,135 |
| 3+ Earners | 68 (12.3%) | $178,611 |
| Total | 552 (100.0%) | $97,321 |
Household Income in Eyota
Household Income Brackets in Eyota
With 181 households falling in the category, the $50,000 to $74,999 income range is the most frequent in Eyota, accounting for 21.9% of all households. In contrast, only 34 households (4.1%) fall into the $15,000 to $24,999 income bracket, making it the least populous group.
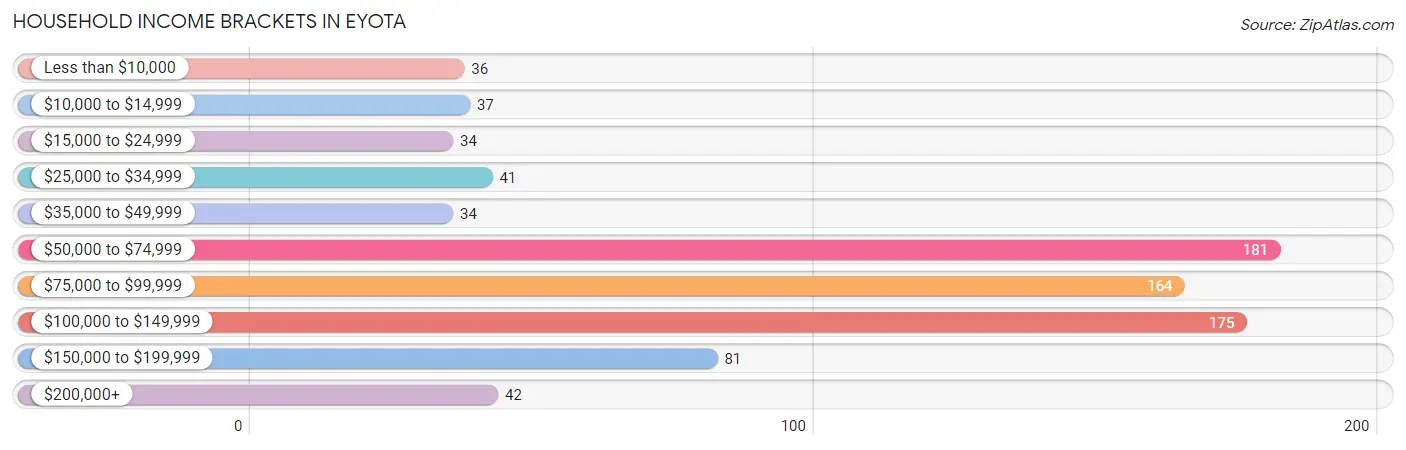
| Income Bracket | # Households | % Households |
| Less than $10,000 | 36 | 4.4% |
| $10,000 to $14,999 | 37 | 4.5% |
| $15,000 to $24,999 | 34 | 4.1% |
| $25,000 to $34,999 | 41 | 5.0% |
| $35,000 to $49,999 | 34 | 4.1% |
| $50,000 to $74,999 | 181 | 21.9% |
| $75,000 to $99,999 | 164 | 19.9% |
| $100,000 to $149,999 | 175 | 21.2% |
| $150,000 to $199,999 | 81 | 9.8% |
| $200,000+ | 42 | 5.1% |
Household Income by Householder Age in Eyota
The median household income in Eyota is $81,103, with the highest median household income of $104,688 found in the 25 to 44 years age bracket for the primary householder. A total of 255 households (30.9%) fall into this category. Meanwhile, the 65+ years age bracket for the primary householder has the lowest median household income of $34,450, with 251 households (30.4%) in this group.
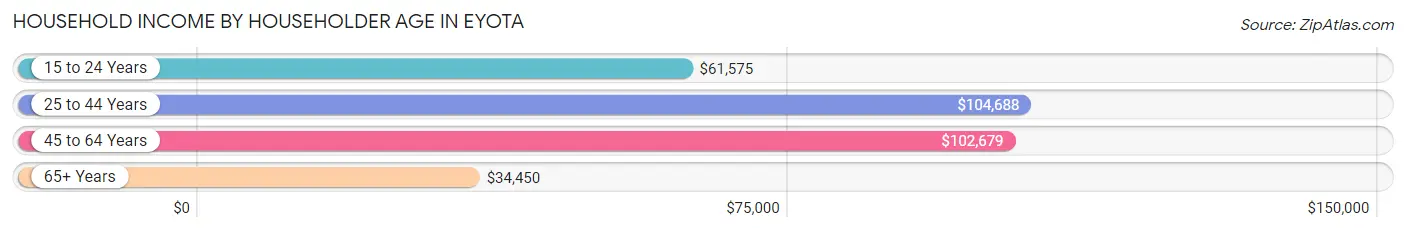
| Income Bracket | # Households | Median Income |
| 15 to 24 Years | 63 (7.6%) | $61,575 |
| 25 to 44 Years | 255 (30.9%) | $104,688 |
| 45 to 64 Years | 256 (31.0%) | $102,679 |
| 65+ Years | 251 (30.4%) | $34,450 |
| Total | 825 (100.0%) | $81,103 |
Poverty in Eyota
Income Below Poverty by Sex and Age in Eyota
With 2.4% poverty level for males and 9.2% for females among the residents of Eyota, 55 to 64 year old males and 75 year old and over females are the most vulnerable to poverty, with 12 males (12.1%) and 24 females (34.3%) in their respective age groups living below the poverty level.
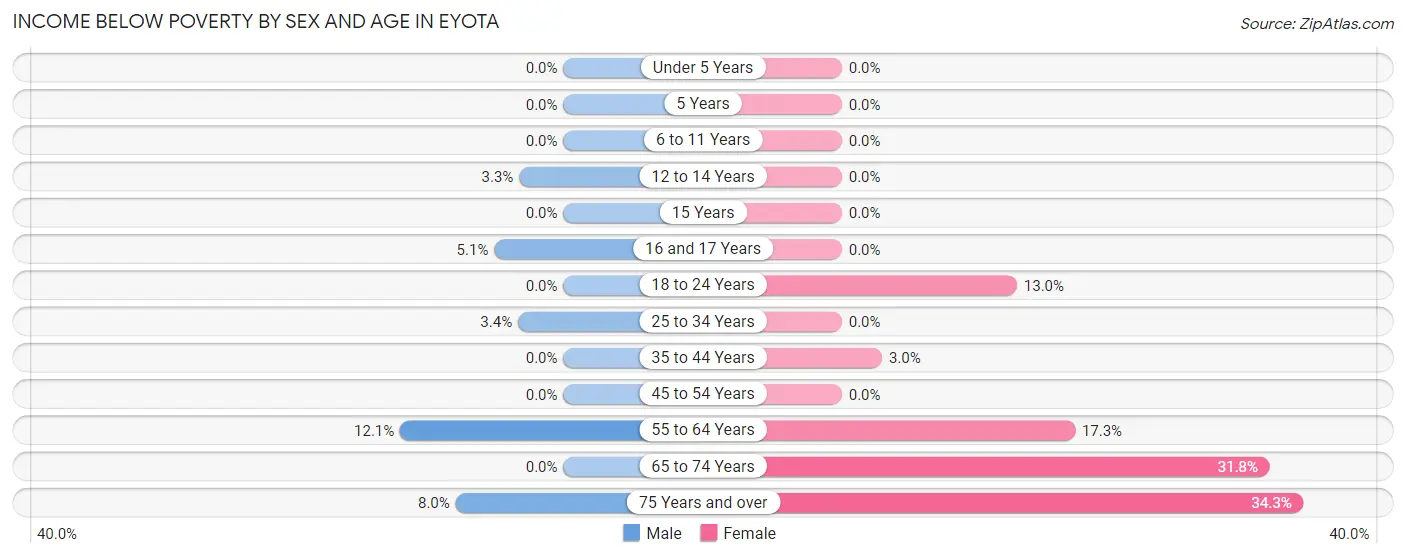
| Age Bracket | Male | Female |
| Under 5 Years | 0 (0.0%) | 0 (0.0%) |
| 5 Years | 0 (0.0%) | 0 (0.0%) |
| 6 to 11 Years | 0 (0.0%) | 0 (0.0%) |
| 12 to 14 Years | 2 (3.3%) | 0 (0.0%) |
| 15 Years | 0 (0.0%) | 0 (0.0%) |
| 16 and 17 Years | 2 (5.1%) | 0 (0.0%) |
| 18 to 24 Years | 0 (0.0%) | 13 (13.0%) |
| 25 to 34 Years | 3 (3.4%) | 0 (0.0%) |
| 35 to 44 Years | 0 (0.0%) | 5 (3.0%) |
| 45 to 54 Years | 0 (0.0%) | 0 (0.0%) |
| 55 to 64 Years | 12 (12.1%) | 18 (17.3%) |
| 65 to 74 Years | 0 (0.0%) | 41 (31.8%) |
| 75 Years and over | 4 (8.0%) | 24 (34.3%) |
| Total | 23 (2.4%) | 101 (9.2%) |
Income Above Poverty by Sex and Age in Eyota
According to the poverty statistics in Eyota, males aged under 5 years and females aged under 5 years are the age groups that are most secure financially, with 100.0% of males and 100.0% of females in these age groups living above the poverty line.
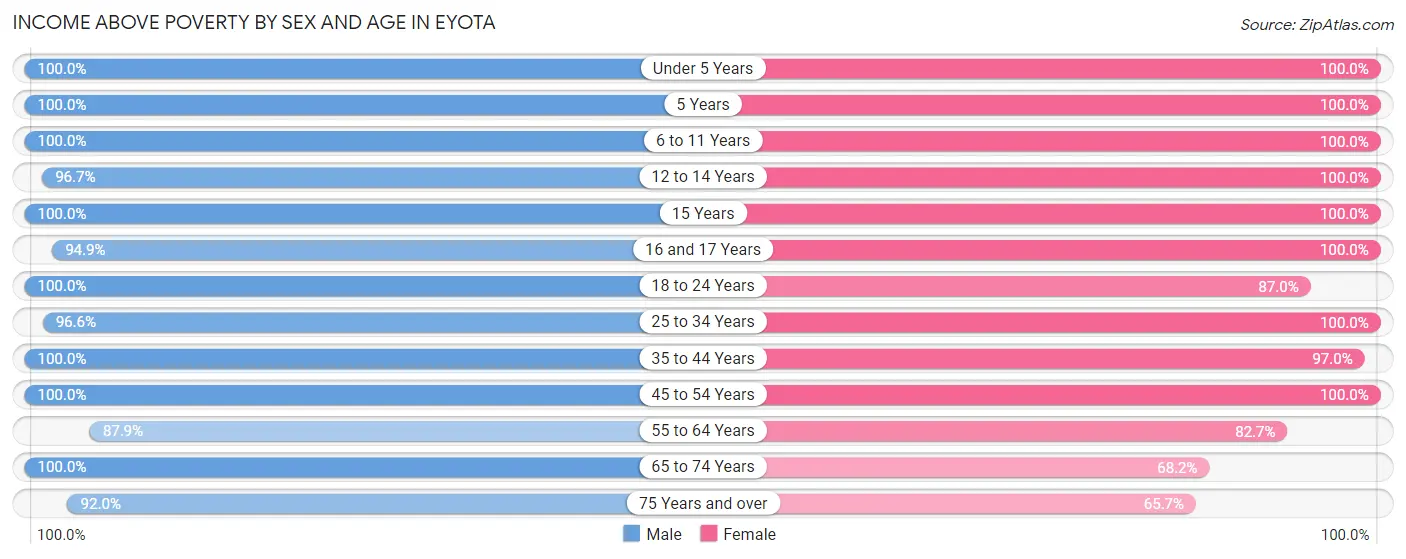
| Age Bracket | Male | Female |
| Under 5 Years | 68 (100.0%) | 115 (100.0%) |
| 5 Years | 22 (100.0%) | 26 (100.0%) |
| 6 to 11 Years | 86 (100.0%) | 66 (100.0%) |
| 12 to 14 Years | 59 (96.7%) | 63 (100.0%) |
| 15 Years | 28 (100.0%) | 17 (100.0%) |
| 16 and 17 Years | 37 (94.9%) | 16 (100.0%) |
| 18 to 24 Years | 104 (100.0%) | 87 (87.0%) |
| 25 to 34 Years | 86 (96.6%) | 125 (100.0%) |
| 35 to 44 Years | 136 (100.0%) | 162 (97.0%) |
| 45 to 54 Years | 115 (100.0%) | 97 (100.0%) |
| 55 to 64 Years | 87 (87.9%) | 86 (82.7%) |
| 65 to 74 Years | 70 (100.0%) | 88 (68.2%) |
| 75 Years and over | 46 (92.0%) | 46 (65.7%) |
| Total | 944 (97.6%) | 994 (90.8%) |
Income Below Poverty Among Married-Couple Families in Eyota
The poverty statistics for married-couple families in Eyota show that 0.9% or 4 of the total 451 families live below the poverty line. Families with no children have the highest poverty rate of 1.6%, comprising of 4 families. On the other hand, families with 1 or 2 children have the lowest poverty rate of 0.0%, which includes 0 families.
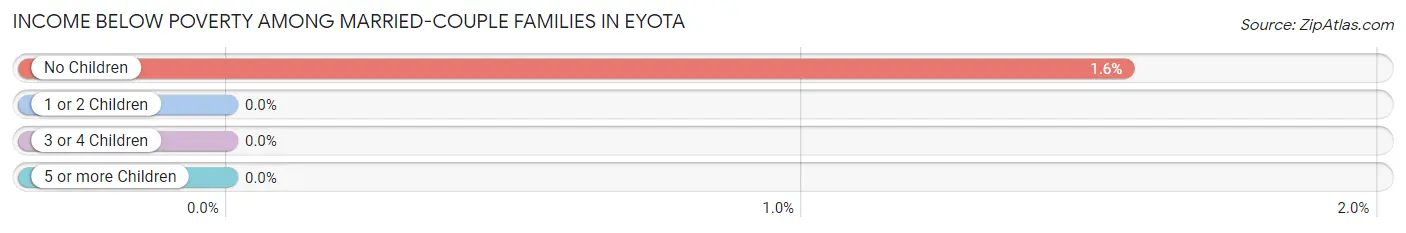
| Children | Above Poverty | Below Poverty |
| No Children | 252 (98.4%) | 4 (1.6%) |
| 1 or 2 Children | 148 (100.0%) | 0 (0.0%) |
| 3 or 4 Children | 47 (100.0%) | 0 (0.0%) |
| 5 or more Children | 0 (0.0%) | 0 (0.0%) |
| Total | 447 (99.1%) | 4 (0.9%) |
Income Below Poverty Among Single-Parent Households in Eyota
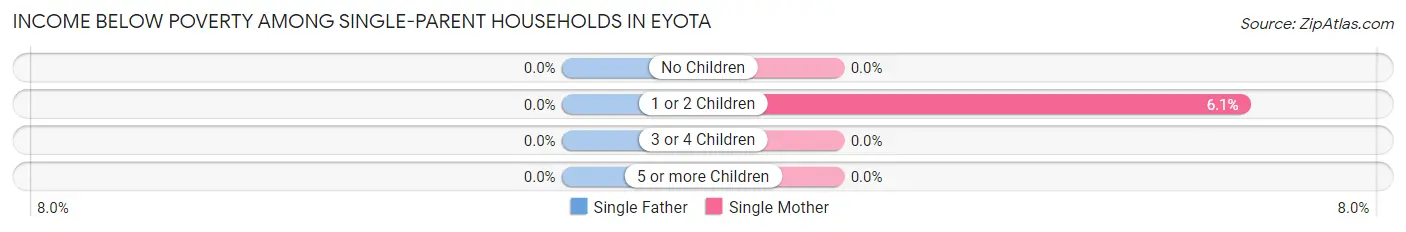
| Children | Single Father | Single Mother |
| No Children | 0 (0.0%) | 0 (0.0%) |
| 1 or 2 Children | 0 (0.0%) | 2 (6.1%) |
| 3 or 4 Children | 0 (0.0%) | 0 (0.0%) |
| 5 or more Children | 0 (0.0%) | 0 (0.0%) |
| Total | 0 (0.0%) | 2 (3.3%) |
Income Below Poverty Among Married-Couple vs Single-Parent Households in Eyota
The poverty data for Eyota shows that 4 of the married-couple family households (0.9%) and 2 of the single-parent households (2.0%) are living below the poverty level. Within the married-couple family households, those with no children have the highest poverty rate, with 4 households (1.6%) falling below the poverty line. Among the single-parent households, those with 1 or 2 children have the highest poverty rate, with 2 household (4.3%) living below poverty.
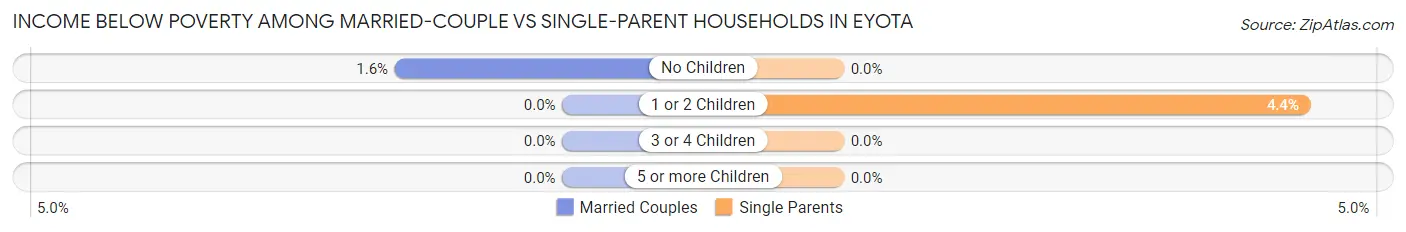
| Children | Married-Couple Families | Single-Parent Households |
| No Children | 4 (1.6%) | 0 (0.0%) |
| 1 or 2 Children | 0 (0.0%) | 2 (4.3%) |
| 3 or 4 Children | 0 (0.0%) | 0 (0.0%) |
| 5 or more Children | 0 (0.0%) | 0 (0.0%) |
| Total | 4 (0.9%) | 2 (2.0%) |
Employment Characteristics in Eyota
Employment by Class of Employer in Eyota
Among the 1,056 employed individuals in Eyota, private company employees (557 | 52.7%), not-for-profit organizations (180 | 17.1%), and local government employees (125 | 11.8%) make up the most common classes of employment.
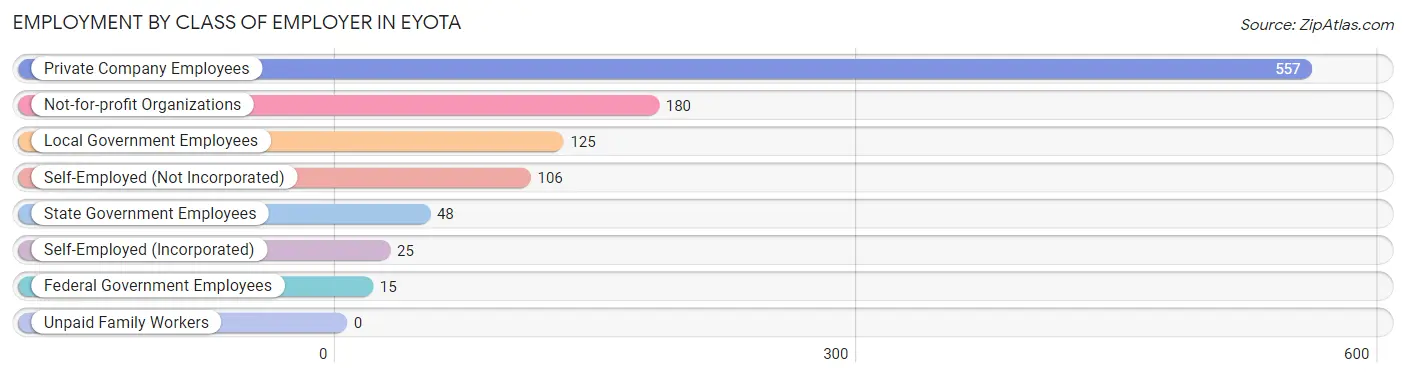
| Employer Class | # Employees | % Employees |
| Private Company Employees | 557 | 52.7% |
| Self-Employed (Incorporated) | 25 | 2.4% |
| Self-Employed (Not Incorporated) | 106 | 10.0% |
| Not-for-profit Organizations | 180 | 17.1% |
| Local Government Employees | 125 | 11.8% |
| State Government Employees | 48 | 4.5% |
| Federal Government Employees | 15 | 1.4% |
| Unpaid Family Workers | 0 | 0.0% |
| Total | 1,056 | 100.0% |
Employment Status by Age in Eyota
According to the labor force statistics for Eyota, out of the total population over 16 years of age (1,534), 70.7% or 1,085 individuals are in the labor force, with 1.8% or 20 of them unemployed. The age group with the highest labor force participation rate is 30 to 34 years, with 98.5% or 135 individuals in the labor force. Within the labor force, the 60 to 64 years age range has the highest percentage of unemployed individuals, with 16.8% or 17 of them being unemployed.
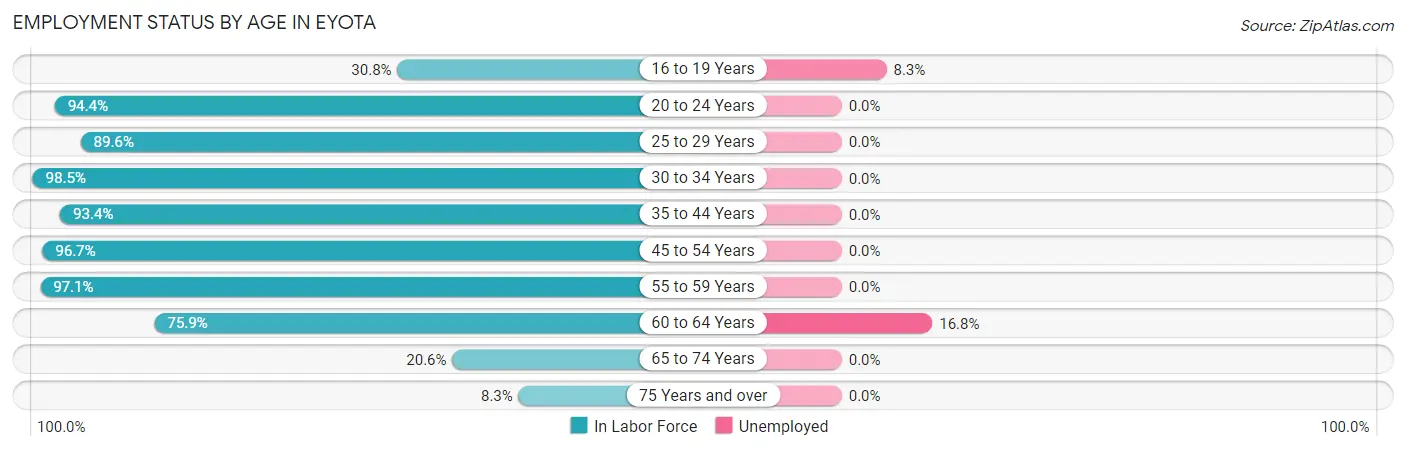
| Age Bracket | In Labor Force | Unemployed |
| 16 to 19 Years | 36 (30.8%) | 3 (8.3%) |
| 20 to 24 Years | 134 (94.4%) | 0 (0.0%) |
| 25 to 29 Years | 69 (89.6%) | 0 (0.0%) |
| 30 to 34 Years | 135 (98.5%) | 0 (0.0%) |
| 35 to 44 Years | 283 (93.4%) | 0 (0.0%) |
| 45 to 54 Years | 205 (96.7%) | 0 (0.0%) |
| 55 to 59 Years | 68 (97.1%) | 0 (0.0%) |
| 60 to 64 Years | 101 (75.9%) | 17 (16.8%) |
| 65 to 74 Years | 41 (20.6%) | 0 (0.0%) |
| 75 Years and over | 12 (8.3%) | 0 (0.0%) |
| Total | 1,085 (70.7%) | 20 (1.8%) |
Employment Status by Educational Attainment in Eyota
According to labor force statistics for Eyota, 92.4% of individuals (861) out of the total population between 25 and 64 years of age (932) are in the labor force, with 2.0% or 17 of them being unemployed. The group with the highest labor force participation rate are those with the educational attainment of less than high school, with 96.0% or 24 individuals in the labor force. Within the labor force, individuals with high school diploma education have the highest percentage of unemployment, with 9.2% or 17 of them being unemployed.
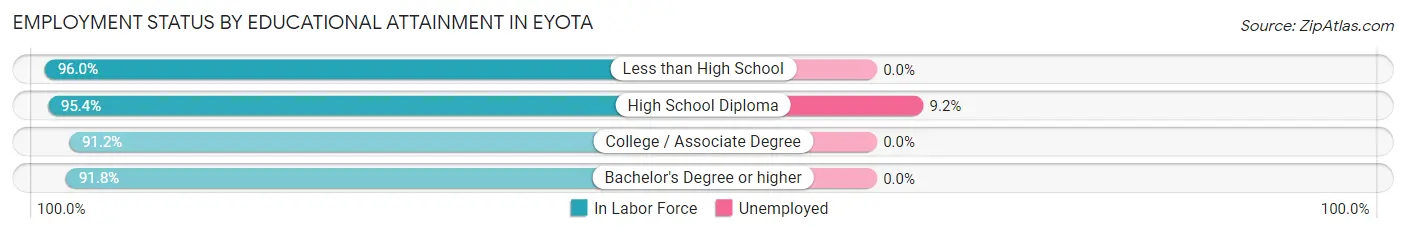
| Educational Attainment | In Labor Force | Unemployed |
| Less than High School | 24 (96.0%) | 0 (0.0%) |
| High School Diploma | 185 (95.4%) | 18 (9.2%) |
| College / Associate Degree | 372 (91.2%) | 0 (0.0%) |
| Bachelor's Degree or higher | 280 (91.8%) | 0 (0.0%) |
| Total | 861 (92.4%) | 19 (2.0%) |
Employment Occupations by Sex in Eyota
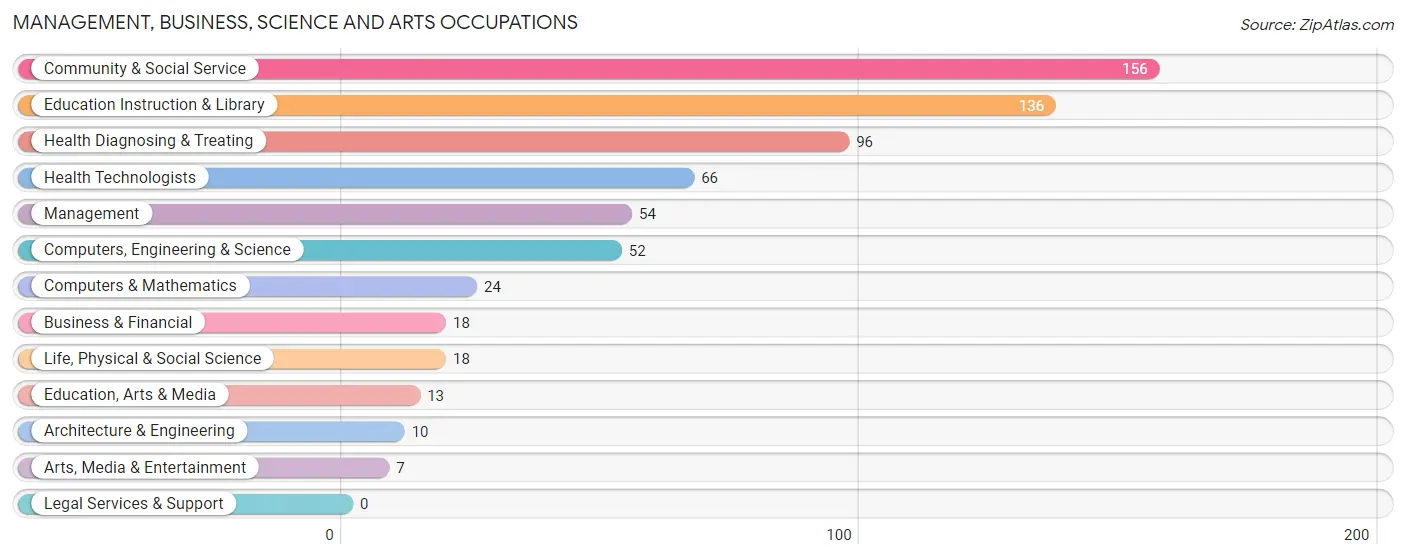
Management, Business, Science and Arts Occupations
The most common Management, Business, Science and Arts occupations in Eyota are Community & Social Service (156 | 14.7%), Education Instruction & Library (136 | 12.8%), Health Diagnosing & Treating (96 | 9.0%), Health Technologists (66 | 6.2%), and Management (54 | 5.1%).
Management, Business, Science and Arts Occupations by Sex
Within the Management, Business, Science and Arts occupations in Eyota, the most male-oriented occupations are Architecture & Engineering (100.0%), Business & Financial (77.8%), and Education, Arts & Media (76.9%), while the most female-oriented occupations are Health Technologists (81.8%), Health Diagnosing & Treating (77.1%), and Management (74.1%).

| Occupation | Male | Female |
| Management | 14 (25.9%) | 40 (74.1%) |
| Business & Financial | 14 (77.8%) | 4 (22.2%) |
| Computers, Engineering & Science | 31 (59.6%) | 21 (40.4%) |
| Computers & Mathematics | 10 (41.7%) | 14 (58.3%) |
| Architecture & Engineering | 10 (100.0%) | 0 (0.0%) |
| Life, Physical & Social Science | 11 (61.1%) | 7 (38.9%) |
| Community & Social Service | 69 (44.2%) | 87 (55.8%) |
| Education, Arts & Media | 10 (76.9%) | 3 (23.1%) |
| Legal Services & Support | 0 (0.0%) | 0 (0.0%) |
| Education Instruction & Library | 56 (41.2%) | 80 (58.8%) |
| Arts, Media & Entertainment | 3 (42.9%) | 4 (57.1%) |
| Health Diagnosing & Treating | 22 (22.9%) | 74 (77.1%) |
| Health Technologists | 12 (18.2%) | 54 (81.8%) |
| Total (Category) | 150 (39.9%) | 226 (60.1%) |
| Total (Overall) | 518 (48.7%) | 546 (51.3%) |
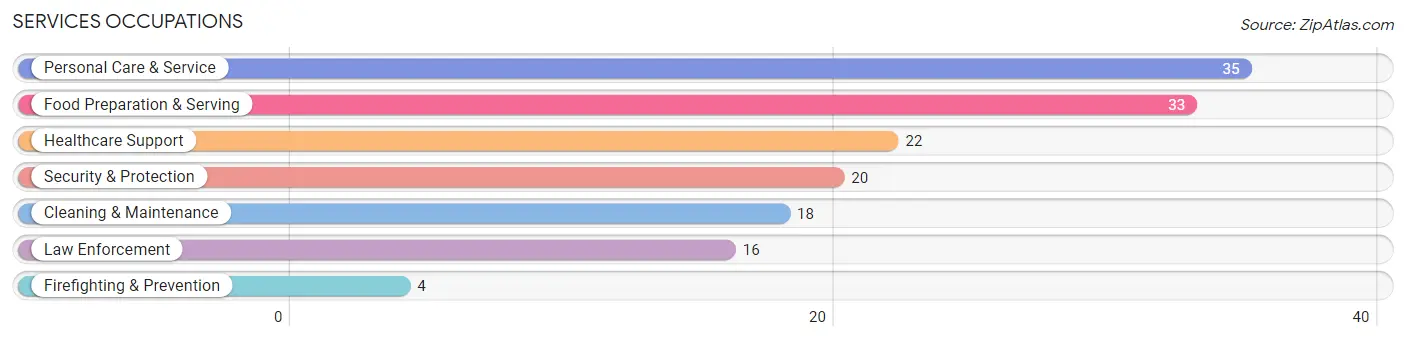
Services Occupations
The most common Services occupations in Eyota are Personal Care & Service (35 | 3.3%), Food Preparation & Serving (33 | 3.1%), Healthcare Support (22 | 2.1%), Security & Protection (20 | 1.9%), and Cleaning & Maintenance (18 | 1.7%).
Services Occupations by Sex
Within the Services occupations in Eyota, the most male-oriented occupations are Security & Protection (100.0%), Firefighting & Prevention (100.0%), and Law Enforcement (100.0%), while the most female-oriented occupations are Personal Care & Service (100.0%), Food Preparation & Serving (75.8%), and Cleaning & Maintenance (72.2%).
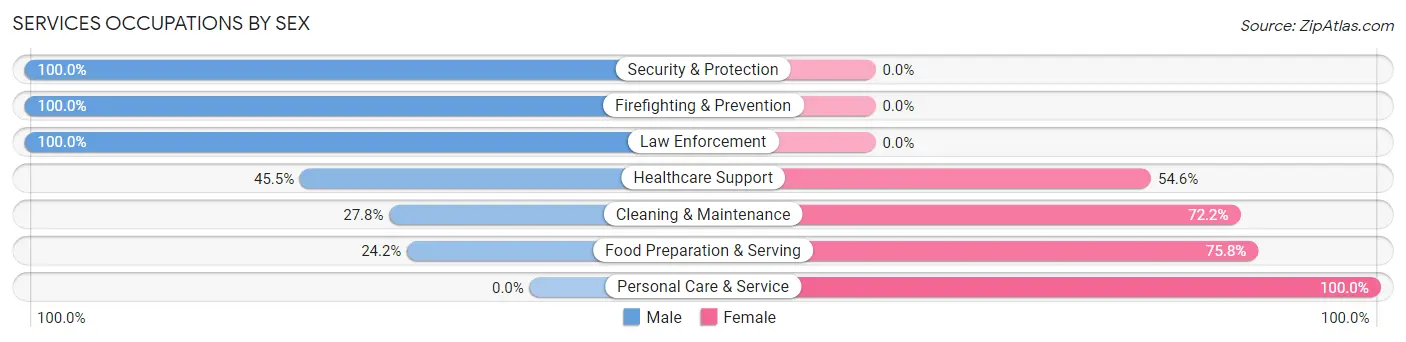
| Occupation | Male | Female |
| Healthcare Support | 10 (45.5%) | 12 (54.5%) |
| Security & Protection | 20 (100.0%) | 0 (0.0%) |
| Firefighting & Prevention | 4 (100.0%) | 0 (0.0%) |
| Law Enforcement | 16 (100.0%) | 0 (0.0%) |
| Food Preparation & Serving | 8 (24.2%) | 25 (75.8%) |
| Cleaning & Maintenance | 5 (27.8%) | 13 (72.2%) |
| Personal Care & Service | 0 (0.0%) | 35 (100.0%) |
| Total (Category) | 43 (33.6%) | 85 (66.4%) |
| Total (Overall) | 518 (48.7%) | 546 (51.3%) |
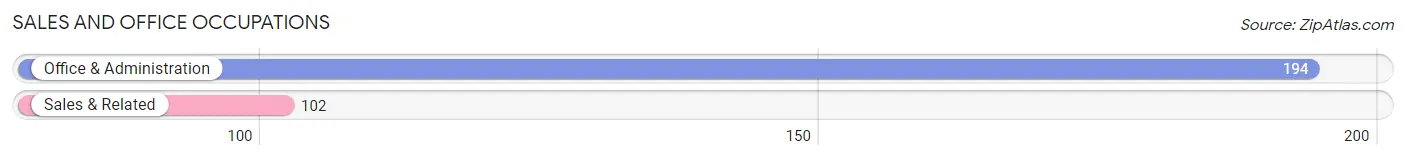
Sales and Office Occupations
The most common Sales and Office occupations in Eyota are Office & Administration (194 | 18.2%), and Sales & Related (102 | 9.6%).
Sales and Office Occupations by Sex
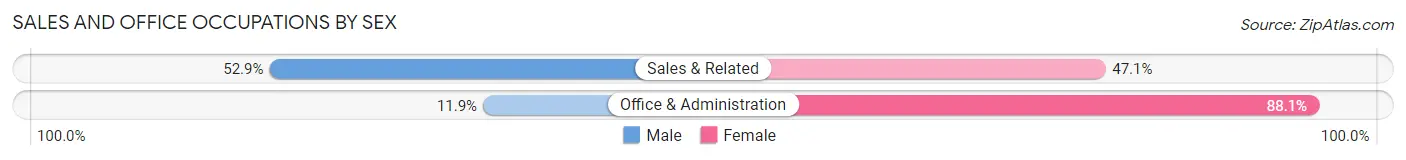
| Occupation | Male | Female |
| Sales & Related | 54 (52.9%) | 48 (47.1%) |
| Office & Administration | 23 (11.9%) | 171 (88.1%) |
| Total (Category) | 77 (26.0%) | 219 (74.0%) |
| Total (Overall) | 518 (48.7%) | 546 (51.3%) |
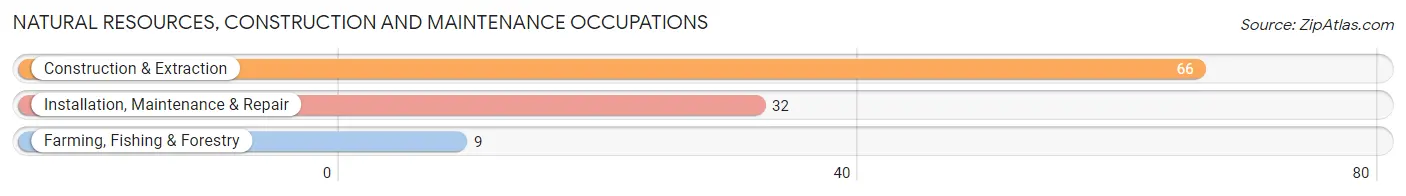
Natural Resources, Construction and Maintenance Occupations
The most common Natural Resources, Construction and Maintenance occupations in Eyota are Construction & Extraction (66 | 6.2%), Installation, Maintenance & Repair (32 | 3.0%), and Farming, Fishing & Forestry (9 | 0.9%).
Natural Resources, Construction and Maintenance Occupations by Sex
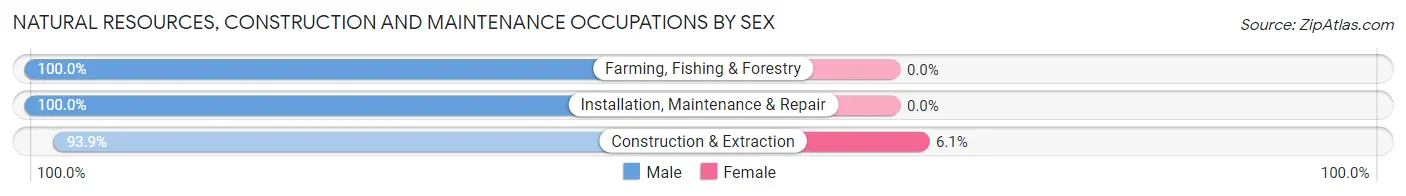
| Occupation | Male | Female |
| Farming, Fishing & Forestry | 9 (100.0%) | 0 (0.0%) |
| Construction & Extraction | 62 (93.9%) | 4 (6.1%) |
| Installation, Maintenance & Repair | 32 (100.0%) | 0 (0.0%) |
| Total (Category) | 103 (96.3%) | 4 (3.7%) |
| Total (Overall) | 518 (48.7%) | 546 (51.3%) |
Production, Transportation and Moving Occupations
The most common Production, Transportation and Moving occupations in Eyota are Production (85 | 8.0%), Transportation (57 | 5.4%), and Material Moving (15 | 1.4%).
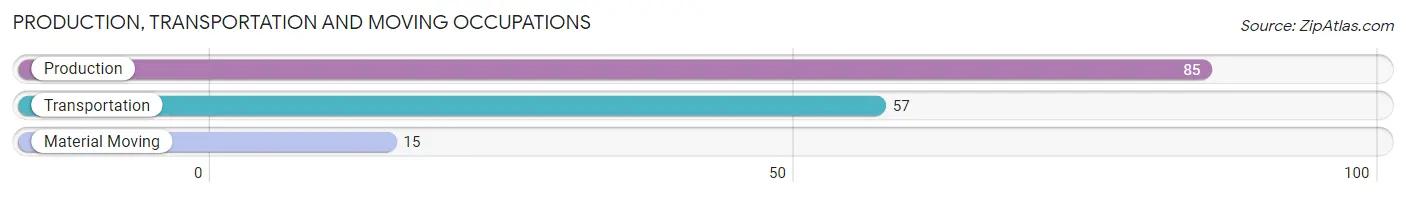
Production, Transportation and Moving Occupations by Sex
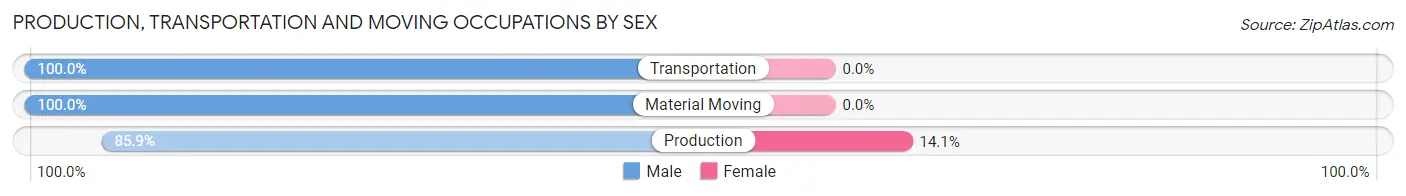
| Occupation | Male | Female |
| Production | 73 (85.9%) | 12 (14.1%) |
| Transportation | 57 (100.0%) | 0 (0.0%) |
| Material Moving | 15 (100.0%) | 0 (0.0%) |
| Total (Category) | 145 (92.4%) | 12 (7.6%) |
| Total (Overall) | 518 (48.7%) | 546 (51.3%) |
Employment Industries by Sex in Eyota
Employment Industries in Eyota
The major employment industries in Eyota include Health Care & Social Assistance (348 | 32.7%), Educational Services (152 | 14.3%), Manufacturing (87 | 8.2%), Construction (77 | 7.2%), and Retail Trade (76 | 7.1%).
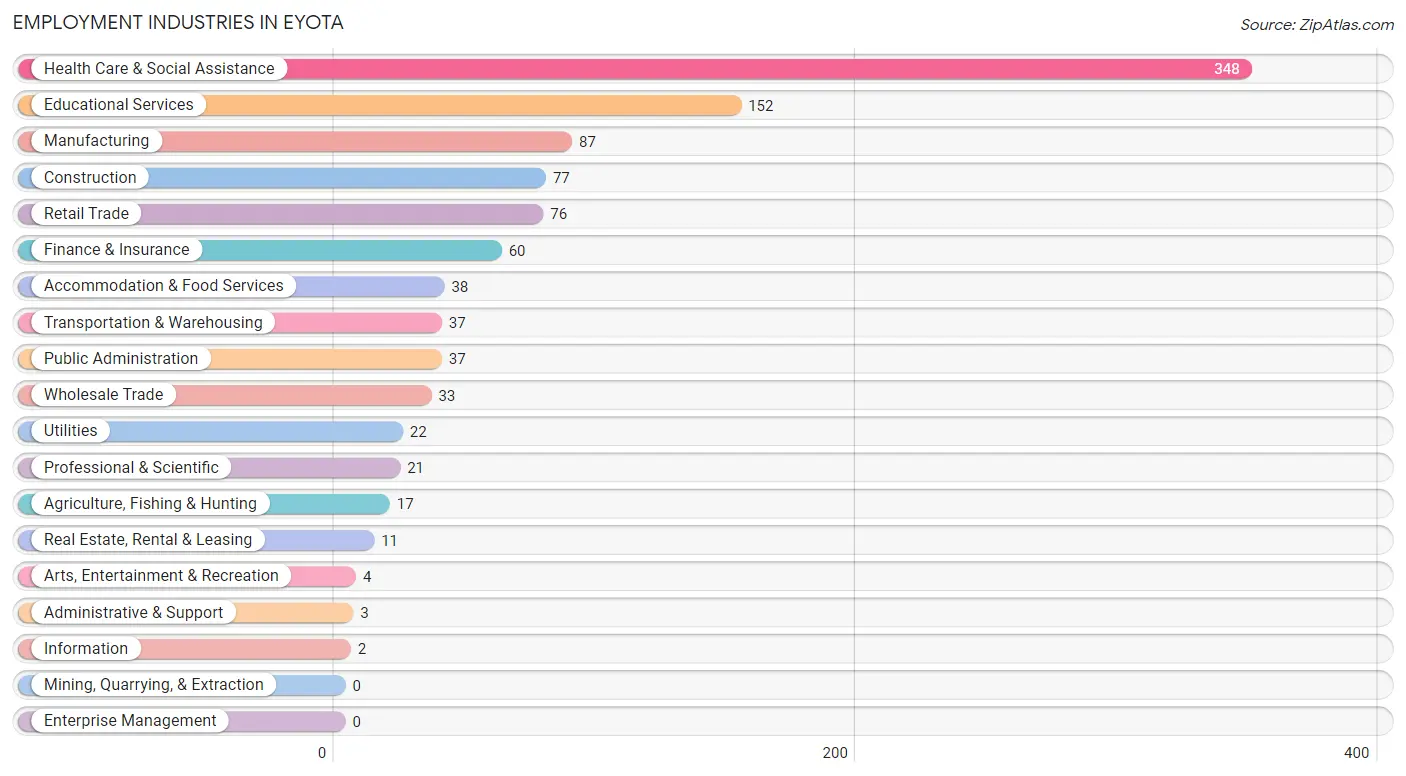
Employment Industries by Sex in Eyota
The Eyota industries that see more men than women are Wholesale Trade (100.0%), Transportation & Warehousing (100.0%), and Information (100.0%), whereas the industries that tend to have a higher number of women are Real Estate, Rental & Leasing (100.0%), Administrative & Support (100.0%), and Accommodation & Food Services (84.2%).
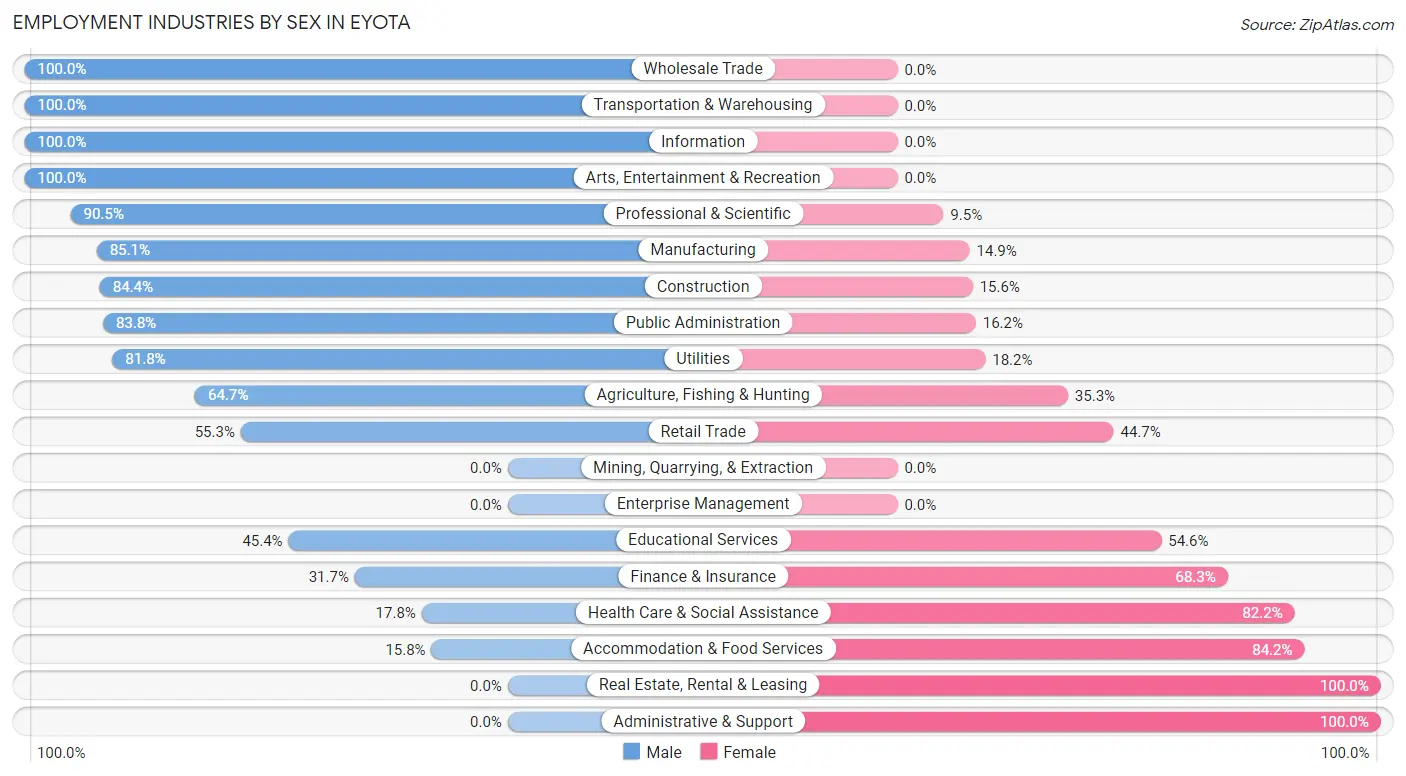
| Industry | Male | Female |
| Agriculture, Fishing & Hunting | 11 (64.7%) | 6 (35.3%) |
| Mining, Quarrying, & Extraction | 0 (0.0%) | 0 (0.0%) |
| Construction | 65 (84.4%) | 12 (15.6%) |
| Manufacturing | 74 (85.1%) | 13 (14.9%) |
| Wholesale Trade | 33 (100.0%) | 0 (0.0%) |
| Retail Trade | 42 (55.3%) | 34 (44.7%) |
| Transportation & Warehousing | 37 (100.0%) | 0 (0.0%) |
| Utilities | 18 (81.8%) | 4 (18.2%) |
| Information | 2 (100.0%) | 0 (0.0%) |
| Finance & Insurance | 19 (31.7%) | 41 (68.3%) |
| Real Estate, Rental & Leasing | 0 (0.0%) | 11 (100.0%) |
| Professional & Scientific | 19 (90.5%) | 2 (9.5%) |
| Enterprise Management | 0 (0.0%) | 0 (0.0%) |
| Administrative & Support | 0 (0.0%) | 3 (100.0%) |
| Educational Services | 69 (45.4%) | 83 (54.6%) |
| Health Care & Social Assistance | 62 (17.8%) | 286 (82.2%) |
| Arts, Entertainment & Recreation | 4 (100.0%) | 0 (0.0%) |
| Accommodation & Food Services | 6 (15.8%) | 32 (84.2%) |
| Public Administration | 31 (83.8%) | 6 (16.2%) |
| Total | 518 (48.7%) | 546 (51.3%) |
Education in Eyota
School Enrollment in Eyota
The most common levels of schooling among the 559 students in Eyota are high school (149 | 26.7%), middle school (142 | 25.4%), and elementary school (109 | 19.5%).
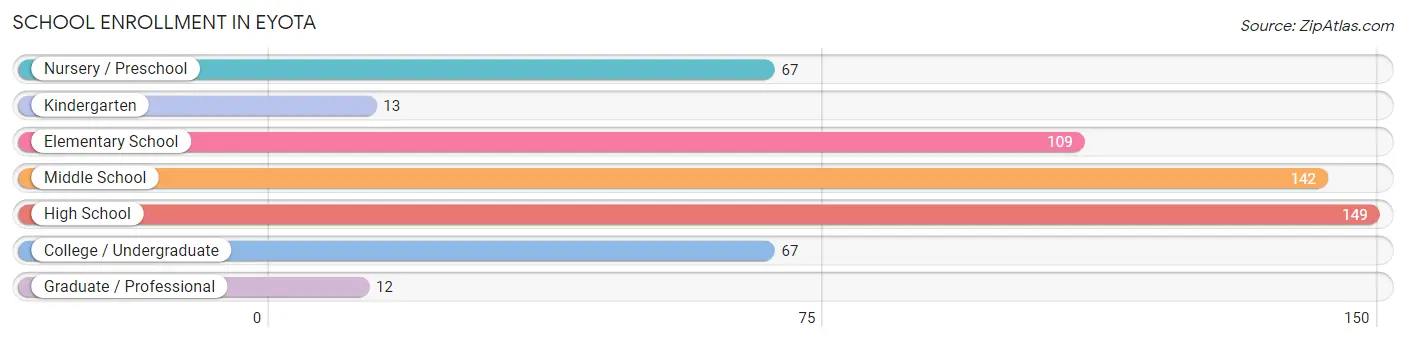
| School Level | # Students | % Students |
| Nursery / Preschool | 67 | 12.0% |
| Kindergarten | 13 | 2.3% |
| Elementary School | 109 | 19.5% |
| Middle School | 142 | 25.4% |
| High School | 149 | 26.7% |
| College / Undergraduate | 67 | 12.0% |
| Graduate / Professional | 12 | 2.1% |
| Total | 559 | 100.0% |
School Enrollment by Age by Funding Source in Eyota
Out of a total of 559 students who are enrolled in schools in Eyota, 95 (17.0%) attend a private institution, while the remaining 464 (83.0%) are enrolled in public schools. The age group of 3 to 4 year olds has the highest likelihood of being enrolled in private schools, with 26 (86.7% in the age bracket) enrolled. Conversely, the age group of 10 to 14 year olds has the lowest likelihood of being enrolled in a private school, with 181 (100.0% in the age bracket) attending a public institution.
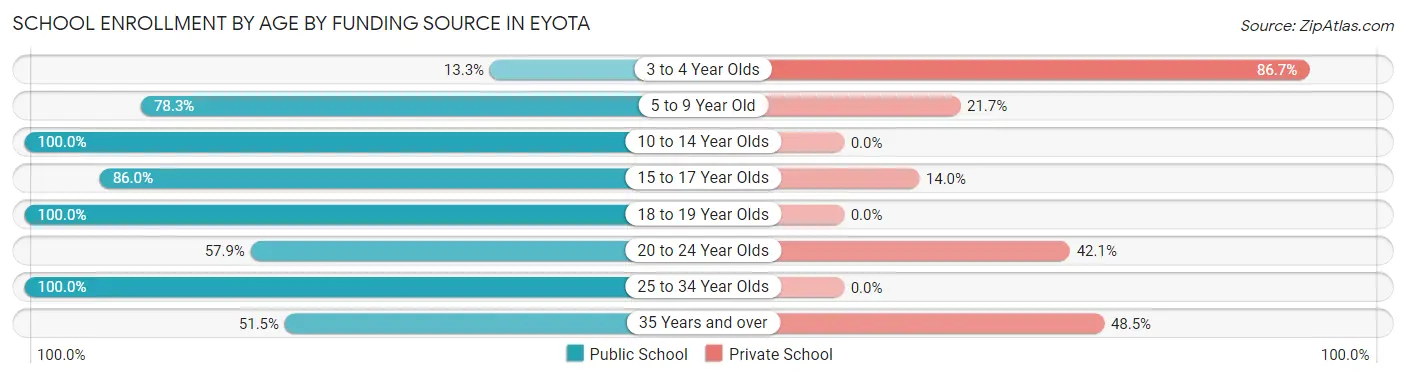
| Age Bracket | Public School | Private School |
| 3 to 4 Year Olds | 4 (13.3%) | 26 (86.7%) |
| 5 to 9 Year Old | 112 (78.3%) | 31 (21.7%) |
| 10 to 14 Year Olds | 181 (100.0%) | 0 (0.0%) |
| 15 to 17 Year Olds | 86 (86.0%) | 14 (14.0%) |
| 18 to 19 Year Olds | 43 (100.0%) | 0 (0.0%) |
| 20 to 24 Year Olds | 11 (57.9%) | 8 (42.1%) |
| 25 to 34 Year Olds | 10 (100.0%) | 0 (0.0%) |
| 35 Years and over | 17 (51.5%) | 16 (48.5%) |
| Total | 464 (83.0%) | 95 (17.0%) |
Educational Attainment by Field of Study in Eyota
Education (112 | 28.9%), science & technology (74 | 19.1%), business (50 | 12.9%), bio, nature & agricultural (39 | 10.1%), and psychology (24 | 6.2%) are the most common fields of study among 388 individuals in Eyota who have obtained a bachelor's degree or higher.
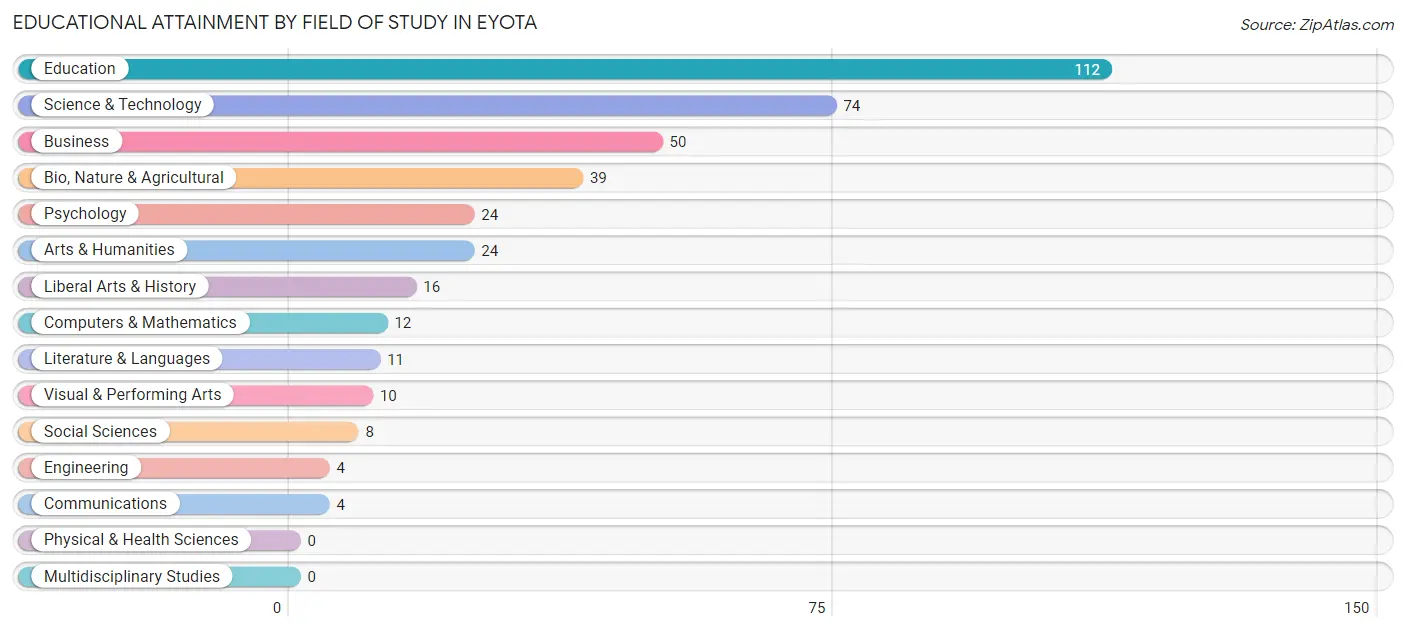
| Field of Study | # Graduates | % Graduates |
| Computers & Mathematics | 12 | 3.1% |
| Bio, Nature & Agricultural | 39 | 10.1% |
| Physical & Health Sciences | 0 | 0.0% |
| Psychology | 24 | 6.2% |
| Social Sciences | 8 | 2.1% |
| Engineering | 4 | 1.0% |
| Multidisciplinary Studies | 0 | 0.0% |
| Science & Technology | 74 | 19.1% |
| Business | 50 | 12.9% |
| Education | 112 | 28.9% |
| Literature & Languages | 11 | 2.8% |
| Liberal Arts & History | 16 | 4.1% |
| Visual & Performing Arts | 10 | 2.6% |
| Communications | 4 | 1.0% |
| Arts & Humanities | 24 | 6.2% |
| Total | 388 | 100.0% |
Transportation & Commute in Eyota
Vehicle Availability by Sex in Eyota
The most prevalent vehicle ownership categories in Eyota are males with 2 vehicles (289, accounting for 55.8%) and females with 2 vehicles (259, making up 53.7%).
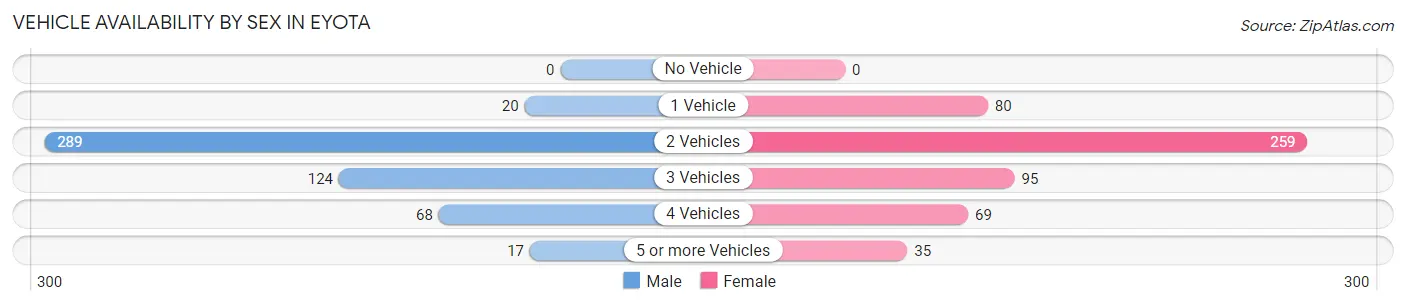
| Vehicles Available | Male | Female |
| No Vehicle | 0 (0.0%) | 0 (0.0%) |
| 1 Vehicle | 20 (3.9%) | 80 (14.9%) |
| 2 Vehicles | 289 (55.8%) | 259 (48.1%) |
| 3 Vehicles | 124 (23.9%) | 95 (17.7%) |
| 4 Vehicles | 68 (13.1%) | 69 (12.8%) |
| 5 or more Vehicles | 17 (3.3%) | 35 (6.5%) |
| Total | 518 (100.0%) | 538 (100.0%) |
Commute Time in Eyota
The most frequently occuring commute durations in Eyota are 20 to 24 minutes (278 commuters, 28.3%), 25 to 29 minutes (127 commuters, 12.9%), and 30 to 34 minutes (123 commuters, 12.5%).
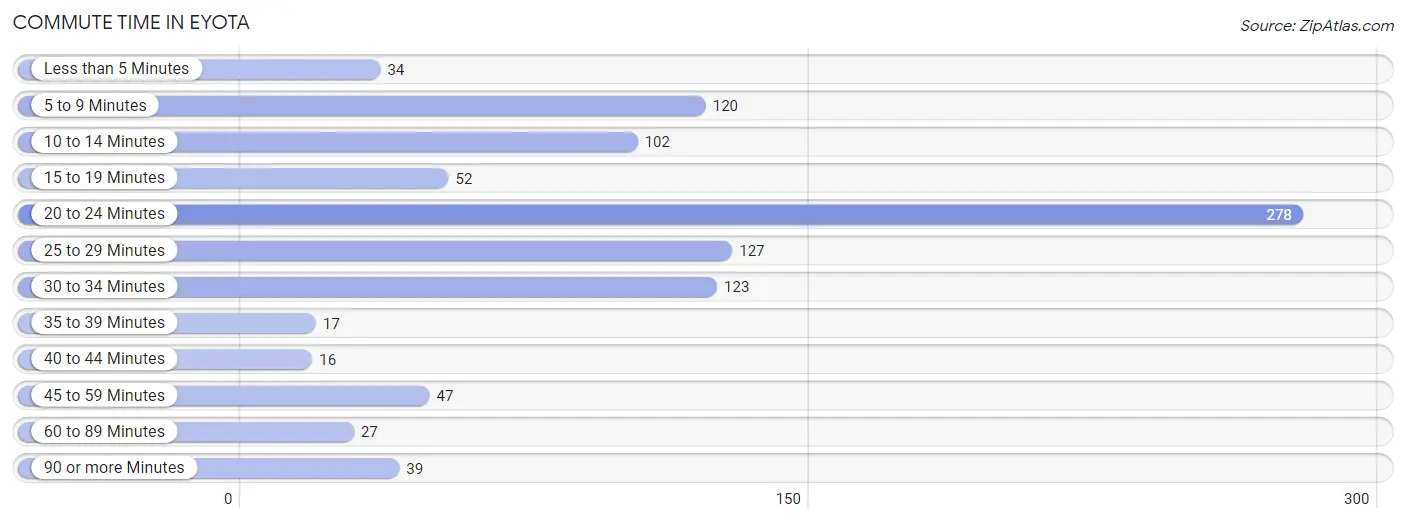
| Commute Time | # Commuters | % Commuters |
| Less than 5 Minutes | 34 | 3.5% |
| 5 to 9 Minutes | 120 | 12.2% |
| 10 to 14 Minutes | 102 | 10.4% |
| 15 to 19 Minutes | 52 | 5.3% |
| 20 to 24 Minutes | 278 | 28.3% |
| 25 to 29 Minutes | 127 | 12.9% |
| 30 to 34 Minutes | 123 | 12.5% |
| 35 to 39 Minutes | 17 | 1.7% |
| 40 to 44 Minutes | 16 | 1.6% |
| 45 to 59 Minutes | 47 | 4.8% |
| 60 to 89 Minutes | 27 | 2.8% |
| 90 or more Minutes | 39 | 4.0% |
Commute Time by Sex in Eyota
The most common commute times in Eyota are 20 to 24 minutes (144 commuters, 28.5%) for males and 20 to 24 minutes (134 commuters, 28.1%) for females.
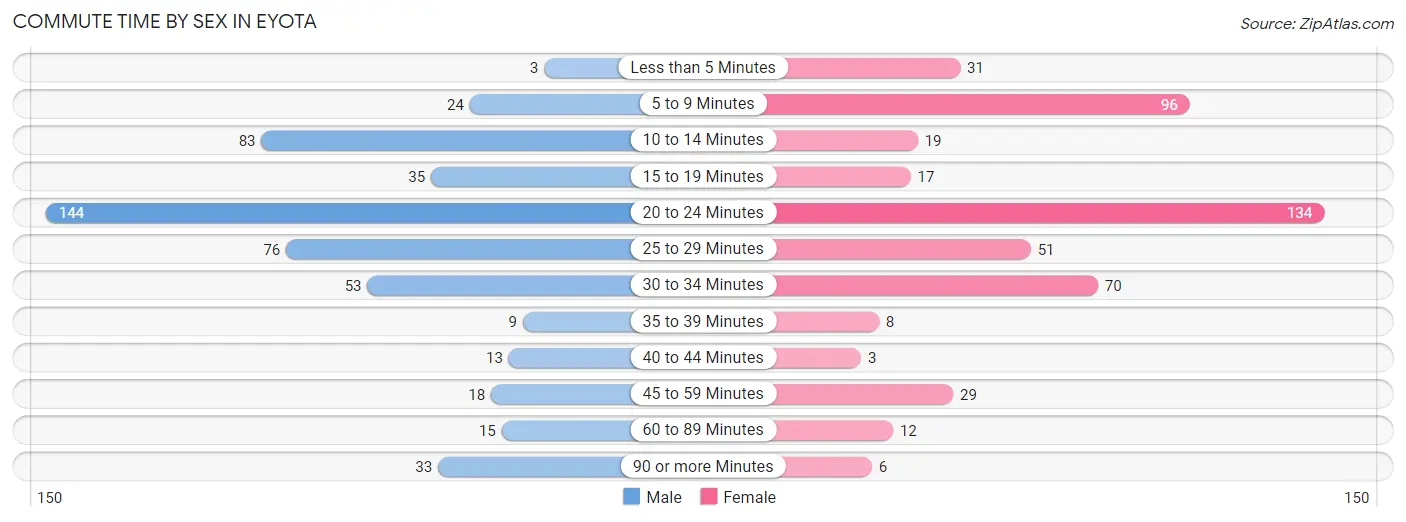
| Commute Time | Male | Female |
| Less than 5 Minutes | 3 (0.6%) | 31 (6.5%) |
| 5 to 9 Minutes | 24 (4.7%) | 96 (20.2%) |
| 10 to 14 Minutes | 83 (16.4%) | 19 (4.0%) |
| 15 to 19 Minutes | 35 (6.9%) | 17 (3.6%) |
| 20 to 24 Minutes | 144 (28.5%) | 134 (28.1%) |
| 25 to 29 Minutes | 76 (15.0%) | 51 (10.7%) |
| 30 to 34 Minutes | 53 (10.5%) | 70 (14.7%) |
| 35 to 39 Minutes | 9 (1.8%) | 8 (1.7%) |
| 40 to 44 Minutes | 13 (2.6%) | 3 (0.6%) |
| 45 to 59 Minutes | 18 (3.6%) | 29 (6.1%) |
| 60 to 89 Minutes | 15 (3.0%) | 12 (2.5%) |
| 90 or more Minutes | 33 (6.5%) | 6 (1.3%) |
Time of Departure to Work by Sex in Eyota
The most frequent times of departure to work in Eyota are 6:30 AM to 6:59 AM (97, 19.2%) for males and 7:00 AM to 7:29 AM (201, 42.2%) for females.
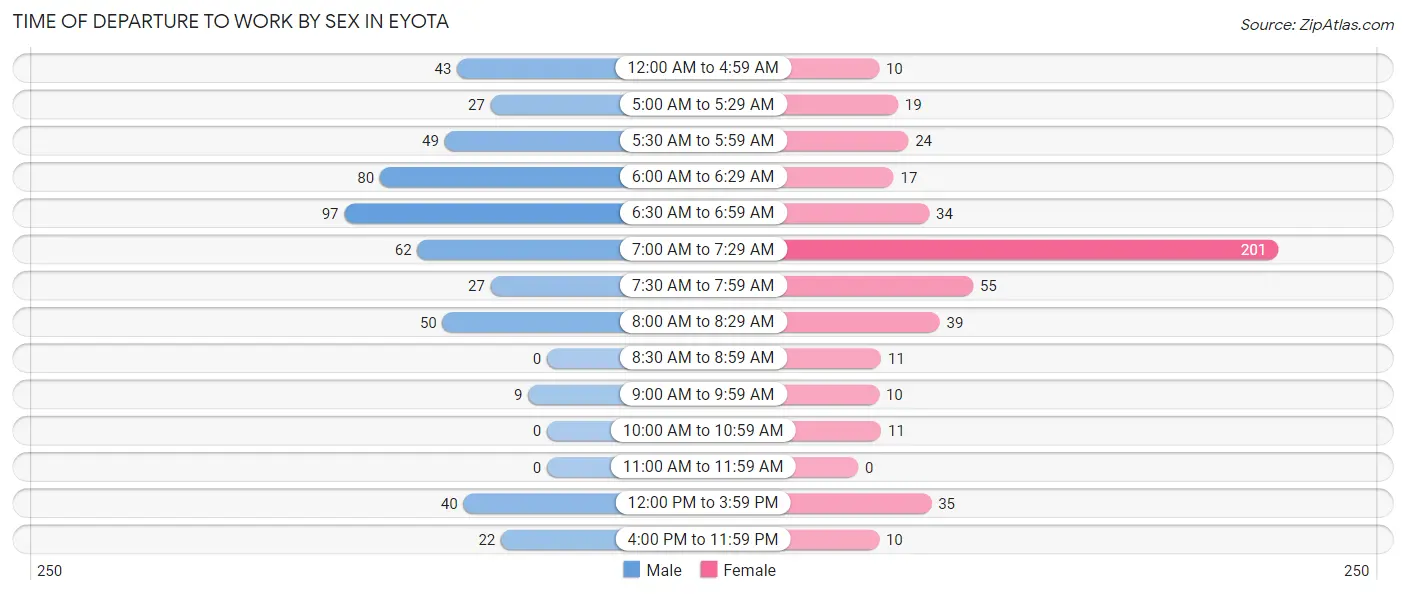
| Time of Departure | Male | Female |
| 12:00 AM to 4:59 AM | 43 (8.5%) | 10 (2.1%) |
| 5:00 AM to 5:29 AM | 27 (5.3%) | 19 (4.0%) |
| 5:30 AM to 5:59 AM | 49 (9.7%) | 24 (5.0%) |
| 6:00 AM to 6:29 AM | 80 (15.8%) | 17 (3.6%) |
| 6:30 AM to 6:59 AM | 97 (19.2%) | 34 (7.1%) |
| 7:00 AM to 7:29 AM | 62 (12.2%) | 201 (42.2%) |
| 7:30 AM to 7:59 AM | 27 (5.3%) | 55 (11.6%) |
| 8:00 AM to 8:29 AM | 50 (9.9%) | 39 (8.2%) |
| 8:30 AM to 8:59 AM | 0 (0.0%) | 11 (2.3%) |
| 9:00 AM to 9:59 AM | 9 (1.8%) | 10 (2.1%) |
| 10:00 AM to 10:59 AM | 0 (0.0%) | 11 (2.3%) |
| 11:00 AM to 11:59 AM | 0 (0.0%) | 0 (0.0%) |
| 12:00 PM to 3:59 PM | 40 (7.9%) | 35 (7.3%) |
| 4:00 PM to 11:59 PM | 22 (4.3%) | 10 (2.1%) |
| Total | 506 (100.0%) | 476 (100.0%) |
Housing Occupancy in Eyota
Occupancy by Ownership in Eyota
Of the total 825 dwellings in Eyota, owner-occupied units account for 598 (72.5%), while renter-occupied units make up 227 (27.5%).
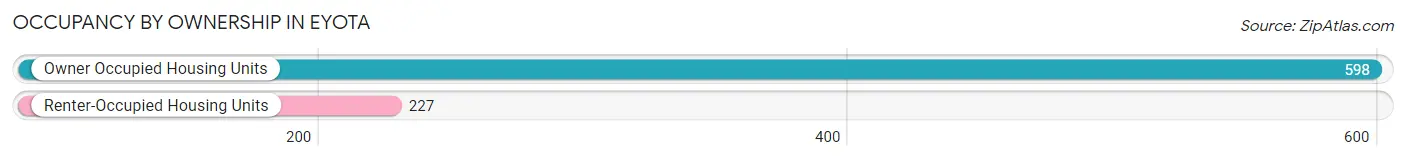
| Occupancy | # Housing Units | % Housing Units |
| Owner Occupied Housing Units | 598 | 72.5% |
| Renter-Occupied Housing Units | 227 | 27.5% |
| Total Occupied Housing Units | 825 | 100.0% |
Occupancy by Household Size in Eyota
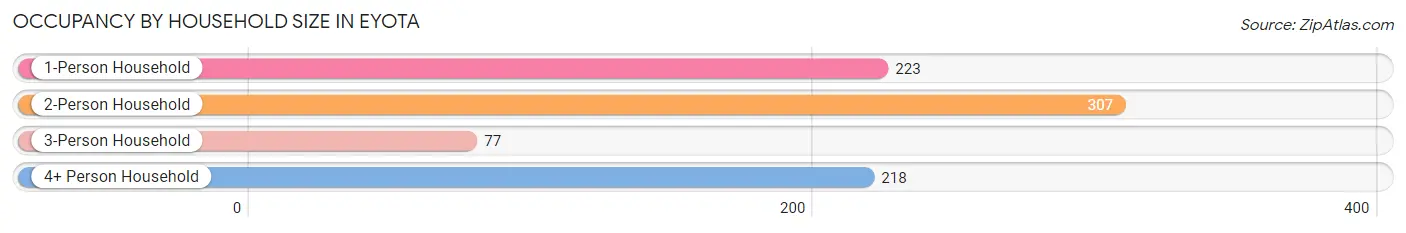
| Household Size | # Housing Units | % Housing Units |
| 1-Person Household | 223 | 27.0% |
| 2-Person Household | 307 | 37.2% |
| 3-Person Household | 77 | 9.3% |
| 4+ Person Household | 218 | 26.4% |
| Total Housing Units | 825 | 100.0% |
Occupancy by Ownership by Household Size in Eyota
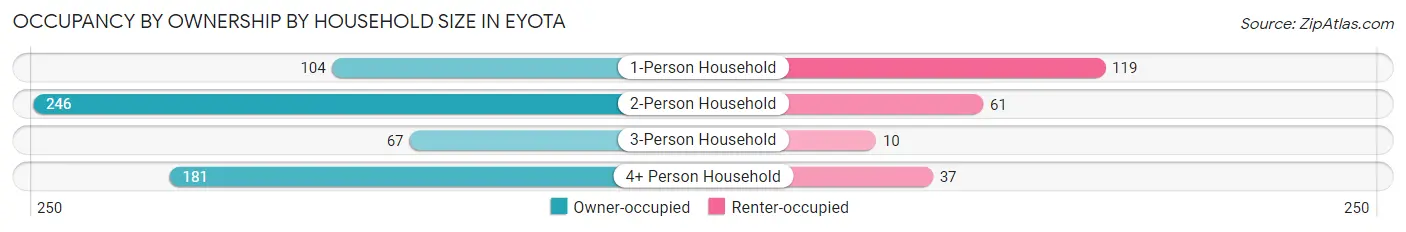
| Household Size | Owner-occupied | Renter-occupied |
| 1-Person Household | 104 (46.6%) | 119 (53.4%) |
| 2-Person Household | 246 (80.1%) | 61 (19.9%) |
| 3-Person Household | 67 (87.0%) | 10 (13.0%) |
| 4+ Person Household | 181 (83.0%) | 37 (17.0%) |
| Total Housing Units | 598 (72.5%) | 227 (27.5%) |
Occupancy by Educational Attainment in Eyota
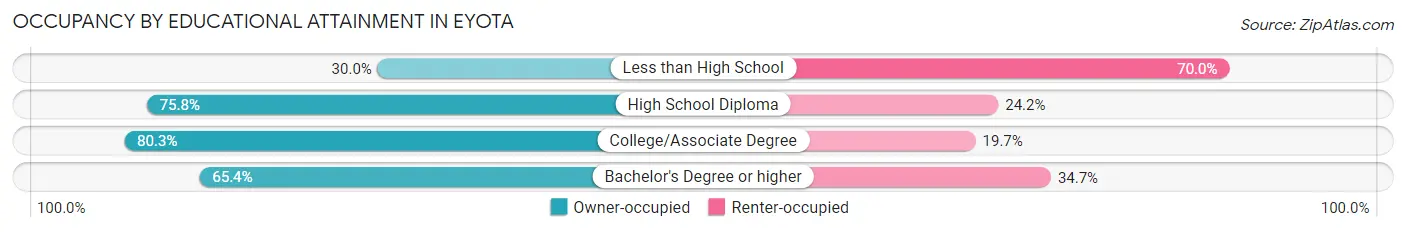
| Household Size | Owner-occupied | Renter-occupied |
| Less than High School | 9 (30.0%) | 21 (70.0%) |
| High School Diploma | 191 (75.8%) | 61 (24.2%) |
| College/Associate Degree | 232 (80.3%) | 57 (19.7%) |
| Bachelor's Degree or higher | 166 (65.3%) | 88 (34.6%) |
Occupancy by Age of Householder in Eyota
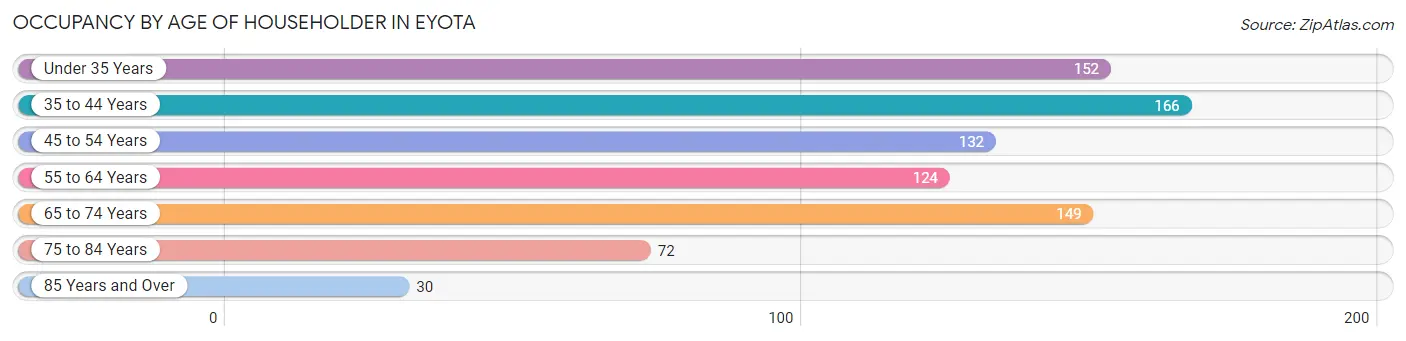
| Age Bracket | # Households | % Households |
| Under 35 Years | 152 | 18.4% |
| 35 to 44 Years | 166 | 20.1% |
| 45 to 54 Years | 132 | 16.0% |
| 55 to 64 Years | 124 | 15.0% |
| 65 to 74 Years | 149 | 18.1% |
| 75 to 84 Years | 72 | 8.7% |
| 85 Years and Over | 30 | 3.6% |
| Total | 825 | 100.0% |
Housing Finances in Eyota
Median Income by Occupancy in Eyota
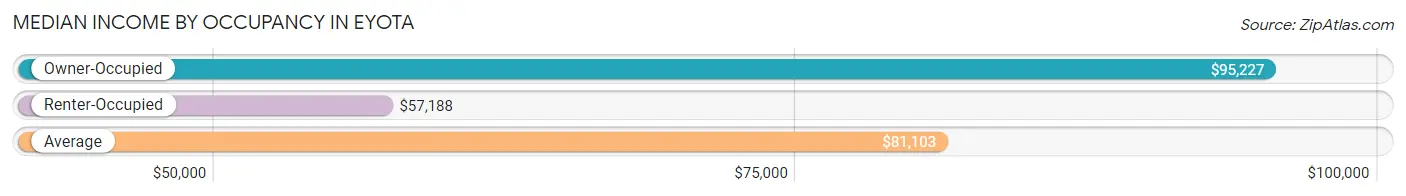
| Occupancy Type | # Households | Median Income |
| Owner-Occupied | 598 (72.5%) | $95,227 |
| Renter-Occupied | 227 (27.5%) | $57,188 |
| Average | 825 (100.0%) | $81,103 |
Occupancy by Householder Income Bracket in Eyota
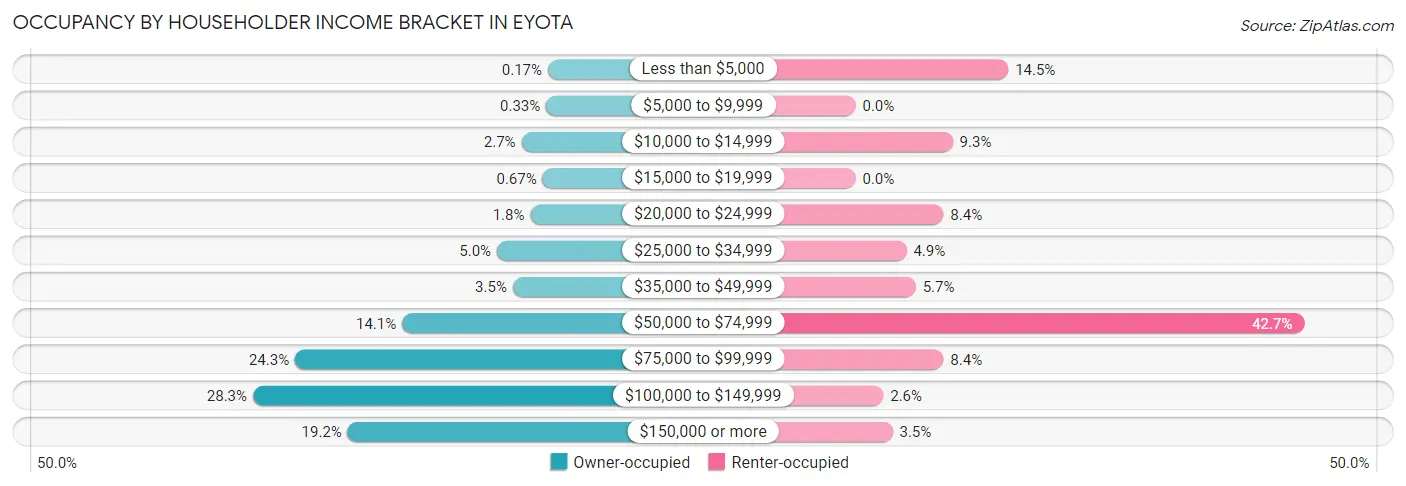
| Income Bracket | Owner-occupied | Renter-occupied |
| Less than $5,000 | 1 (0.2%) | 33 (14.5%) |
| $5,000 to $9,999 | 2 (0.3%) | 0 (0.0%) |
| $10,000 to $14,999 | 16 (2.7%) | 21 (9.2%) |
| $15,000 to $19,999 | 4 (0.7%) | 0 (0.0%) |
| $20,000 to $24,999 | 11 (1.8%) | 19 (8.4%) |
| $25,000 to $34,999 | 30 (5.0%) | 11 (4.9%) |
| $35,000 to $49,999 | 21 (3.5%) | 13 (5.7%) |
| $50,000 to $74,999 | 84 (14.1%) | 97 (42.7%) |
| $75,000 to $99,999 | 145 (24.2%) | 19 (8.4%) |
| $100,000 to $149,999 | 169 (28.3%) | 6 (2.6%) |
| $150,000 or more | 115 (19.2%) | 8 (3.5%) |
| Total | 598 (100.0%) | 227 (100.0%) |
Monthly Housing Cost Tiers in Eyota
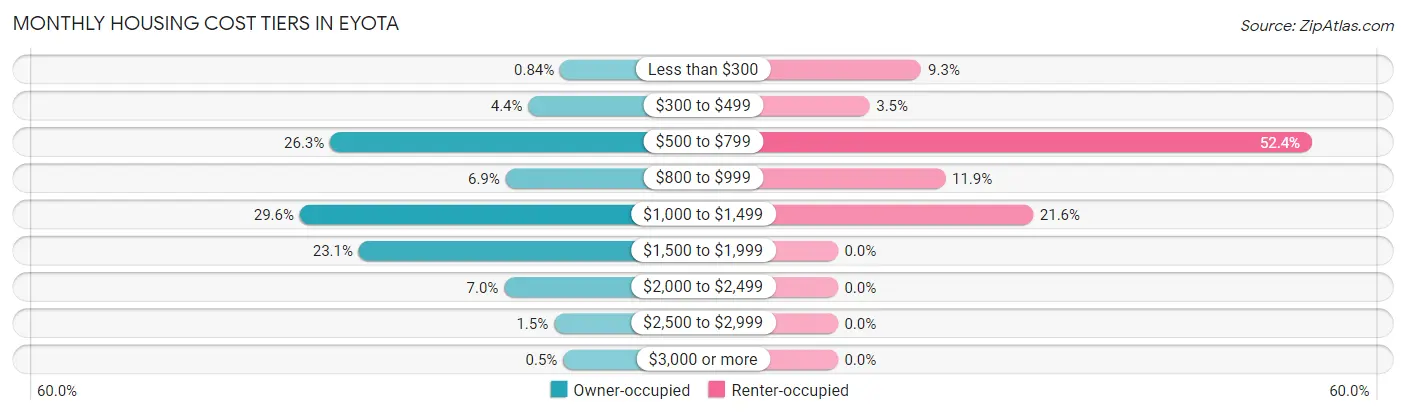
| Monthly Cost | Owner-occupied | Renter-occupied |
| Less than $300 | 5 (0.8%) | 21 (9.2%) |
| $300 to $499 | 26 (4.3%) | 8 (3.5%) |
| $500 to $799 | 157 (26.3%) | 119 (52.4%) |
| $800 to $999 | 41 (6.9%) | 27 (11.9%) |
| $1,000 to $1,499 | 177 (29.6%) | 49 (21.6%) |
| $1,500 to $1,999 | 138 (23.1%) | 0 (0.0%) |
| $2,000 to $2,499 | 42 (7.0%) | 0 (0.0%) |
| $2,500 to $2,999 | 9 (1.5%) | 0 (0.0%) |
| $3,000 or more | 3 (0.5%) | 0 (0.0%) |
| Total | 598 (100.0%) | 227 (100.0%) |
Physical Housing Characteristics in Eyota
Housing Structures in Eyota
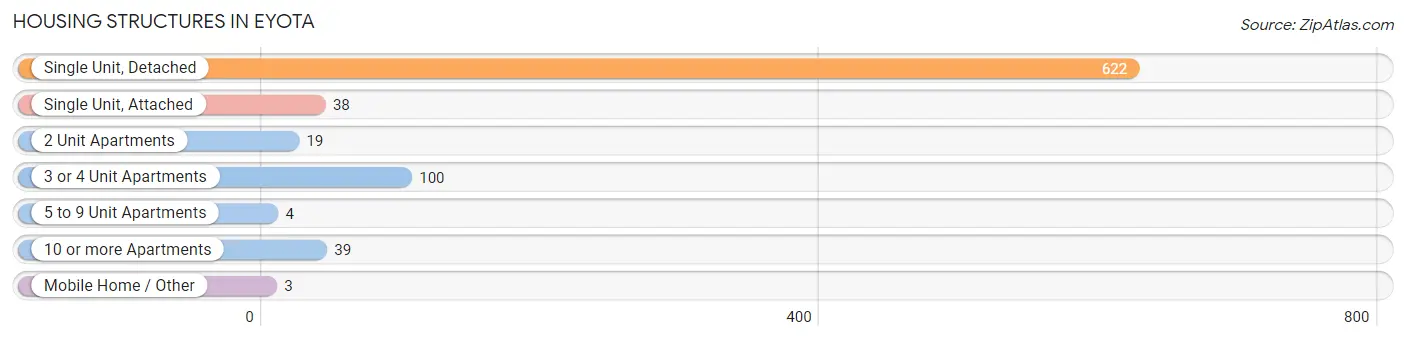
| Structure Type | # Housing Units | % Housing Units |
| Single Unit, Detached | 622 | 75.4% |
| Single Unit, Attached | 38 | 4.6% |
| 2 Unit Apartments | 19 | 2.3% |
| 3 or 4 Unit Apartments | 100 | 12.1% |
| 5 to 9 Unit Apartments | 4 | 0.5% |
| 10 or more Apartments | 39 | 4.7% |
| Mobile Home / Other | 3 | 0.4% |
| Total | 825 | 100.0% |
Housing Structures by Occupancy in Eyota
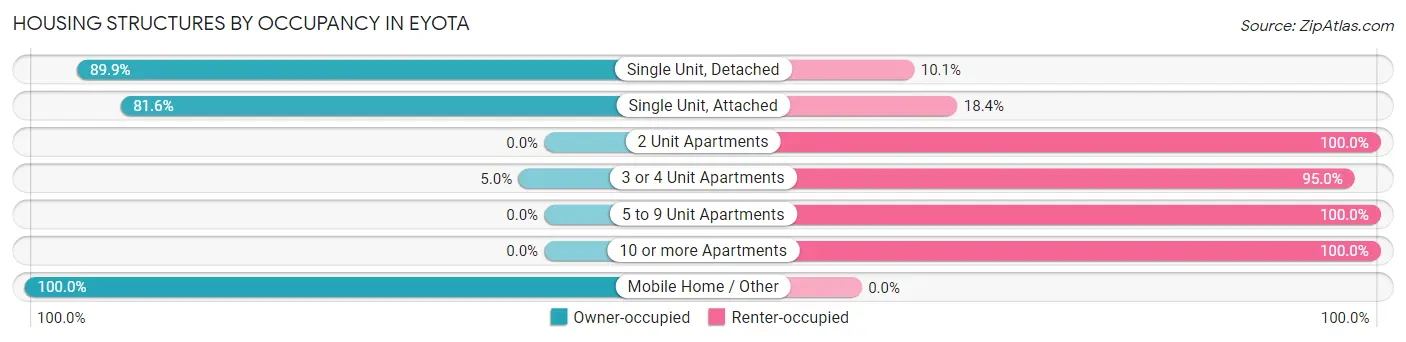
| Structure Type | Owner-occupied | Renter-occupied |
| Single Unit, Detached | 559 (89.9%) | 63 (10.1%) |
| Single Unit, Attached | 31 (81.6%) | 7 (18.4%) |
| 2 Unit Apartments | 0 (0.0%) | 19 (100.0%) |
| 3 or 4 Unit Apartments | 5 (5.0%) | 95 (95.0%) |
| 5 to 9 Unit Apartments | 0 (0.0%) | 4 (100.0%) |
| 10 or more Apartments | 0 (0.0%) | 39 (100.0%) |
| Mobile Home / Other | 3 (100.0%) | 0 (0.0%) |
| Total | 598 (72.5%) | 227 (27.5%) |
Housing Structures by Number of Rooms in Eyota
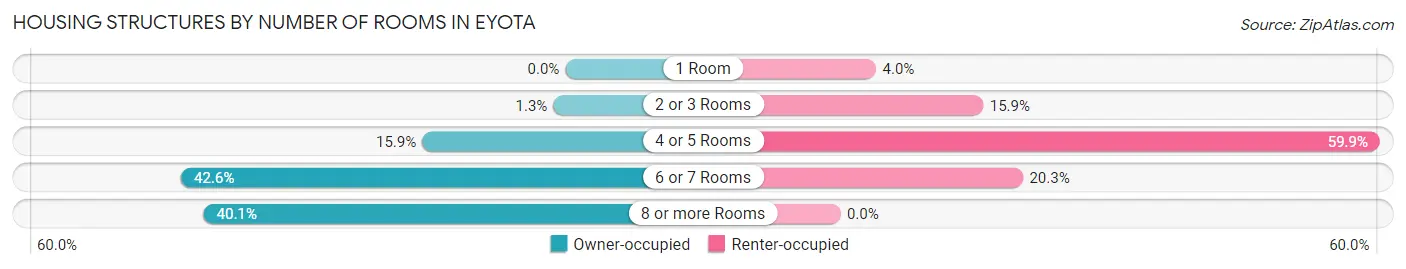
| Number of Rooms | Owner-occupied | Renter-occupied |
| 1 Room | 0 (0.0%) | 9 (4.0%) |
| 2 or 3 Rooms | 8 (1.3%) | 36 (15.9%) |
| 4 or 5 Rooms | 95 (15.9%) | 136 (59.9%) |
| 6 or 7 Rooms | 255 (42.6%) | 46 (20.3%) |
| 8 or more Rooms | 240 (40.1%) | 0 (0.0%) |
| Total | 598 (100.0%) | 227 (100.0%) |
Housing Structure by Heating Type in Eyota
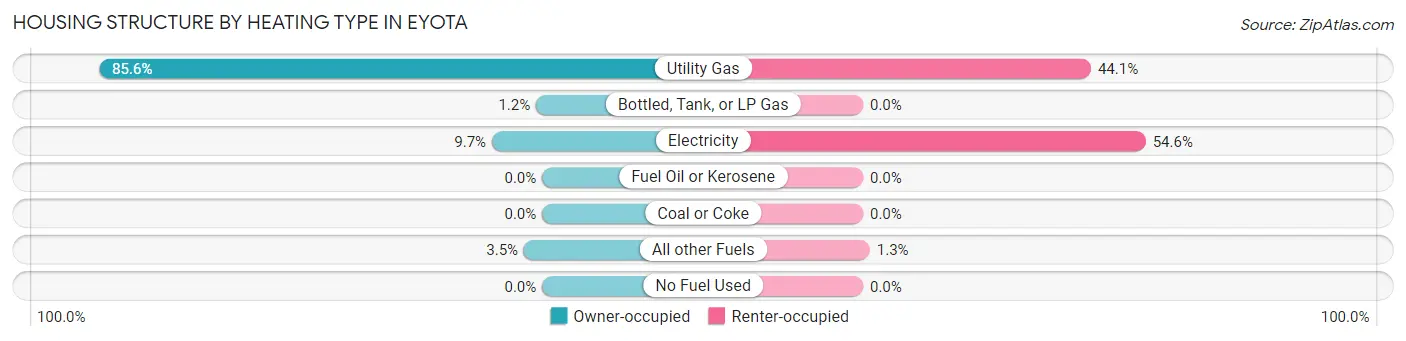
| Heating Type | Owner-occupied | Renter-occupied |
| Utility Gas | 512 (85.6%) | 100 (44.1%) |
| Bottled, Tank, or LP Gas | 7 (1.2%) | 0 (0.0%) |
| Electricity | 58 (9.7%) | 124 (54.6%) |
| Fuel Oil or Kerosene | 0 (0.0%) | 0 (0.0%) |
| Coal or Coke | 0 (0.0%) | 0 (0.0%) |
| All other Fuels | 21 (3.5%) | 3 (1.3%) |
| No Fuel Used | 0 (0.0%) | 0 (0.0%) |
| Total | 598 (100.0%) | 227 (100.0%) |
Household Vehicle Usage in Eyota
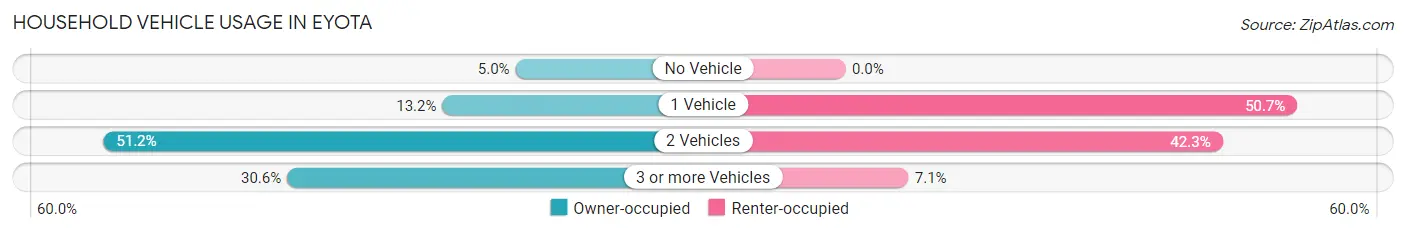
| Vehicles per Household | Owner-occupied | Renter-occupied |
| No Vehicle | 30 (5.0%) | 0 (0.0%) |
| 1 Vehicle | 79 (13.2%) | 115 (50.7%) |
| 2 Vehicles | 306 (51.2%) | 96 (42.3%) |
| 3 or more Vehicles | 183 (30.6%) | 16 (7.0%) |
| Total | 598 (100.0%) | 227 (100.0%) |
Real Estate & Mortgages in Eyota
Real Estate and Mortgage Overview in Eyota
| Characteristic | Without Mortgage | With Mortgage |
| Housing Units | 184 | 414 |
| Median Property Value | $263,500 | $243,600 |
| Median Household Income | $86,875 | $91 |
| Monthly Housing Costs | $660 | $3 |
| Real Estate Taxes | $2,901 | $0 |
Property Value by Mortgage Status in Eyota
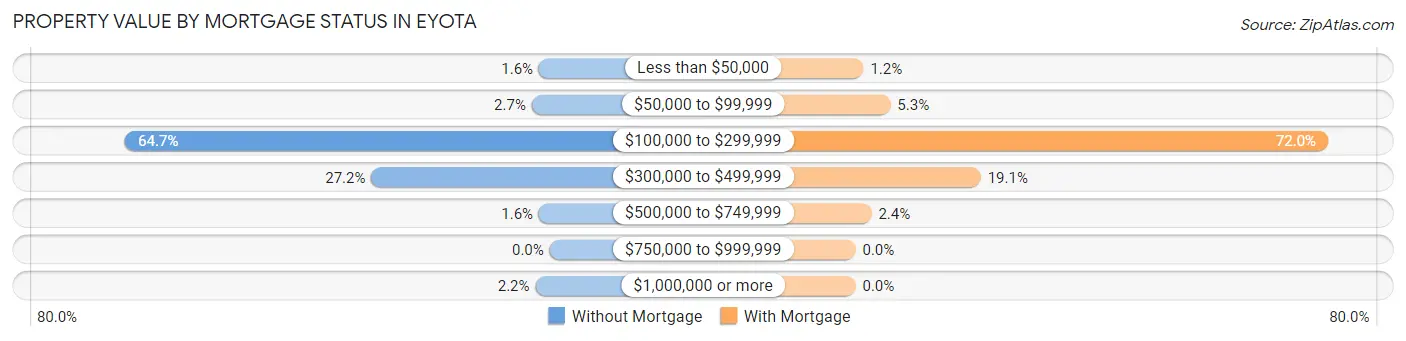
| Property Value | Without Mortgage | With Mortgage |
| Less than $50,000 | 3 (1.6%) | 5 (1.2%) |
| $50,000 to $99,999 | 5 (2.7%) | 22 (5.3%) |
| $100,000 to $299,999 | 119 (64.7%) | 298 (72.0%) |
| $300,000 to $499,999 | 50 (27.2%) | 79 (19.1%) |
| $500,000 to $749,999 | 3 (1.6%) | 10 (2.4%) |
| $750,000 to $999,999 | 0 (0.0%) | 0 (0.0%) |
| $1,000,000 or more | 4 (2.2%) | 0 (0.0%) |
| Total | 184 (100.0%) | 414 (100.0%) |
Household Income by Mortgage Status in Eyota
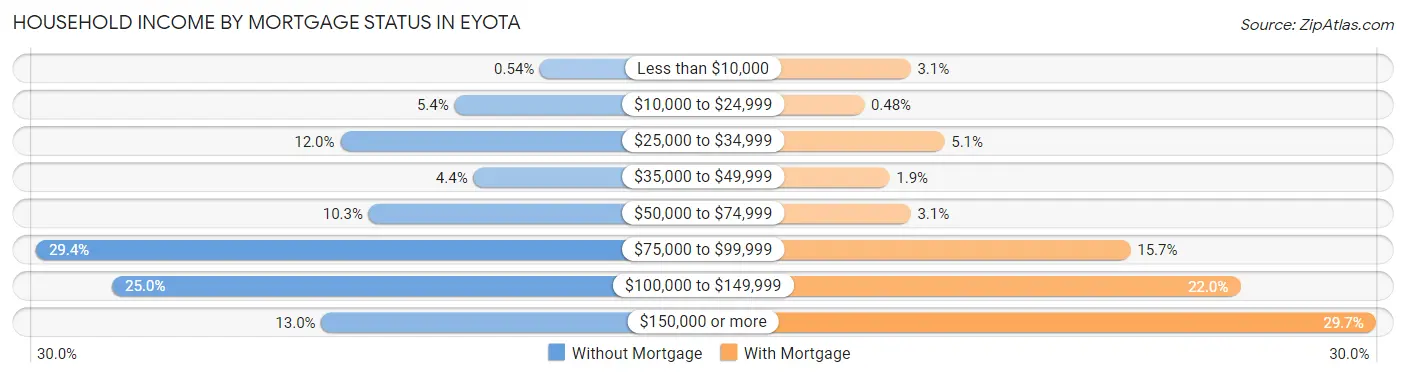
| Household Income | Without Mortgage | With Mortgage |
| Less than $10,000 | 1 (0.5%) | 13 (3.1%) |
| $10,000 to $24,999 | 10 (5.4%) | 2 (0.5%) |
| $25,000 to $34,999 | 22 (12.0%) | 21 (5.1%) |
| $35,000 to $49,999 | 8 (4.3%) | 8 (1.9%) |
| $50,000 to $74,999 | 19 (10.3%) | 13 (3.1%) |
| $75,000 to $99,999 | 54 (29.3%) | 65 (15.7%) |
| $100,000 to $149,999 | 46 (25.0%) | 91 (22.0%) |
| $150,000 or more | 24 (13.0%) | 123 (29.7%) |
| Total | 184 (100.0%) | 414 (100.0%) |
Property Value to Household Income Ratio in Eyota
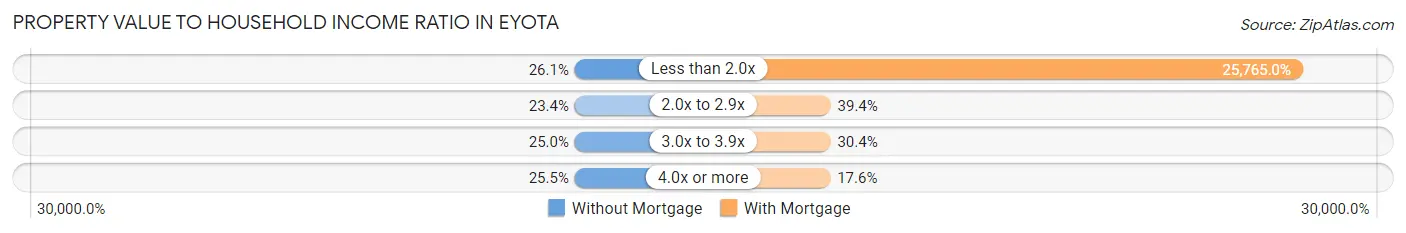
| Value-to-Income Ratio | Without Mortgage | With Mortgage |
| Less than 2.0x | 48 (26.1%) | 106,667 (25,765.0%) |
| 2.0x to 2.9x | 43 (23.4%) | 163 (39.4%) |
| 3.0x to 3.9x | 46 (25.0%) | 126 (30.4%) |
| 4.0x or more | 47 (25.5%) | 73 (17.6%) |
| Total | 184 (100.0%) | 414 (100.0%) |
Real Estate Taxes by Mortgage Status in Eyota
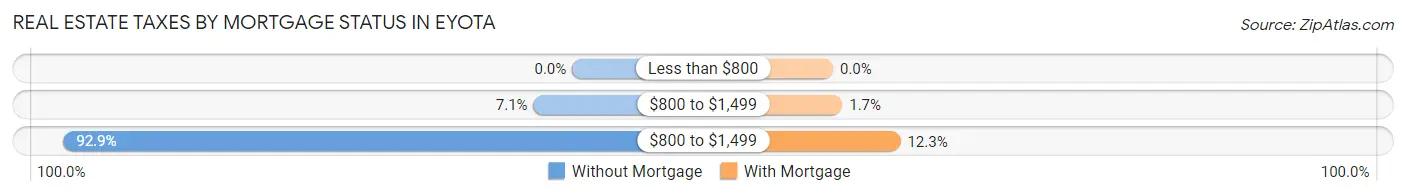
| Property Taxes | Without Mortgage | With Mortgage |
| Less than $800 | 0 (0.0%) | 0 (0.0%) |
| $800 to $1,499 | 13 (7.1%) | 7 (1.7%) |
| $800 to $1,499 | 171 (92.9%) | 51 (12.3%) |
| Total | 184 (100.0%) | 414 (100.0%) |
Health & Disability in Eyota
Health Insurance Coverage by Age in Eyota
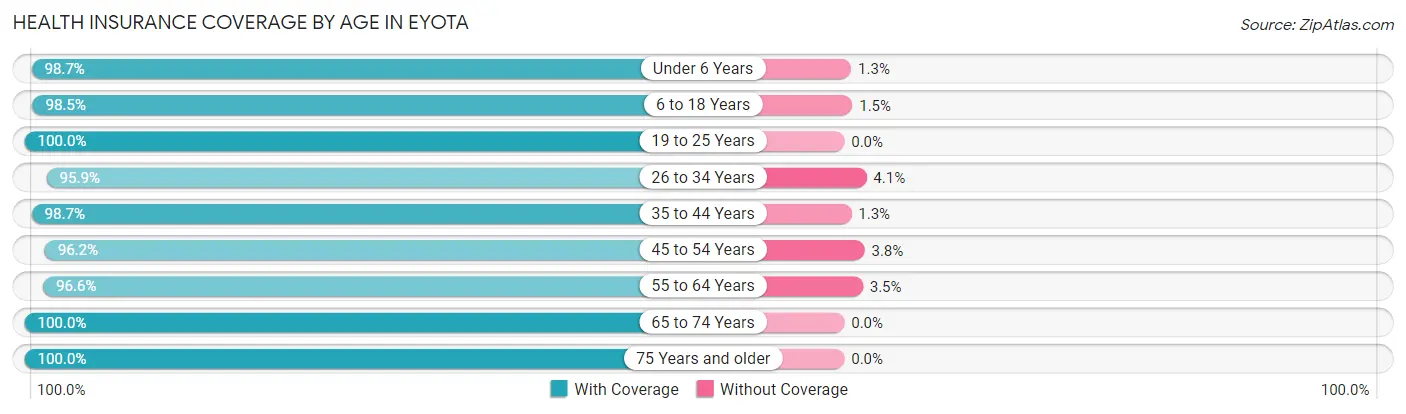
| Age Bracket | With Coverage | Without Coverage |
| Under 6 Years | 232 (98.7%) | 3 (1.3%) |
| 6 to 18 Years | 396 (98.5%) | 6 (1.5%) |
| 19 to 25 Years | 198 (100.0%) | 0 (0.0%) |
| 26 to 34 Years | 186 (95.9%) | 8 (4.1%) |
| 35 to 44 Years | 299 (98.7%) | 4 (1.3%) |
| 45 to 54 Years | 204 (96.2%) | 8 (3.8%) |
| 55 to 64 Years | 196 (96.6%) | 7 (3.5%) |
| 65 to 74 Years | 199 (100.0%) | 0 (0.0%) |
| 75 Years and older | 120 (100.0%) | 0 (0.0%) |
| Total | 2,030 (98.3%) | 36 (1.7%) |
Health Insurance Coverage by Citizenship Status in Eyota
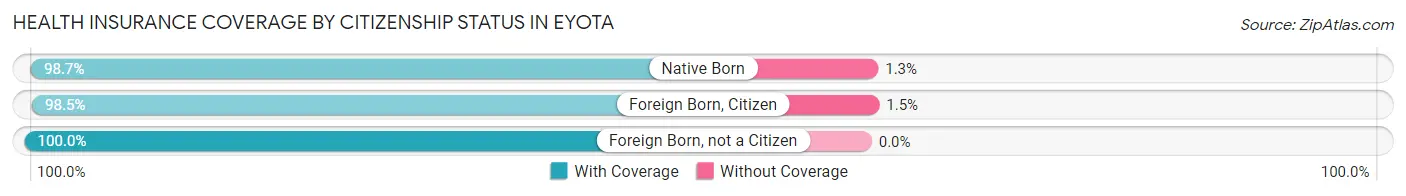
| Citizenship Status | With Coverage | Without Coverage |
| Native Born | 232 (98.7%) | 3 (1.3%) |
| Foreign Born, Citizen | 396 (98.5%) | 6 (1.5%) |
| Foreign Born, not a Citizen | 198 (100.0%) | 0 (0.0%) |
Health Insurance Coverage by Household Income in Eyota
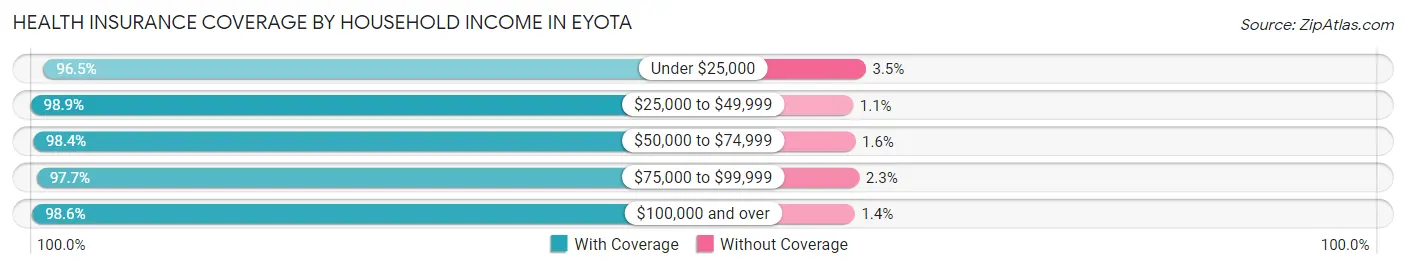
| Household Income | With Coverage | Without Coverage |
| Under $25,000 | 110 (96.5%) | 4 (3.5%) |
| $25,000 to $49,999 | 87 (98.9%) | 1 (1.1%) |
| $50,000 to $74,999 | 378 (98.4%) | 6 (1.6%) |
| $75,000 to $99,999 | 431 (97.7%) | 10 (2.3%) |
| $100,000 and over | 1,024 (98.6%) | 15 (1.4%) |
Public vs Private Health Insurance Coverage by Age in Eyota
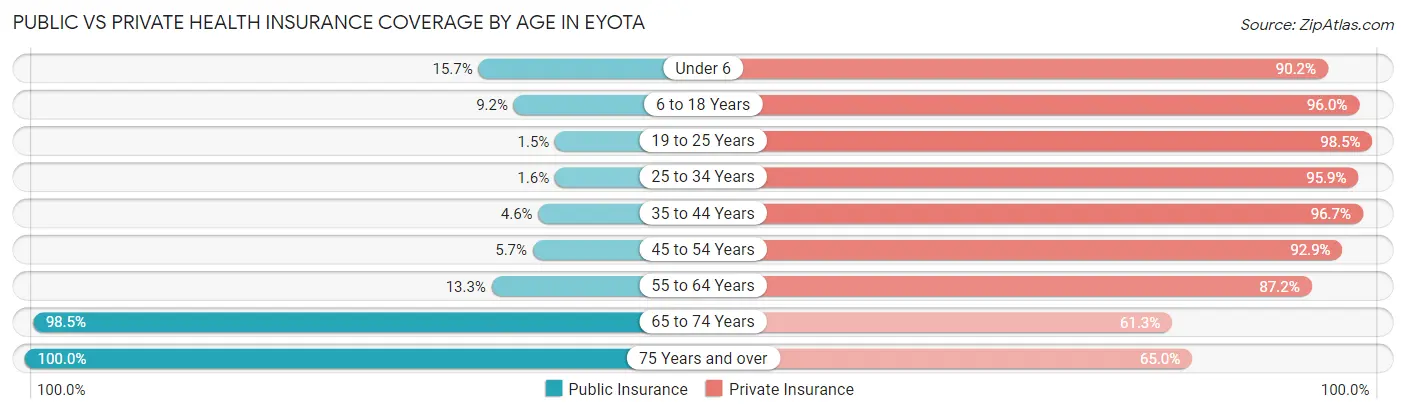
| Age Bracket | Public Insurance | Private Insurance |
| Under 6 | 37 (15.7%) | 212 (90.2%) |
| 6 to 18 Years | 37 (9.2%) | 386 (96.0%) |
| 19 to 25 Years | 3 (1.5%) | 195 (98.5%) |
| 25 to 34 Years | 3 (1.5%) | 186 (95.9%) |
| 35 to 44 Years | 14 (4.6%) | 293 (96.7%) |
| 45 to 54 Years | 12 (5.7%) | 197 (92.9%) |
| 55 to 64 Years | 27 (13.3%) | 177 (87.2%) |
| 65 to 74 Years | 196 (98.5%) | 122 (61.3%) |
| 75 Years and over | 120 (100.0%) | 78 (65.0%) |
| Total | 449 (21.7%) | 1,846 (89.3%) |
Disability Status by Sex by Age in Eyota
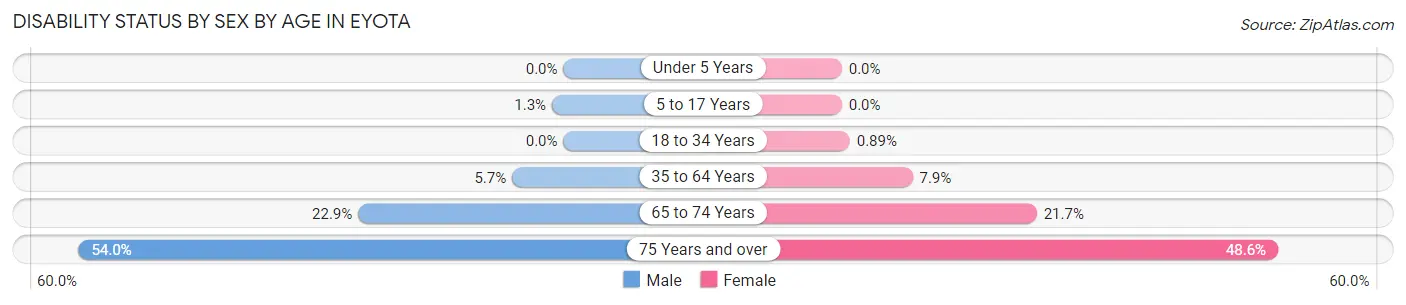
| Age Bracket | Male | Female |
| Under 5 Years | 0 (0.0%) | 0 (0.0%) |
| 5 to 17 Years | 3 (1.3%) | 0 (0.0%) |
| 18 to 34 Years | 0 (0.0%) | 2 (0.9%) |
| 35 to 64 Years | 20 (5.7%) | 29 (7.9%) |
| 65 to 74 Years | 16 (22.9%) | 28 (21.7%) |
| 75 Years and over | 27 (54.0%) | 34 (48.6%) |
Disability Class by Sex by Age in Eyota
Disability Class: Hearing Difficulty
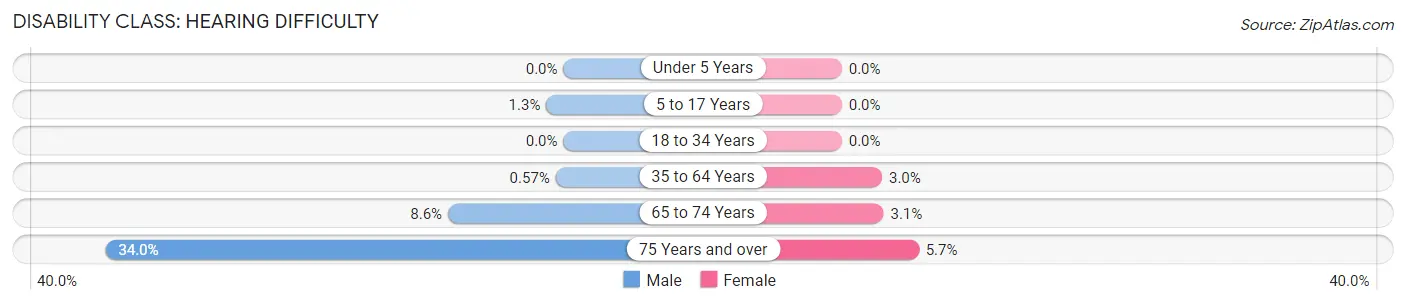
| Age Bracket | Male | Female |
| Under 5 Years | 0 (0.0%) | 0 (0.0%) |
| 5 to 17 Years | 3 (1.3%) | 0 (0.0%) |
| 18 to 34 Years | 0 (0.0%) | 0 (0.0%) |
| 35 to 64 Years | 2 (0.6%) | 11 (3.0%) |
| 65 to 74 Years | 6 (8.6%) | 4 (3.1%) |
| 75 Years and over | 17 (34.0%) | 4 (5.7%) |
Disability Class: Vision Difficulty

| Age Bracket | Male | Female |
| Under 5 Years | 0 (0.0%) | 0 (0.0%) |
| 5 to 17 Years | 0 (0.0%) | 0 (0.0%) |
| 18 to 34 Years | 0 (0.0%) | 0 (0.0%) |
| 35 to 64 Years | 1 (0.3%) | 0 (0.0%) |
| 65 to 74 Years | 0 (0.0%) | 19 (14.7%) |
| 75 Years and over | 3 (6.0%) | 4 (5.7%) |
Disability Class: Cognitive Difficulty
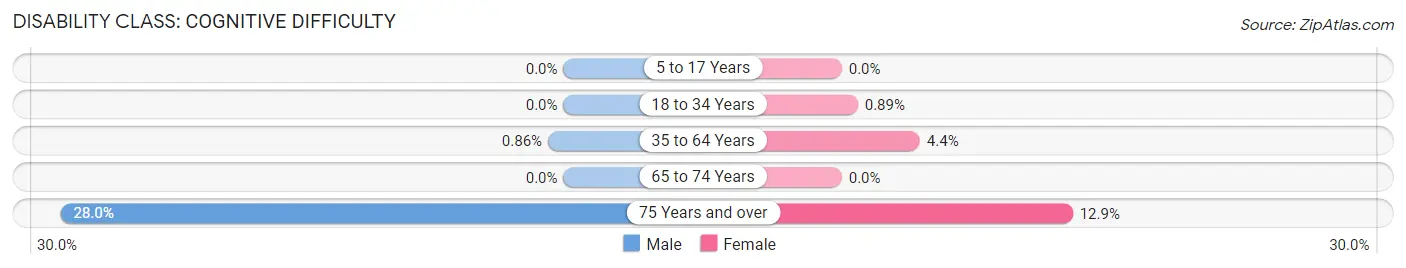
| Age Bracket | Male | Female |
| 5 to 17 Years | 0 (0.0%) | 0 (0.0%) |
| 18 to 34 Years | 0 (0.0%) | 2 (0.9%) |
| 35 to 64 Years | 3 (0.9%) | 16 (4.3%) |
| 65 to 74 Years | 0 (0.0%) | 0 (0.0%) |
| 75 Years and over | 14 (28.0%) | 9 (12.9%) |
Disability Class: Ambulatory Difficulty
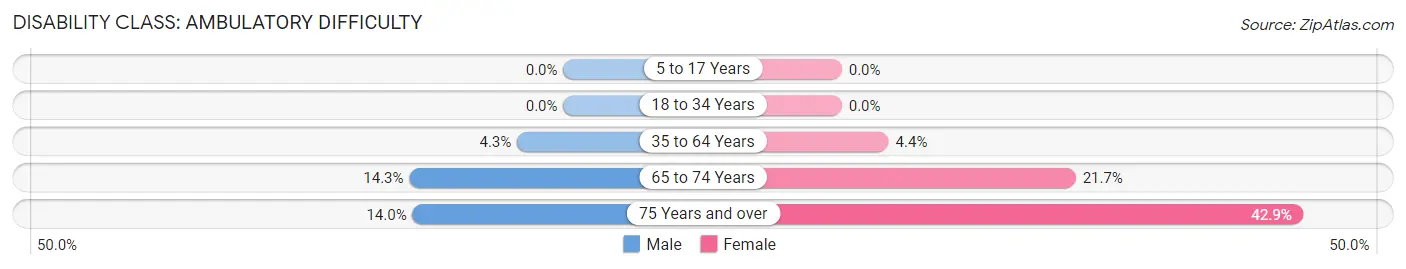
| Age Bracket | Male | Female |
| 5 to 17 Years | 0 (0.0%) | 0 (0.0%) |
| 18 to 34 Years | 0 (0.0%) | 0 (0.0%) |
| 35 to 64 Years | 15 (4.3%) | 16 (4.3%) |
| 65 to 74 Years | 10 (14.3%) | 28 (21.7%) |
| 75 Years and over | 7 (14.0%) | 30 (42.9%) |
Disability Class: Self-Care Difficulty

| Age Bracket | Male | Female |
| 5 to 17 Years | 0 (0.0%) | 0 (0.0%) |
| 18 to 34 Years | 0 (0.0%) | 0 (0.0%) |
| 35 to 64 Years | 3 (0.9%) | 3 (0.8%) |
| 65 to 74 Years | 0 (0.0%) | 5 (3.9%) |
| 75 Years and over | 0 (0.0%) | 9 (12.9%) |
Technology Access in Eyota
Computing Device Access in Eyota
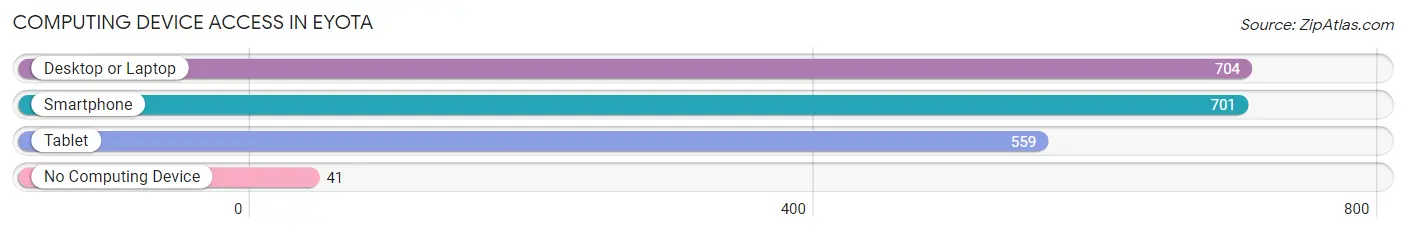
| Device Type | # Households | % Households |
| Desktop or Laptop | 704 | 85.3% |
| Smartphone | 701 | 85.0% |
| Tablet | 559 | 67.8% |
| No Computing Device | 41 | 5.0% |
| Total | 825 | 100.0% |
Internet Access in Eyota
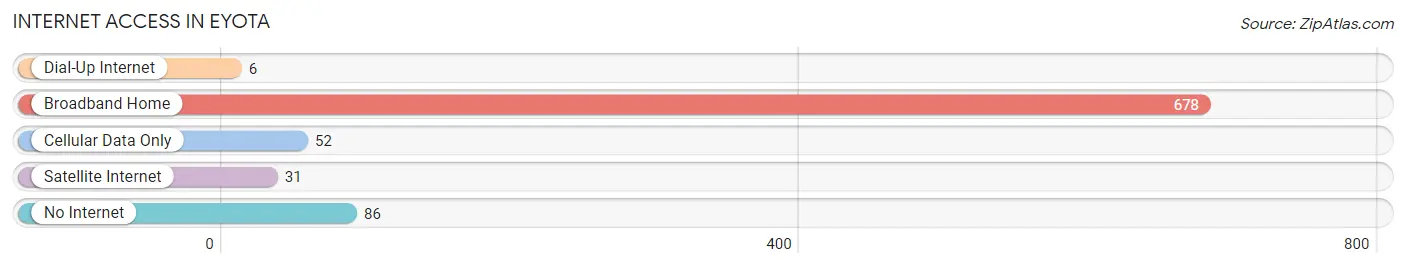
| Internet Type | # Households | % Households |
| Dial-Up Internet | 6 | 0.7% |
| Broadband Home | 678 | 82.2% |
| Cellular Data Only | 52 | 6.3% |
| Satellite Internet | 31 | 3.8% |
| No Internet | 86 | 10.4% |
| Total | 825 | 100.0% |
Eyota Summary
Eyota, Minnesota is a small city located in Olmsted County, in the southeastern corner of the state. It is situated on the banks of the Zumbro River, and is part of the Rochester Metropolitan Statistical Area. The city has a population of 1,845, according to the 2010 census, and is the smallest city in Olmsted County.
History
The area that is now Eyota was first settled in 1854 by a group of settlers from New York. The settlers named the area after the Greek goddess of the dawn, Eos. The first post office was established in 1856, and the city was officially incorporated in 1876.
The city was originally a farming community, and the main crops were wheat, oats, and corn. In the late 19th century, the city began to grow as a result of the railroad, which connected it to the larger cities of Rochester and Winona.
Geography
Eyota is located in southeastern Minnesota, in Olmsted County. It is situated on the banks of the Zumbro River, and is part of the Rochester Metropolitan Statistical Area. The city has a total area of 1.2 square miles, all of which is land.
The city is located in a hilly region, with the highest point being the summit of a hill located in the northwest corner of the city. The city is located in a temperate climate, with hot summers and cold winters.
Economy
Eyota’s economy is largely based on agriculture, with the main crops being wheat, oats, and corn. The city also has a number of small businesses, including a grocery store, a hardware store, and a few restaurants.
The city is also home to a number of manufacturing companies, including a plastics manufacturer, a metal fabricator, and a printing company. The city is also home to a number of small technology companies, including a software development firm and a web design firm.
Demographics
According to the 2010 census, the population of Eyota was 1,845. The racial makeup of the city was 97.2% White, 0.7% African American, 0.3% Native American, 0.3% Asian, 0.2% from other races, and 1.5% from two or more races. Hispanic or Latino of any race were 1.2% of the population.
The median income for a household in the city was $50,938, and the median income for a family was $60,000. The per capita income for the city was $22,845. About 5.2% of families and 6.7% of the population were below the poverty line, including 8.2% of those under age 18 and 4.2% of those age 65 or over.
Eyota is a small city with a rich history and a diverse economy. It is home to a number of small businesses, manufacturing companies, and technology firms, and is a great place to live and work.
Common Questions
What is the Total Population of Eyota?
Total Population of Eyota is 2,090.
What is the Total Male Population of Eyota?
Total Male Population of Eyota is 967.
What is the Total Female Population of Eyota?
Total Female Population of Eyota is 1,123.
What is the Ratio of Males per 100 Females in Eyota?
There are 86.11 Males per 100 Females in Eyota.
What is the Ratio of Females per 100 Males in Eyota?
There are 116.13 Females per 100 Males in Eyota.
What is the Median Population Age in Eyota?
Median Population Age in Eyota is 35.5 Years.
What is the Average Family Size in Eyota
Average Family Size in Eyota is 3.1 People.
What is the Average Household Size in Eyota
Average Household Size in Eyota is 2.5 People.
What is Per Capita Income in Eyota?
Per Capita income in Eyota is $37,774.
What is the Median Family Income in Eyota?
Median Family Income in Eyota is $97,321.
What is the Median Household income in Eyota?
Median Household Income in Eyota is $81,103.
What is Income or Wage Gap in Eyota?
Income or Wage Gap in Eyota is 29.0%.
Women in Eyota earn 71.0 cents for every dollar earned by a man.
What is Inequality or Gini Index in Eyota?
Inequality or Gini Index in Eyota is 0.40.
How Large is the Labor Force in Eyota?
There are 1,085 People in the Labor Forcein in Eyota.
What is the Percentage of People in the Labor Force in Eyota?
70.7% of People are in the Labor Force in Eyota.
What is the Unemployment Rate in Eyota?
Unemployment Rate in Eyota is 1.8%.