Cities with the Highest Percentage of Population Employed in Office & Administration in New Mexico
RELATED REPORTS & OPTIONS
Office & Administration
New Mexico
Compare Cities
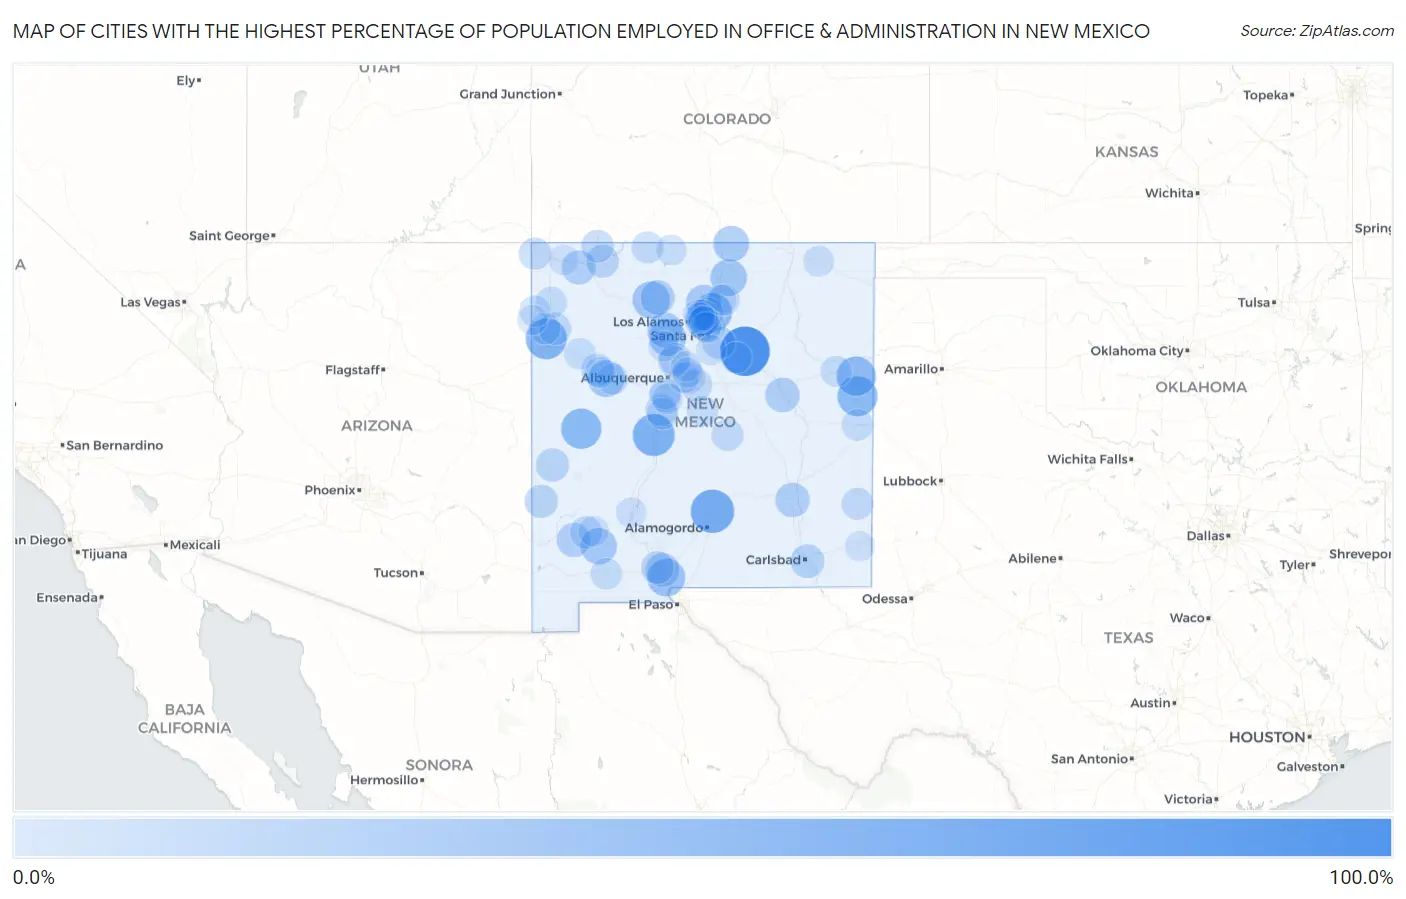
Map of Cities with the Highest Percentage of Population Employed in Office & Administration in New Mexico
0.0%
100.0%
Cities with the Highest Percentage of Population Employed in Office & Administration in New Mexico
| City | % Employed | vs State | vs National | |
| 1. | Tecolote | 100.0% | 11.2%(+88.8)#1 | 10.9%(+89.1)#34 |
| 2. | Redrock | 100.0% | 11.2%(+88.8)#2 | 10.9%(+89.1)#40 |
| 3. | Stanley | 84.6% | 11.2%(+73.5)#3 | 10.9%(+73.8)#58 |
| 4. | Bent | 72.0% | 11.2%(+60.9)#4 | 10.9%(+61.2)#78 |
| 5. | Golden Acres | 70.4% | 11.2%(+59.2)#5 | 10.9%(+59.6)#85 |
| 6. | San Acacia | 65.7% | 11.2%(+54.5)#6 | 10.9%(+54.9)#105 |
| 7. | Yah Ta Hey | 61.0% | 11.2%(+49.9)#7 | 10.9%(+50.2)#122 |
| 8. | Pie Town | 57.9% | 11.2%(+46.7)#8 | 10.9%(+47.0)#136 |
| 9. | Grady | 57.1% | 11.2%(+46.0)#9 | 10.9%(+46.3)#142 |
| 10. | San Jon | 54.3% | 11.2%(+43.2)#10 | 10.9%(+43.5)#168 |
| 11. | Cordova | 53.2% | 11.2%(+42.0)#11 | 10.9%(+42.3)#179 |
| 12. | Mount Taylor | 53.1% | 11.2%(+42.0)#12 | 10.9%(+42.3)#180 |
| 13. | Butterfield Park | 51.7% | 11.2%(+40.5)#13 | 10.9%(+40.8)#192 |
| 14. | Mesquite | 47.8% | 11.2%(+36.6)#14 | 10.9%(+36.9)#250 |
| 15. | Regina | 45.0% | 11.2%(+33.8)#15 | 10.9%(+34.1)#294 |
| 16. | Ponderosa | 43.3% | 11.2%(+32.1)#16 | 10.9%(+32.4)#328 |
| 17. | Anzac Village | 42.1% | 11.2%(+30.9)#17 | 10.9%(+31.2)#358 |
| 18. | Arroyo Seco | 41.8% | 11.2%(+30.6)#18 | 10.9%(+31.0)#368 |
| 19. | Faywood | 40.0% | 11.2%(+28.8)#19 | 10.9%(+29.1)#417 |
| 20. | Costilla | 38.2% | 11.2%(+27.1)#20 | 10.9%(+27.4)#463 |
| 21. | Tortugas | 36.7% | 11.2%(+25.5)#21 | 10.9%(+25.8)#504 |
| 22. | Lyden | 36.5% | 11.2%(+25.4)#22 | 10.9%(+25.7)#515 |
| 23. | Jemez Springs | 36.5% | 11.2%(+25.3)#23 | 10.9%(+25.6)#518 |
| 24. | Puerto De Luna | 33.0% | 11.2%(+21.9)#24 | 10.9%(+22.2)#693 |
| 25. | Canones | 32.8% | 11.2%(+21.6)#25 | 10.9%(+21.9)#702 |
| 26. | Midway | 32.6% | 11.2%(+21.4)#26 | 10.9%(+21.8)#705 |
| 27. | Gallina | 32.6% | 11.2%(+21.4)#27 | 10.9%(+21.8)#707 |
| 28. | Tyrone | 31.5% | 11.2%(+20.4)#28 | 10.9%(+20.7)#762 |
| 29. | Broadview | 31.1% | 11.2%(+19.9)#29 | 10.9%(+20.3)#780 |
| 30. | University Park | 31.0% | 11.2%(+19.8)#30 | 10.9%(+20.1)#783 |
| 31. | Napi Headquarters | 30.9% | 11.2%(+19.7)#31 | 10.9%(+20.1)#791 |
| 32. | Lindrith | 29.9% | 11.2%(+18.7)#32 | 10.9%(+19.1)#855 |
| 33. | Livingston Wheeler | 29.6% | 11.2%(+18.5)#33 | 10.9%(+18.8)#869 |
| 34. | Cuyamungue Grant | 28.0% | 11.2%(+16.9)#34 | 10.9%(+17.2)#999 |
| 35. | Totah Vista | 27.4% | 11.2%(+16.2)#35 | 10.9%(+16.5)#1,070 |
| 36. | Glorieta | 27.4% | 11.2%(+16.2)#36 | 10.9%(+16.5)#1,071 |
| 37. | Pleasanton | 27.0% | 11.2%(+15.9)#37 | 10.9%(+16.2)#1,101 |
| 38. | Cruzville | 27.0% | 11.2%(+15.8)#38 | 10.9%(+16.1)#1,106 |
| 39. | Middle Mesa | 25.8% | 11.2%(+14.7)#39 | 10.9%(+15.0)#1,215 |
| 40. | Blanco | 25.6% | 11.2%(+14.4)#40 | 10.9%(+14.7)#1,243 |
| 41. | Fairacres | 25.5% | 11.2%(+14.3)#41 | 10.9%(+14.6)#1,261 |
| 42. | Cedar Hill | 25.0% | 11.2%(+13.8)#42 | 10.9%(+14.1)#1,298 |
| 43. | Chimayo | 24.6% | 11.2%(+13.4)#43 | 10.9%(+13.7)#1,386 |
| 44. | Milan | 23.8% | 11.2%(+12.6)#44 | 10.9%(+12.9)#1,497 |
| 45. | Brimhall Nizhoni | 23.7% | 11.2%(+12.5)#45 | 10.9%(+12.9)#1,508 |
| 46. | Gamerco | 23.6% | 11.2%(+12.5)#46 | 10.9%(+12.8)#1,529 |
| 47. | Hanover | 23.5% | 11.2%(+12.4)#47 | 10.9%(+12.7)#1,548 |
| 48. | Cuyamungue | 23.3% | 11.2%(+12.2)#48 | 10.9%(+12.5)#1,573 |
| 49. | Jaconita | 23.2% | 11.2%(+12.1)#49 | 10.9%(+12.4)#1,599 |
| 50. | Sedillo | 23.0% | 11.2%(+11.8)#50 | 10.9%(+12.1)#1,633 |
| 51. | Beclabito | 22.8% | 11.2%(+11.7)#51 | 10.9%(+12.0)#1,668 |
| 52. | Canada De Los Alamos | 22.5% | 11.2%(+11.3)#52 | 10.9%(+11.6)#1,739 |
| 53. | Borrego Pass | 22.2% | 11.2%(+11.1)#53 | 10.9%(+11.4)#1,799 |
| 54. | Corona | 22.2% | 11.2%(+11.1)#54 | 10.9%(+11.4)#1,802 |
| 55. | Indian Hills | 22.0% | 11.2%(+10.8)#55 | 10.9%(+11.1)#1,853 |
| 56. | Dulce | 21.9% | 11.2%(+10.8)#56 | 10.9%(+11.1)#1,861 |
| 57. | Tatum | 21.6% | 11.2%(+10.4)#57 | 10.9%(+10.7)#1,937 |
| 58. | Santa Ana Pueblo | 21.5% | 11.2%(+10.4)#58 | 10.9%(+10.7)#1,953 |
| 59. | Jarales | 21.4% | 11.2%(+10.2)#59 | 10.9%(+10.6)#1,998 |
| 60. | Vadito | 20.9% | 11.2%(+9.78)#60 | 10.9%(+10.1)#2,112 |
| 61. | Casas Adobes | 20.6% | 11.2%(+9.47)#61 | 10.9%(+9.78)#2,210 |
| 62. | Acomita Lake | 20.4% | 11.2%(+9.27)#62 | 10.9%(+9.57)#2,271 |
| 63. | La Hacienda | 20.3% | 11.2%(+9.14)#63 | 10.9%(+9.44)#2,306 |
| 64. | Chupadero | 20.2% | 11.2%(+9.05)#64 | 10.9%(+9.36)#2,333 |
| 65. | Cannon Afb | 20.1% | 11.2%(+8.92)#65 | 10.9%(+9.23)#2,378 |
| 66. | Santa Clara Pueblo | 20.1% | 11.2%(+8.90)#66 | 10.9%(+9.21)#2,384 |
| 67. | Sheep Springs | 19.8% | 11.2%(+8.64)#67 | 10.9%(+8.95)#2,501 |
| 68. | Bernalillo | 19.7% | 11.2%(+8.50)#68 | 10.9%(+8.81)#2,543 |
| 69. | Valencia | 19.5% | 11.2%(+8.37)#69 | 10.9%(+8.68)#2,598 |
| 70. | Thoreau | 19.3% | 11.2%(+8.10)#70 | 10.9%(+8.41)#2,691 |
| 71. | Nakaibito | 19.1% | 11.2%(+7.95)#71 | 10.9%(+8.26)#2,755 |
| 72. | Ribera | 19.0% | 11.2%(+7.88)#72 | 10.9%(+8.19)#2,779 |
| 73. | Crystal | 19.0% | 11.2%(+7.84)#73 | 10.9%(+8.14)#2,805 |
| 74. | Casa Colorada | 18.8% | 11.2%(+7.63)#74 | 10.9%(+7.94)#2,915 |
| 75. | Tucumcari | 18.5% | 11.2%(+7.30)#75 | 10.9%(+7.61)#3,098 |
| 76. | Willard | 18.4% | 11.2%(+7.24)#76 | 10.9%(+7.54)#3,132 |
| 77. | Grants | 18.2% | 11.2%(+7.03)#77 | 10.9%(+7.34)#3,218 |
| 78. | Bosque Farms | 17.7% | 11.2%(+6.51)#78 | 10.9%(+6.82)#3,521 |
| 79. | Sombrillo | 17.5% | 11.2%(+6.34)#79 | 10.9%(+6.64)#3,637 |
| 80. | Chama | 16.8% | 11.2%(+5.62)#80 | 10.9%(+5.92)#4,119 |
| 81. | Capulin | 16.7% | 11.2%(+5.50)#81 | 10.9%(+5.81)#4,226 |
| 82. | El Cerro Mission | 16.6% | 11.2%(+5.44)#82 | 10.9%(+5.75)#4,261 |
| 83. | Tijeras | 16.3% | 11.2%(+5.12)#83 | 10.9%(+5.43)#4,515 |
| 84. | La Madera | 16.3% | 11.2%(+5.11)#84 | 10.9%(+5.42)#4,526 |
| 85. | San Antonito Cdp Bernalillo County | 16.2% | 11.2%(+5.07)#85 | 10.9%(+5.38)#4,567 |
| 86. | Tesuque Pueblo | 16.2% | 11.2%(+5.00)#86 | 10.9%(+5.31)#4,630 |
| 87. | Picuris Pueblo | 16.1% | 11.2%(+4.96)#87 | 10.9%(+5.27)#4,663 |
| 88. | Zia Pueblo | 16.1% | 11.2%(+4.96)#88 | 10.9%(+5.26)#4,666 |
| 89. | Williamsburg | 15.7% | 11.2%(+4.52)#89 | 10.9%(+4.83)#5,098 |
| 90. | San Jose Cdp Rio Arriba County | 15.6% | 11.2%(+4.43)#90 | 10.9%(+4.74)#5,194 |
| 91. | Mimbres | 15.6% | 11.2%(+4.43)#91 | 10.9%(+4.74)#5,195 |
| 92. | Pojoaque | 15.5% | 11.2%(+4.32)#92 | 10.9%(+4.63)#5,319 |
| 93. | Bluewater | 15.5% | 11.2%(+4.31)#93 | 10.9%(+4.62)#5,329 |
| 94. | Sandia Knolls | 15.3% | 11.2%(+4.15)#94 | 10.9%(+4.46)#5,527 |
| 95. | Becenti | 15.2% | 11.2%(+3.99)#95 | 10.9%(+4.30)#5,692 |
| 96. | Waterflow | 14.9% | 11.2%(+3.78)#96 | 10.9%(+4.09)#5,934 |
| 97. | La Mesilla | 14.9% | 11.2%(+3.75)#97 | 10.9%(+4.06)#5,965 |
| 98. | Navajo | 14.7% | 11.2%(+3.49)#98 | 10.9%(+3.80)#6,292 |
| 99. | Monument | 14.5% | 11.2%(+3.35)#99 | 10.9%(+3.66)#6,491 |
| 100. | Lamy | 14.4% | 11.2%(+3.26)#100 | 10.9%(+3.57)#6,623 |
Common Questions
What are the Top 10 Cities with the Highest Percentage of Population Employed in Office & Administration in New Mexico?
Top 10 Cities with the Highest Percentage of Population Employed in Office & Administration in New Mexico are:
#1
100.0%
#2
72.0%
#3
65.7%
#4
61.0%
#5
57.9%
#6
57.1%
#7
54.3%
#8
53.2%
#9
47.8%
#10
45.0%
What city has the Highest Percentage of Population Employed in Office & Administration in New Mexico?
Tecolote has the Highest Percentage of Population Employed in Office & Administration in New Mexico with 100.0%.
What is the Percentage of Population Employed in Office & Administration in the State of New Mexico?
Percentage of Population Employed in Office & Administration in New Mexico is 11.2%.
What is the Percentage of Population Employed in Office & Administration in the United States?
Percentage of Population Employed in Office & Administration in the United States is 10.9%.