West Roy Lake, MN
West Roy Lake Map
West Roy Lake Overview
43
TOTAL POPULATION
16
MALE POPULATION
27
FEMALE POPULATION
59.26
MALES / 100 FEMALES
168.75
FEMALES / 100 MALES
29.9
MEDIAN AGE
4.6
AVG FAMILY SIZE
3.9
AVG HOUSEHOLD SIZE
$18,416
PER CAPITA INCOME
$94,375
AVG FAMILY INCOME
0.34
INEQUALITY / GINI INDEX
9
LABOR FORCE [ PEOPLE ]
33.3%
PERCENT IN LABOR FORCE
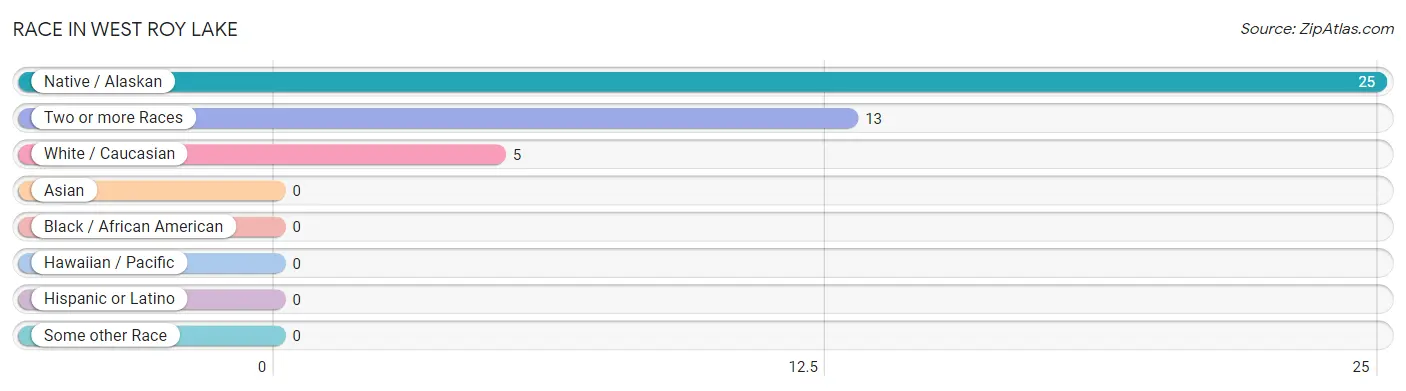
Race in West Roy Lake
The most populous races in West Roy Lake are Native / Alaskan (25 | 58.1%), Two or more Races (13 | 30.2%), and White / Caucasian (5 | 11.6%).
| Race | # Population | % Population |
| Asian | 0 | 0.0% |
| Black / African American | 0 | 0.0% |
| Hawaiian / Pacific | 0 | 0.0% |
| Hispanic or Latino | 0 | 0.0% |
| Native / Alaskan | 25 | 58.1% |
| White / Caucasian | 5 | 11.6% |
| Two or more Races | 13 | 30.2% |
| Some other Race | 0 | 0.0% |
| Total | 43 | 100.0% |
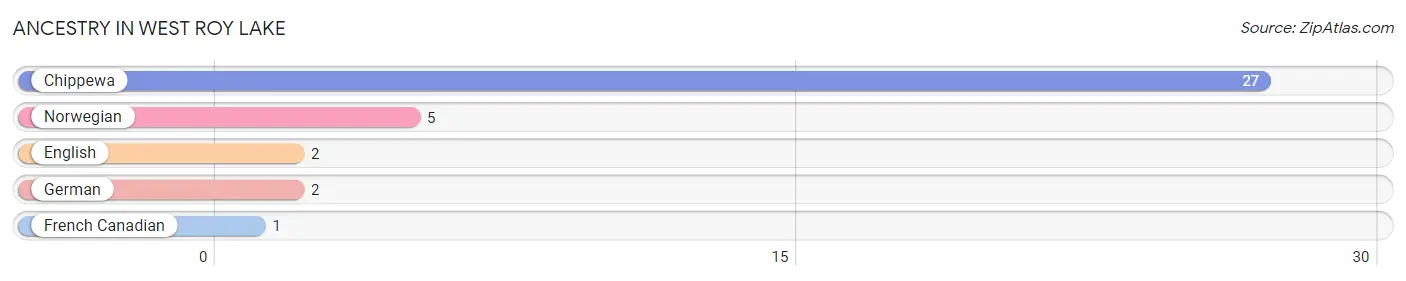
Ancestry in West Roy Lake
The most populous ancestries reported in West Roy Lake are Chippewa (27 | 62.8%), Norwegian (5 | 11.6%), English (2 | 4.6%), German (2 | 4.6%), and French Canadian (1 | 2.3%), together accounting for 86.0% of all West Roy Lake residents.
| Ancestry | # Population | % Population |
| Chippewa | 27 | 62.8% |
| English | 2 | 4.6% |
| French Canadian | 1 | 2.3% |
| German | 2 | 4.6% |
| Norwegian | 5 | 11.6% | View All 5 Rows |
Immigrants in West Roy Lake

| Immigration Origin | # Population | % Population | View All 0 Rows |
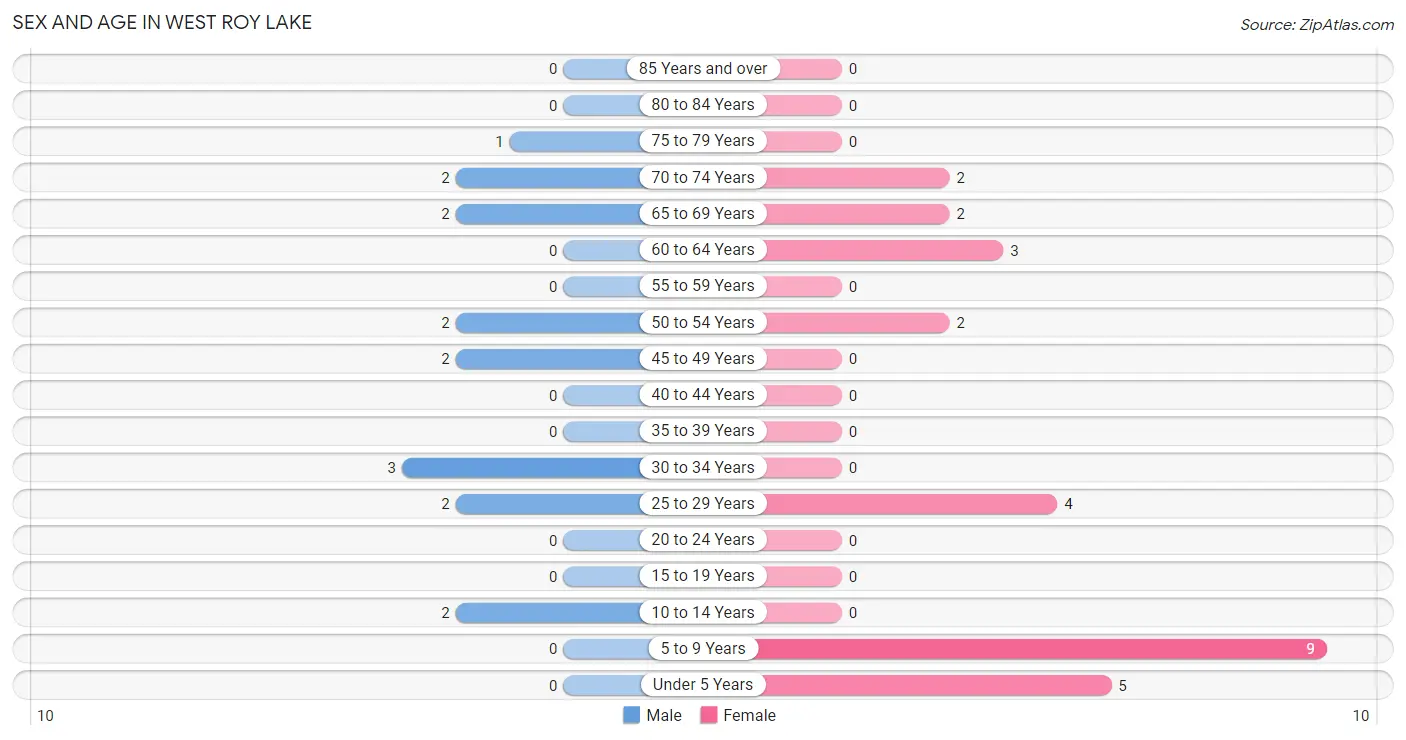
Sex and Age in West Roy Lake
Sex and Age in West Roy Lake
The most populous age groups in West Roy Lake are 30 to 34 Years (3 | 18.8%) for men and 5 to 9 Years (9 | 33.3%) for women.
| Age Bracket | Male | Female |
| Under 5 Years | 0 (0.0%) | 5 (18.5%) |
| 5 to 9 Years | 0 (0.0%) | 9 (33.3%) |
| 10 to 14 Years | 2 (12.5%) | 0 (0.0%) |
| 15 to 19 Years | 0 (0.0%) | 0 (0.0%) |
| 20 to 24 Years | 0 (0.0%) | 0 (0.0%) |
| 25 to 29 Years | 2 (12.5%) | 4 (14.8%) |
| 30 to 34 Years | 3 (18.8%) | 0 (0.0%) |
| 35 to 39 Years | 0 (0.0%) | 0 (0.0%) |
| 40 to 44 Years | 0 (0.0%) | 0 (0.0%) |
| 45 to 49 Years | 2 (12.5%) | 0 (0.0%) |
| 50 to 54 Years | 2 (12.5%) | 2 (7.4%) |
| 55 to 59 Years | 0 (0.0%) | 0 (0.0%) |
| 60 to 64 Years | 0 (0.0%) | 3 (11.1%) |
| 65 to 69 Years | 2 (12.5%) | 2 (7.4%) |
| 70 to 74 Years | 2 (12.5%) | 2 (7.4%) |
| 75 to 79 Years | 1 (6.2%) | 0 (0.0%) |
| 80 to 84 Years | 0 (0.0%) | 0 (0.0%) |
| 85 Years and over | 0 (0.0%) | 0 (0.0%) |
| Total | 16 (100.0%) | 27 (100.0%) |
Families and Households in West Roy Lake
Median Family Size in West Roy Lake
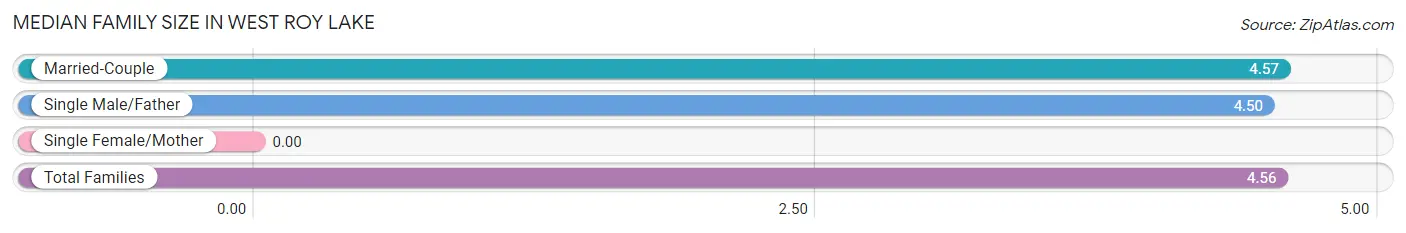
| Family Type | # Families | Family Size |
| Married-Couple | 7 (77.8%) | 4.57 |
| Single Male/Father | 2 (22.2%) | 4.50 |
| Single Female/Mother | 0 (0.0%) | - |
| Total Families | 9 (100.0%) | 4.56 |
Median Household Size in West Roy Lake
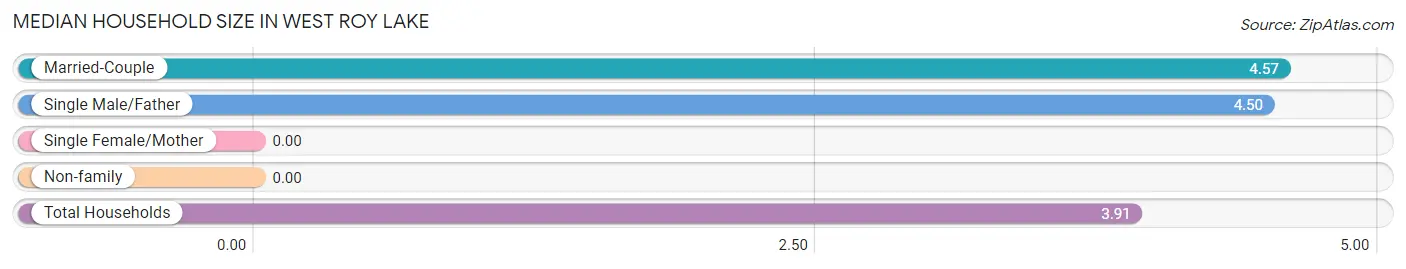
| Household Type | # Households | Household Size |
| Married-Couple | 7 (63.6%) | 4.57 |
| Single Male/Father | 2 (18.2%) | 4.50 |
| Single Female/Mother | 0 (0.0%) | - |
| Non-family | 2 (18.2%) | - |
| Total Households | 11 (100.0%) | 3.91 |
Household Size by Marriage Status in West Roy Lake
Out of a total of 11 households in West Roy Lake, 9 (81.8%) are family households, while 2 (18.2%) are nonfamily households. The most numerous type of family households are 2-person households, comprising 4, and the most common type of nonfamily households are 1-person households, comprising 2.
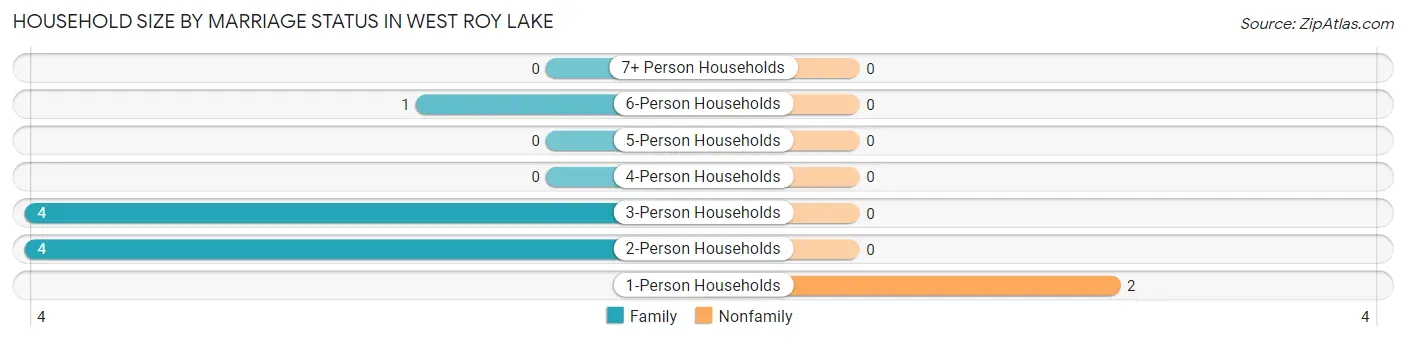
| Household Size | Family Households | Nonfamily Households |
| 1-Person Households | - | 2 (18.2%) |
| 2-Person Households | 4 (36.4%) | 0 (0.0%) |
| 3-Person Households | 4 (36.4%) | 0 (0.0%) |
| 4-Person Households | 0 (0.0%) | 0 (0.0%) |
| 5-Person Households | 0 (0.0%) | 0 (0.0%) |
| 6-Person Households | 1 (9.1%) | 0 (0.0%) |
| 7+ Person Households | 0 (0.0%) | 0 (0.0%) |
| Total | 9 (81.8%) | 2 (18.2%) |
Female Fertility in West Roy Lake
Fertility by Age in West Roy Lake
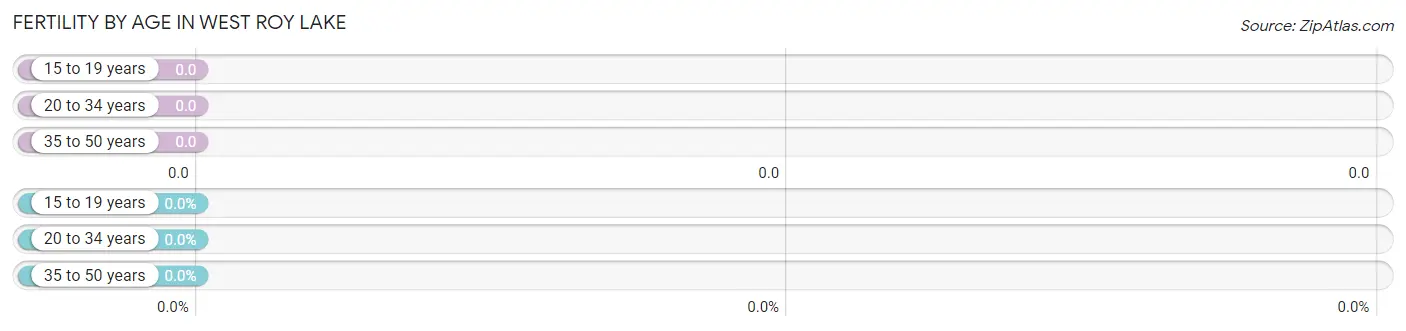
| Age Bracket | Women with Births | Births / 1,000 Women |
| 15 to 19 years | 0 (0.0%) | 0.0 |
| 20 to 34 years | 0 (0.0%) | 0.0 |
| 35 to 50 years | 0 (0.0%) | 0.0 |
| Total | 0 (0.0%) | 0.0 |
Fertility by Age by Marriage Status in West Roy Lake
| Age Bracket | Married | Unmarried |
| 15 to 19 years | 0 (0.0%) | 0 (0.0%) |
| 20 to 34 years | 0 (0.0%) | 0 (0.0%) |
| 35 to 50 years | 0 (0.0%) | 0 (0.0%) |
| Total | 0 (0.0%) | 0 (0.0%) |
Fertility by Education in West Roy Lake
| Educational Attainment | Women with Births | Births / 1,000 Women |
| Less than High School | 0 (0.0%) | 0.0 |
| High School Diploma | 0 (0.0%) | 0.0 |
| College or Associate's Degree | 0 (0.0%) | 0.0 |
| Bachelor's Degree | 0 (0.0%) | 0.0 |
| Graduate Degree | 0 (0.0%) | 0.0 |
| Total | 0 (0.0%) | 0.0 |
Fertility by Education by Marriage Status in West Roy Lake
| Educational Attainment | Married | Unmarried |
| Less than High School | 0 (0.0%) | 0 (0.0%) |
| High School Diploma | 0 (0.0%) | 0 (0.0%) |
| College or Associate's Degree | 0 (0.0%) | 0 (0.0%) |
| Bachelor's Degree | 0 (0.0%) | 0 (0.0%) |
| Graduate Degree | 0 (0.0%) | 0 (0.0%) |
| Total | 0 (0.0%) | 0 (0.0%) |
Income in West Roy Lake
Income Overview in West Roy Lake
| Characteristic | Number | Measure |
| Per Capita Income | 43 | $18,416 |
| Median Family Income | 9 | $94,375 |
| Mean Family Income | 9 | $77,256 |
| Median Household Income | 11 | $0 |
| Mean Household Income | 11 | $65,355 |
| Income Deficit | 9 | $0 |
| Wage / Income Gap (%) | 43 | 0.00% |
| Wage / Income Gap ($) | 43 | 100.00¢ per $1 |
| Gini / Inequality Index | 43 | 0.34 |
Earnings by Sex in West Roy Lake
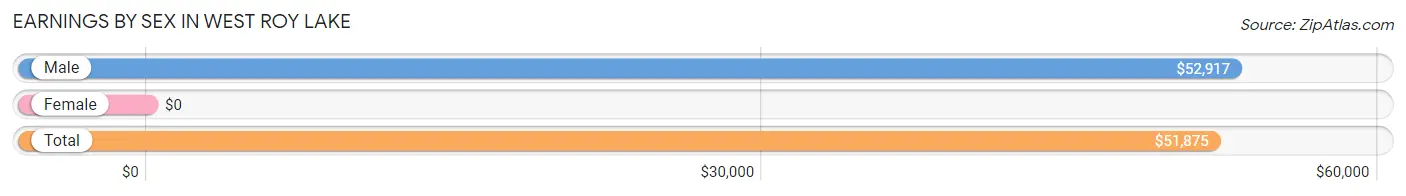
| Sex | Number | Average Earnings |
| Male | 9 (81.8%) | $52,917 |
| Female | 2 (18.2%) | $0 |
| Total | 11 (100.0%) | $51,875 |
Earnings by Sex by Income Bracket in West Roy Lake
The most common earnings brackets in West Roy Lake are $50,000 to $54,999 for men (3 | 33.3%) and $50,000 to $54,999 for women (2 | 100.0%).
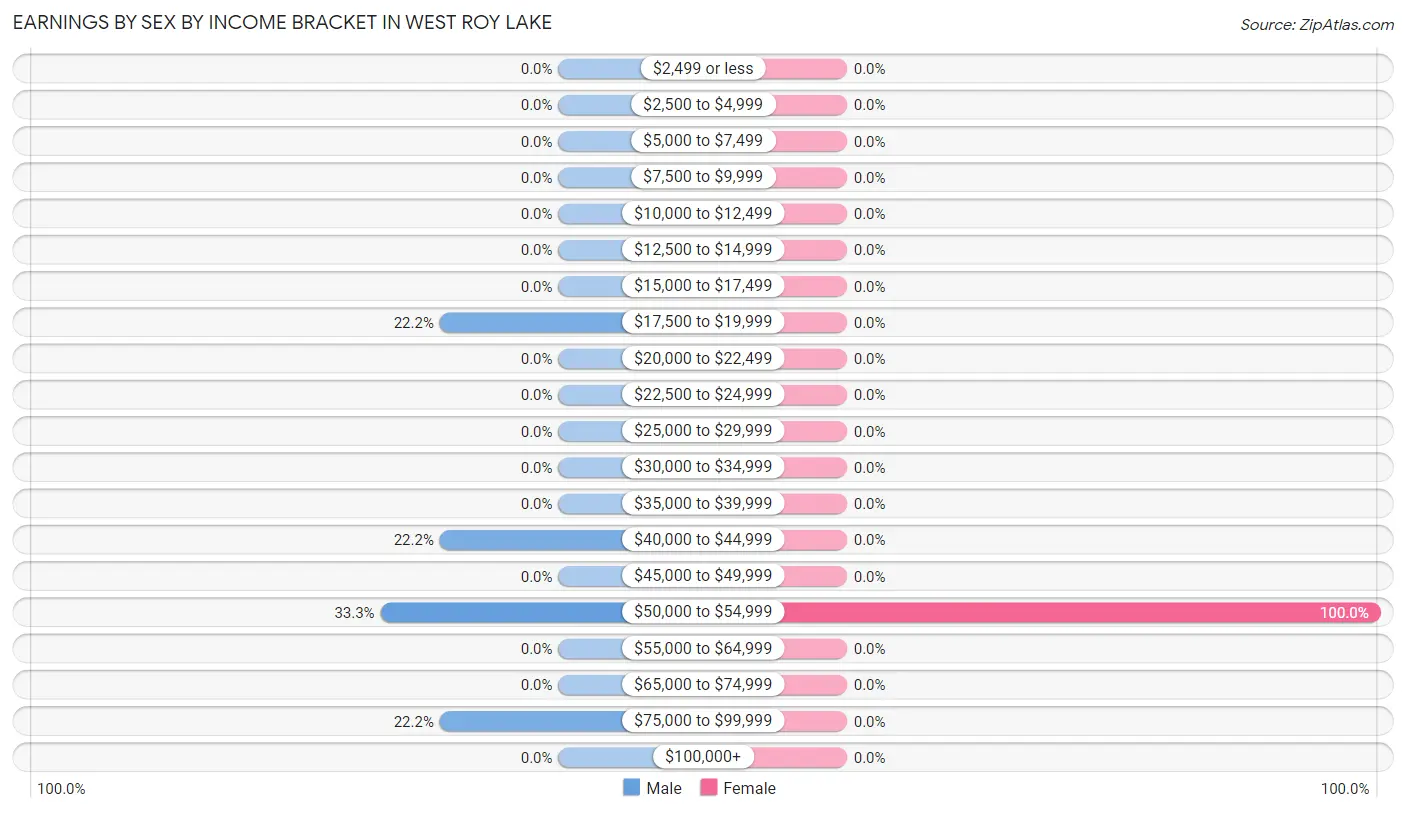
| Income | Male | Female |
| $2,499 or less | 0 (0.0%) | 0 (0.0%) |
| $2,500 to $4,999 | 0 (0.0%) | 0 (0.0%) |
| $5,000 to $7,499 | 0 (0.0%) | 0 (0.0%) |
| $7,500 to $9,999 | 0 (0.0%) | 0 (0.0%) |
| $10,000 to $12,499 | 0 (0.0%) | 0 (0.0%) |
| $12,500 to $14,999 | 0 (0.0%) | 0 (0.0%) |
| $15,000 to $17,499 | 0 (0.0%) | 0 (0.0%) |
| $17,500 to $19,999 | 2 (22.2%) | 0 (0.0%) |
| $20,000 to $22,499 | 0 (0.0%) | 0 (0.0%) |
| $22,500 to $24,999 | 0 (0.0%) | 0 (0.0%) |
| $25,000 to $29,999 | 0 (0.0%) | 0 (0.0%) |
| $30,000 to $34,999 | 0 (0.0%) | 0 (0.0%) |
| $35,000 to $39,999 | 0 (0.0%) | 0 (0.0%) |
| $40,000 to $44,999 | 2 (22.2%) | 0 (0.0%) |
| $45,000 to $49,999 | 0 (0.0%) | 0 (0.0%) |
| $50,000 to $54,999 | 3 (33.3%) | 2 (100.0%) |
| $55,000 to $64,999 | 0 (0.0%) | 0 (0.0%) |
| $65,000 to $74,999 | 0 (0.0%) | 0 (0.0%) |
| $75,000 to $99,999 | 2 (22.2%) | 0 (0.0%) |
| $100,000+ | 0 (0.0%) | 0 (0.0%) |
| Total | 9 (100.0%) | 2 (100.0%) |
Earnings by Sex by Educational Attainment in West Roy Lake
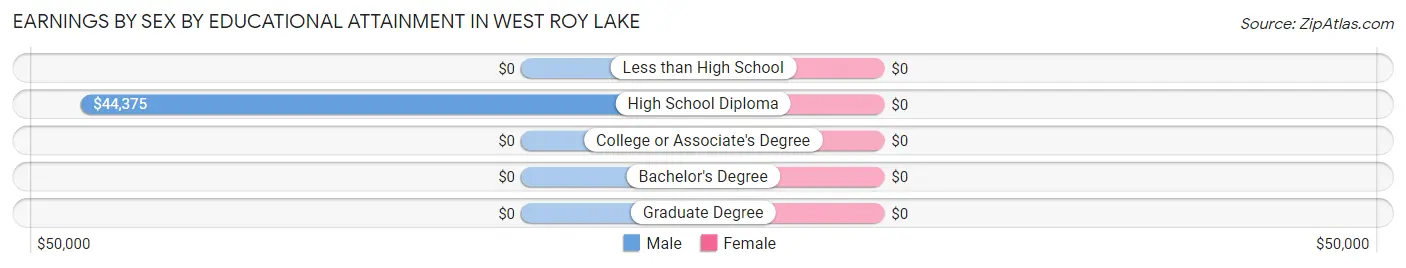
| Educational Attainment | Male Income | Female Income |
| Less than High School | - | - |
| High School Diploma | $44,375 | $0 |
| College or Associate's Degree | - | - |
| Bachelor's Degree | - | - |
| Graduate Degree | - | - |
| Total | $52,917 | $0 |
Family Income in West Roy Lake
Family Income Brackets in West Roy Lake
According to the West Roy Lake family income data, there are 4 families falling into the $100,000 to $149,999 income range, which is the most common income bracket and makes up 44.4% of all families.
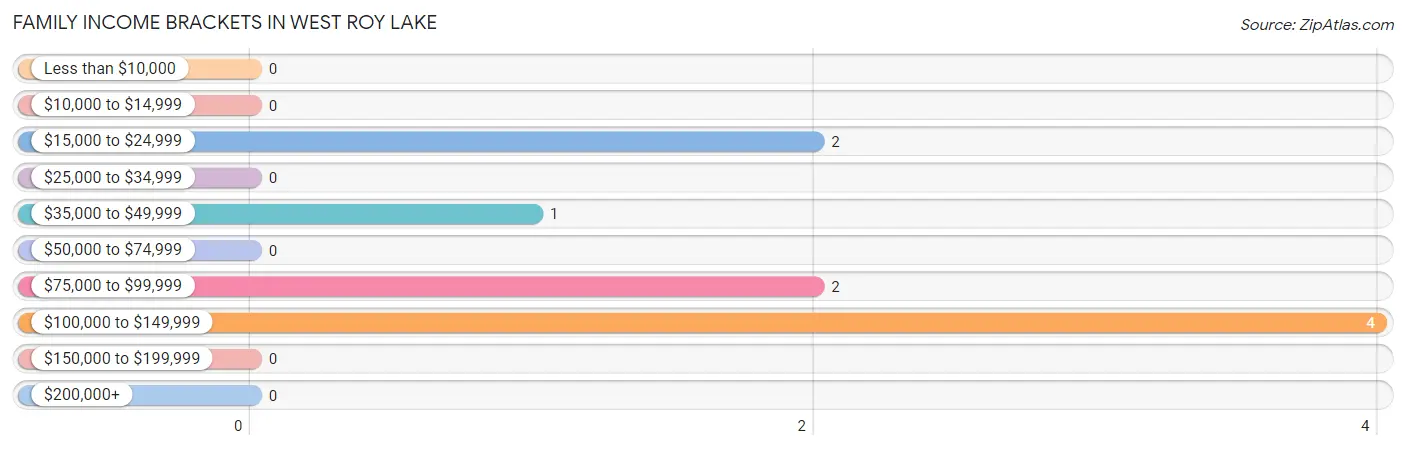
| Income Bracket | # Families | % Families |
| Less than $10,000 | 0 | 0.0% |
| $10,000 to $14,999 | 0 | 0.0% |
| $15,000 to $24,999 | 2 | 22.2% |
| $25,000 to $34,999 | 0 | 0.0% |
| $35,000 to $49,999 | 1 | 11.1% |
| $50,000 to $74,999 | 0 | 0.0% |
| $75,000 to $99,999 | 2 | 22.2% |
| $100,000 to $149,999 | 4 | 44.4% |
| $150,000 to $199,999 | 0 | 0.0% |
| $200,000+ | 0 | 0.0% |
Family Income by Famaliy Size in West Roy Lake
| Income Bracket | # Families | Median Income |
| 2-Person Families | 4 (44.4%) | $0 |
| 3-Person Families | 4 (44.4%) | $0 |
| 4-Person Families | 0 (0.0%) | $0 |
| 5-Person Families | 0 (0.0%) | $0 |
| 6-Person Families | 1 (11.1%) | $0 |
| 7+ Person Families | 0 (0.0%) | $0 |
| Total | 9 (100.0%) | $94,375 |
Family Income by Number of Earners in West Roy Lake
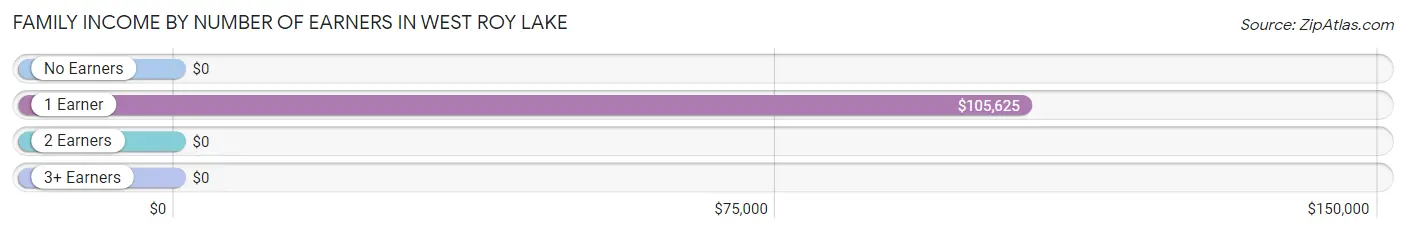
| Number of Earners | # Families | Median Income |
| No Earners | 1 (11.1%) | $0 |
| 1 Earner | 6 (66.7%) | $105,625 |
| 2 Earners | 2 (22.2%) | $0 |
| 3+ Earners | 0 (0.0%) | $0 |
| Total | 9 (100.0%) | $94,375 |
Household Income in West Roy Lake
Household Income Brackets in West Roy Lake
With 4 households falling in the category, the $100,000 to $149,999 income range is the most frequent in West Roy Lake, accounting for 36.4% of all households.
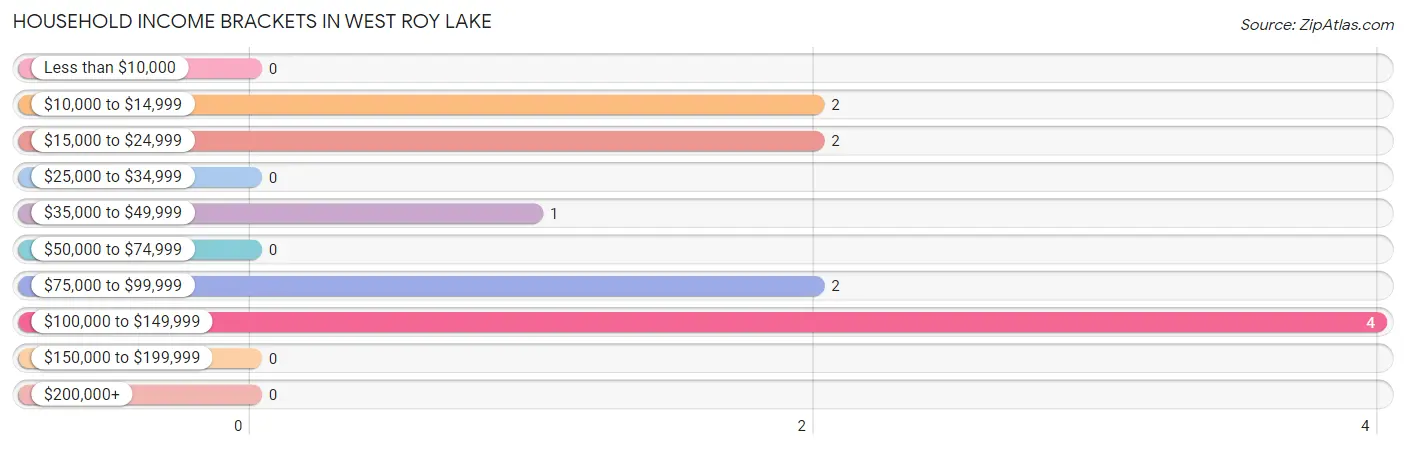
| Income Bracket | # Households | % Households |
| Less than $10,000 | 0 | 0.0% |
| $10,000 to $14,999 | 2 | 18.2% |
| $15,000 to $24,999 | 2 | 18.2% |
| $25,000 to $34,999 | 0 | 0.0% |
| $35,000 to $49,999 | 1 | 9.1% |
| $50,000 to $74,999 | 0 | 0.0% |
| $75,000 to $99,999 | 2 | 18.2% |
| $100,000 to $149,999 | 4 | 36.4% |
| $150,000 to $199,999 | 0 | 0.0% |
| $200,000+ | 0 | 0.0% |
Household Income by Householder Age in West Roy Lake
The median household income in West Roy Lake is $0, with the highest median household income of $105,938 found in the 65+ years age bracket for the primary householder. A total of 5 households (45.5%) fall into this category.
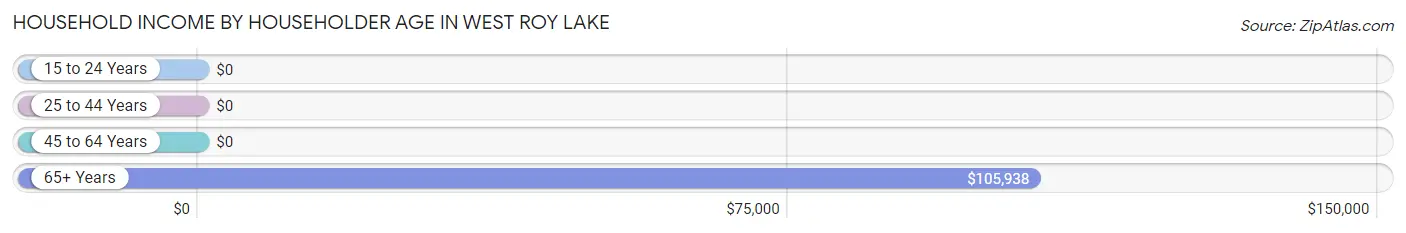
| Income Bracket | # Households | Median Income |
| 15 to 24 Years | 0 (0.0%) | $0 |
| 25 to 44 Years | 2 (18.2%) | $0 |
| 45 to 64 Years | 4 (36.4%) | $0 |
| 65+ Years | 5 (45.5%) | $105,938 |
| Total | 11 (100.0%) | $0 |
Poverty in West Roy Lake
Income Below Poverty by Sex and Age in West Roy Lake
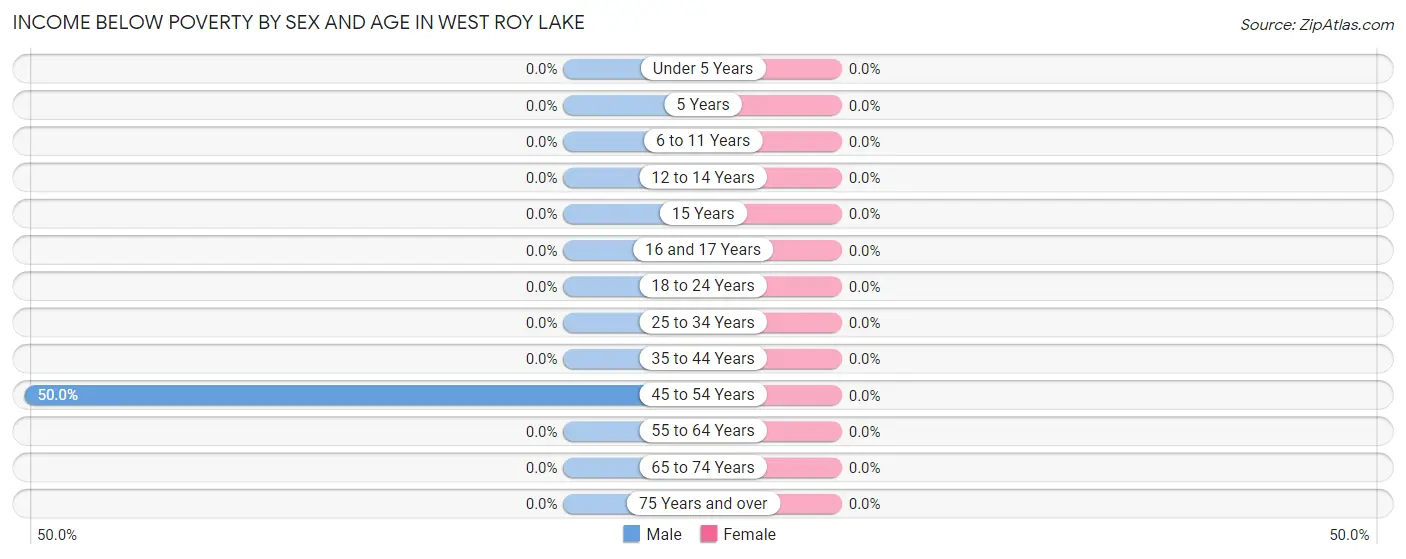
| Age Bracket | Male | Female |
| Under 5 Years | 0 (0.0%) | 0 (0.0%) |
| 5 Years | 0 (0.0%) | 0 (0.0%) |
| 6 to 11 Years | 0 (0.0%) | 0 (0.0%) |
| 12 to 14 Years | 0 (0.0%) | 0 (0.0%) |
| 15 Years | 0 (0.0%) | 0 (0.0%) |
| 16 and 17 Years | 0 (0.0%) | 0 (0.0%) |
| 18 to 24 Years | 0 (0.0%) | 0 (0.0%) |
| 25 to 34 Years | 0 (0.0%) | 0 (0.0%) |
| 35 to 44 Years | 0 (0.0%) | 0 (0.0%) |
| 45 to 54 Years | 2 (50.0%) | 0 (0.0%) |
| 55 to 64 Years | 0 (0.0%) | 0 (0.0%) |
| 65 to 74 Years | 0 (0.0%) | 0 (0.0%) |
| 75 Years and over | 0 (0.0%) | 0 (0.0%) |
| Total | 2 (12.5%) | 0 (0.0%) |
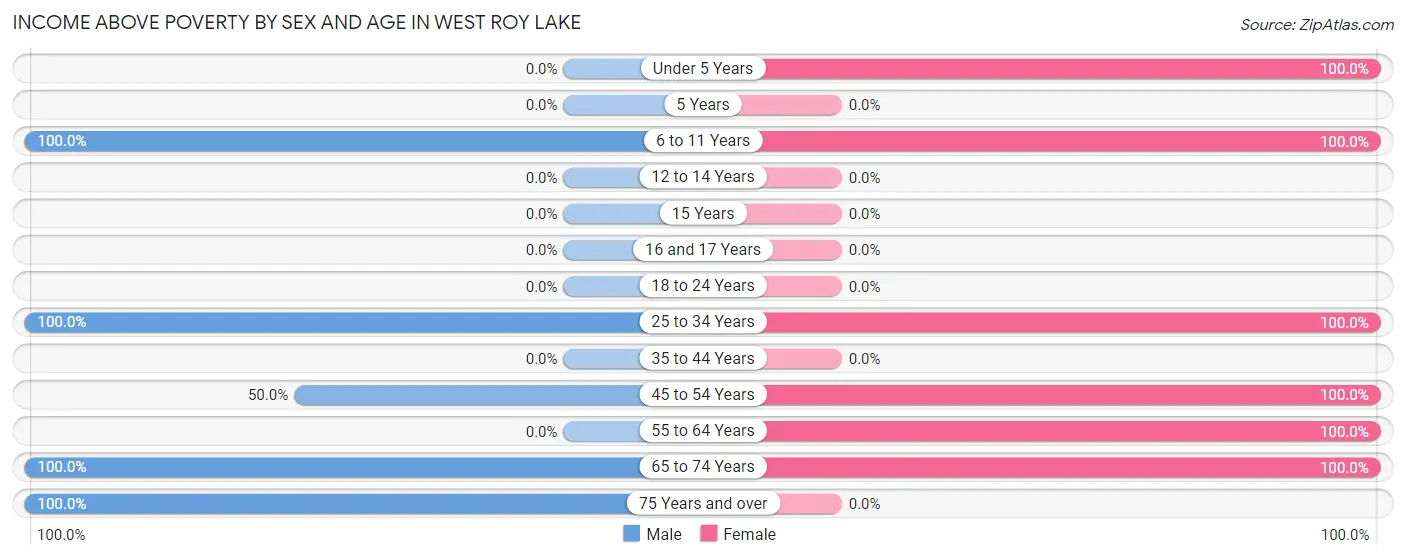
Income Above Poverty by Sex and Age in West Roy Lake
According to the poverty statistics in West Roy Lake, males aged 6 to 11 years and females aged under 5 years are the age groups that are most secure financially, with 100.0% of males and 100.0% of females in these age groups living above the poverty line.
| Age Bracket | Male | Female |
| Under 5 Years | 0 (0.0%) | 5 (100.0%) |
| 5 Years | 0 (0.0%) | 0 (0.0%) |
| 6 to 11 Years | 2 (100.0%) | 9 (100.0%) |
| 12 to 14 Years | 0 (0.0%) | 0 (0.0%) |
| 15 Years | 0 (0.0%) | 0 (0.0%) |
| 16 and 17 Years | 0 (0.0%) | 0 (0.0%) |
| 18 to 24 Years | 0 (0.0%) | 0 (0.0%) |
| 25 to 34 Years | 5 (100.0%) | 4 (100.0%) |
| 35 to 44 Years | 0 (0.0%) | 0 (0.0%) |
| 45 to 54 Years | 2 (50.0%) | 2 (100.0%) |
| 55 to 64 Years | 0 (0.0%) | 3 (100.0%) |
| 65 to 74 Years | 4 (100.0%) | 4 (100.0%) |
| 75 Years and over | 1 (100.0%) | 0 (0.0%) |
| Total | 14 (87.5%) | 27 (100.0%) |
Income Below Poverty Among Married-Couple Families in West Roy Lake
| Children | Above Poverty | Below Poverty |
| No Children | 4 (100.0%) | 0 (0.0%) |
| 1 or 2 Children | 2 (100.0%) | 0 (0.0%) |
| 3 or 4 Children | 1 (100.0%) | 0 (0.0%) |
| 5 or more Children | 0 (0.0%) | 0 (0.0%) |
| Total | 7 (100.0%) | 0 (0.0%) |
Income Below Poverty Among Single-Parent Households in West Roy Lake
| Children | Single Father | Single Mother |
| No Children | 0 (0.0%) | 0 (0.0%) |
| 1 or 2 Children | 0 (0.0%) | 0 (0.0%) |
| 3 or 4 Children | 0 (0.0%) | 0 (0.0%) |
| 5 or more Children | 0 (0.0%) | 0 (0.0%) |
| Total | 0 (0.0%) | 0 (0.0%) |
Income Below Poverty Among Married-Couple vs Single-Parent Households in West Roy Lake
| Children | Married-Couple Families | Single-Parent Households |
| No Children | 0 (0.0%) | 0 (0.0%) |
| 1 or 2 Children | 0 (0.0%) | 0 (0.0%) |
| 3 or 4 Children | 0 (0.0%) | 0 (0.0%) |
| 5 or more Children | 0 (0.0%) | 0 (0.0%) |
| Total | 0 (0.0%) | 0 (0.0%) |
Employment Characteristics in West Roy Lake
Employment by Class of Employer in West Roy Lake
Among the 9 employed individuals in West Roy Lake, private company employees (7 | 77.8%), and state government employees (2 | 22.2%) make up the most common classes of employment.
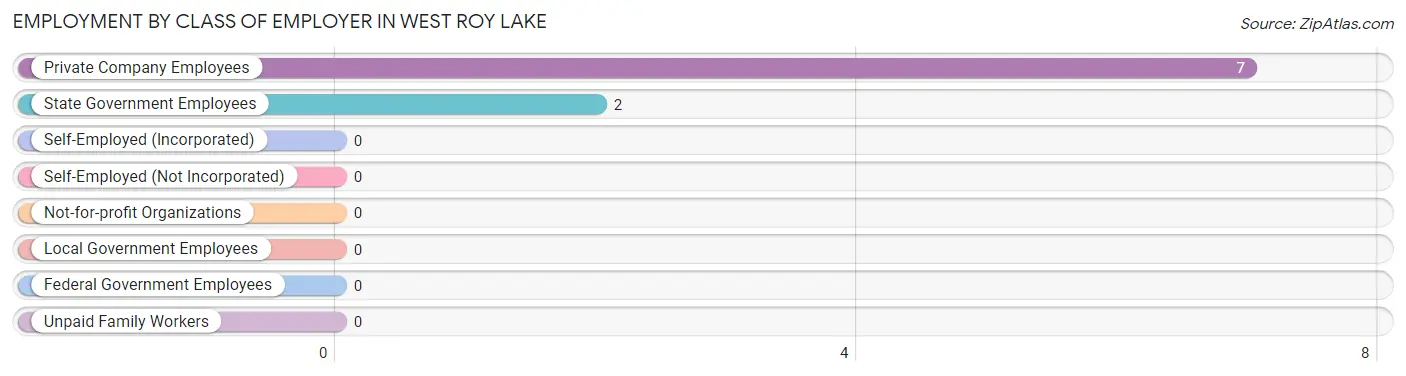
| Employer Class | # Employees | % Employees |
| Private Company Employees | 7 | 77.8% |
| Self-Employed (Incorporated) | 0 | 0.0% |
| Self-Employed (Not Incorporated) | 0 | 0.0% |
| Not-for-profit Organizations | 0 | 0.0% |
| Local Government Employees | 0 | 0.0% |
| State Government Employees | 2 | 22.2% |
| Federal Government Employees | 0 | 0.0% |
| Unpaid Family Workers | 0 | 0.0% |
| Total | 9 | 100.0% |
Employment Status by Age in West Roy Lake
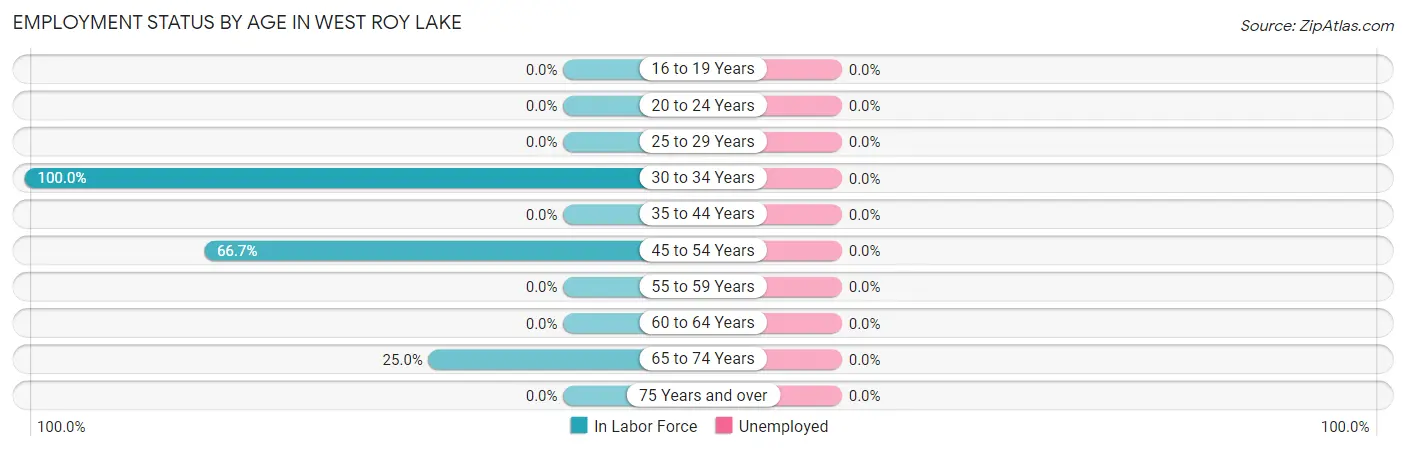
| Age Bracket | In Labor Force | Unemployed |
| 16 to 19 Years | 0 (0.0%) | 0 (0.0%) |
| 20 to 24 Years | 0 (0.0%) | 0 (0.0%) |
| 25 to 29 Years | 0 (0.0%) | 0 (0.0%) |
| 30 to 34 Years | 3 (100.0%) | 0 (0.0%) |
| 35 to 44 Years | 0 (0.0%) | 0 (0.0%) |
| 45 to 54 Years | 4 (66.7%) | 0 (0.0%) |
| 55 to 59 Years | 0 (0.0%) | 0 (0.0%) |
| 60 to 64 Years | 0 (0.0%) | 0 (0.0%) |
| 65 to 74 Years | 2 (25.0%) | 0 (0.0%) |
| 75 Years and over | 0 (0.0%) | 0 (0.0%) |
| Total | 9 (33.3%) | 0 (0.0%) |
Employment Status by Educational Attainment in West Roy Lake
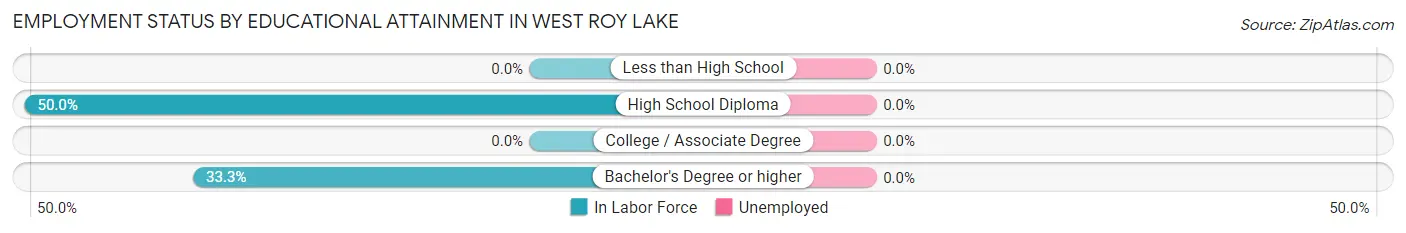
| Educational Attainment | In Labor Force | Unemployed |
| Less than High School | 0 (0.0%) | 0 (0.0%) |
| High School Diploma | 5 (50.0%) | 0 (0.0%) |
| College / Associate Degree | 0 (0.0%) | 0 (0.0%) |
| Bachelor's Degree or higher | 2 (33.3%) | 0 (0.0%) |
| Total | 7 (38.9%) | 0 (0.0%) |
Employment Occupations by Sex in West Roy Lake
Management, Business, Science and Arts Occupations
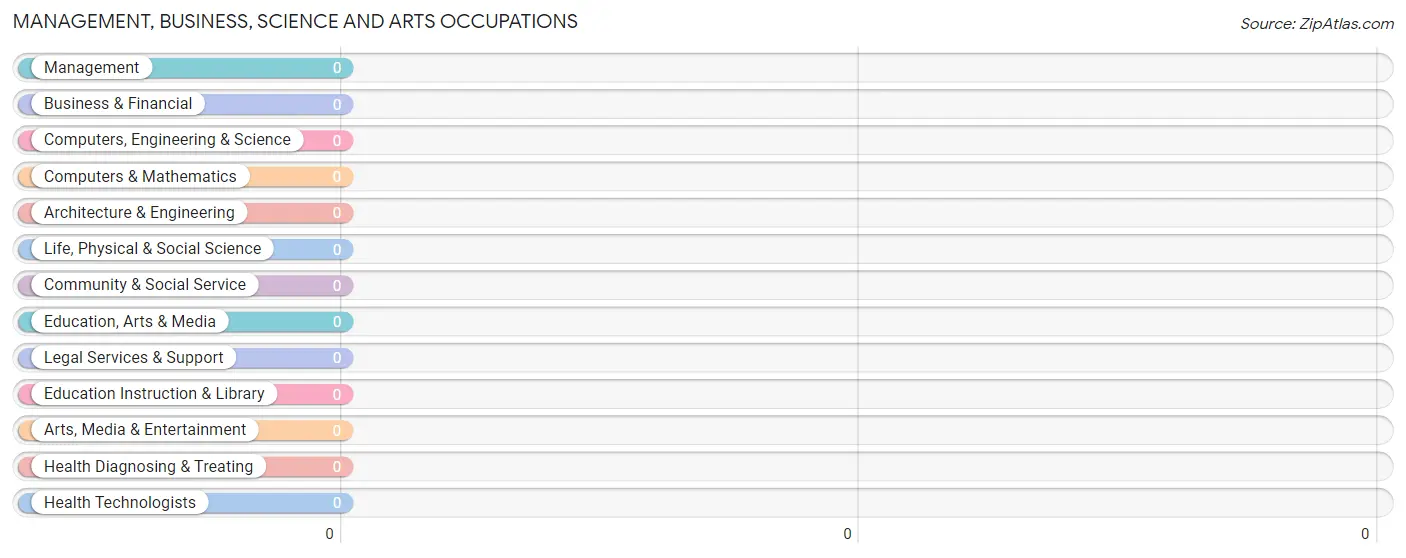
Management, Business, Science and Arts Occupations by Sex
| Occupation | Male | Female |
| Management | 0 (0.0%) | 0 (0.0%) |
| Business & Financial | 0 (0.0%) | 0 (0.0%) |
| Computers, Engineering & Science | 0 (0.0%) | 0 (0.0%) |
| Computers & Mathematics | 0 (0.0%) | 0 (0.0%) |
| Architecture & Engineering | 0 (0.0%) | 0 (0.0%) |
| Life, Physical & Social Science | 0 (0.0%) | 0 (0.0%) |
| Community & Social Service | 0 (0.0%) | 0 (0.0%) |
| Education, Arts & Media | 0 (0.0%) | 0 (0.0%) |
| Legal Services & Support | 0 (0.0%) | 0 (0.0%) |
| Education Instruction & Library | 0 (0.0%) | 0 (0.0%) |
| Arts, Media & Entertainment | 0 (0.0%) | 0 (0.0%) |
| Health Diagnosing & Treating | 0 (0.0%) | 0 (0.0%) |
| Health Technologists | 0 (0.0%) | 0 (0.0%) |
| Total (Category) | 0 (0.0%) | 0 (0.0%) |
| Total (Overall) | 7 (77.8%) | 2 (22.2%) |
Services Occupations
Services Occupations by Sex
| Occupation | Male | Female |
| Healthcare Support | 0 (0.0%) | 0 (0.0%) |
| Security & Protection | 0 (0.0%) | 0 (0.0%) |
| Firefighting & Prevention | 0 (0.0%) | 0 (0.0%) |
| Law Enforcement | 0 (0.0%) | 0 (0.0%) |
| Food Preparation & Serving | 0 (0.0%) | 0 (0.0%) |
| Cleaning & Maintenance | 0 (0.0%) | 0 (0.0%) |
| Personal Care & Service | 0 (0.0%) | 0 (0.0%) |
| Total (Category) | 0 (0.0%) | 0 (0.0%) |
| Total (Overall) | 7 (77.8%) | 2 (22.2%) |
Sales and Office Occupations
The most common Sales and Office occupations in West Roy Lake are , and Office & Administration (2 | 22.2%).
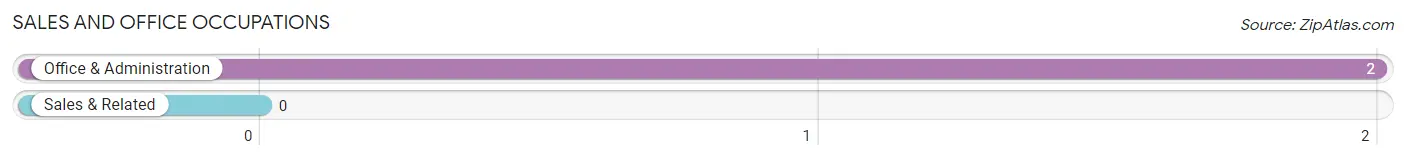
Sales and Office Occupations by Sex
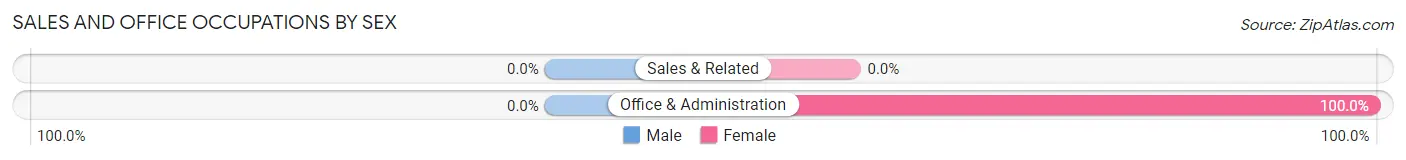
| Occupation | Male | Female |
| Sales & Related | 0 (0.0%) | 0 (0.0%) |
| Office & Administration | 0 (0.0%) | 2 (100.0%) |
| Total (Category) | 0 (0.0%) | 2 (100.0%) |
| Total (Overall) | 7 (77.8%) | 2 (22.2%) |
Natural Resources, Construction and Maintenance Occupations
The most common Natural Resources, Construction and Maintenance occupations in West Roy Lake are , and Construction & Extraction (5 | 55.6%).
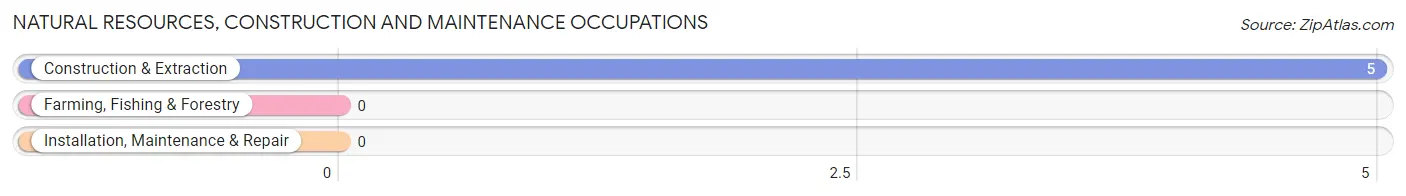
Natural Resources, Construction and Maintenance Occupations by Sex
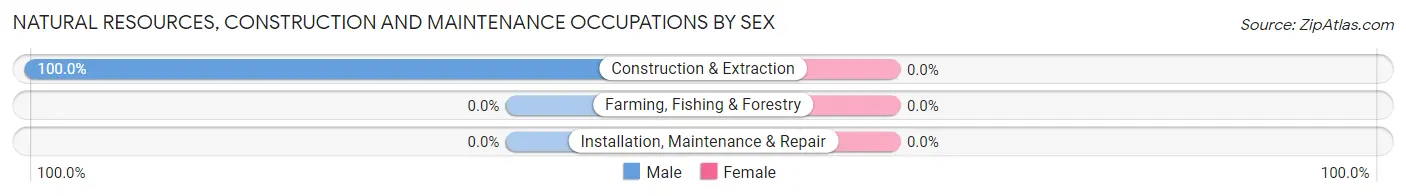
| Occupation | Male | Female |
| Farming, Fishing & Forestry | 0 (0.0%) | 0 (0.0%) |
| Construction & Extraction | 5 (100.0%) | 0 (0.0%) |
| Installation, Maintenance & Repair | 0 (0.0%) | 0 (0.0%) |
| Total (Category) | 5 (100.0%) | 0 (0.0%) |
| Total (Overall) | 7 (77.8%) | 2 (22.2%) |
Production, Transportation and Moving Occupations
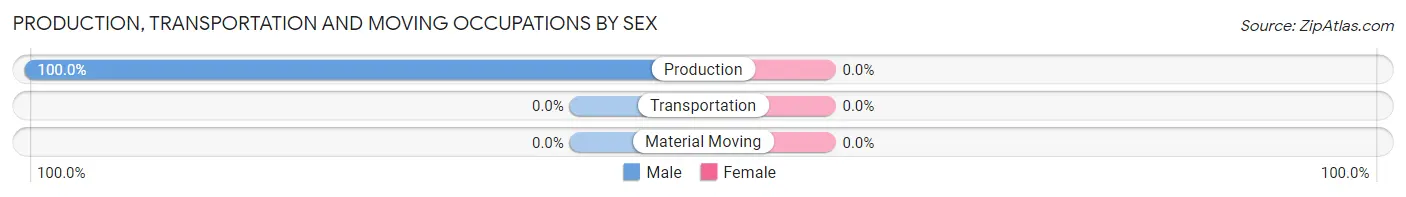
The most common Production, Transportation and Moving occupations in West Roy Lake are , and Production (2 | 22.2%).
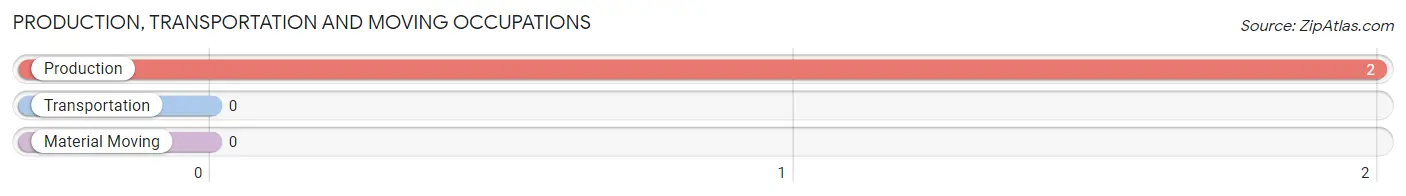
Production, Transportation and Moving Occupations by Sex
| Occupation | Male | Female |
| Production | 2 (100.0%) | 0 (0.0%) |
| Transportation | 0 (0.0%) | 0 (0.0%) |
| Material Moving | 0 (0.0%) | 0 (0.0%) |
| Total (Category) | 2 (100.0%) | 0 (0.0%) |
| Total (Overall) | 7 (77.8%) | 2 (22.2%) |
Employment Industries by Sex in West Roy Lake
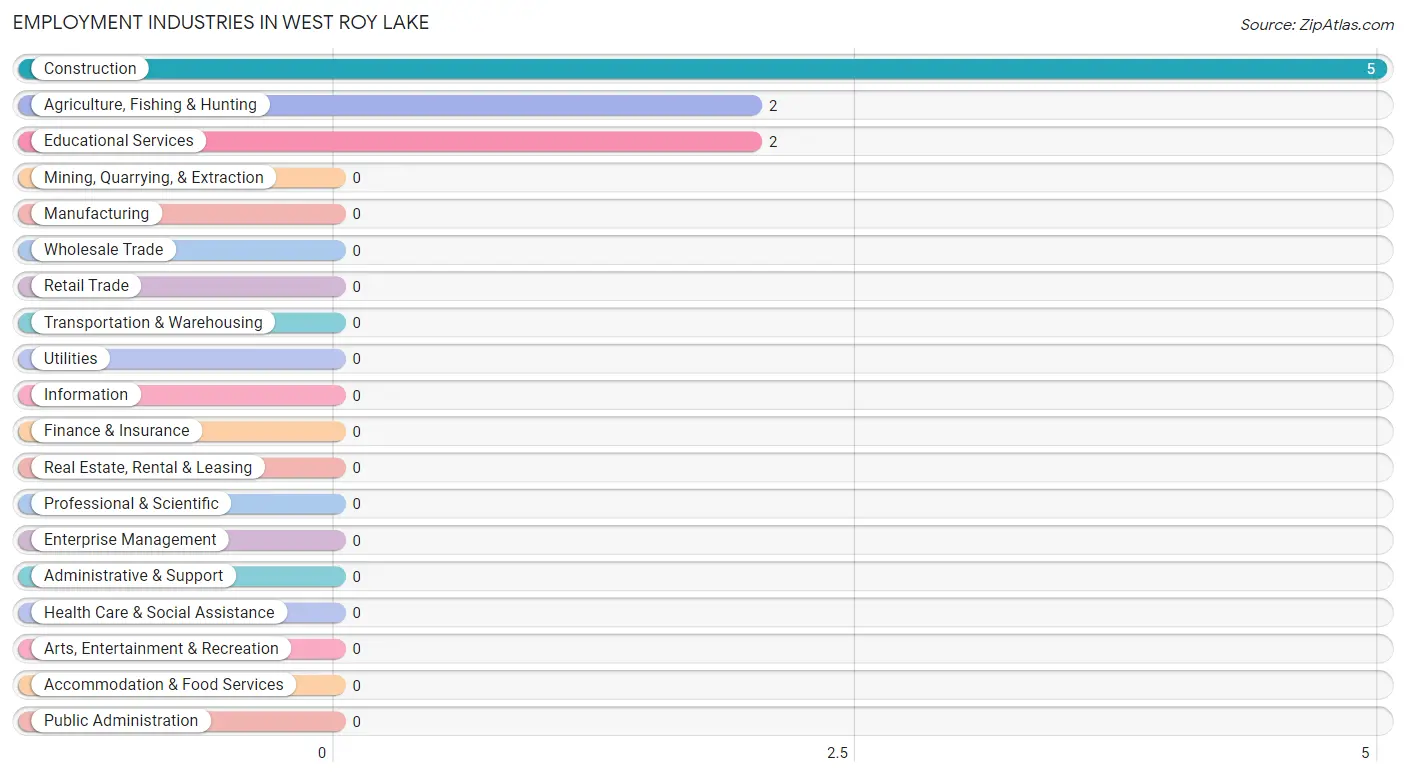
Employment Industries in West Roy Lake
The major employment industries in West Roy Lake include Construction (5 | 55.6%), Agriculture, Fishing & Hunting (2 | 22.2%), and Educational Services (2 | 22.2%).
Employment Industries by Sex in West Roy Lake
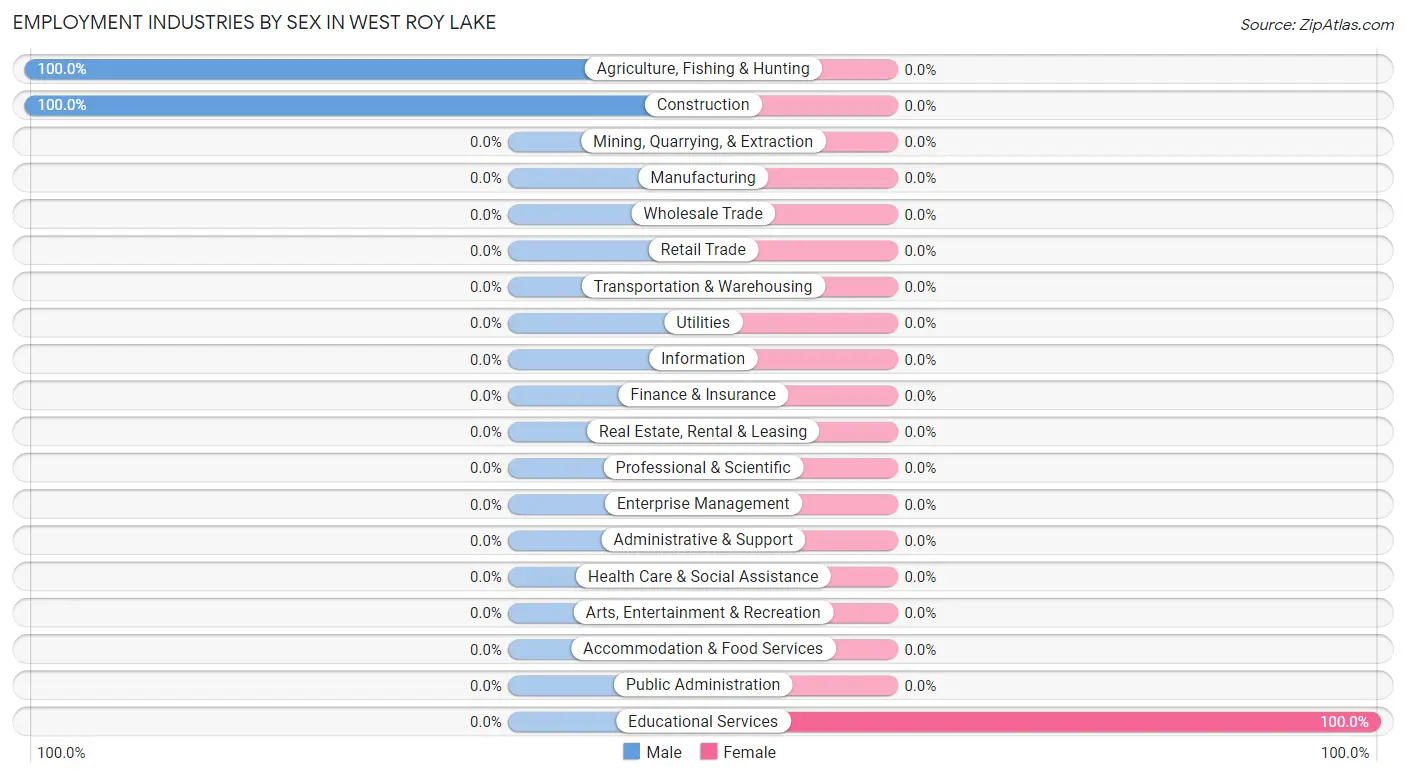
| Industry | Male | Female |
| Agriculture, Fishing & Hunting | 2 (100.0%) | 0 (0.0%) |
| Mining, Quarrying, & Extraction | 0 (0.0%) | 0 (0.0%) |
| Construction | 5 (100.0%) | 0 (0.0%) |
| Manufacturing | 0 (0.0%) | 0 (0.0%) |
| Wholesale Trade | 0 (0.0%) | 0 (0.0%) |
| Retail Trade | 0 (0.0%) | 0 (0.0%) |
| Transportation & Warehousing | 0 (0.0%) | 0 (0.0%) |
| Utilities | 0 (0.0%) | 0 (0.0%) |
| Information | 0 (0.0%) | 0 (0.0%) |
| Finance & Insurance | 0 (0.0%) | 0 (0.0%) |
| Real Estate, Rental & Leasing | 0 (0.0%) | 0 (0.0%) |
| Professional & Scientific | 0 (0.0%) | 0 (0.0%) |
| Enterprise Management | 0 (0.0%) | 0 (0.0%) |
| Administrative & Support | 0 (0.0%) | 0 (0.0%) |
| Educational Services | 0 (0.0%) | 2 (100.0%) |
| Health Care & Social Assistance | 0 (0.0%) | 0 (0.0%) |
| Arts, Entertainment & Recreation | 0 (0.0%) | 0 (0.0%) |
| Accommodation & Food Services | 0 (0.0%) | 0 (0.0%) |
| Public Administration | 0 (0.0%) | 0 (0.0%) |
| Total | 7 (77.8%) | 2 (22.2%) |
Education in West Roy Lake
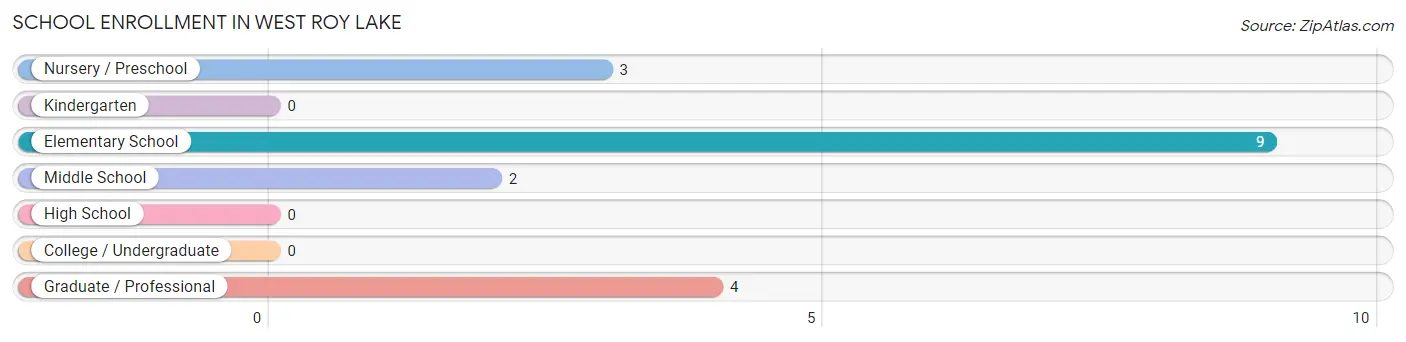
School Enrollment in West Roy Lake
The most common levels of schooling among the 18 students in West Roy Lake are elementary school (9 | 50.0%), graduate / professional (4 | 22.2%), and nursery / preschool (3 | 16.7%).
| School Level | # Students | % Students |
| Nursery / Preschool | 3 | 16.7% |
| Kindergarten | 0 | 0.0% |
| Elementary School | 9 | 50.0% |
| Middle School | 2 | 11.1% |
| High School | 0 | 0.0% |
| College / Undergraduate | 0 | 0.0% |
| Graduate / Professional | 4 | 22.2% |
| Total | 18 | 100.0% |
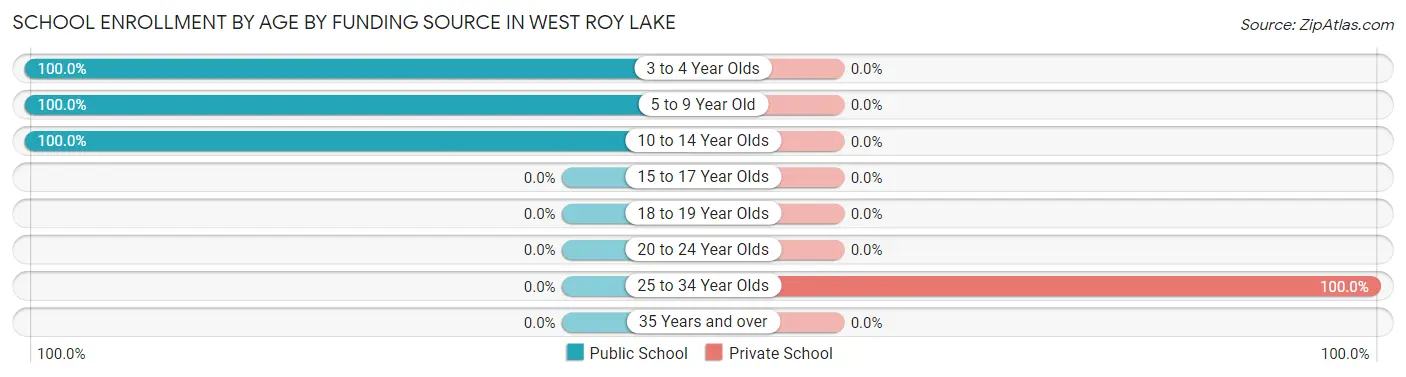
School Enrollment by Age by Funding Source in West Roy Lake
Out of a total of 18 students who are enrolled in schools in West Roy Lake, 4 (22.2%) attend a private institution, while the remaining 14 (77.8%) are enrolled in public schools. The age group of 25 to 34 year olds has the highest likelihood of being enrolled in private schools, with 4 (100.0% in the age bracket) enrolled. Conversely, the age group of 3 to 4 year olds has the lowest likelihood of being enrolled in a private school, with 3 (100.0% in the age bracket) attending a public institution.
| Age Bracket | Public School | Private School |
| 3 to 4 Year Olds | 3 (100.0%) | 0 (0.0%) |
| 5 to 9 Year Old | 9 (100.0%) | 0 (0.0%) |
| 10 to 14 Year Olds | 2 (100.0%) | 0 (0.0%) |
| 15 to 17 Year Olds | 0 (0.0%) | 0 (0.0%) |
| 18 to 19 Year Olds | 0 (0.0%) | 0 (0.0%) |
| 20 to 24 Year Olds | 0 (0.0%) | 0 (0.0%) |
| 25 to 34 Year Olds | 0 (0.0%) | 4 (100.0%) |
| 35 Years and over | 0 (0.0%) | 0 (0.0%) |
| Total | 14 (77.8%) | 4 (22.2%) |
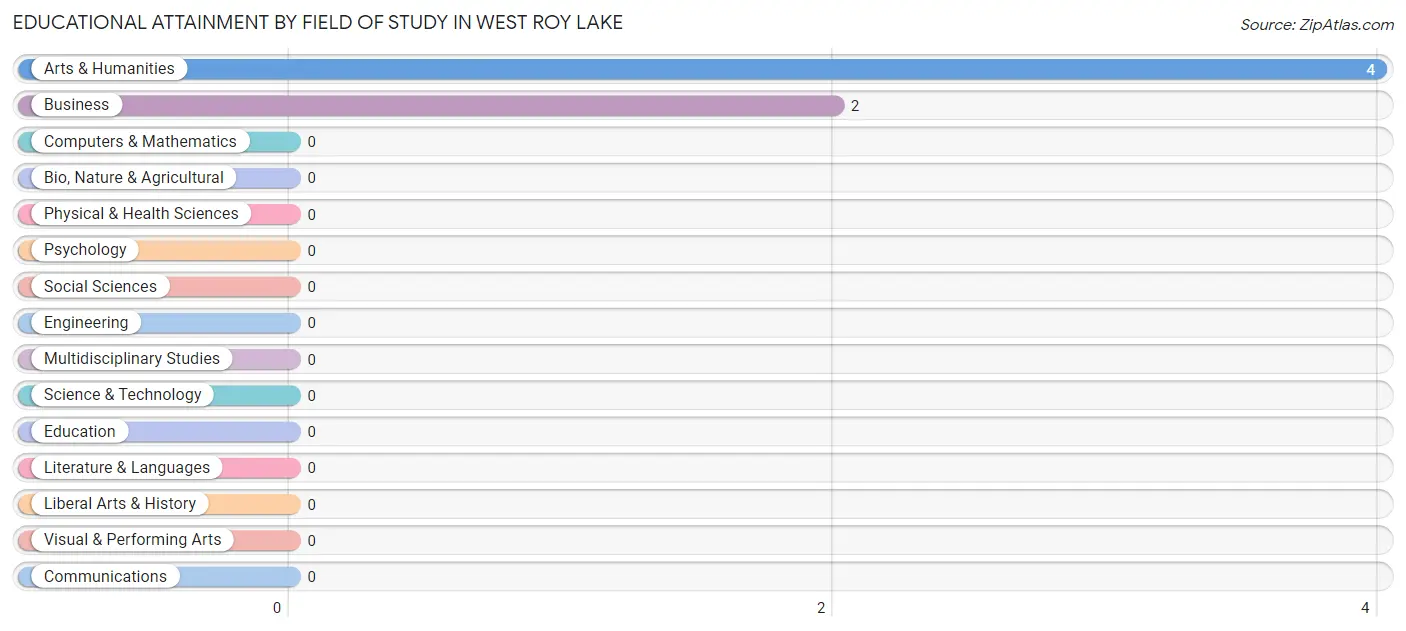
Educational Attainment by Field of Study in West Roy Lake
Arts & humanities (4 | 66.7%), and business (2 | 33.3%) are the most common fields of study among 6 individuals in West Roy Lake who have obtained a bachelor's degree or higher.
| Field of Study | # Graduates | % Graduates |
| Computers & Mathematics | 0 | 0.0% |
| Bio, Nature & Agricultural | 0 | 0.0% |
| Physical & Health Sciences | 0 | 0.0% |
| Psychology | 0 | 0.0% |
| Social Sciences | 0 | 0.0% |
| Engineering | 0 | 0.0% |
| Multidisciplinary Studies | 0 | 0.0% |
| Science & Technology | 0 | 0.0% |
| Business | 2 | 33.3% |
| Education | 0 | 0.0% |
| Literature & Languages | 0 | 0.0% |
| Liberal Arts & History | 0 | 0.0% |
| Visual & Performing Arts | 0 | 0.0% |
| Communications | 0 | 0.0% |
| Arts & Humanities | 4 | 66.7% |
| Total | 6 | 100.0% |
Transportation & Commute in West Roy Lake
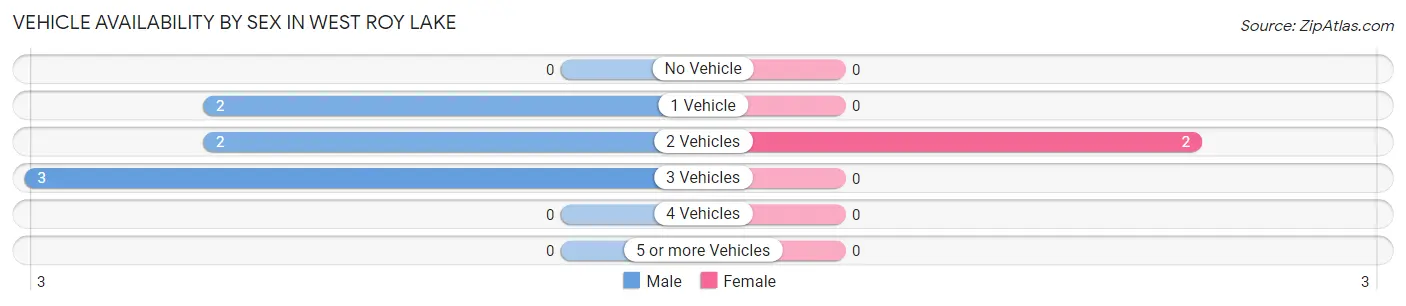
Vehicle Availability by Sex in West Roy Lake
The most prevalent vehicle ownership categories in West Roy Lake are males with 3 vehicles (3, accounting for 42.9%) and females with 3 vehicles (0, making up 150.0%).
| Vehicles Available | Male | Female |
| No Vehicle | 0 (0.0%) | 0 (0.0%) |
| 1 Vehicle | 2 (28.6%) | 0 (0.0%) |
| 2 Vehicles | 2 (28.6%) | 2 (100.0%) |
| 3 Vehicles | 3 (42.9%) | 0 (0.0%) |
| 4 Vehicles | 0 (0.0%) | 0 (0.0%) |
| 5 or more Vehicles | 0 (0.0%) | 0 (0.0%) |
| Total | 7 (100.0%) | 2 (100.0%) |
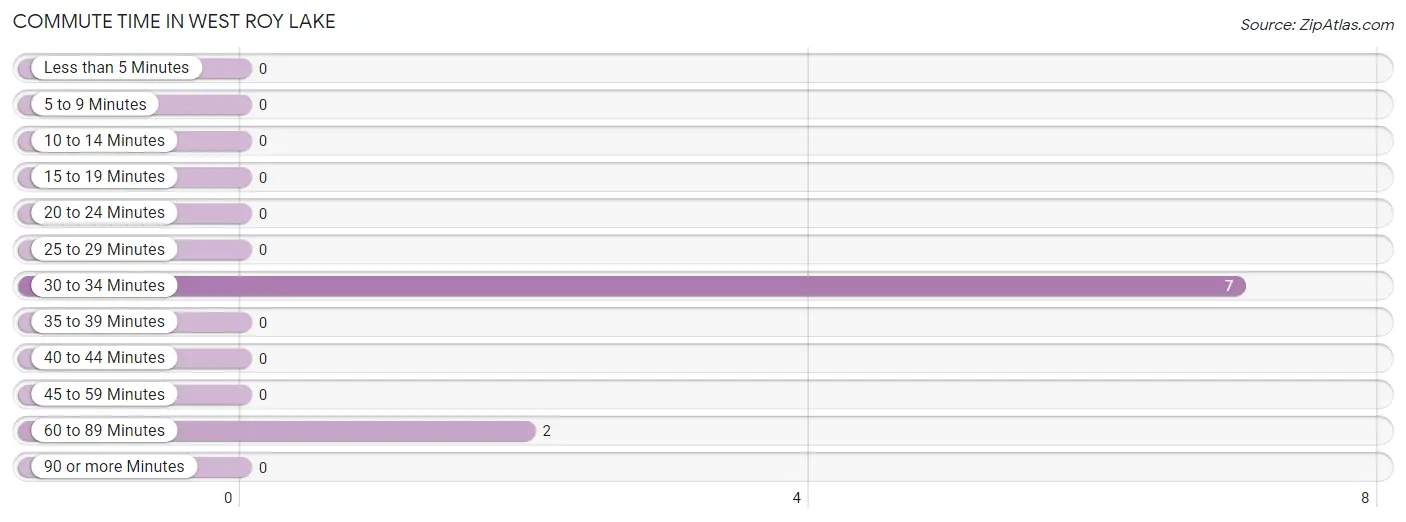
Commute Time in West Roy Lake
The most frequently occuring commute durations in West Roy Lake are 30 to 34 minutes (7 commuters, 77.8%), 60 to 89 minutes (2 commuters, 22.2%), and less than 5 minutes (0 commuters, 0.0%).
| Commute Time | # Commuters | % Commuters |
| Less than 5 Minutes | 0 | 0.0% |
| 5 to 9 Minutes | 0 | 0.0% |
| 10 to 14 Minutes | 0 | 0.0% |
| 15 to 19 Minutes | 0 | 0.0% |
| 20 to 24 Minutes | 0 | 0.0% |
| 25 to 29 Minutes | 0 | 0.0% |
| 30 to 34 Minutes | 7 | 77.8% |
| 35 to 39 Minutes | 0 | 0.0% |
| 40 to 44 Minutes | 0 | 0.0% |
| 45 to 59 Minutes | 0 | 0.0% |
| 60 to 89 Minutes | 2 | 22.2% |
| 90 or more Minutes | 0 | 0.0% |
Commute Time by Sex in West Roy Lake
The most common commute times in West Roy Lake are 30 to 34 minutes (7 commuters, 100.0%) for males and 60 to 89 minutes (2 commuters, 100.0%) for females.
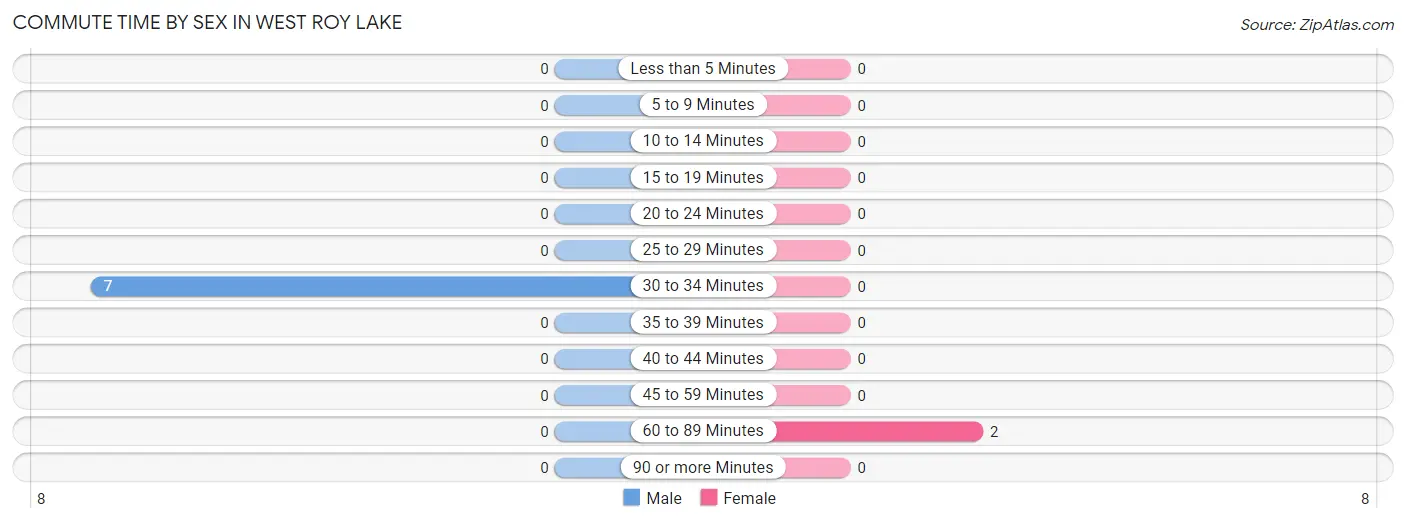
| Commute Time | Male | Female |
| Less than 5 Minutes | 0 (0.0%) | 0 (0.0%) |
| 5 to 9 Minutes | 0 (0.0%) | 0 (0.0%) |
| 10 to 14 Minutes | 0 (0.0%) | 0 (0.0%) |
| 15 to 19 Minutes | 0 (0.0%) | 0 (0.0%) |
| 20 to 24 Minutes | 0 (0.0%) | 0 (0.0%) |
| 25 to 29 Minutes | 0 (0.0%) | 0 (0.0%) |
| 30 to 34 Minutes | 7 (100.0%) | 0 (0.0%) |
| 35 to 39 Minutes | 0 (0.0%) | 0 (0.0%) |
| 40 to 44 Minutes | 0 (0.0%) | 0 (0.0%) |
| 45 to 59 Minutes | 0 (0.0%) | 0 (0.0%) |
| 60 to 89 Minutes | 0 (0.0%) | 2 (100.0%) |
| 90 or more Minutes | 0 (0.0%) | 0 (0.0%) |
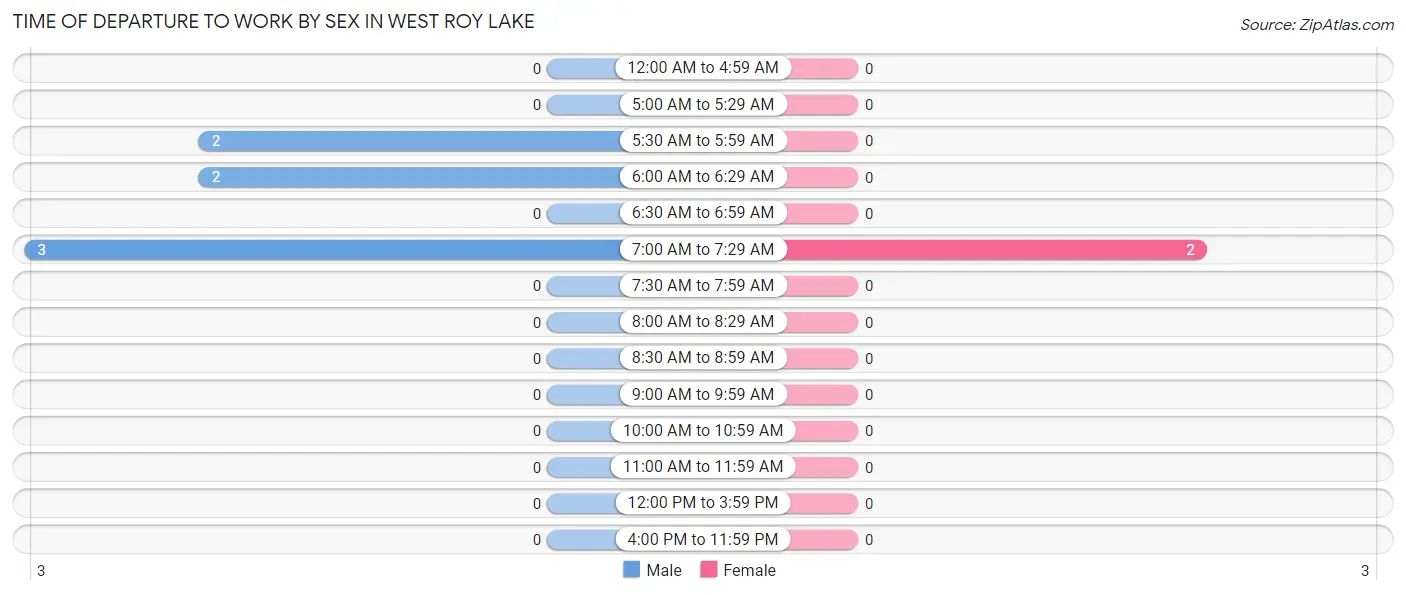
Time of Departure to Work by Sex in West Roy Lake
The most frequent times of departure to work in West Roy Lake are 7:00 AM to 7:29 AM (3, 42.9%) for males and 7:00 AM to 7:29 AM (2, 100.0%) for females.
| Time of Departure | Male | Female |
| 12:00 AM to 4:59 AM | 0 (0.0%) | 0 (0.0%) |
| 5:00 AM to 5:29 AM | 0 (0.0%) | 0 (0.0%) |
| 5:30 AM to 5:59 AM | 2 (28.6%) | 0 (0.0%) |
| 6:00 AM to 6:29 AM | 2 (28.6%) | 0 (0.0%) |
| 6:30 AM to 6:59 AM | 0 (0.0%) | 0 (0.0%) |
| 7:00 AM to 7:29 AM | 3 (42.9%) | 2 (100.0%) |
| 7:30 AM to 7:59 AM | 0 (0.0%) | 0 (0.0%) |
| 8:00 AM to 8:29 AM | 0 (0.0%) | 0 (0.0%) |
| 8:30 AM to 8:59 AM | 0 (0.0%) | 0 (0.0%) |
| 9:00 AM to 9:59 AM | 0 (0.0%) | 0 (0.0%) |
| 10:00 AM to 10:59 AM | 0 (0.0%) | 0 (0.0%) |
| 11:00 AM to 11:59 AM | 0 (0.0%) | 0 (0.0%) |
| 12:00 PM to 3:59 PM | 0 (0.0%) | 0 (0.0%) |
| 4:00 PM to 11:59 PM | 0 (0.0%) | 0 (0.0%) |
| Total | 7 (100.0%) | 2 (100.0%) |
Housing Occupancy in West Roy Lake
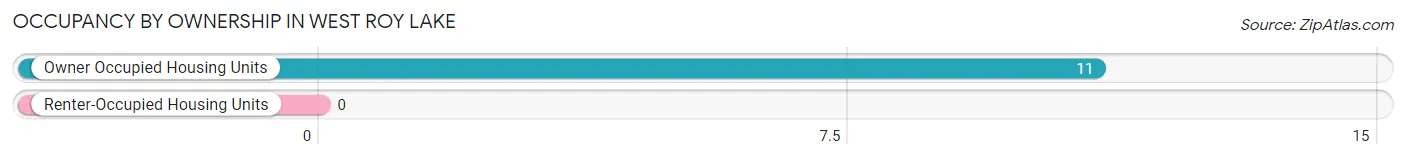
Occupancy by Ownership in West Roy Lake
Of the total 11 dwellings in West Roy Lake, owner-occupied units account for 11 (100.0%), while renter-occupied units make up 0 (0.0%).
| Occupancy | # Housing Units | % Housing Units |
| Owner Occupied Housing Units | 11 | 100.0% |
| Renter-Occupied Housing Units | 0 | 0.0% |
| Total Occupied Housing Units | 11 | 100.0% |
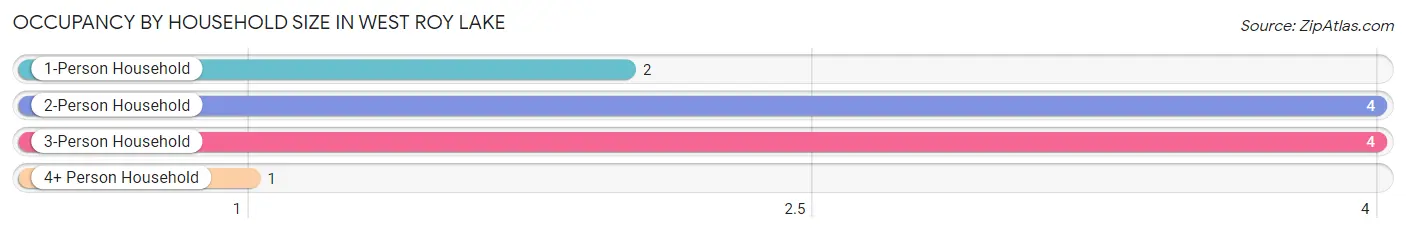
Occupancy by Household Size in West Roy Lake
| Household Size | # Housing Units | % Housing Units |
| 1-Person Household | 2 | 18.2% |
| 2-Person Household | 4 | 36.4% |
| 3-Person Household | 4 | 36.4% |
| 4+ Person Household | 1 | 9.1% |
| Total Housing Units | 11 | 100.0% |
Occupancy by Ownership by Household Size in West Roy Lake
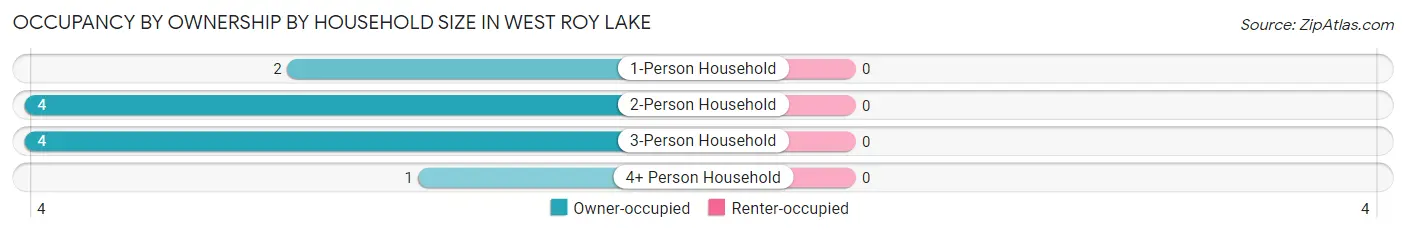
| Household Size | Owner-occupied | Renter-occupied |
| 1-Person Household | 2 (100.0%) | 0 (0.0%) |
| 2-Person Household | 4 (100.0%) | 0 (0.0%) |
| 3-Person Household | 4 (100.0%) | 0 (0.0%) |
| 4+ Person Household | 1 (100.0%) | 0 (0.0%) |
| Total Housing Units | 11 (100.0%) | 0 (0.0%) |
Occupancy by Educational Attainment in West Roy Lake
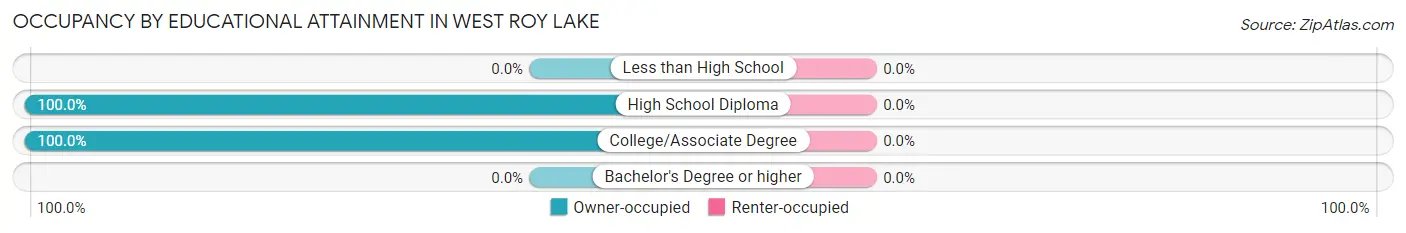
| Household Size | Owner-occupied | Renter-occupied |
| Less than High School | 0 (0.0%) | 0 (0.0%) |
| High School Diploma | 7 (100.0%) | 0 (0.0%) |
| College/Associate Degree | 4 (100.0%) | 0 (0.0%) |
| Bachelor's Degree or higher | 0 (0.0%) | 0 (0.0%) |
Occupancy by Age of Householder in West Roy Lake
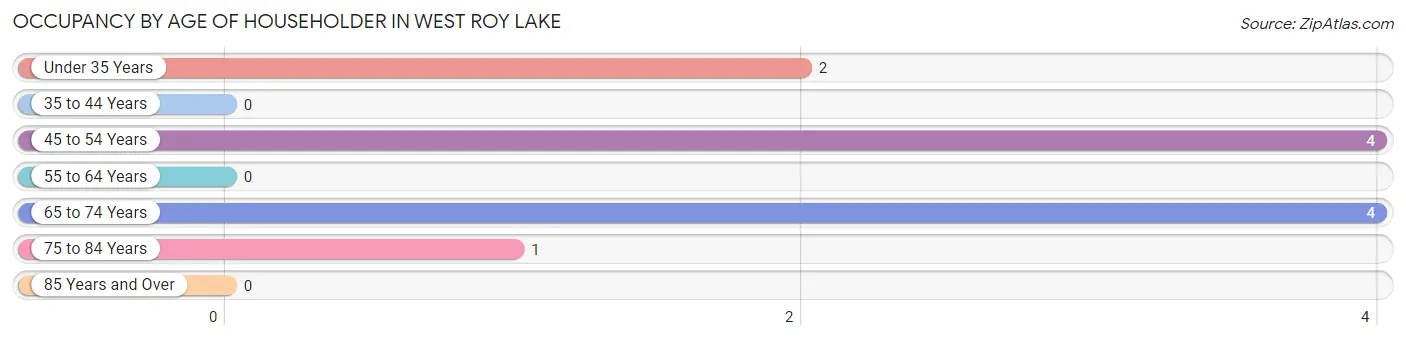
| Age Bracket | # Households | % Households |
| Under 35 Years | 2 | 18.2% |
| 35 to 44 Years | 0 | 0.0% |
| 45 to 54 Years | 4 | 36.4% |
| 55 to 64 Years | 0 | 0.0% |
| 65 to 74 Years | 4 | 36.4% |
| 75 to 84 Years | 1 | 9.1% |
| 85 Years and Over | 0 | 0.0% |
| Total | 11 | 100.0% |
Housing Finances in West Roy Lake
Median Income by Occupancy in West Roy Lake
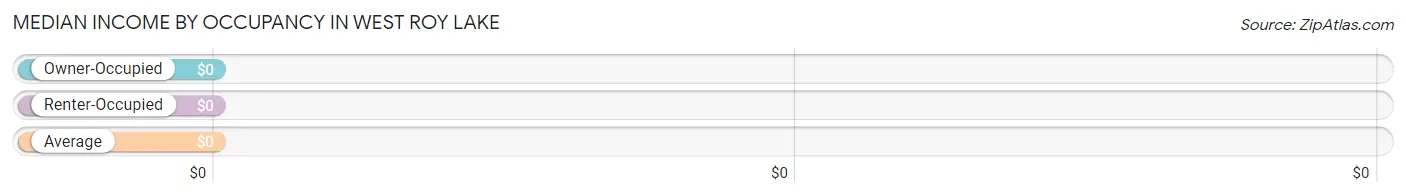
| Occupancy Type | # Households | Median Income |
| Owner-Occupied | 11 (100.0%) | $0 |
| Renter-Occupied | 0 (0.0%) | $0 |
| Average | 11 (100.0%) | $0 |
Occupancy by Householder Income Bracket in West Roy Lake
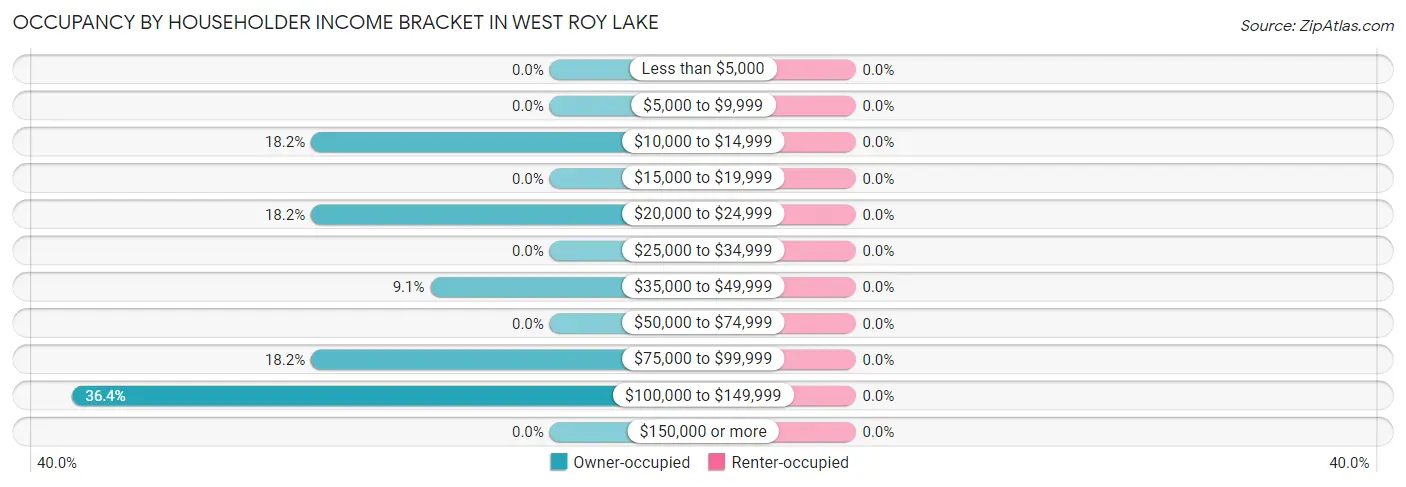
| Income Bracket | Owner-occupied | Renter-occupied |
| Less than $5,000 | 0 (0.0%) | 0 (0.0%) |
| $5,000 to $9,999 | 0 (0.0%) | 0 (0.0%) |
| $10,000 to $14,999 | 2 (18.2%) | 0 (0.0%) |
| $15,000 to $19,999 | 0 (0.0%) | 0 (0.0%) |
| $20,000 to $24,999 | 2 (18.2%) | 0 (0.0%) |
| $25,000 to $34,999 | 0 (0.0%) | 0 (0.0%) |
| $35,000 to $49,999 | 1 (9.1%) | 0 (0.0%) |
| $50,000 to $74,999 | 0 (0.0%) | 0 (0.0%) |
| $75,000 to $99,999 | 2 (18.2%) | 0 (0.0%) |
| $100,000 to $149,999 | 4 (36.4%) | 0 (0.0%) |
| $150,000 or more | 0 (0.0%) | 0 (0.0%) |
| Total | 11 (100.0%) | 0 (0.0%) |
Monthly Housing Cost Tiers in West Roy Lake
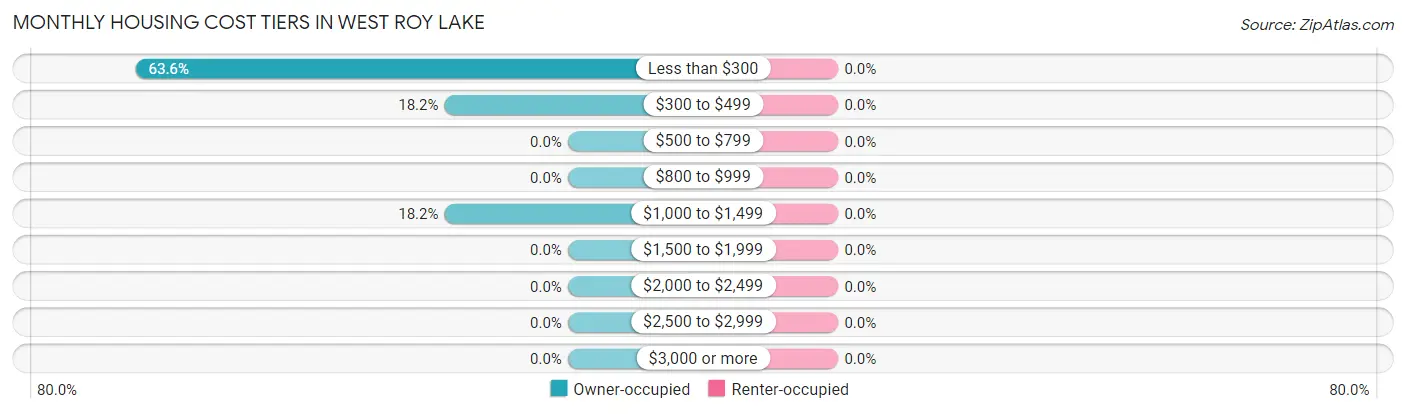
| Monthly Cost | Owner-occupied | Renter-occupied |
| Less than $300 | 7 (63.6%) | 0 (0.0%) |
| $300 to $499 | 2 (18.2%) | 0 (0.0%) |
| $500 to $799 | 0 (0.0%) | 0 (0.0%) |
| $800 to $999 | 0 (0.0%) | 0 (0.0%) |
| $1,000 to $1,499 | 2 (18.2%) | 0 (0.0%) |
| $1,500 to $1,999 | 0 (0.0%) | 0 (0.0%) |
| $2,000 to $2,499 | 0 (0.0%) | 0 (0.0%) |
| $2,500 to $2,999 | 0 (0.0%) | 0 (0.0%) |
| $3,000 or more | 0 (0.0%) | 0 (0.0%) |
| Total | 11 (100.0%) | 0 (0.0%) |
Physical Housing Characteristics in West Roy Lake
Housing Structures in West Roy Lake
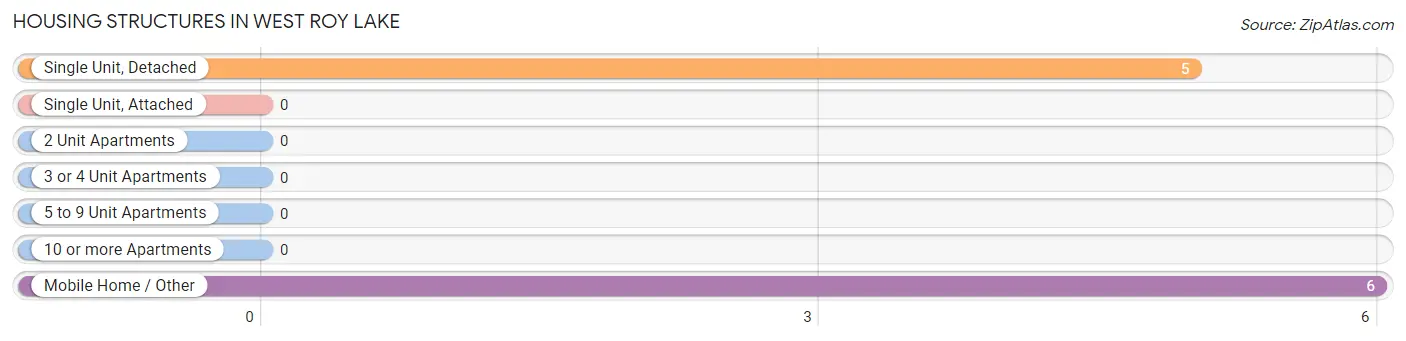
| Structure Type | # Housing Units | % Housing Units |
| Single Unit, Detached | 5 | 45.5% |
| Single Unit, Attached | 0 | 0.0% |
| 2 Unit Apartments | 0 | 0.0% |
| 3 or 4 Unit Apartments | 0 | 0.0% |
| 5 to 9 Unit Apartments | 0 | 0.0% |
| 10 or more Apartments | 0 | 0.0% |
| Mobile Home / Other | 6 | 54.5% |
| Total | 11 | 100.0% |
Housing Structures by Occupancy in West Roy Lake
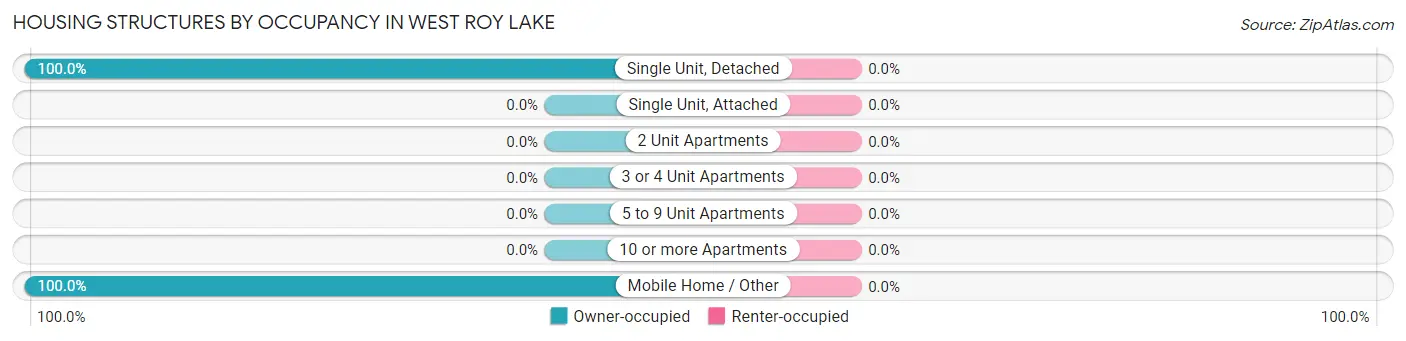
| Structure Type | Owner-occupied | Renter-occupied |
| Single Unit, Detached | 5 (100.0%) | 0 (0.0%) |
| Single Unit, Attached | 0 (0.0%) | 0 (0.0%) |
| 2 Unit Apartments | 0 (0.0%) | 0 (0.0%) |
| 3 or 4 Unit Apartments | 0 (0.0%) | 0 (0.0%) |
| 5 to 9 Unit Apartments | 0 (0.0%) | 0 (0.0%) |
| 10 or more Apartments | 0 (0.0%) | 0 (0.0%) |
| Mobile Home / Other | 6 (100.0%) | 0 (0.0%) |
| Total | 11 (100.0%) | 0 (0.0%) |
Housing Structures by Number of Rooms in West Roy Lake
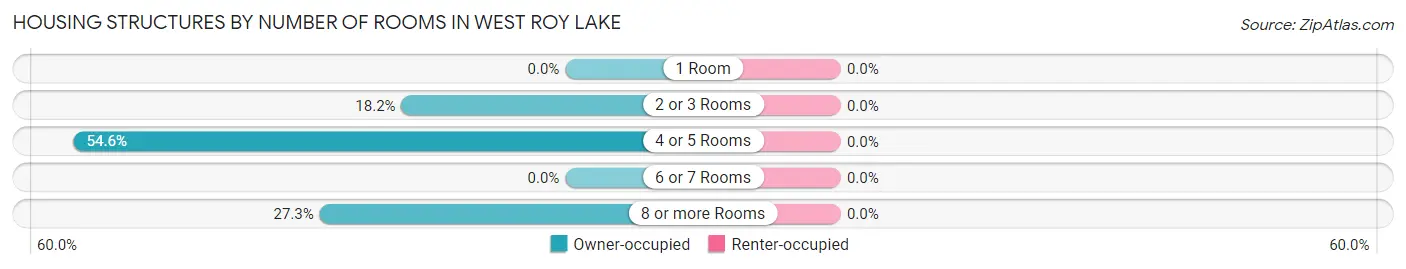
| Number of Rooms | Owner-occupied | Renter-occupied |
| 1 Room | 0 (0.0%) | 0 (0.0%) |
| 2 or 3 Rooms | 2 (18.2%) | 0 (0.0%) |
| 4 or 5 Rooms | 6 (54.5%) | 0 (0.0%) |
| 6 or 7 Rooms | 0 (0.0%) | 0 (0.0%) |
| 8 or more Rooms | 3 (27.3%) | 0 (0.0%) |
| Total | 11 (100.0%) | 0 (0.0%) |
Housing Structure by Heating Type in West Roy Lake
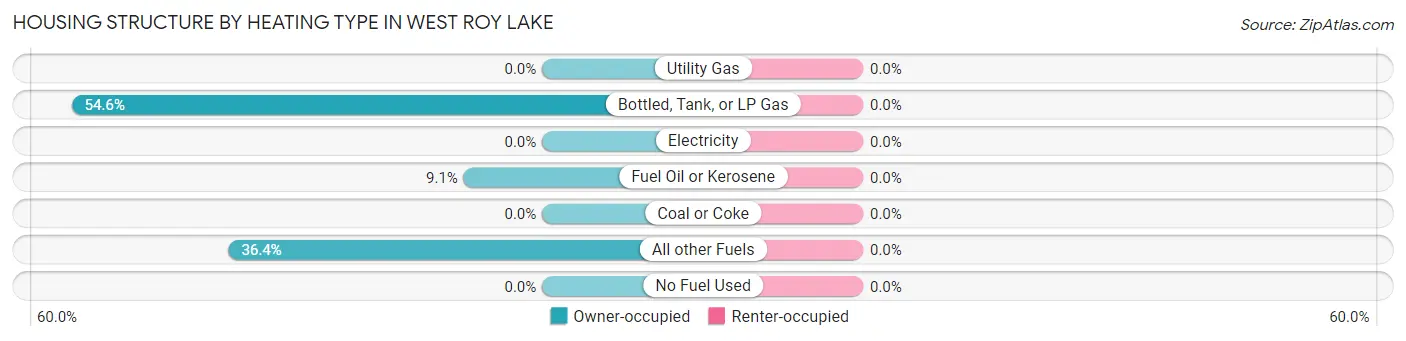
| Heating Type | Owner-occupied | Renter-occupied |
| Utility Gas | 0 (0.0%) | 0 (0.0%) |
| Bottled, Tank, or LP Gas | 6 (54.5%) | 0 (0.0%) |
| Electricity | 0 (0.0%) | 0 (0.0%) |
| Fuel Oil or Kerosene | 1 (9.1%) | 0 (0.0%) |
| Coal or Coke | 0 (0.0%) | 0 (0.0%) |
| All other Fuels | 4 (36.4%) | 0 (0.0%) |
| No Fuel Used | 0 (0.0%) | 0 (0.0%) |
| Total | 11 (100.0%) | 0 (0.0%) |
Household Vehicle Usage in West Roy Lake
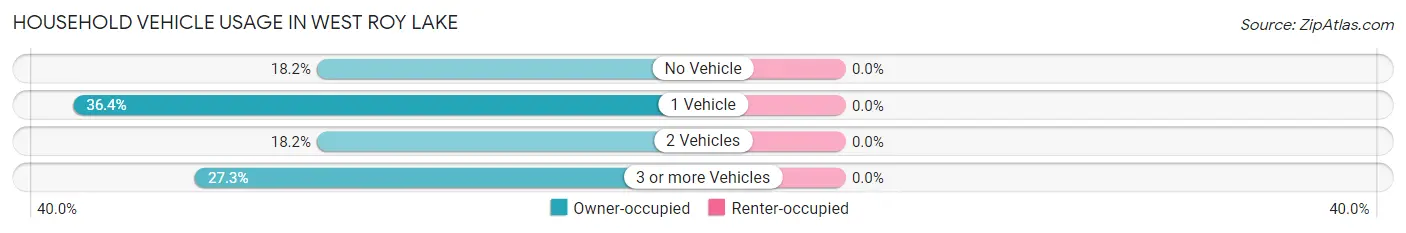
| Vehicles per Household | Owner-occupied | Renter-occupied |
| No Vehicle | 2 (18.2%) | 0 (0.0%) |
| 1 Vehicle | 4 (36.4%) | 0 (0.0%) |
| 2 Vehicles | 2 (18.2%) | 0 (0.0%) |
| 3 or more Vehicles | 3 (27.3%) | 0 (0.0%) |
| Total | 11 (100.0%) | 0 (0.0%) |
Real Estate & Mortgages in West Roy Lake
Real Estate and Mortgage Overview in West Roy Lake
| Characteristic | Without Mortgage | With Mortgage |
| Housing Units | 9 | 2 |
| Median Property Value | $18,100 | $0 |
| Median Household Income | - | - |
| Monthly Housing Costs | $275 | $0 |
| Real Estate Taxes | - | - |
Property Value by Mortgage Status in West Roy Lake
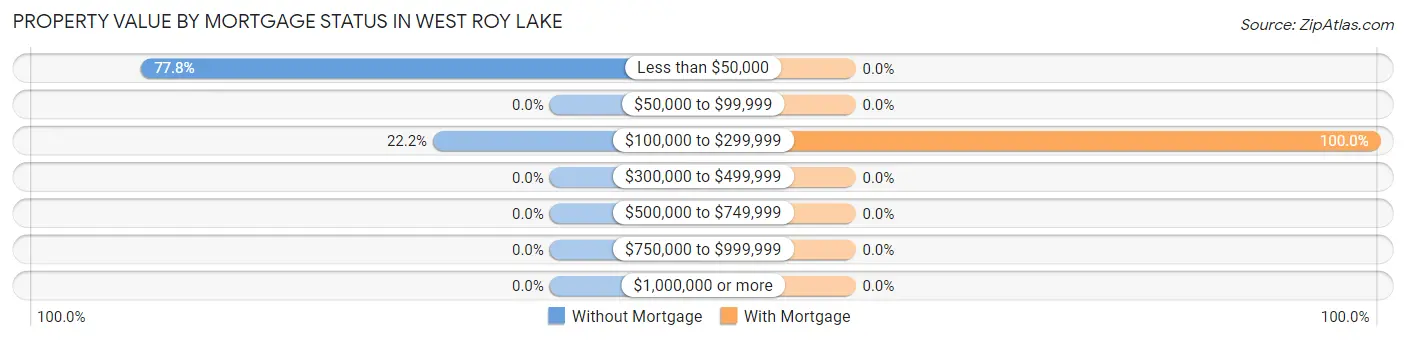
| Property Value | Without Mortgage | With Mortgage |
| Less than $50,000 | 7 (77.8%) | 0 (0.0%) |
| $50,000 to $99,999 | 0 (0.0%) | 0 (0.0%) |
| $100,000 to $299,999 | 2 (22.2%) | 2 (100.0%) |
| $300,000 to $499,999 | 0 (0.0%) | 0 (0.0%) |
| $500,000 to $749,999 | 0 (0.0%) | 0 (0.0%) |
| $750,000 to $999,999 | 0 (0.0%) | 0 (0.0%) |
| $1,000,000 or more | 0 (0.0%) | 0 (0.0%) |
| Total | 9 (100.0%) | 2 (100.0%) |
Household Income by Mortgage Status in West Roy Lake
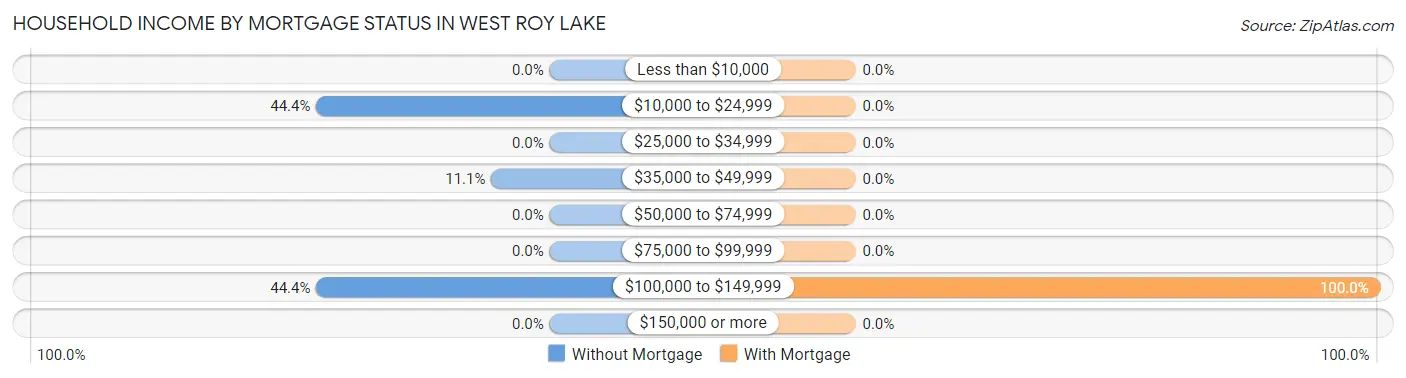
| Household Income | Without Mortgage | With Mortgage |
| Less than $10,000 | 0 (0.0%) | 0 (0.0%) |
| $10,000 to $24,999 | 4 (44.4%) | 0 (0.0%) |
| $25,000 to $34,999 | 0 (0.0%) | 0 (0.0%) |
| $35,000 to $49,999 | 1 (11.1%) | 0 (0.0%) |
| $50,000 to $74,999 | 0 (0.0%) | 0 (0.0%) |
| $75,000 to $99,999 | 0 (0.0%) | 0 (0.0%) |
| $100,000 to $149,999 | 4 (44.4%) | 2 (100.0%) |
| $150,000 or more | 0 (0.0%) | 0 (0.0%) |
| Total | 9 (100.0%) | 2 (100.0%) |
Property Value to Household Income Ratio in West Roy Lake
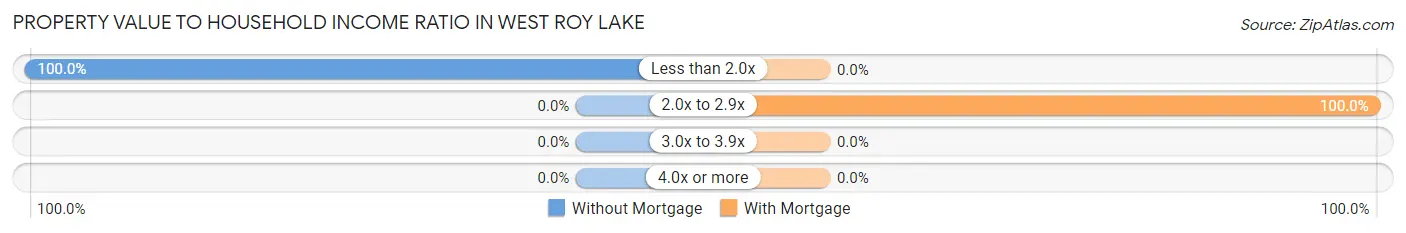
| Value-to-Income Ratio | Without Mortgage | With Mortgage |
| Less than 2.0x | 9 (100.0%) | 0 (0.0%) |
| 2.0x to 2.9x | 0 (0.0%) | 2 (100.0%) |
| 3.0x to 3.9x | 0 (0.0%) | 0 (0.0%) |
| 4.0x or more | 0 (0.0%) | 0 (0.0%) |
| Total | 9 (100.0%) | 2 (100.0%) |
Real Estate Taxes by Mortgage Status in West Roy Lake
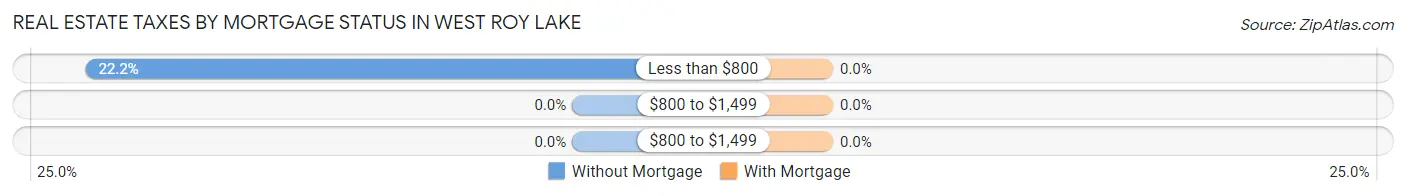
| Property Taxes | Without Mortgage | With Mortgage |
| Less than $800 | 2 (22.2%) | 0 (0.0%) |
| $800 to $1,499 | 0 (0.0%) | 0 (0.0%) |
| $800 to $1,499 | 0 (0.0%) | 0 (0.0%) |
| Total | 9 (100.0%) | 2 (100.0%) |
Health & Disability in West Roy Lake
Health Insurance Coverage by Age in West Roy Lake
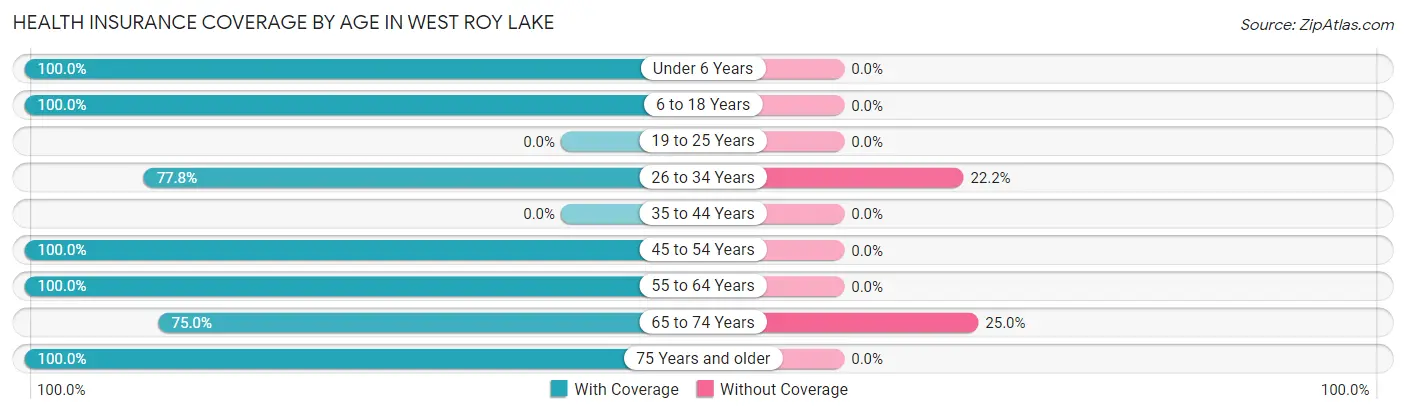
| Age Bracket | With Coverage | Without Coverage |
| Under 6 Years | 5 (100.0%) | 0 (0.0%) |
| 6 to 18 Years | 11 (100.0%) | 0 (0.0%) |
| 19 to 25 Years | 0 (0.0%) | 0 (0.0%) |
| 26 to 34 Years | 7 (77.8%) | 2 (22.2%) |
| 35 to 44 Years | 0 (0.0%) | 0 (0.0%) |
| 45 to 54 Years | 6 (100.0%) | 0 (0.0%) |
| 55 to 64 Years | 3 (100.0%) | 0 (0.0%) |
| 65 to 74 Years | 6 (75.0%) | 2 (25.0%) |
| 75 Years and older | 1 (100.0%) | 0 (0.0%) |
| Total | 39 (90.7%) | 4 (9.3%) |
Health Insurance Coverage by Citizenship Status in West Roy Lake
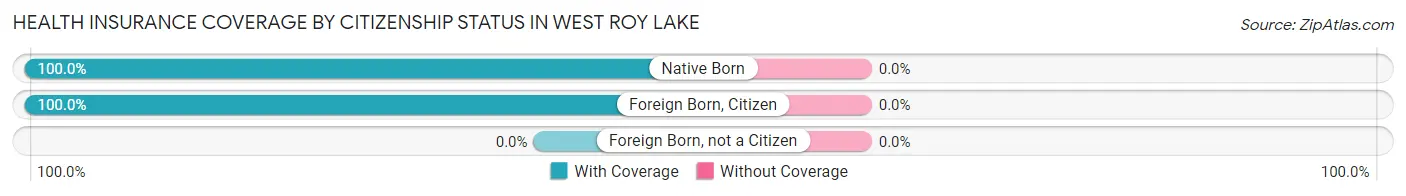
| Citizenship Status | With Coverage | Without Coverage |
| Native Born | 5 (100.0%) | 0 (0.0%) |
| Foreign Born, Citizen | 11 (100.0%) | 0 (0.0%) |
| Foreign Born, not a Citizen | 0 (0.0%) | 0 (0.0%) |
Health Insurance Coverage by Household Income in West Roy Lake
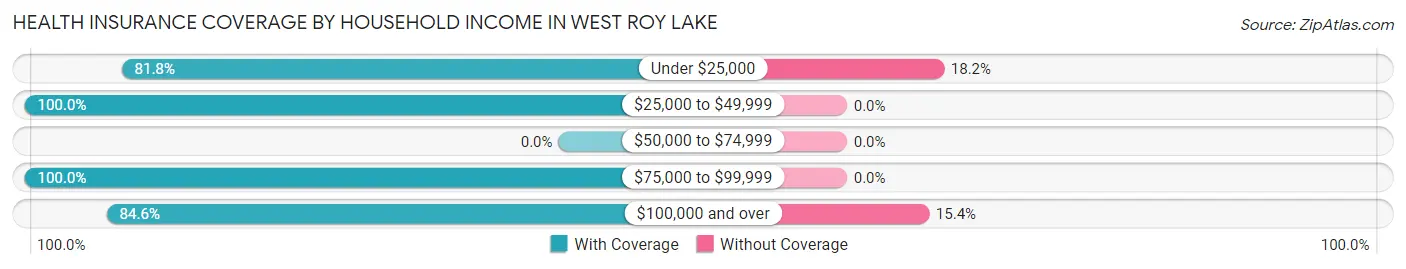
| Household Income | With Coverage | Without Coverage |
| Under $25,000 | 9 (81.8%) | 2 (18.2%) |
| $25,000 to $49,999 | 15 (100.0%) | 0 (0.0%) |
| $50,000 to $74,999 | 0 (0.0%) | 0 (0.0%) |
| $75,000 to $99,999 | 4 (100.0%) | 0 (0.0%) |
| $100,000 and over | 11 (84.6%) | 2 (15.4%) |
Public vs Private Health Insurance Coverage by Age in West Roy Lake
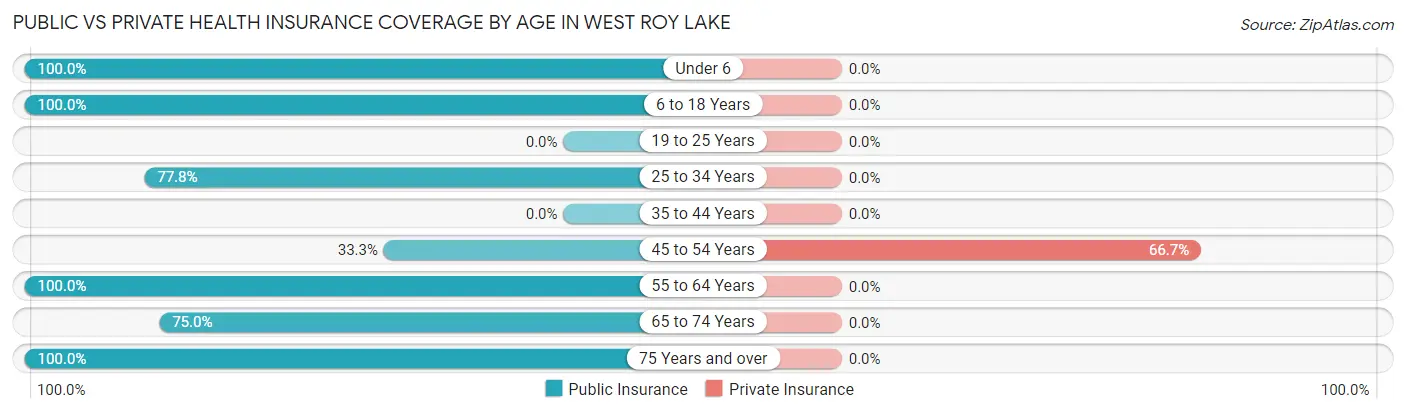
| Age Bracket | Public Insurance | Private Insurance |
| Under 6 | 5 (100.0%) | 0 (0.0%) |
| 6 to 18 Years | 11 (100.0%) | 0 (0.0%) |
| 19 to 25 Years | 0 (0.0%) | 0 (0.0%) |
| 25 to 34 Years | 7 (77.8%) | 0 (0.0%) |
| 35 to 44 Years | 0 (0.0%) | 0 (0.0%) |
| 45 to 54 Years | 2 (33.3%) | 4 (66.7%) |
| 55 to 64 Years | 3 (100.0%) | 0 (0.0%) |
| 65 to 74 Years | 6 (75.0%) | 0 (0.0%) |
| 75 Years and over | 1 (100.0%) | 0 (0.0%) |
| Total | 35 (81.4%) | 4 (9.3%) |
Disability Status by Sex by Age in West Roy Lake
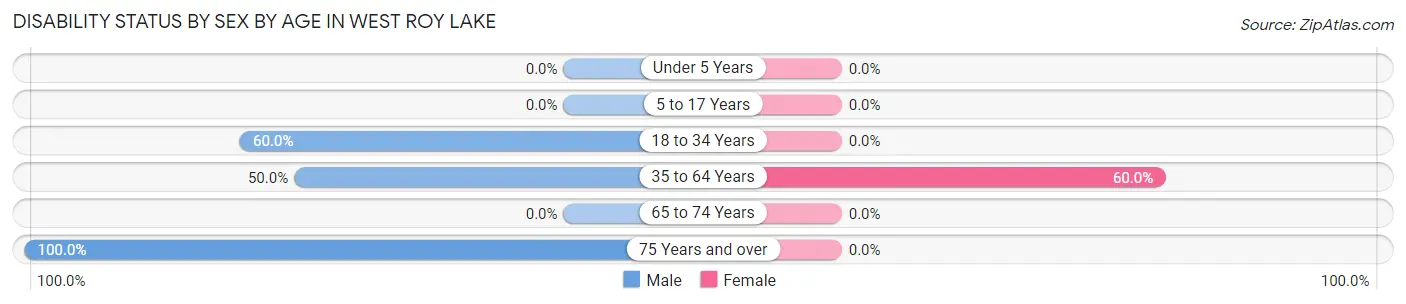
| Age Bracket | Male | Female |
| Under 5 Years | 0 (0.0%) | 0 (0.0%) |
| 5 to 17 Years | 0 (0.0%) | 0 (0.0%) |
| 18 to 34 Years | 3 (60.0%) | 0 (0.0%) |
| 35 to 64 Years | 2 (50.0%) | 3 (60.0%) |
| 65 to 74 Years | 0 (0.0%) | 0 (0.0%) |
| 75 Years and over | 1 (100.0%) | 0 (0.0%) |
Disability Class by Sex by Age in West Roy Lake
Disability Class: Hearing Difficulty
| Age Bracket | Male | Female |
| Under 5 Years | 0 (0.0%) | 0 (0.0%) |
| 5 to 17 Years | 0 (0.0%) | 0 (0.0%) |
| 18 to 34 Years | 0 (0.0%) | 0 (0.0%) |
| 35 to 64 Years | 0 (0.0%) | 0 (0.0%) |
| 65 to 74 Years | 0 (0.0%) | 0 (0.0%) |
| 75 Years and over | 0 (0.0%) | 0 (0.0%) |
Disability Class: Vision Difficulty
| Age Bracket | Male | Female |
| Under 5 Years | 0 (0.0%) | 0 (0.0%) |
| 5 to 17 Years | 0 (0.0%) | 0 (0.0%) |
| 18 to 34 Years | 0 (0.0%) | 0 (0.0%) |
| 35 to 64 Years | 0 (0.0%) | 0 (0.0%) |
| 65 to 74 Years | 0 (0.0%) | 0 (0.0%) |
| 75 Years and over | 0 (0.0%) | 0 (0.0%) |
Disability Class: Cognitive Difficulty
| Age Bracket | Male | Female |
| 5 to 17 Years | 0 (0.0%) | 0 (0.0%) |
| 18 to 34 Years | 3 (60.0%) | 0 (0.0%) |
| 35 to 64 Years | 2 (50.0%) | 0 (0.0%) |
| 65 to 74 Years | 0 (0.0%) | 0 (0.0%) |
| 75 Years and over | 0 (0.0%) | 0 (0.0%) |
Disability Class: Ambulatory Difficulty
| Age Bracket | Male | Female |
| 5 to 17 Years | 0 (0.0%) | 0 (0.0%) |
| 18 to 34 Years | 0 (0.0%) | 0 (0.0%) |
| 35 to 64 Years | 0 (0.0%) | 3 (60.0%) |
| 65 to 74 Years | 0 (0.0%) | 0 (0.0%) |
| 75 Years and over | 1 (100.0%) | 0 (0.0%) |
Disability Class: Self-Care Difficulty
| Age Bracket | Male | Female |
| 5 to 17 Years | 0 (0.0%) | 0 (0.0%) |
| 18 to 34 Years | 0 (0.0%) | 0 (0.0%) |
| 35 to 64 Years | 0 (0.0%) | 0 (0.0%) |
| 65 to 74 Years | 0 (0.0%) | 0 (0.0%) |
| 75 Years and over | 0 (0.0%) | 0 (0.0%) |
Technology Access in West Roy Lake
Computing Device Access in West Roy Lake
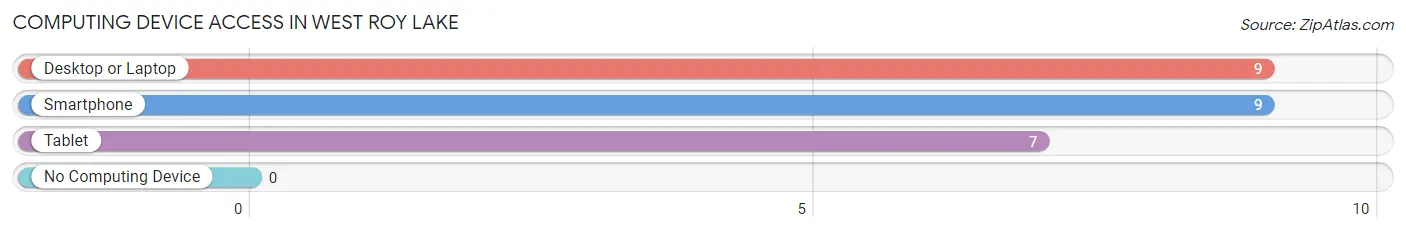
| Device Type | # Households | % Households |
| Desktop or Laptop | 9 | 81.8% |
| Smartphone | 9 | 81.8% |
| Tablet | 7 | 63.6% |
| No Computing Device | 0 | 0.0% |
| Total | 11 | 100.0% |
Internet Access in West Roy Lake
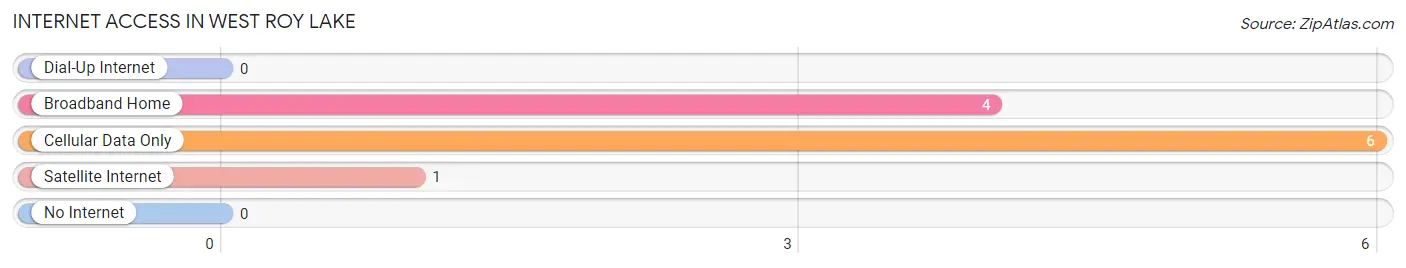
| Internet Type | # Households | % Households |
| Dial-Up Internet | 0 | 0.0% |
| Broadband Home | 4 | 36.4% |
| Cellular Data Only | 6 | 54.5% |
| Satellite Internet | 1 | 9.1% |
| No Internet | 0 | 0.0% |
| Total | 11 | 100.0% |
West Roy Lake Summary
Roy Lake is a small lake located in the north-central part of Minnesota, in the United States. It is located in the Chippewa National Forest, and is part of the Leech Lake Indian Reservation. The lake is approximately 1,400 acres in size, and is the largest lake in the Chippewa National Forest.
History
The area around Roy Lake has been inhabited by Native Americans for centuries. The lake was named after Chief Roy, a leader of the Ojibwe people who lived in the area. The lake was first surveyed in 1882, and was used for logging and fishing. In the early 1900s, the lake was used for recreational activities such as swimming, boating, and fishing.
In the 1930s, the Civilian Conservation Corps (CCC) built a camp on the lake, which was used to provide employment for local residents. The camp was used to build roads, trails, and other infrastructure in the area. The camp was eventually closed in the 1940s, but the infrastructure it built still remains.
In the 1950s, the lake was used for recreational activities such as swimming, boating, and fishing. In the 1960s, the lake was used for water skiing and other water sports. In the 1970s, the lake was used for recreational activities such as camping, hiking, and fishing.
Geography
Roy Lake is located in the north-central part of Minnesota, in the United States. It is located in the Chippewa National Forest, and is part of the Leech Lake Indian Reservation. The lake is approximately 1,400 acres in size, and is the largest lake in the Chippewa National Forest. The lake is surrounded by a variety of trees, including white pine, red pine, and jack pine. The lake is fed by several small streams, and is drained by the Roy River.
Economy
The economy of Roy Lake is largely based on tourism and recreation. The lake is a popular destination for fishing, boating, swimming, camping, and other outdoor activities. The lake is also home to several resorts, which offer a variety of amenities such as cabins, boat rentals, and restaurants. The lake is also home to several marinas, which offer boat rentals and other services.
Demographics
The population of Roy Lake is largely made up of Native Americans, with a small number of non-Native Americans. The majority of the population is of Ojibwe descent, with a small number of other Native American tribes represented. The population of the lake is estimated to be around 500 people. The median age of the population is around 40 years old. The median household income is around $30,000. The majority of the population is employed in the tourism and recreation industry.
Common Questions
What is the Total Population of West Roy Lake?
Total Population of West Roy Lake is 43.
What is the Total Male Population of West Roy Lake?
Total Male Population of West Roy Lake is 16.
What is the Total Female Population of West Roy Lake?
Total Female Population of West Roy Lake is 27.
What is the Ratio of Males per 100 Females in West Roy Lake?
There are 59.26 Males per 100 Females in West Roy Lake.
What is the Ratio of Females per 100 Males in West Roy Lake?
There are 168.75 Females per 100 Males in West Roy Lake.
What is the Median Population Age in West Roy Lake?
Median Population Age in West Roy Lake is 29.9 Years.
What is the Average Family Size in West Roy Lake
Average Family Size in West Roy Lake is 4.6 People.
What is the Average Household Size in West Roy Lake
Average Household Size in West Roy Lake is 3.9 People.
What is Per Capita Income in West Roy Lake?
Per Capita income in West Roy Lake is $18,416.
What is the Median Family Income in West Roy Lake?
Median Family Income in West Roy Lake is $94,375.
What is Inequality or Gini Index in West Roy Lake?
Inequality or Gini Index in West Roy Lake is 0.34.
How Large is the Labor Force in West Roy Lake?
There are 9 People in the Labor Forcein in West Roy Lake.
What is the Percentage of People in the Labor Force in West Roy Lake?
33.3% of People are in the Labor Force in West Roy Lake.