Willernie, MN
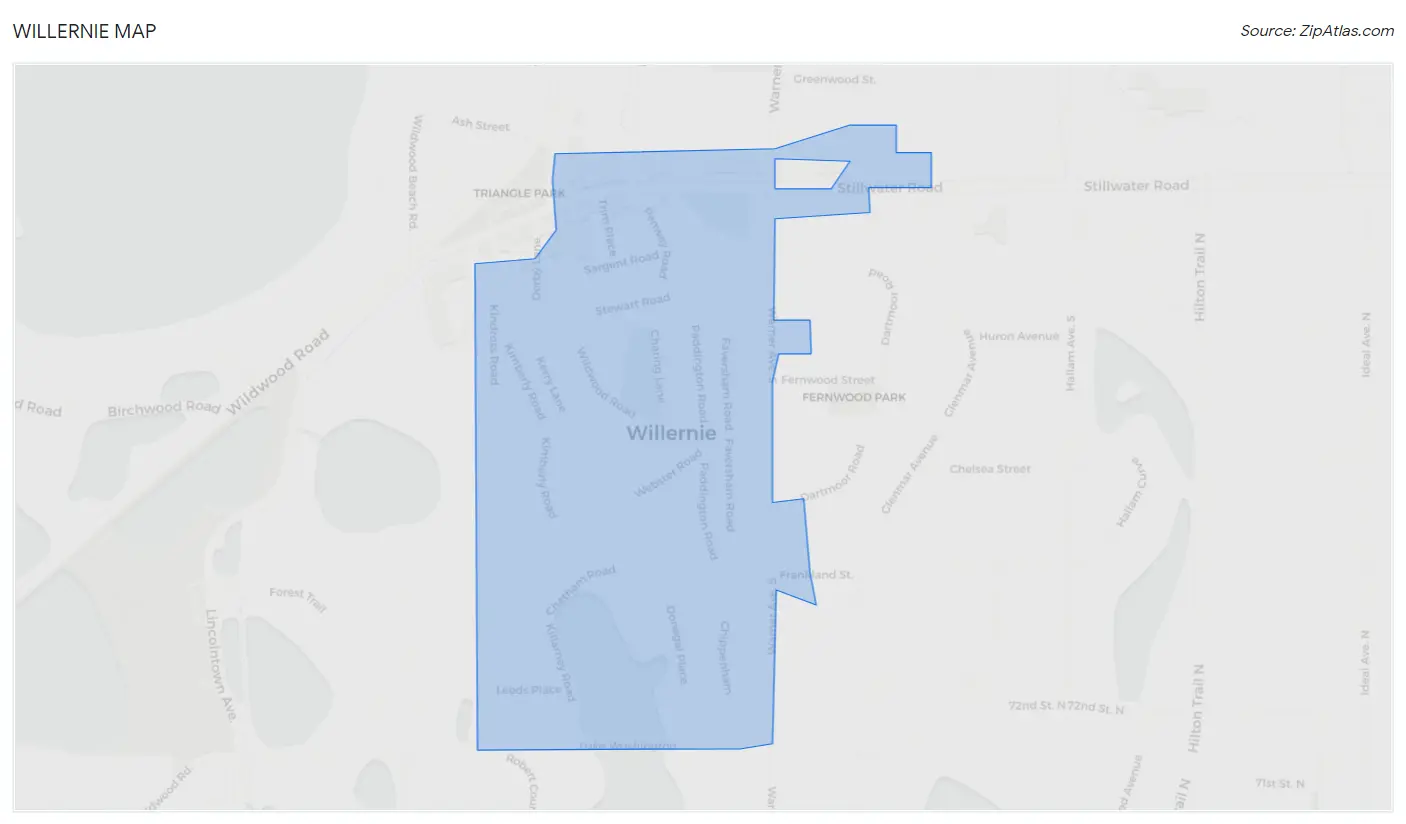
Willernie Map
Willernie Overview
463
TOTAL POPULATION
201
MALE POPULATION
262
FEMALE POPULATION
76.72
MALES / 100 FEMALES
130.35
FEMALES / 100 MALES
38.1
MEDIAN AGE
2.7
AVG FAMILY SIZE
2.2
AVG HOUSEHOLD SIZE
$38,110
PER CAPITA INCOME
$80,625
AVG FAMILY INCOME
$77,321
AVG HOUSEHOLD INCOME
46.5%
WAGE / INCOME GAP [ % ]
53.5¢/ $1
WAGE / INCOME GAP [ $ ]
0.32
INEQUALITY / GINI INDEX
281
LABOR FORCE [ PEOPLE ]
66.7%
PERCENT IN LABOR FORCE
21.0%
UNEMPLOYMENT RATE
Willernie Zip Codes
Willernie Area Codes
Race in Willernie
The most populous races in Willernie are White / Caucasian (445 | 96.1%), Black / African American (14 | 3.0%), and Two or more Races (4 | 0.9%).
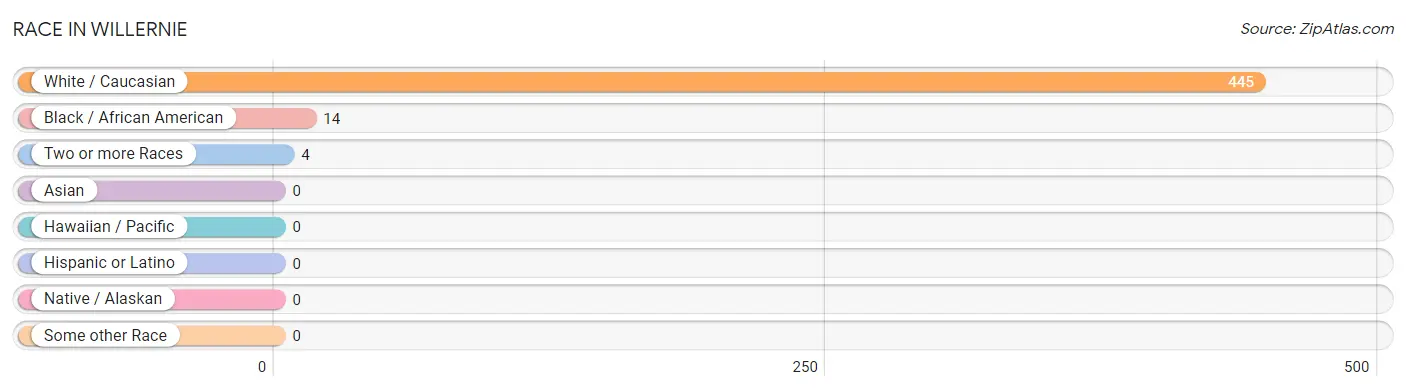
| Race | # Population | % Population |
| Asian | 0 | 0.0% |
| Black / African American | 14 | 3.0% |
| Hawaiian / Pacific | 0 | 0.0% |
| Hispanic or Latino | 0 | 0.0% |
| Native / Alaskan | 0 | 0.0% |
| White / Caucasian | 445 | 96.1% |
| Two or more Races | 4 | 0.9% |
| Some other Race | 0 | 0.0% |
| Total | 463 | 100.0% |
Ancestry in Willernie
The most populous ancestries reported in Willernie are German (226 | 48.8%), Norwegian (77 | 16.6%), French (65 | 14.0%), Czech (58 | 12.5%), and Irish (54 | 11.7%), together accounting for 103.7% of all Willernie residents.
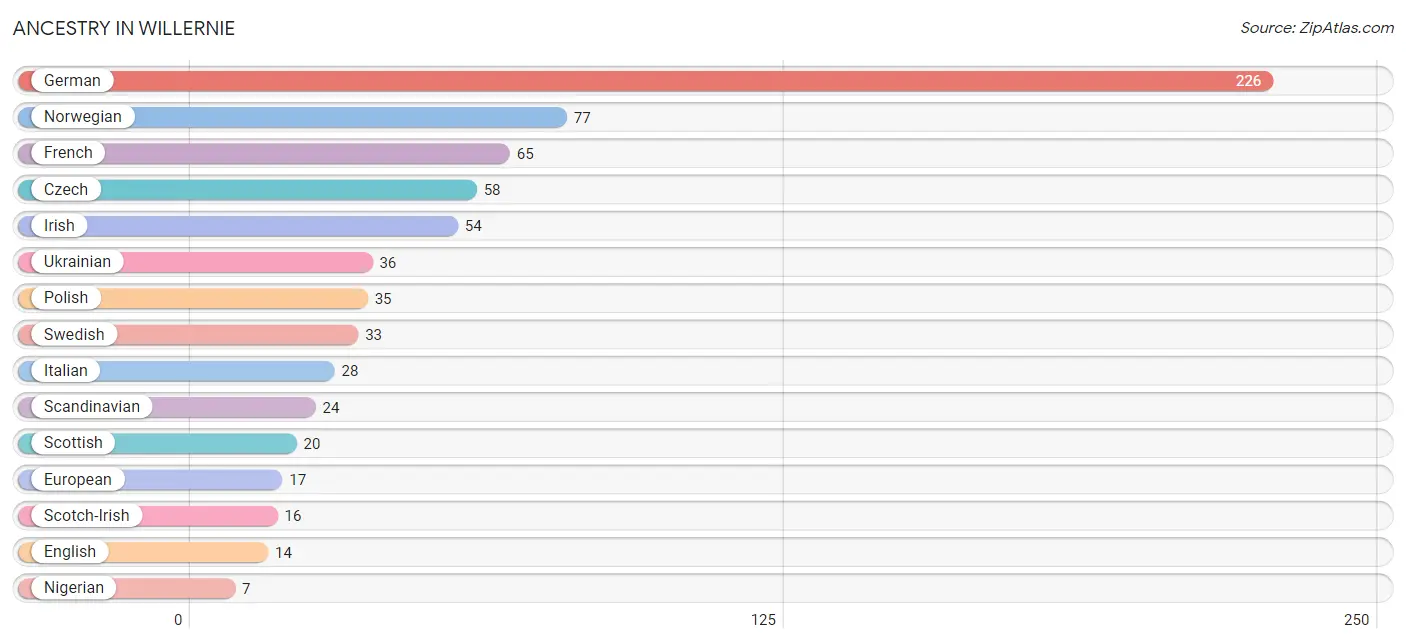
| Ancestry | # Population | % Population |
| Czech | 58 | 12.5% |
| English | 14 | 3.0% |
| European | 17 | 3.7% |
| Finnish | 5 | 1.1% |
| French | 65 | 14.0% |
| German | 226 | 48.8% |
| Irish | 54 | 11.7% |
| Italian | 28 | 6.0% |
| Nigerian | 7 | 1.5% |
| Norwegian | 77 | 16.6% |
| Polish | 35 | 7.6% |
| Russian | 6 | 1.3% |
| Scandinavian | 24 | 5.2% |
| Scotch-Irish | 16 | 3.5% |
| Scottish | 20 | 4.3% |
| Subsaharan African | 7 | 1.5% |
| Swedish | 33 | 7.1% |
| Ukrainian | 36 | 7.8% | View All 18 Rows |
Immigrants in Willernie
The most numerous immigrant groups reported in Willernie came from Eastern Europe (6 | 1.3%), Europe (6 | 1.3%), Russia (6 | 1.3%), Africa (3 | 0.6%), and Nigeria (3 | 0.6%), together accounting for 5.2% of all Willernie residents.
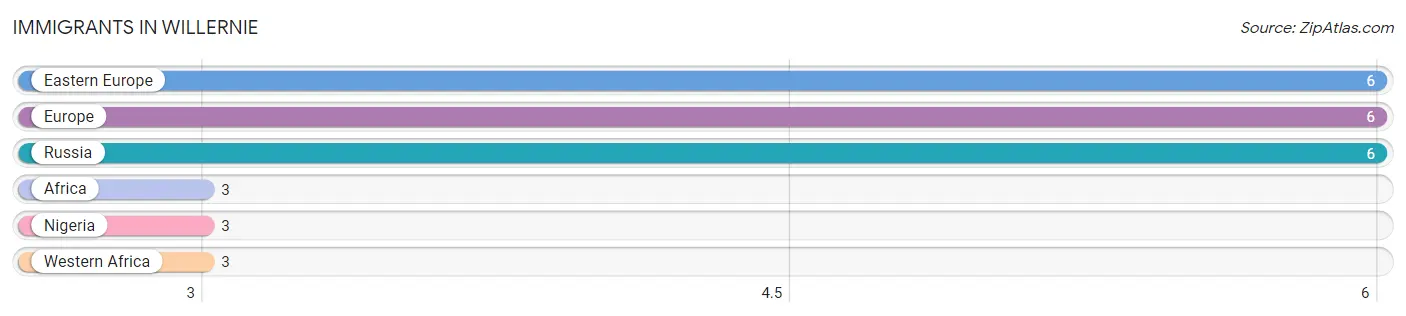
| Immigration Origin | # Population | % Population |
| Africa | 3 | 0.6% |
| Eastern Europe | 6 | 1.3% |
| Europe | 6 | 1.3% |
| Nigeria | 3 | 0.6% |
| Russia | 6 | 1.3% |
| Western Africa | 3 | 0.6% | View All 6 Rows |
Sex and Age in Willernie
Sex and Age in Willernie
The most populous age groups in Willernie are 35 to 39 Years (41 | 20.4%) for men and 25 to 29 Years (55 | 21.0%) for women.
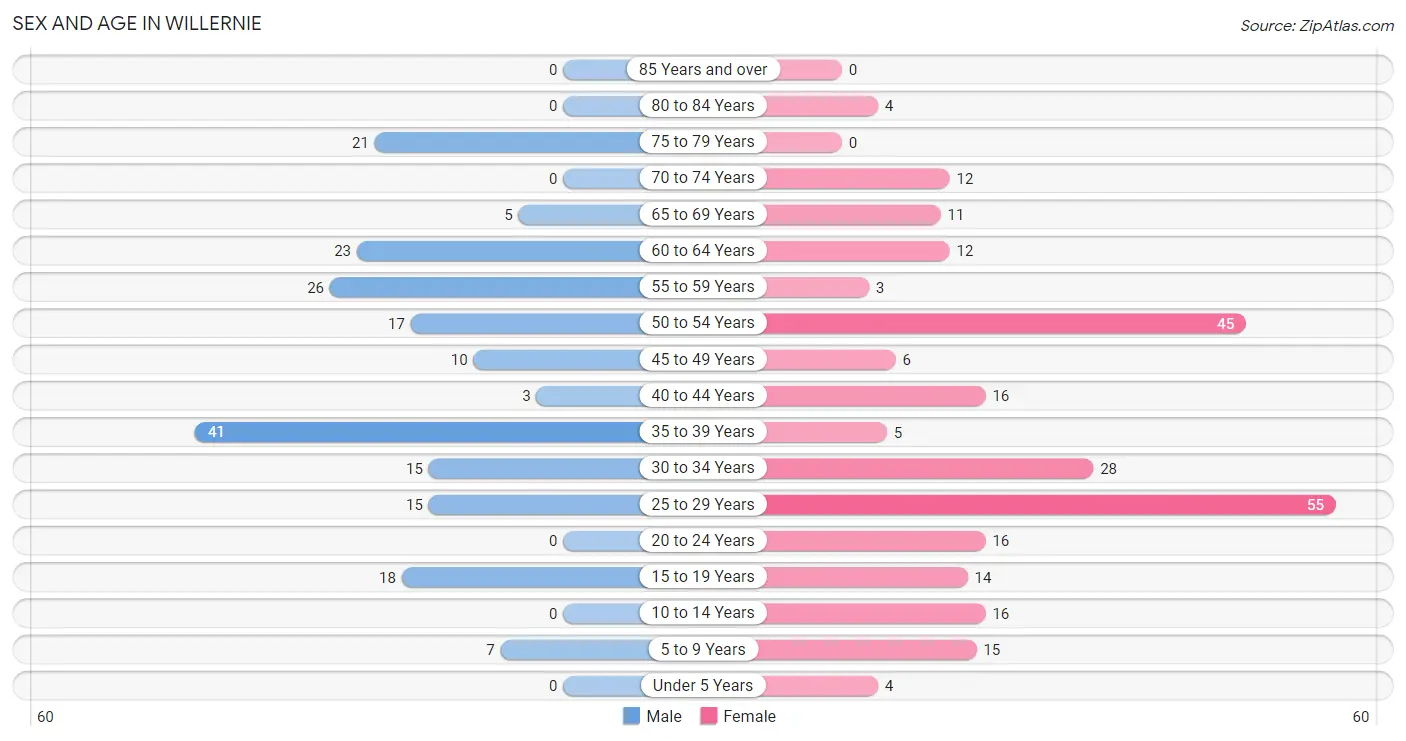
| Age Bracket | Male | Female |
| Under 5 Years | 0 (0.0%) | 4 (1.5%) |
| 5 to 9 Years | 7 (3.5%) | 15 (5.7%) |
| 10 to 14 Years | 0 (0.0%) | 16 (6.1%) |
| 15 to 19 Years | 18 (9.0%) | 14 (5.3%) |
| 20 to 24 Years | 0 (0.0%) | 16 (6.1%) |
| 25 to 29 Years | 15 (7.5%) | 55 (21.0%) |
| 30 to 34 Years | 15 (7.5%) | 28 (10.7%) |
| 35 to 39 Years | 41 (20.4%) | 5 (1.9%) |
| 40 to 44 Years | 3 (1.5%) | 16 (6.1%) |
| 45 to 49 Years | 10 (5.0%) | 6 (2.3%) |
| 50 to 54 Years | 17 (8.5%) | 45 (17.2%) |
| 55 to 59 Years | 26 (12.9%) | 3 (1.1%) |
| 60 to 64 Years | 23 (11.4%) | 12 (4.6%) |
| 65 to 69 Years | 5 (2.5%) | 11 (4.2%) |
| 70 to 74 Years | 0 (0.0%) | 12 (4.6%) |
| 75 to 79 Years | 21 (10.4%) | 0 (0.0%) |
| 80 to 84 Years | 0 (0.0%) | 4 (1.5%) |
| 85 Years and over | 0 (0.0%) | 0 (0.0%) |
| Total | 201 (100.0%) | 262 (100.0%) |
Families and Households in Willernie
Median Family Size in Willernie
The median family size in Willernie is 2.69 persons per family, with single male/father families (49 | 35.0%) accounting for the largest median family size of 3.02 persons per family. On the other hand, single female/mother families (14 | 10.0%) represent the smallest median family size with 2.21 persons per family.
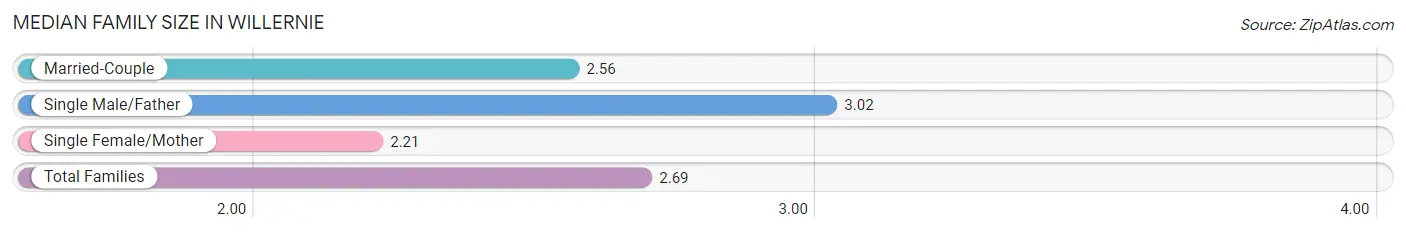
| Family Type | # Families | Family Size |
| Married-Couple | 77 (55.0%) | 2.56 |
| Single Male/Father | 49 (35.0%) | 3.02 |
| Single Female/Mother | 14 (10.0%) | 2.21 |
| Total Families | 140 (100.0%) | 2.69 |
Median Household Size in Willernie
The median household size in Willernie is 2.17 persons per household, with single male/father households (49 | 23.0%) accounting for the largest median household size of 3.02 persons per household. non-family households (73 | 34.3%) represent the smallest median household size with 1.19 persons per household.
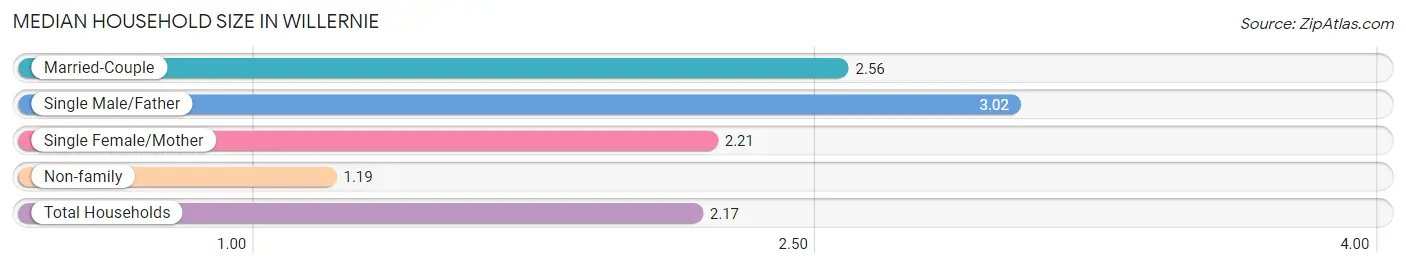
| Household Type | # Households | Household Size |
| Married-Couple | 77 (36.1%) | 2.56 |
| Single Male/Father | 49 (23.0%) | 3.02 |
| Single Female/Mother | 14 (6.6%) | 2.21 |
| Non-family | 73 (34.3%) | 1.19 |
| Total Households | 213 (100.0%) | 2.17 |
Household Size by Marriage Status in Willernie
Out of a total of 213 households in Willernie, 140 (65.7%) are family households, while 73 (34.3%) are nonfamily households. The most numerous type of family households are 2-person households, comprising 95, and the most common type of nonfamily households are 1-person households, comprising 58.
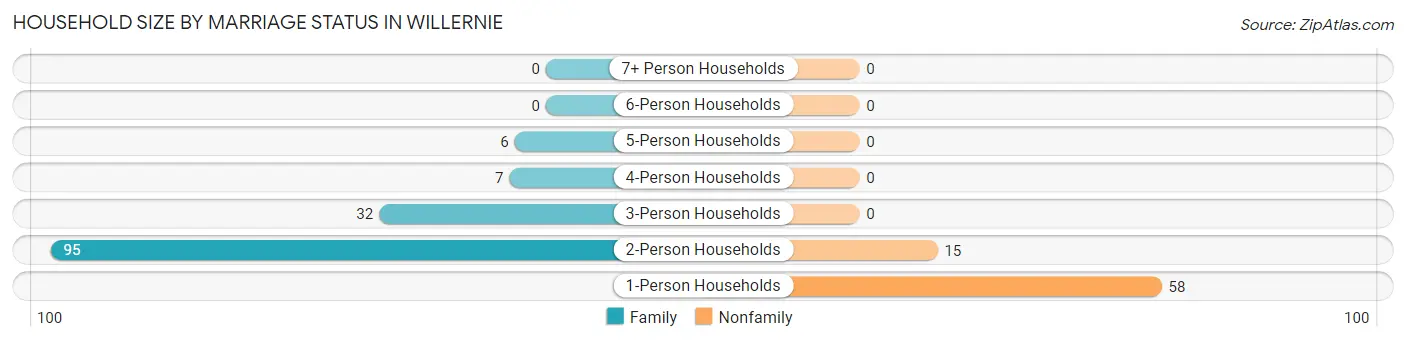
| Household Size | Family Households | Nonfamily Households |
| 1-Person Households | - | 58 (27.2%) |
| 2-Person Households | 95 (44.6%) | 15 (7.0%) |
| 3-Person Households | 32 (15.0%) | 0 (0.0%) |
| 4-Person Households | 7 (3.3%) | 0 (0.0%) |
| 5-Person Households | 6 (2.8%) | 0 (0.0%) |
| 6-Person Households | 0 (0.0%) | 0 (0.0%) |
| 7+ Person Households | 0 (0.0%) | 0 (0.0%) |
| Total | 140 (65.7%) | 73 (34.3%) |
Female Fertility in Willernie
Fertility by Age in Willernie
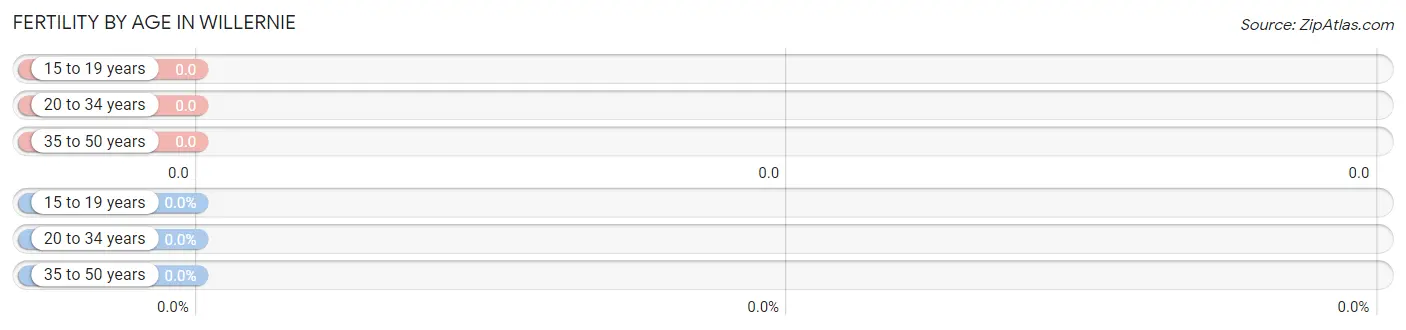
| Age Bracket | Women with Births | Births / 1,000 Women |
| 15 to 19 years | 0 (0.0%) | 0.0 |
| 20 to 34 years | 0 (0.0%) | 0.0 |
| 35 to 50 years | 0 (0.0%) | 0.0 |
| Total | 0 (0.0%) | 0.0 |
Fertility by Age by Marriage Status in Willernie
| Age Bracket | Married | Unmarried |
| 15 to 19 years | 0 (0.0%) | 0 (0.0%) |
| 20 to 34 years | 0 (0.0%) | 0 (0.0%) |
| 35 to 50 years | 0 (0.0%) | 0 (0.0%) |
| Total | 0 (0.0%) | 0 (0.0%) |
Fertility by Education in Willernie
| Educational Attainment | Women with Births | Births / 1,000 Women |
| Less than High School | 0 (0.0%) | 0.0 |
| High School Diploma | 0 (0.0%) | 0.0 |
| College or Associate's Degree | 0 (0.0%) | 0.0 |
| Bachelor's Degree | 0 (0.0%) | 0.0 |
| Graduate Degree | 0 (0.0%) | 0.0 |
| Total | 0 (0.0%) | 0.0 |
Fertility by Education by Marriage Status in Willernie
| Educational Attainment | Married | Unmarried |
| Less than High School | 0 (0.0%) | 0 (0.0%) |
| High School Diploma | 0 (0.0%) | 0 (0.0%) |
| College or Associate's Degree | 0 (0.0%) | 0 (0.0%) |
| Bachelor's Degree | 0 (0.0%) | 0 (0.0%) |
| Graduate Degree | 0 (0.0%) | 0 (0.0%) |
| Total | 0 (0.0%) | 0 (0.0%) |
Income in Willernie
Income Overview in Willernie
Per Capita Income in Willernie is $38,110, while median incomes of families and households are $80,625 and $77,321 respectively.
| Characteristic | Number | Measure |
| Per Capita Income | 463 | $38,110 |
| Median Family Income | 140 | $80,625 |
| Mean Family Income | 140 | $94,436 |
| Median Household Income | 213 | $77,321 |
| Mean Household Income | 213 | $83,185 |
| Income Deficit | 140 | $0 |
| Wage / Income Gap (%) | 463 | 46.54% |
| Wage / Income Gap ($) | 463 | 53.46¢ per $1 |
| Gini / Inequality Index | 463 | 0.32 |
Earnings by Sex in Willernie
Average Earnings in Willernie are $49,135, $75,288 for men and $40,250 for women, a difference of 46.5%.
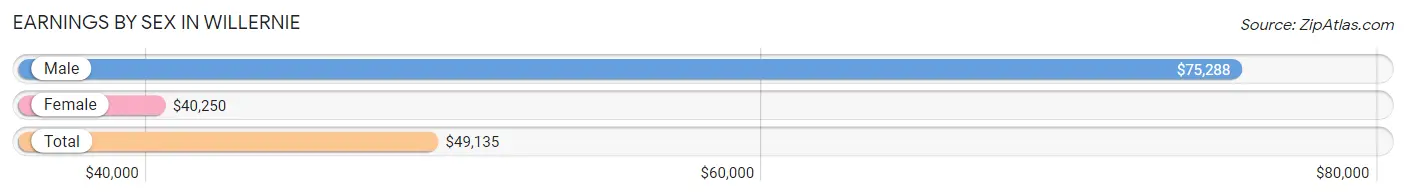
| Sex | Number | Average Earnings |
| Male | 152 (53.3%) | $75,288 |
| Female | 133 (46.7%) | $40,250 |
| Total | 285 (100.0%) | $49,135 |
Earnings by Sex by Income Bracket in Willernie
The most common earnings brackets in Willernie are $75,000 to $99,999 for men (60 | 39.5%) and $2,499 or less for women (27 | 20.3%).
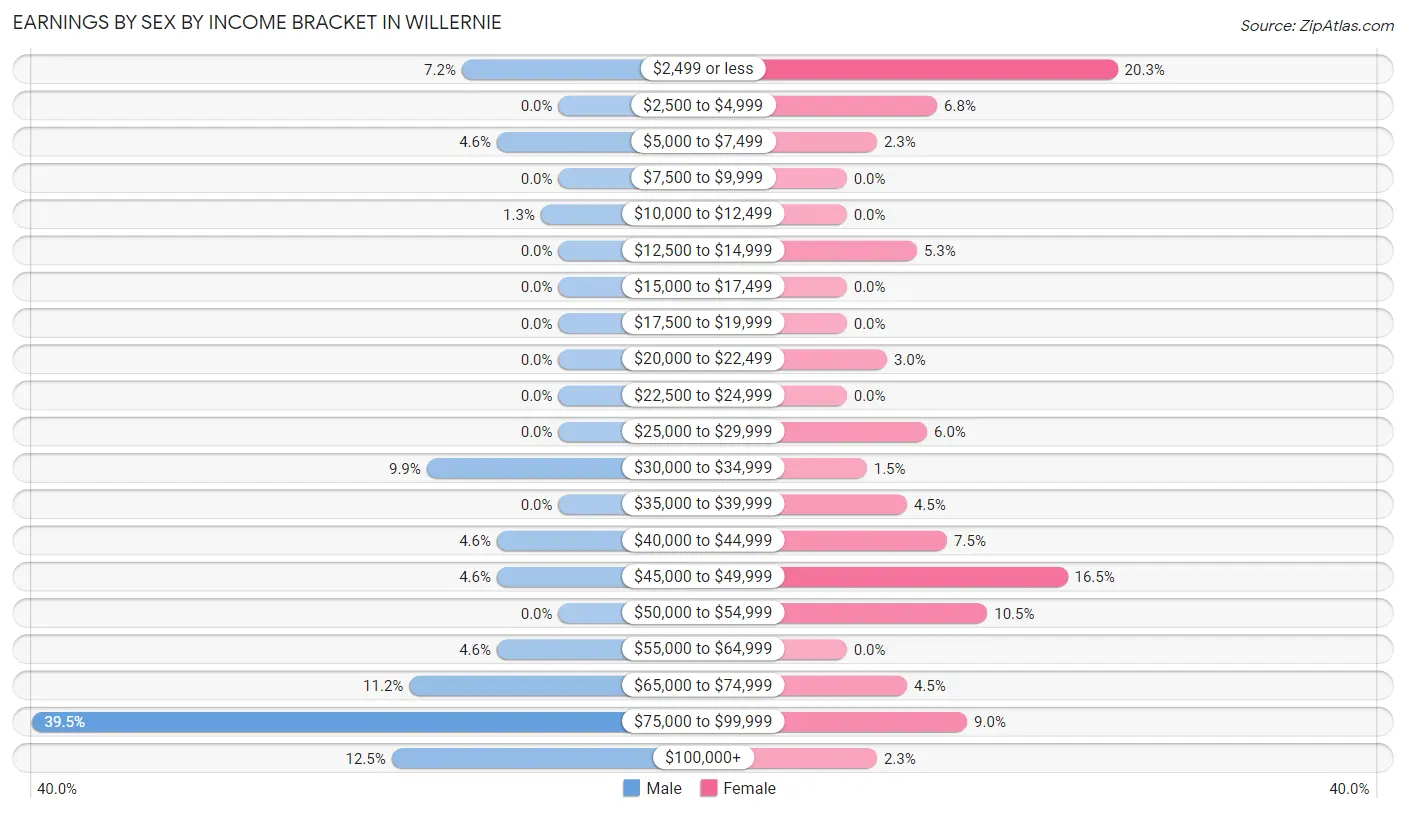
| Income | Male | Female |
| $2,499 or less | 11 (7.2%) | 27 (20.3%) |
| $2,500 to $4,999 | 0 (0.0%) | 9 (6.8%) |
| $5,000 to $7,499 | 7 (4.6%) | 3 (2.3%) |
| $7,500 to $9,999 | 0 (0.0%) | 0 (0.0%) |
| $10,000 to $12,499 | 2 (1.3%) | 0 (0.0%) |
| $12,500 to $14,999 | 0 (0.0%) | 7 (5.3%) |
| $15,000 to $17,499 | 0 (0.0%) | 0 (0.0%) |
| $17,500 to $19,999 | 0 (0.0%) | 0 (0.0%) |
| $20,000 to $22,499 | 0 (0.0%) | 4 (3.0%) |
| $22,500 to $24,999 | 0 (0.0%) | 0 (0.0%) |
| $25,000 to $29,999 | 0 (0.0%) | 8 (6.0%) |
| $30,000 to $34,999 | 15 (9.9%) | 2 (1.5%) |
| $35,000 to $39,999 | 0 (0.0%) | 6 (4.5%) |
| $40,000 to $44,999 | 7 (4.6%) | 10 (7.5%) |
| $45,000 to $49,999 | 7 (4.6%) | 22 (16.5%) |
| $50,000 to $54,999 | 0 (0.0%) | 14 (10.5%) |
| $55,000 to $64,999 | 7 (4.6%) | 0 (0.0%) |
| $65,000 to $74,999 | 17 (11.2%) | 6 (4.5%) |
| $75,000 to $99,999 | 60 (39.5%) | 12 (9.0%) |
| $100,000+ | 19 (12.5%) | 3 (2.3%) |
| Total | 152 (100.0%) | 133 (100.0%) |
Earnings by Sex by Educational Attainment in Willernie
Average earnings in Willernie are $76,154 for men and $42,250 for women, a difference of 44.5%. Men with an educational attainment of bachelor's degree enjoy the highest average annual earnings of $77,159, while those with college or associate's degree education earn the least with $56,250. Women with an educational attainment of bachelor's degree earn the most with the average annual earnings of $50,179, while those with high school diploma education have the smallest earnings of $2,499.
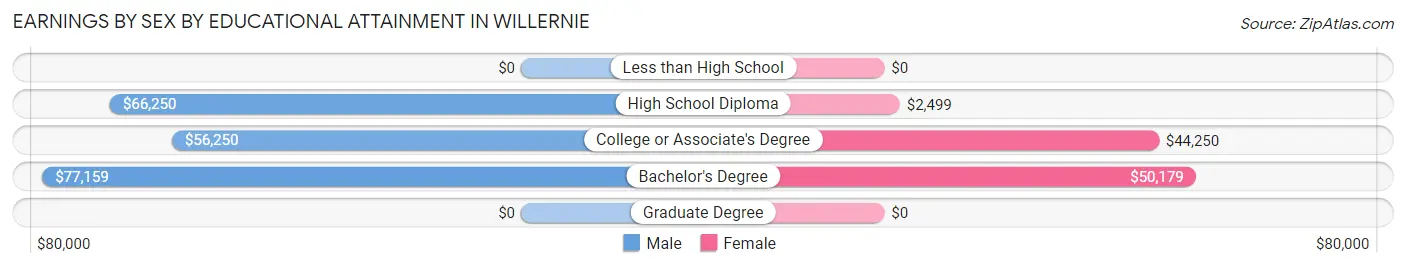
| Educational Attainment | Male Income | Female Income |
| Less than High School | - | - |
| High School Diploma | $66,250 | $2,499 |
| College or Associate's Degree | $56,250 | $44,250 |
| Bachelor's Degree | $77,159 | $50,179 |
| Graduate Degree | - | - |
| Total | $76,154 | $42,250 |
Family Income in Willernie
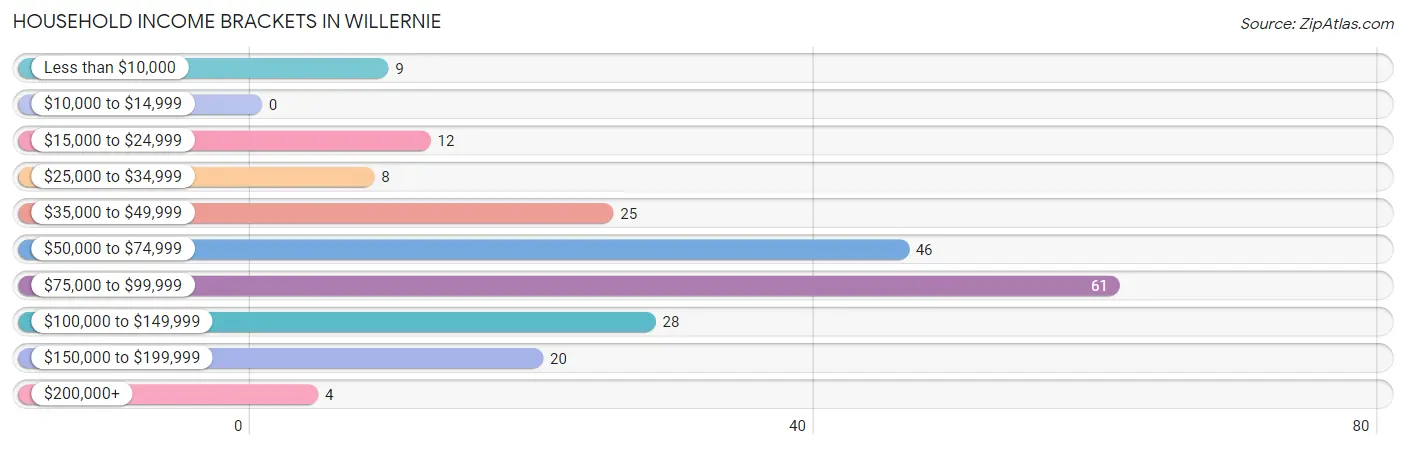
Family Income Brackets in Willernie
According to the Willernie family income data, there are 61 families falling into the $75,000 to $99,999 income range, which is the most common income bracket and makes up 43.6% of all families.
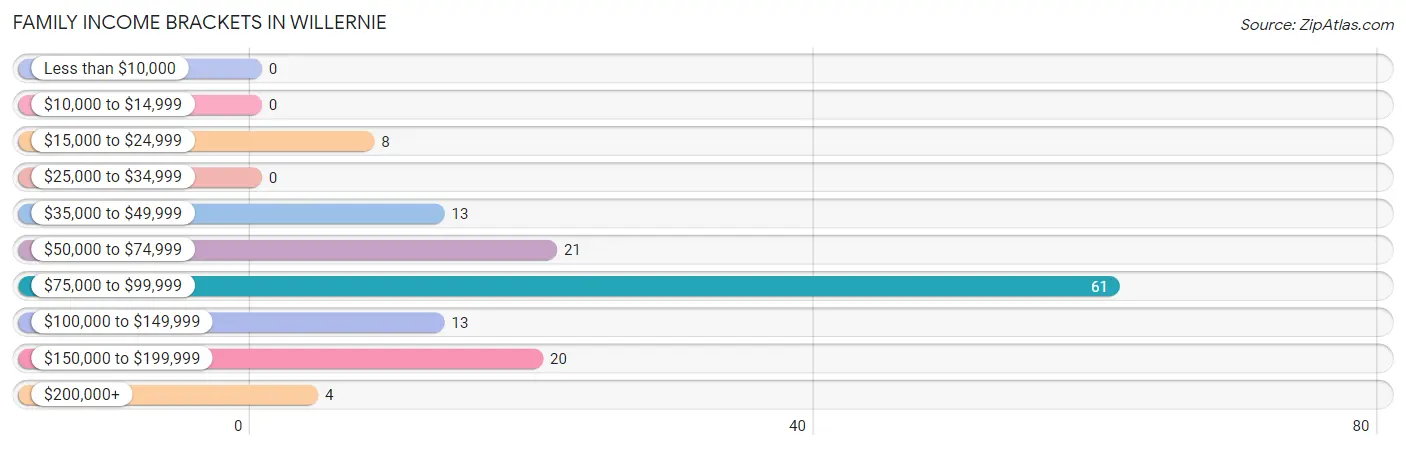
| Income Bracket | # Families | % Families |
| Less than $10,000 | 0 | 0.0% |
| $10,000 to $14,999 | 0 | 0.0% |
| $15,000 to $24,999 | 8 | 5.7% |
| $25,000 to $34,999 | 0 | 0.0% |
| $35,000 to $49,999 | 13 | 9.3% |
| $50,000 to $74,999 | 21 | 15.0% |
| $75,000 to $99,999 | 61 | 43.6% |
| $100,000 to $149,999 | 13 | 9.3% |
| $150,000 to $199,999 | 20 | 14.3% |
| $200,000+ | 4 | 2.9% |
Family Income by Famaliy Size in Willernie
2-person families (95 | 67.9%) account for the highest median family income in Willernie with $80,188 per family, while 2-person families (95 | 67.9%) have the highest median income of $40,094 per family member.
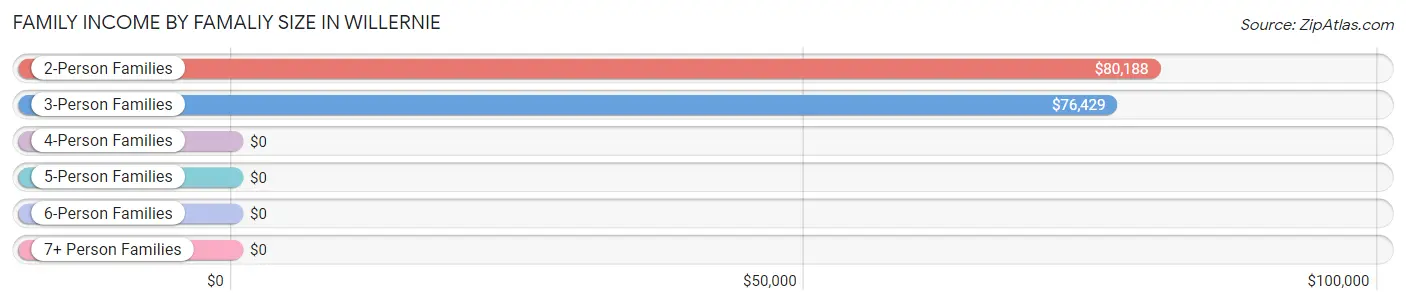
| Income Bracket | # Families | Median Income |
| 2-Person Families | 95 (67.9%) | $80,188 |
| 3-Person Families | 32 (22.9%) | $76,429 |
| 4-Person Families | 7 (5.0%) | $0 |
| 5-Person Families | 6 (4.3%) | $0 |
| 6-Person Families | 0 (0.0%) | $0 |
| 7+ Person Families | 0 (0.0%) | $0 |
| Total | 140 (100.0%) | $80,625 |
Family Income by Number of Earners in Willernie
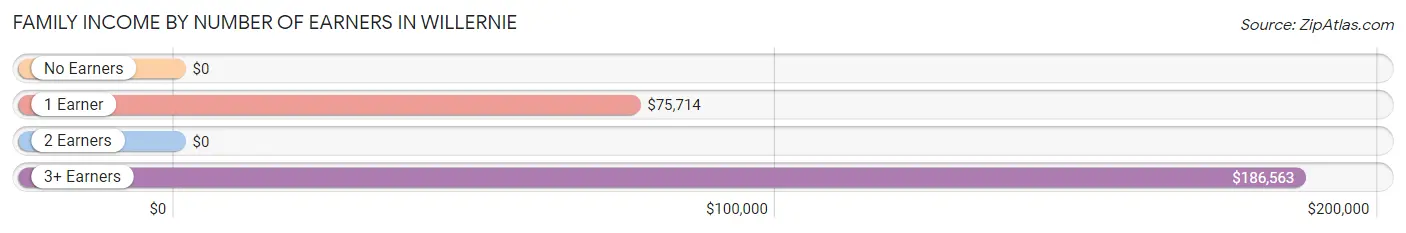
| Number of Earners | # Families | Median Income |
| No Earners | 6 (4.3%) | $0 |
| 1 Earner | 76 (54.3%) | $75,714 |
| 2 Earners | 44 (31.4%) | $0 |
| 3+ Earners | 14 (10.0%) | $186,563 |
| Total | 140 (100.0%) | $80,625 |
Household Income in Willernie
Household Income Brackets in Willernie
With 61 households falling in the category, the $75,000 to $99,999 income range is the most frequent in Willernie, accounting for 28.6% of all households.
| Income Bracket | # Households | % Households |
| Less than $10,000 | 9 | 4.2% |
| $10,000 to $14,999 | 0 | 0.0% |
| $15,000 to $24,999 | 12 | 5.6% |
| $25,000 to $34,999 | 8 | 3.8% |
| $35,000 to $49,999 | 25 | 11.7% |
| $50,000 to $74,999 | 46 | 21.6% |
| $75,000 to $99,999 | 61 | 28.6% |
| $100,000 to $149,999 | 28 | 13.1% |
| $150,000 to $199,999 | 20 | 9.4% |
| $200,000+ | 4 | 1.9% |
Household Income by Householder Age in Willernie
The median household income in Willernie is $77,321, with the highest median household income of $80,875 found in the 25 to 44 years age bracket for the primary householder. A total of 90 households (42.2%) fall into this category.
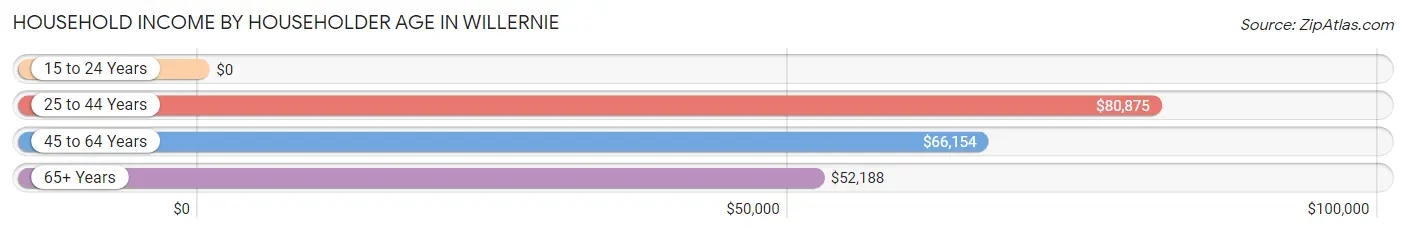
| Income Bracket | # Households | Median Income |
| 15 to 24 Years | 0 (0.0%) | $0 |
| 25 to 44 Years | 90 (42.2%) | $80,875 |
| 45 to 64 Years | 86 (40.4%) | $66,154 |
| 65+ Years | 37 (17.4%) | $52,188 |
| Total | 213 (100.0%) | $77,321 |
Poverty in Willernie
Income Below Poverty by Sex and Age in Willernie
With 1.0% poverty level for males and 8.8% for females among the residents of Willernie, 45 to 54 year old males and 35 to 44 year old females are the most vulnerable to poverty, with 2 males (7.4%) and 8 females (38.1%) in their respective age groups living below the poverty level.
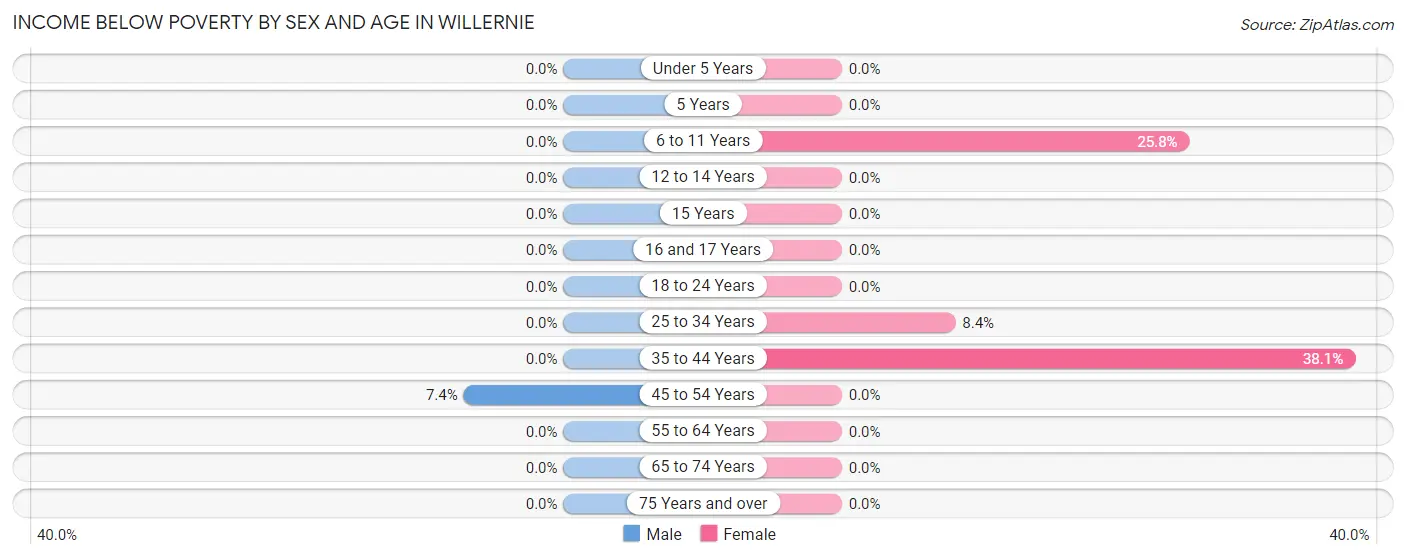
| Age Bracket | Male | Female |
| Under 5 Years | 0 (0.0%) | 0 (0.0%) |
| 5 Years | 0 (0.0%) | 0 (0.0%) |
| 6 to 11 Years | 0 (0.0%) | 8 (25.8%) |
| 12 to 14 Years | 0 (0.0%) | 0 (0.0%) |
| 15 Years | 0 (0.0%) | 0 (0.0%) |
| 16 and 17 Years | 0 (0.0%) | 0 (0.0%) |
| 18 to 24 Years | 0 (0.0%) | 0 (0.0%) |
| 25 to 34 Years | 0 (0.0%) | 7 (8.4%) |
| 35 to 44 Years | 0 (0.0%) | 8 (38.1%) |
| 45 to 54 Years | 2 (7.4%) | 0 (0.0%) |
| 55 to 64 Years | 0 (0.0%) | 0 (0.0%) |
| 65 to 74 Years | 0 (0.0%) | 0 (0.0%) |
| 75 Years and over | 0 (0.0%) | 0 (0.0%) |
| Total | 2 (1.0%) | 23 (8.8%) |
Income Above Poverty by Sex and Age in Willernie
According to the poverty statistics in Willernie, males aged 6 to 11 years and females aged under 5 years are the age groups that are most secure financially, with 100.0% of males and 100.0% of females in these age groups living above the poverty line.
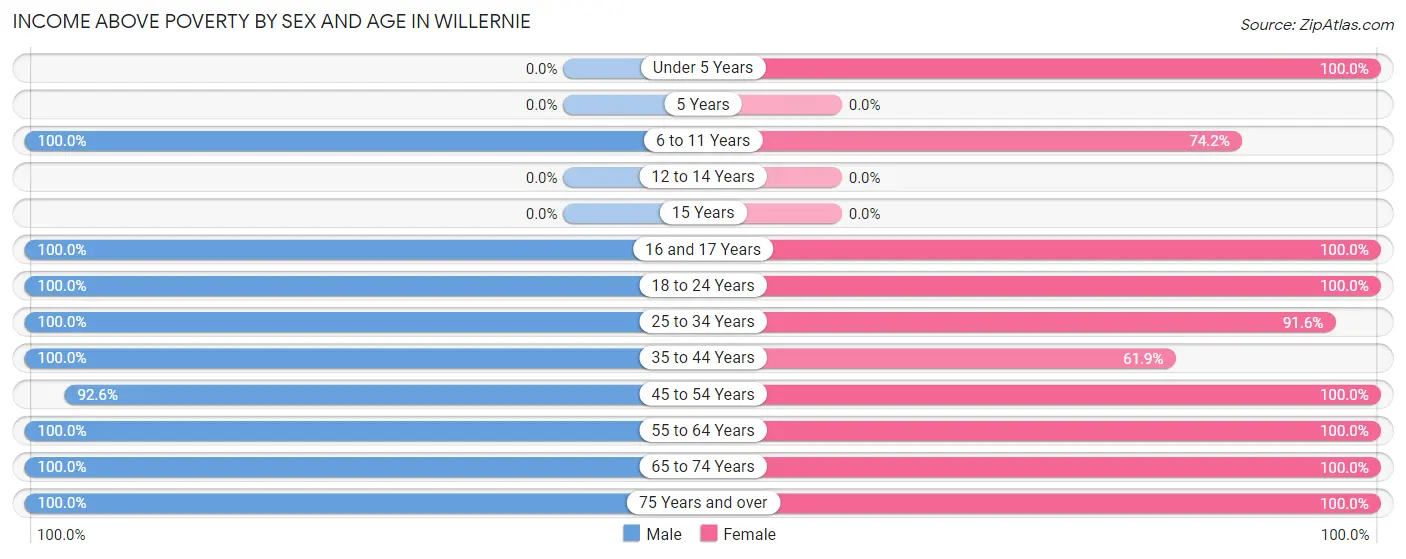
| Age Bracket | Male | Female |
| Under 5 Years | 0 (0.0%) | 4 (100.0%) |
| 5 Years | 0 (0.0%) | 0 (0.0%) |
| 6 to 11 Years | 7 (100.0%) | 23 (74.2%) |
| 12 to 14 Years | 0 (0.0%) | 0 (0.0%) |
| 15 Years | 0 (0.0%) | 0 (0.0%) |
| 16 and 17 Years | 11 (100.0%) | 14 (100.0%) |
| 18 to 24 Years | 7 (100.0%) | 16 (100.0%) |
| 25 to 34 Years | 30 (100.0%) | 76 (91.6%) |
| 35 to 44 Years | 44 (100.0%) | 13 (61.9%) |
| 45 to 54 Years | 25 (92.6%) | 51 (100.0%) |
| 55 to 64 Years | 49 (100.0%) | 15 (100.0%) |
| 65 to 74 Years | 5 (100.0%) | 23 (100.0%) |
| 75 Years and over | 21 (100.0%) | 4 (100.0%) |
| Total | 199 (99.0%) | 239 (91.2%) |
Income Below Poverty Among Married-Couple Families in Willernie
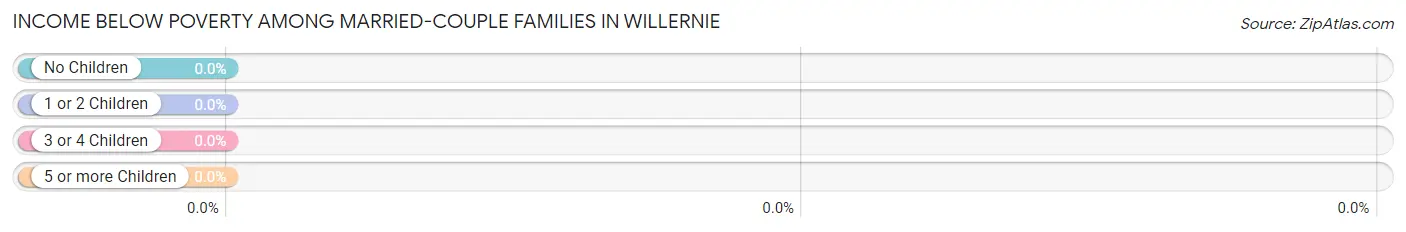
| Children | Above Poverty | Below Poverty |
| No Children | 66 (100.0%) | 0 (0.0%) |
| 1 or 2 Children | 11 (100.0%) | 0 (0.0%) |
| 3 or 4 Children | 0 (0.0%) | 0 (0.0%) |
| 5 or more Children | 0 (0.0%) | 0 (0.0%) |
| Total | 77 (100.0%) | 0 (0.0%) |
Income Below Poverty Among Single-Parent Households in Willernie
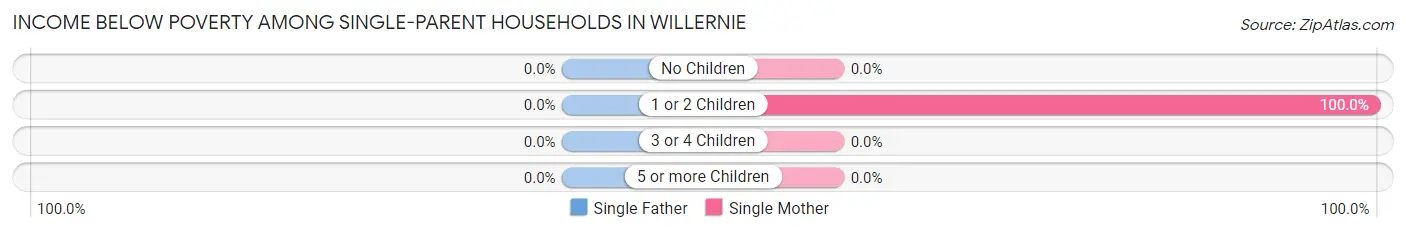
| Children | Single Father | Single Mother |
| No Children | 0 (0.0%) | 0 (0.0%) |
| 1 or 2 Children | 0 (0.0%) | 8 (100.0%) |
| 3 or 4 Children | 0 (0.0%) | 0 (0.0%) |
| 5 or more Children | 0 (0.0%) | 0 (0.0%) |
| Total | 0 (0.0%) | 8 (57.1%) |
Income Below Poverty Among Married-Couple vs Single-Parent Households in Willernie
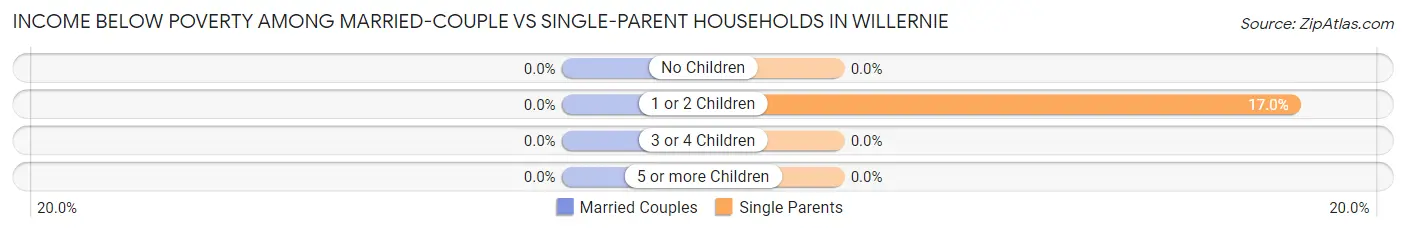
| Children | Married-Couple Families | Single-Parent Households |
| No Children | 0 (0.0%) | 0 (0.0%) |
| 1 or 2 Children | 0 (0.0%) | 8 (17.0%) |
| 3 or 4 Children | 0 (0.0%) | 0 (0.0%) |
| 5 or more Children | 0 (0.0%) | 0 (0.0%) |
| Total | 0 (0.0%) | 8 (12.7%) |
Employment Characteristics in Willernie
Employment by Class of Employer in Willernie
Among the 213 employed individuals in Willernie, private company employees (137 | 64.3%), not-for-profit organizations (25 | 11.7%), and state government employees (20 | 9.4%) make up the most common classes of employment.
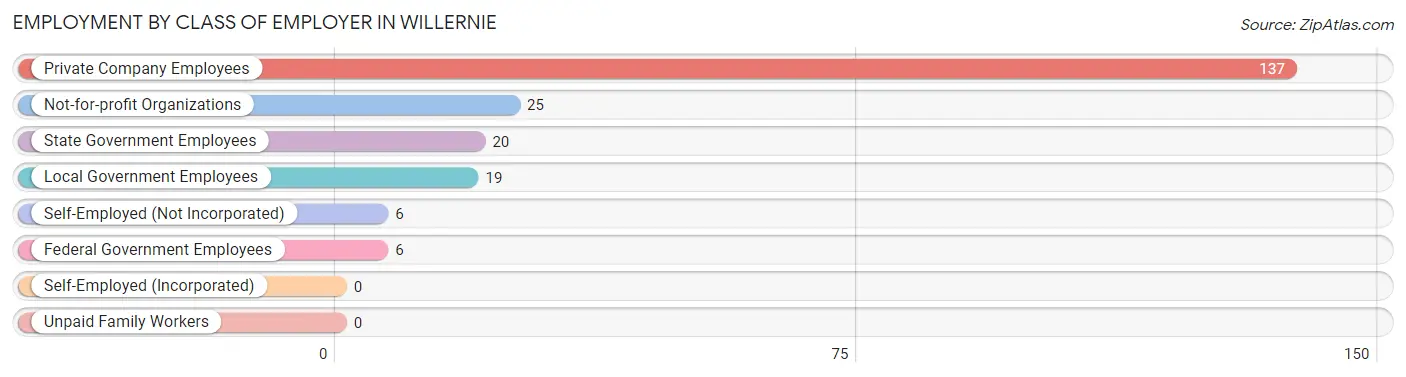
| Employer Class | # Employees | % Employees |
| Private Company Employees | 137 | 64.3% |
| Self-Employed (Incorporated) | 0 | 0.0% |
| Self-Employed (Not Incorporated) | 6 | 2.8% |
| Not-for-profit Organizations | 25 | 11.7% |
| Local Government Employees | 19 | 8.9% |
| State Government Employees | 20 | 9.4% |
| Federal Government Employees | 6 | 2.8% |
| Unpaid Family Workers | 0 | 0.0% |
| Total | 213 | 100.0% |
Employment Status by Age in Willernie
According to the labor force statistics for Willernie, out of the total population over 16 years of age (421), 66.7% or 281 individuals are in the labor force, with 21.0% or 59 of them unemployed. The age group with the highest labor force participation rate is 25 to 29 years, with 100.0% or 70 individuals in the labor force. Within the labor force, the 16 to 19 years age range has the highest percentage of unemployed individuals, with 100.0% or 11 of them being unemployed.
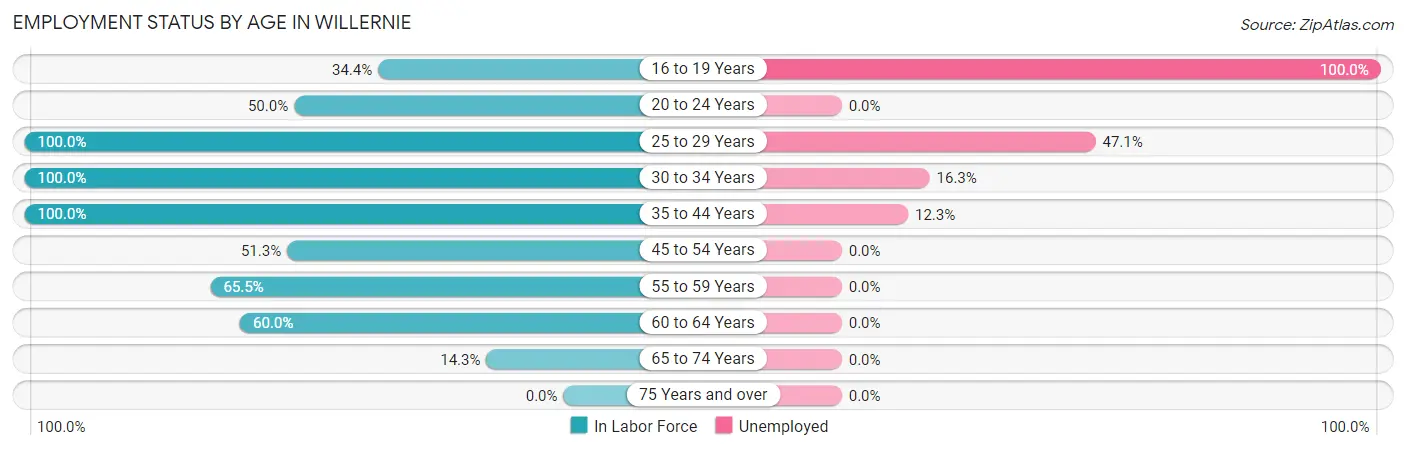
| Age Bracket | In Labor Force | Unemployed |
| 16 to 19 Years | 11 (34.4%) | 11 (100.0%) |
| 20 to 24 Years | 8 (50.0%) | 0 (0.0%) |
| 25 to 29 Years | 70 (100.0%) | 33 (47.1%) |
| 30 to 34 Years | 43 (100.0%) | 7 (16.3%) |
| 35 to 44 Years | 65 (100.0%) | 8 (12.3%) |
| 45 to 54 Years | 40 (51.3%) | 0 (0.0%) |
| 55 to 59 Years | 19 (65.5%) | 0 (0.0%) |
| 60 to 64 Years | 21 (60.0%) | 0 (0.0%) |
| 65 to 74 Years | 4 (14.3%) | 0 (0.0%) |
| 75 Years and over | 0 (0.0%) | 0 (0.0%) |
| Total | 281 (66.7%) | 59 (21.0%) |
Employment Status by Educational Attainment in Willernie
According to labor force statistics for Willernie, 80.6% of individuals (258) out of the total population between 25 and 64 years of age (320) are in the labor force, with 18.6% or 48 of them being unemployed. The group with the highest labor force participation rate are those with the educational attainment of college / associate degree, with 92.5% or 99 individuals in the labor force. Within the labor force, individuals with high school diploma education have the highest percentage of unemployment, with 63.0% or 34 of them being unemployed.
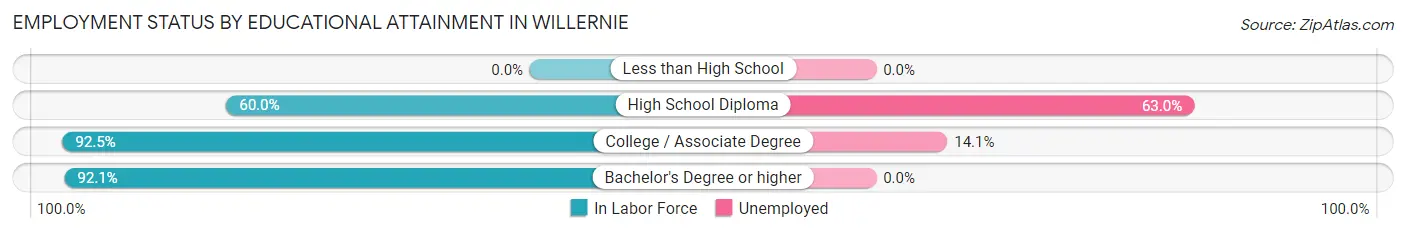
| Educational Attainment | In Labor Force | Unemployed |
| Less than High School | 0 (0.0%) | 0 (0.0%) |
| High School Diploma | 54 (60.0%) | 57 (63.0%) |
| College / Associate Degree | 99 (92.5%) | 15 (14.1%) |
| Bachelor's Degree or higher | 105 (92.1%) | 0 (0.0%) |
| Total | 258 (80.6%) | 60 (18.6%) |
Employment Occupations by Sex in Willernie
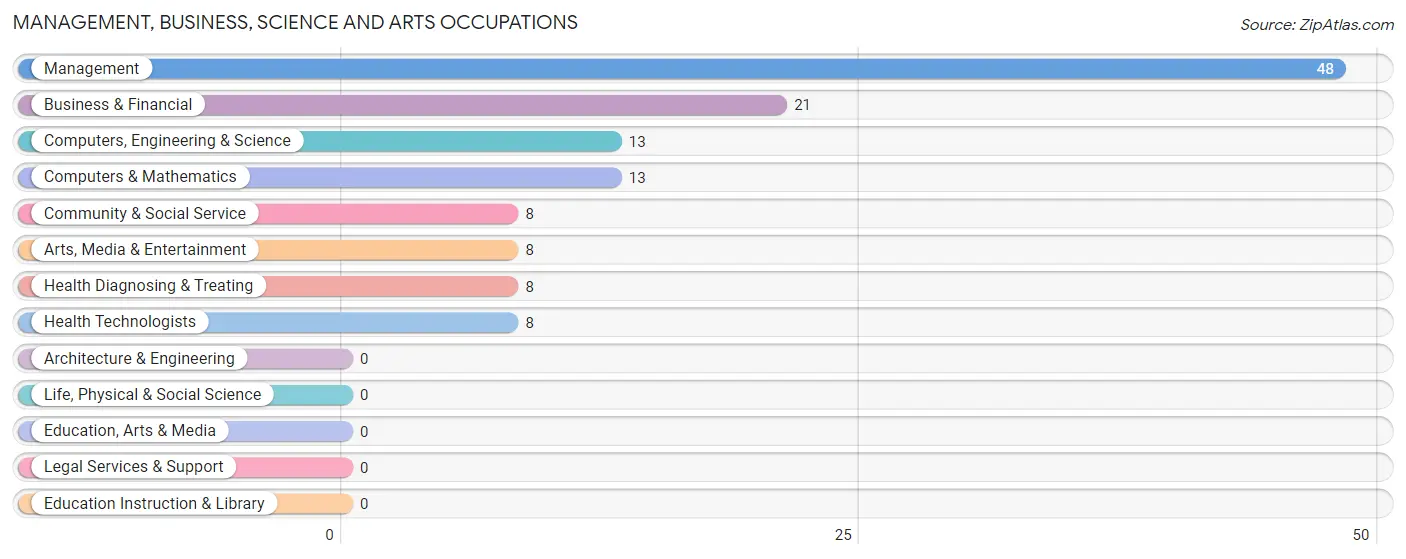
Management, Business, Science and Arts Occupations
The most common Management, Business, Science and Arts occupations in Willernie are Management (48 | 21.6%), Business & Financial (21 | 9.5%), Computers, Engineering & Science (13 | 5.9%), Computers & Mathematics (13 | 5.9%), and Community & Social Service (8 | 3.6%).
Management, Business, Science and Arts Occupations by Sex
Within the Management, Business, Science and Arts occupations in Willernie, the most male-oriented occupations are Computers, Engineering & Science (100.0%), Computers & Mathematics (100.0%), and Community & Social Service (100.0%), while the most female-oriented occupations are Health Diagnosing & Treating (100.0%), Health Technologists (100.0%), and Business & Financial (28.6%).
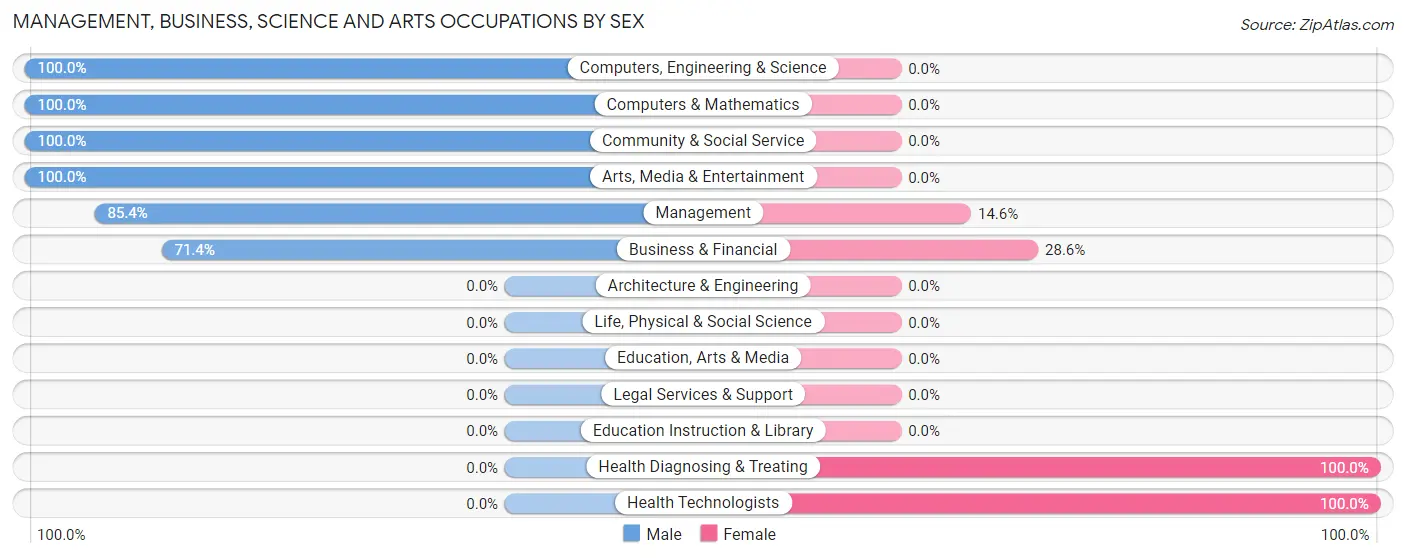
| Occupation | Male | Female |
| Management | 41 (85.4%) | 7 (14.6%) |
| Business & Financial | 15 (71.4%) | 6 (28.6%) |
| Computers, Engineering & Science | 13 (100.0%) | 0 (0.0%) |
| Computers & Mathematics | 13 (100.0%) | 0 (0.0%) |
| Architecture & Engineering | 0 (0.0%) | 0 (0.0%) |
| Life, Physical & Social Science | 0 (0.0%) | 0 (0.0%) |
| Community & Social Service | 8 (100.0%) | 0 (0.0%) |
| Education, Arts & Media | 0 (0.0%) | 0 (0.0%) |
| Legal Services & Support | 0 (0.0%) | 0 (0.0%) |
| Education Instruction & Library | 0 (0.0%) | 0 (0.0%) |
| Arts, Media & Entertainment | 8 (100.0%) | 0 (0.0%) |
| Health Diagnosing & Treating | 0 (0.0%) | 8 (100.0%) |
| Health Technologists | 0 (0.0%) | 8 (100.0%) |
| Total (Category) | 77 (78.6%) | 21 (21.4%) |
| Total (Overall) | 127 (57.2%) | 95 (42.8%) |
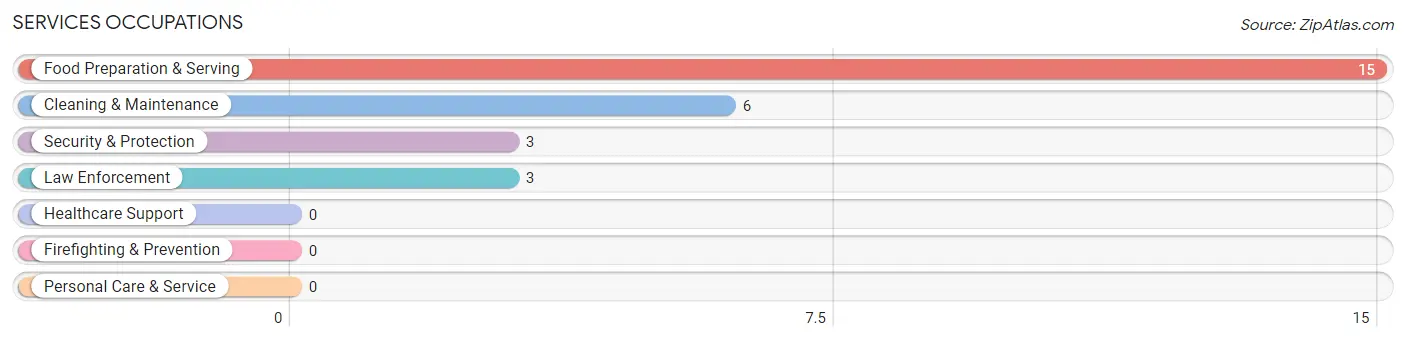
Services Occupations
The most common Services occupations in Willernie are Food Preparation & Serving (15 | 6.8%), Cleaning & Maintenance (6 | 2.7%), Security & Protection (3 | 1.3%), and Law Enforcement (3 | 1.3%).
Services Occupations by Sex
Within the Services occupations in Willernie, the most male-oriented occupations are Security & Protection (100.0%), Law Enforcement (100.0%), and Food Preparation & Serving (46.7%), while the most female-oriented occupations are Cleaning & Maintenance (100.0%), and Food Preparation & Serving (53.3%).
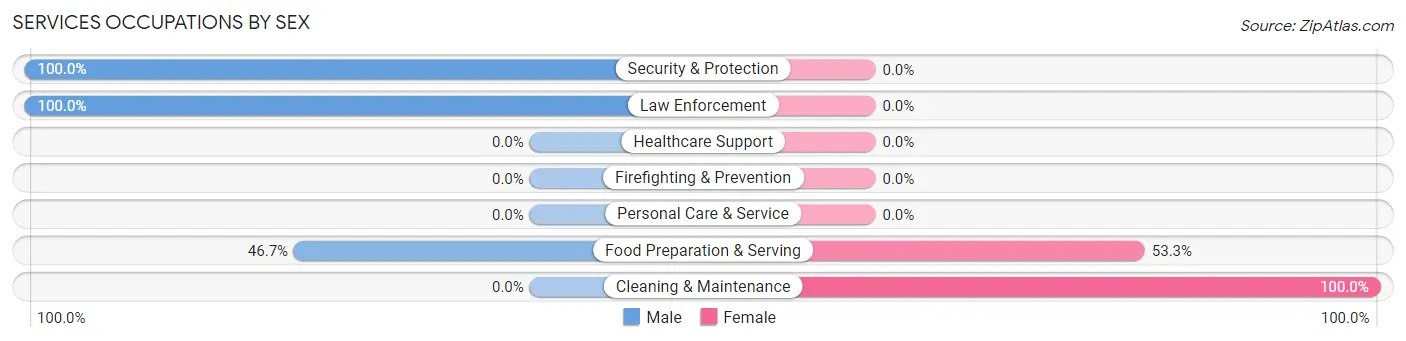
| Occupation | Male | Female |
| Healthcare Support | 0 (0.0%) | 0 (0.0%) |
| Security & Protection | 3 (100.0%) | 0 (0.0%) |
| Firefighting & Prevention | 0 (0.0%) | 0 (0.0%) |
| Law Enforcement | 3 (100.0%) | 0 (0.0%) |
| Food Preparation & Serving | 7 (46.7%) | 8 (53.3%) |
| Cleaning & Maintenance | 0 (0.0%) | 6 (100.0%) |
| Personal Care & Service | 0 (0.0%) | 0 (0.0%) |
| Total (Category) | 10 (41.7%) | 14 (58.3%) |
| Total (Overall) | 127 (57.2%) | 95 (42.8%) |
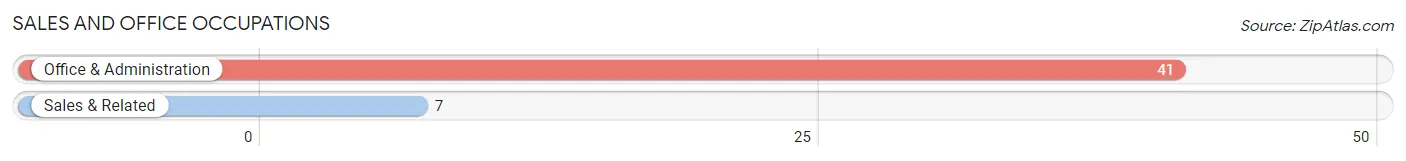
Sales and Office Occupations
The most common Sales and Office occupations in Willernie are Office & Administration (41 | 18.5%), and Sales & Related (7 | 3.2%).
Sales and Office Occupations by Sex
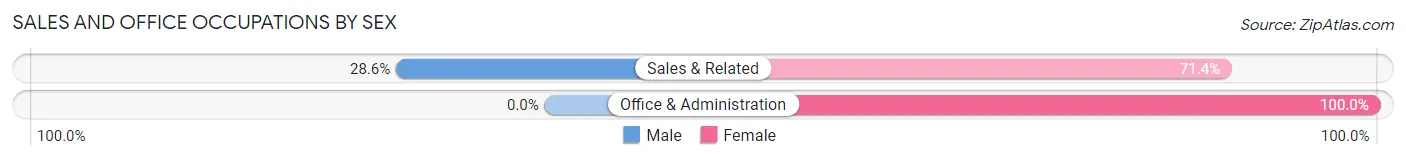
| Occupation | Male | Female |
| Sales & Related | 2 (28.6%) | 5 (71.4%) |
| Office & Administration | 0 (0.0%) | 41 (100.0%) |
| Total (Category) | 2 (4.2%) | 46 (95.8%) |
| Total (Overall) | 127 (57.2%) | 95 (42.8%) |
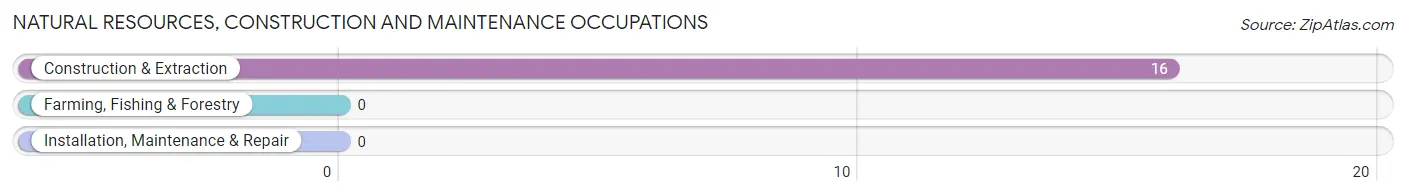
Natural Resources, Construction and Maintenance Occupations
The most common Natural Resources, Construction and Maintenance occupations in Willernie are , and Construction & Extraction (16 | 7.2%).
Natural Resources, Construction and Maintenance Occupations by Sex
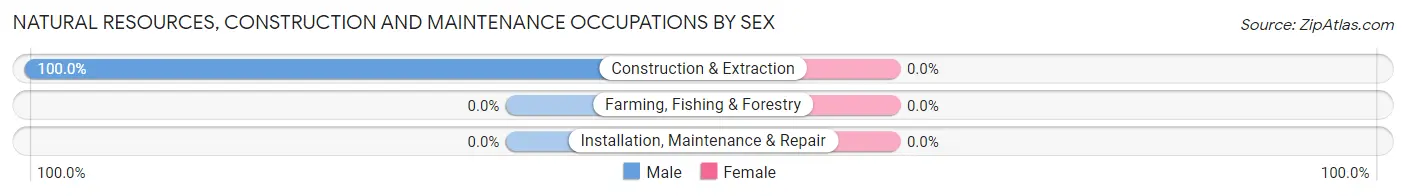
| Occupation | Male | Female |
| Farming, Fishing & Forestry | 0 (0.0%) | 0 (0.0%) |
| Construction & Extraction | 16 (100.0%) | 0 (0.0%) |
| Installation, Maintenance & Repair | 0 (0.0%) | 0 (0.0%) |
| Total (Category) | 16 (100.0%) | 0 (0.0%) |
| Total (Overall) | 127 (57.2%) | 95 (42.8%) |
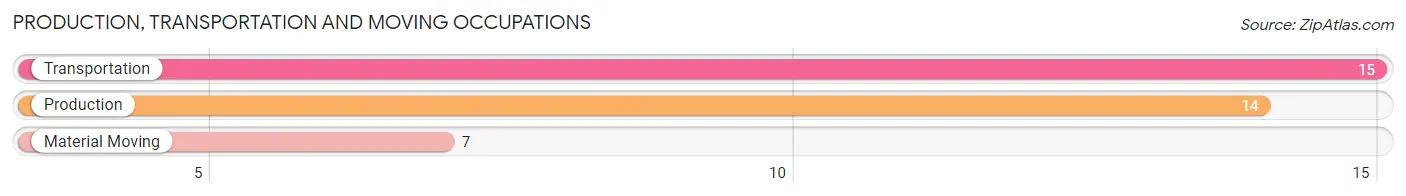
Production, Transportation and Moving Occupations
The most common Production, Transportation and Moving occupations in Willernie are Transportation (15 | 6.8%), Production (14 | 6.3%), and Material Moving (7 | 3.2%).
Production, Transportation and Moving Occupations by Sex
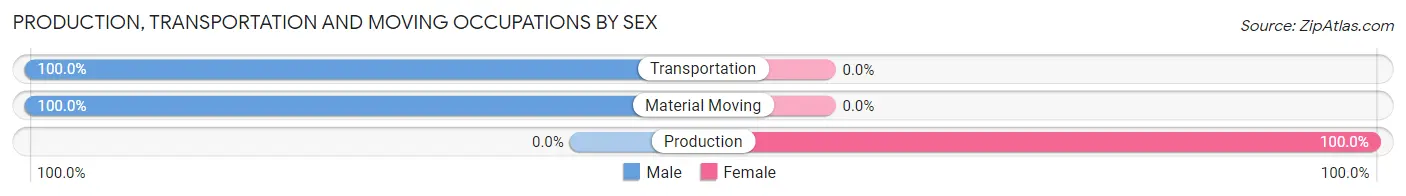
| Occupation | Male | Female |
| Production | 0 (0.0%) | 14 (100.0%) |
| Transportation | 15 (100.0%) | 0 (0.0%) |
| Material Moving | 7 (100.0%) | 0 (0.0%) |
| Total (Category) | 22 (61.1%) | 14 (38.9%) |
| Total (Overall) | 127 (57.2%) | 95 (42.8%) |
Employment Industries by Sex in Willernie
Employment Industries in Willernie
The major employment industries in Willernie include Construction (45 | 20.3%), Transportation & Warehousing (23 | 10.4%), Health Care & Social Assistance (21 | 9.5%), Manufacturing (19 | 8.6%), and Public Administration (19 | 8.6%).
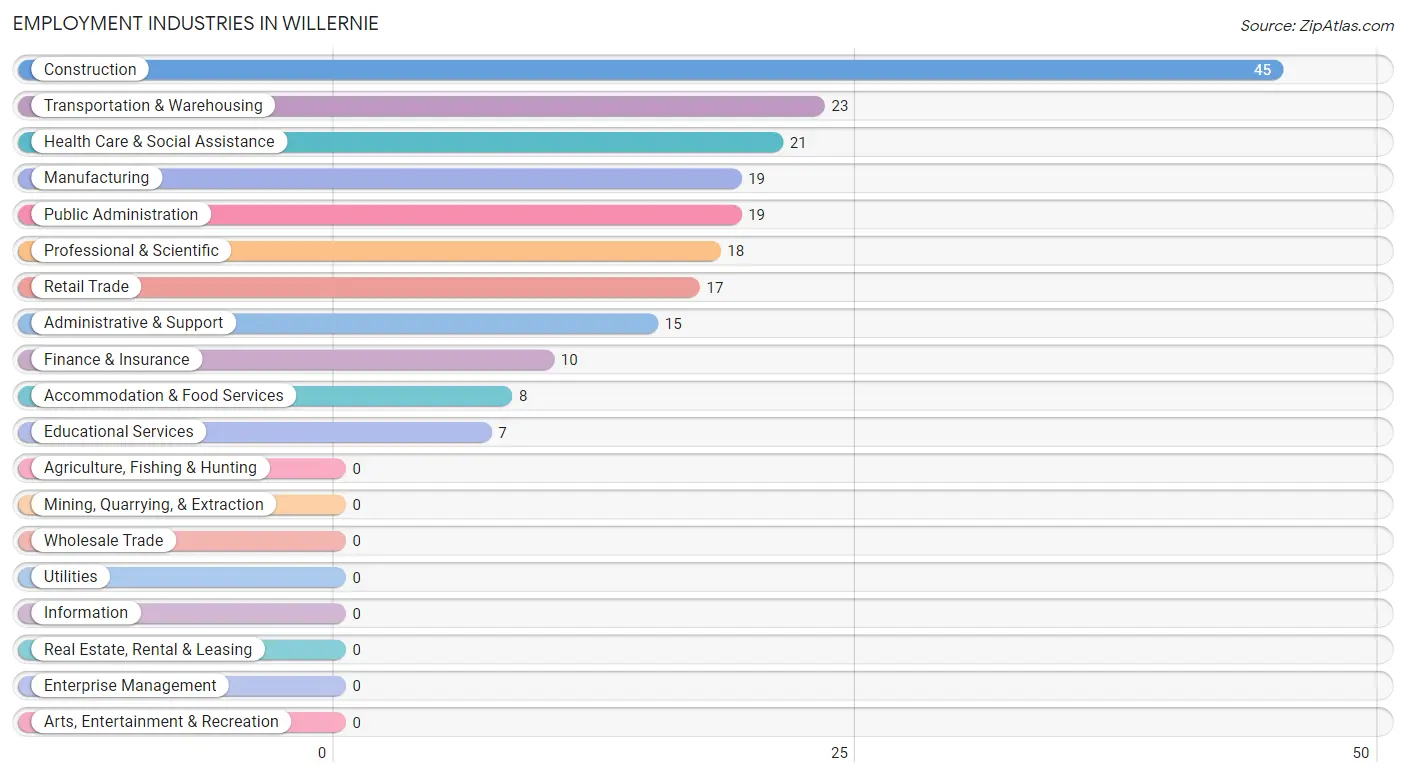
Employment Industries by Sex in Willernie
The Willernie industries that see more men than women are Construction (100.0%), Administrative & Support (100.0%), and Educational Services (100.0%), whereas the industries that tend to have a higher number of women are Manufacturing (100.0%), Retail Trade (100.0%), and Accommodation & Food Services (100.0%).
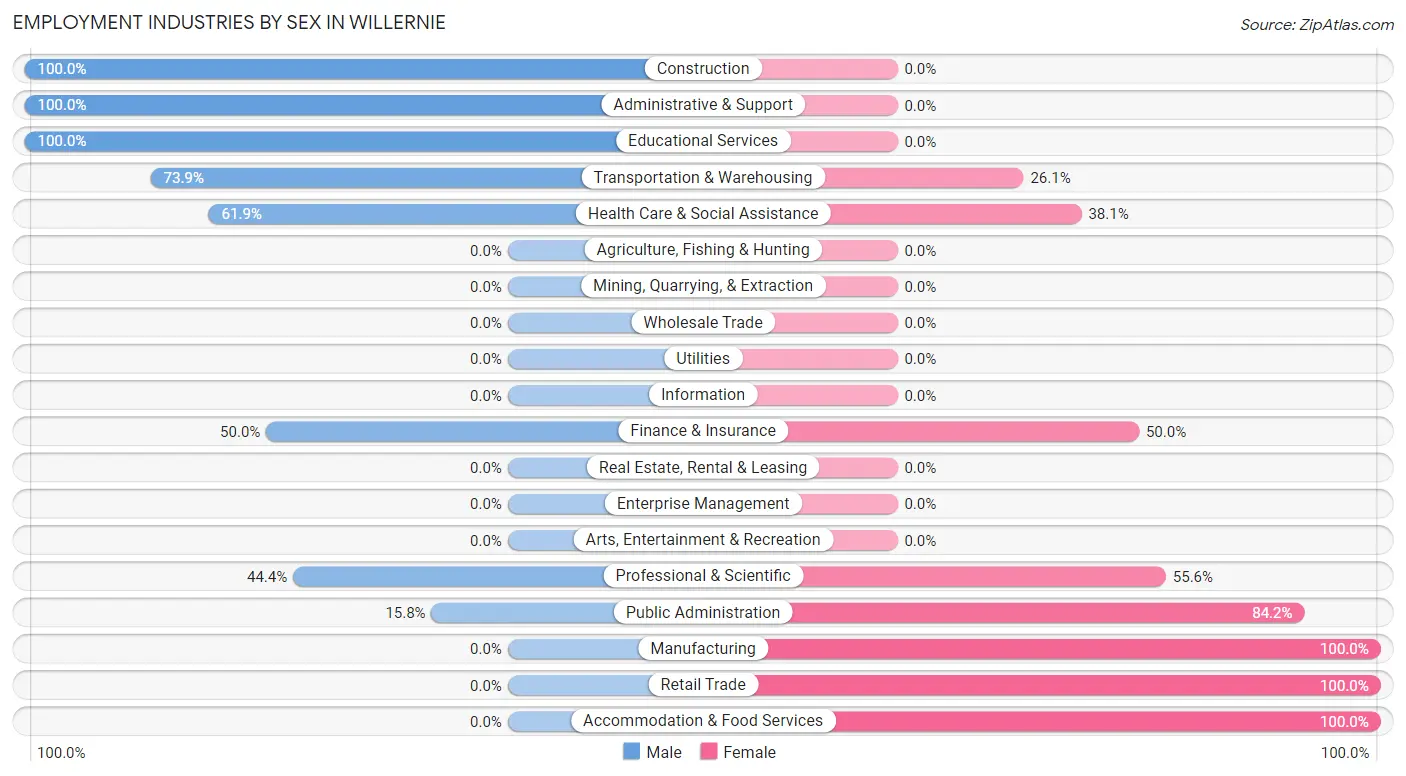
| Industry | Male | Female |
| Agriculture, Fishing & Hunting | 0 (0.0%) | 0 (0.0%) |
| Mining, Quarrying, & Extraction | 0 (0.0%) | 0 (0.0%) |
| Construction | 45 (100.0%) | 0 (0.0%) |
| Manufacturing | 0 (0.0%) | 19 (100.0%) |
| Wholesale Trade | 0 (0.0%) | 0 (0.0%) |
| Retail Trade | 0 (0.0%) | 17 (100.0%) |
| Transportation & Warehousing | 17 (73.9%) | 6 (26.1%) |
| Utilities | 0 (0.0%) | 0 (0.0%) |
| Information | 0 (0.0%) | 0 (0.0%) |
| Finance & Insurance | 5 (50.0%) | 5 (50.0%) |
| Real Estate, Rental & Leasing | 0 (0.0%) | 0 (0.0%) |
| Professional & Scientific | 8 (44.4%) | 10 (55.6%) |
| Enterprise Management | 0 (0.0%) | 0 (0.0%) |
| Administrative & Support | 15 (100.0%) | 0 (0.0%) |
| Educational Services | 7 (100.0%) | 0 (0.0%) |
| Health Care & Social Assistance | 13 (61.9%) | 8 (38.1%) |
| Arts, Entertainment & Recreation | 0 (0.0%) | 0 (0.0%) |
| Accommodation & Food Services | 0 (0.0%) | 8 (100.0%) |
| Public Administration | 3 (15.8%) | 16 (84.2%) |
| Total | 127 (57.2%) | 95 (42.8%) |
Education in Willernie
School Enrollment in Willernie
The most common levels of schooling among the 68 students in Willernie are high school (25 | 36.8%), elementary school (22 | 32.4%), and middle school (16 | 23.5%).
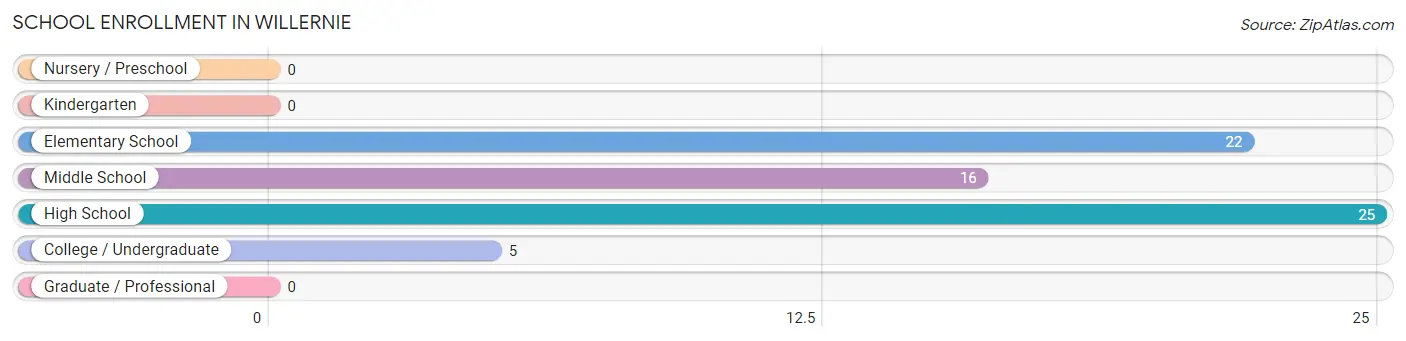
| School Level | # Students | % Students |
| Nursery / Preschool | 0 | 0.0% |
| Kindergarten | 0 | 0.0% |
| Elementary School | 22 | 32.4% |
| Middle School | 16 | 23.5% |
| High School | 25 | 36.8% |
| College / Undergraduate | 5 | 7.3% |
| Graduate / Professional | 0 | 0.0% |
| Total | 68 | 100.0% |
School Enrollment by Age by Funding Source in Willernie
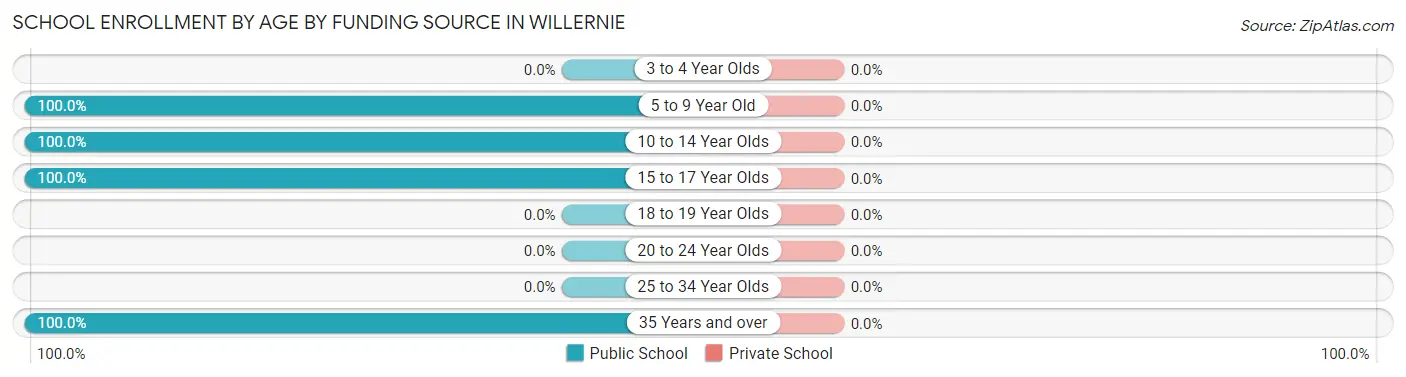
| Age Bracket | Public School | Private School |
| 3 to 4 Year Olds | 0 (0.0%) | 0 (0.0%) |
| 5 to 9 Year Old | 22 (100.0%) | 0 (0.0%) |
| 10 to 14 Year Olds | 16 (100.0%) | 0 (0.0%) |
| 15 to 17 Year Olds | 25 (100.0%) | 0 (0.0%) |
| 18 to 19 Year Olds | 0 (0.0%) | 0 (0.0%) |
| 20 to 24 Year Olds | 0 (0.0%) | 0 (0.0%) |
| 25 to 34 Year Olds | 0 (0.0%) | 0 (0.0%) |
| 35 Years and over | 5 (100.0%) | 0 (0.0%) |
| Total | 68 (100.0%) | 0 (0.0%) |
Educational Attainment by Field of Study in Willernie
Bio, nature & agricultural (29 | 23.0%), social sciences (20 | 15.9%), liberal arts & history (17 | 13.5%), business (13 | 10.3%), and literature & languages (10 | 7.9%) are the most common fields of study among 126 individuals in Willernie who have obtained a bachelor's degree or higher.
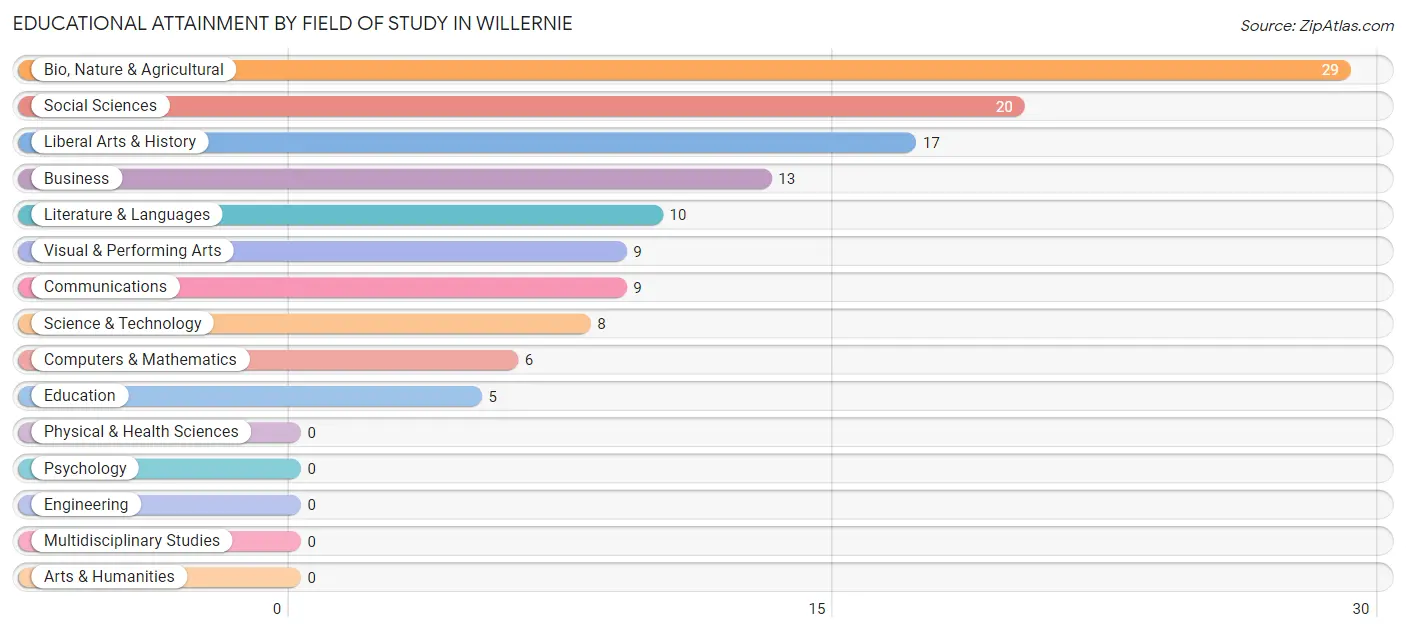
| Field of Study | # Graduates | % Graduates |
| Computers & Mathematics | 6 | 4.8% |
| Bio, Nature & Agricultural | 29 | 23.0% |
| Physical & Health Sciences | 0 | 0.0% |
| Psychology | 0 | 0.0% |
| Social Sciences | 20 | 15.9% |
| Engineering | 0 | 0.0% |
| Multidisciplinary Studies | 0 | 0.0% |
| Science & Technology | 8 | 6.4% |
| Business | 13 | 10.3% |
| Education | 5 | 4.0% |
| Literature & Languages | 10 | 7.9% |
| Liberal Arts & History | 17 | 13.5% |
| Visual & Performing Arts | 9 | 7.1% |
| Communications | 9 | 7.1% |
| Arts & Humanities | 0 | 0.0% |
| Total | 126 | 100.0% |
Transportation & Commute in Willernie
Vehicle Availability by Sex in Willernie
The most prevalent vehicle ownership categories in Willernie are males with 2 vehicles (73, accounting for 61.9%) and females with 2 vehicles (39, making up 76.8%).
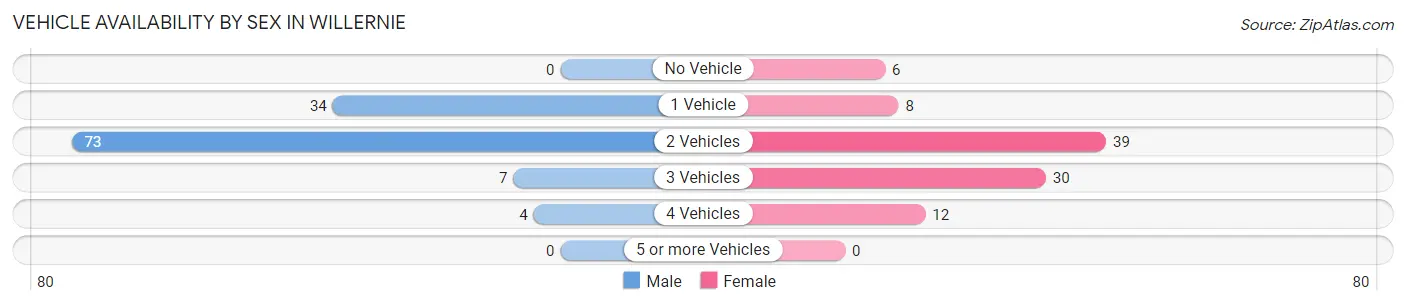
| Vehicles Available | Male | Female |
| No Vehicle | 0 (0.0%) | 6 (6.3%) |
| 1 Vehicle | 34 (28.8%) | 8 (8.4%) |
| 2 Vehicles | 73 (61.9%) | 39 (41.0%) |
| 3 Vehicles | 7 (5.9%) | 30 (31.6%) |
| 4 Vehicles | 4 (3.4%) | 12 (12.6%) |
| 5 or more Vehicles | 0 (0.0%) | 0 (0.0%) |
| Total | 118 (100.0%) | 95 (100.0%) |
Commute Time in Willernie
The most frequently occuring commute durations in Willernie are 15 to 19 minutes (46 commuters, 23.6%), 20 to 24 minutes (34 commuters, 17.4%), and 40 to 44 minutes (32 commuters, 16.4%).
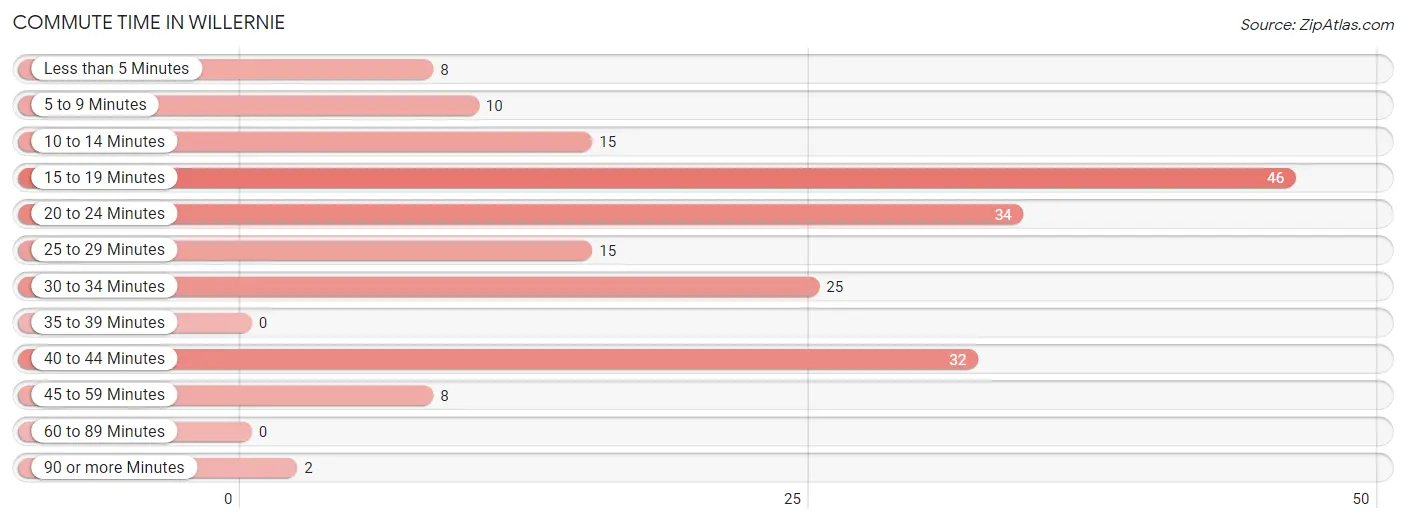
| Commute Time | # Commuters | % Commuters |
| Less than 5 Minutes | 8 | 4.1% |
| 5 to 9 Minutes | 10 | 5.1% |
| 10 to 14 Minutes | 15 | 7.7% |
| 15 to 19 Minutes | 46 | 23.6% |
| 20 to 24 Minutes | 34 | 17.4% |
| 25 to 29 Minutes | 15 | 7.7% |
| 30 to 34 Minutes | 25 | 12.8% |
| 35 to 39 Minutes | 0 | 0.0% |
| 40 to 44 Minutes | 32 | 16.4% |
| 45 to 59 Minutes | 8 | 4.1% |
| 60 to 89 Minutes | 0 | 0.0% |
| 90 or more Minutes | 2 | 1.0% |
Commute Time by Sex in Willernie
The most common commute times in Willernie are 20 to 24 minutes (34 commuters, 28.8%) for males and 30 to 34 minutes (25 commuters, 32.5%) for females.
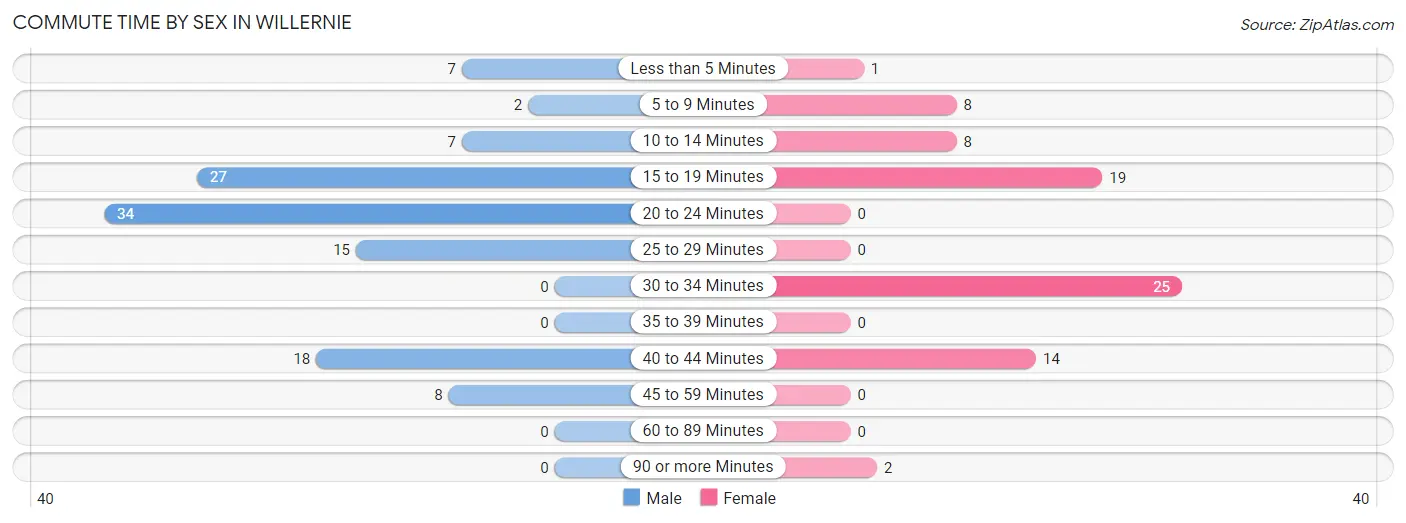
| Commute Time | Male | Female |
| Less than 5 Minutes | 7 (5.9%) | 1 (1.3%) |
| 5 to 9 Minutes | 2 (1.7%) | 8 (10.4%) |
| 10 to 14 Minutes | 7 (5.9%) | 8 (10.4%) |
| 15 to 19 Minutes | 27 (22.9%) | 19 (24.7%) |
| 20 to 24 Minutes | 34 (28.8%) | 0 (0.0%) |
| 25 to 29 Minutes | 15 (12.7%) | 0 (0.0%) |
| 30 to 34 Minutes | 0 (0.0%) | 25 (32.5%) |
| 35 to 39 Minutes | 0 (0.0%) | 0 (0.0%) |
| 40 to 44 Minutes | 18 (15.2%) | 14 (18.2%) |
| 45 to 59 Minutes | 8 (6.8%) | 0 (0.0%) |
| 60 to 89 Minutes | 0 (0.0%) | 0 (0.0%) |
| 90 or more Minutes | 0 (0.0%) | 2 (2.6%) |
Time of Departure to Work by Sex in Willernie
The most frequent times of departure to work in Willernie are 8:00 AM to 8:29 AM (27, 22.9%) for males and 7:00 AM to 7:29 AM (35, 45.5%) for females.
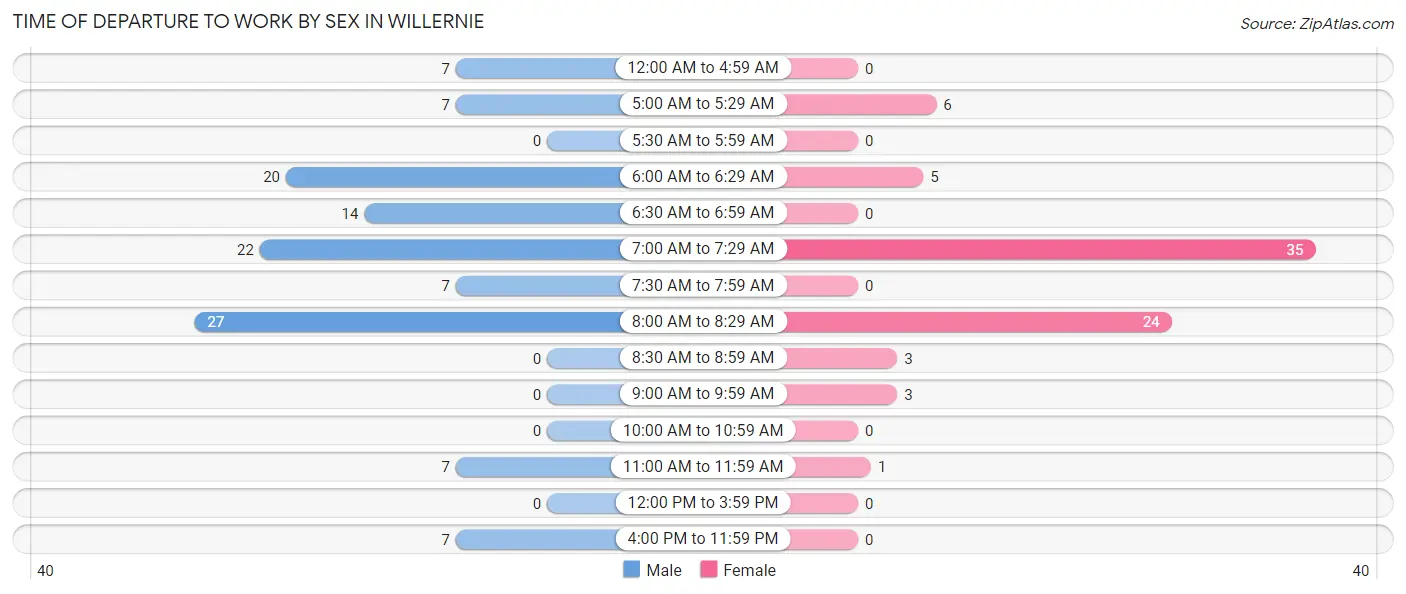
| Time of Departure | Male | Female |
| 12:00 AM to 4:59 AM | 7 (5.9%) | 0 (0.0%) |
| 5:00 AM to 5:29 AM | 7 (5.9%) | 6 (7.8%) |
| 5:30 AM to 5:59 AM | 0 (0.0%) | 0 (0.0%) |
| 6:00 AM to 6:29 AM | 20 (17.0%) | 5 (6.5%) |
| 6:30 AM to 6:59 AM | 14 (11.9%) | 0 (0.0%) |
| 7:00 AM to 7:29 AM | 22 (18.6%) | 35 (45.5%) |
| 7:30 AM to 7:59 AM | 7 (5.9%) | 0 (0.0%) |
| 8:00 AM to 8:29 AM | 27 (22.9%) | 24 (31.2%) |
| 8:30 AM to 8:59 AM | 0 (0.0%) | 3 (3.9%) |
| 9:00 AM to 9:59 AM | 0 (0.0%) | 3 (3.9%) |
| 10:00 AM to 10:59 AM | 0 (0.0%) | 0 (0.0%) |
| 11:00 AM to 11:59 AM | 7 (5.9%) | 1 (1.3%) |
| 12:00 PM to 3:59 PM | 0 (0.0%) | 0 (0.0%) |
| 4:00 PM to 11:59 PM | 7 (5.9%) | 0 (0.0%) |
| Total | 118 (100.0%) | 77 (100.0%) |
Housing Occupancy in Willernie
Occupancy by Ownership in Willernie
Of the total 213 dwellings in Willernie, owner-occupied units account for 152 (71.4%), while renter-occupied units make up 61 (28.6%).
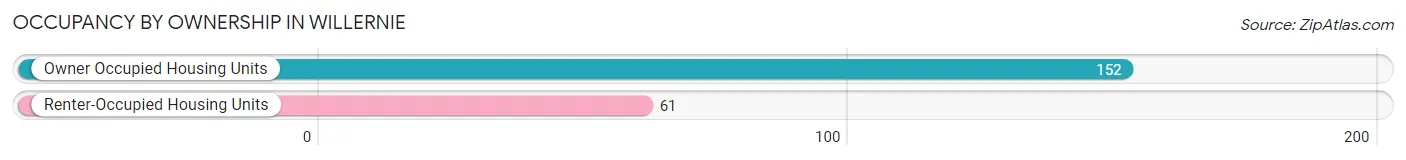
| Occupancy | # Housing Units | % Housing Units |
| Owner Occupied Housing Units | 152 | 71.4% |
| Renter-Occupied Housing Units | 61 | 28.6% |
| Total Occupied Housing Units | 213 | 100.0% |
Occupancy by Household Size in Willernie
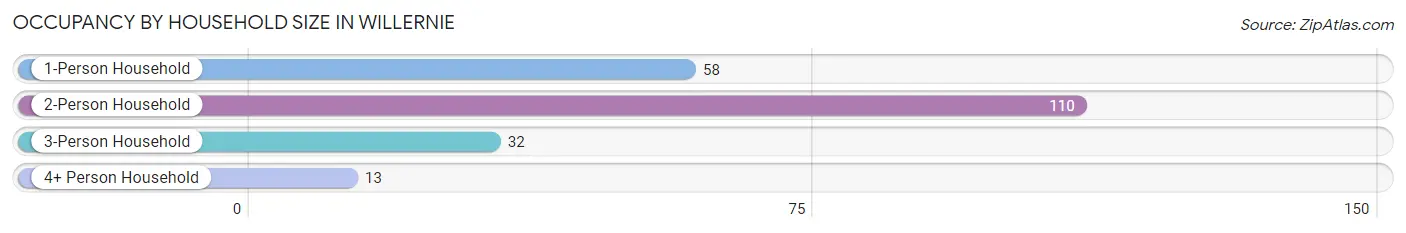
| Household Size | # Housing Units | % Housing Units |
| 1-Person Household | 58 | 27.2% |
| 2-Person Household | 110 | 51.6% |
| 3-Person Household | 32 | 15.0% |
| 4+ Person Household | 13 | 6.1% |
| Total Housing Units | 213 | 100.0% |
Occupancy by Ownership by Household Size in Willernie
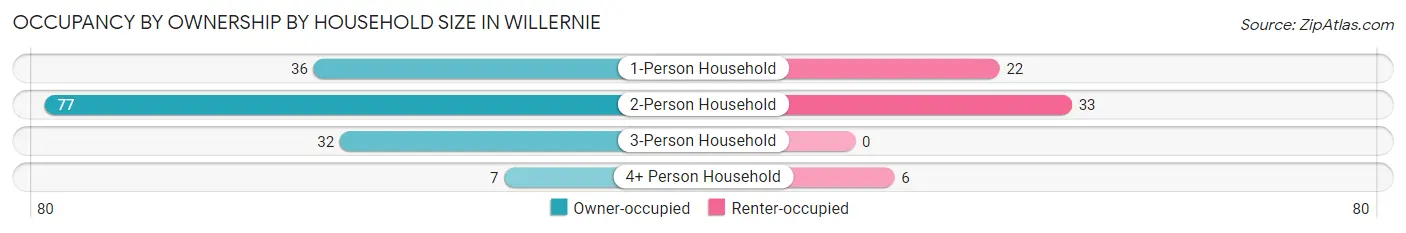
| Household Size | Owner-occupied | Renter-occupied |
| 1-Person Household | 36 (62.1%) | 22 (37.9%) |
| 2-Person Household | 77 (70.0%) | 33 (30.0%) |
| 3-Person Household | 32 (100.0%) | 0 (0.0%) |
| 4+ Person Household | 7 (53.8%) | 6 (46.2%) |
| Total Housing Units | 152 (71.4%) | 61 (28.6%) |
Occupancy by Educational Attainment in Willernie
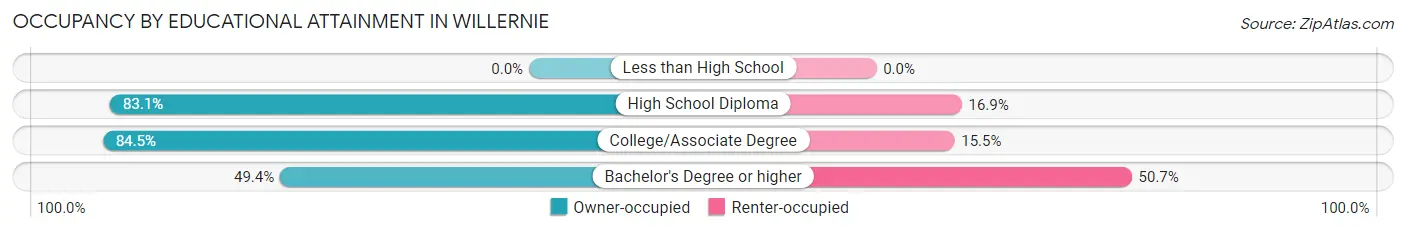
| Household Size | Owner-occupied | Renter-occupied |
| Less than High School | 0 (0.0%) | 0 (0.0%) |
| High School Diploma | 54 (83.1%) | 11 (16.9%) |
| College/Associate Degree | 60 (84.5%) | 11 (15.5%) |
| Bachelor's Degree or higher | 38 (49.3%) | 39 (50.6%) |
Occupancy by Age of Householder in Willernie
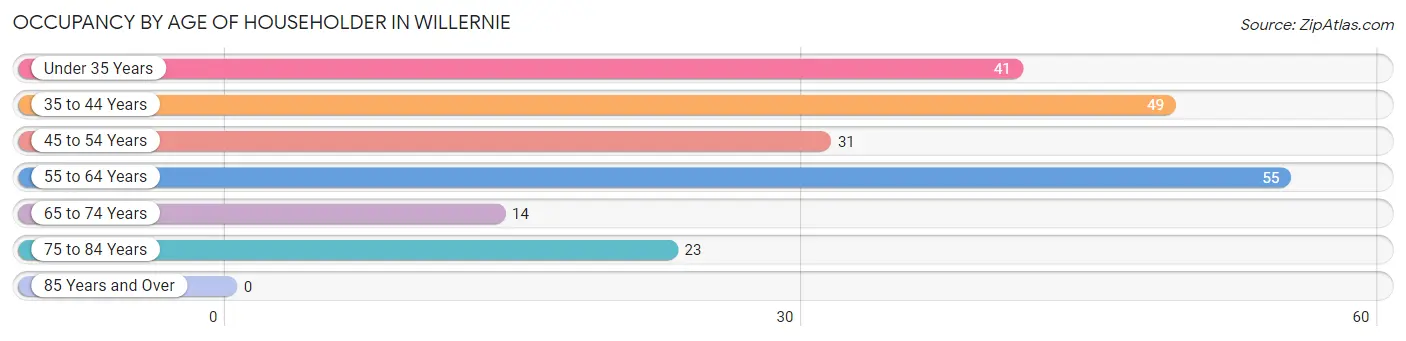
| Age Bracket | # Households | % Households |
| Under 35 Years | 41 | 19.3% |
| 35 to 44 Years | 49 | 23.0% |
| 45 to 54 Years | 31 | 14.5% |
| 55 to 64 Years | 55 | 25.8% |
| 65 to 74 Years | 14 | 6.6% |
| 75 to 84 Years | 23 | 10.8% |
| 85 Years and Over | 0 | 0.0% |
| Total | 213 | 100.0% |
Housing Finances in Willernie
Median Income by Occupancy in Willernie
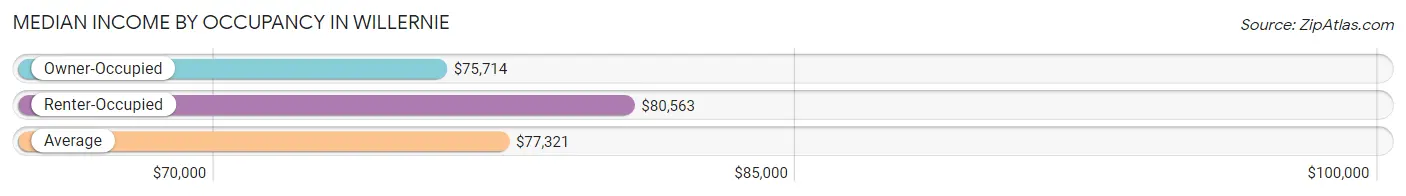
| Occupancy Type | # Households | Median Income |
| Owner-Occupied | 152 (71.4%) | $75,714 |
| Renter-Occupied | 61 (28.6%) | $80,563 |
| Average | 213 (100.0%) | $77,321 |
Occupancy by Householder Income Bracket in Willernie
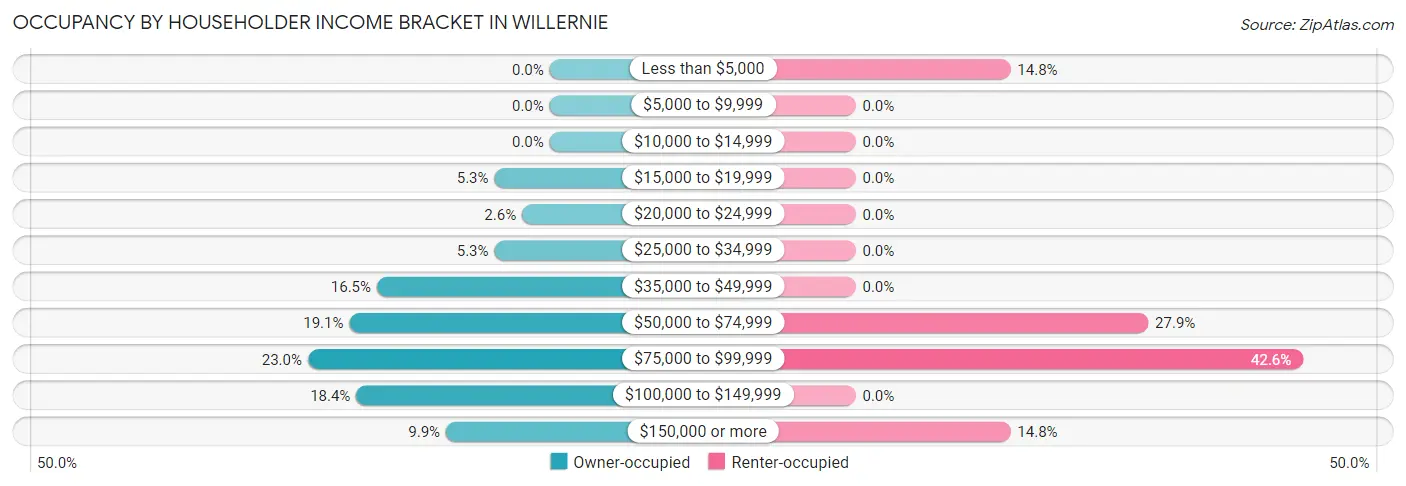
| Income Bracket | Owner-occupied | Renter-occupied |
| Less than $5,000 | 0 (0.0%) | 9 (14.7%) |
| $5,000 to $9,999 | 0 (0.0%) | 0 (0.0%) |
| $10,000 to $14,999 | 0 (0.0%) | 0 (0.0%) |
| $15,000 to $19,999 | 8 (5.3%) | 0 (0.0%) |
| $20,000 to $24,999 | 4 (2.6%) | 0 (0.0%) |
| $25,000 to $34,999 | 8 (5.3%) | 0 (0.0%) |
| $35,000 to $49,999 | 25 (16.5%) | 0 (0.0%) |
| $50,000 to $74,999 | 29 (19.1%) | 17 (27.9%) |
| $75,000 to $99,999 | 35 (23.0%) | 26 (42.6%) |
| $100,000 to $149,999 | 28 (18.4%) | 0 (0.0%) |
| $150,000 or more | 15 (9.9%) | 9 (14.7%) |
| Total | 152 (100.0%) | 61 (100.0%) |
Monthly Housing Cost Tiers in Willernie
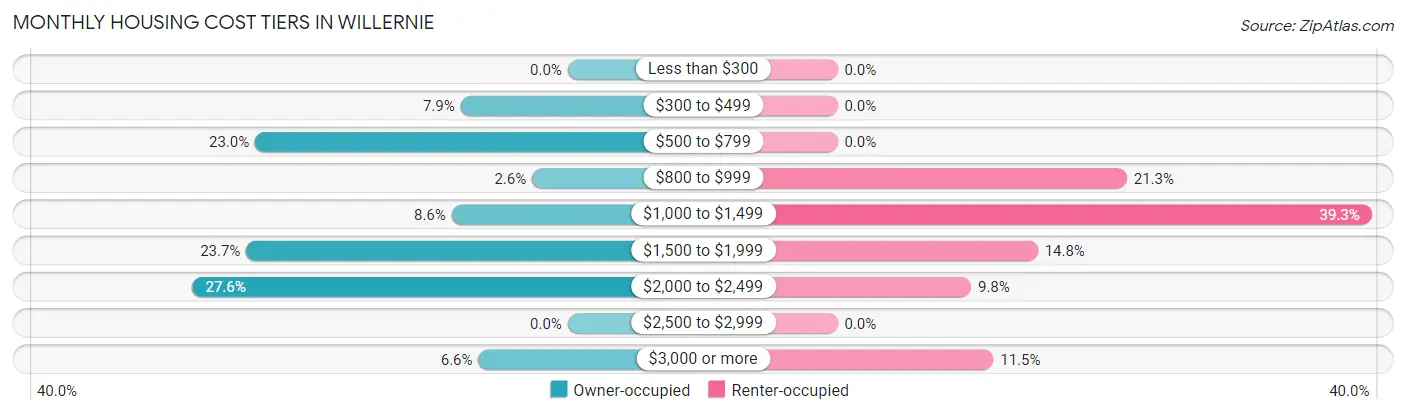
| Monthly Cost | Owner-occupied | Renter-occupied |
| Less than $300 | 0 (0.0%) | 0 (0.0%) |
| $300 to $499 | 12 (7.9%) | 0 (0.0%) |
| $500 to $799 | 35 (23.0%) | 0 (0.0%) |
| $800 to $999 | 4 (2.6%) | 13 (21.3%) |
| $1,000 to $1,499 | 13 (8.6%) | 24 (39.3%) |
| $1,500 to $1,999 | 36 (23.7%) | 9 (14.7%) |
| $2,000 to $2,499 | 42 (27.6%) | 6 (9.8%) |
| $2,500 to $2,999 | 0 (0.0%) | 0 (0.0%) |
| $3,000 or more | 10 (6.6%) | 7 (11.5%) |
| Total | 152 (100.0%) | 61 (100.0%) |
Physical Housing Characteristics in Willernie
Housing Structures in Willernie
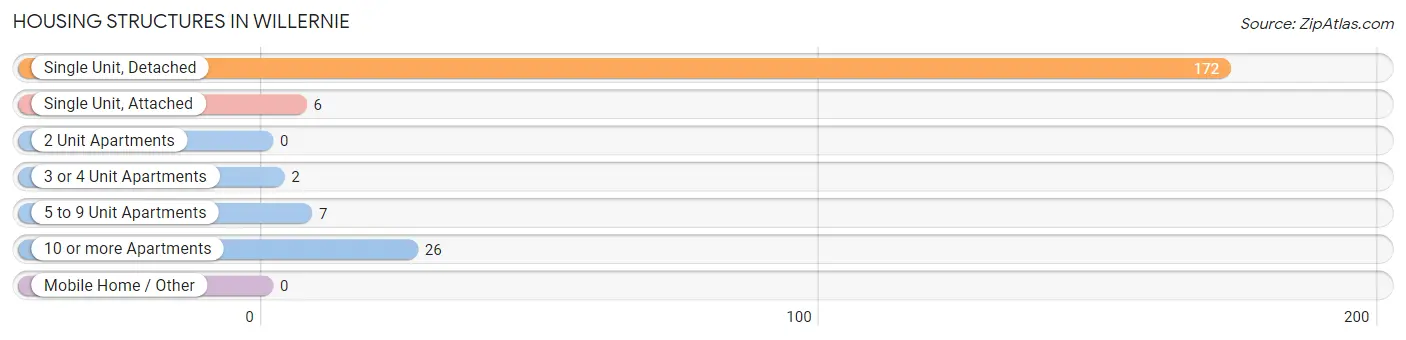
| Structure Type | # Housing Units | % Housing Units |
| Single Unit, Detached | 172 | 80.7% |
| Single Unit, Attached | 6 | 2.8% |
| 2 Unit Apartments | 0 | 0.0% |
| 3 or 4 Unit Apartments | 2 | 0.9% |
| 5 to 9 Unit Apartments | 7 | 3.3% |
| 10 or more Apartments | 26 | 12.2% |
| Mobile Home / Other | 0 | 0.0% |
| Total | 213 | 100.0% |
Housing Structures by Occupancy in Willernie
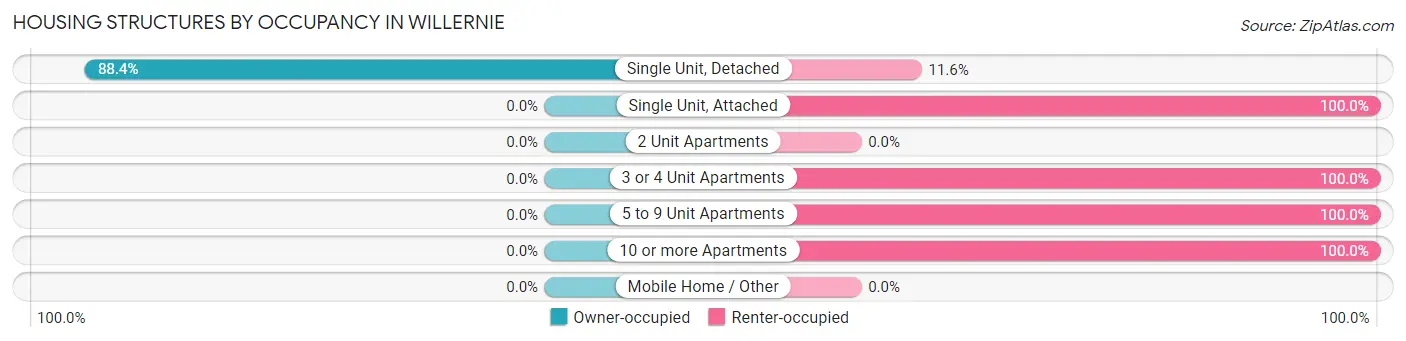
| Structure Type | Owner-occupied | Renter-occupied |
| Single Unit, Detached | 152 (88.4%) | 20 (11.6%) |
| Single Unit, Attached | 0 (0.0%) | 6 (100.0%) |
| 2 Unit Apartments | 0 (0.0%) | 0 (0.0%) |
| 3 or 4 Unit Apartments | 0 (0.0%) | 2 (100.0%) |
| 5 to 9 Unit Apartments | 0 (0.0%) | 7 (100.0%) |
| 10 or more Apartments | 0 (0.0%) | 26 (100.0%) |
| Mobile Home / Other | 0 (0.0%) | 0 (0.0%) |
| Total | 152 (71.4%) | 61 (28.6%) |
Housing Structures by Number of Rooms in Willernie
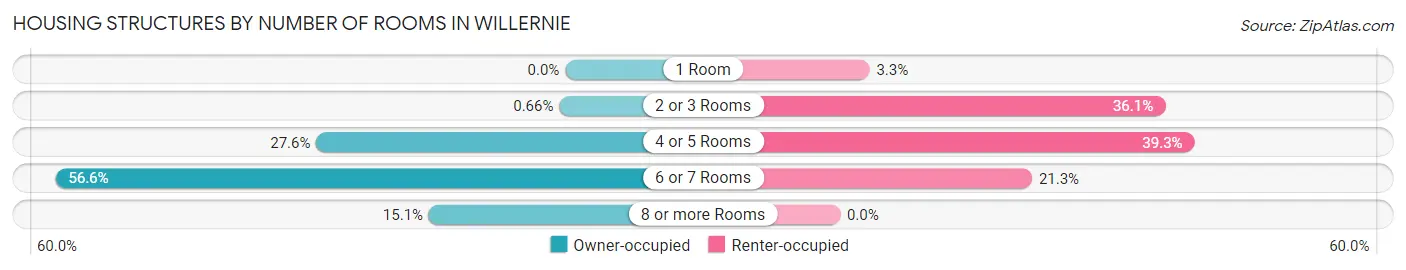
| Number of Rooms | Owner-occupied | Renter-occupied |
| 1 Room | 0 (0.0%) | 2 (3.3%) |
| 2 or 3 Rooms | 1 (0.7%) | 22 (36.1%) |
| 4 or 5 Rooms | 42 (27.6%) | 24 (39.3%) |
| 6 or 7 Rooms | 86 (56.6%) | 13 (21.3%) |
| 8 or more Rooms | 23 (15.1%) | 0 (0.0%) |
| Total | 152 (100.0%) | 61 (100.0%) |
Housing Structure by Heating Type in Willernie
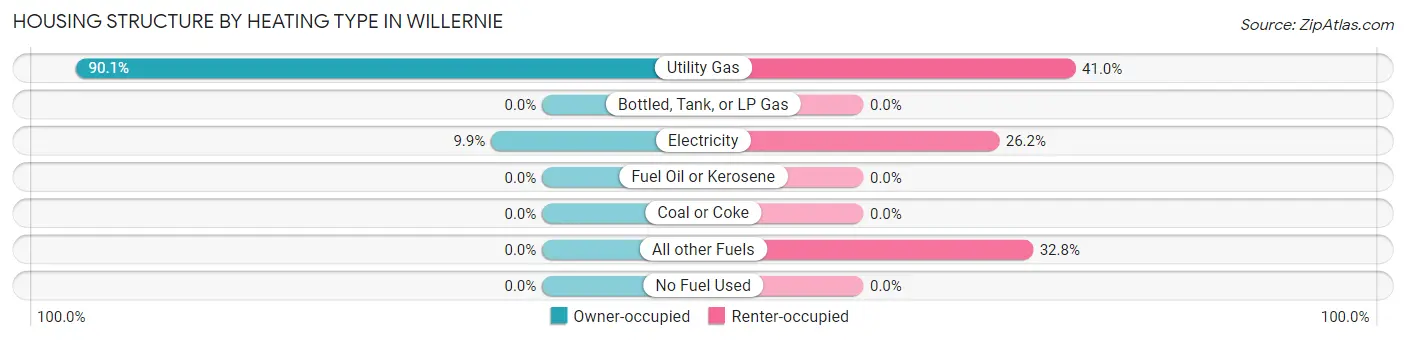
| Heating Type | Owner-occupied | Renter-occupied |
| Utility Gas | 137 (90.1%) | 25 (41.0%) |
| Bottled, Tank, or LP Gas | 0 (0.0%) | 0 (0.0%) |
| Electricity | 15 (9.9%) | 16 (26.2%) |
| Fuel Oil or Kerosene | 0 (0.0%) | 0 (0.0%) |
| Coal or Coke | 0 (0.0%) | 0 (0.0%) |
| All other Fuels | 0 (0.0%) | 20 (32.8%) |
| No Fuel Used | 0 (0.0%) | 0 (0.0%) |
| Total | 152 (100.0%) | 61 (100.0%) |
Household Vehicle Usage in Willernie
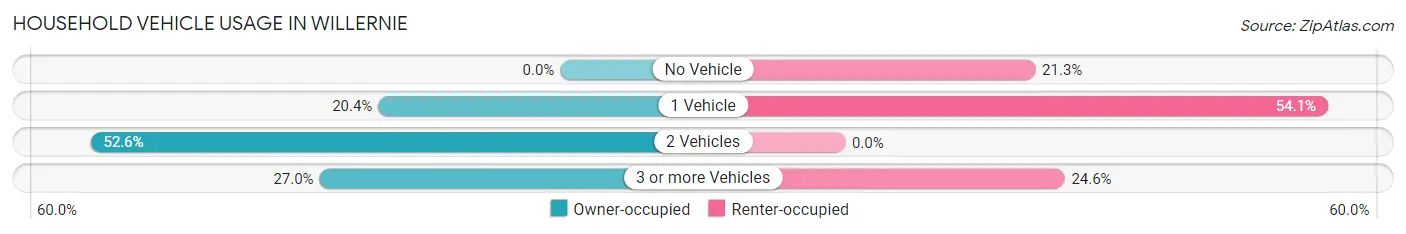
| Vehicles per Household | Owner-occupied | Renter-occupied |
| No Vehicle | 0 (0.0%) | 13 (21.3%) |
| 1 Vehicle | 31 (20.4%) | 33 (54.1%) |
| 2 Vehicles | 80 (52.6%) | 0 (0.0%) |
| 3 or more Vehicles | 41 (27.0%) | 15 (24.6%) |
| Total | 152 (100.0%) | 61 (100.0%) |
Real Estate & Mortgages in Willernie
Real Estate and Mortgage Overview in Willernie
| Characteristic | Without Mortgage | With Mortgage |
| Housing Units | 47 | 105 |
| Median Property Value | $235,000 | $288,800 |
| Median Household Income | $47,375 | $15 |
| Monthly Housing Costs | $577 | $10 |
| Real Estate Taxes | $2,638 | $0 |
Property Value by Mortgage Status in Willernie
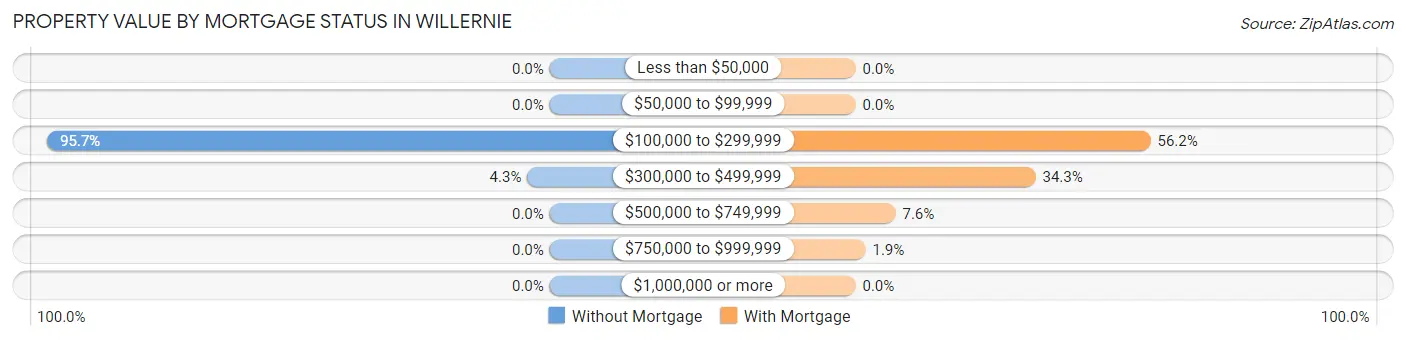
| Property Value | Without Mortgage | With Mortgage |
| Less than $50,000 | 0 (0.0%) | 0 (0.0%) |
| $50,000 to $99,999 | 0 (0.0%) | 0 (0.0%) |
| $100,000 to $299,999 | 45 (95.7%) | 59 (56.2%) |
| $300,000 to $499,999 | 2 (4.3%) | 36 (34.3%) |
| $500,000 to $749,999 | 0 (0.0%) | 8 (7.6%) |
| $750,000 to $999,999 | 0 (0.0%) | 2 (1.9%) |
| $1,000,000 or more | 0 (0.0%) | 0 (0.0%) |
| Total | 47 (100.0%) | 105 (100.0%) |
Household Income by Mortgage Status in Willernie
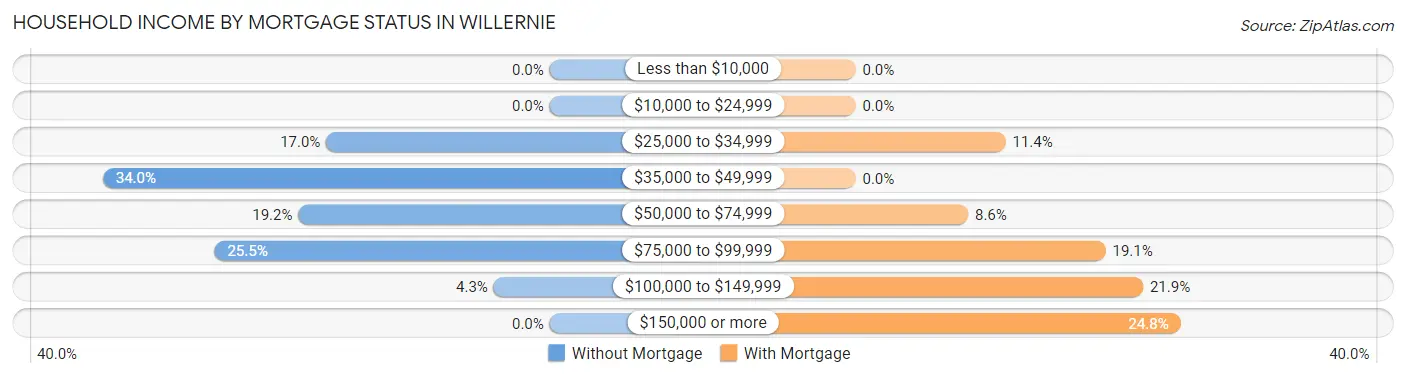
| Household Income | Without Mortgage | With Mortgage |
| Less than $10,000 | 0 (0.0%) | 0 (0.0%) |
| $10,000 to $24,999 | 0 (0.0%) | 0 (0.0%) |
| $25,000 to $34,999 | 8 (17.0%) | 12 (11.4%) |
| $35,000 to $49,999 | 16 (34.0%) | 0 (0.0%) |
| $50,000 to $74,999 | 9 (19.2%) | 9 (8.6%) |
| $75,000 to $99,999 | 12 (25.5%) | 20 (19.1%) |
| $100,000 to $149,999 | 2 (4.3%) | 23 (21.9%) |
| $150,000 or more | 0 (0.0%) | 26 (24.8%) |
| Total | 47 (100.0%) | 105 (100.0%) |
Property Value to Household Income Ratio in Willernie
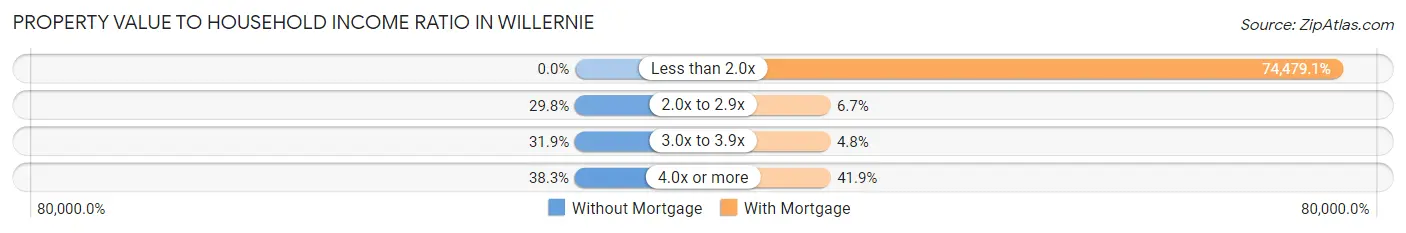
| Value-to-Income Ratio | Without Mortgage | With Mortgage |
| Less than 2.0x | 0 (0.0%) | 78,203 (74,479.0%) |
| 2.0x to 2.9x | 14 (29.8%) | 7 (6.7%) |
| 3.0x to 3.9x | 15 (31.9%) | 5 (4.8%) |
| 4.0x or more | 18 (38.3%) | 44 (41.9%) |
| Total | 47 (100.0%) | 105 (100.0%) |
Real Estate Taxes by Mortgage Status in Willernie
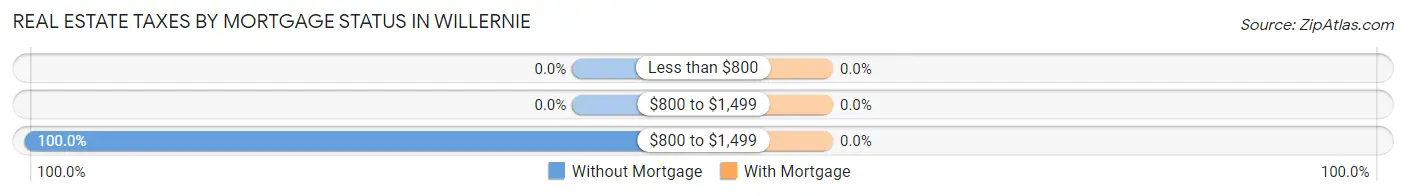
| Property Taxes | Without Mortgage | With Mortgage |
| Less than $800 | 0 (0.0%) | 0 (0.0%) |
| $800 to $1,499 | 0 (0.0%) | 0 (0.0%) |
| $800 to $1,499 | 47 (100.0%) | 0 (0.0%) |
| Total | 47 (100.0%) | 105 (100.0%) |
Health & Disability in Willernie
Health Insurance Coverage by Age in Willernie
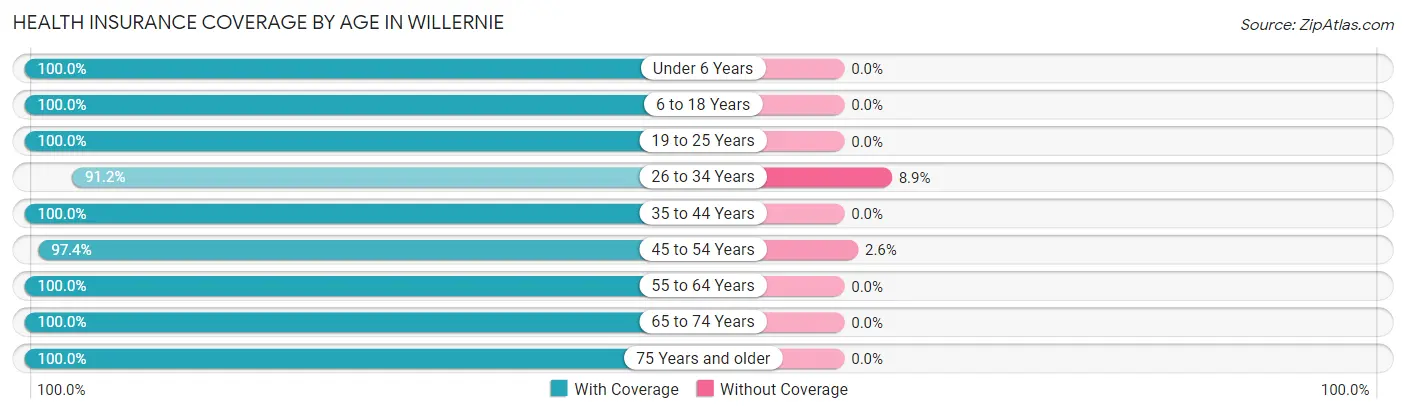
| Age Bracket | With Coverage | Without Coverage |
| Under 6 Years | 4 (100.0%) | 0 (0.0%) |
| 6 to 18 Years | 63 (100.0%) | 0 (0.0%) |
| 19 to 25 Years | 23 (100.0%) | 0 (0.0%) |
| 26 to 34 Years | 103 (91.1%) | 10 (8.8%) |
| 35 to 44 Years | 65 (100.0%) | 0 (0.0%) |
| 45 to 54 Years | 76 (97.4%) | 2 (2.6%) |
| 55 to 64 Years | 64 (100.0%) | 0 (0.0%) |
| 65 to 74 Years | 28 (100.0%) | 0 (0.0%) |
| 75 Years and older | 25 (100.0%) | 0 (0.0%) |
| Total | 451 (97.4%) | 12 (2.6%) |
Health Insurance Coverage by Citizenship Status in Willernie
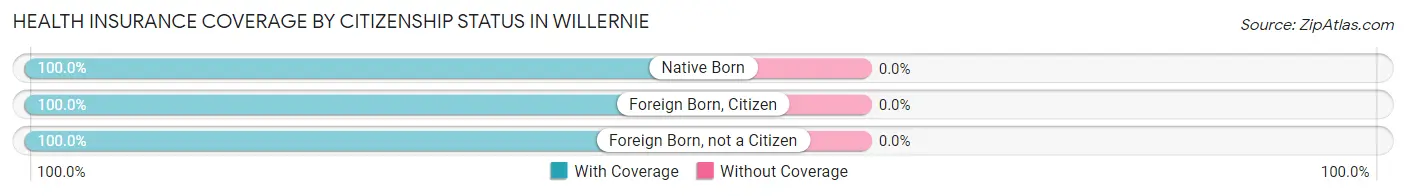
| Citizenship Status | With Coverage | Without Coverage |
| Native Born | 4 (100.0%) | 0 (0.0%) |
| Foreign Born, Citizen | 63 (100.0%) | 0 (0.0%) |
| Foreign Born, not a Citizen | 23 (100.0%) | 0 (0.0%) |
Health Insurance Coverage by Household Income in Willernie
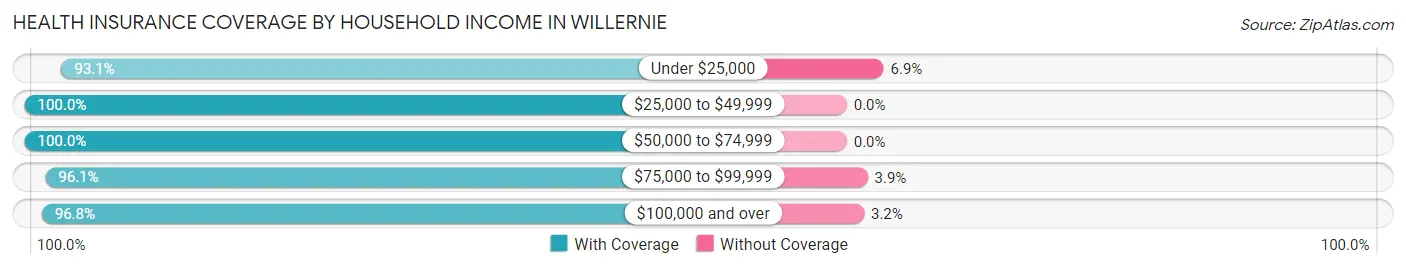
| Household Income | With Coverage | Without Coverage |
| Under $25,000 | 27 (93.1%) | 2 (6.9%) |
| $25,000 to $49,999 | 87 (100.0%) | 0 (0.0%) |
| $50,000 to $74,999 | 69 (100.0%) | 0 (0.0%) |
| $75,000 to $99,999 | 148 (96.1%) | 6 (3.9%) |
| $100,000 and over | 120 (96.8%) | 4 (3.2%) |
Public vs Private Health Insurance Coverage by Age in Willernie
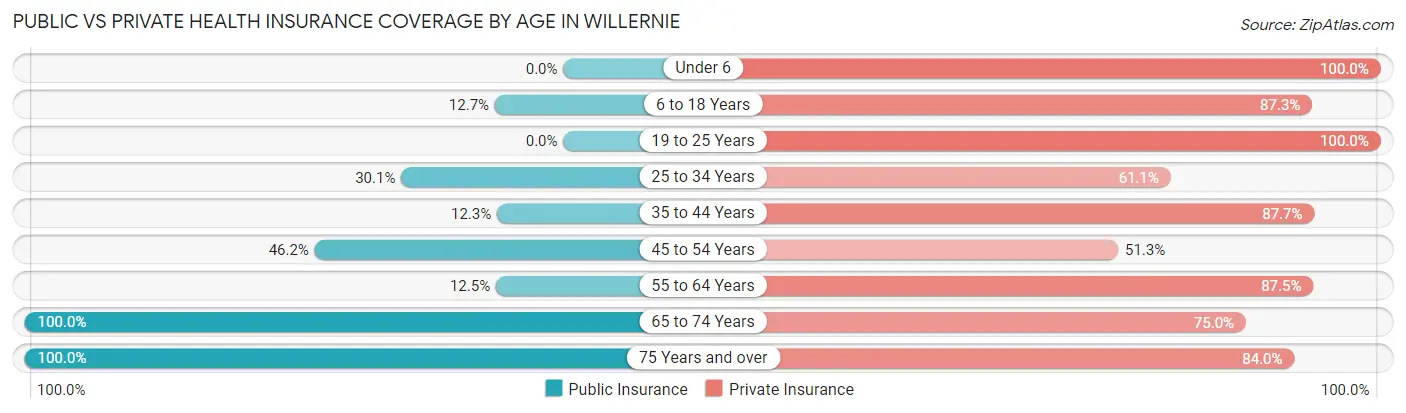
| Age Bracket | Public Insurance | Private Insurance |
| Under 6 | 0 (0.0%) | 4 (100.0%) |
| 6 to 18 Years | 8 (12.7%) | 55 (87.3%) |
| 19 to 25 Years | 0 (0.0%) | 23 (100.0%) |
| 25 to 34 Years | 34 (30.1%) | 69 (61.1%) |
| 35 to 44 Years | 8 (12.3%) | 57 (87.7%) |
| 45 to 54 Years | 36 (46.2%) | 40 (51.3%) |
| 55 to 64 Years | 8 (12.5%) | 56 (87.5%) |
| 65 to 74 Years | 28 (100.0%) | 21 (75.0%) |
| 75 Years and over | 25 (100.0%) | 21 (84.0%) |
| Total | 147 (31.8%) | 346 (74.7%) |
Disability Status by Sex by Age in Willernie
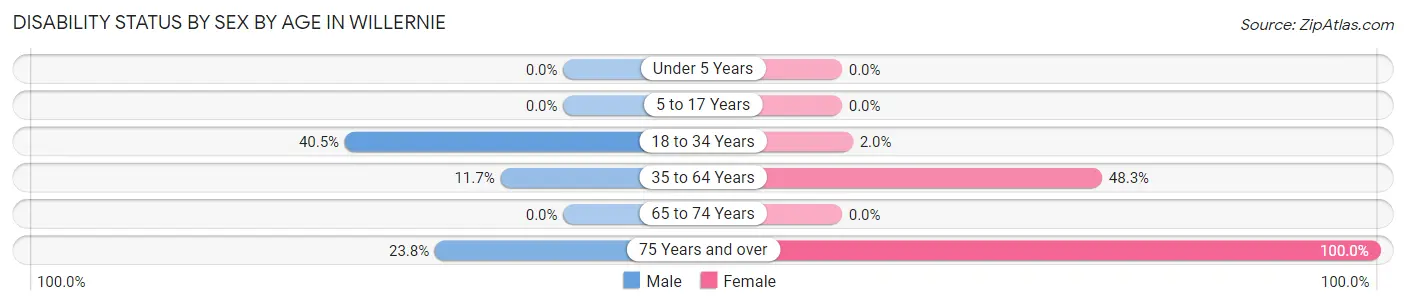
| Age Bracket | Male | Female |
| Under 5 Years | 0 (0.0%) | 0 (0.0%) |
| 5 to 17 Years | 0 (0.0%) | 0 (0.0%) |
| 18 to 34 Years | 15 (40.5%) | 2 (2.0%) |
| 35 to 64 Years | 14 (11.7%) | 42 (48.3%) |
| 65 to 74 Years | 0 (0.0%) | 0 (0.0%) |
| 75 Years and over | 5 (23.8%) | 4 (100.0%) |
Disability Class by Sex by Age in Willernie
Disability Class: Hearing Difficulty
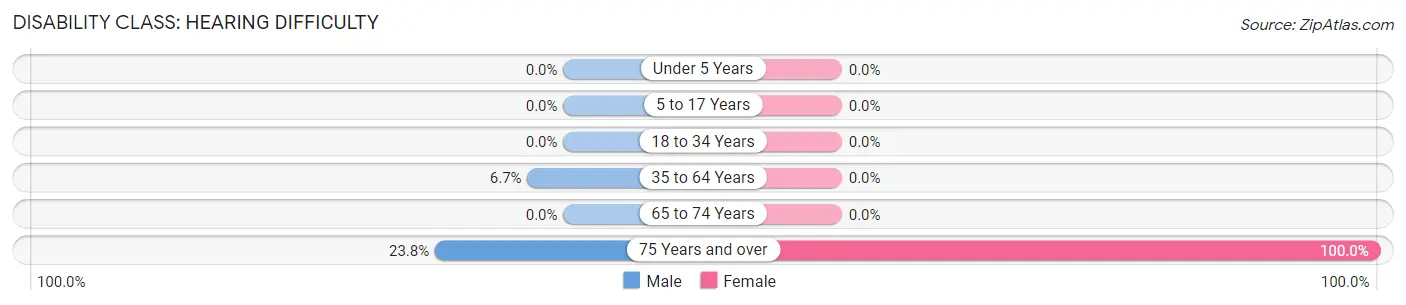
| Age Bracket | Male | Female |
| Under 5 Years | 0 (0.0%) | 0 (0.0%) |
| 5 to 17 Years | 0 (0.0%) | 0 (0.0%) |
| 18 to 34 Years | 0 (0.0%) | 0 (0.0%) |
| 35 to 64 Years | 8 (6.7%) | 0 (0.0%) |
| 65 to 74 Years | 0 (0.0%) | 0 (0.0%) |
| 75 Years and over | 5 (23.8%) | 4 (100.0%) |
Disability Class: Vision Difficulty
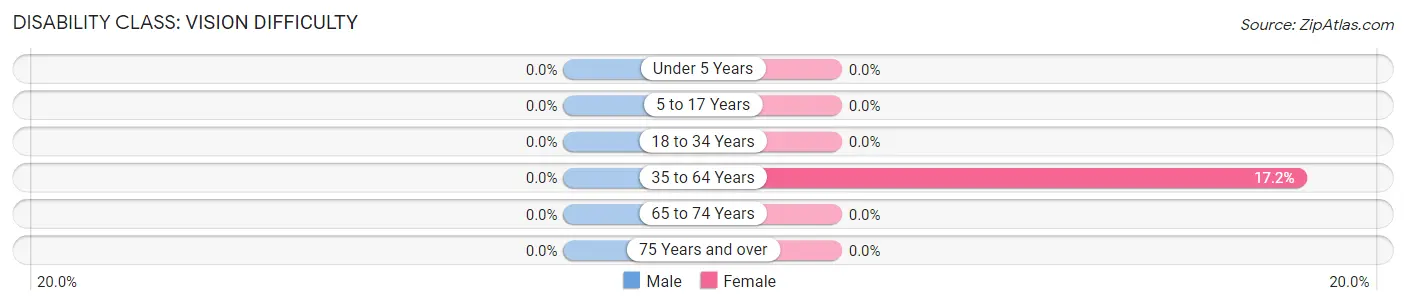
| Age Bracket | Male | Female |
| Under 5 Years | 0 (0.0%) | 0 (0.0%) |
| 5 to 17 Years | 0 (0.0%) | 0 (0.0%) |
| 18 to 34 Years | 0 (0.0%) | 0 (0.0%) |
| 35 to 64 Years | 0 (0.0%) | 15 (17.2%) |
| 65 to 74 Years | 0 (0.0%) | 0 (0.0%) |
| 75 Years and over | 0 (0.0%) | 0 (0.0%) |
Disability Class: Cognitive Difficulty
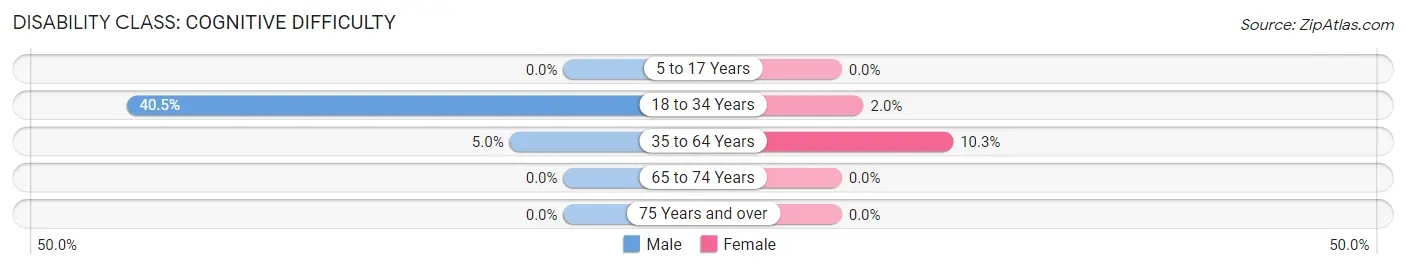
| Age Bracket | Male | Female |
| 5 to 17 Years | 0 (0.0%) | 0 (0.0%) |
| 18 to 34 Years | 15 (40.5%) | 2 (2.0%) |
| 35 to 64 Years | 6 (5.0%) | 9 (10.3%) |
| 65 to 74 Years | 0 (0.0%) | 0 (0.0%) |
| 75 Years and over | 0 (0.0%) | 0 (0.0%) |
Disability Class: Ambulatory Difficulty
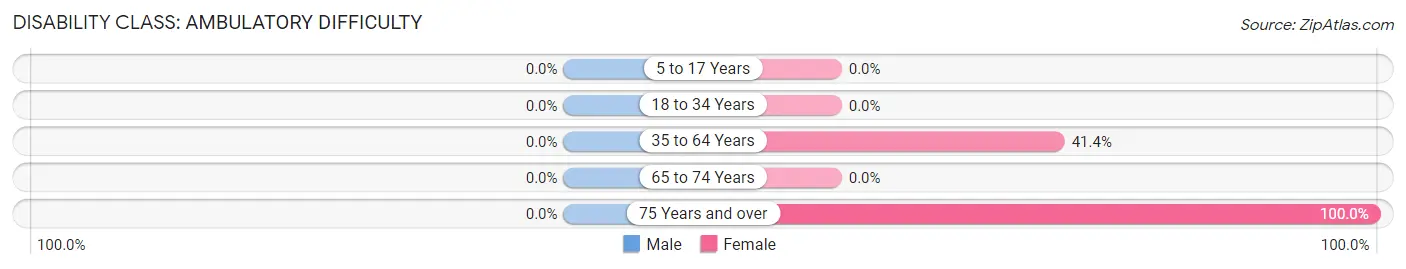
| Age Bracket | Male | Female |
| 5 to 17 Years | 0 (0.0%) | 0 (0.0%) |
| 18 to 34 Years | 0 (0.0%) | 0 (0.0%) |
| 35 to 64 Years | 0 (0.0%) | 36 (41.4%) |
| 65 to 74 Years | 0 (0.0%) | 0 (0.0%) |
| 75 Years and over | 0 (0.0%) | 4 (100.0%) |
Disability Class: Self-Care Difficulty
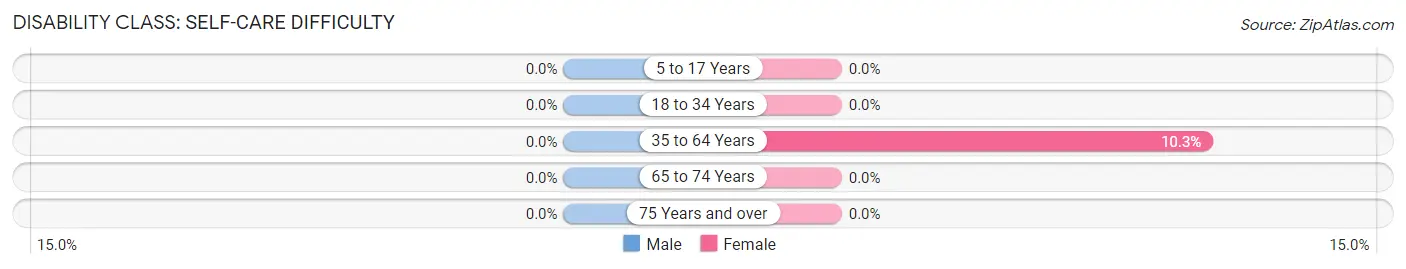
| Age Bracket | Male | Female |
| 5 to 17 Years | 0 (0.0%) | 0 (0.0%) |
| 18 to 34 Years | 0 (0.0%) | 0 (0.0%) |
| 35 to 64 Years | 0 (0.0%) | 9 (10.3%) |
| 65 to 74 Years | 0 (0.0%) | 0 (0.0%) |
| 75 Years and over | 0 (0.0%) | 0 (0.0%) |
Technology Access in Willernie
Computing Device Access in Willernie
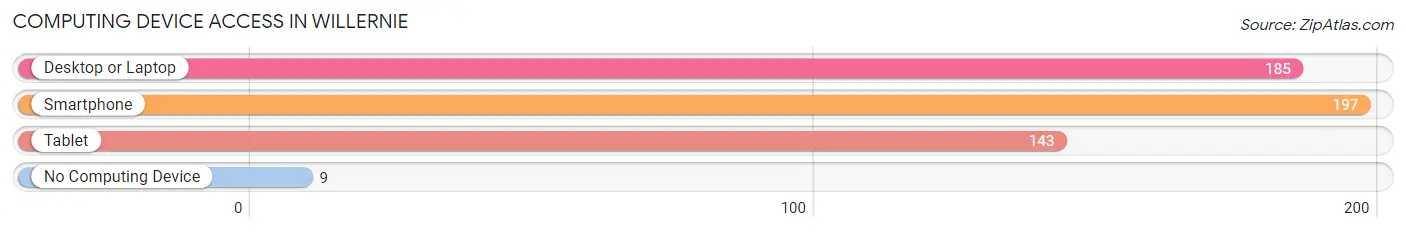
| Device Type | # Households | % Households |
| Desktop or Laptop | 185 | 86.9% |
| Smartphone | 197 | 92.5% |
| Tablet | 143 | 67.1% |
| No Computing Device | 9 | 4.2% |
| Total | 213 | 100.0% |
Internet Access in Willernie
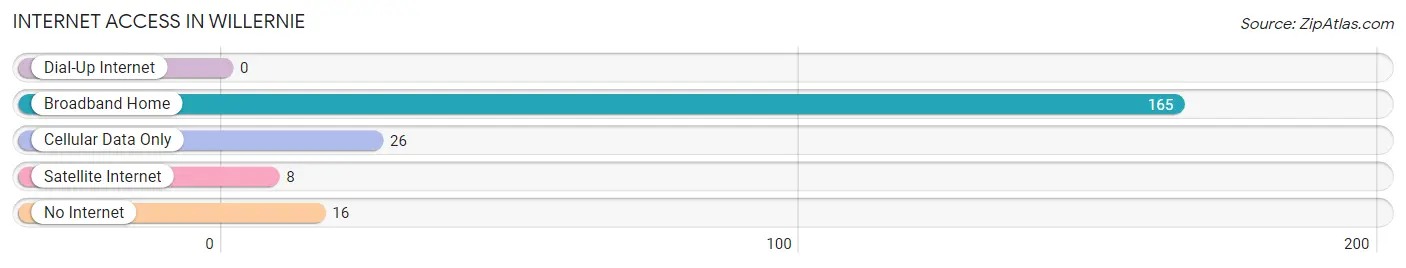
| Internet Type | # Households | % Households |
| Dial-Up Internet | 0 | 0.0% |
| Broadband Home | 165 | 77.5% |
| Cellular Data Only | 26 | 12.2% |
| Satellite Internet | 8 | 3.8% |
| No Internet | 16 | 7.5% |
| Total | 213 | 100.0% |
Willernie Summary
Willernie, Minnesota is a small city located in Washington County, just east of St. Paul. It is a suburb of the Twin Cities metropolitan area and is part of the larger East Metro region. The city has a population of just over 1,000 people and is known for its small-town charm and close-knit community.
History
Willernie was founded in 1887 by William and Ellen Willernie, who were among the first settlers in the area. The city was originally known as Willernie Station, as it was a stop on the St. Paul and Duluth Railroad. The city was officially incorporated in 1895 and was named after the Willernie family.
In the early 1900s, Willernie was a thriving agricultural community. The city was home to several farms, as well as a creamery, a cheese factory, and a canning factory. The city also had a post office, a general store, and a blacksmith shop.
In the 1950s, Willernie began to experience a population boom as people moved to the area from the Twin Cities. The city was annexed by the city of Mahtomedi in 1961, and the two cities have been closely linked ever since.
Geography
Willernie is located in the east-central part of Washington County, just east of St. Paul. The city is situated on the banks of the Mississippi River and is bordered by the cities of Mahtomedi, White Bear Lake, and Birchwood. The city covers an area of 1.3 square miles and has a population density of 810 people per square mile.
The city is located in a hilly region, with the highest point being the Willernie Hill at an elevation of 890 feet. The city is also home to several small lakes, including Lake Willernie, Lake Mahtomedi, and Lake White Bear.
Economy
Willernie’s economy is largely based on the service industry. The city is home to several small businesses, including restaurants, retail stores, and professional services. The city is also home to a number of manufacturing companies, including a plastics factory and a printing company.
The city is also home to several parks and recreational areas, including the Willernie Park and the Willernie Nature Center. The city is also home to the Willernie Golf Course, which is a popular destination for golfers from the Twin Cities area.
Demographics
As of the 2010 census, Willernie had a population of 1,072 people. The racial makeup of the city was 94.3% White, 1.2% African American, 0.3% Native American, 1.2% Asian, 0.1% Pacific Islander, 1.2% from other races, and 1.9% from two or more races. Hispanic or Latino of any race were 3.2% of the population.
The median household income in Willernie was $60,938, and the median family income was $68,750. The per capita income for the city was $27,945. About 4.3% of families and 5.7% of the population were below the poverty line, including 6.3% of those under age 18 and 4.2% of those age 65 or over.
Willernie is a small city with a close-knit community and a rich history. The city is home to a diverse population and a thriving economy, and it is a great place to live and work.
Common Questions
What is the Total Population of Willernie?
Total Population of Willernie is 463.
What is the Total Male Population of Willernie?
Total Male Population of Willernie is 201.
What is the Total Female Population of Willernie?
Total Female Population of Willernie is 262.
What is the Ratio of Males per 100 Females in Willernie?
There are 76.72 Males per 100 Females in Willernie.
What is the Ratio of Females per 100 Males in Willernie?
There are 130.35 Females per 100 Males in Willernie.
What is the Median Population Age in Willernie?
Median Population Age in Willernie is 38.1 Years.
What is the Average Family Size in Willernie
Average Family Size in Willernie is 2.7 People.
What is the Average Household Size in Willernie
Average Household Size in Willernie is 2.2 People.
What is Per Capita Income in Willernie?
Per Capita income in Willernie is $38,110.
What is the Median Family Income in Willernie?
Median Family Income in Willernie is $80,625.
What is the Median Household income in Willernie?
Median Household Income in Willernie is $77,321.
What is Income or Wage Gap in Willernie?
Income or Wage Gap in Willernie is 46.5%.
Women in Willernie earn 53.5 cents for every dollar earned by a man.
What is Inequality or Gini Index in Willernie?
Inequality or Gini Index in Willernie is 0.32.
How Large is the Labor Force in Willernie?
There are 281 People in the Labor Forcein in Willernie.
What is the Percentage of People in the Labor Force in Willernie?
66.7% of People are in the Labor Force in Willernie.
What is the Unemployment Rate in Willernie?
Unemployment Rate in Willernie is 21.0%.