Lakeland, MN
Lakeland Map
Lakeland Overview
1,637
TOTAL POPULATION
825
MALE POPULATION
812
FEMALE POPULATION
101.60
MALES / 100 FEMALES
98.42
FEMALES / 100 MALES
52.3
MEDIAN AGE
2.6
AVG FAMILY SIZE
2.2
AVG HOUSEHOLD SIZE
$52,074
PER CAPITA INCOME
$106,563
AVG FAMILY INCOME
$96,176
AVG HOUSEHOLD INCOME
21.8%
WAGE / INCOME GAP [ % ]
78.2¢/ $1
WAGE / INCOME GAP [ $ ]
0.37
INEQUALITY / GINI INDEX
960
LABOR FORCE [ PEOPLE ]
68.4%
PERCENT IN LABOR FORCE
4.8%
UNEMPLOYMENT RATE
Lakeland Zip Codes
Lakeland Area Codes
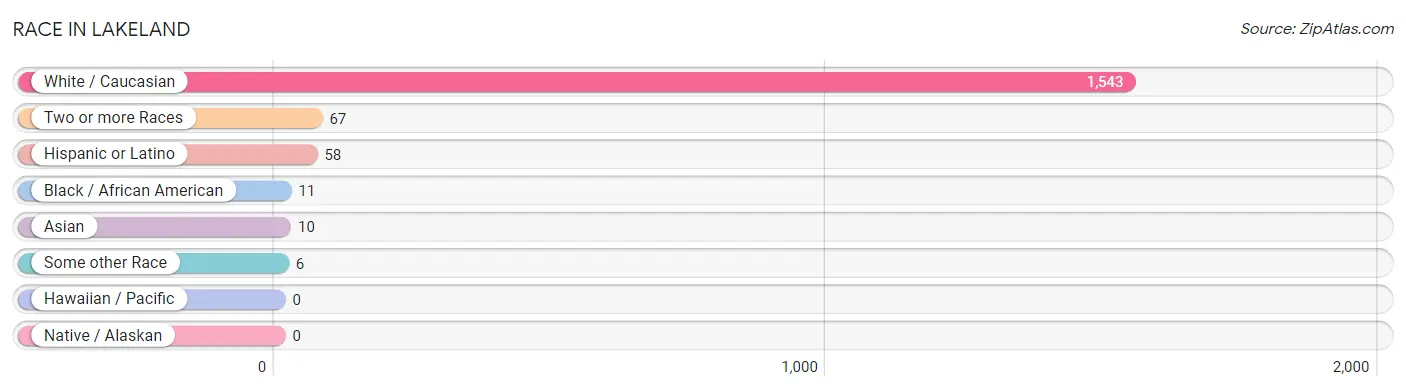
Race in Lakeland
The most populous races in Lakeland are White / Caucasian (1,543 | 94.3%), Two or more Races (67 | 4.1%), and Hispanic or Latino (58 | 3.5%).
| Race | # Population | % Population |
| Asian | 10 | 0.6% |
| Black / African American | 11 | 0.7% |
| Hawaiian / Pacific | 0 | 0.0% |
| Hispanic or Latino | 58 | 3.5% |
| Native / Alaskan | 0 | 0.0% |
| White / Caucasian | 1,543 | 94.3% |
| Two or more Races | 67 | 4.1% |
| Some other Race | 6 | 0.4% |
| Total | 1,637 | 100.0% |
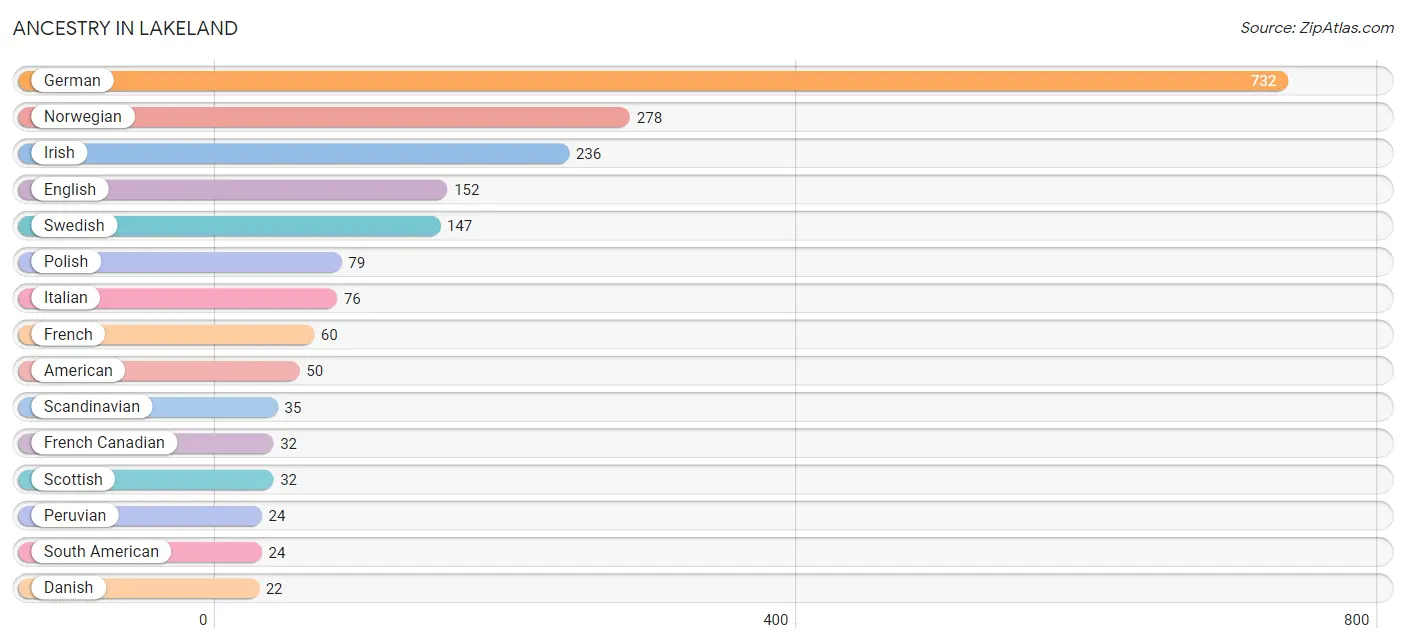
Ancestry in Lakeland
The most populous ancestries reported in Lakeland are German (732 | 44.7%), Norwegian (278 | 17.0%), Irish (236 | 14.4%), English (152 | 9.3%), and Swedish (147 | 9.0%), together accounting for 94.4% of all Lakeland residents.
| Ancestry | # Population | % Population |
| American | 50 | 3.0% |
| Arab | 2 | 0.1% |
| Austrian | 2 | 0.1% |
| British | 11 | 0.7% |
| Burmese | 7 | 0.4% |
| Chippewa | 2 | 0.1% |
| Croatian | 2 | 0.1% |
| Czech | 8 | 0.5% |
| Czechoslovakian | 4 | 0.2% |
| Danish | 22 | 1.3% |
| Dutch | 10 | 0.6% |
| Eastern European | 2 | 0.1% |
| English | 152 | 9.3% |
| European | 5 | 0.3% |
| Finnish | 15 | 0.9% |
| French | 60 | 3.7% |
| French Canadian | 32 | 1.9% |
| German | 732 | 44.7% |
| Indian (Asian) | 5 | 0.3% |
| Irish | 236 | 14.4% |
| Italian | 76 | 4.6% |
| Korean | 2 | 0.1% |
| Lithuanian | 12 | 0.7% |
| Luxembourger | 2 | 0.1% |
| Mexican | 20 | 1.2% |
| Nigerian | 6 | 0.4% |
| Norwegian | 278 | 17.0% |
| Peruvian | 24 | 1.5% |
| Polish | 79 | 4.8% |
| Russian | 3 | 0.2% |
| Scandinavian | 35 | 2.1% |
| Scotch-Irish | 6 | 0.4% |
| Scottish | 32 | 1.9% |
| Serbian | 3 | 0.2% |
| Slavic | 2 | 0.1% |
| Slovak | 3 | 0.2% |
| Slovene | 9 | 0.5% |
| South African | 2 | 0.1% |
| South American | 24 | 1.5% |
| Spaniard | 3 | 0.2% |
| Spanish | 11 | 0.7% |
| Sri Lankan | 3 | 0.2% |
| Subsaharan African | 8 | 0.5% |
| Swedish | 147 | 9.0% |
| Swiss | 9 | 0.5% |
| Welsh | 5 | 0.3% | View All 46 Rows |
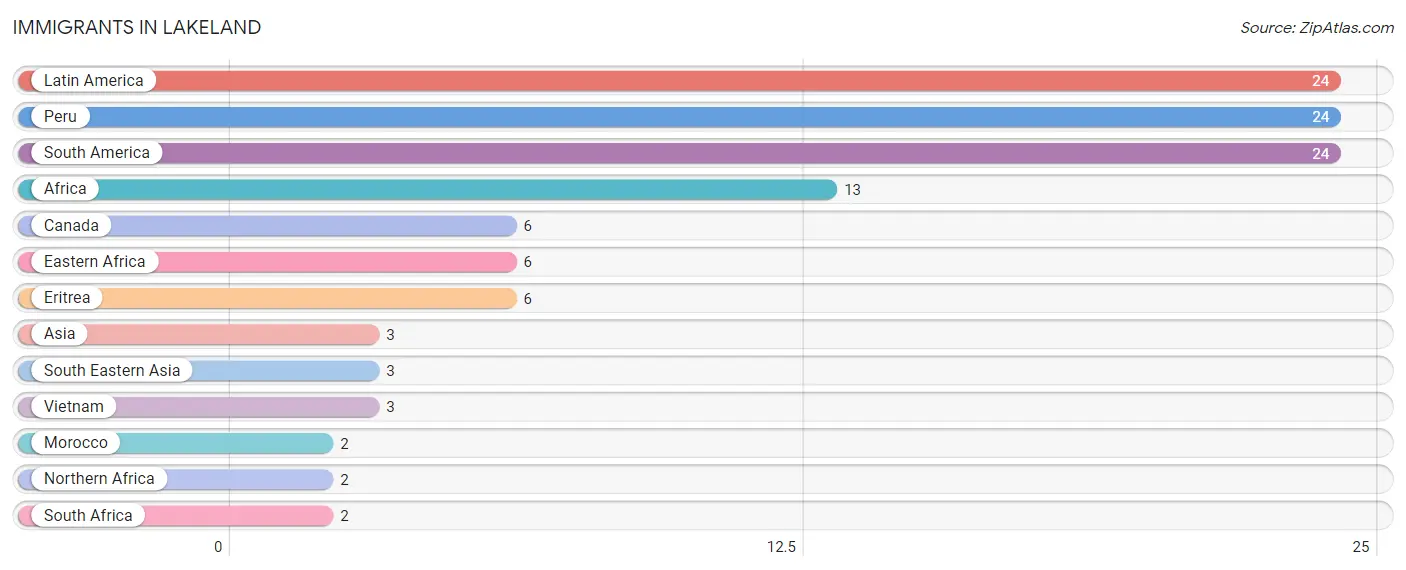
Immigrants in Lakeland
The most numerous immigrant groups reported in Lakeland came from Latin America (24 | 1.5%), Peru (24 | 1.5%), South America (24 | 1.5%), Africa (13 | 0.8%), and Canada (6 | 0.4%), together accounting for 5.6% of all Lakeland residents.
| Immigration Origin | # Population | % Population |
| Africa | 13 | 0.8% |
| Asia | 3 | 0.2% |
| Canada | 6 | 0.4% |
| Eastern Africa | 6 | 0.4% |
| Eritrea | 6 | 0.4% |
| Latin America | 24 | 1.5% |
| Morocco | 2 | 0.1% |
| Northern Africa | 2 | 0.1% |
| Peru | 24 | 1.5% |
| South Africa | 2 | 0.1% |
| South America | 24 | 1.5% |
| South Eastern Asia | 3 | 0.2% |
| Vietnam | 3 | 0.2% | View All 13 Rows |
Sex and Age in Lakeland
Sex and Age in Lakeland
The most populous age groups in Lakeland are 50 to 54 Years (86 | 10.4%) for men and 60 to 64 Years (117 | 14.4%) for women.
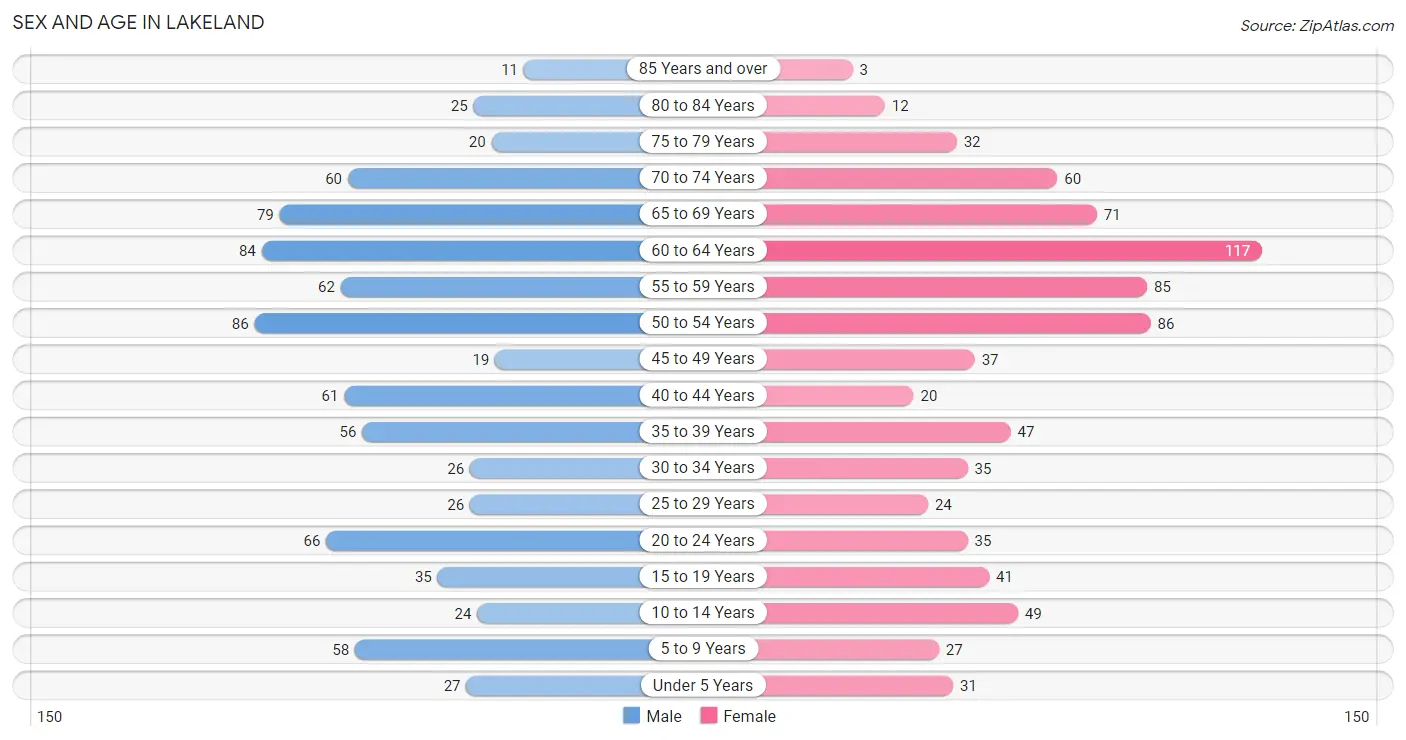
| Age Bracket | Male | Female |
| Under 5 Years | 27 (3.3%) | 31 (3.8%) |
| 5 to 9 Years | 58 (7.0%) | 27 (3.3%) |
| 10 to 14 Years | 24 (2.9%) | 49 (6.0%) |
| 15 to 19 Years | 35 (4.2%) | 41 (5.1%) |
| 20 to 24 Years | 66 (8.0%) | 35 (4.3%) |
| 25 to 29 Years | 26 (3.2%) | 24 (3.0%) |
| 30 to 34 Years | 26 (3.2%) | 35 (4.3%) |
| 35 to 39 Years | 56 (6.8%) | 47 (5.8%) |
| 40 to 44 Years | 61 (7.4%) | 20 (2.5%) |
| 45 to 49 Years | 19 (2.3%) | 37 (4.6%) |
| 50 to 54 Years | 86 (10.4%) | 86 (10.6%) |
| 55 to 59 Years | 62 (7.5%) | 85 (10.5%) |
| 60 to 64 Years | 84 (10.2%) | 117 (14.4%) |
| 65 to 69 Years | 79 (9.6%) | 71 (8.7%) |
| 70 to 74 Years | 60 (7.3%) | 60 (7.4%) |
| 75 to 79 Years | 20 (2.4%) | 32 (3.9%) |
| 80 to 84 Years | 25 (3.0%) | 12 (1.5%) |
| 85 Years and over | 11 (1.3%) | 3 (0.4%) |
| Total | 825 (100.0%) | 812 (100.0%) |
Families and Households in Lakeland
Median Family Size in Lakeland
The median family size in Lakeland is 2.58 persons per family, with single female/mother families (67 | 13.5%) accounting for the largest median family size of 2.91 persons per family. On the other hand, single male/father families (39 | 7.9%) represent the smallest median family size with 2.23 persons per family.
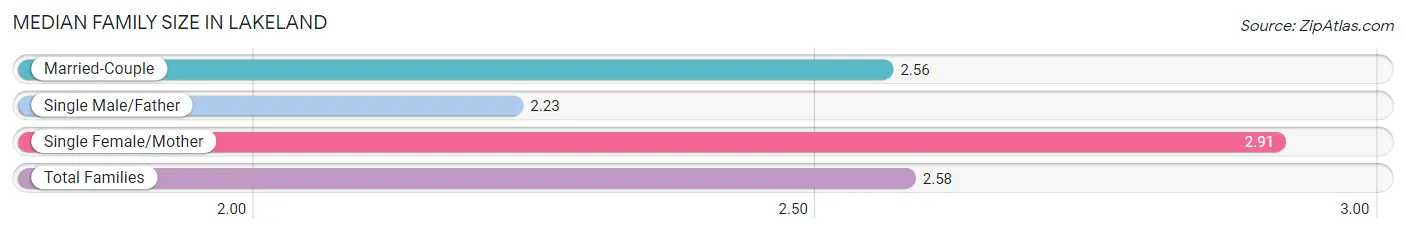
| Family Type | # Families | Family Size |
| Married-Couple | 391 (78.7%) | 2.56 |
| Single Male/Father | 39 (7.9%) | 2.23 |
| Single Female/Mother | 67 (13.5%) | 2.91 |
| Total Families | 497 (100.0%) | 2.58 |
Median Household Size in Lakeland
The median household size in Lakeland is 2.16 persons per household, with single female/mother households (67 | 8.8%) accounting for the largest median household size of 3.06 persons per household. non-family households (261 | 34.4%) represent the smallest median household size with 1.26 persons per household.
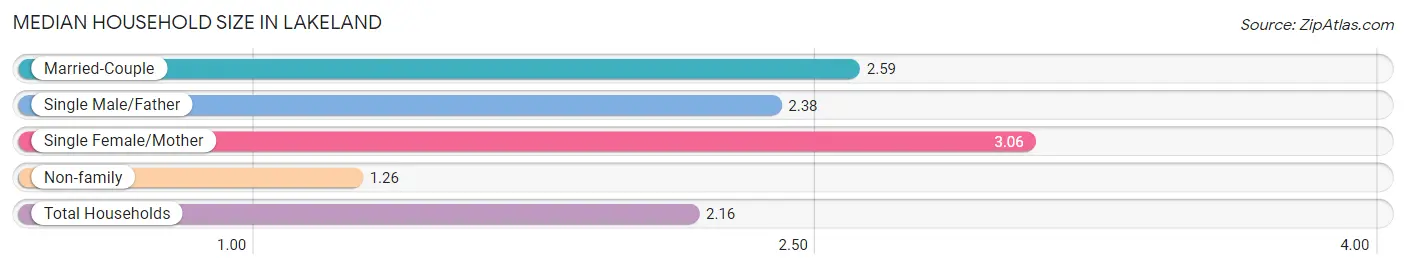
| Household Type | # Households | Household Size |
| Married-Couple | 391 (51.6%) | 2.59 |
| Single Male/Father | 39 (5.1%) | 2.38 |
| Single Female/Mother | 67 (8.8%) | 3.06 |
| Non-family | 261 (34.4%) | 1.26 |
| Total Households | 758 (100.0%) | 2.16 |
Household Size by Marriage Status in Lakeland
Out of a total of 758 households in Lakeland, 497 (65.6%) are family households, while 261 (34.4%) are nonfamily households. The most numerous type of family households are 2-person households, comprising 321, and the most common type of nonfamily households are 1-person households, comprising 210.
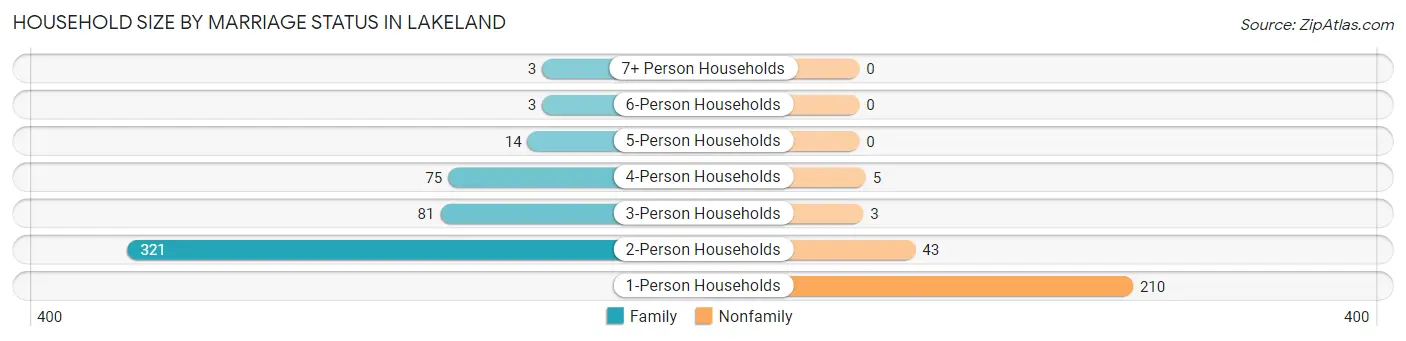
| Household Size | Family Households | Nonfamily Households |
| 1-Person Households | - | 210 (27.7%) |
| 2-Person Households | 321 (42.3%) | 43 (5.7%) |
| 3-Person Households | 81 (10.7%) | 3 (0.4%) |
| 4-Person Households | 75 (9.9%) | 5 (0.7%) |
| 5-Person Households | 14 (1.8%) | 0 (0.0%) |
| 6-Person Households | 3 (0.4%) | 0 (0.0%) |
| 7+ Person Households | 3 (0.4%) | 0 (0.0%) |
| Total | 497 (65.6%) | 261 (34.4%) |
Female Fertility in Lakeland
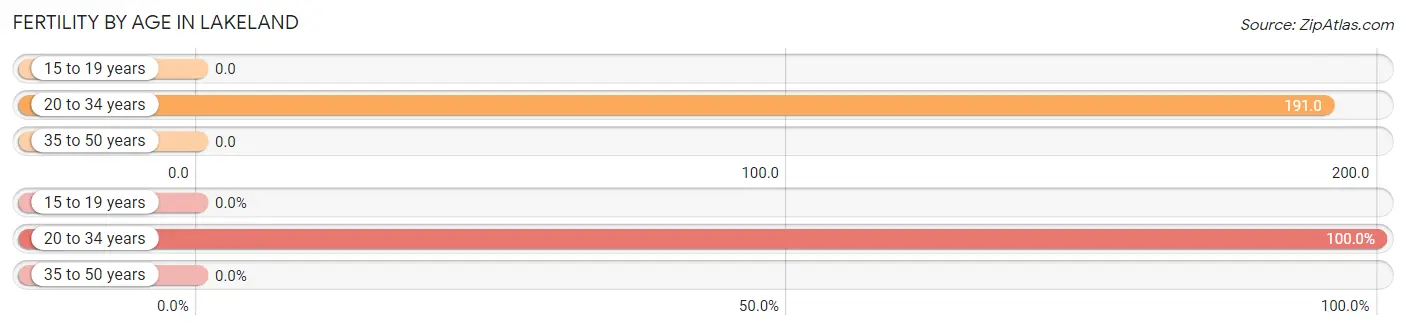
Fertility by Age in Lakeland
Average fertility rate in Lakeland is 70.0 births per 1,000 women. Women in the age bracket of 20 to 34 years have the highest fertility rate with 191.0 births per 1,000 women. Women in the age bracket of 20 to 34 years acount for 100.0% of all women with births.
| Age Bracket | Women with Births | Births / 1,000 Women |
| 15 to 19 years | 0 (0.0%) | 0.0 |
| 20 to 34 years | 18 (100.0%) | 191.0 |
| 35 to 50 years | 0 (0.0%) | 0.0 |
| Total | 18 (100.0%) | 70.0 |
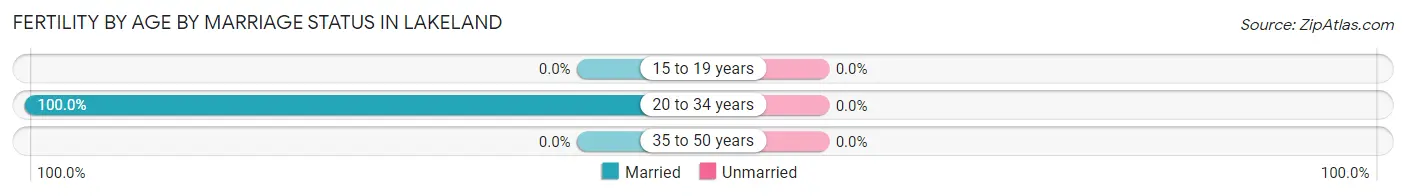
Fertility by Age by Marriage Status in Lakeland
| Age Bracket | Married | Unmarried |
| 15 to 19 years | 0 (0.0%) | 0 (0.0%) |
| 20 to 34 years | 18 (100.0%) | 0 (0.0%) |
| 35 to 50 years | 0 (0.0%) | 0 (0.0%) |
| Total | 18 (100.0%) | 0 (0.0%) |
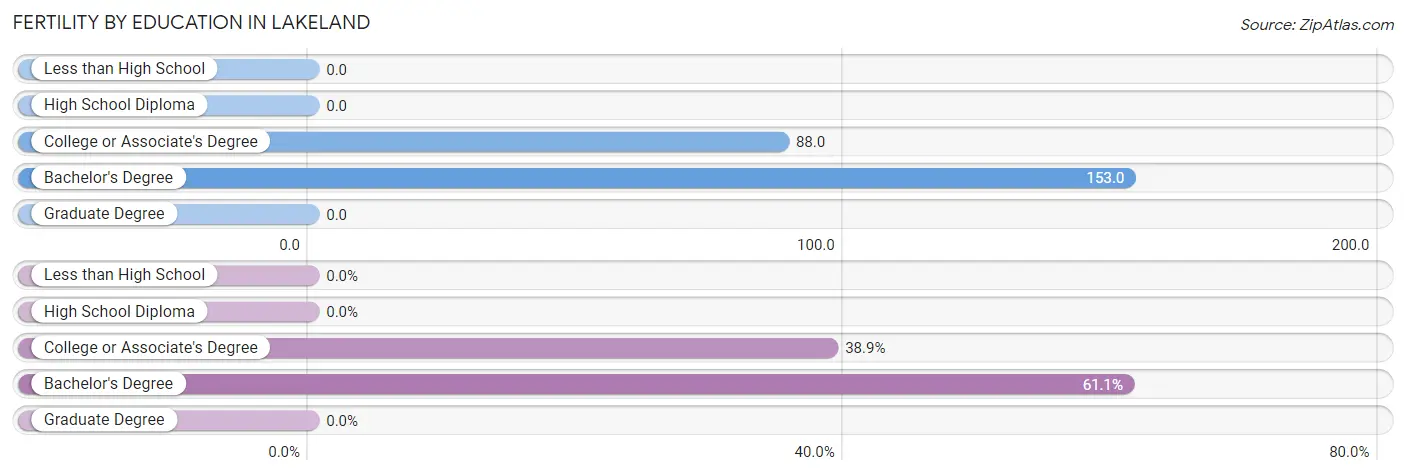
Fertility by Education in Lakeland
| Educational Attainment | Women with Births | Births / 1,000 Women |
| Less than High School | 0 (0.0%) | 0.0 |
| High School Diploma | 0 (0.0%) | 0.0 |
| College or Associate's Degree | 7 (38.9%) | 88.0 |
| Bachelor's Degree | 11 (61.1%) | 153.0 |
| Graduate Degree | 0 (0.0%) | 0.0 |
| Total | 18 (100.0%) | 70.0 |
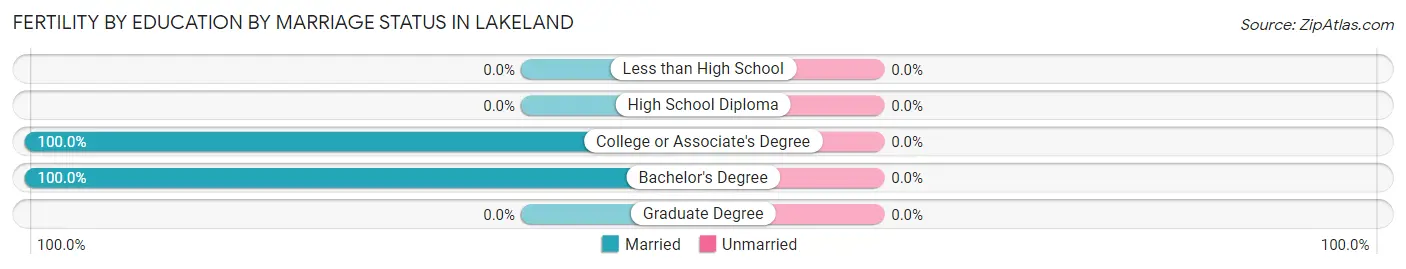
Fertility by Education by Marriage Status in Lakeland
| Educational Attainment | Married | Unmarried |
| Less than High School | 0 (0.0%) | 0 (0.0%) |
| High School Diploma | 0 (0.0%) | 0 (0.0%) |
| College or Associate's Degree | 7 (100.0%) | 0 (0.0%) |
| Bachelor's Degree | 11 (100.0%) | 0 (0.0%) |
| Graduate Degree | 0 (0.0%) | 0 (0.0%) |
| Total | 18 (100.0%) | 0 (0.0%) |
Income in Lakeland
Income Overview in Lakeland
Per Capita Income in Lakeland is $52,074, while median incomes of families and households are $106,563 and $96,176 respectively.
| Characteristic | Number | Measure |
| Per Capita Income | 1,637 | $52,074 |
| Median Family Income | 497 | $106,563 |
| Mean Family Income | 497 | $128,866 |
| Median Household Income | 758 | $96,176 |
| Mean Household Income | 758 | $112,080 |
| Income Deficit | 497 | $0 |
| Wage / Income Gap (%) | 1,637 | 21.83% |
| Wage / Income Gap ($) | 1,637 | 78.17¢ per $1 |
| Gini / Inequality Index | 1,637 | 0.37 |
Earnings by Sex in Lakeland
Average Earnings in Lakeland are $48,125, $53,661 for men and $41,947 for women, a difference of 21.8%.
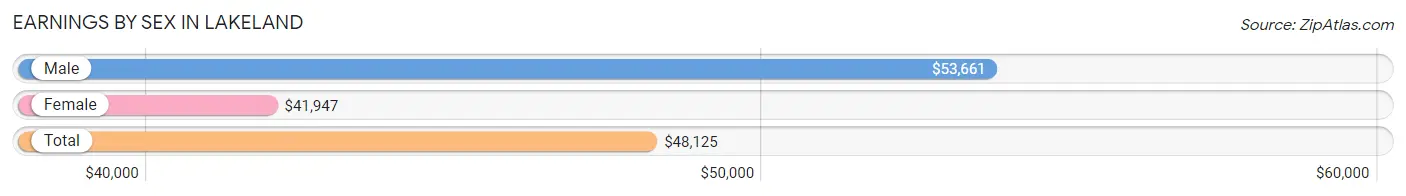
| Sex | Number | Average Earnings |
| Male | 507 (50.5%) | $53,661 |
| Female | 497 (49.5%) | $41,947 |
| Total | 1,004 (100.0%) | $48,125 |
Earnings by Sex by Income Bracket in Lakeland
The most common earnings brackets in Lakeland are $100,000+ for men (146 | 28.8%) and $40,000 to $44,999 for women (65 | 13.1%).
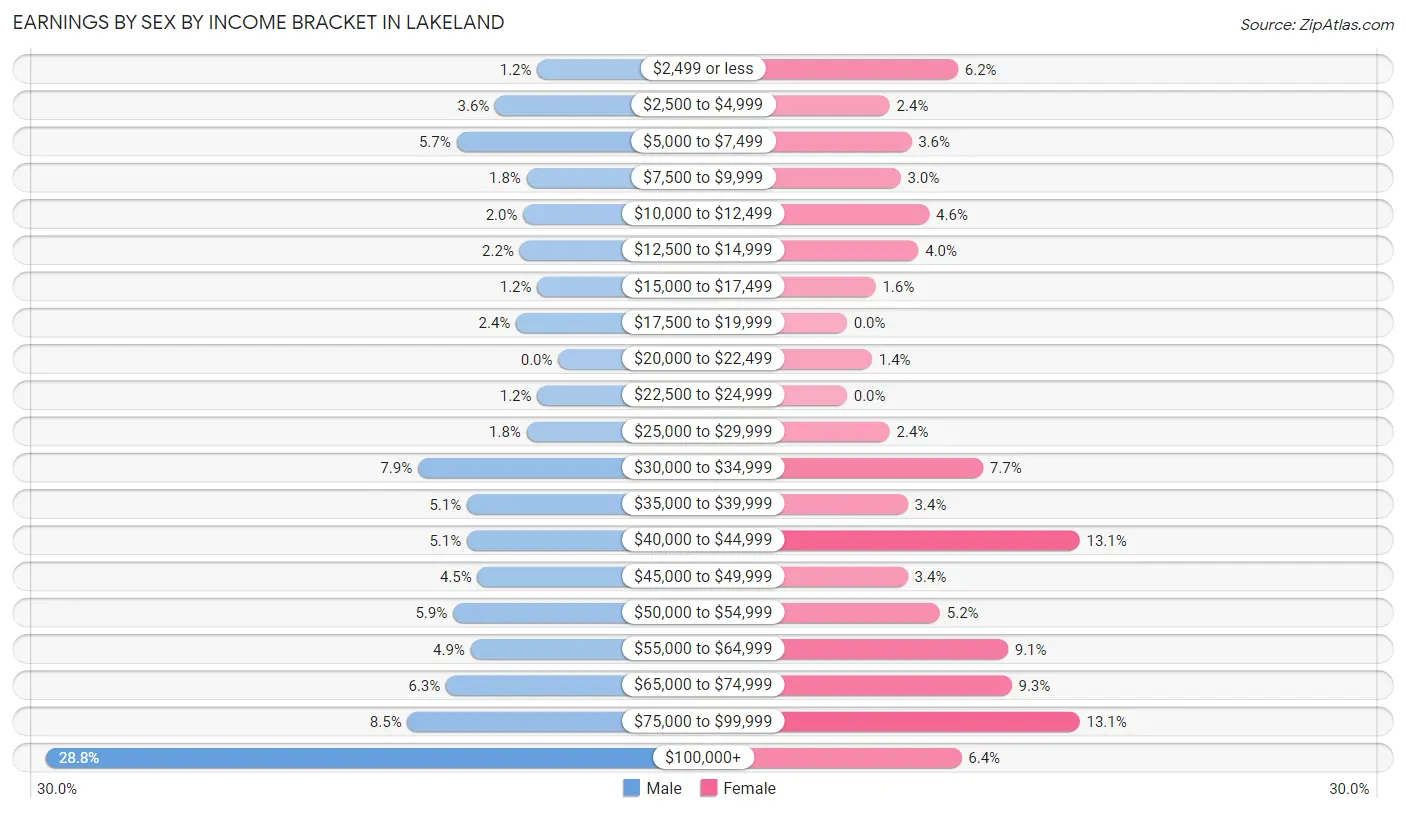
| Income | Male | Female |
| $2,499 or less | 6 (1.2%) | 31 (6.2%) |
| $2,500 to $4,999 | 18 (3.5%) | 12 (2.4%) |
| $5,000 to $7,499 | 29 (5.7%) | 18 (3.6%) |
| $7,500 to $9,999 | 9 (1.8%) | 15 (3.0%) |
| $10,000 to $12,499 | 10 (2.0%) | 23 (4.6%) |
| $12,500 to $14,999 | 11 (2.2%) | 20 (4.0%) |
| $15,000 to $17,499 | 6 (1.2%) | 8 (1.6%) |
| $17,500 to $19,999 | 12 (2.4%) | 0 (0.0%) |
| $20,000 to $22,499 | 0 (0.0%) | 7 (1.4%) |
| $22,500 to $24,999 | 6 (1.2%) | 0 (0.0%) |
| $25,000 to $29,999 | 9 (1.8%) | 12 (2.4%) |
| $30,000 to $34,999 | 40 (7.9%) | 38 (7.6%) |
| $35,000 to $39,999 | 26 (5.1%) | 17 (3.4%) |
| $40,000 to $44,999 | 26 (5.1%) | 65 (13.1%) |
| $45,000 to $49,999 | 23 (4.5%) | 17 (3.4%) |
| $50,000 to $54,999 | 30 (5.9%) | 26 (5.2%) |
| $55,000 to $64,999 | 25 (4.9%) | 45 (9.0%) |
| $65,000 to $74,999 | 32 (6.3%) | 46 (9.3%) |
| $75,000 to $99,999 | 43 (8.5%) | 65 (13.1%) |
| $100,000+ | 146 (28.8%) | 32 (6.4%) |
| Total | 507 (100.0%) | 497 (100.0%) |
Earnings by Sex by Educational Attainment in Lakeland
Average earnings in Lakeland are $66,250 for men and $45,625 for women, a difference of 31.1%. Men with an educational attainment of graduate degree enjoy the highest average annual earnings of $135,625, while those with high school diploma education earn the least with $40,438. Women with an educational attainment of graduate degree earn the most with the average annual earnings of $67,500, while those with college or associate's degree education have the smallest earnings of $40,192.
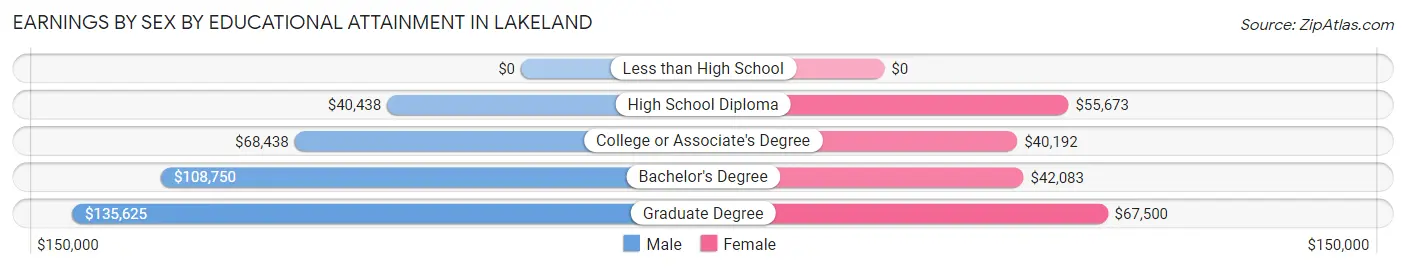
| Educational Attainment | Male Income | Female Income |
| Less than High School | - | - |
| High School Diploma | $40,438 | $55,673 |
| College or Associate's Degree | $68,438 | $40,192 |
| Bachelor's Degree | $108,750 | $42,083 |
| Graduate Degree | $135,625 | $67,500 |
| Total | $66,250 | $45,625 |
Family Income in Lakeland
Family Income Brackets in Lakeland
According to the Lakeland family income data, there are 125 families falling into the $100,000 to $149,999 income range, which is the most common income bracket and makes up 25.2% of all families.
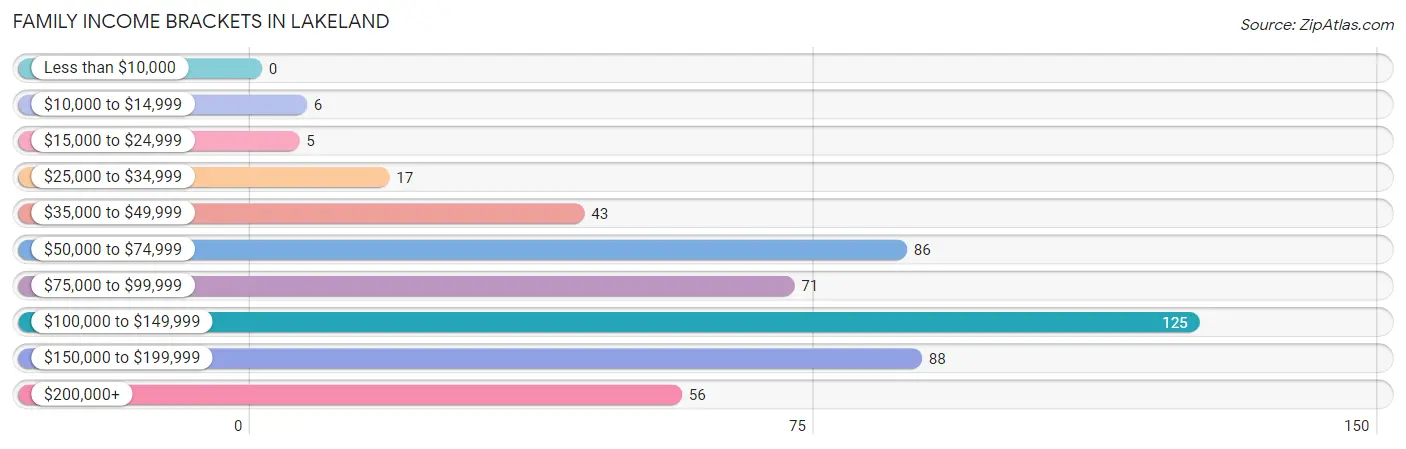
| Income Bracket | # Families | % Families |
| Less than $10,000 | 0 | 0.0% |
| $10,000 to $14,999 | 6 | 1.2% |
| $15,000 to $24,999 | 5 | 1.0% |
| $25,000 to $34,999 | 17 | 3.4% |
| $35,000 to $49,999 | 43 | 8.7% |
| $50,000 to $74,999 | 86 | 17.3% |
| $75,000 to $99,999 | 71 | 14.3% |
| $100,000 to $149,999 | 125 | 25.2% |
| $150,000 to $199,999 | 88 | 17.7% |
| $200,000+ | 56 | 11.3% |
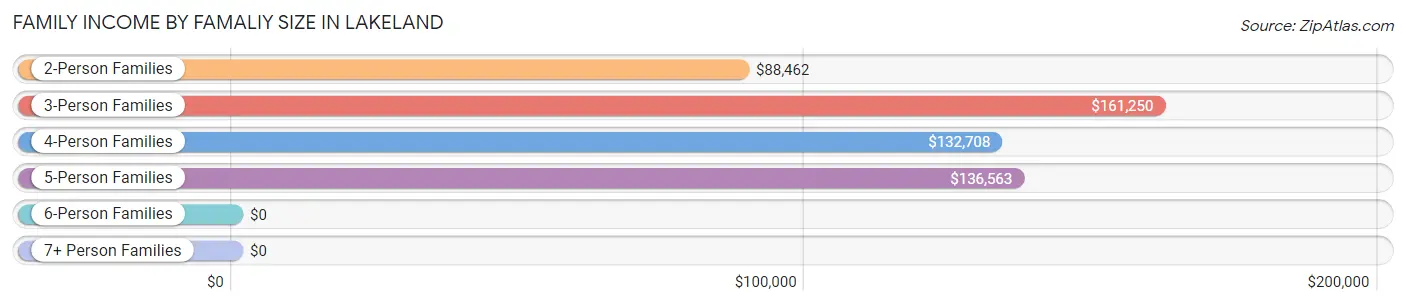
Family Income by Famaliy Size in Lakeland
3-person families (82 | 16.5%) account for the highest median family income in Lakeland with $161,250 per family, while 3-person families (82 | 16.5%) have the highest median income of $53,750 per family member.
| Income Bracket | # Families | Median Income |
| 2-Person Families | 332 (66.8%) | $88,462 |
| 3-Person Families | 82 (16.5%) | $161,250 |
| 4-Person Families | 63 (12.7%) | $132,708 |
| 5-Person Families | 17 (3.4%) | $136,563 |
| 6-Person Families | 0 (0.0%) | $0 |
| 7+ Person Families | 3 (0.6%) | $0 |
| Total | 497 (100.0%) | $106,563 |
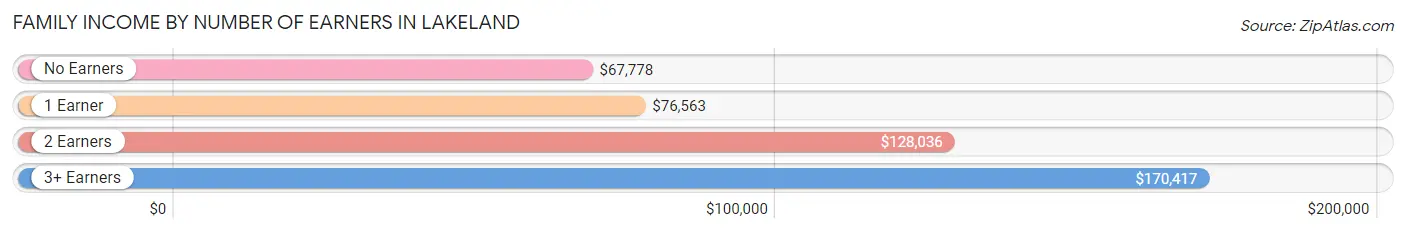
Family Income by Number of Earners in Lakeland
The median family income in Lakeland is $106,563, with families comprising 3+ earners (37) having the highest median family income of $170,417, while families with no earners (106) have the lowest median family income of $67,778, accounting for 7.4% and 21.3% of families, respectively.
| Number of Earners | # Families | Median Income |
| No Earners | 106 (21.3%) | $67,778 |
| 1 Earner | 123 (24.7%) | $76,563 |
| 2 Earners | 231 (46.5%) | $128,036 |
| 3+ Earners | 37 (7.4%) | $170,417 |
| Total | 497 (100.0%) | $106,563 |
Household Income in Lakeland
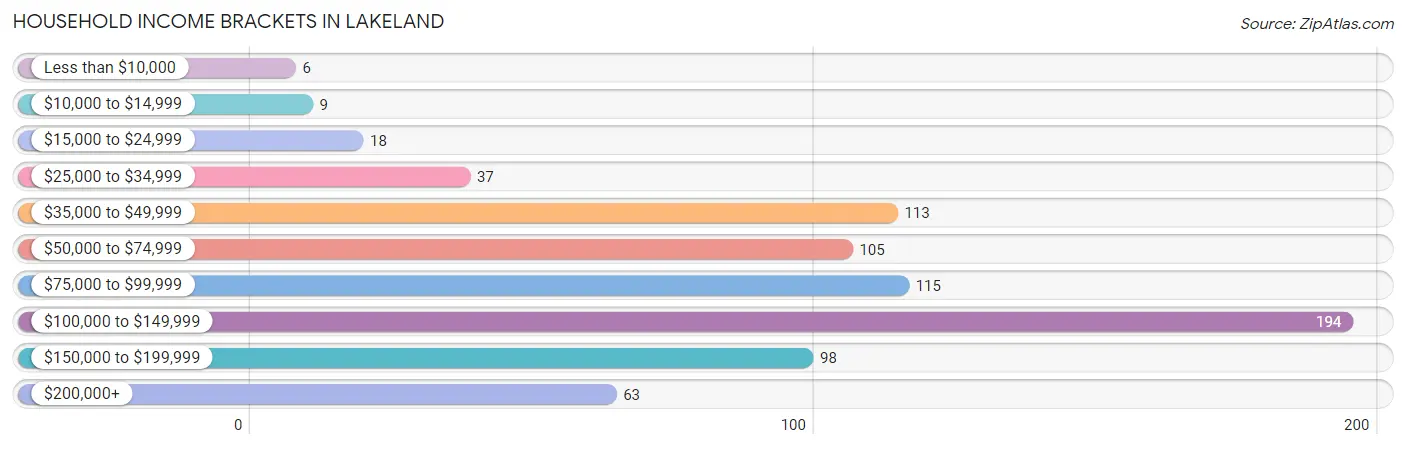
Household Income Brackets in Lakeland
With 194 households falling in the category, the $100,000 to $149,999 income range is the most frequent in Lakeland, accounting for 25.6% of all households. In contrast, only 6 households (0.8%) fall into the less than $10,000 income bracket, making it the least populous group.
| Income Bracket | # Households | % Households |
| Less than $10,000 | 6 | 0.8% |
| $10,000 to $14,999 | 9 | 1.2% |
| $15,000 to $24,999 | 18 | 2.4% |
| $25,000 to $34,999 | 37 | 4.9% |
| $35,000 to $49,999 | 113 | 14.9% |
| $50,000 to $74,999 | 105 | 13.9% |
| $75,000 to $99,999 | 115 | 15.2% |
| $100,000 to $149,999 | 194 | 25.6% |
| $150,000 to $199,999 | 98 | 12.9% |
| $200,000+ | 63 | 8.3% |
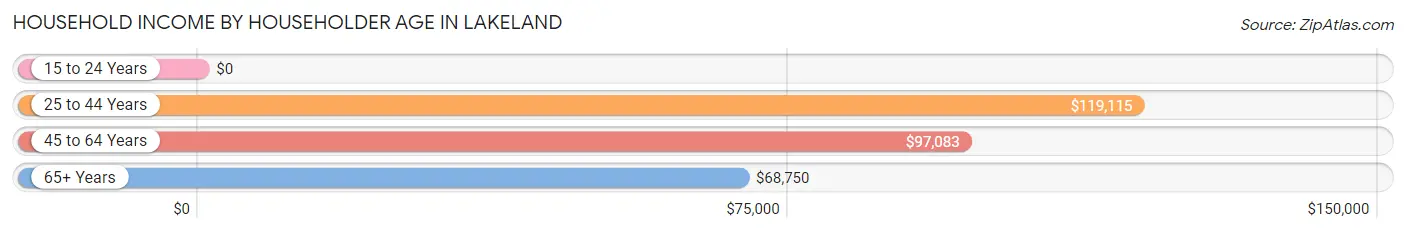
Household Income by Householder Age in Lakeland
The median household income in Lakeland is $96,176, with the highest median household income of $119,115 found in the 25 to 44 years age bracket for the primary householder. A total of 147 households (19.4%) fall into this category. Meanwhile, the 15 to 24 years age bracket for the primary householder has the lowest median household income of $0, with 38 households (5.0%) in this group.
| Income Bracket | # Households | Median Income |
| 15 to 24 Years | 38 (5.0%) | $0 |
| 25 to 44 Years | 147 (19.4%) | $119,115 |
| 45 to 64 Years | 329 (43.4%) | $97,083 |
| 65+ Years | 244 (32.2%) | $68,750 |
| Total | 758 (100.0%) | $96,176 |
Poverty in Lakeland
Income Below Poverty by Sex and Age in Lakeland
With 3.6% poverty level for males and 2.6% for females among the residents of Lakeland, 18 to 24 year old males and 18 to 24 year old females are the most vulnerable to poverty, with 10 males (12.8%) and 5 females (9.8%) in their respective age groups living below the poverty level.
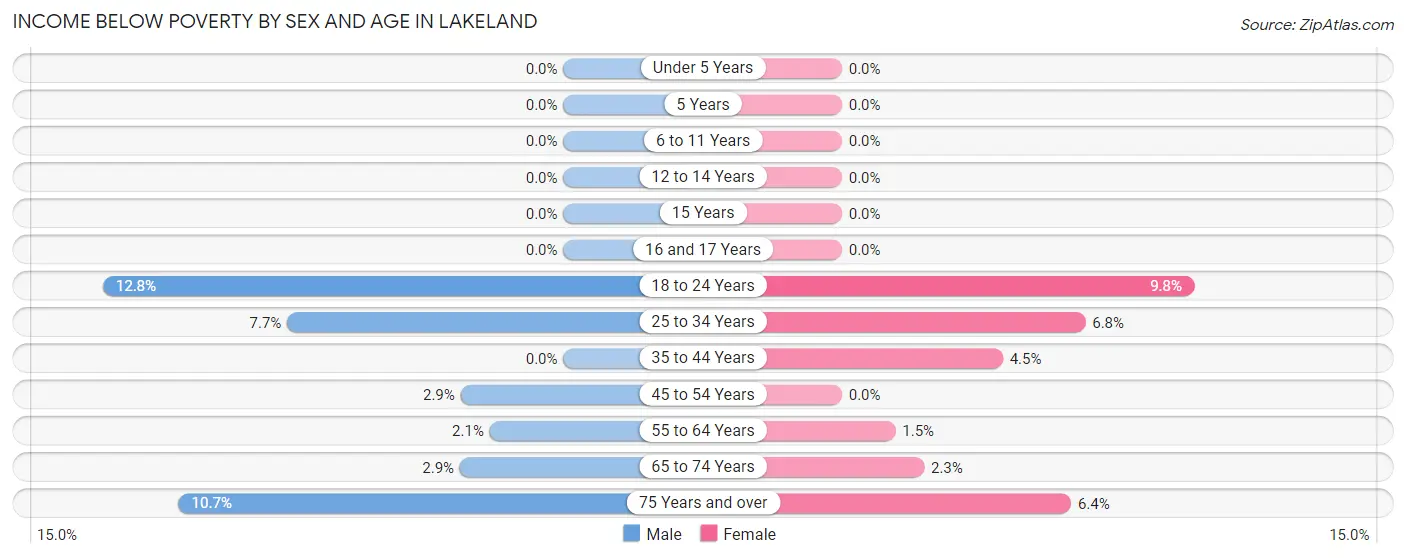
| Age Bracket | Male | Female |
| Under 5 Years | 0 (0.0%) | 0 (0.0%) |
| 5 Years | 0 (0.0%) | 0 (0.0%) |
| 6 to 11 Years | 0 (0.0%) | 0 (0.0%) |
| 12 to 14 Years | 0 (0.0%) | 0 (0.0%) |
| 15 Years | 0 (0.0%) | 0 (0.0%) |
| 16 and 17 Years | 0 (0.0%) | 0 (0.0%) |
| 18 to 24 Years | 10 (12.8%) | 5 (9.8%) |
| 25 to 34 Years | 4 (7.7%) | 4 (6.8%) |
| 35 to 44 Years | 0 (0.0%) | 3 (4.5%) |
| 45 to 54 Years | 3 (2.9%) | 0 (0.0%) |
| 55 to 64 Years | 3 (2.1%) | 3 (1.5%) |
| 65 to 74 Years | 4 (2.9%) | 3 (2.3%) |
| 75 Years and over | 6 (10.7%) | 3 (6.4%) |
| Total | 30 (3.6%) | 21 (2.6%) |
Income Above Poverty by Sex and Age in Lakeland
According to the poverty statistics in Lakeland, males aged under 5 years and females aged under 5 years are the age groups that are most secure financially, with 100.0% of males and 100.0% of females in these age groups living above the poverty line.
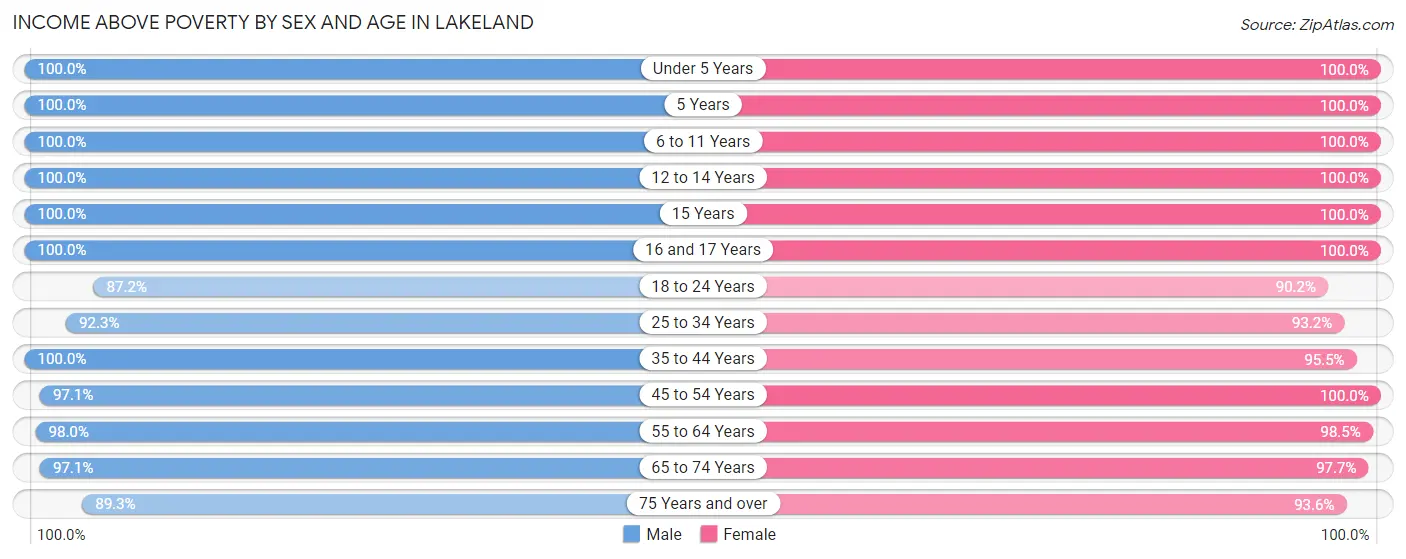
| Age Bracket | Male | Female |
| Under 5 Years | 27 (100.0%) | 31 (100.0%) |
| 5 Years | 13 (100.0%) | 3 (100.0%) |
| 6 to 11 Years | 62 (100.0%) | 36 (100.0%) |
| 12 to 14 Years | 7 (100.0%) | 30 (100.0%) |
| 15 Years | 5 (100.0%) | 13 (100.0%) |
| 16 and 17 Years | 18 (100.0%) | 12 (100.0%) |
| 18 to 24 Years | 68 (87.2%) | 46 (90.2%) |
| 25 to 34 Years | 48 (92.3%) | 55 (93.2%) |
| 35 to 44 Years | 117 (100.0%) | 64 (95.5%) |
| 45 to 54 Years | 102 (97.1%) | 123 (100.0%) |
| 55 to 64 Years | 143 (98.0%) | 199 (98.5%) |
| 65 to 74 Years | 135 (97.1%) | 128 (97.7%) |
| 75 Years and over | 50 (89.3%) | 44 (93.6%) |
| Total | 795 (96.4%) | 784 (97.4%) |
Income Below Poverty Among Married-Couple Families in Lakeland
The poverty statistics for married-couple families in Lakeland show that 0.8% or 3 of the total 391 families live below the poverty line. Families with no children have the highest poverty rate of 1.0%, comprising of 3 families. On the other hand, families with 1 or 2 children have the lowest poverty rate of 0.0%, which includes 0 families.
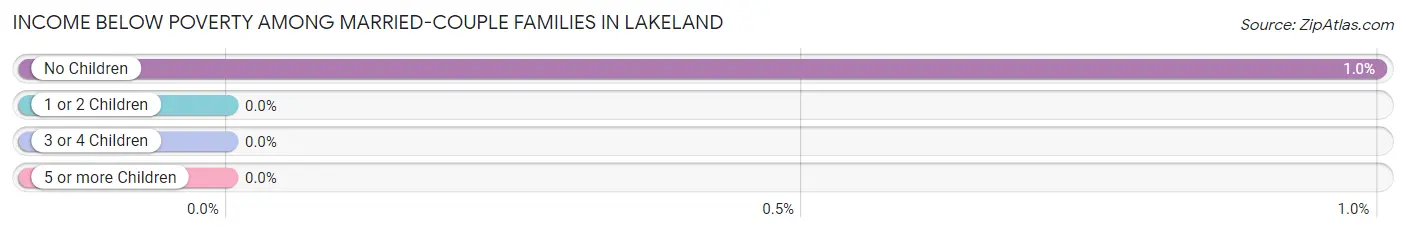
| Children | Above Poverty | Below Poverty |
| No Children | 297 (99.0%) | 3 (1.0%) |
| 1 or 2 Children | 80 (100.0%) | 0 (0.0%) |
| 3 or 4 Children | 11 (100.0%) | 0 (0.0%) |
| 5 or more Children | 0 (0.0%) | 0 (0.0%) |
| Total | 388 (99.2%) | 3 (0.8%) |
Income Below Poverty Among Single-Parent Households in Lakeland
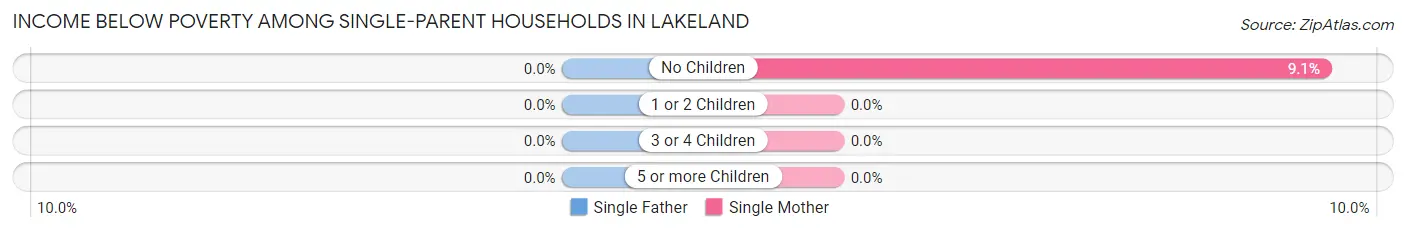
| Children | Single Father | Single Mother |
| No Children | 0 (0.0%) | 3 (9.1%) |
| 1 or 2 Children | 0 (0.0%) | 0 (0.0%) |
| 3 or 4 Children | 0 (0.0%) | 0 (0.0%) |
| 5 or more Children | 0 (0.0%) | 0 (0.0%) |
| Total | 0 (0.0%) | 3 (4.5%) |
Income Below Poverty Among Married-Couple vs Single-Parent Households in Lakeland
The poverty data for Lakeland shows that 3 of the married-couple family households (0.8%) and 3 of the single-parent households (2.8%) are living below the poverty level. Within the married-couple family households, those with no children have the highest poverty rate, with 3 households (1.0%) falling below the poverty line. Among the single-parent households, those with no children have the highest poverty rate, with 3 household (5.8%) living below poverty.
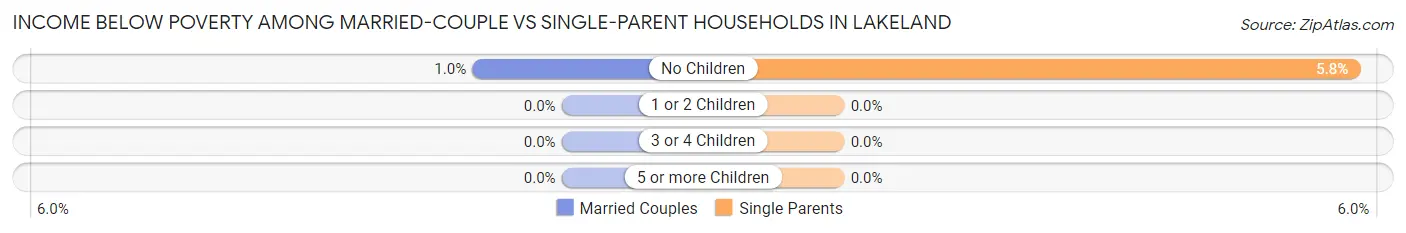
| Children | Married-Couple Families | Single-Parent Households |
| No Children | 3 (1.0%) | 3 (5.8%) |
| 1 or 2 Children | 0 (0.0%) | 0 (0.0%) |
| 3 or 4 Children | 0 (0.0%) | 0 (0.0%) |
| 5 or more Children | 0 (0.0%) | 0 (0.0%) |
| Total | 3 (0.8%) | 3 (2.8%) |
Employment Characteristics in Lakeland
Employment by Class of Employer in Lakeland
Among the 901 employed individuals in Lakeland, private company employees (530 | 58.8%), local government employees (87 | 9.7%), and not-for-profit organizations (75 | 8.3%) make up the most common classes of employment.
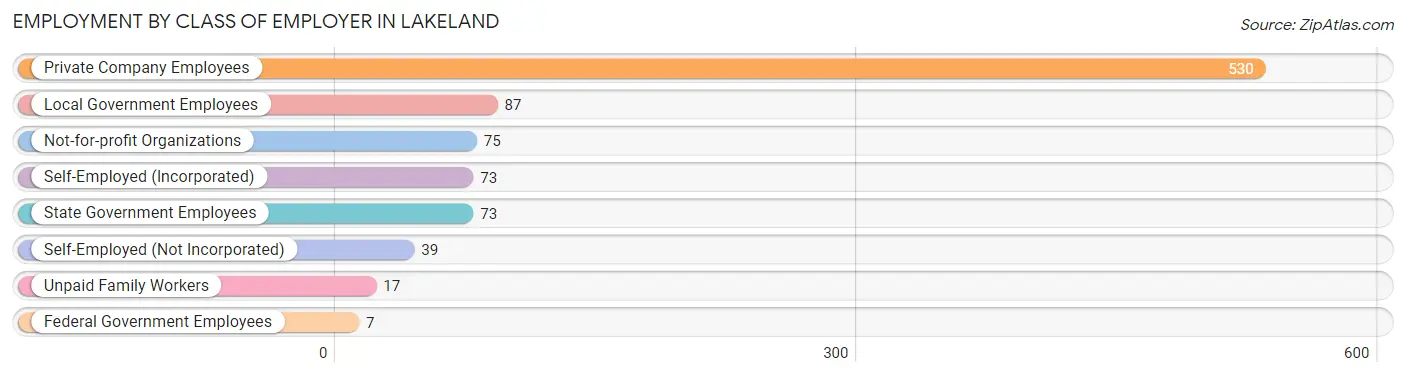
| Employer Class | # Employees | % Employees |
| Private Company Employees | 530 | 58.8% |
| Self-Employed (Incorporated) | 73 | 8.1% |
| Self-Employed (Not Incorporated) | 39 | 4.3% |
| Not-for-profit Organizations | 75 | 8.3% |
| Local Government Employees | 87 | 9.7% |
| State Government Employees | 73 | 8.1% |
| Federal Government Employees | 7 | 0.8% |
| Unpaid Family Workers | 17 | 1.9% |
| Total | 901 | 100.0% |
Employment Status by Age in Lakeland
According to the labor force statistics for Lakeland, out of the total population over 16 years of age (1,403), 68.4% or 960 individuals are in the labor force, with 4.8% or 46 of them unemployed. The age group with the highest labor force participation rate is 30 to 34 years, with 100.0% or 61 individuals in the labor force. Within the labor force, the 35 to 44 years age range has the highest percentage of unemployed individuals, with 15.9% or 26 of them being unemployed.
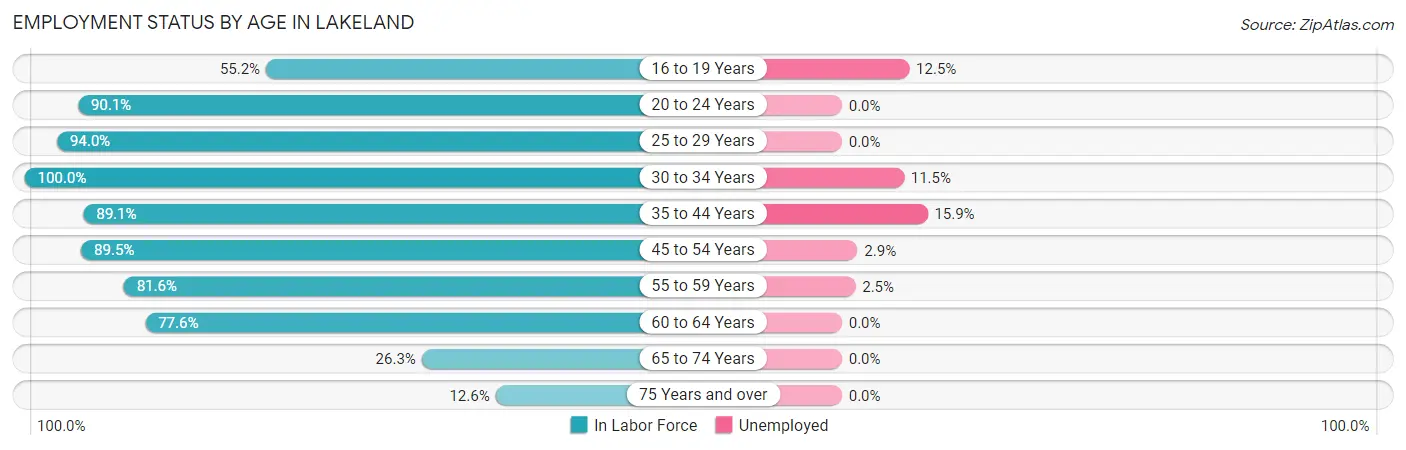
| Age Bracket | In Labor Force | Unemployed |
| 16 to 19 Years | 32 (55.2%) | 4 (12.5%) |
| 20 to 24 Years | 91 (90.1%) | 0 (0.0%) |
| 25 to 29 Years | 47 (94.0%) | 0 (0.0%) |
| 30 to 34 Years | 61 (100.0%) | 7 (11.5%) |
| 35 to 44 Years | 164 (89.1%) | 26 (15.9%) |
| 45 to 54 Years | 204 (89.5%) | 6 (2.9%) |
| 55 to 59 Years | 120 (81.6%) | 3 (2.5%) |
| 60 to 64 Years | 156 (77.6%) | 0 (0.0%) |
| 65 to 74 Years | 71 (26.3%) | 0 (0.0%) |
| 75 Years and over | 13 (12.6%) | 0 (0.0%) |
| Total | 960 (68.4%) | 46 (4.8%) |
Employment Status by Educational Attainment in Lakeland
According to labor force statistics for Lakeland, 86.3% of individuals (752) out of the total population between 25 and 64 years of age (871) are in the labor force, with 5.6% or 42 of them being unemployed. The group with the highest labor force participation rate are those with the educational attainment of college / associate degree, with 91.8% or 256 individuals in the labor force. Within the labor force, individuals with less than high school education have the highest percentage of unemployment, with 100.0% or 12 of them being unemployed.
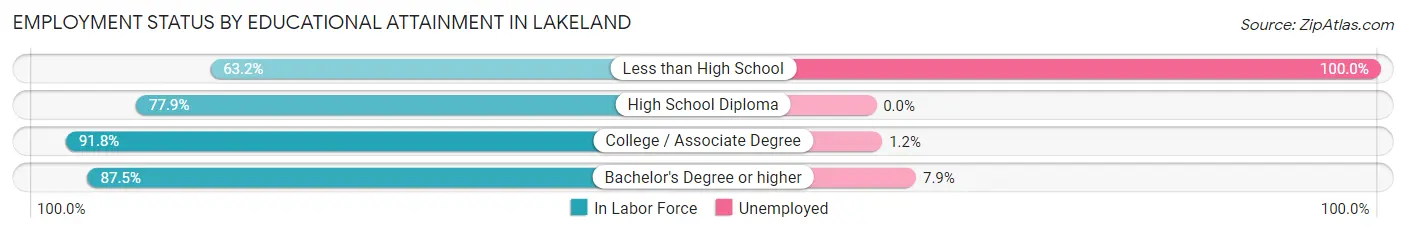
| Educational Attainment | In Labor Force | Unemployed |
| Less than High School | 12 (63.2%) | 19 (100.0%) |
| High School Diploma | 141 (77.9%) | 0 (0.0%) |
| College / Associate Degree | 256 (91.8%) | 3 (1.2%) |
| Bachelor's Degree or higher | 343 (87.5%) | 31 (7.9%) |
| Total | 752 (86.3%) | 49 (5.6%) |
Employment Occupations by Sex in Lakeland
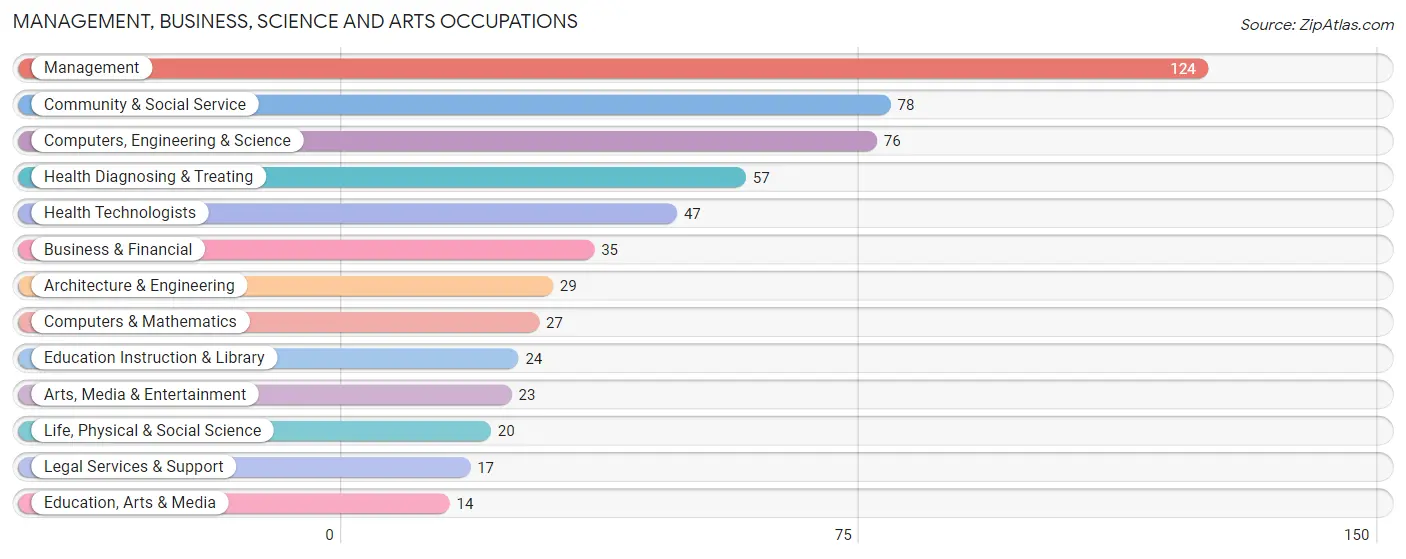
Management, Business, Science and Arts Occupations
The most common Management, Business, Science and Arts occupations in Lakeland are Management (124 | 13.6%), Community & Social Service (78 | 8.5%), Computers, Engineering & Science (76 | 8.3%), Health Diagnosing & Treating (57 | 6.2%), and Health Technologists (47 | 5.1%).
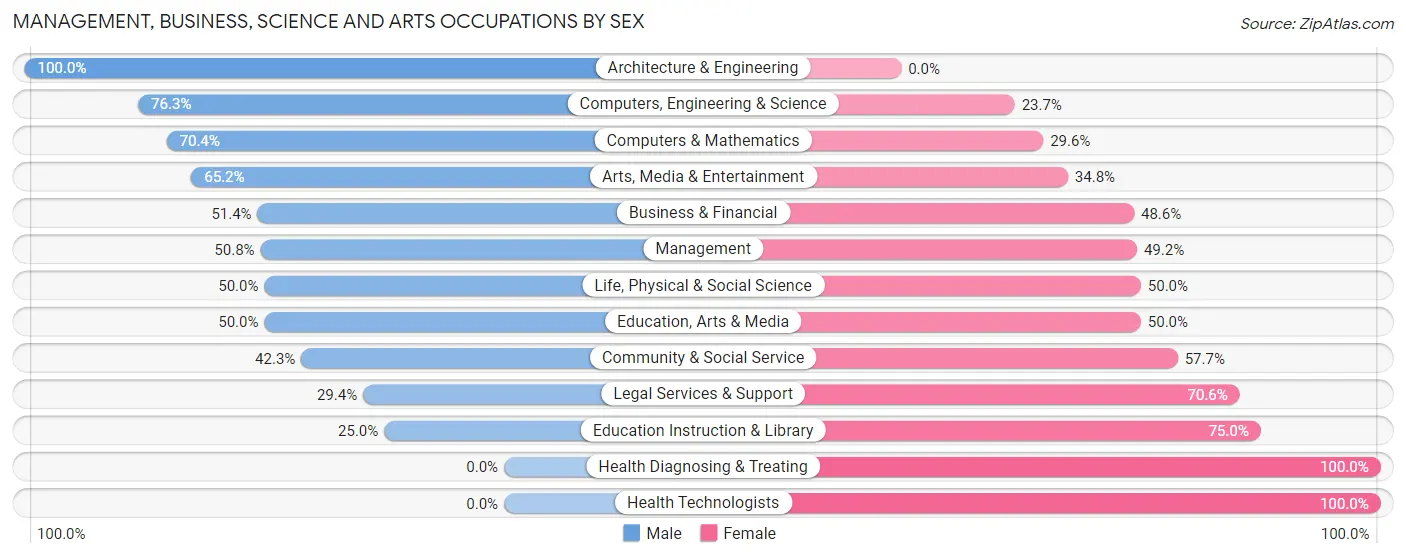
Management, Business, Science and Arts Occupations by Sex
Within the Management, Business, Science and Arts occupations in Lakeland, the most male-oriented occupations are Architecture & Engineering (100.0%), Computers, Engineering & Science (76.3%), and Computers & Mathematics (70.4%), while the most female-oriented occupations are Health Diagnosing & Treating (100.0%), Health Technologists (100.0%), and Education Instruction & Library (75.0%).
| Occupation | Male | Female |
| Management | 63 (50.8%) | 61 (49.2%) |
| Business & Financial | 18 (51.4%) | 17 (48.6%) |
| Computers, Engineering & Science | 58 (76.3%) | 18 (23.7%) |
| Computers & Mathematics | 19 (70.4%) | 8 (29.6%) |
| Architecture & Engineering | 29 (100.0%) | 0 (0.0%) |
| Life, Physical & Social Science | 10 (50.0%) | 10 (50.0%) |
| Community & Social Service | 33 (42.3%) | 45 (57.7%) |
| Education, Arts & Media | 7 (50.0%) | 7 (50.0%) |
| Legal Services & Support | 5 (29.4%) | 12 (70.6%) |
| Education Instruction & Library | 6 (25.0%) | 18 (75.0%) |
| Arts, Media & Entertainment | 15 (65.2%) | 8 (34.8%) |
| Health Diagnosing & Treating | 0 (0.0%) | 57 (100.0%) |
| Health Technologists | 0 (0.0%) | 47 (100.0%) |
| Total (Category) | 172 (46.5%) | 198 (53.5%) |
| Total (Overall) | 439 (48.1%) | 474 (51.9%) |
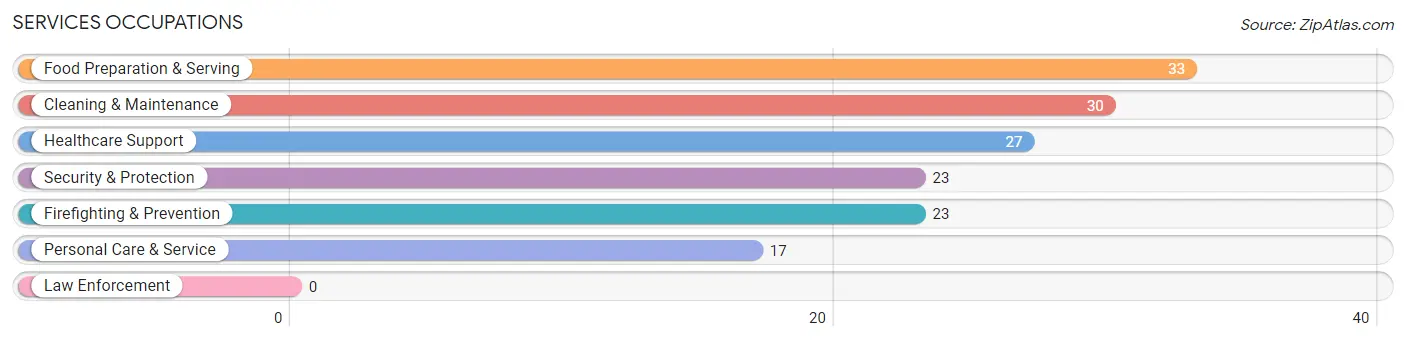
Services Occupations
The most common Services occupations in Lakeland are Food Preparation & Serving (33 | 3.6%), Cleaning & Maintenance (30 | 3.3%), Healthcare Support (27 | 3.0%), Security & Protection (23 | 2.5%), and Firefighting & Prevention (23 | 2.5%).
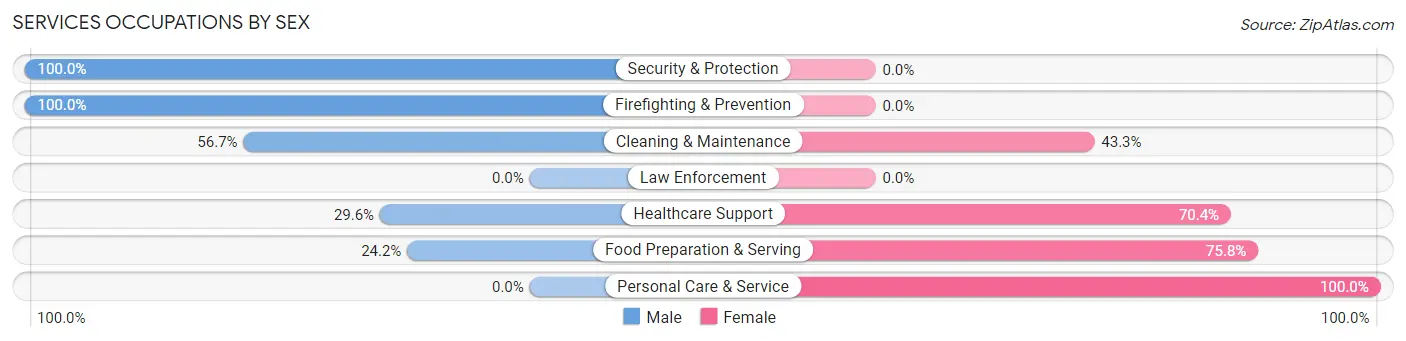
Services Occupations by Sex
Within the Services occupations in Lakeland, the most male-oriented occupations are Security & Protection (100.0%), Firefighting & Prevention (100.0%), and Cleaning & Maintenance (56.7%), while the most female-oriented occupations are Personal Care & Service (100.0%), Food Preparation & Serving (75.8%), and Healthcare Support (70.4%).
| Occupation | Male | Female |
| Healthcare Support | 8 (29.6%) | 19 (70.4%) |
| Security & Protection | 23 (100.0%) | 0 (0.0%) |
| Firefighting & Prevention | 23 (100.0%) | 0 (0.0%) |
| Law Enforcement | 0 (0.0%) | 0 (0.0%) |
| Food Preparation & Serving | 8 (24.2%) | 25 (75.8%) |
| Cleaning & Maintenance | 17 (56.7%) | 13 (43.3%) |
| Personal Care & Service | 0 (0.0%) | 17 (100.0%) |
| Total (Category) | 56 (43.1%) | 74 (56.9%) |
| Total (Overall) | 439 (48.1%) | 474 (51.9%) |
Sales and Office Occupations
The most common Sales and Office occupations in Lakeland are Office & Administration (195 | 21.4%), and Sales & Related (63 | 6.9%).
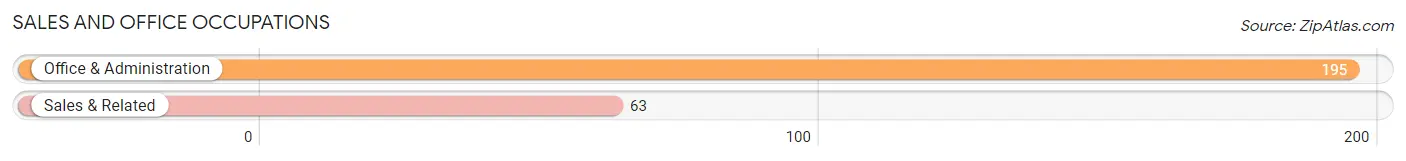
Sales and Office Occupations by Sex

| Occupation | Male | Female |
| Sales & Related | 58 (92.1%) | 5 (7.9%) |
| Office & Administration | 33 (16.9%) | 162 (83.1%) |
| Total (Category) | 91 (35.3%) | 167 (64.7%) |
| Total (Overall) | 439 (48.1%) | 474 (51.9%) |
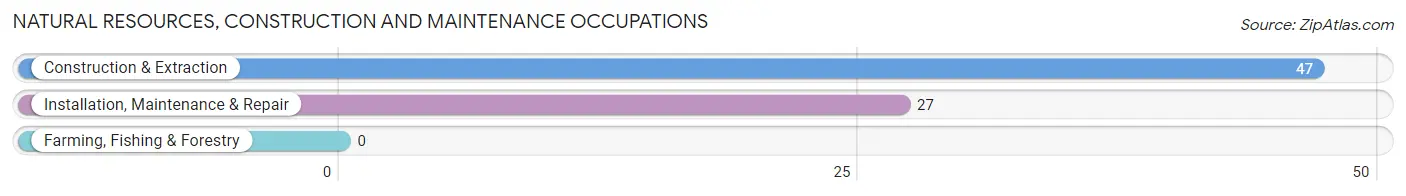
Natural Resources, Construction and Maintenance Occupations
The most common Natural Resources, Construction and Maintenance occupations in Lakeland are Construction & Extraction (47 | 5.1%), and Installation, Maintenance & Repair (27 | 3.0%).
Natural Resources, Construction and Maintenance Occupations by Sex
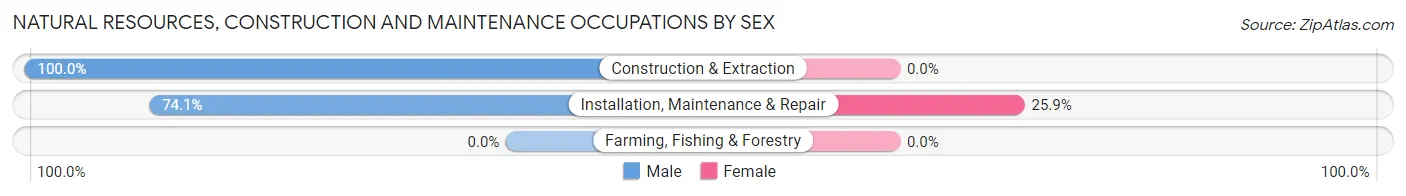
| Occupation | Male | Female |
| Farming, Fishing & Forestry | 0 (0.0%) | 0 (0.0%) |
| Construction & Extraction | 47 (100.0%) | 0 (0.0%) |
| Installation, Maintenance & Repair | 20 (74.1%) | 7 (25.9%) |
| Total (Category) | 67 (90.5%) | 7 (9.5%) |
| Total (Overall) | 439 (48.1%) | 474 (51.9%) |
Production, Transportation and Moving Occupations
The most common Production, Transportation and Moving occupations in Lakeland are Production (43 | 4.7%), Transportation (22 | 2.4%), and Material Moving (16 | 1.8%).
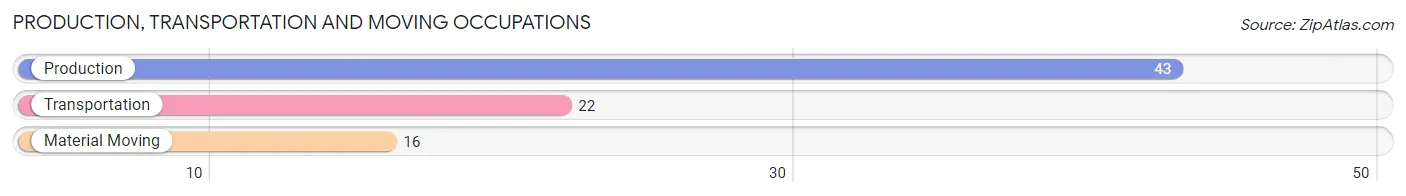
Production, Transportation and Moving Occupations by Sex
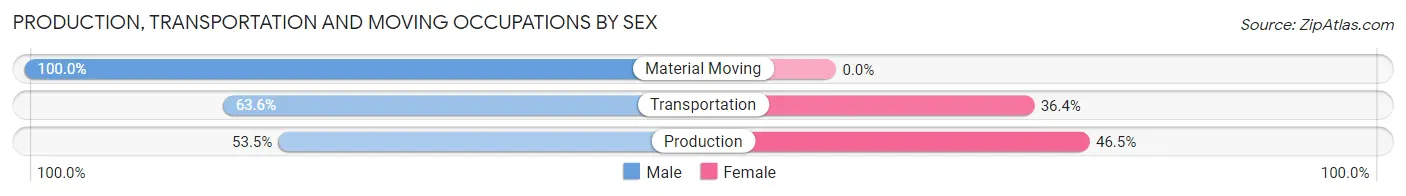
| Occupation | Male | Female |
| Production | 23 (53.5%) | 20 (46.5%) |
| Transportation | 14 (63.6%) | 8 (36.4%) |
| Material Moving | 16 (100.0%) | 0 (0.0%) |
| Total (Category) | 53 (65.4%) | 28 (34.6%) |
| Total (Overall) | 439 (48.1%) | 474 (51.9%) |
Employment Industries by Sex in Lakeland
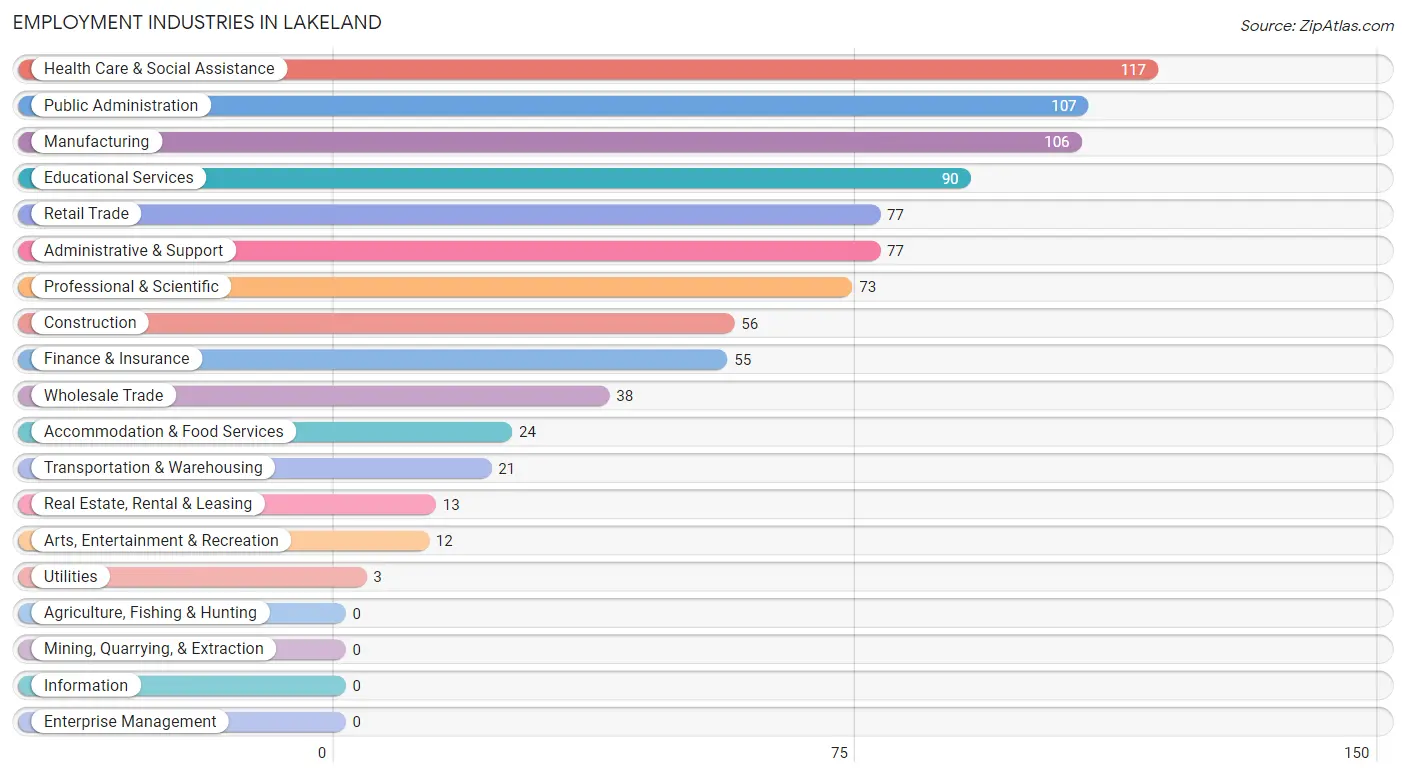
Employment Industries in Lakeland
The major employment industries in Lakeland include Health Care & Social Assistance (117 | 12.8%), Public Administration (107 | 11.7%), Manufacturing (106 | 11.6%), Educational Services (90 | 9.9%), and Retail Trade (77 | 8.4%).
Employment Industries by Sex in Lakeland
The Lakeland industries that see more men than women are Utilities (100.0%), Construction (94.6%), and Transportation & Warehousing (85.7%), whereas the industries that tend to have a higher number of women are Educational Services (82.2%), Health Care & Social Assistance (80.3%), and Accommodation & Food Services (79.2%).
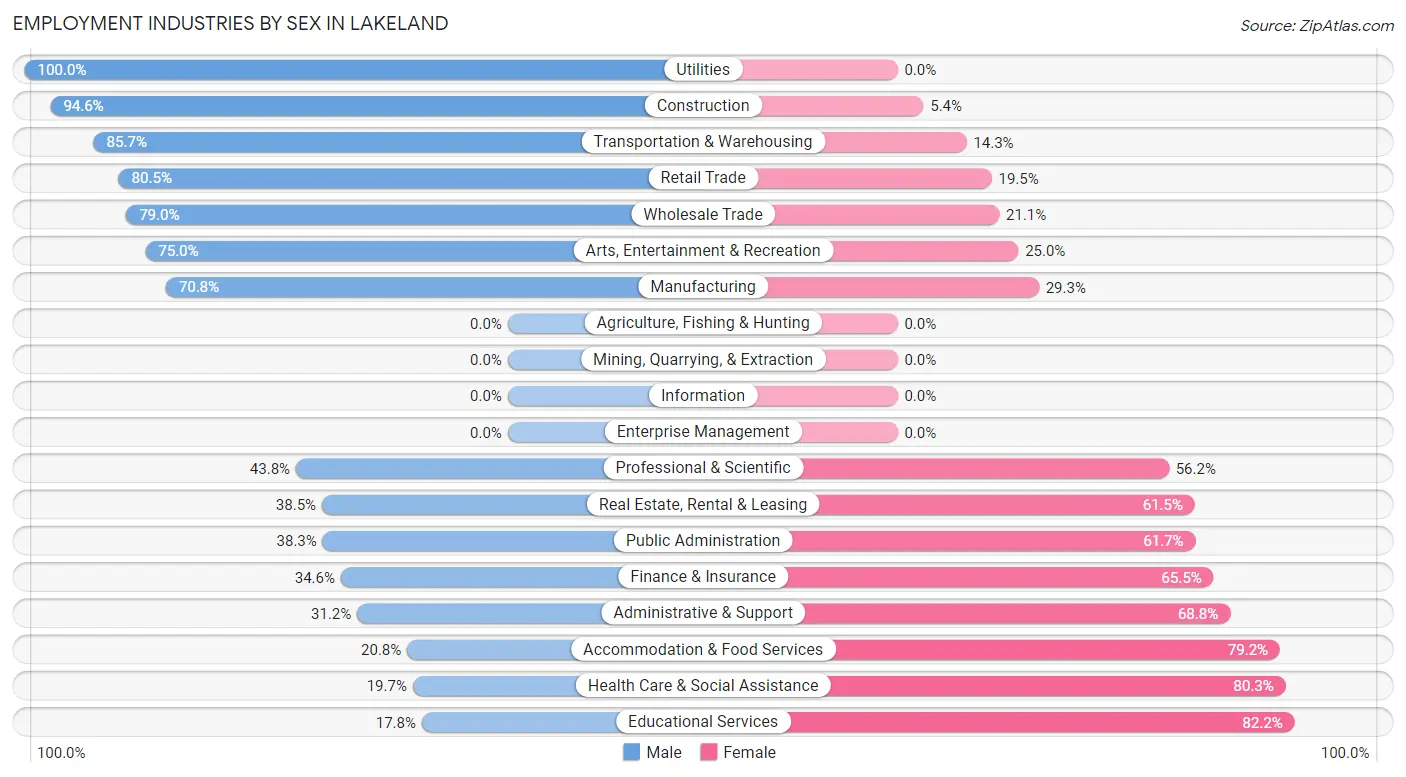
| Industry | Male | Female |
| Agriculture, Fishing & Hunting | 0 (0.0%) | 0 (0.0%) |
| Mining, Quarrying, & Extraction | 0 (0.0%) | 0 (0.0%) |
| Construction | 53 (94.6%) | 3 (5.4%) |
| Manufacturing | 75 (70.8%) | 31 (29.2%) |
| Wholesale Trade | 30 (78.9%) | 8 (21.0%) |
| Retail Trade | 62 (80.5%) | 15 (19.5%) |
| Transportation & Warehousing | 18 (85.7%) | 3 (14.3%) |
| Utilities | 3 (100.0%) | 0 (0.0%) |
| Information | 0 (0.0%) | 0 (0.0%) |
| Finance & Insurance | 19 (34.5%) | 36 (65.4%) |
| Real Estate, Rental & Leasing | 5 (38.5%) | 8 (61.5%) |
| Professional & Scientific | 32 (43.8%) | 41 (56.2%) |
| Enterprise Management | 0 (0.0%) | 0 (0.0%) |
| Administrative & Support | 24 (31.2%) | 53 (68.8%) |
| Educational Services | 16 (17.8%) | 74 (82.2%) |
| Health Care & Social Assistance | 23 (19.7%) | 94 (80.3%) |
| Arts, Entertainment & Recreation | 9 (75.0%) | 3 (25.0%) |
| Accommodation & Food Services | 5 (20.8%) | 19 (79.2%) |
| Public Administration | 41 (38.3%) | 66 (61.7%) |
| Total | 439 (48.1%) | 474 (51.9%) |
Education in Lakeland
School Enrollment in Lakeland
The most common levels of schooling among the 311 students in Lakeland are elementary school (82 | 26.4%), high school (69 | 22.2%), and college / undergraduate (66 | 21.2%).
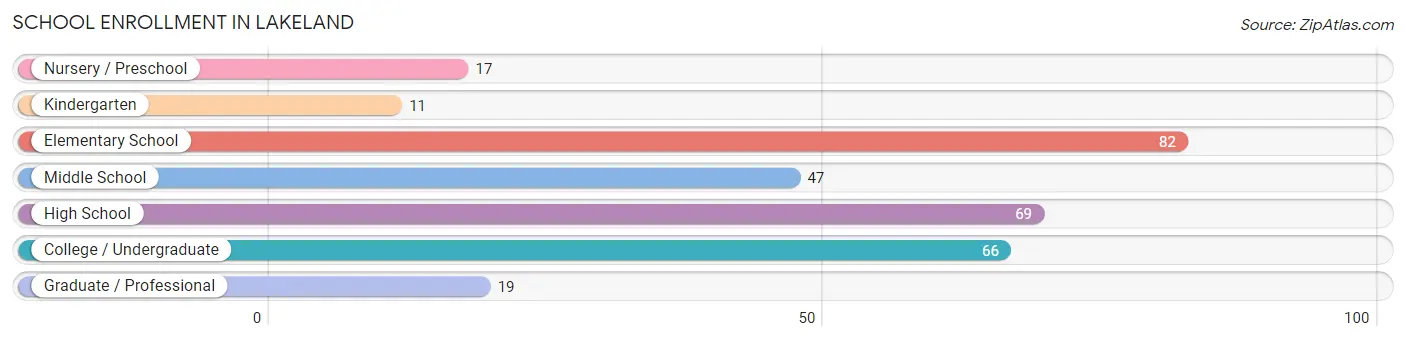
| School Level | # Students | % Students |
| Nursery / Preschool | 17 | 5.5% |
| Kindergarten | 11 | 3.5% |
| Elementary School | 82 | 26.4% |
| Middle School | 47 | 15.1% |
| High School | 69 | 22.2% |
| College / Undergraduate | 66 | 21.2% |
| Graduate / Professional | 19 | 6.1% |
| Total | 311 | 100.0% |
School Enrollment by Age by Funding Source in Lakeland
Out of a total of 311 students who are enrolled in schools in Lakeland, 41 (13.2%) attend a private institution, while the remaining 270 (86.8%) are enrolled in public schools. The age group of 3 to 4 year olds has the highest likelihood of being enrolled in private schools, with 13 (100.0% in the age bracket) enrolled. Conversely, the age group of 5 to 9 year old has the lowest likelihood of being enrolled in a private school, with 75 (100.0% in the age bracket) attending a public institution.
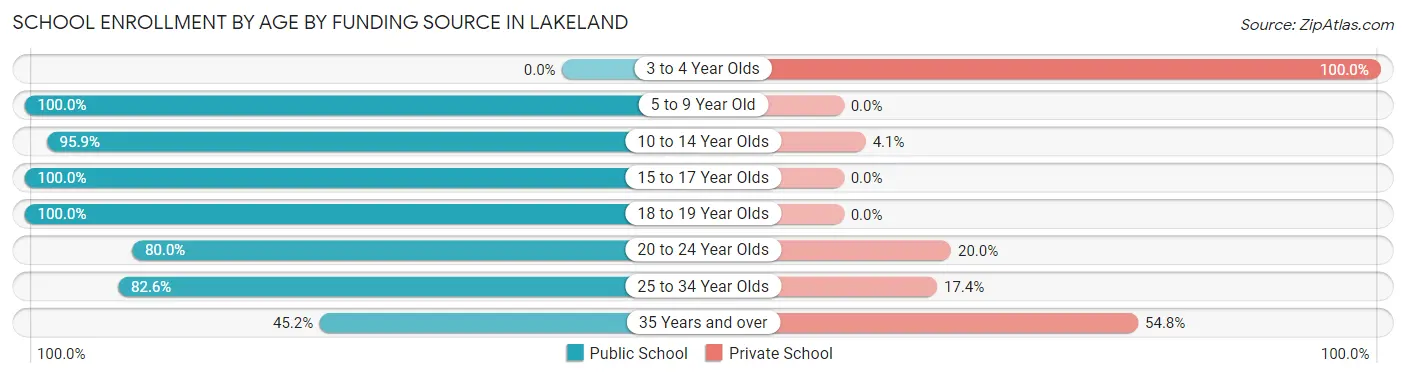
| Age Bracket | Public School | Private School |
| 3 to 4 Year Olds | 0 (0.0%) | 13 (100.0%) |
| 5 to 9 Year Old | 75 (100.0%) | 0 (0.0%) |
| 10 to 14 Year Olds | 70 (95.9%) | 3 (4.1%) |
| 15 to 17 Year Olds | 48 (100.0%) | 0 (0.0%) |
| 18 to 19 Year Olds | 28 (100.0%) | 0 (0.0%) |
| 20 to 24 Year Olds | 16 (80.0%) | 4 (20.0%) |
| 25 to 34 Year Olds | 19 (82.6%) | 4 (17.4%) |
| 35 Years and over | 14 (45.2%) | 17 (54.8%) |
| Total | 270 (86.8%) | 41 (13.2%) |
Educational Attainment by Field of Study in Lakeland
Business (118 | 19.6%), science & technology (72 | 12.0%), education (66 | 11.0%), social sciences (62 | 10.3%), and liberal arts & history (57 | 9.5%) are the most common fields of study among 602 individuals in Lakeland who have obtained a bachelor's degree or higher.
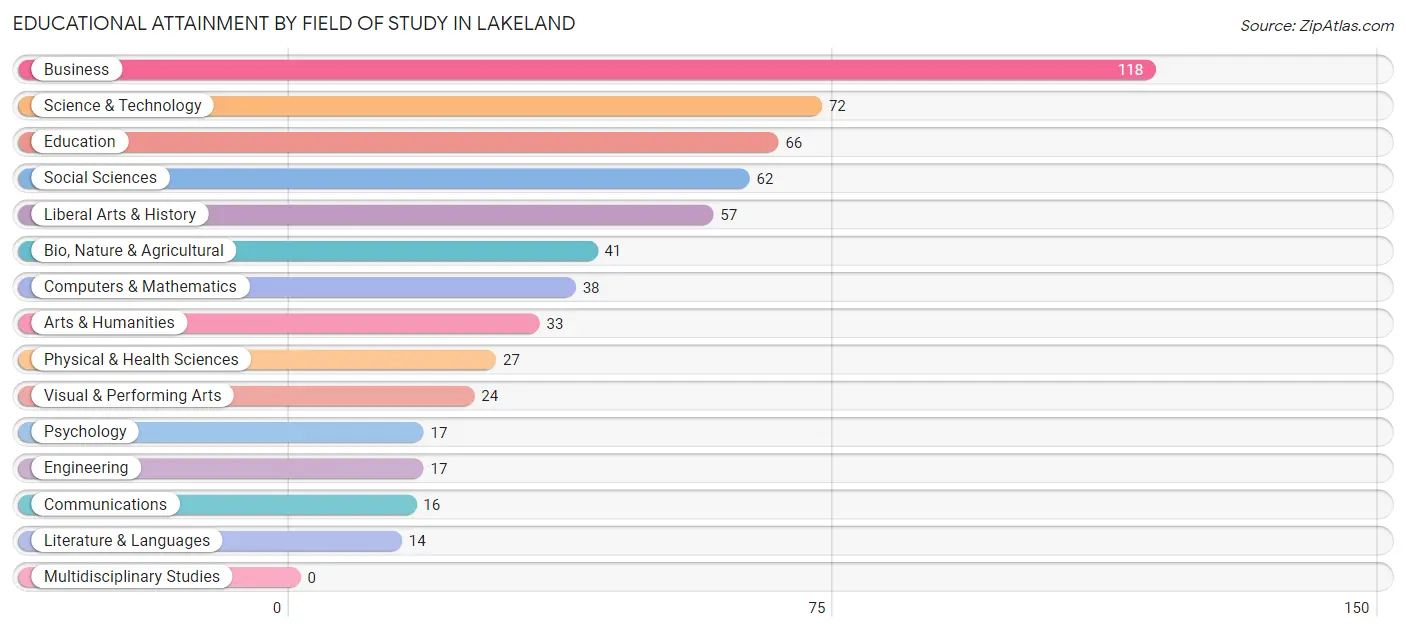
| Field of Study | # Graduates | % Graduates |
| Computers & Mathematics | 38 | 6.3% |
| Bio, Nature & Agricultural | 41 | 6.8% |
| Physical & Health Sciences | 27 | 4.5% |
| Psychology | 17 | 2.8% |
| Social Sciences | 62 | 10.3% |
| Engineering | 17 | 2.8% |
| Multidisciplinary Studies | 0 | 0.0% |
| Science & Technology | 72 | 12.0% |
| Business | 118 | 19.6% |
| Education | 66 | 11.0% |
| Literature & Languages | 14 | 2.3% |
| Liberal Arts & History | 57 | 9.5% |
| Visual & Performing Arts | 24 | 4.0% |
| Communications | 16 | 2.7% |
| Arts & Humanities | 33 | 5.5% |
| Total | 602 | 100.0% |
Transportation & Commute in Lakeland
Vehicle Availability by Sex in Lakeland
The most prevalent vehicle ownership categories in Lakeland are males with 2 vehicles (192, accounting for 43.7%) and females with 2 vehicles (193, making up 41.6%).
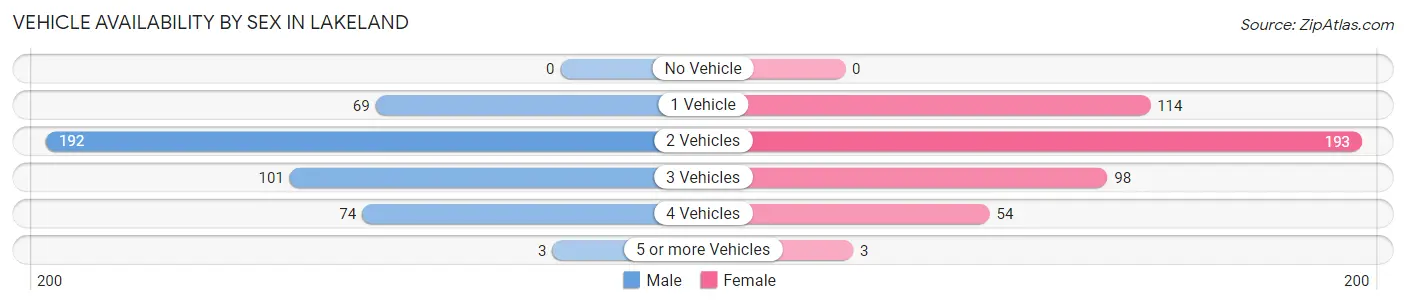
| Vehicles Available | Male | Female |
| No Vehicle | 0 (0.0%) | 0 (0.0%) |
| 1 Vehicle | 69 (15.7%) | 114 (24.7%) |
| 2 Vehicles | 192 (43.7%) | 193 (41.8%) |
| 3 Vehicles | 101 (23.0%) | 98 (21.2%) |
| 4 Vehicles | 74 (16.9%) | 54 (11.7%) |
| 5 or more Vehicles | 3 (0.7%) | 3 (0.6%) |
| Total | 439 (100.0%) | 462 (100.0%) |
Commute Time in Lakeland
The most frequently occuring commute durations in Lakeland are 15 to 19 minutes (165 commuters, 21.9%), 30 to 34 minutes (135 commuters, 17.9%), and 10 to 14 minutes (75 commuters, 10.0%).
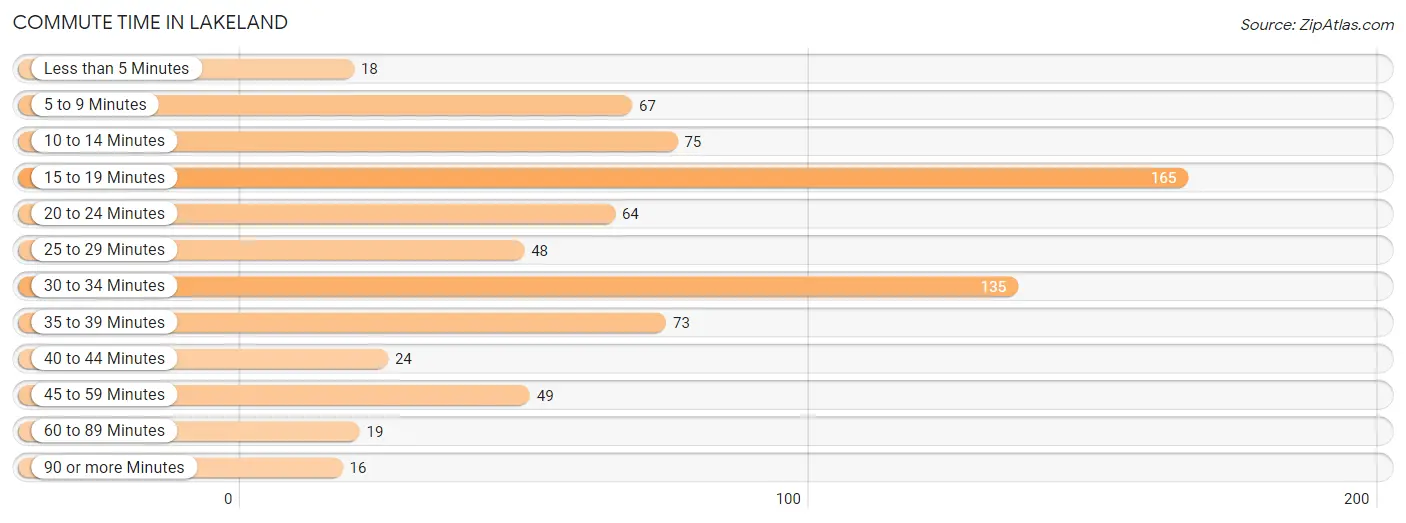
| Commute Time | # Commuters | % Commuters |
| Less than 5 Minutes | 18 | 2.4% |
| 5 to 9 Minutes | 67 | 8.9% |
| 10 to 14 Minutes | 75 | 10.0% |
| 15 to 19 Minutes | 165 | 21.9% |
| 20 to 24 Minutes | 64 | 8.5% |
| 25 to 29 Minutes | 48 | 6.4% |
| 30 to 34 Minutes | 135 | 17.9% |
| 35 to 39 Minutes | 73 | 9.7% |
| 40 to 44 Minutes | 24 | 3.2% |
| 45 to 59 Minutes | 49 | 6.5% |
| 60 to 89 Minutes | 19 | 2.5% |
| 90 or more Minutes | 16 | 2.1% |
Commute Time by Sex in Lakeland
The most common commute times in Lakeland are 30 to 34 minutes (78 commuters, 20.2%) for males and 15 to 19 minutes (104 commuters, 28.3%) for females.
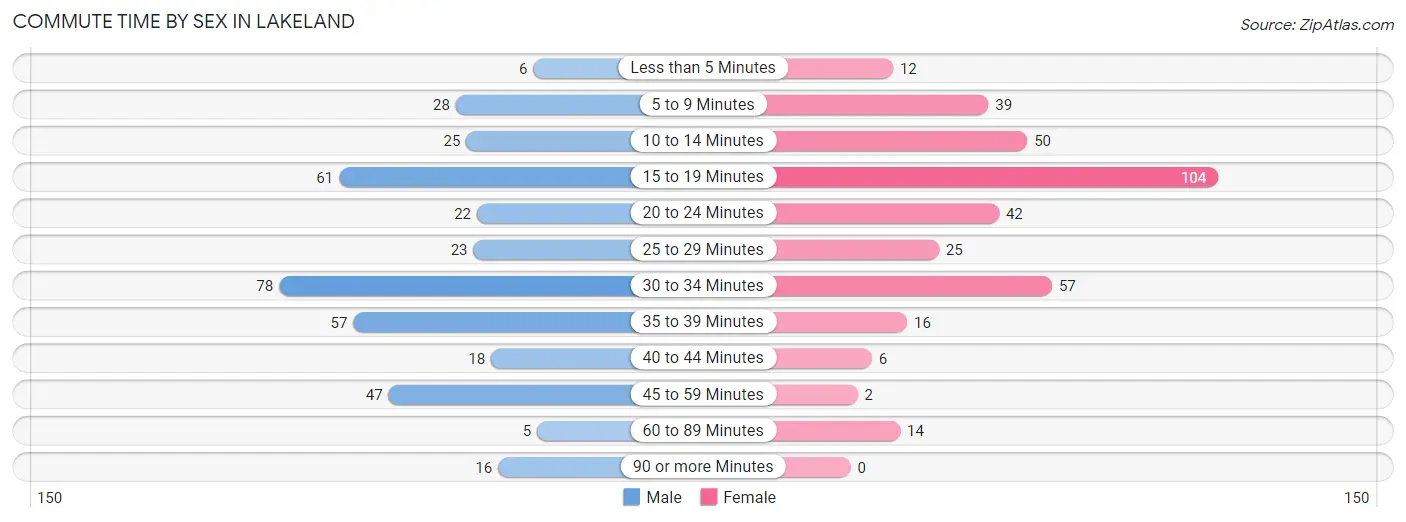
| Commute Time | Male | Female |
| Less than 5 Minutes | 6 (1.5%) | 12 (3.3%) |
| 5 to 9 Minutes | 28 (7.2%) | 39 (10.6%) |
| 10 to 14 Minutes | 25 (6.5%) | 50 (13.6%) |
| 15 to 19 Minutes | 61 (15.8%) | 104 (28.3%) |
| 20 to 24 Minutes | 22 (5.7%) | 42 (11.4%) |
| 25 to 29 Minutes | 23 (6.0%) | 25 (6.8%) |
| 30 to 34 Minutes | 78 (20.2%) | 57 (15.5%) |
| 35 to 39 Minutes | 57 (14.8%) | 16 (4.4%) |
| 40 to 44 Minutes | 18 (4.7%) | 6 (1.6%) |
| 45 to 59 Minutes | 47 (12.2%) | 2 (0.5%) |
| 60 to 89 Minutes | 5 (1.3%) | 14 (3.8%) |
| 90 or more Minutes | 16 (4.2%) | 0 (0.0%) |
Time of Departure to Work by Sex in Lakeland
The most frequent times of departure to work in Lakeland are 8:00 AM to 8:29 AM (55, 14.2%) for males and 10:00 AM to 10:59 AM (59, 16.1%) for females.
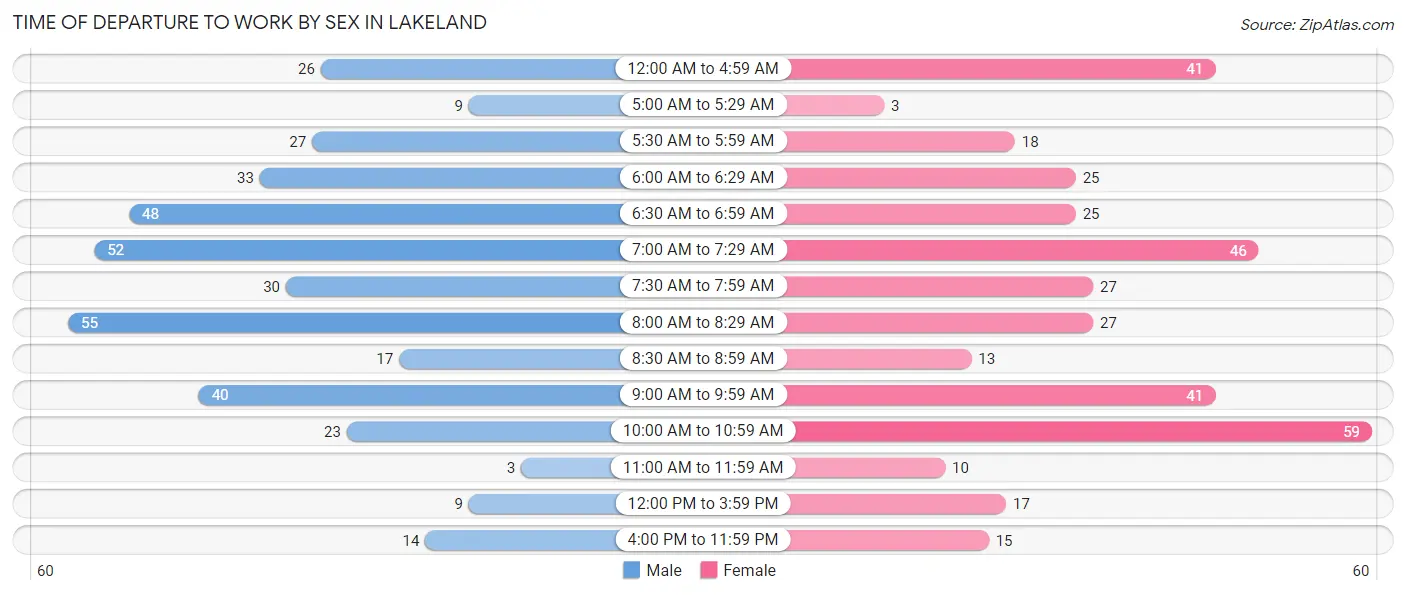
| Time of Departure | Male | Female |
| 12:00 AM to 4:59 AM | 26 (6.7%) | 41 (11.2%) |
| 5:00 AM to 5:29 AM | 9 (2.3%) | 3 (0.8%) |
| 5:30 AM to 5:59 AM | 27 (7.0%) | 18 (4.9%) |
| 6:00 AM to 6:29 AM | 33 (8.6%) | 25 (6.8%) |
| 6:30 AM to 6:59 AM | 48 (12.4%) | 25 (6.8%) |
| 7:00 AM to 7:29 AM | 52 (13.5%) | 46 (12.5%) |
| 7:30 AM to 7:59 AM | 30 (7.8%) | 27 (7.4%) |
| 8:00 AM to 8:29 AM | 55 (14.2%) | 27 (7.4%) |
| 8:30 AM to 8:59 AM | 17 (4.4%) | 13 (3.5%) |
| 9:00 AM to 9:59 AM | 40 (10.4%) | 41 (11.2%) |
| 10:00 AM to 10:59 AM | 23 (6.0%) | 59 (16.1%) |
| 11:00 AM to 11:59 AM | 3 (0.8%) | 10 (2.7%) |
| 12:00 PM to 3:59 PM | 9 (2.3%) | 17 (4.6%) |
| 4:00 PM to 11:59 PM | 14 (3.6%) | 15 (4.1%) |
| Total | 386 (100.0%) | 367 (100.0%) |
Housing Occupancy in Lakeland
Occupancy by Ownership in Lakeland
Of the total 758 dwellings in Lakeland, owner-occupied units account for 639 (84.3%), while renter-occupied units make up 119 (15.7%).
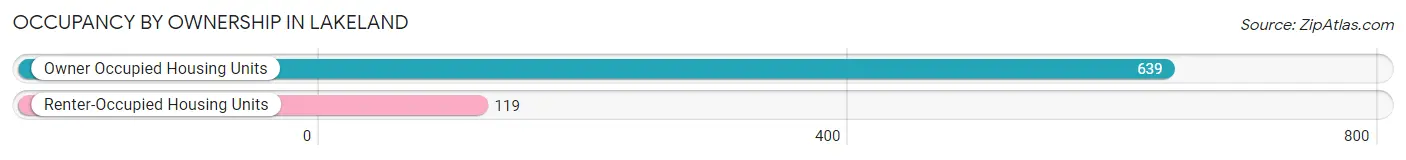
| Occupancy | # Housing Units | % Housing Units |
| Owner Occupied Housing Units | 639 | 84.3% |
| Renter-Occupied Housing Units | 119 | 15.7% |
| Total Occupied Housing Units | 758 | 100.0% |
Occupancy by Household Size in Lakeland
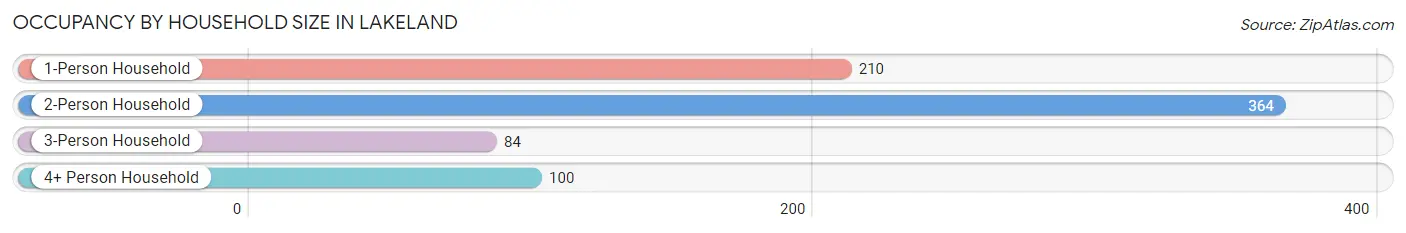
| Household Size | # Housing Units | % Housing Units |
| 1-Person Household | 210 | 27.7% |
| 2-Person Household | 364 | 48.0% |
| 3-Person Household | 84 | 11.1% |
| 4+ Person Household | 100 | 13.2% |
| Total Housing Units | 758 | 100.0% |
Occupancy by Ownership by Household Size in Lakeland
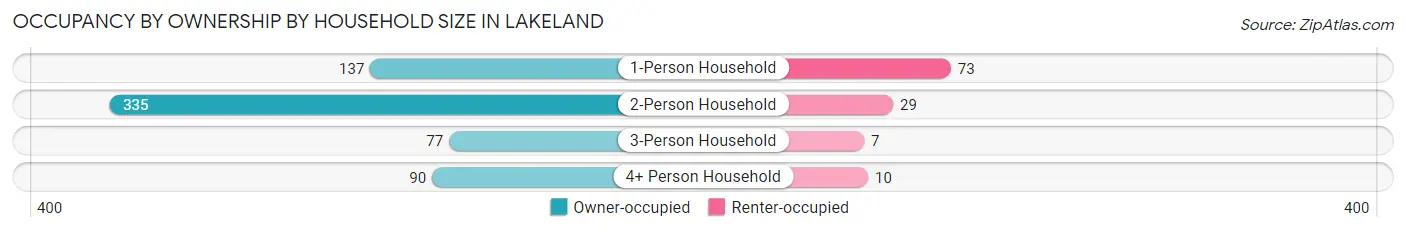
| Household Size | Owner-occupied | Renter-occupied |
| 1-Person Household | 137 (65.2%) | 73 (34.8%) |
| 2-Person Household | 335 (92.0%) | 29 (8.0%) |
| 3-Person Household | 77 (91.7%) | 7 (8.3%) |
| 4+ Person Household | 90 (90.0%) | 10 (10.0%) |
| Total Housing Units | 639 (84.3%) | 119 (15.7%) |
Occupancy by Educational Attainment in Lakeland
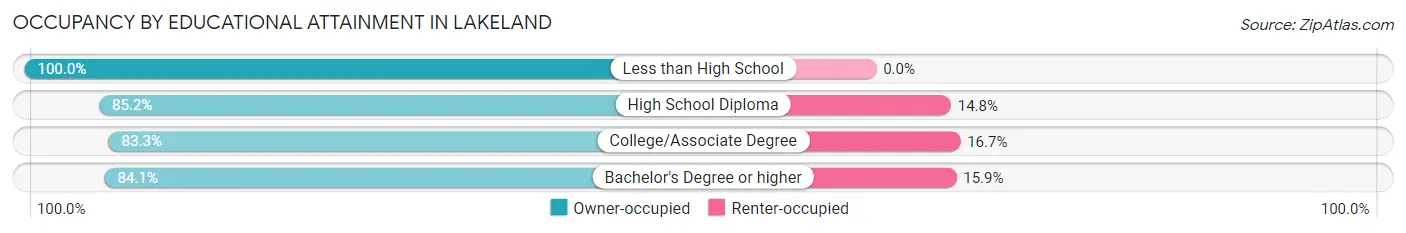
| Household Size | Owner-occupied | Renter-occupied |
| Less than High School | 9 (100.0%) | 0 (0.0%) |
| High School Diploma | 144 (85.2%) | 25 (14.8%) |
| College/Associate Degree | 200 (83.3%) | 40 (16.7%) |
| Bachelor's Degree or higher | 286 (84.1%) | 54 (15.9%) |
Occupancy by Age of Householder in Lakeland
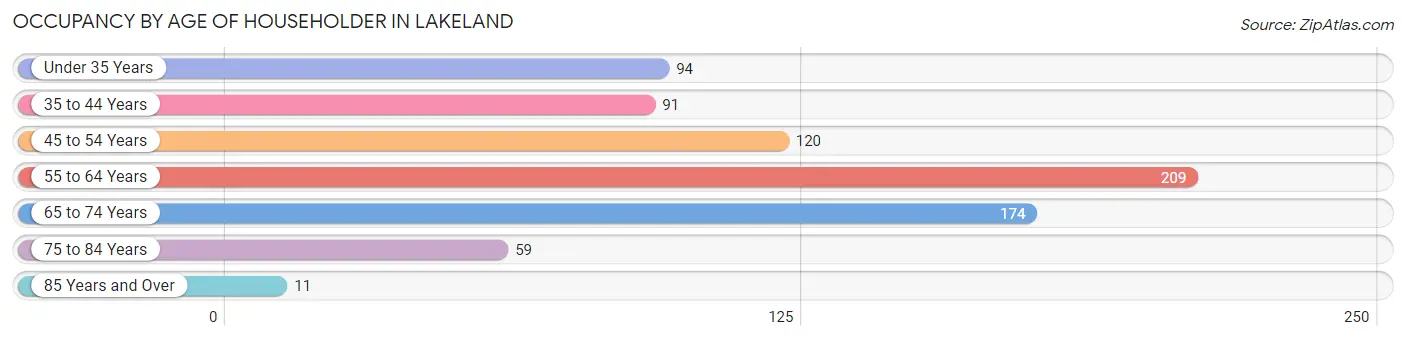
| Age Bracket | # Households | % Households |
| Under 35 Years | 94 | 12.4% |
| 35 to 44 Years | 91 | 12.0% |
| 45 to 54 Years | 120 | 15.8% |
| 55 to 64 Years | 209 | 27.6% |
| 65 to 74 Years | 174 | 23.0% |
| 75 to 84 Years | 59 | 7.8% |
| 85 Years and Over | 11 | 1.5% |
| Total | 758 | 100.0% |
Housing Finances in Lakeland
Median Income by Occupancy in Lakeland
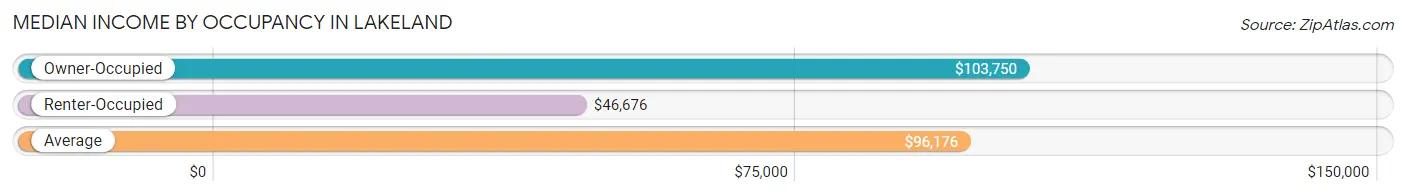
| Occupancy Type | # Households | Median Income |
| Owner-Occupied | 639 (84.3%) | $103,750 |
| Renter-Occupied | 119 (15.7%) | $46,676 |
| Average | 758 (100.0%) | $96,176 |
Occupancy by Householder Income Bracket in Lakeland
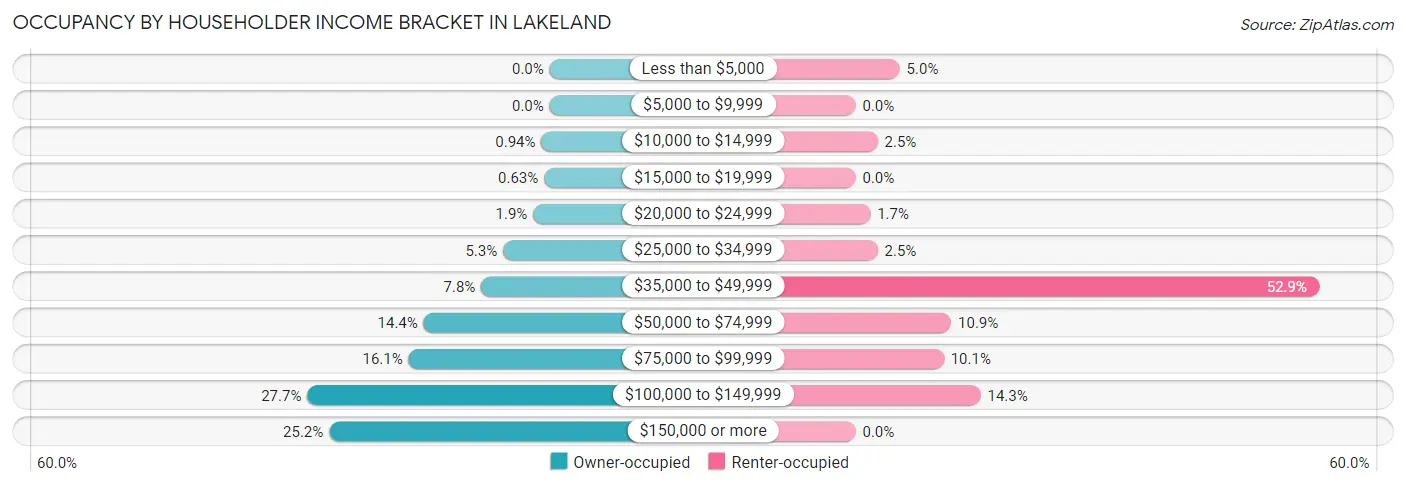
| Income Bracket | Owner-occupied | Renter-occupied |
| Less than $5,000 | 0 (0.0%) | 6 (5.0%) |
| $5,000 to $9,999 | 0 (0.0%) | 0 (0.0%) |
| $10,000 to $14,999 | 6 (0.9%) | 3 (2.5%) |
| $15,000 to $19,999 | 4 (0.6%) | 0 (0.0%) |
| $20,000 to $24,999 | 12 (1.9%) | 2 (1.7%) |
| $25,000 to $34,999 | 34 (5.3%) | 3 (2.5%) |
| $35,000 to $49,999 | 50 (7.8%) | 63 (52.9%) |
| $50,000 to $74,999 | 92 (14.4%) | 13 (10.9%) |
| $75,000 to $99,999 | 103 (16.1%) | 12 (10.1%) |
| $100,000 to $149,999 | 177 (27.7%) | 17 (14.3%) |
| $150,000 or more | 161 (25.2%) | 0 (0.0%) |
| Total | 639 (100.0%) | 119 (100.0%) |
Monthly Housing Cost Tiers in Lakeland
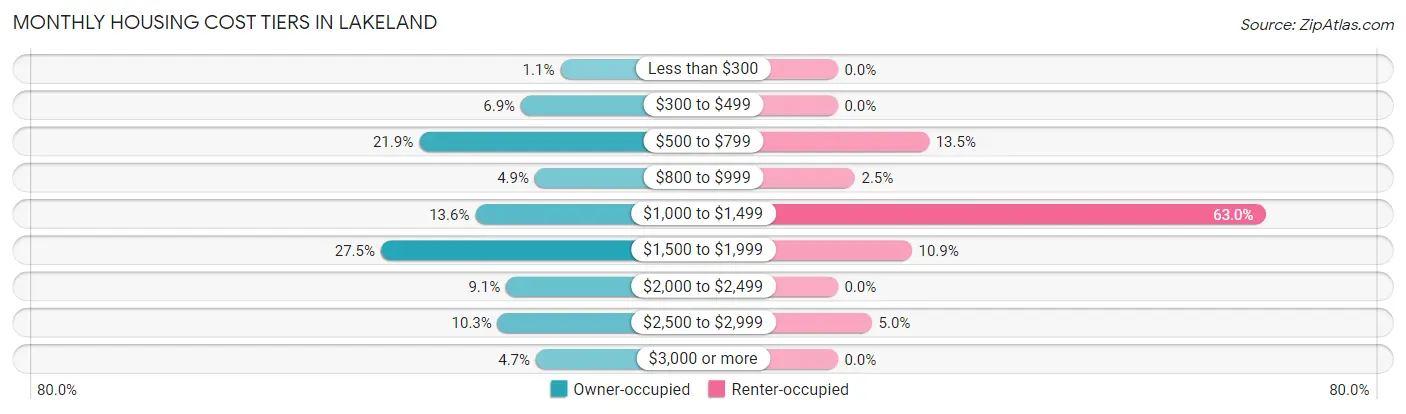
| Monthly Cost | Owner-occupied | Renter-occupied |
| Less than $300 | 7 (1.1%) | 0 (0.0%) |
| $300 to $499 | 44 (6.9%) | 0 (0.0%) |
| $500 to $799 | 140 (21.9%) | 16 (13.5%) |
| $800 to $999 | 31 (4.9%) | 3 (2.5%) |
| $1,000 to $1,499 | 87 (13.6%) | 75 (63.0%) |
| $1,500 to $1,999 | 176 (27.5%) | 13 (10.9%) |
| $2,000 to $2,499 | 58 (9.1%) | 0 (0.0%) |
| $2,500 to $2,999 | 66 (10.3%) | 6 (5.0%) |
| $3,000 or more | 30 (4.7%) | 0 (0.0%) |
| Total | 639 (100.0%) | 119 (100.0%) |
Physical Housing Characteristics in Lakeland
Housing Structures in Lakeland
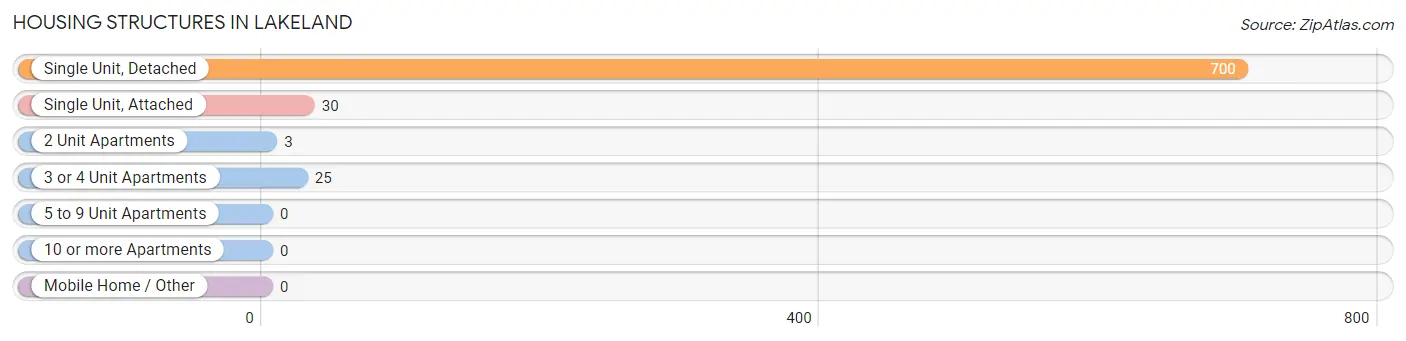
| Structure Type | # Housing Units | % Housing Units |
| Single Unit, Detached | 700 | 92.3% |
| Single Unit, Attached | 30 | 4.0% |
| 2 Unit Apartments | 3 | 0.4% |
| 3 or 4 Unit Apartments | 25 | 3.3% |
| 5 to 9 Unit Apartments | 0 | 0.0% |
| 10 or more Apartments | 0 | 0.0% |
| Mobile Home / Other | 0 | 0.0% |
| Total | 758 | 100.0% |
Housing Structures by Occupancy in Lakeland
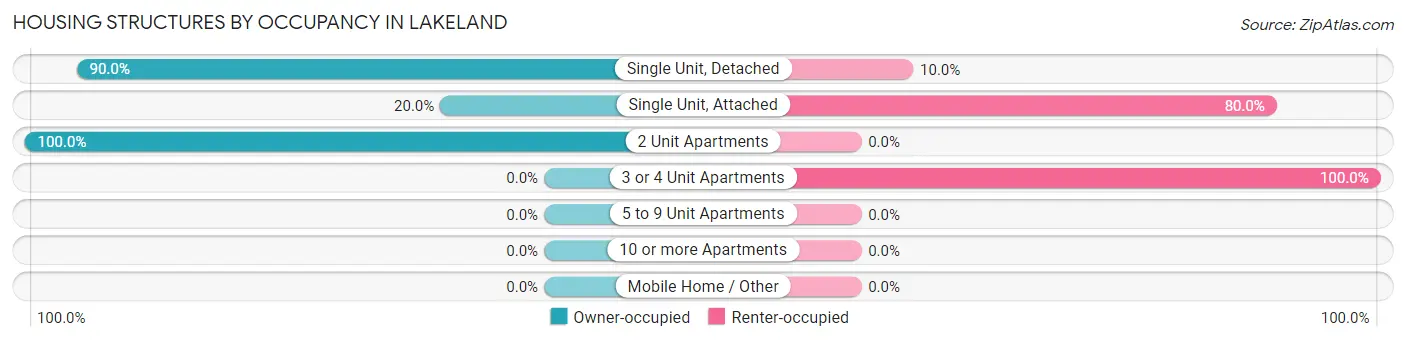
| Structure Type | Owner-occupied | Renter-occupied |
| Single Unit, Detached | 630 (90.0%) | 70 (10.0%) |
| Single Unit, Attached | 6 (20.0%) | 24 (80.0%) |
| 2 Unit Apartments | 3 (100.0%) | 0 (0.0%) |
| 3 or 4 Unit Apartments | 0 (0.0%) | 25 (100.0%) |
| 5 to 9 Unit Apartments | 0 (0.0%) | 0 (0.0%) |
| 10 or more Apartments | 0 (0.0%) | 0 (0.0%) |
| Mobile Home / Other | 0 (0.0%) | 0 (0.0%) |
| Total | 639 (84.3%) | 119 (15.7%) |
Housing Structures by Number of Rooms in Lakeland
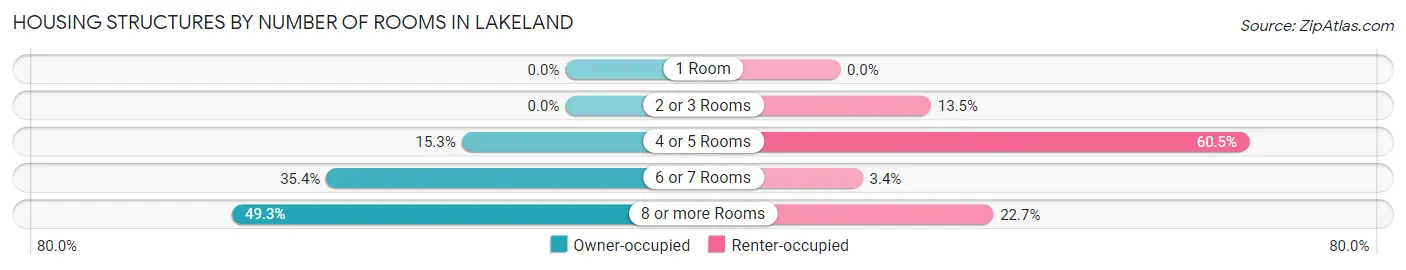
| Number of Rooms | Owner-occupied | Renter-occupied |
| 1 Room | 0 (0.0%) | 0 (0.0%) |
| 2 or 3 Rooms | 0 (0.0%) | 16 (13.5%) |
| 4 or 5 Rooms | 98 (15.3%) | 72 (60.5%) |
| 6 or 7 Rooms | 226 (35.4%) | 4 (3.4%) |
| 8 or more Rooms | 315 (49.3%) | 27 (22.7%) |
| Total | 639 (100.0%) | 119 (100.0%) |
Housing Structure by Heating Type in Lakeland
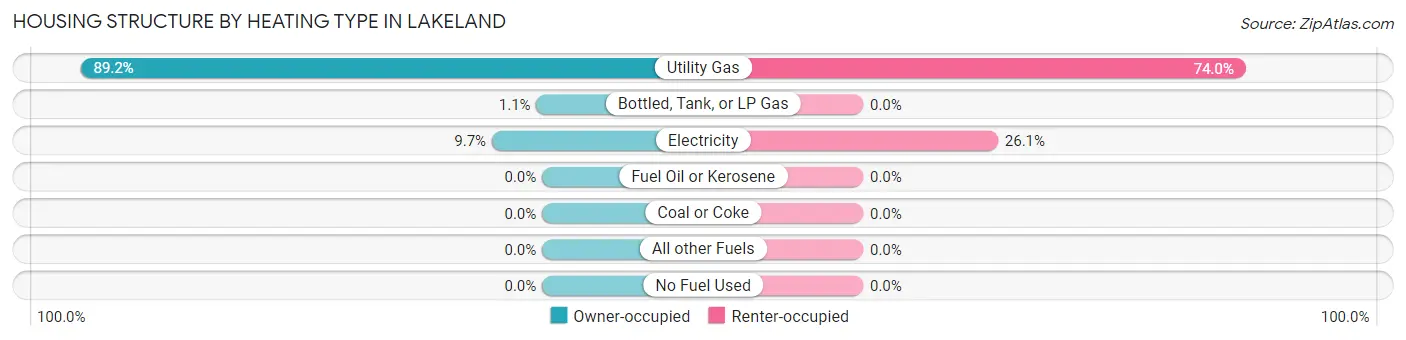
| Heating Type | Owner-occupied | Renter-occupied |
| Utility Gas | 570 (89.2%) | 88 (74.0%) |
| Bottled, Tank, or LP Gas | 7 (1.1%) | 0 (0.0%) |
| Electricity | 62 (9.7%) | 31 (26.1%) |
| Fuel Oil or Kerosene | 0 (0.0%) | 0 (0.0%) |
| Coal or Coke | 0 (0.0%) | 0 (0.0%) |
| All other Fuels | 0 (0.0%) | 0 (0.0%) |
| No Fuel Used | 0 (0.0%) | 0 (0.0%) |
| Total | 639 (100.0%) | 119 (100.0%) |
Household Vehicle Usage in Lakeland
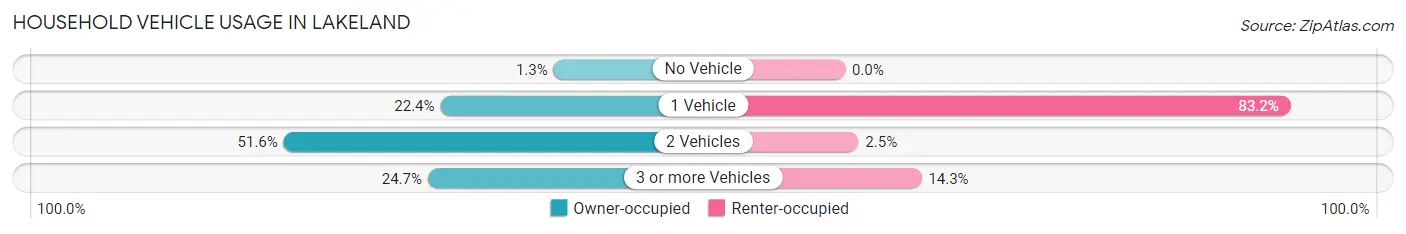
| Vehicles per Household | Owner-occupied | Renter-occupied |
| No Vehicle | 8 (1.3%) | 0 (0.0%) |
| 1 Vehicle | 143 (22.4%) | 99 (83.2%) |
| 2 Vehicles | 330 (51.6%) | 3 (2.5%) |
| 3 or more Vehicles | 158 (24.7%) | 17 (14.3%) |
| Total | 639 (100.0%) | 119 (100.0%) |
Real Estate & Mortgages in Lakeland
Real Estate and Mortgage Overview in Lakeland
| Characteristic | Without Mortgage | With Mortgage |
| Housing Units | 226 | 413 |
| Median Property Value | $331,300 | $345,900 |
| Median Household Income | $71,759 | $121 |
| Monthly Housing Costs | $646 | $30 |
| Real Estate Taxes | $2,930 | $6 |
Property Value by Mortgage Status in Lakeland
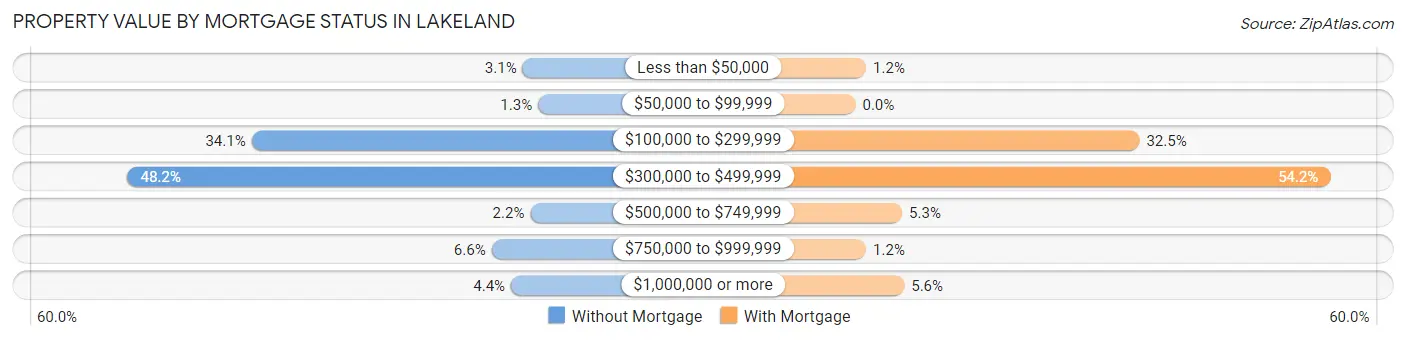
| Property Value | Without Mortgage | With Mortgage |
| Less than $50,000 | 7 (3.1%) | 5 (1.2%) |
| $50,000 to $99,999 | 3 (1.3%) | 0 (0.0%) |
| $100,000 to $299,999 | 77 (34.1%) | 134 (32.5%) |
| $300,000 to $499,999 | 109 (48.2%) | 224 (54.2%) |
| $500,000 to $749,999 | 5 (2.2%) | 22 (5.3%) |
| $750,000 to $999,999 | 15 (6.6%) | 5 (1.2%) |
| $1,000,000 or more | 10 (4.4%) | 23 (5.6%) |
| Total | 226 (100.0%) | 413 (100.0%) |
Household Income by Mortgage Status in Lakeland
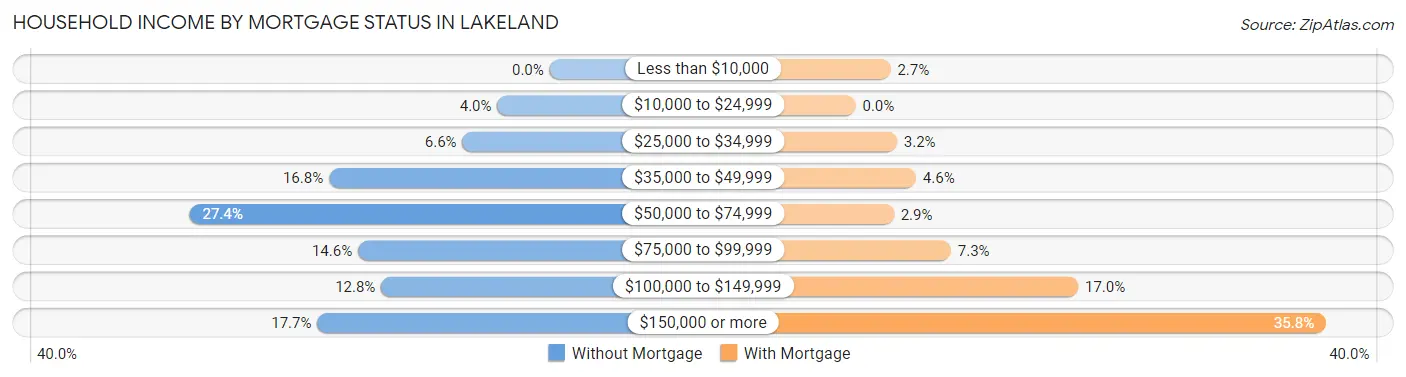
| Household Income | Without Mortgage | With Mortgage |
| Less than $10,000 | 0 (0.0%) | 11 (2.7%) |
| $10,000 to $24,999 | 9 (4.0%) | 0 (0.0%) |
| $25,000 to $34,999 | 15 (6.6%) | 13 (3.2%) |
| $35,000 to $49,999 | 38 (16.8%) | 19 (4.6%) |
| $50,000 to $74,999 | 62 (27.4%) | 12 (2.9%) |
| $75,000 to $99,999 | 33 (14.6%) | 30 (7.3%) |
| $100,000 to $149,999 | 29 (12.8%) | 70 (17.0%) |
| $150,000 or more | 40 (17.7%) | 148 (35.8%) |
| Total | 226 (100.0%) | 413 (100.0%) |
Property Value to Household Income Ratio in Lakeland
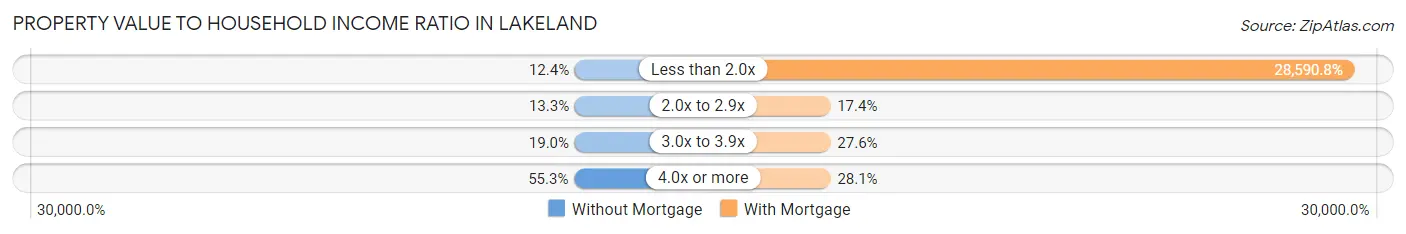
| Value-to-Income Ratio | Without Mortgage | With Mortgage |
| Less than 2.0x | 28 (12.4%) | 118,080 (28,590.8%) |
| 2.0x to 2.9x | 30 (13.3%) | 72 (17.4%) |
| 3.0x to 3.9x | 43 (19.0%) | 114 (27.6%) |
| 4.0x or more | 125 (55.3%) | 116 (28.1%) |
| Total | 226 (100.0%) | 413 (100.0%) |
Real Estate Taxes by Mortgage Status in Lakeland
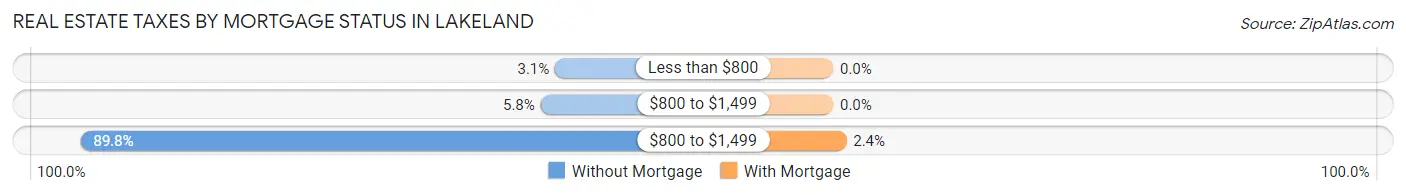
| Property Taxes | Without Mortgage | With Mortgage |
| Less than $800 | 7 (3.1%) | 0 (0.0%) |
| $800 to $1,499 | 13 (5.8%) | 0 (0.0%) |
| $800 to $1,499 | 203 (89.8%) | 10 (2.4%) |
| Total | 226 (100.0%) | 413 (100.0%) |
Health & Disability in Lakeland
Health Insurance Coverage by Age in Lakeland
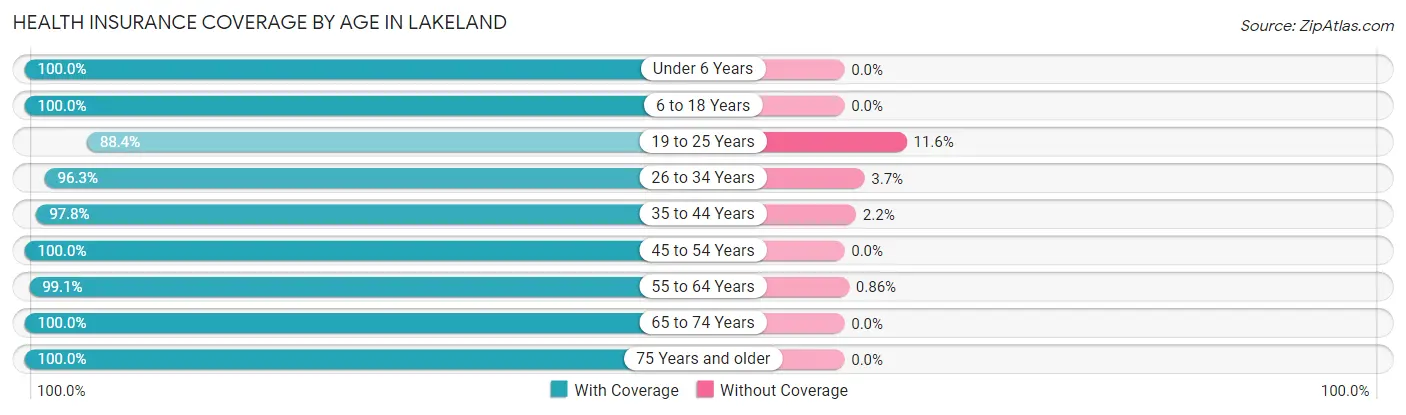
| Age Bracket | With Coverage | Without Coverage |
| Under 6 Years | 74 (100.0%) | 0 (0.0%) |
| 6 to 18 Years | 211 (100.0%) | 0 (0.0%) |
| 19 to 25 Years | 99 (88.4%) | 13 (11.6%) |
| 26 to 34 Years | 103 (96.3%) | 4 (3.7%) |
| 35 to 44 Years | 180 (97.8%) | 4 (2.2%) |
| 45 to 54 Years | 228 (100.0%) | 0 (0.0%) |
| 55 to 64 Years | 345 (99.1%) | 3 (0.9%) |
| 65 to 74 Years | 270 (100.0%) | 0 (0.0%) |
| 75 Years and older | 103 (100.0%) | 0 (0.0%) |
| Total | 1,613 (98.5%) | 24 (1.5%) |
Health Insurance Coverage by Citizenship Status in Lakeland
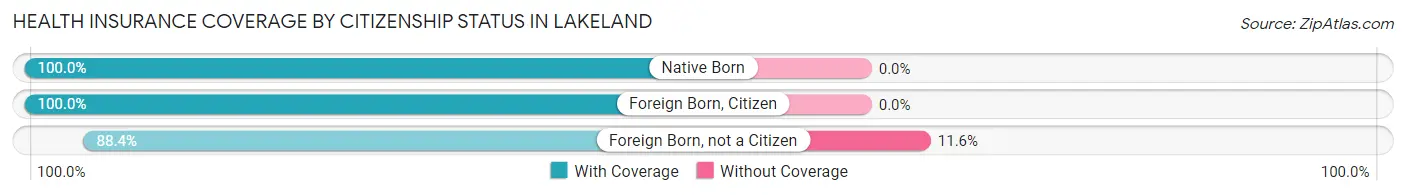
| Citizenship Status | With Coverage | Without Coverage |
| Native Born | 74 (100.0%) | 0 (0.0%) |
| Foreign Born, Citizen | 211 (100.0%) | 0 (0.0%) |
| Foreign Born, not a Citizen | 99 (88.4%) | 13 (11.6%) |
Health Insurance Coverage by Household Income in Lakeland
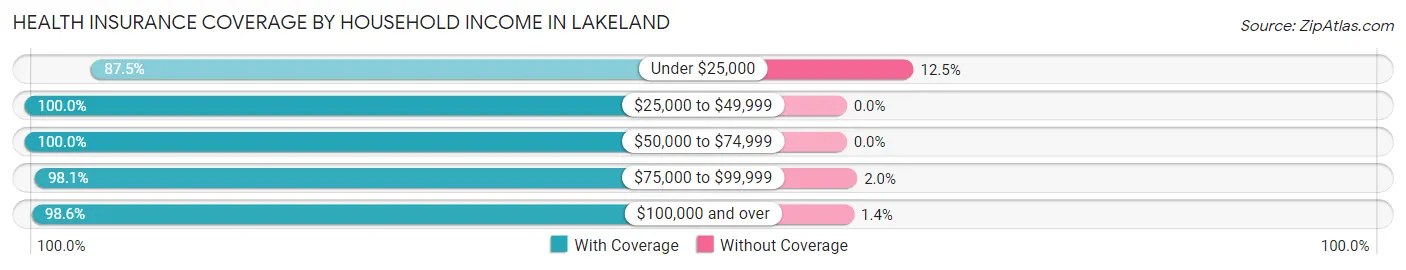
| Household Income | With Coverage | Without Coverage |
| Under $25,000 | 49 (87.5%) | 7 (12.5%) |
| $25,000 to $49,999 | 242 (100.0%) | 0 (0.0%) |
| $50,000 to $74,999 | 185 (100.0%) | 0 (0.0%) |
| $75,000 to $99,999 | 201 (98.1%) | 4 (1.9%) |
| $100,000 and over | 936 (98.6%) | 13 (1.4%) |
Public vs Private Health Insurance Coverage by Age in Lakeland
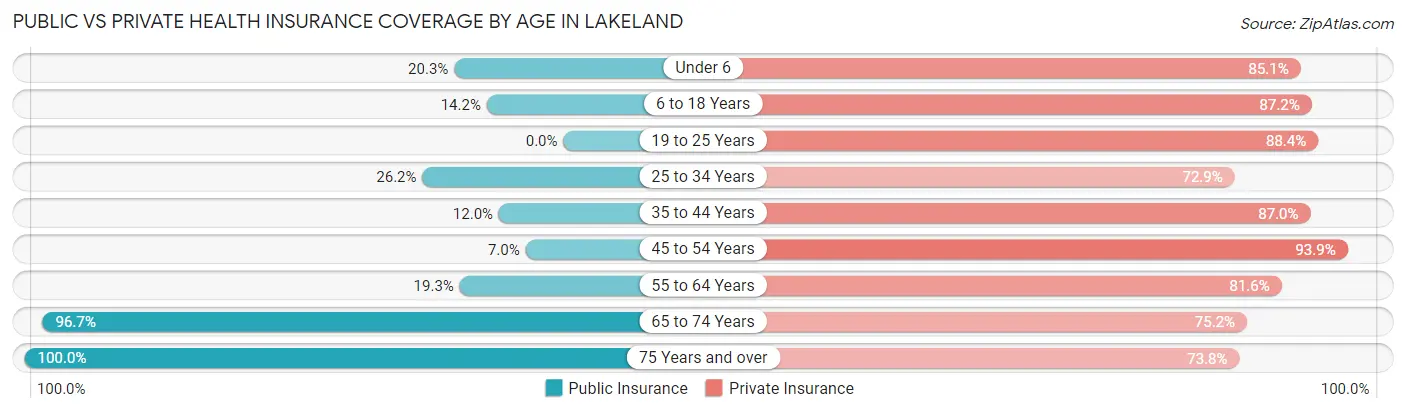
| Age Bracket | Public Insurance | Private Insurance |
| Under 6 | 15 (20.3%) | 63 (85.1%) |
| 6 to 18 Years | 30 (14.2%) | 184 (87.2%) |
| 19 to 25 Years | 0 (0.0%) | 99 (88.4%) |
| 25 to 34 Years | 28 (26.2%) | 78 (72.9%) |
| 35 to 44 Years | 22 (12.0%) | 160 (87.0%) |
| 45 to 54 Years | 16 (7.0%) | 214 (93.9%) |
| 55 to 64 Years | 67 (19.3%) | 284 (81.6%) |
| 65 to 74 Years | 261 (96.7%) | 203 (75.2%) |
| 75 Years and over | 103 (100.0%) | 76 (73.8%) |
| Total | 542 (33.1%) | 1,361 (83.1%) |
Disability Status by Sex by Age in Lakeland

| Age Bracket | Male | Female |
| Under 5 Years | 0 (0.0%) | 0 (0.0%) |
| 5 to 17 Years | 23 (21.9%) | 7 (6.9%) |
| 18 to 34 Years | 18 (13.9%) | 0 (0.0%) |
| 35 to 64 Years | 38 (10.3%) | 60 (15.3%) |
| 65 to 74 Years | 14 (10.1%) | 13 (9.9%) |
| 75 Years and over | 16 (28.6%) | 11 (23.4%) |
Disability Class by Sex by Age in Lakeland
Disability Class: Hearing Difficulty
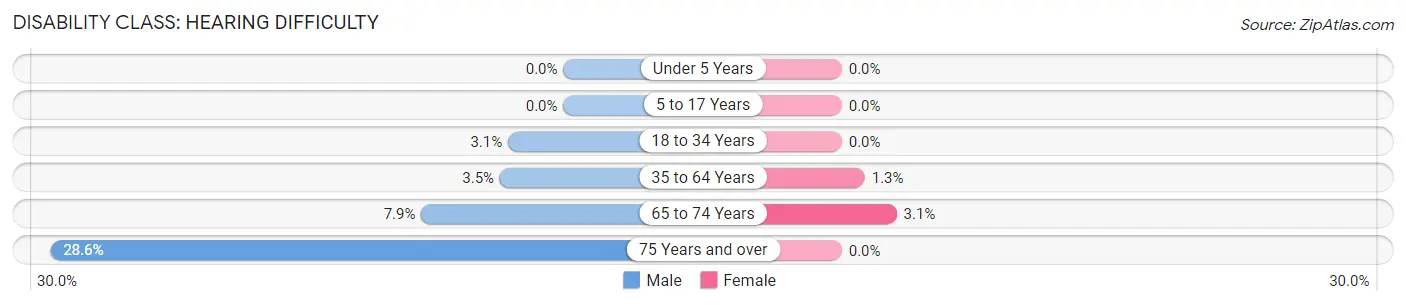
| Age Bracket | Male | Female |
| Under 5 Years | 0 (0.0%) | 0 (0.0%) |
| 5 to 17 Years | 0 (0.0%) | 0 (0.0%) |
| 18 to 34 Years | 4 (3.1%) | 0 (0.0%) |
| 35 to 64 Years | 13 (3.5%) | 5 (1.3%) |
| 65 to 74 Years | 11 (7.9%) | 4 (3.0%) |
| 75 Years and over | 16 (28.6%) | 0 (0.0%) |
Disability Class: Vision Difficulty
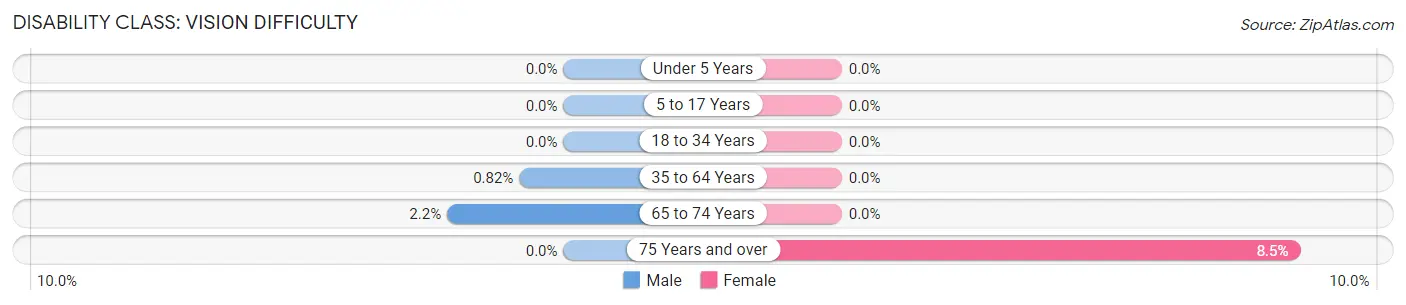
| Age Bracket | Male | Female |
| Under 5 Years | 0 (0.0%) | 0 (0.0%) |
| 5 to 17 Years | 0 (0.0%) | 0 (0.0%) |
| 18 to 34 Years | 0 (0.0%) | 0 (0.0%) |
| 35 to 64 Years | 3 (0.8%) | 0 (0.0%) |
| 65 to 74 Years | 3 (2.2%) | 0 (0.0%) |
| 75 Years and over | 0 (0.0%) | 4 (8.5%) |
Disability Class: Cognitive Difficulty
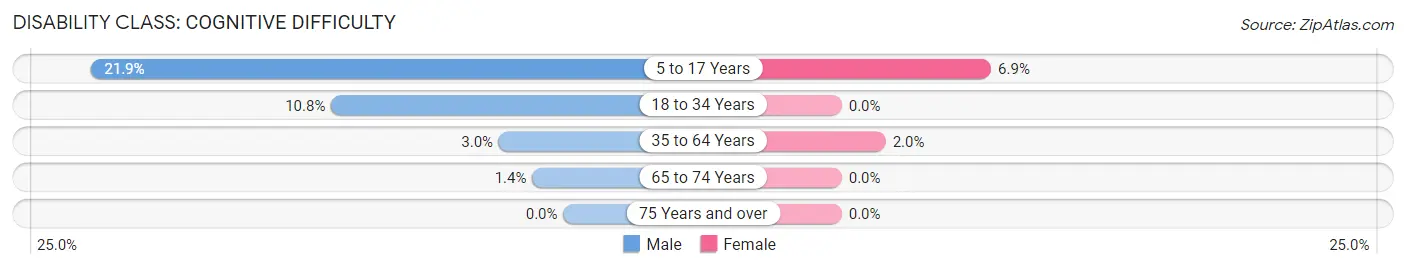
| Age Bracket | Male | Female |
| 5 to 17 Years | 23 (21.9%) | 7 (6.9%) |
| 18 to 34 Years | 14 (10.8%) | 0 (0.0%) |
| 35 to 64 Years | 11 (3.0%) | 8 (2.0%) |
| 65 to 74 Years | 2 (1.4%) | 0 (0.0%) |
| 75 Years and over | 0 (0.0%) | 0 (0.0%) |
Disability Class: Ambulatory Difficulty
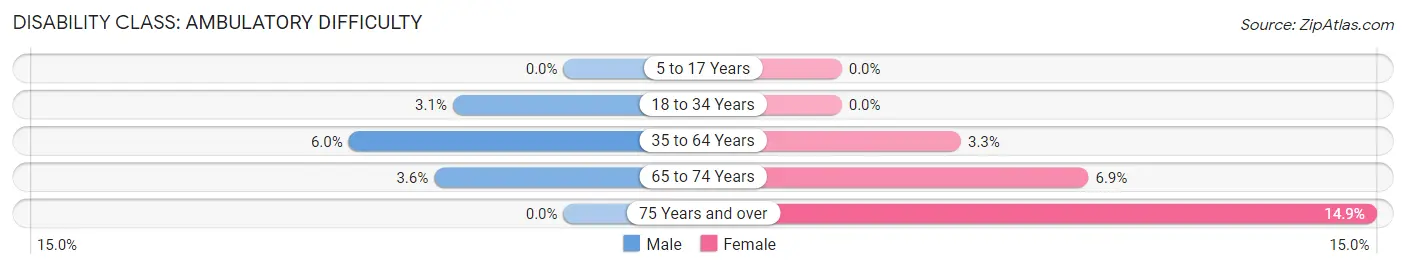
| Age Bracket | Male | Female |
| 5 to 17 Years | 0 (0.0%) | 0 (0.0%) |
| 18 to 34 Years | 4 (3.1%) | 0 (0.0%) |
| 35 to 64 Years | 22 (6.0%) | 13 (3.3%) |
| 65 to 74 Years | 5 (3.6%) | 9 (6.9%) |
| 75 Years and over | 0 (0.0%) | 7 (14.9%) |
Disability Class: Self-Care Difficulty
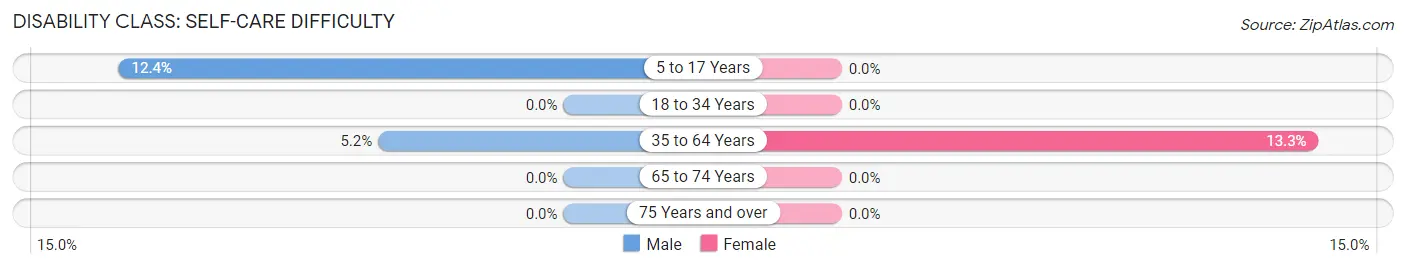
| Age Bracket | Male | Female |
| 5 to 17 Years | 13 (12.4%) | 0 (0.0%) |
| 18 to 34 Years | 0 (0.0%) | 0 (0.0%) |
| 35 to 64 Years | 19 (5.2%) | 52 (13.3%) |
| 65 to 74 Years | 0 (0.0%) | 0 (0.0%) |
| 75 Years and over | 0 (0.0%) | 0 (0.0%) |
Technology Access in Lakeland
Computing Device Access in Lakeland
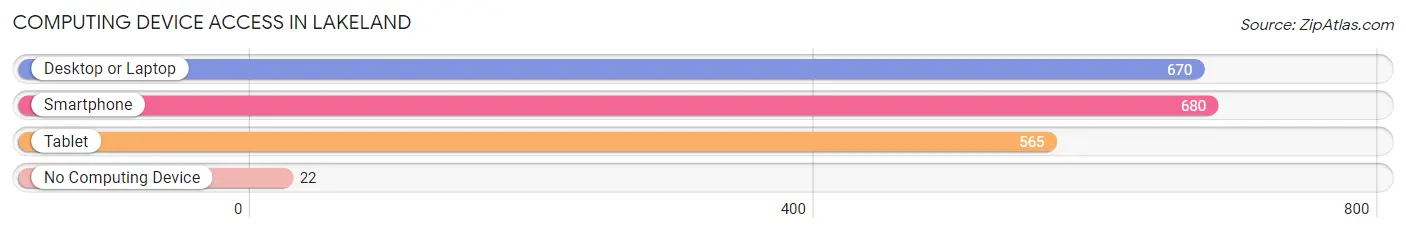
| Device Type | # Households | % Households |
| Desktop or Laptop | 670 | 88.4% |
| Smartphone | 680 | 89.7% |
| Tablet | 565 | 74.5% |
| No Computing Device | 22 | 2.9% |
| Total | 758 | 100.0% |
Internet Access in Lakeland
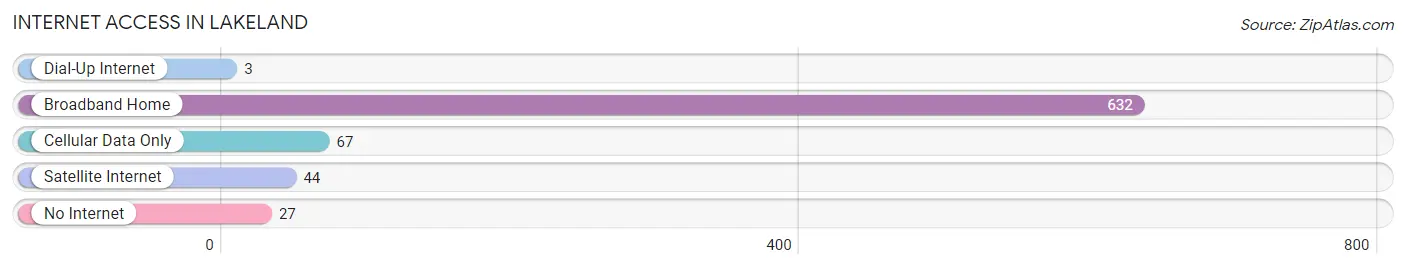
| Internet Type | # Households | % Households |
| Dial-Up Internet | 3 | 0.4% |
| Broadband Home | 632 | 83.4% |
| Cellular Data Only | 67 | 8.8% |
| Satellite Internet | 44 | 5.8% |
| No Internet | 27 | 3.6% |
| Total | 758 | 100.0% |
Lakeland Summary
Lakeland, Minnesota is a small city located in Washington County, Minnesota. It is situated on the St. Croix River, just north of the Twin Cities metropolitan area. The city has a population of approximately 8,000 people and is part of the larger Stillwater-Oak Park Heights metropolitan area.
History
The area that is now Lakeland was first settled in the early 1800s by French-Canadian fur traders. The first permanent settlers arrived in the area in 1844, and the town was officially incorporated in 1858. The town was named after the nearby lake, which was named after the nearby lake, Lake St. Croix.
The town grew slowly over the years, and by the early 1900s, it had become a popular summer resort destination. The town was known for its beautiful scenery and its many outdoor activities, such as fishing, boating, and swimming.
In the 1950s, the town began to experience a population boom, as many people moved to the area from the Twin Cities. This growth continued into the 1960s and 1970s, and the town began to develop into a more suburban community.
Geography
Lakeland is located in Washington County, Minnesota, just north of the Twin Cities metropolitan area. The city is situated on the St. Croix River, and is bordered by the cities of Stillwater, Oak Park Heights, and Bayport. The city covers an area of approximately 4.5 square miles, and has a population of approximately 8,000 people.
The city is located in a region of rolling hills and wooded areas, and is known for its beautiful scenery. The city is home to several parks and recreational areas, including Lake Elmo Park Reserve, which is a popular destination for hiking, biking, and camping.
Economy
The economy of Lakeland is largely based on tourism and retail. The city is home to several small businesses, including restaurants, shops, and other retail establishments. The city is also home to several large employers, such as 3M, Andersen Windows, and the St. Croix Valley Medical Center.
The city is also home to several educational institutions, including the University of Minnesota-Twin Cities, St. Croix Valley Technical College, and the Minnesota School of Business.
Demographics
As of the 2010 census, the population of Lakeland was 8,000 people. The racial makeup of the city was 94.3% White, 1.2% African American, 0.7% Native American, 1.2% Asian, 0.1% Pacific Islander, 1.2% from other races, and 1.5% from two or more races. Hispanic or Latino of any race were 3.2% of the population.
The median household income in Lakeland was $60,000, and the median family income was $68,000. The per capita income for the city was $27,000. About 8.5% of families and 10.2% of the population were below the poverty line, including 14.2% of those under age 18 and 6.2% of those age 65 or over.
Conclusion
Lakeland, Minnesota is a small city located in Washington County, Minnesota. It is situated on the St. Croix River, just north of the Twin Cities metropolitan area. The city has a population of approximately 8,000 people and is part of the larger Stillwater-Oak Park Heights metropolitan area. The city has a long history, dating back to the early 1800s, and has grown into a popular suburban community. The economy of Lakeland is largely based on tourism and retail, and the city is home to several large employers. The population of Lakeland is predominantly white, with a small percentage of African American, Native American, Asian, and Hispanic or Latino residents.
Common Questions
What is the Total Population of Lakeland?
Total Population of Lakeland is 1,637.
What is the Total Male Population of Lakeland?
Total Male Population of Lakeland is 825.
What is the Total Female Population of Lakeland?
Total Female Population of Lakeland is 812.
What is the Ratio of Males per 100 Females in Lakeland?
There are 101.60 Males per 100 Females in Lakeland.
What is the Ratio of Females per 100 Males in Lakeland?
There are 98.42 Females per 100 Males in Lakeland.
What is the Median Population Age in Lakeland?
Median Population Age in Lakeland is 52.3 Years.
What is the Average Family Size in Lakeland
Average Family Size in Lakeland is 2.6 People.
What is the Average Household Size in Lakeland
Average Household Size in Lakeland is 2.2 People.
What is Per Capita Income in Lakeland?
Per Capita income in Lakeland is $52,074.
What is the Median Family Income in Lakeland?
Median Family Income in Lakeland is $106,563.
What is the Median Household income in Lakeland?
Median Household Income in Lakeland is $96,176.
What is Income or Wage Gap in Lakeland?
Income or Wage Gap in Lakeland is 21.8%.
Women in Lakeland earn 78.2 cents for every dollar earned by a man.
What is Inequality or Gini Index in Lakeland?
Inequality or Gini Index in Lakeland is 0.37.
How Large is the Labor Force in Lakeland?
There are 960 People in the Labor Forcein in Lakeland.
What is the Percentage of People in the Labor Force in Lakeland?
68.4% of People are in the Labor Force in Lakeland.
What is the Unemployment Rate in Lakeland?
Unemployment Rate in Lakeland is 4.8%.