Cities with the Highest Percentage of Population Employed in Office & Administration in Oklahoma
RELATED REPORTS & OPTIONS
Office & Administration
Oklahoma
Compare Cities
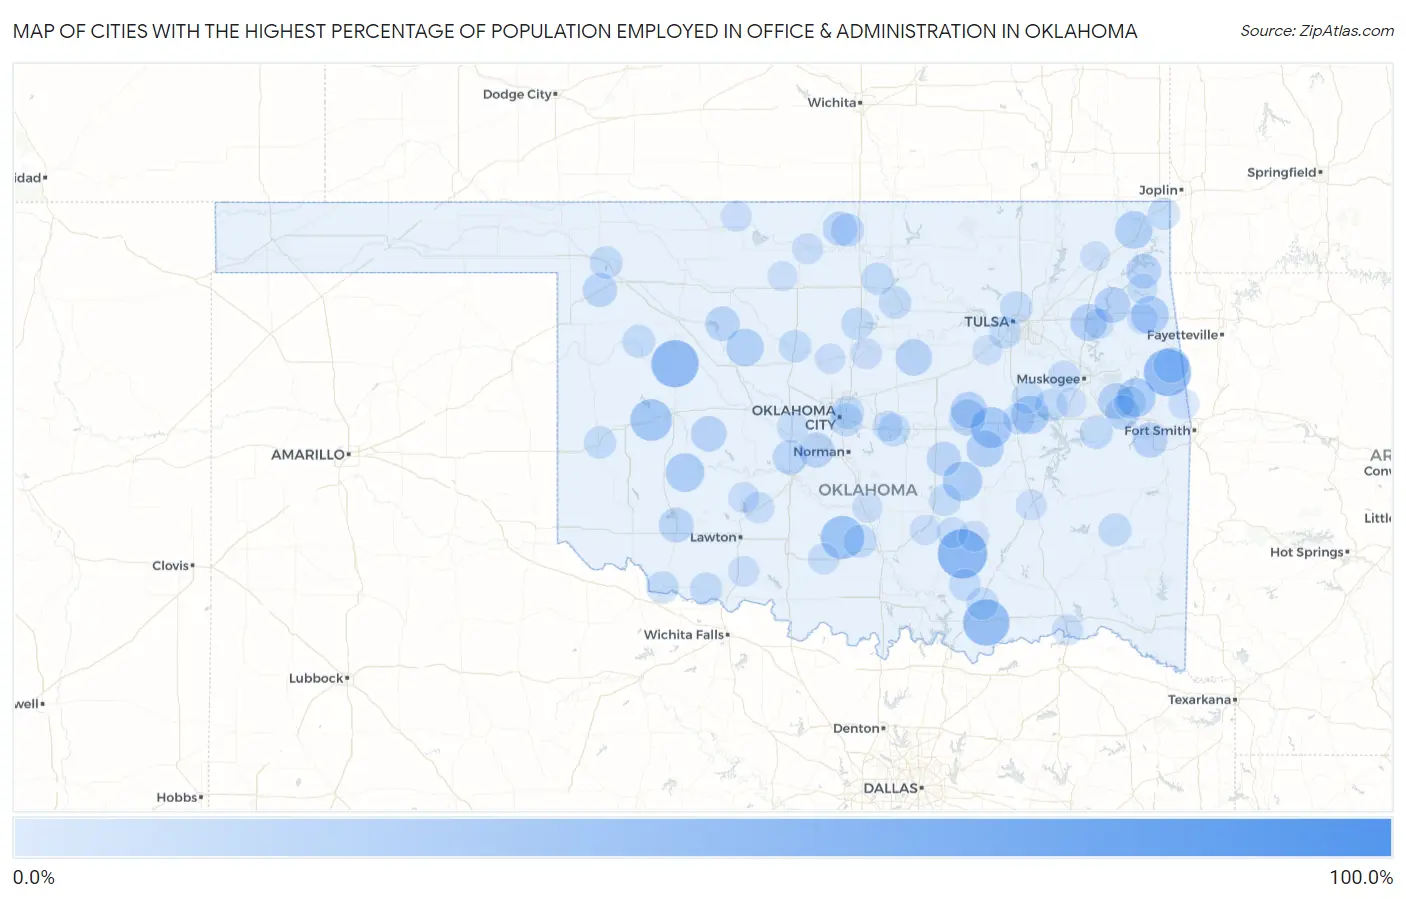
Map of Cities with the Highest Percentage of Population Employed in Office & Administration in Oklahoma
0.0%
100.0%
Cities with the Highest Percentage of Population Employed in Office & Administration in Oklahoma
| City | % Employed | vs State | vs National | |
| 1. | Quay | 100.0% | 11.5%(+88.5)#1 | 10.9%(+89.1)#49 |
| 2. | Fay | 60.0% | 11.5%(+48.5)#2 | 10.9%(+49.1)#128 |
| 3. | Clarita | 58.1% | 11.5%(+46.5)#3 | 10.9%(+47.2)#135 |
| 4. | Lake Ellsworth Addition | 57.0% | 11.5%(+45.4)#4 | 10.9%(+46.1)#145 |
| 5. | Putnam | 53.3% | 11.5%(+41.8)#5 | 10.9%(+42.5)#176 |
| 6. | Zion | 53.3% | 11.5%(+41.8)#6 | 10.9%(+42.5)#177 |
| 7. | Blue | 51.4% | 11.5%(+39.9)#7 | 10.9%(+40.6)#194 |
| 8. | Hanson | 51.3% | 11.5%(+39.7)#8 | 10.9%(+40.4)#195 |
| 9. | Bowring | 48.6% | 11.5%(+37.0)#9 | 10.9%(+37.7)#242 |
| 10. | Lovell | 48.0% | 11.5%(+36.5)#10 | 10.9%(+37.1)#247 |
| 11. | Foster | 45.1% | 11.5%(+33.6)#11 | 10.9%(+34.2)#290 |
| 12. | Leonard | 42.9% | 11.5%(+31.3)#12 | 10.9%(+32.0)#334 |
| 13. | Foss | 41.9% | 11.5%(+30.3)#13 | 10.9%(+31.0)#367 |
| 14. | Clearview | 40.0% | 11.5%(+28.5)#14 | 10.9%(+29.1)#414 |
| 15. | Briartown | 39.1% | 11.5%(+27.6)#15 | 10.9%(+28.3)#440 |
| 16. | Spaulding | 37.3% | 11.5%(+25.7)#16 | 10.9%(+26.4)#491 |
| 17. | Evening Shade | 35.7% | 11.5%(+24.2)#17 | 10.9%(+24.9)#544 |
| 18. | Gotebo | 35.5% | 11.5%(+24.0)#18 | 10.9%(+24.7)#549 |
| 19. | Hoffman | 34.5% | 11.5%(+22.9)#19 | 10.9%(+23.6)#596 |
| 20. | Kansas | 34.0% | 11.5%(+22.4)#20 | 10.9%(+23.1)#617 |
| 21. | Narcissa | 33.3% | 11.5%(+21.8)#21 | 10.9%(+22.5)#651 |
| 22. | Hitchcock | 33.3% | 11.5%(+21.8)#22 | 10.9%(+22.5)#677 |
| 23. | Wetumka | 32.6% | 11.5%(+21.0)#23 | 10.9%(+21.7)#709 |
| 24. | Mazie | 31.7% | 11.5%(+20.2)#24 | 10.9%(+20.9)#746 |
| 25. | Agra | 31.0% | 11.5%(+19.4)#25 | 10.9%(+20.1)#785 |
| 26. | Castle | 30.8% | 11.5%(+19.2)#26 | 10.9%(+19.9)#798 |
| 27. | Ixl | 30.8% | 11.5%(+19.2)#27 | 10.9%(+19.9)#801 |
| 28. | Notchietown | 30.7% | 11.5%(+19.2)#28 | 10.9%(+19.8)#805 |
| 29. | Pump Back | 30.2% | 11.5%(+18.7)#29 | 10.9%(+19.4)#831 |
| 30. | Colony | 29.5% | 11.5%(+18.0)#30 | 10.9%(+18.7)#875 |
| 31. | Fairfield | 29.4% | 11.5%(+17.9)#31 | 10.9%(+18.6)#881 |
| 32. | Cumberland | 29.1% | 11.5%(+17.6)#32 | 10.9%(+18.2)#910 |
| 33. | Cowlington | 28.6% | 11.5%(+17.0)#33 | 10.9%(+17.7)#955 |
| 34. | Bridge Creek | 28.5% | 11.5%(+17.0)#34 | 10.9%(+17.7)#967 |
| 35. | Mountain Park | 28.0% | 11.5%(+16.5)#35 | 10.9%(+17.1)#1,002 |
| 36. | Pocasset | 27.5% | 11.5%(+16.0)#36 | 10.9%(+16.7)#1,060 |
| 37. | Zena | 27.5% | 11.5%(+16.0)#37 | 10.9%(+16.6)#1,064 |
| 38. | Longdale | 27.4% | 11.5%(+15.9)#38 | 10.9%(+16.6)#1,069 |
| 39. | Deer Creek | 27.0% | 11.5%(+15.5)#39 | 10.9%(+16.2)#1,104 |
| 40. | Lima | 26.9% | 11.5%(+15.4)#40 | 10.9%(+16.1)#1,114 |
| 41. | Carlisle | 26.7% | 11.5%(+15.1)#41 | 10.9%(+15.8)#1,138 |
| 42. | Fargo | 26.5% | 11.5%(+14.9)#42 | 10.9%(+15.6)#1,159 |
| 43. | Nashoba | 26.3% | 11.5%(+14.8)#43 | 10.9%(+15.5)#1,177 |
| 44. | Nardin | 24.6% | 11.5%(+13.1)#44 | 10.9%(+13.8)#1,372 |
| 45. | Katie | 24.3% | 11.5%(+12.8)#45 | 10.9%(+13.5)#1,416 |
| 46. | Smith Village | 24.2% | 11.5%(+12.7)#46 | 10.9%(+13.4)#1,430 |
| 47. | Haywood | 24.1% | 11.5%(+12.5)#47 | 10.9%(+13.2)#1,450 |
| 48. | Forest Park | 24.0% | 11.5%(+12.5)#48 | 10.9%(+13.2)#1,458 |
| 49. | Camargo | 23.9% | 11.5%(+12.4)#49 | 10.9%(+13.1)#1,466 |
| 50. | Albion | 23.8% | 11.5%(+12.3)#50 | 10.9%(+13.0)#1,493 |
| 51. | Dale | 23.7% | 11.5%(+12.2)#51 | 10.9%(+12.9)#1,504 |
| 52. | Turley | 23.7% | 11.5%(+12.2)#52 | 10.9%(+12.9)#1,509 |
| 53. | Dover | 23.7% | 11.5%(+12.1)#53 | 10.9%(+12.8)#1,517 |
| 54. | Fort Supply | 23.6% | 11.5%(+12.1)#54 | 10.9%(+12.8)#1,520 |
| 55. | Porum | 23.6% | 11.5%(+12.1)#55 | 10.9%(+12.8)#1,522 |
| 56. | Morrison | 23.6% | 11.5%(+12.1)#56 | 10.9%(+12.7)#1,533 |
| 57. | Red Rock | 23.3% | 11.5%(+11.8)#57 | 10.9%(+12.5)#1,578 |
| 58. | Council Hill | 23.3% | 11.5%(+11.8)#58 | 10.9%(+12.5)#1,581 |
| 59. | Fittstown | 23.3% | 11.5%(+11.8)#59 | 10.9%(+12.5)#1,584 |
| 60. | Davidson | 23.2% | 11.5%(+11.7)#60 | 10.9%(+12.4)#1,597 |
| 61. | Grandfield | 23.2% | 11.5%(+11.7)#61 | 10.9%(+12.4)#1,603 |
| 62. | Orlando | 23.1% | 11.5%(+11.5)#62 | 10.9%(+12.2)#1,621 |
| 63. | Sayre | 22.8% | 11.5%(+11.3)#63 | 10.9%(+12.0)#1,665 |
| 64. | Caddo | 22.8% | 11.5%(+11.3)#64 | 10.9%(+12.0)#1,666 |
| 65. | Olive | 22.7% | 11.5%(+11.2)#65 | 10.9%(+11.9)#1,689 |
| 66. | Morris | 22.6% | 11.5%(+11.1)#66 | 10.9%(+11.7)#1,707 |
| 67. | Coleman | 22.3% | 11.5%(+10.8)#67 | 10.9%(+11.4)#1,777 |
| 68. | Francis | 22.2% | 11.5%(+10.7)#68 | 10.9%(+11.4)#1,787 |
| 69. | Box | 22.2% | 11.5%(+10.7)#69 | 10.9%(+11.4)#1,797 |
| 70. | Peoria | 22.2% | 11.5%(+10.7)#70 | 10.9%(+11.4)#1,800 |
| 71. | Oakhurst | 22.1% | 11.5%(+10.5)#71 | 10.9%(+11.2)#1,825 |
| 72. | Bryant | 21.4% | 11.5%(+9.89)#72 | 10.9%(+10.6)#1,996 |
| 73. | Pumpkin Hollow | 21.2% | 11.5%(+9.61)#73 | 10.9%(+10.3)#2,060 |
| 74. | Union City | 21.0% | 11.5%(+9.43)#74 | 10.9%(+10.1)#2,106 |
| 75. | Velma | 20.9% | 11.5%(+9.36)#75 | 10.9%(+10.0)#2,125 |
| 76. | Fletcher | 20.8% | 11.5%(+9.29)#76 | 10.9%(+9.98)#2,141 |
| 77. | Dewar | 20.7% | 11.5%(+9.21)#77 | 10.9%(+9.89)#2,172 |
| 78. | Apache | 20.5% | 11.5%(+8.97)#78 | 10.9%(+9.66)#2,244 |
| 79. | Taft | 20.5% | 11.5%(+8.97)#79 | 10.9%(+9.66)#2,249 |
| 80. | Stonewall | 20.4% | 11.5%(+8.84)#80 | 10.9%(+9.52)#2,284 |
| 81. | Langston | 20.3% | 11.5%(+8.74)#81 | 10.9%(+9.43)#2,313 |
| 82. | Pond Creek | 20.2% | 11.5%(+8.69)#82 | 10.9%(+9.38)#2,324 |
| 83. | Grant | 20.0% | 11.5%(+8.46)#83 | 10.9%(+9.14)#2,407 |
| 84. | Burlington | 20.0% | 11.5%(+8.46)#84 | 10.9%(+9.14)#2,416 |
| 85. | Centrahoma | 20.0% | 11.5%(+8.46)#85 | 10.9%(+9.14)#2,435 |
| 86. | Walters | 19.9% | 11.5%(+8.38)#86 | 10.9%(+9.06)#2,460 |
| 87. | Mcloud | 19.8% | 11.5%(+8.21)#87 | 10.9%(+8.90)#2,518 |
| 88. | Savanna | 19.7% | 11.5%(+8.20)#88 | 10.9%(+8.89)#2,522 |
| 89. | Short | 19.7% | 11.5%(+8.20)#89 | 10.9%(+8.88)#2,525 |
| 90. | Oaks | 19.7% | 11.5%(+8.16)#90 | 10.9%(+8.84)#2,533 |
| 91. | Fitzhugh | 19.4% | 11.5%(+7.90)#91 | 10.9%(+8.59)#2,629 |
| 92. | Murphy | 19.1% | 11.5%(+7.61)#92 | 10.9%(+8.29)#2,742 |
| 93. | Cimarron City | 19.0% | 11.5%(+7.51)#93 | 10.9%(+8.19)#2,783 |
| 94. | Oktaha | 19.0% | 11.5%(+7.42)#94 | 10.9%(+8.11)#2,817 |
| 95. | New Eucha | 18.8% | 11.5%(+7.31)#95 | 10.9%(+7.99)#2,885 |
| 96. | Paoli | 18.8% | 11.5%(+7.26)#96 | 10.9%(+7.94)#2,912 |
| 97. | Carrier | 18.6% | 11.5%(+7.06)#97 | 10.9%(+7.75)#3,020 |
| 98. | Kellyville | 18.5% | 11.5%(+6.92)#98 | 10.9%(+7.61)#3,104 |
| 99. | White Oak | 18.3% | 11.5%(+6.77)#99 | 10.9%(+7.45)#3,172 |
| 100. | Hennepin | 18.3% | 11.5%(+6.75)#100 | 10.9%(+7.44)#3,184 |
Common Questions
What are the Top 10 Cities with the Highest Percentage of Population Employed in Office & Administration in Oklahoma?
Top 10 Cities with the Highest Percentage of Population Employed in Office & Administration in Oklahoma are:
What city has the Highest Percentage of Population Employed in Office & Administration in Oklahoma?
Clarita has the Highest Percentage of Population Employed in Office & Administration in Oklahoma with 58.1%.
What is the Percentage of Population Employed in Office & Administration in the State of Oklahoma?
Percentage of Population Employed in Office & Administration in Oklahoma is 11.5%.
What is the Percentage of Population Employed in Office & Administration in the United States?
Percentage of Population Employed in Office & Administration in the United States is 10.9%.