Morristown, MN
Morristown Map
Morristown Overview
912
TOTAL POPULATION
472
MALE POPULATION
440
FEMALE POPULATION
107.27
MALES / 100 FEMALES
93.22
FEMALES / 100 MALES
40.8
MEDIAN AGE
3.0
AVG FAMILY SIZE
2.3
AVG HOUSEHOLD SIZE
$35,271
PER CAPITA INCOME
$80,625
AVG FAMILY INCOME
$75,054
AVG HOUSEHOLD INCOME
21.0%
WAGE / INCOME GAP [ % ]
79.0¢/ $1
WAGE / INCOME GAP [ $ ]
0.40
INEQUALITY / GINI INDEX
563
LABOR FORCE [ PEOPLE ]
73.3%
PERCENT IN LABOR FORCE
6.7%
UNEMPLOYMENT RATE
Morristown Zip Codes
Morristown Area Codes
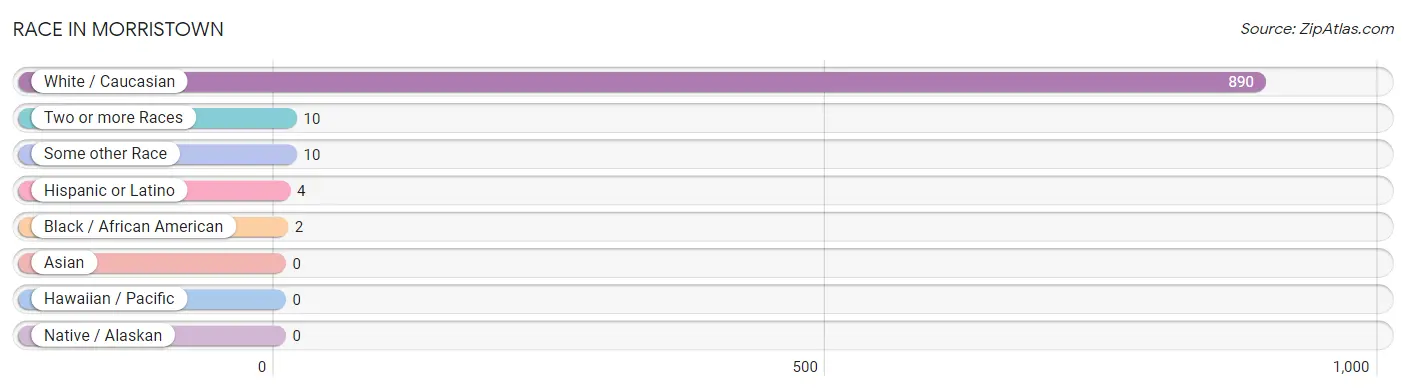
Race in Morristown
The most populous races in Morristown are White / Caucasian (890 | 97.6%), Two or more Races (10 | 1.1%), and Some other Race (10 | 1.1%).
| Race | # Population | % Population |
| Asian | 0 | 0.0% |
| Black / African American | 2 | 0.2% |
| Hawaiian / Pacific | 0 | 0.0% |
| Hispanic or Latino | 4 | 0.4% |
| Native / Alaskan | 0 | 0.0% |
| White / Caucasian | 890 | 97.6% |
| Two or more Races | 10 | 1.1% |
| Some other Race | 10 | 1.1% |
| Total | 912 | 100.0% |
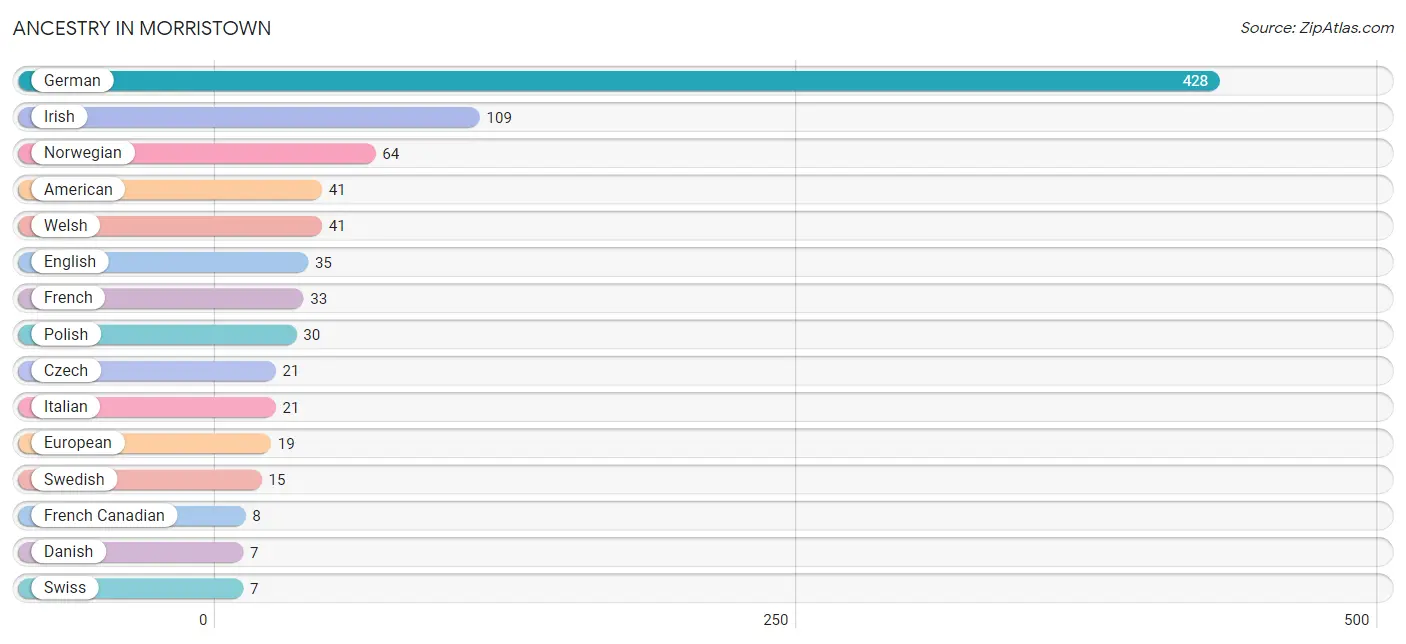
Ancestry in Morristown
The most populous ancestries reported in Morristown are German (428 | 46.9%), Irish (109 | 11.9%), Norwegian (64 | 7.0%), American (41 | 4.5%), and Welsh (41 | 4.5%), together accounting for 74.9% of all Morristown residents.
| Ancestry | # Population | % Population |
| American | 41 | 4.5% |
| Belgian | 5 | 0.5% |
| Czech | 21 | 2.3% |
| Czechoslovakian | 2 | 0.2% |
| Danish | 7 | 0.8% |
| Dutch | 2 | 0.2% |
| English | 35 | 3.8% |
| European | 19 | 2.1% |
| French | 33 | 3.6% |
| French Canadian | 8 | 0.9% |
| German | 428 | 46.9% |
| Greek | 3 | 0.3% |
| Irish | 109 | 11.9% |
| Italian | 21 | 2.3% |
| Korean | 4 | 0.4% |
| Mexican | 4 | 0.4% |
| Norwegian | 64 | 7.0% |
| Polish | 30 | 3.3% |
| Scandinavian | 3 | 0.3% |
| Scotch-Irish | 1 | 0.1% |
| Scottish | 6 | 0.7% |
| Slovene | 2 | 0.2% |
| Swedish | 15 | 1.6% |
| Swiss | 7 | 0.8% |
| Welsh | 41 | 4.5% | View All 25 Rows |
Immigrants in Morristown

| Immigration Origin | # Population | % Population | View All 0 Rows |
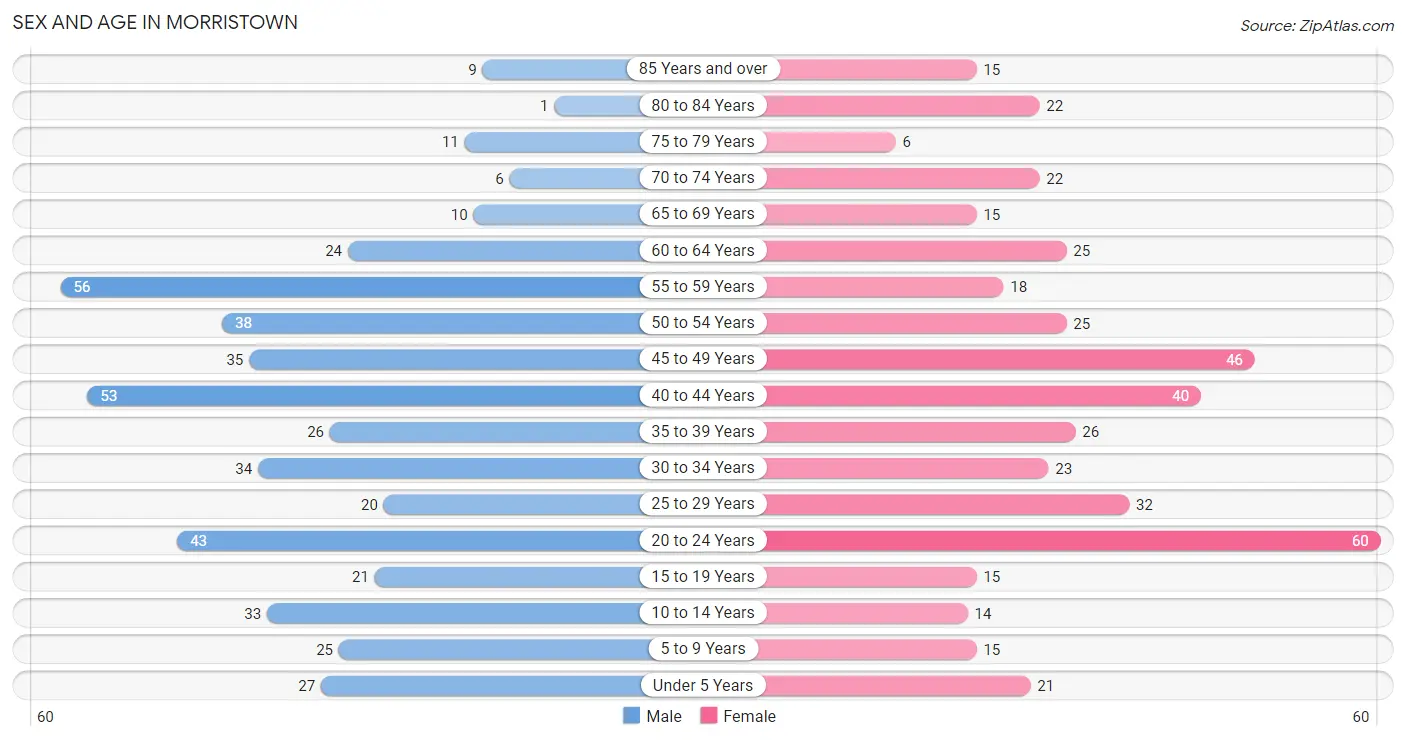
Sex and Age in Morristown
Sex and Age in Morristown
The most populous age groups in Morristown are 55 to 59 Years (56 | 11.9%) for men and 20 to 24 Years (60 | 13.6%) for women.
| Age Bracket | Male | Female |
| Under 5 Years | 27 (5.7%) | 21 (4.8%) |
| 5 to 9 Years | 25 (5.3%) | 15 (3.4%) |
| 10 to 14 Years | 33 (7.0%) | 14 (3.2%) |
| 15 to 19 Years | 21 (4.4%) | 15 (3.4%) |
| 20 to 24 Years | 43 (9.1%) | 60 (13.6%) |
| 25 to 29 Years | 20 (4.2%) | 32 (7.3%) |
| 30 to 34 Years | 34 (7.2%) | 23 (5.2%) |
| 35 to 39 Years | 26 (5.5%) | 26 (5.9%) |
| 40 to 44 Years | 53 (11.2%) | 40 (9.1%) |
| 45 to 49 Years | 35 (7.4%) | 46 (10.4%) |
| 50 to 54 Years | 38 (8.1%) | 25 (5.7%) |
| 55 to 59 Years | 56 (11.9%) | 18 (4.1%) |
| 60 to 64 Years | 24 (5.1%) | 25 (5.7%) |
| 65 to 69 Years | 10 (2.1%) | 15 (3.4%) |
| 70 to 74 Years | 6 (1.3%) | 22 (5.0%) |
| 75 to 79 Years | 11 (2.3%) | 6 (1.4%) |
| 80 to 84 Years | 1 (0.2%) | 22 (5.0%) |
| 85 Years and over | 9 (1.9%) | 15 (3.4%) |
| Total | 472 (100.0%) | 440 (100.0%) |
Families and Households in Morristown
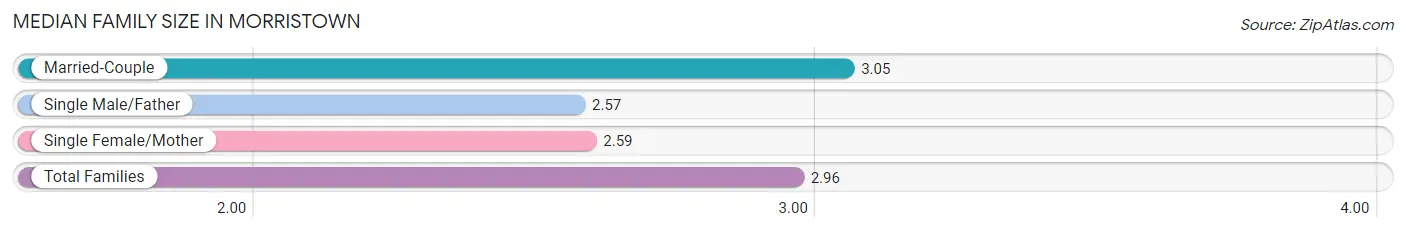
Median Family Size in Morristown
The median family size in Morristown is 2.96 persons per family, with married-couple families (169 | 80.5%) accounting for the largest median family size of 3.05 persons per family. On the other hand, single male/father families (7 | 3.3%) represent the smallest median family size with 2.57 persons per family.
| Family Type | # Families | Family Size |
| Married-Couple | 169 (80.5%) | 3.05 |
| Single Male/Father | 7 (3.3%) | 2.57 |
| Single Female/Mother | 34 (16.2%) | 2.59 |
| Total Families | 210 (100.0%) | 2.96 |
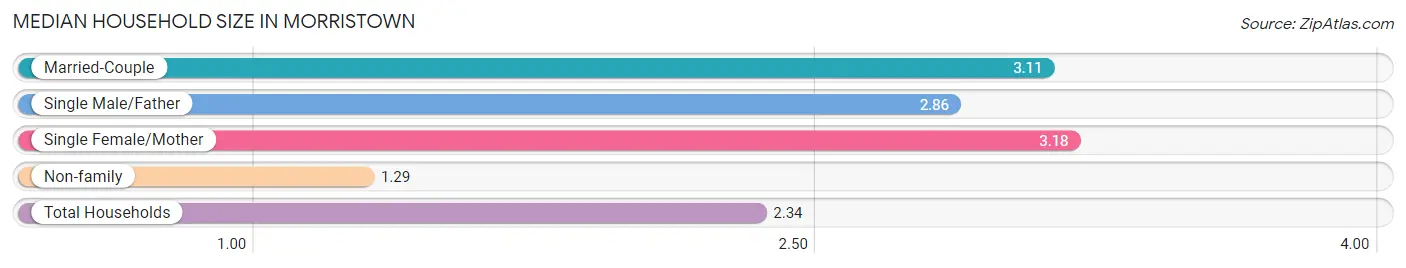
Median Household Size in Morristown
The median household size in Morristown is 2.34 persons per household, with single female/mother households (34 | 9.4%) accounting for the largest median household size of 3.18 persons per household. non-family households (153 | 42.1%) represent the smallest median household size with 1.29 persons per household.
| Household Type | # Households | Household Size |
| Married-Couple | 169 (46.6%) | 3.11 |
| Single Male/Father | 7 (1.9%) | 2.86 |
| Single Female/Mother | 34 (9.4%) | 3.18 |
| Non-family | 153 (42.1%) | 1.29 |
| Total Households | 363 (100.0%) | 2.34 |
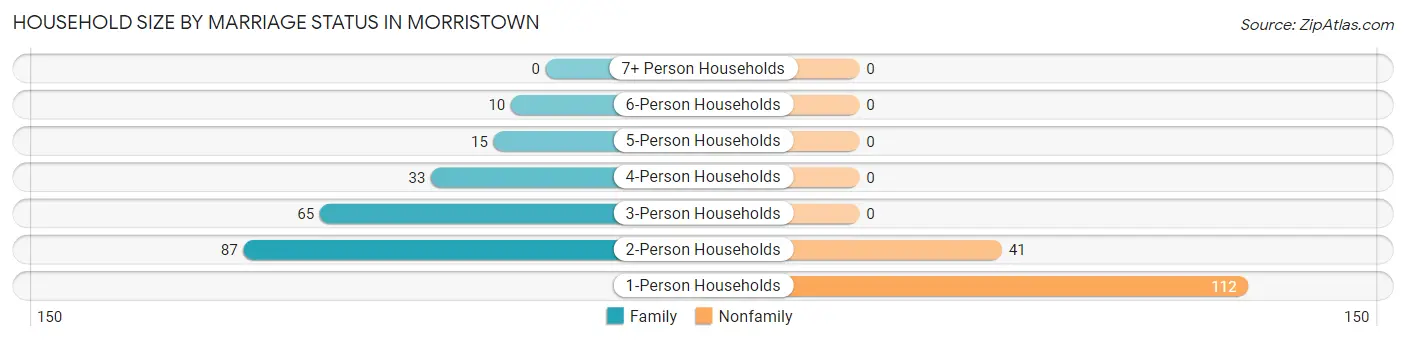
Household Size by Marriage Status in Morristown
Out of a total of 363 households in Morristown, 210 (57.9%) are family households, while 153 (42.1%) are nonfamily households. The most numerous type of family households are 2-person households, comprising 87, and the most common type of nonfamily households are 1-person households, comprising 112.
| Household Size | Family Households | Nonfamily Households |
| 1-Person Households | - | 112 (30.8%) |
| 2-Person Households | 87 (24.0%) | 41 (11.3%) |
| 3-Person Households | 65 (17.9%) | 0 (0.0%) |
| 4-Person Households | 33 (9.1%) | 0 (0.0%) |
| 5-Person Households | 15 (4.1%) | 0 (0.0%) |
| 6-Person Households | 10 (2.8%) | 0 (0.0%) |
| 7+ Person Households | 0 (0.0%) | 0 (0.0%) |
| Total | 210 (57.9%) | 153 (42.1%) |
Female Fertility in Morristown
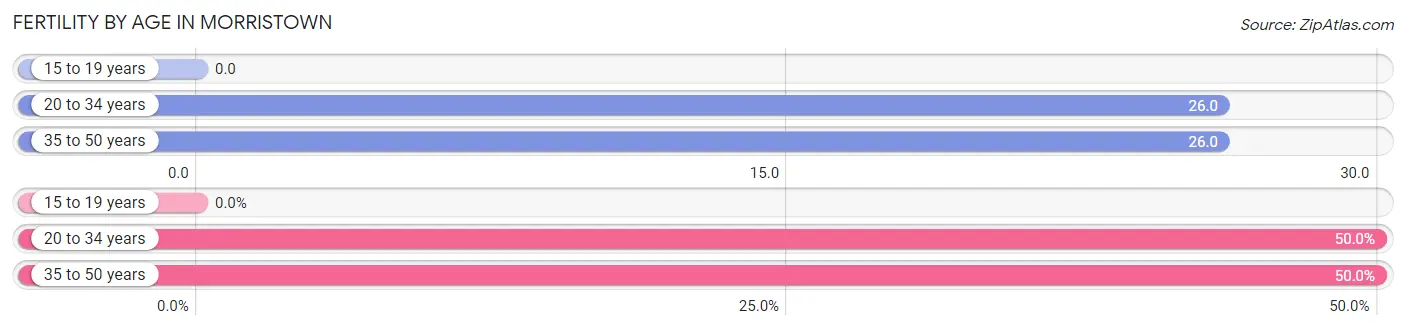
Fertility by Age in Morristown
Average fertility rate in Morristown is 25.0 births per 1,000 women. Women in the age bracket of 20 to 34 years have the highest fertility rate with 26.0 births per 1,000 women. Women in the age bracket of 20 to 34 years acount for 50.0% of all women with births.
| Age Bracket | Women with Births | Births / 1,000 Women |
| 15 to 19 years | 0 (0.0%) | 0.0 |
| 20 to 34 years | 3 (50.0%) | 26.0 |
| 35 to 50 years | 3 (50.0%) | 26.0 |
| Total | 6 (100.0%) | 25.0 |
Fertility by Age by Marriage Status in Morristown
50.0% of women with births (6) in Morristown are married. The highest percentage of unmarried women with births falls into 20 to 34 years age bracket with 100.0% of them unmarried at the time of birth, while the lowest percentage of unmarried women with births belong to 35 to 50 years age bracket with 0.0% of them unmarried.
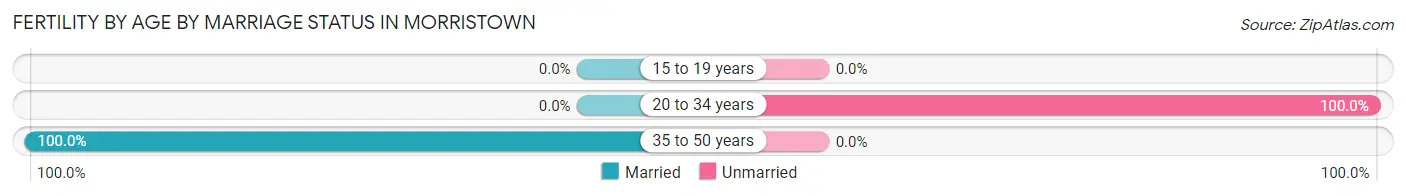
| Age Bracket | Married | Unmarried |
| 15 to 19 years | 0 (0.0%) | 0 (0.0%) |
| 20 to 34 years | 0 (0.0%) | 3 (100.0%) |
| 35 to 50 years | 3 (100.0%) | 0 (0.0%) |
| Total | 3 (50.0%) | 3 (50.0%) |
Fertility by Education in Morristown
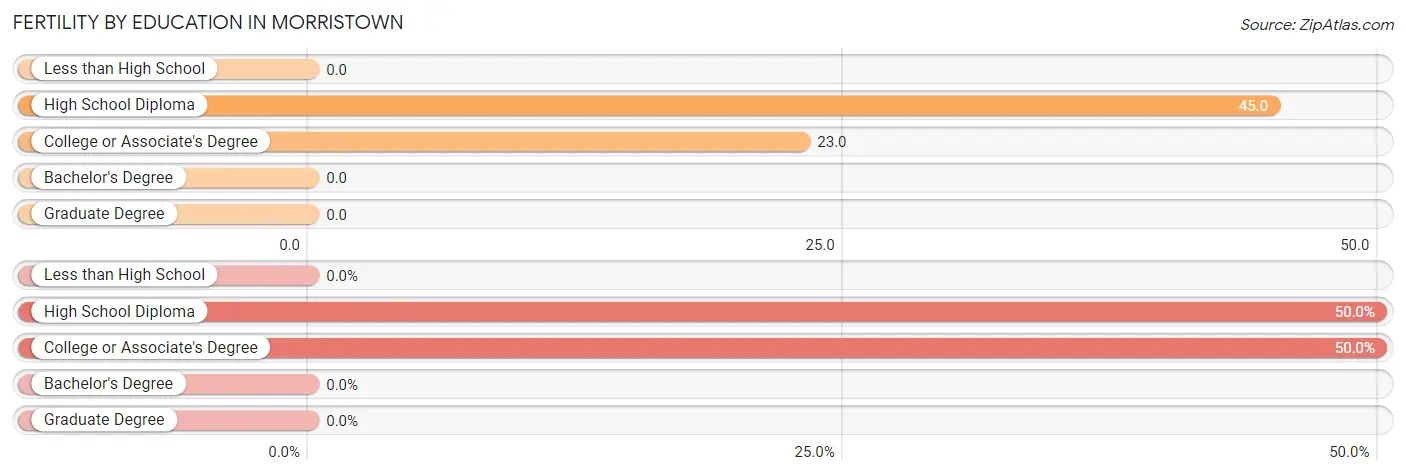
| Educational Attainment | Women with Births | Births / 1,000 Women |
| Less than High School | 0 (0.0%) | 0.0 |
| High School Diploma | 3 (50.0%) | 45.0 |
| College or Associate's Degree | 3 (50.0%) | 23.0 |
| Bachelor's Degree | 0 (0.0%) | 0.0 |
| Graduate Degree | 0 (0.0%) | 0.0 |
| Total | 6 (100.0%) | 25.0 |
Fertility by Education by Marriage Status in Morristown
50.0% of women with births in Morristown are unmarried. Women with the educational attainment of college or associate's degree are most likely to be married with 100.0% of them married at childbirth, while women with the educational attainment of high school diploma are least likely to be married with 100.0% of them unmarried at childbirth.
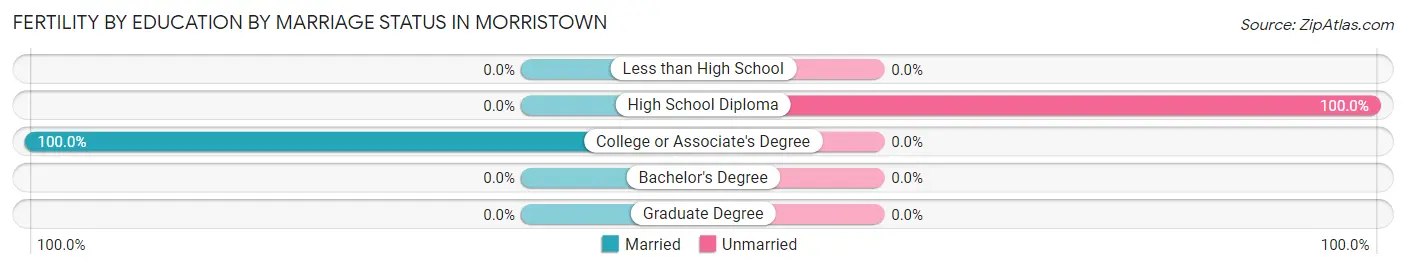
| Educational Attainment | Married | Unmarried |
| Less than High School | 0 (0.0%) | 0 (0.0%) |
| High School Diploma | 0 (0.0%) | 3 (100.0%) |
| College or Associate's Degree | 3 (100.0%) | 0 (0.0%) |
| Bachelor's Degree | 0 (0.0%) | 0 (0.0%) |
| Graduate Degree | 0 (0.0%) | 0 (0.0%) |
| Total | 3 (50.0%) | 3 (50.0%) |
Income in Morristown
Income Overview in Morristown
Per Capita Income in Morristown is $35,271, while median incomes of families and households are $80,625 and $75,054 respectively.
| Characteristic | Number | Measure |
| Per Capita Income | 912 | $35,271 |
| Median Family Income | 210 | $80,625 |
| Mean Family Income | 210 | $99,262 |
| Median Household Income | 363 | $75,054 |
| Mean Household Income | 363 | $82,792 |
| Income Deficit | 210 | $0 |
| Wage / Income Gap (%) | 912 | 21.02% |
| Wage / Income Gap ($) | 912 | 78.98¢ per $1 |
| Gini / Inequality Index | 912 | 0.40 |
Earnings by Sex in Morristown
Average Earnings in Morristown are $38,370, $45,547 for men and $35,975 for women, a difference of 21.0%.
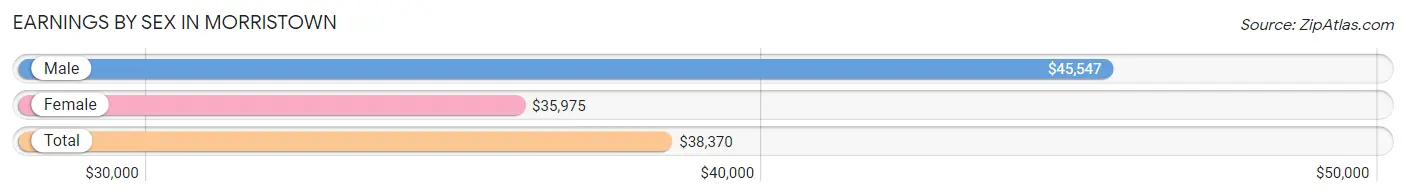
| Sex | Number | Average Earnings |
| Male | 299 (52.6%) | $45,547 |
| Female | 269 (47.4%) | $35,975 |
| Total | 568 (100.0%) | $38,370 |
Earnings by Sex by Income Bracket in Morristown
The most common earnings brackets in Morristown are $75,000 to $99,999 for men (43 | 14.4%) and $35,000 to $39,999 for women (50 | 18.6%).
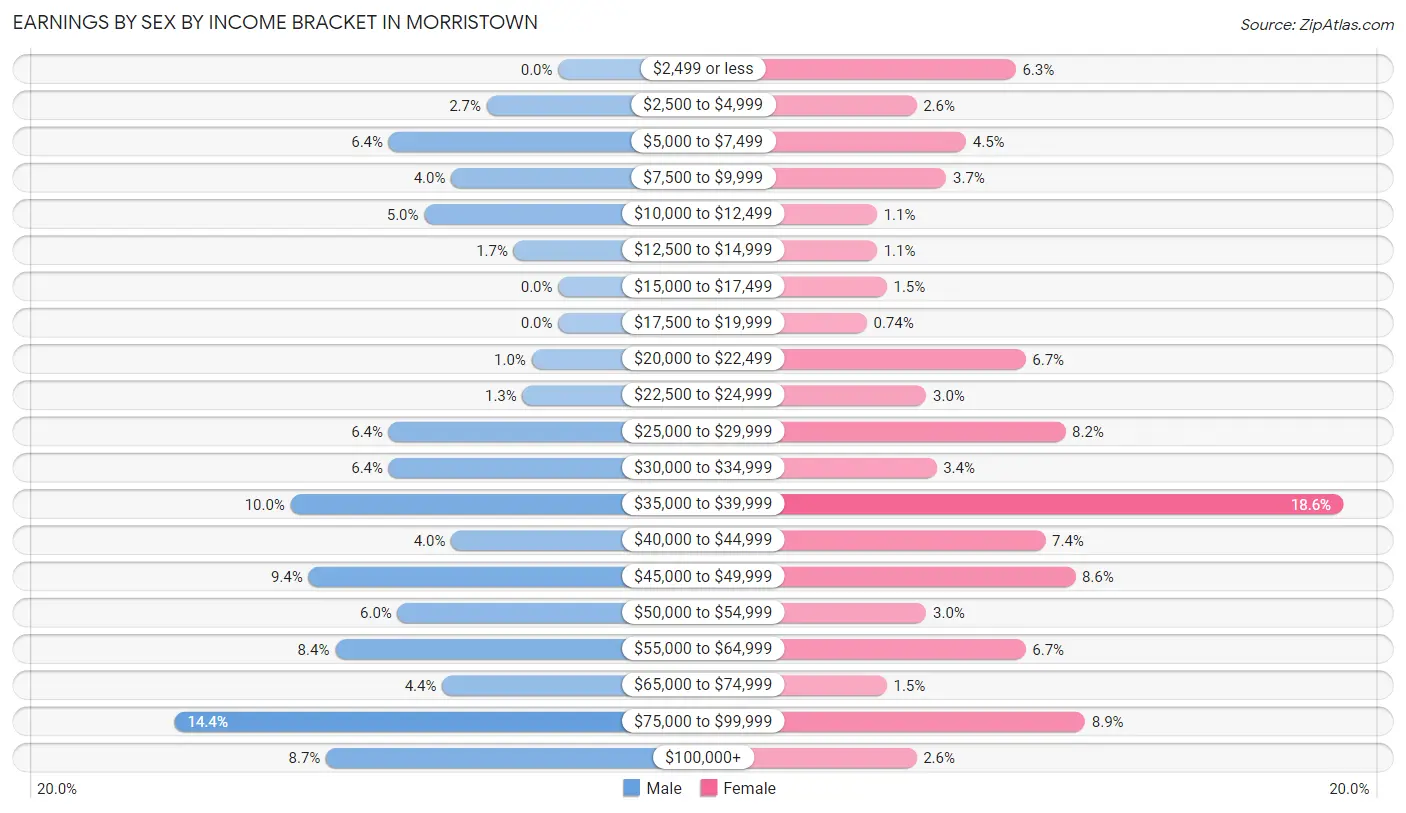
| Income | Male | Female |
| $2,499 or less | 0 (0.0%) | 17 (6.3%) |
| $2,500 to $4,999 | 8 (2.7%) | 7 (2.6%) |
| $5,000 to $7,499 | 19 (6.4%) | 12 (4.5%) |
| $7,500 to $9,999 | 12 (4.0%) | 10 (3.7%) |
| $10,000 to $12,499 | 15 (5.0%) | 3 (1.1%) |
| $12,500 to $14,999 | 5 (1.7%) | 3 (1.1%) |
| $15,000 to $17,499 | 0 (0.0%) | 4 (1.5%) |
| $17,500 to $19,999 | 0 (0.0%) | 2 (0.7%) |
| $20,000 to $22,499 | 3 (1.0%) | 18 (6.7%) |
| $22,500 to $24,999 | 4 (1.3%) | 8 (3.0%) |
| $25,000 to $29,999 | 19 (6.4%) | 22 (8.2%) |
| $30,000 to $34,999 | 19 (6.4%) | 9 (3.4%) |
| $35,000 to $39,999 | 30 (10.0%) | 50 (18.6%) |
| $40,000 to $44,999 | 12 (4.0%) | 20 (7.4%) |
| $45,000 to $49,999 | 28 (9.4%) | 23 (8.6%) |
| $50,000 to $54,999 | 18 (6.0%) | 8 (3.0%) |
| $55,000 to $64,999 | 25 (8.4%) | 18 (6.7%) |
| $65,000 to $74,999 | 13 (4.3%) | 4 (1.5%) |
| $75,000 to $99,999 | 43 (14.4%) | 24 (8.9%) |
| $100,000+ | 26 (8.7%) | 7 (2.6%) |
| Total | 299 (100.0%) | 269 (100.0%) |
Earnings by Sex by Educational Attainment in Morristown
Average earnings in Morristown are $50,000 for men and $40,375 for women, a difference of 19.3%. Men with an educational attainment of college or associate's degree enjoy the highest average annual earnings of $54,167, while those with less than high school education earn the least with $32,679. Women with an educational attainment of college or associate's degree earn the most with the average annual earnings of $40,833, while those with high school diploma education have the smallest earnings of $40,625.
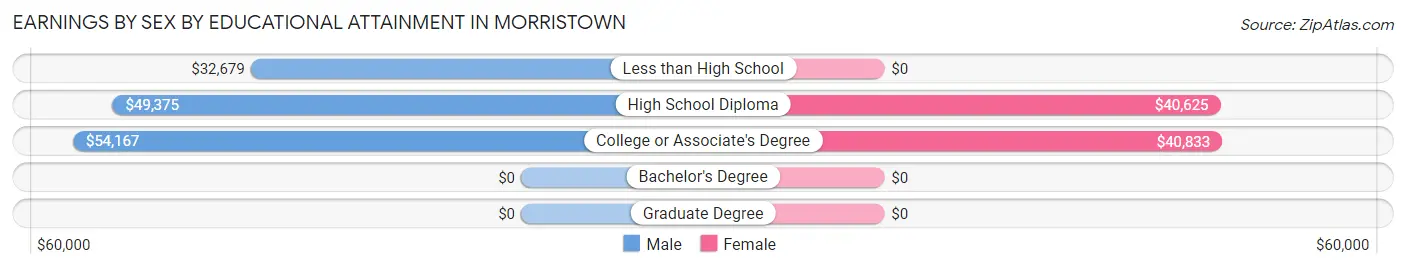
| Educational Attainment | Male Income | Female Income |
| Less than High School | $32,679 | $0 |
| High School Diploma | $49,375 | $40,625 |
| College or Associate's Degree | $54,167 | $40,833 |
| Bachelor's Degree | - | - |
| Graduate Degree | - | - |
| Total | $50,000 | $40,375 |
Family Income in Morristown
Family Income Brackets in Morristown
According to the Morristown family income data, there are 46 families falling into the $100,000 to $149,999 income range, which is the most common income bracket and makes up 21.9% of all families.
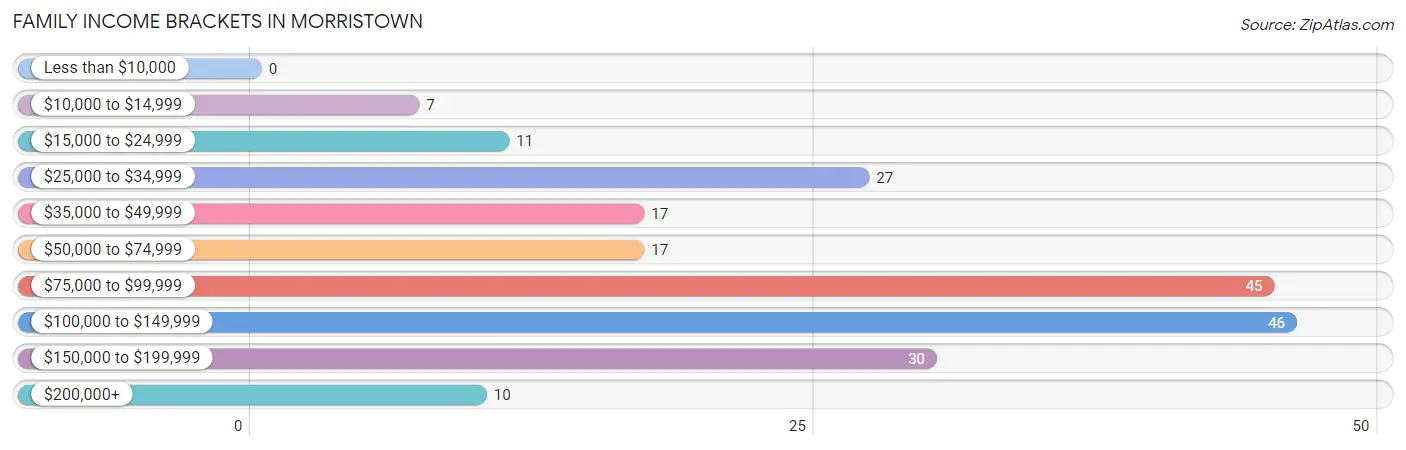
| Income Bracket | # Families | % Families |
| Less than $10,000 | 0 | 0.0% |
| $10,000 to $14,999 | 7 | 3.3% |
| $15,000 to $24,999 | 11 | 5.2% |
| $25,000 to $34,999 | 27 | 12.9% |
| $35,000 to $49,999 | 17 | 8.1% |
| $50,000 to $74,999 | 17 | 8.1% |
| $75,000 to $99,999 | 45 | 21.4% |
| $100,000 to $149,999 | 46 | 21.9% |
| $150,000 to $199,999 | 30 | 14.3% |
| $200,000+ | 10 | 4.8% |
Family Income by Famaliy Size in Morristown
3-person families (58 | 27.6%) account for the highest median family income in Morristown with $132,500 per family, while 3-person families (58 | 27.6%) have the highest median income of $44,167 per family member.
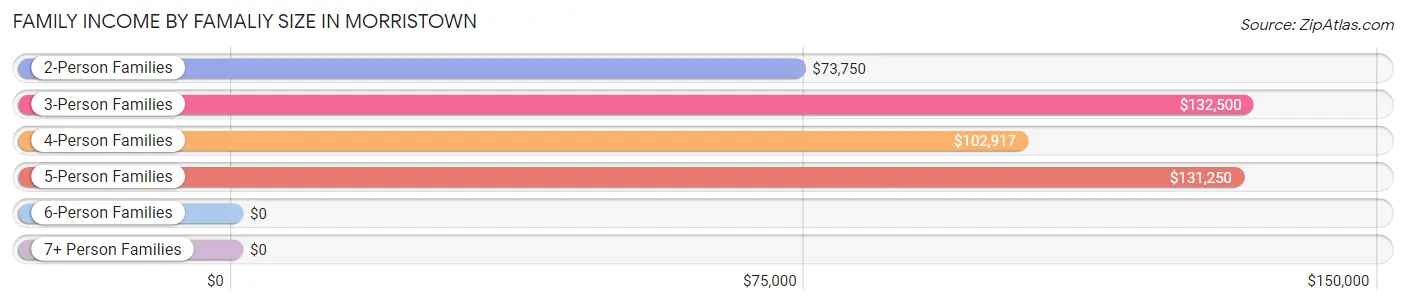
| Income Bracket | # Families | Median Income |
| 2-Person Families | 102 (48.6%) | $73,750 |
| 3-Person Families | 58 (27.6%) | $132,500 |
| 4-Person Families | 31 (14.8%) | $102,917 |
| 5-Person Families | 12 (5.7%) | $131,250 |
| 6-Person Families | 7 (3.3%) | $0 |
| 7+ Person Families | 0 (0.0%) | $0 |
| Total | 210 (100.0%) | $80,625 |
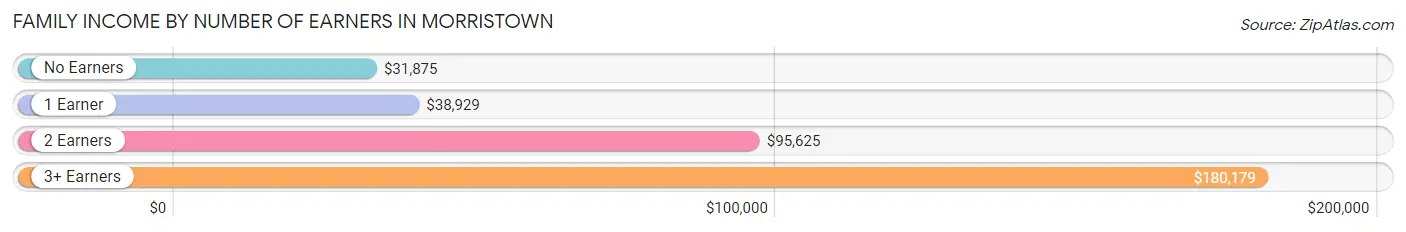
Family Income by Number of Earners in Morristown
The median family income in Morristown is $80,625, with families comprising 3+ earners (35) having the highest median family income of $180,179, while families with no earners (21) have the lowest median family income of $31,875, accounting for 16.7% and 10.0% of families, respectively.
| Number of Earners | # Families | Median Income |
| No Earners | 21 (10.0%) | $31,875 |
| 1 Earner | 50 (23.8%) | $38,929 |
| 2 Earners | 104 (49.5%) | $95,625 |
| 3+ Earners | 35 (16.7%) | $180,179 |
| Total | 210 (100.0%) | $80,625 |
Household Income in Morristown
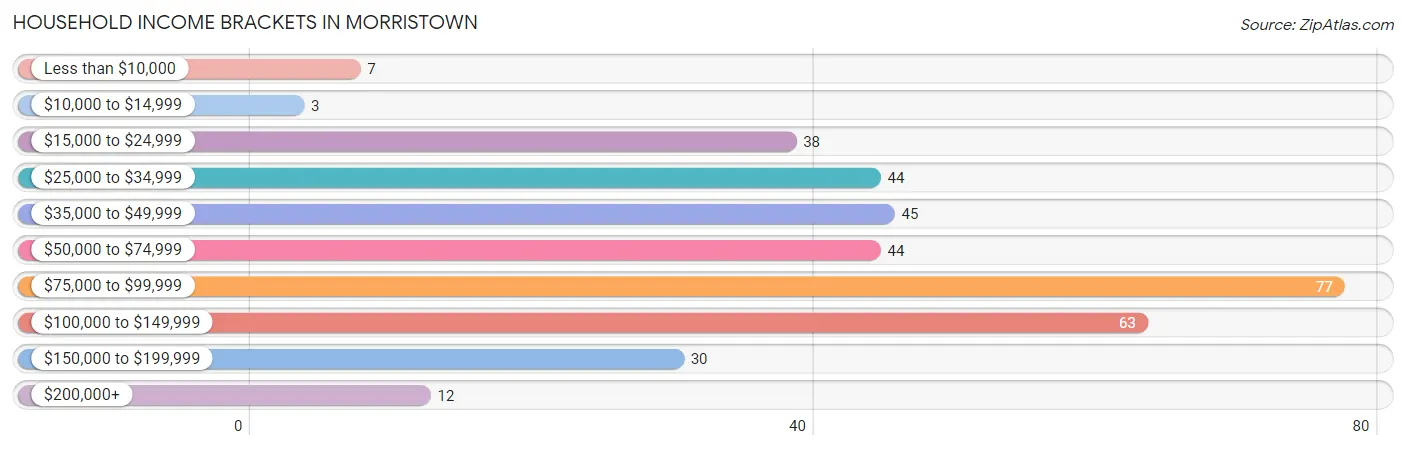
Household Income Brackets in Morristown
With 77 households falling in the category, the $75,000 to $99,999 income range is the most frequent in Morristown, accounting for 21.2% of all households. In contrast, only 3 households (0.8%) fall into the $10,000 to $14,999 income bracket, making it the least populous group.
| Income Bracket | # Households | % Households |
| Less than $10,000 | 7 | 1.9% |
| $10,000 to $14,999 | 3 | 0.8% |
| $15,000 to $24,999 | 38 | 10.5% |
| $25,000 to $34,999 | 44 | 12.1% |
| $35,000 to $49,999 | 45 | 12.4% |
| $50,000 to $74,999 | 44 | 12.1% |
| $75,000 to $99,999 | 77 | 21.2% |
| $100,000 to $149,999 | 63 | 17.4% |
| $150,000 to $199,999 | 30 | 8.3% |
| $200,000+ | 12 | 3.3% |
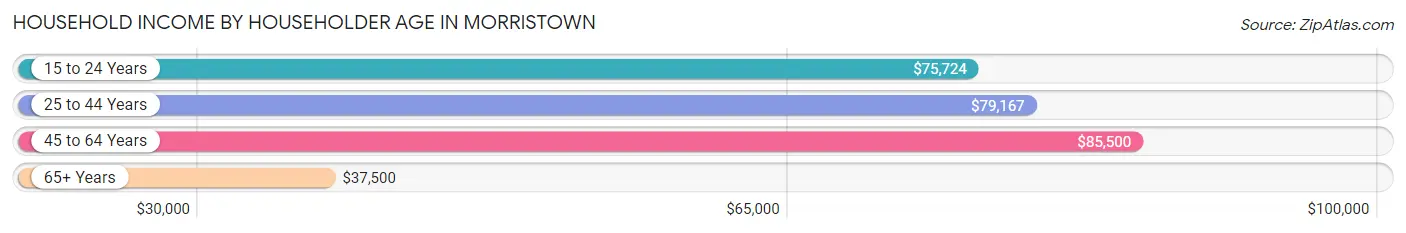
Household Income by Householder Age in Morristown
The median household income in Morristown is $75,054, with the highest median household income of $85,500 found in the 45 to 64 years age bracket for the primary householder. A total of 154 households (42.4%) fall into this category. Meanwhile, the 65+ years age bracket for the primary householder has the lowest median household income of $37,500, with 54 households (14.9%) in this group.
| Income Bracket | # Households | Median Income |
| 15 to 24 Years | 31 (8.5%) | $75,724 |
| 25 to 44 Years | 124 (34.2%) | $79,167 |
| 45 to 64 Years | 154 (42.4%) | $85,500 |
| 65+ Years | 54 (14.9%) | $37,500 |
| Total | 363 (100.0%) | $75,054 |
Poverty in Morristown
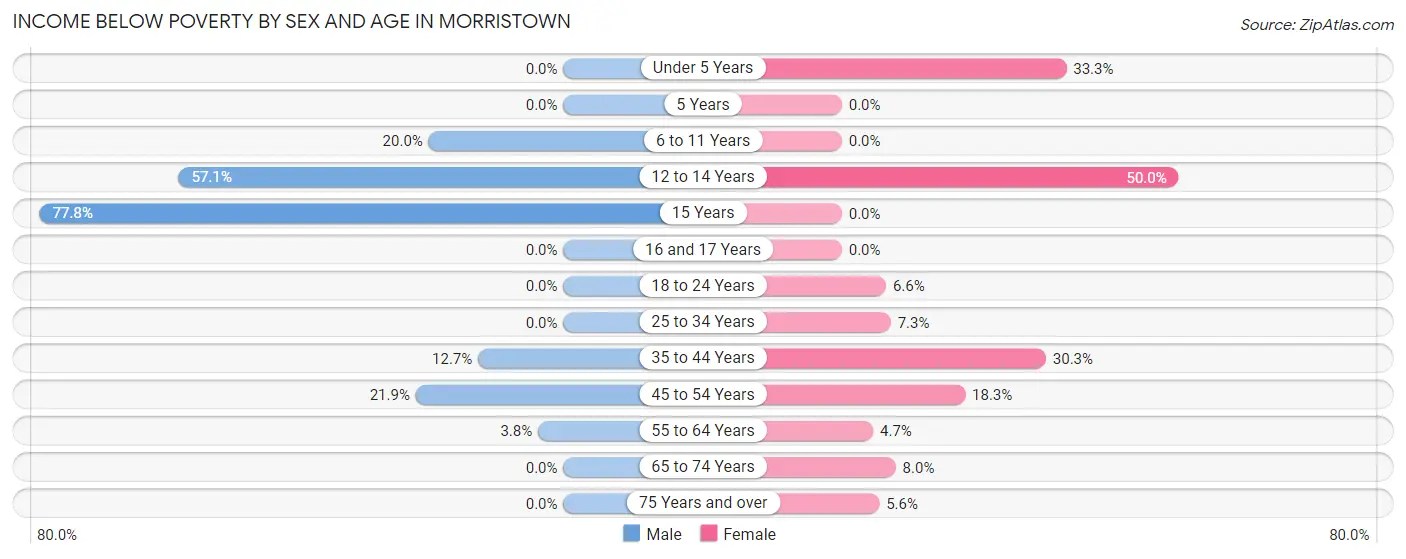
Income Below Poverty by Sex and Age in Morristown
With 11.5% poverty level for males and 14.9% for females among the residents of Morristown, 15 year old males and 12 to 14 year old females are the most vulnerable to poverty, with 7 males (77.8%) and 7 females (50.0%) in their respective age groups living below the poverty level.
| Age Bracket | Male | Female |
| Under 5 Years | 0 (0.0%) | 7 (33.3%) |
| 5 Years | 0 (0.0%) | 0 (0.0%) |
| 6 to 11 Years | 6 (20.0%) | 0 (0.0%) |
| 12 to 14 Years | 12 (57.1%) | 7 (50.0%) |
| 15 Years | 7 (77.8%) | 0 (0.0%) |
| 16 and 17 Years | 0 (0.0%) | 0 (0.0%) |
| 18 to 24 Years | 0 (0.0%) | 4 (6.6%) |
| 25 to 34 Years | 0 (0.0%) | 4 (7.3%) |
| 35 to 44 Years | 10 (12.7%) | 20 (30.3%) |
| 45 to 54 Years | 16 (21.9%) | 13 (18.3%) |
| 55 to 64 Years | 3 (3.7%) | 2 (4.6%) |
| 65 to 74 Years | 0 (0.0%) | 2 (8.0%) |
| 75 Years and over | 0 (0.0%) | 1 (5.6%) |
| Total | 54 (11.5%) | 60 (14.9%) |
Income Above Poverty by Sex and Age in Morristown
According to the poverty statistics in Morristown, males aged under 5 years and females aged 5 years are the age groups that are most secure financially, with 100.0% of males and 100.0% of females in these age groups living above the poverty line.
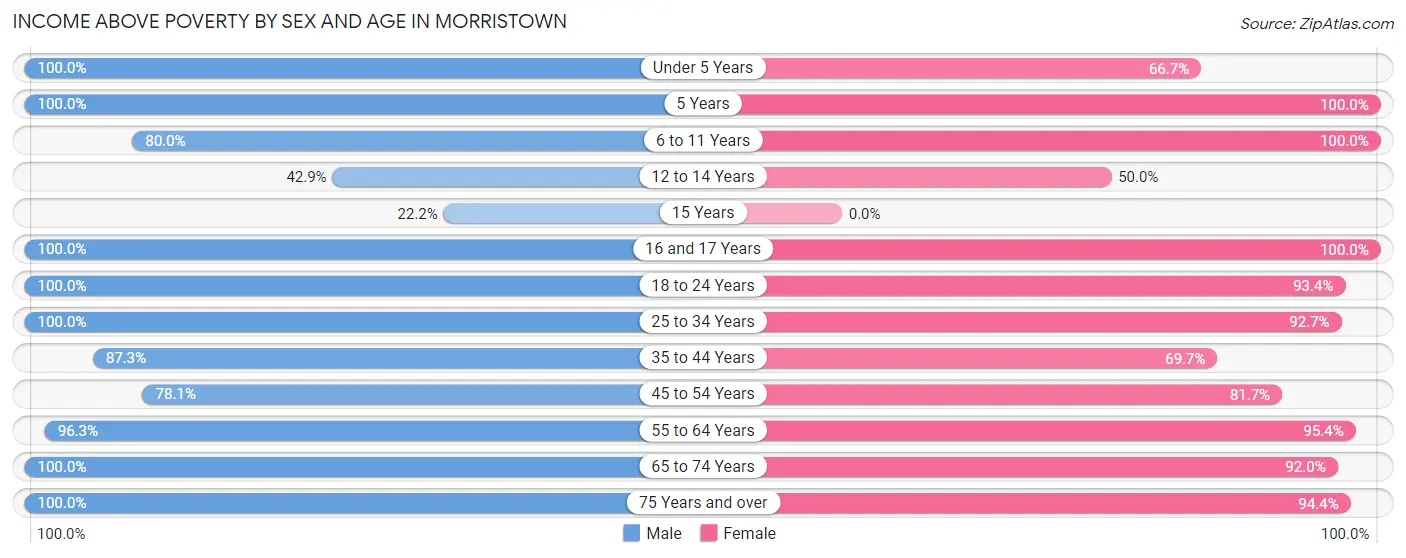
| Age Bracket | Male | Female |
| Under 5 Years | 23 (100.0%) | 14 (66.7%) |
| 5 Years | 7 (100.0%) | 8 (100.0%) |
| 6 to 11 Years | 24 (80.0%) | 7 (100.0%) |
| 12 to 14 Years | 9 (42.9%) | 7 (50.0%) |
| 15 Years | 2 (22.2%) | 0 (0.0%) |
| 16 and 17 Years | 6 (100.0%) | 14 (100.0%) |
| 18 to 24 Years | 49 (100.0%) | 57 (93.4%) |
| 25 to 34 Years | 54 (100.0%) | 51 (92.7%) |
| 35 to 44 Years | 69 (87.3%) | 46 (69.7%) |
| 45 to 54 Years | 57 (78.1%) | 58 (81.7%) |
| 55 to 64 Years | 77 (96.3%) | 41 (95.4%) |
| 65 to 74 Years | 16 (100.0%) | 23 (92.0%) |
| 75 Years and over | 21 (100.0%) | 17 (94.4%) |
| Total | 414 (88.5%) | 343 (85.1%) |
Income Below Poverty Among Married-Couple Families in Morristown
The poverty statistics for married-couple families in Morristown show that 5.9% or 10 of the total 169 families live below the poverty line. Families with 3 or 4 children have the highest poverty rate of 36.8%, comprising of 7 families. On the other hand, families with no children have the lowest poverty rate of 0.0%, which includes 0 families.
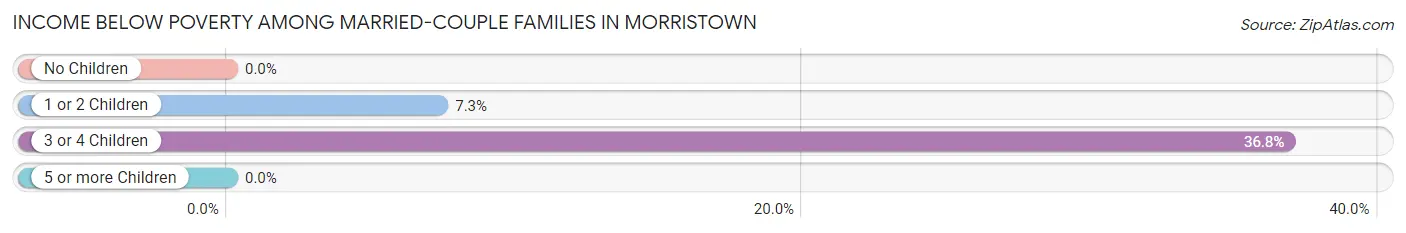
| Children | Above Poverty | Below Poverty |
| No Children | 109 (100.0%) | 0 (0.0%) |
| 1 or 2 Children | 38 (92.7%) | 3 (7.3%) |
| 3 or 4 Children | 12 (63.2%) | 7 (36.8%) |
| 5 or more Children | 0 (0.0%) | 0 (0.0%) |
| Total | 159 (94.1%) | 10 (5.9%) |
Income Below Poverty Among Single-Parent Households in Morristown
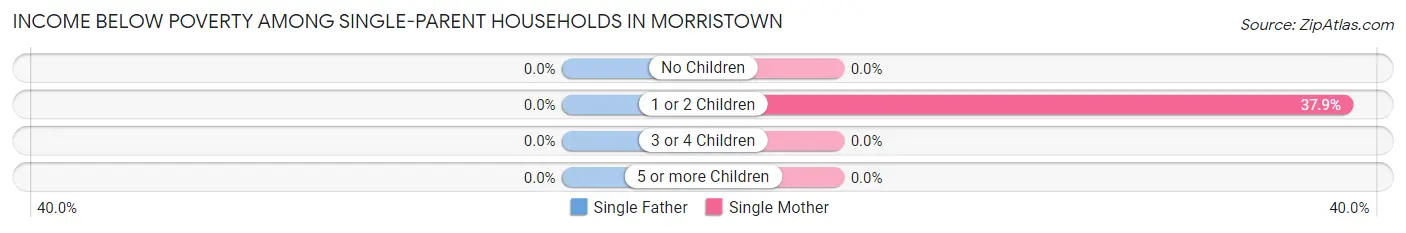
| Children | Single Father | Single Mother |
| No Children | 0 (0.0%) | 0 (0.0%) |
| 1 or 2 Children | 0 (0.0%) | 11 (37.9%) |
| 3 or 4 Children | 0 (0.0%) | 0 (0.0%) |
| 5 or more Children | 0 (0.0%) | 0 (0.0%) |
| Total | 0 (0.0%) | 11 (32.4%) |
Income Below Poverty Among Married-Couple vs Single-Parent Households in Morristown
The poverty data for Morristown shows that 10 of the married-couple family households (5.9%) and 11 of the single-parent households (26.8%) are living below the poverty level. Within the married-couple family households, those with 3 or 4 children have the highest poverty rate, with 7 households (36.8%) falling below the poverty line. Among the single-parent households, those with 1 or 2 children have the highest poverty rate, with 11 household (30.6%) living below poverty.
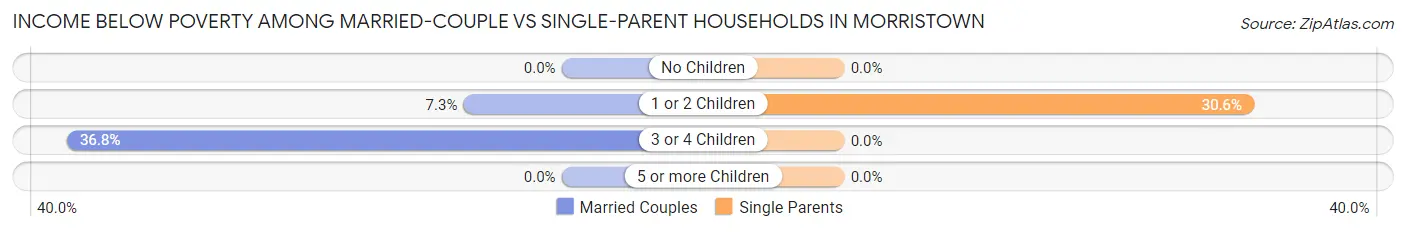
| Children | Married-Couple Families | Single-Parent Households |
| No Children | 0 (0.0%) | 0 (0.0%) |
| 1 or 2 Children | 3 (7.3%) | 11 (30.6%) |
| 3 or 4 Children | 7 (36.8%) | 0 (0.0%) |
| 5 or more Children | 0 (0.0%) | 0 (0.0%) |
| Total | 10 (5.9%) | 11 (26.8%) |
Employment Characteristics in Morristown
Employment by Class of Employer in Morristown
Among the 519 employed individuals in Morristown, private company employees (415 | 80.0%), local government employees (36 | 6.9%), and not-for-profit organizations (28 | 5.4%) make up the most common classes of employment.
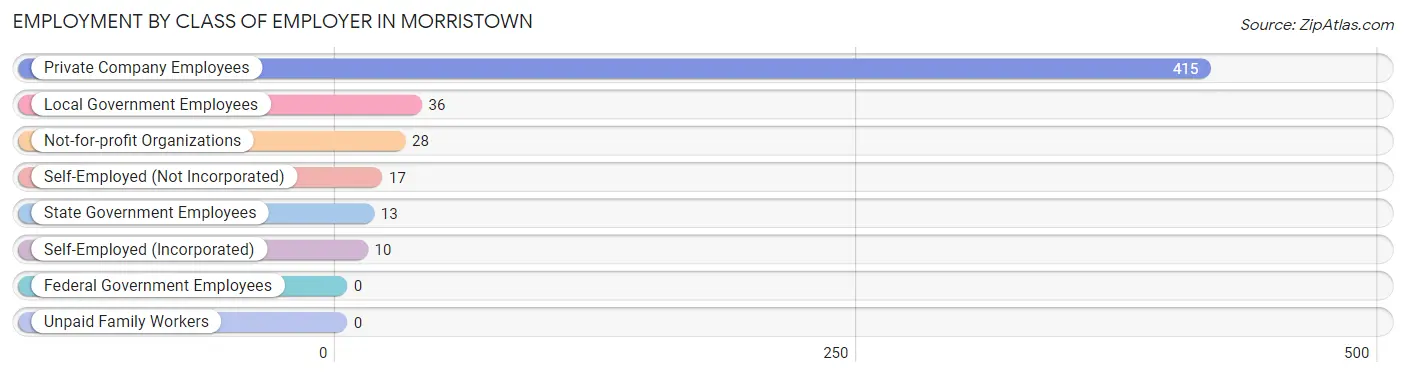
| Employer Class | # Employees | % Employees |
| Private Company Employees | 415 | 80.0% |
| Self-Employed (Incorporated) | 10 | 1.9% |
| Self-Employed (Not Incorporated) | 17 | 3.3% |
| Not-for-profit Organizations | 28 | 5.4% |
| Local Government Employees | 36 | 6.9% |
| State Government Employees | 13 | 2.5% |
| Federal Government Employees | 0 | 0.0% |
| Unpaid Family Workers | 0 | 0.0% |
| Total | 519 | 100.0% |
Employment Status by Age in Morristown
According to the labor force statistics for Morristown, out of the total population over 16 years of age (768), 73.3% or 563 individuals are in the labor force, with 6.7% or 38 of them unemployed. The age group with the highest labor force participation rate is 25 to 29 years, with 100.0% or 52 individuals in the labor force. Within the labor force, the 60 to 64 years age range has the highest percentage of unemployed individuals, with 43.8% or 7 of them being unemployed.
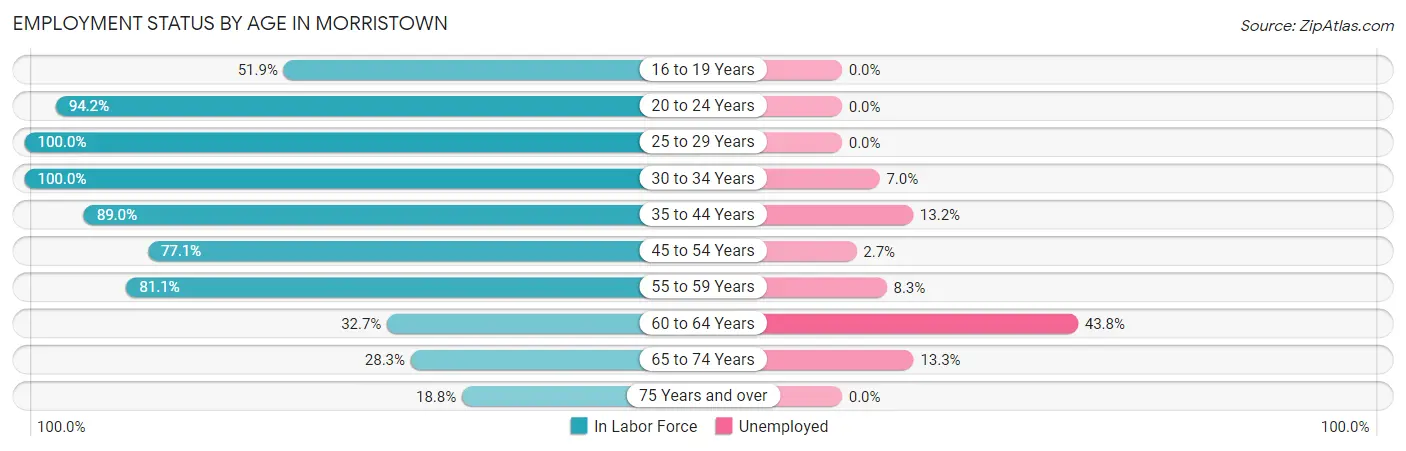
| Age Bracket | In Labor Force | Unemployed |
| 16 to 19 Years | 14 (51.9%) | 0 (0.0%) |
| 20 to 24 Years | 97 (94.2%) | 0 (0.0%) |
| 25 to 29 Years | 52 (100.0%) | 0 (0.0%) |
| 30 to 34 Years | 57 (100.0%) | 4 (7.0%) |
| 35 to 44 Years | 129 (89.0%) | 17 (13.2%) |
| 45 to 54 Years | 111 (77.1%) | 3 (2.7%) |
| 55 to 59 Years | 60 (81.1%) | 5 (8.3%) |
| 60 to 64 Years | 16 (32.7%) | 7 (43.8%) |
| 65 to 74 Years | 15 (28.3%) | 2 (13.3%) |
| 75 Years and over | 12 (18.8%) | 0 (0.0%) |
| Total | 563 (73.3%) | 38 (6.7%) |
Employment Status by Educational Attainment in Morristown
According to labor force statistics for Morristown, 81.6% of individuals (425) out of the total population between 25 and 64 years of age (521) are in the labor force, with 8.5% or 36 of them being unemployed. The group with the highest labor force participation rate are those with the educational attainment of bachelor's degree or higher, with 100.0% or 60 individuals in the labor force. Within the labor force, individuals with less than high school education have the highest percentage of unemployment, with 39.3% or 11 of them being unemployed.
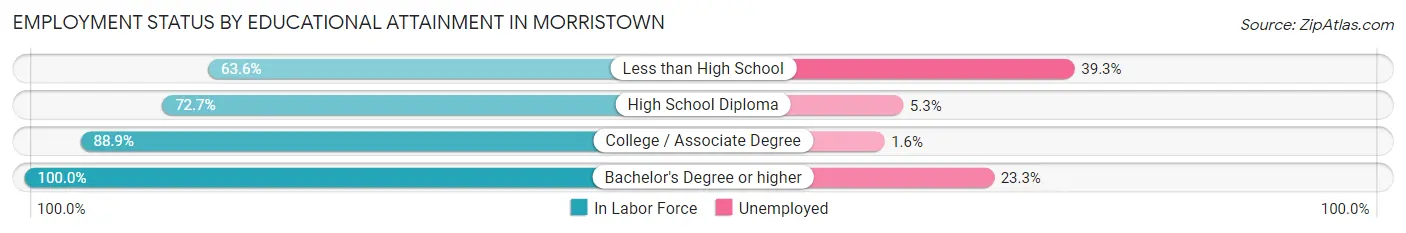
| Educational Attainment | In Labor Force | Unemployed |
| Less than High School | 28 (63.6%) | 17 (39.3%) |
| High School Diploma | 152 (72.7%) | 11 (5.3%) |
| College / Associate Degree | 185 (88.9%) | 3 (1.6%) |
| Bachelor's Degree or higher | 60 (100.0%) | 14 (23.3%) |
| Total | 425 (81.6%) | 44 (8.5%) |
Employment Occupations by Sex in Morristown
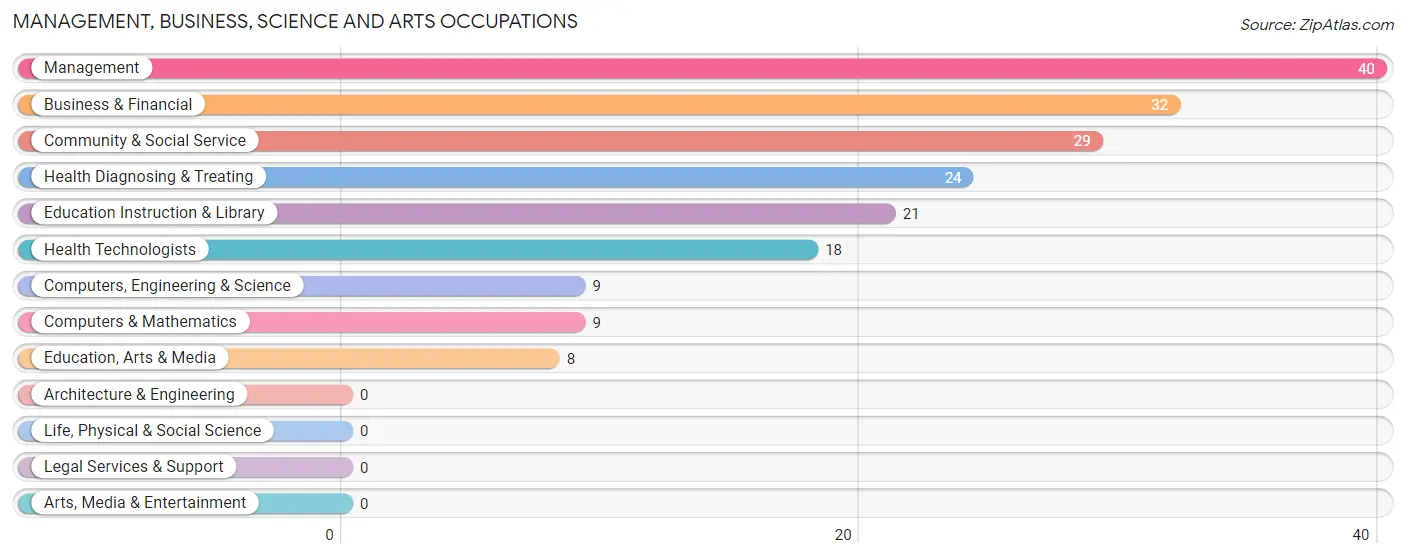
Management, Business, Science and Arts Occupations
The most common Management, Business, Science and Arts occupations in Morristown are Management (40 | 7.6%), Business & Financial (32 | 6.1%), Community & Social Service (29 | 5.5%), Health Diagnosing & Treating (24 | 4.6%), and Education Instruction & Library (21 | 4.0%).
Management, Business, Science and Arts Occupations by Sex
Within the Management, Business, Science and Arts occupations in Morristown, the most male-oriented occupations are Computers, Engineering & Science (100.0%), Computers & Mathematics (100.0%), and Business & Financial (37.5%), while the most female-oriented occupations are Education Instruction & Library (100.0%), Community & Social Service (89.7%), and Health Diagnosing & Treating (75.0%).
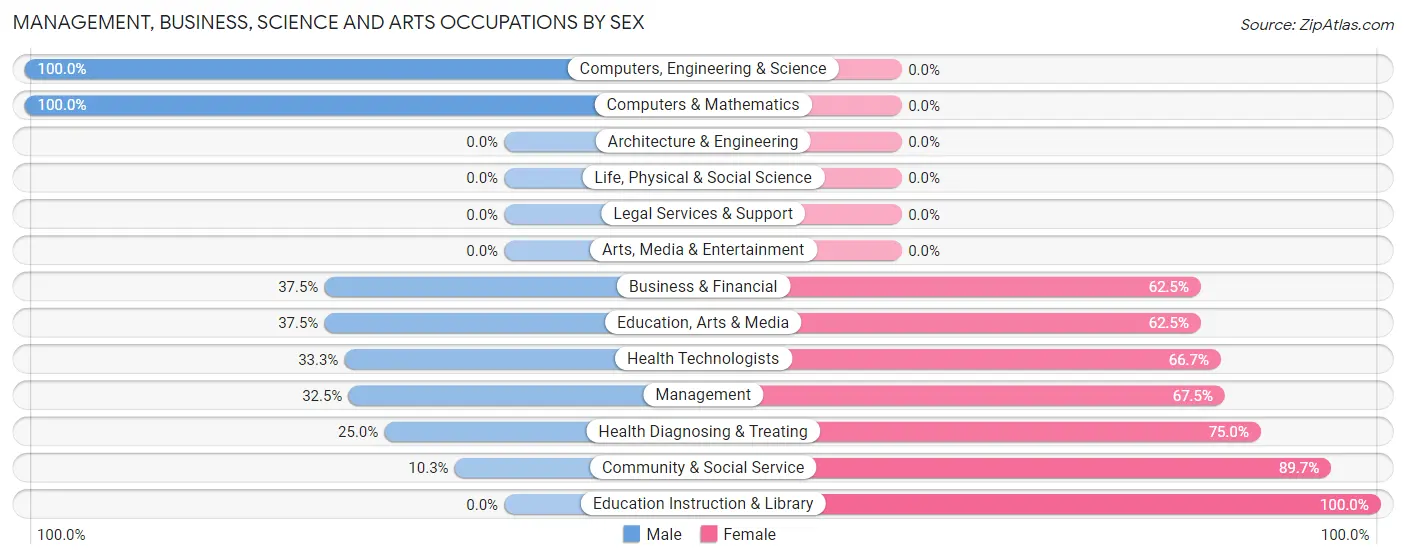
| Occupation | Male | Female |
| Management | 13 (32.5%) | 27 (67.5%) |
| Business & Financial | 12 (37.5%) | 20 (62.5%) |
| Computers, Engineering & Science | 9 (100.0%) | 0 (0.0%) |
| Computers & Mathematics | 9 (100.0%) | 0 (0.0%) |
| Architecture & Engineering | 0 (0.0%) | 0 (0.0%) |
| Life, Physical & Social Science | 0 (0.0%) | 0 (0.0%) |
| Community & Social Service | 3 (10.3%) | 26 (89.7%) |
| Education, Arts & Media | 3 (37.5%) | 5 (62.5%) |
| Legal Services & Support | 0 (0.0%) | 0 (0.0%) |
| Education Instruction & Library | 0 (0.0%) | 21 (100.0%) |
| Arts, Media & Entertainment | 0 (0.0%) | 0 (0.0%) |
| Health Diagnosing & Treating | 6 (25.0%) | 18 (75.0%) |
| Health Technologists | 6 (33.3%) | 12 (66.7%) |
| Total (Category) | 43 (32.1%) | 91 (67.9%) |
| Total (Overall) | 273 (52.0%) | 252 (48.0%) |
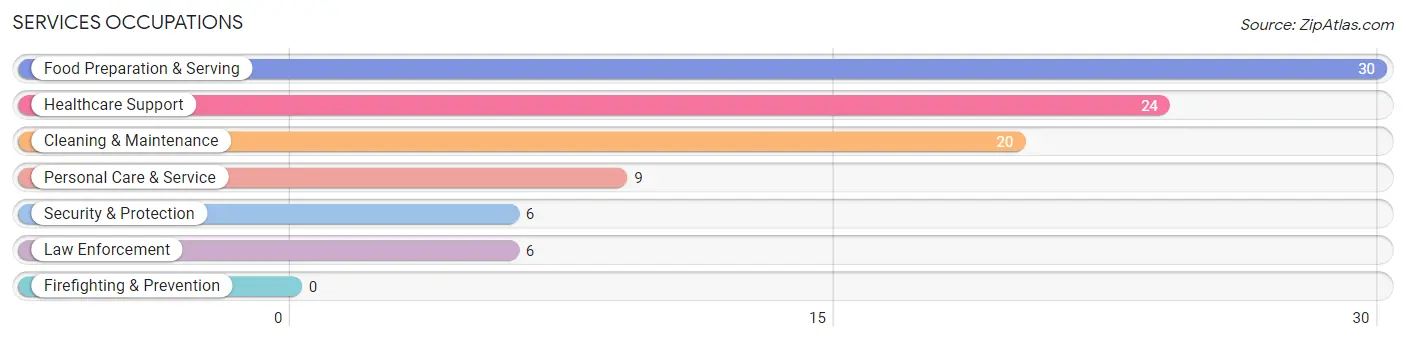
Services Occupations
The most common Services occupations in Morristown are Food Preparation & Serving (30 | 5.7%), Healthcare Support (24 | 4.6%), Cleaning & Maintenance (20 | 3.8%), Personal Care & Service (9 | 1.7%), and Security & Protection (6 | 1.1%).
Services Occupations by Sex
Within the Services occupations in Morristown, the most male-oriented occupations are Food Preparation & Serving (76.7%), Cleaning & Maintenance (70.0%), and Security & Protection (50.0%), while the most female-oriented occupations are Healthcare Support (66.7%), Personal Care & Service (66.7%), and Security & Protection (50.0%).
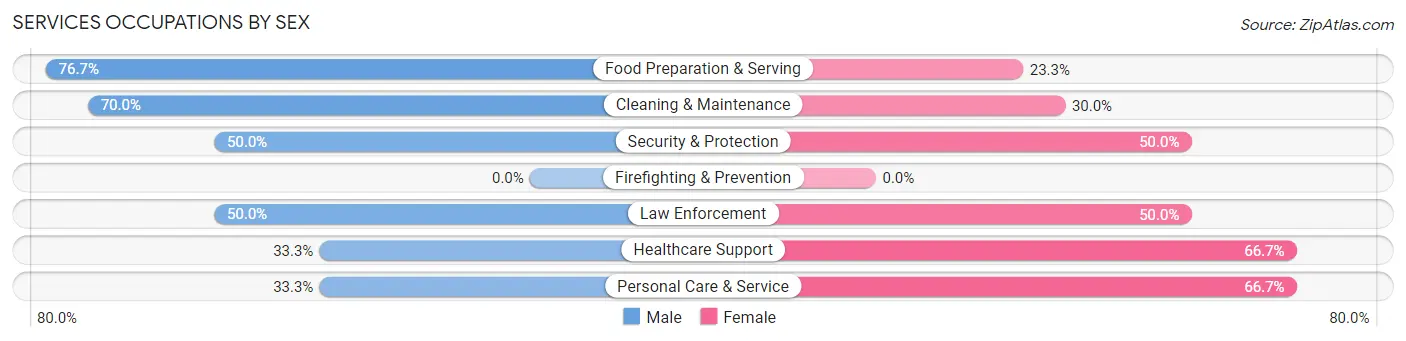
| Occupation | Male | Female |
| Healthcare Support | 8 (33.3%) | 16 (66.7%) |
| Security & Protection | 3 (50.0%) | 3 (50.0%) |
| Firefighting & Prevention | 0 (0.0%) | 0 (0.0%) |
| Law Enforcement | 3 (50.0%) | 3 (50.0%) |
| Food Preparation & Serving | 23 (76.7%) | 7 (23.3%) |
| Cleaning & Maintenance | 14 (70.0%) | 6 (30.0%) |
| Personal Care & Service | 3 (33.3%) | 6 (66.7%) |
| Total (Category) | 51 (57.3%) | 38 (42.7%) |
| Total (Overall) | 273 (52.0%) | 252 (48.0%) |
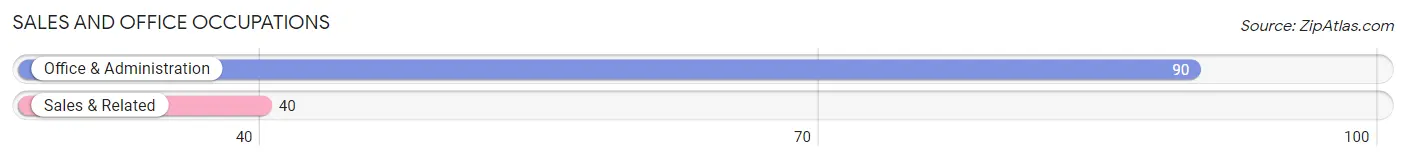
Sales and Office Occupations
The most common Sales and Office occupations in Morristown are Office & Administration (90 | 17.1%), and Sales & Related (40 | 7.6%).
Sales and Office Occupations by Sex
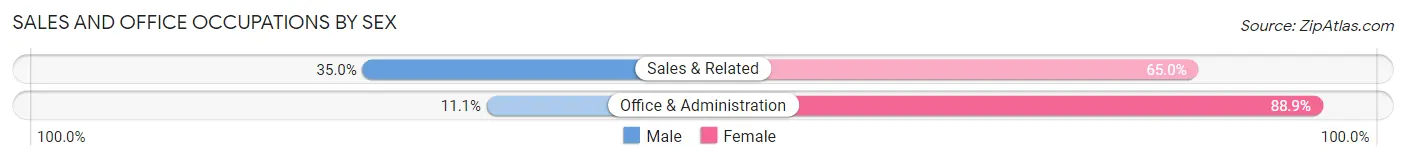
| Occupation | Male | Female |
| Sales & Related | 14 (35.0%) | 26 (65.0%) |
| Office & Administration | 10 (11.1%) | 80 (88.9%) |
| Total (Category) | 24 (18.5%) | 106 (81.5%) |
| Total (Overall) | 273 (52.0%) | 252 (48.0%) |
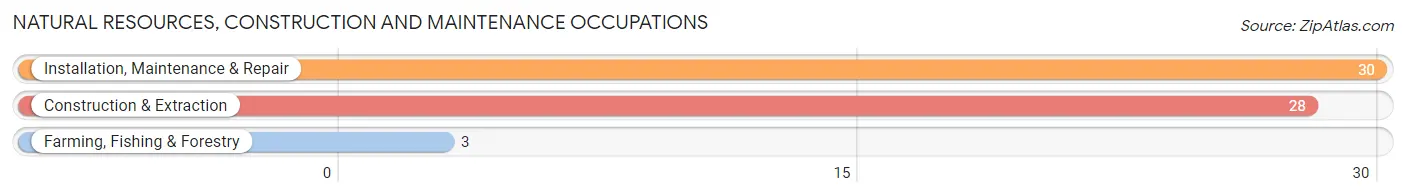
Natural Resources, Construction and Maintenance Occupations
The most common Natural Resources, Construction and Maintenance occupations in Morristown are Installation, Maintenance & Repair (30 | 5.7%), Construction & Extraction (28 | 5.3%), and Farming, Fishing & Forestry (3 | 0.6%).
Natural Resources, Construction and Maintenance Occupations by Sex
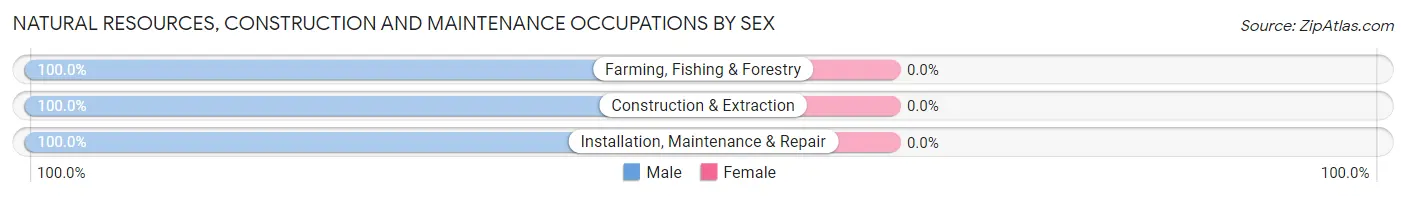
| Occupation | Male | Female |
| Farming, Fishing & Forestry | 3 (100.0%) | 0 (0.0%) |
| Construction & Extraction | 28 (100.0%) | 0 (0.0%) |
| Installation, Maintenance & Repair | 30 (100.0%) | 0 (0.0%) |
| Total (Category) | 61 (100.0%) | 0 (0.0%) |
| Total (Overall) | 273 (52.0%) | 252 (48.0%) |
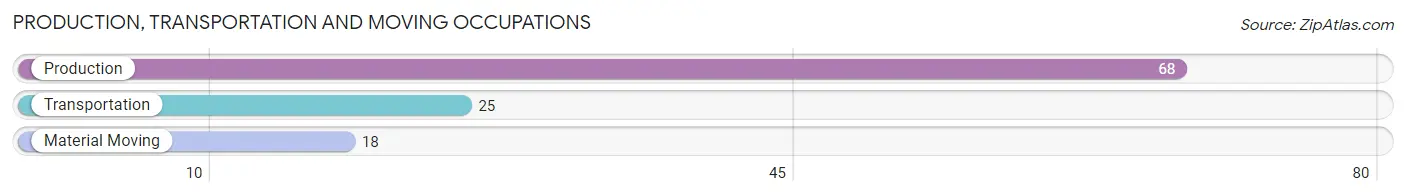
Production, Transportation and Moving Occupations
The most common Production, Transportation and Moving occupations in Morristown are Production (68 | 13.0%), Transportation (25 | 4.8%), and Material Moving (18 | 3.4%).
Production, Transportation and Moving Occupations by Sex
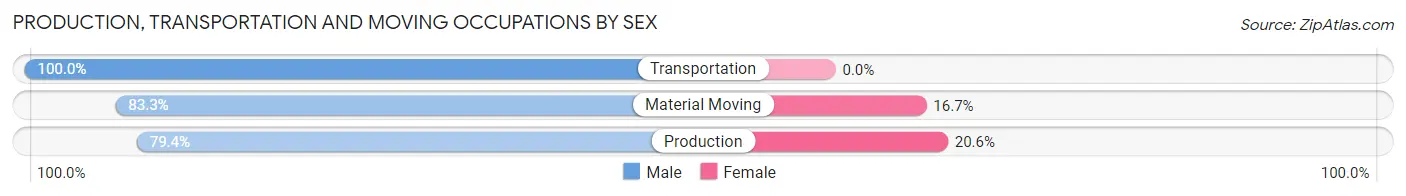
| Occupation | Male | Female |
| Production | 54 (79.4%) | 14 (20.6%) |
| Transportation | 25 (100.0%) | 0 (0.0%) |
| Material Moving | 15 (83.3%) | 3 (16.7%) |
| Total (Category) | 94 (84.7%) | 17 (15.3%) |
| Total (Overall) | 273 (52.0%) | 252 (48.0%) |
Employment Industries by Sex in Morristown
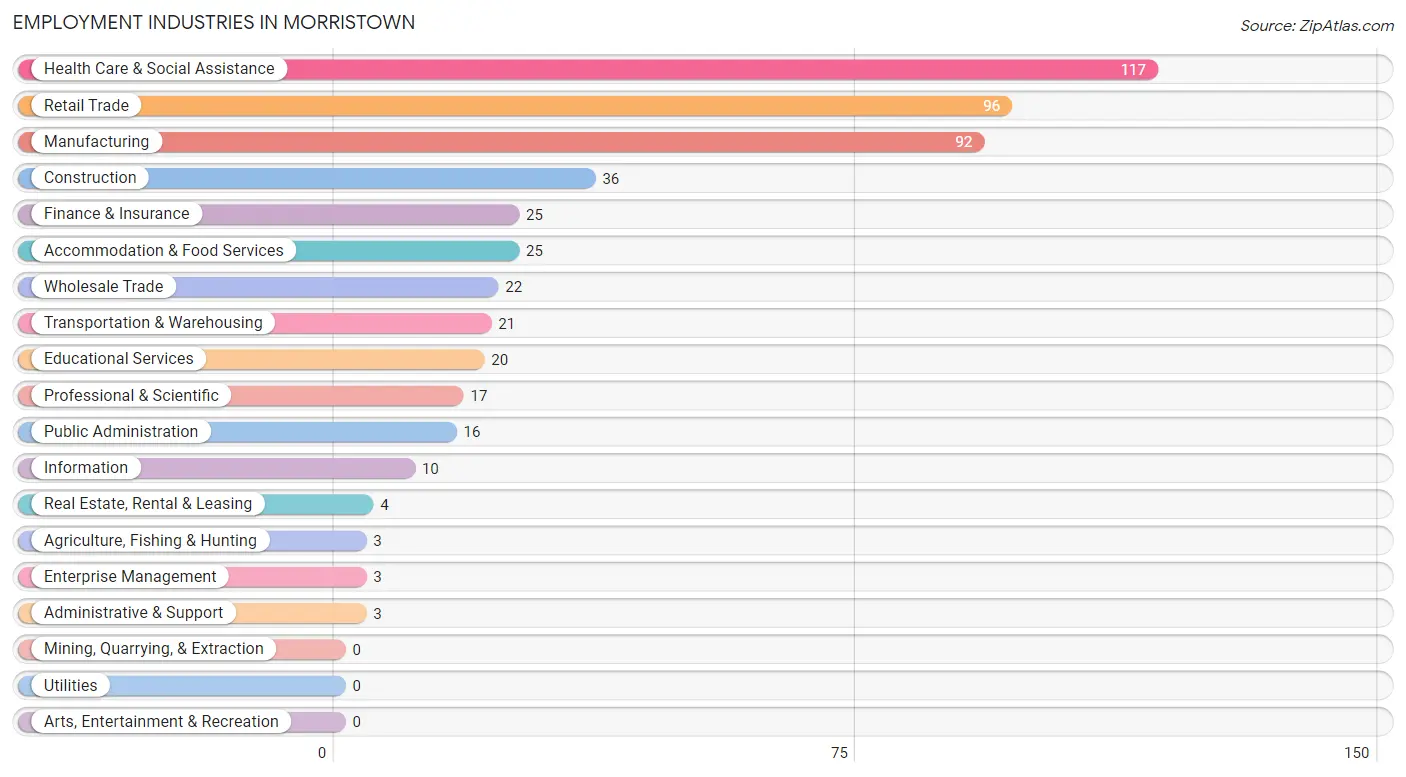
Employment Industries in Morristown
The major employment industries in Morristown include Health Care & Social Assistance (117 | 22.3%), Retail Trade (96 | 18.3%), Manufacturing (92 | 17.5%), Construction (36 | 6.9%), and Finance & Insurance (25 | 4.8%).
Employment Industries by Sex in Morristown
The Morristown industries that see more men than women are Agriculture, Fishing & Hunting (100.0%), Construction (100.0%), and Transportation & Warehousing (100.0%), whereas the industries that tend to have a higher number of women are Real Estate, Rental & Leasing (100.0%), Administrative & Support (100.0%), and Educational Services (95.0%).
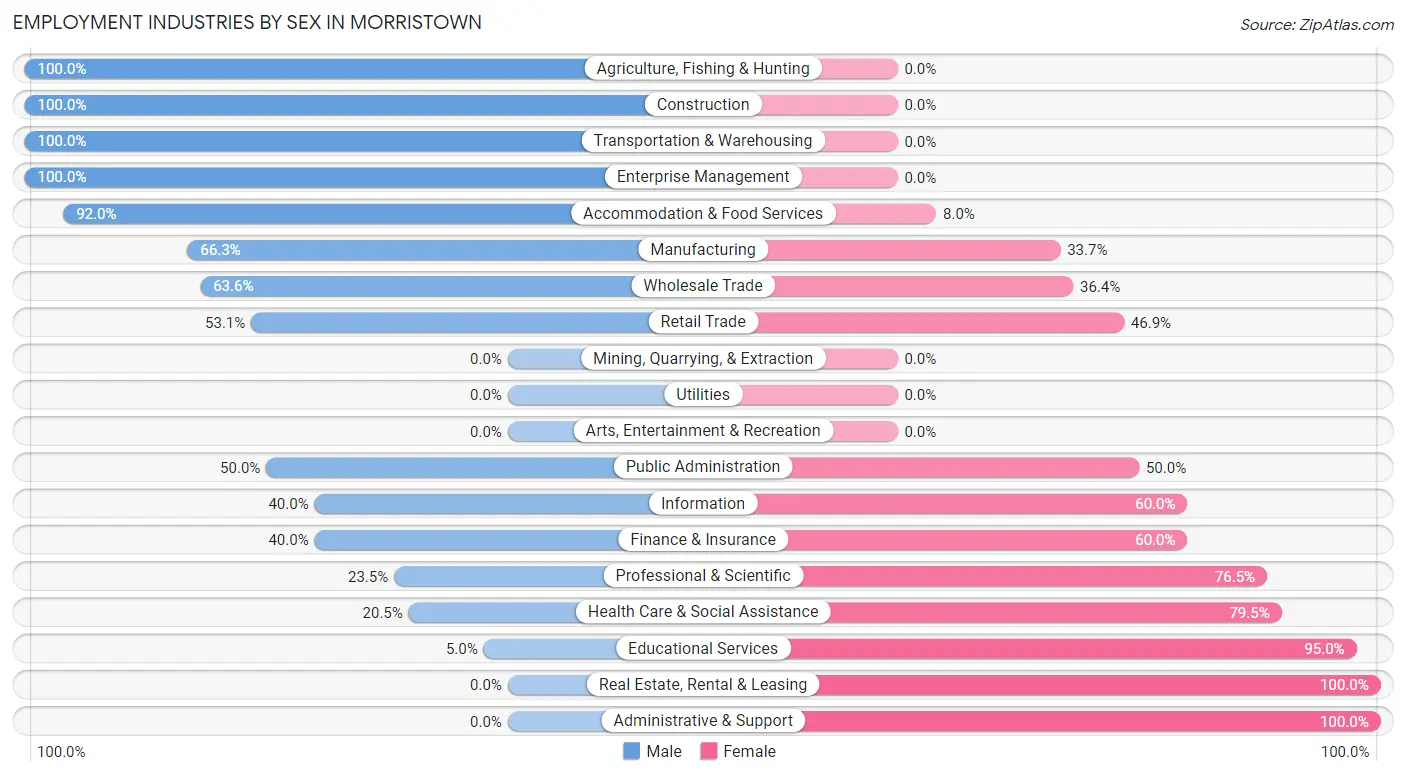
| Industry | Male | Female |
| Agriculture, Fishing & Hunting | 3 (100.0%) | 0 (0.0%) |
| Mining, Quarrying, & Extraction | 0 (0.0%) | 0 (0.0%) |
| Construction | 36 (100.0%) | 0 (0.0%) |
| Manufacturing | 61 (66.3%) | 31 (33.7%) |
| Wholesale Trade | 14 (63.6%) | 8 (36.4%) |
| Retail Trade | 51 (53.1%) | 45 (46.9%) |
| Transportation & Warehousing | 21 (100.0%) | 0 (0.0%) |
| Utilities | 0 (0.0%) | 0 (0.0%) |
| Information | 4 (40.0%) | 6 (60.0%) |
| Finance & Insurance | 10 (40.0%) | 15 (60.0%) |
| Real Estate, Rental & Leasing | 0 (0.0%) | 4 (100.0%) |
| Professional & Scientific | 4 (23.5%) | 13 (76.5%) |
| Enterprise Management | 3 (100.0%) | 0 (0.0%) |
| Administrative & Support | 0 (0.0%) | 3 (100.0%) |
| Educational Services | 1 (5.0%) | 19 (95.0%) |
| Health Care & Social Assistance | 24 (20.5%) | 93 (79.5%) |
| Arts, Entertainment & Recreation | 0 (0.0%) | 0 (0.0%) |
| Accommodation & Food Services | 23 (92.0%) | 2 (8.0%) |
| Public Administration | 8 (50.0%) | 8 (50.0%) |
| Total | 273 (52.0%) | 252 (48.0%) |
Education in Morristown
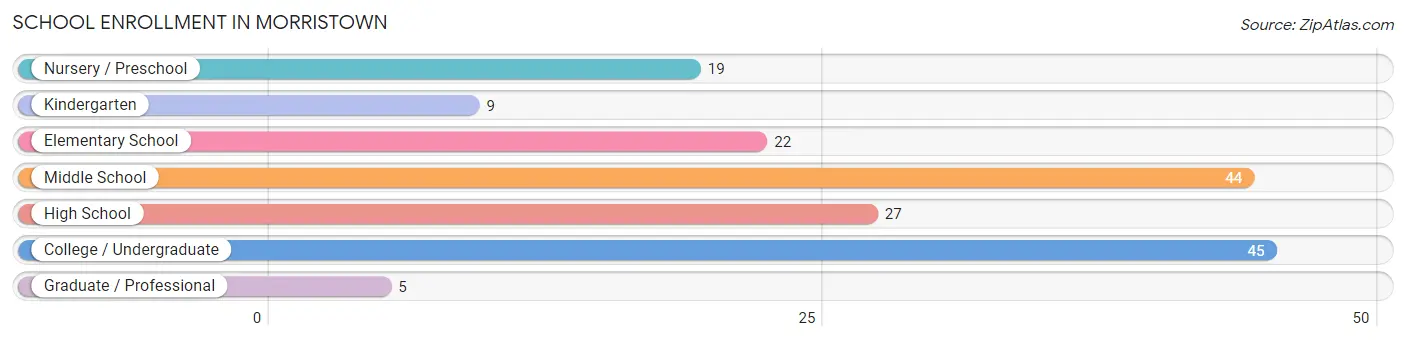
School Enrollment in Morristown
The most common levels of schooling among the 171 students in Morristown are college / undergraduate (45 | 26.3%), middle school (44 | 25.7%), and high school (27 | 15.8%).
| School Level | # Students | % Students |
| Nursery / Preschool | 19 | 11.1% |
| Kindergarten | 9 | 5.3% |
| Elementary School | 22 | 12.9% |
| Middle School | 44 | 25.7% |
| High School | 27 | 15.8% |
| College / Undergraduate | 45 | 26.3% |
| Graduate / Professional | 5 | 2.9% |
| Total | 171 | 100.0% |
School Enrollment by Age by Funding Source in Morristown
Out of a total of 171 students who are enrolled in schools in Morristown, 22 (12.9%) attend a private institution, while the remaining 149 (87.1%) are enrolled in public schools. The age group of 35 years and over has the highest likelihood of being enrolled in private schools, with 2 (100.0% in the age bracket) enrolled. Conversely, the age group of 18 to 19 year olds has the lowest likelihood of being enrolled in a private school, with 6 (100.0% in the age bracket) attending a public institution.
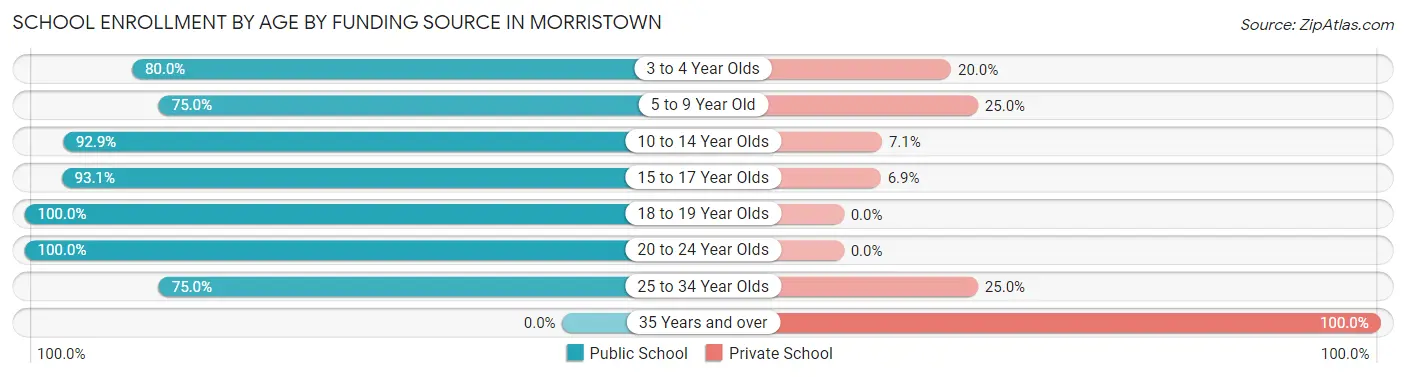
| Age Bracket | Public School | Private School |
| 3 to 4 Year Olds | 8 (80.0%) | 2 (20.0%) |
| 5 to 9 Year Old | 30 (75.0%) | 10 (25.0%) |
| 10 to 14 Year Olds | 39 (92.9%) | 3 (7.1%) |
| 15 to 17 Year Olds | 27 (93.1%) | 2 (6.9%) |
| 18 to 19 Year Olds | 6 (100.0%) | 0 (0.0%) |
| 20 to 24 Year Olds | 30 (100.0%) | 0 (0.0%) |
| 25 to 34 Year Olds | 9 (75.0%) | 3 (25.0%) |
| 35 Years and over | 0 (0.0%) | 2 (100.0%) |
| Total | 149 (87.1%) | 22 (12.9%) |
Educational Attainment by Field of Study in Morristown
Science & technology (19 | 21.8%), business (10 | 11.5%), arts & humanities (10 | 11.5%), education (9 | 10.3%), and visual & performing arts (9 | 10.3%) are the most common fields of study among 87 individuals in Morristown who have obtained a bachelor's degree or higher.
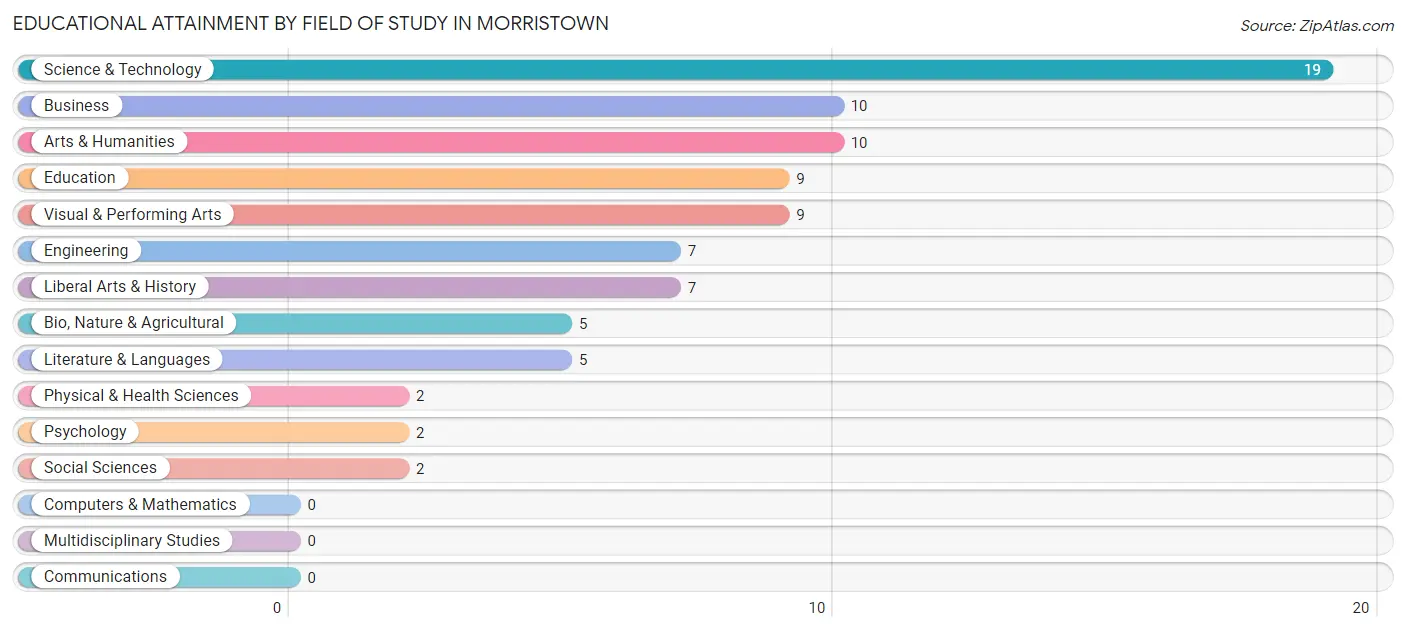
| Field of Study | # Graduates | % Graduates |
| Computers & Mathematics | 0 | 0.0% |
| Bio, Nature & Agricultural | 5 | 5.8% |
| Physical & Health Sciences | 2 | 2.3% |
| Psychology | 2 | 2.3% |
| Social Sciences | 2 | 2.3% |
| Engineering | 7 | 8.1% |
| Multidisciplinary Studies | 0 | 0.0% |
| Science & Technology | 19 | 21.8% |
| Business | 10 | 11.5% |
| Education | 9 | 10.3% |
| Literature & Languages | 5 | 5.8% |
| Liberal Arts & History | 7 | 8.1% |
| Visual & Performing Arts | 9 | 10.3% |
| Communications | 0 | 0.0% |
| Arts & Humanities | 10 | 11.5% |
| Total | 87 | 100.0% |
Transportation & Commute in Morristown
Vehicle Availability by Sex in Morristown
The most prevalent vehicle ownership categories in Morristown are males with 2 vehicles (87, accounting for 32.8%) and females with 2 vehicles (90, making up 34.8%).
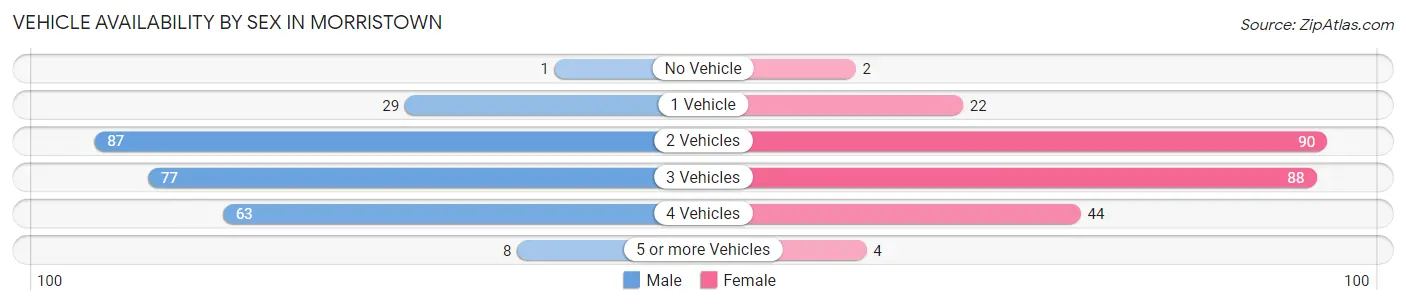
| Vehicles Available | Male | Female |
| No Vehicle | 1 (0.4%) | 2 (0.8%) |
| 1 Vehicle | 29 (10.9%) | 22 (8.8%) |
| 2 Vehicles | 87 (32.8%) | 90 (36.0%) |
| 3 Vehicles | 77 (29.1%) | 88 (35.2%) |
| 4 Vehicles | 63 (23.8%) | 44 (17.6%) |
| 5 or more Vehicles | 8 (3.0%) | 4 (1.6%) |
| Total | 265 (100.0%) | 250 (100.0%) |
Commute Time in Morristown
The most frequently occuring commute durations in Morristown are 30 to 34 minutes (90 commuters, 18.8%), 20 to 24 minutes (83 commuters, 17.3%), and 15 to 19 minutes (61 commuters, 12.7%).
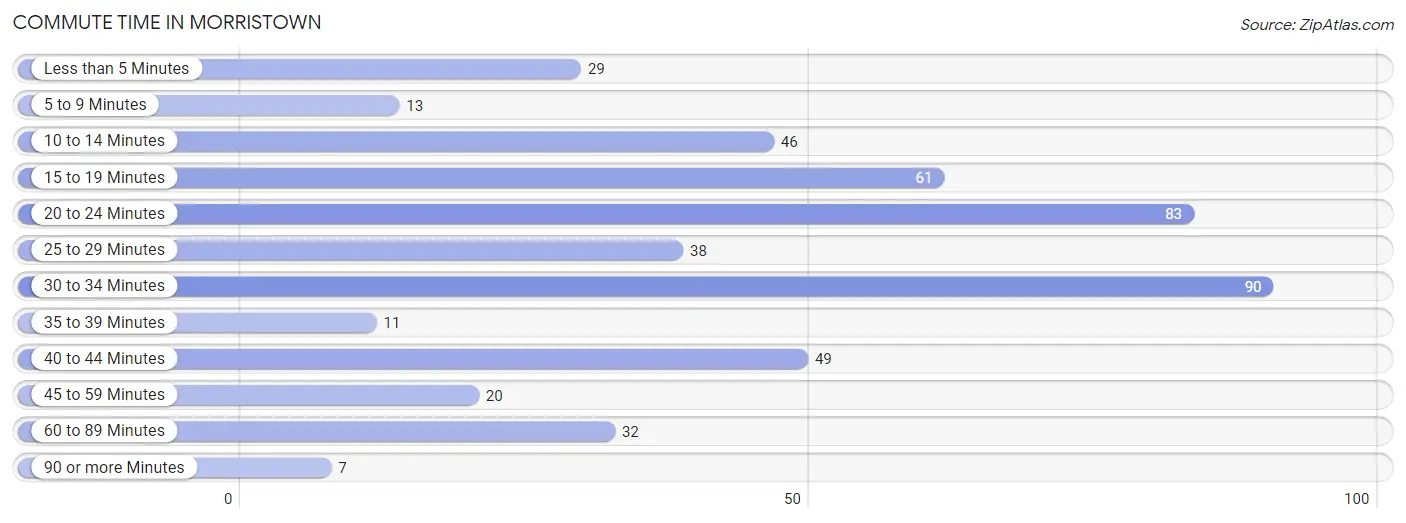
| Commute Time | # Commuters | % Commuters |
| Less than 5 Minutes | 29 | 6.0% |
| 5 to 9 Minutes | 13 | 2.7% |
| 10 to 14 Minutes | 46 | 9.6% |
| 15 to 19 Minutes | 61 | 12.7% |
| 20 to 24 Minutes | 83 | 17.3% |
| 25 to 29 Minutes | 38 | 7.9% |
| 30 to 34 Minutes | 90 | 18.8% |
| 35 to 39 Minutes | 11 | 2.3% |
| 40 to 44 Minutes | 49 | 10.2% |
| 45 to 59 Minutes | 20 | 4.2% |
| 60 to 89 Minutes | 32 | 6.7% |
| 90 or more Minutes | 7 | 1.5% |
Commute Time by Sex in Morristown
The most common commute times in Morristown are 20 to 24 minutes (56 commuters, 22.4%) for males and 30 to 34 minutes (54 commuters, 23.6%) for females.
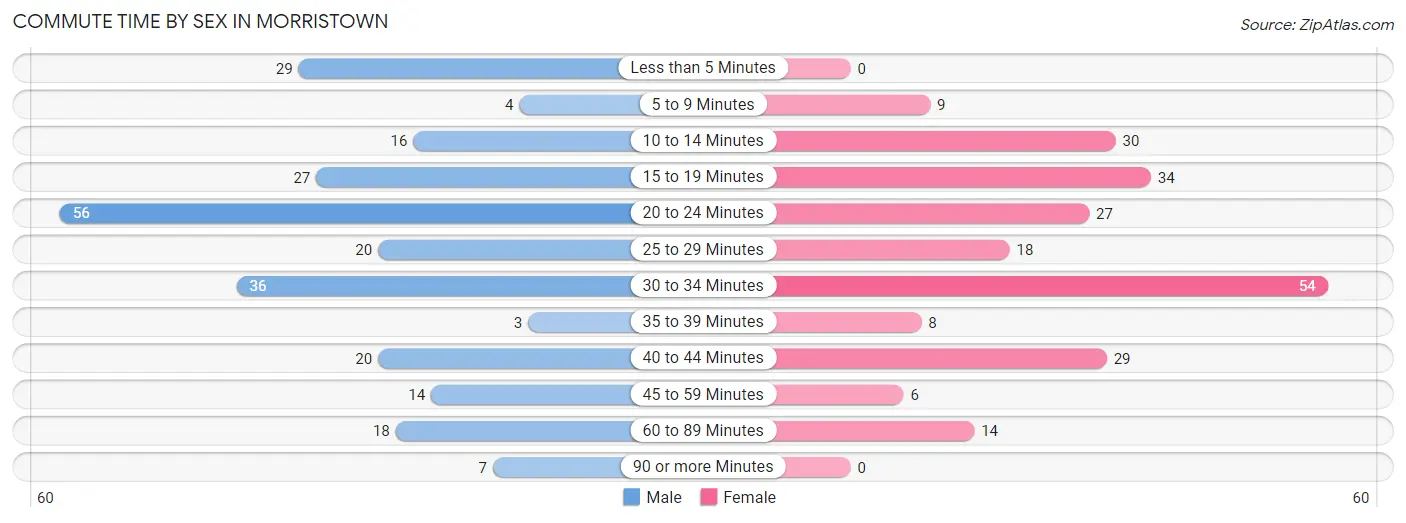
| Commute Time | Male | Female |
| Less than 5 Minutes | 29 (11.6%) | 0 (0.0%) |
| 5 to 9 Minutes | 4 (1.6%) | 9 (3.9%) |
| 10 to 14 Minutes | 16 (6.4%) | 30 (13.1%) |
| 15 to 19 Minutes | 27 (10.8%) | 34 (14.8%) |
| 20 to 24 Minutes | 56 (22.4%) | 27 (11.8%) |
| 25 to 29 Minutes | 20 (8.0%) | 18 (7.9%) |
| 30 to 34 Minutes | 36 (14.4%) | 54 (23.6%) |
| 35 to 39 Minutes | 3 (1.2%) | 8 (3.5%) |
| 40 to 44 Minutes | 20 (8.0%) | 29 (12.7%) |
| 45 to 59 Minutes | 14 (5.6%) | 6 (2.6%) |
| 60 to 89 Minutes | 18 (7.2%) | 14 (6.1%) |
| 90 or more Minutes | 7 (2.8%) | 0 (0.0%) |
Time of Departure to Work by Sex in Morristown
The most frequent times of departure to work in Morristown are 12:00 PM to 3:59 PM (50, 20.0%) for males and 7:00 AM to 7:29 AM (61, 26.6%) for females.
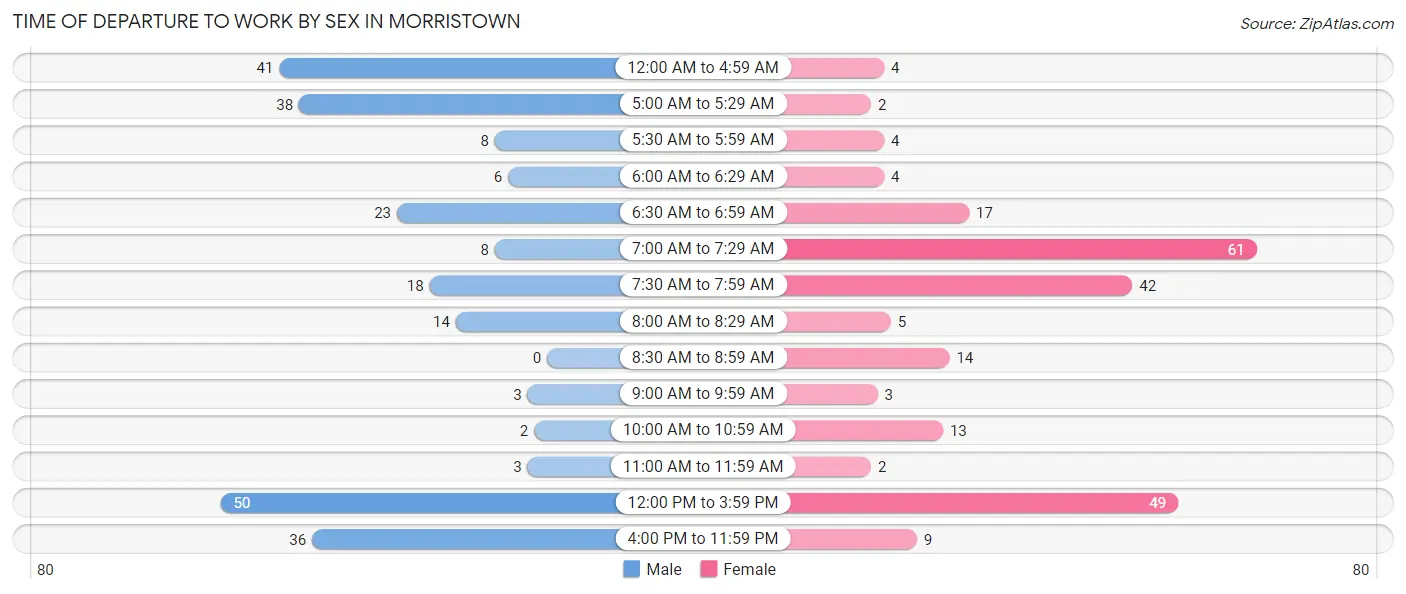
| Time of Departure | Male | Female |
| 12:00 AM to 4:59 AM | 41 (16.4%) | 4 (1.8%) |
| 5:00 AM to 5:29 AM | 38 (15.2%) | 2 (0.9%) |
| 5:30 AM to 5:59 AM | 8 (3.2%) | 4 (1.8%) |
| 6:00 AM to 6:29 AM | 6 (2.4%) | 4 (1.8%) |
| 6:30 AM to 6:59 AM | 23 (9.2%) | 17 (7.4%) |
| 7:00 AM to 7:29 AM | 8 (3.2%) | 61 (26.6%) |
| 7:30 AM to 7:59 AM | 18 (7.2%) | 42 (18.3%) |
| 8:00 AM to 8:29 AM | 14 (5.6%) | 5 (2.2%) |
| 8:30 AM to 8:59 AM | 0 (0.0%) | 14 (6.1%) |
| 9:00 AM to 9:59 AM | 3 (1.2%) | 3 (1.3%) |
| 10:00 AM to 10:59 AM | 2 (0.8%) | 13 (5.7%) |
| 11:00 AM to 11:59 AM | 3 (1.2%) | 2 (0.9%) |
| 12:00 PM to 3:59 PM | 50 (20.0%) | 49 (21.4%) |
| 4:00 PM to 11:59 PM | 36 (14.4%) | 9 (3.9%) |
| Total | 250 (100.0%) | 229 (100.0%) |
Housing Occupancy in Morristown
Occupancy by Ownership in Morristown
Of the total 363 dwellings in Morristown, owner-occupied units account for 303 (83.5%), while renter-occupied units make up 60 (16.5%).
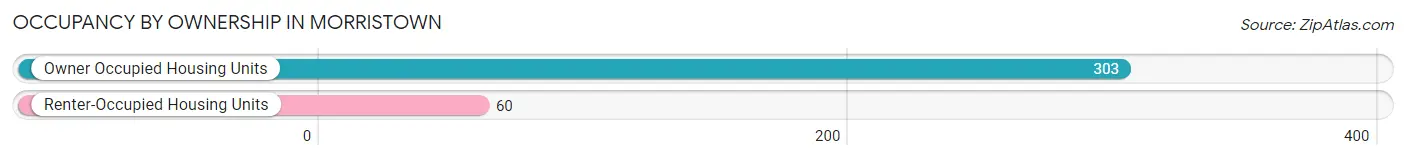
| Occupancy | # Housing Units | % Housing Units |
| Owner Occupied Housing Units | 303 | 83.5% |
| Renter-Occupied Housing Units | 60 | 16.5% |
| Total Occupied Housing Units | 363 | 100.0% |
Occupancy by Household Size in Morristown
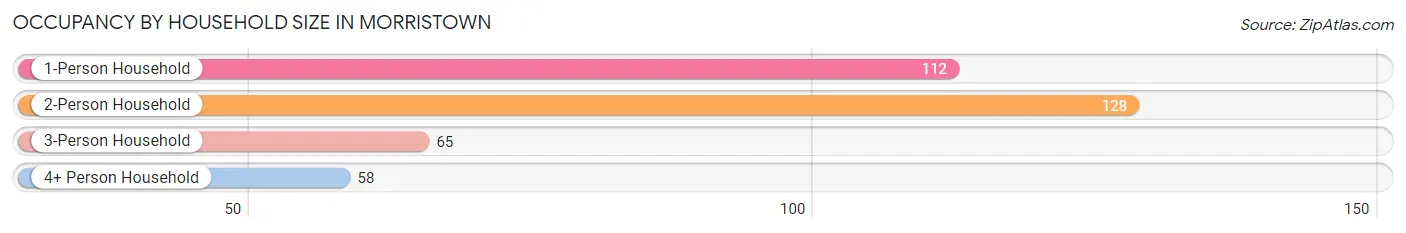
| Household Size | # Housing Units | % Housing Units |
| 1-Person Household | 112 | 30.8% |
| 2-Person Household | 128 | 35.3% |
| 3-Person Household | 65 | 17.9% |
| 4+ Person Household | 58 | 16.0% |
| Total Housing Units | 363 | 100.0% |
Occupancy by Ownership by Household Size in Morristown
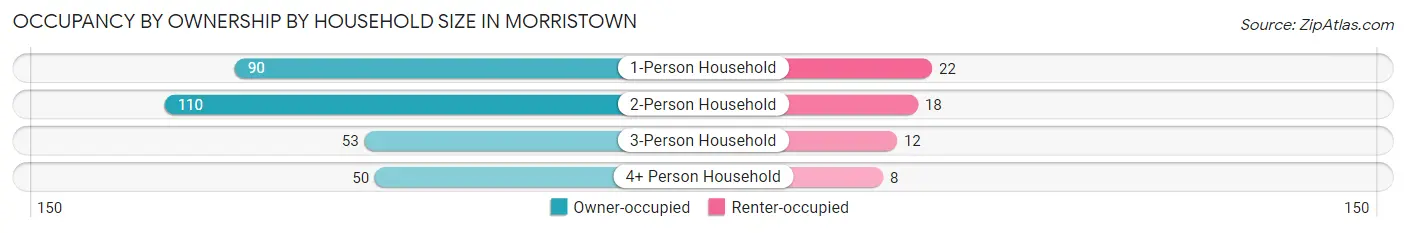
| Household Size | Owner-occupied | Renter-occupied |
| 1-Person Household | 90 (80.4%) | 22 (19.6%) |
| 2-Person Household | 110 (85.9%) | 18 (14.1%) |
| 3-Person Household | 53 (81.5%) | 12 (18.5%) |
| 4+ Person Household | 50 (86.2%) | 8 (13.8%) |
| Total Housing Units | 303 (83.5%) | 60 (16.5%) |
Occupancy by Educational Attainment in Morristown
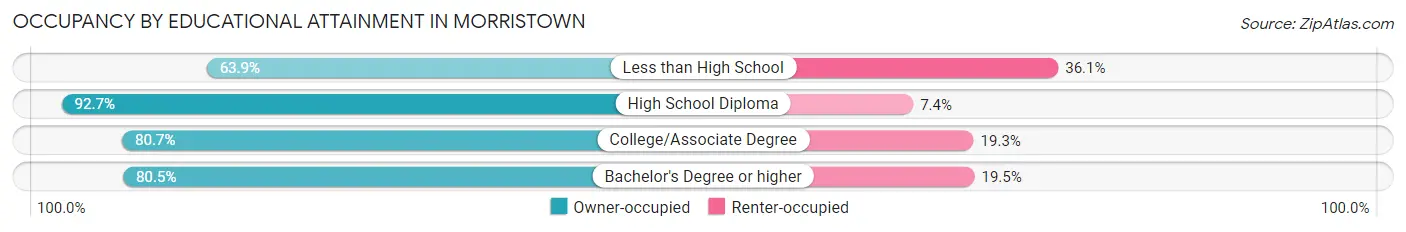
| Household Size | Owner-occupied | Renter-occupied |
| Less than High School | 23 (63.9%) | 13 (36.1%) |
| High School Diploma | 126 (92.6%) | 10 (7.3%) |
| College/Associate Degree | 121 (80.7%) | 29 (19.3%) |
| Bachelor's Degree or higher | 33 (80.5%) | 8 (19.5%) |
Occupancy by Age of Householder in Morristown
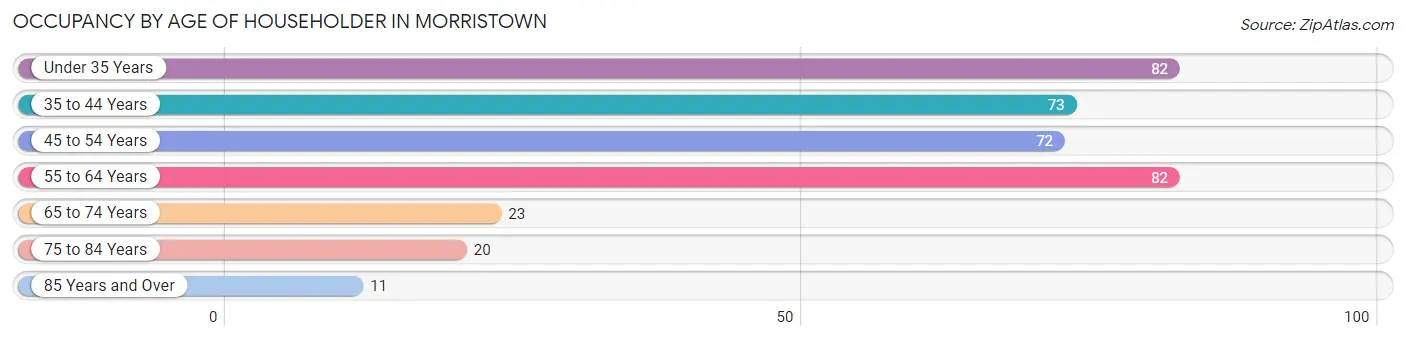
| Age Bracket | # Households | % Households |
| Under 35 Years | 82 | 22.6% |
| 35 to 44 Years | 73 | 20.1% |
| 45 to 54 Years | 72 | 19.8% |
| 55 to 64 Years | 82 | 22.6% |
| 65 to 74 Years | 23 | 6.3% |
| 75 to 84 Years | 20 | 5.5% |
| 85 Years and Over | 11 | 3.0% |
| Total | 363 | 100.0% |
Housing Finances in Morristown
Median Income by Occupancy in Morristown
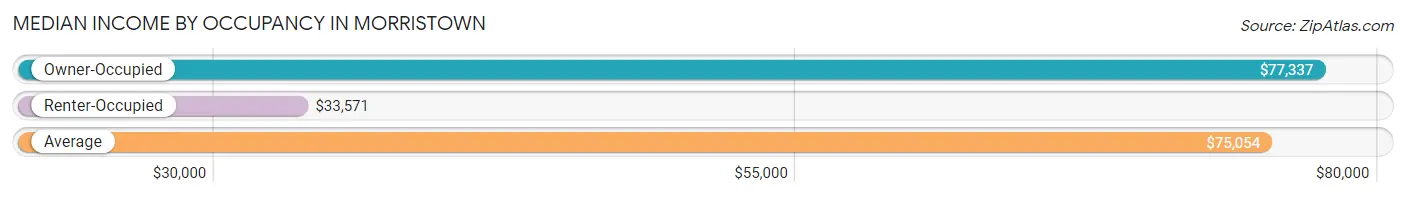
| Occupancy Type | # Households | Median Income |
| Owner-Occupied | 303 (83.5%) | $77,337 |
| Renter-Occupied | 60 (16.5%) | $33,571 |
| Average | 363 (100.0%) | $75,054 |
Occupancy by Householder Income Bracket in Morristown
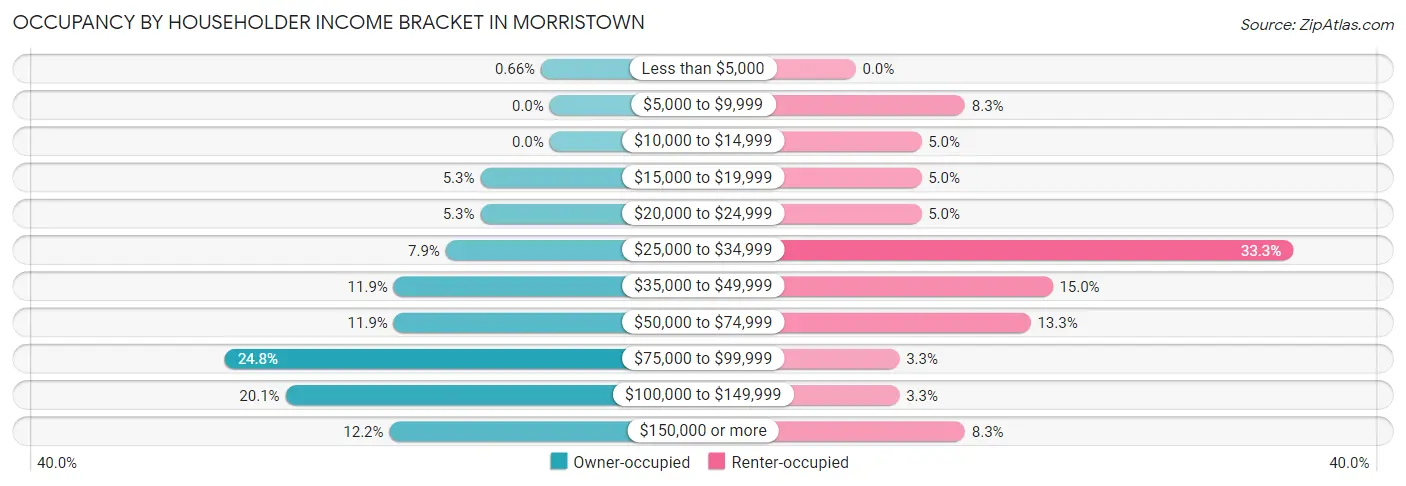
| Income Bracket | Owner-occupied | Renter-occupied |
| Less than $5,000 | 2 (0.7%) | 0 (0.0%) |
| $5,000 to $9,999 | 0 (0.0%) | 5 (8.3%) |
| $10,000 to $14,999 | 0 (0.0%) | 3 (5.0%) |
| $15,000 to $19,999 | 16 (5.3%) | 3 (5.0%) |
| $20,000 to $24,999 | 16 (5.3%) | 3 (5.0%) |
| $25,000 to $34,999 | 24 (7.9%) | 20 (33.3%) |
| $35,000 to $49,999 | 36 (11.9%) | 9 (15.0%) |
| $50,000 to $74,999 | 36 (11.9%) | 8 (13.3%) |
| $75,000 to $99,999 | 75 (24.7%) | 2 (3.3%) |
| $100,000 to $149,999 | 61 (20.1%) | 2 (3.3%) |
| $150,000 or more | 37 (12.2%) | 5 (8.3%) |
| Total | 303 (100.0%) | 60 (100.0%) |
Monthly Housing Cost Tiers in Morristown
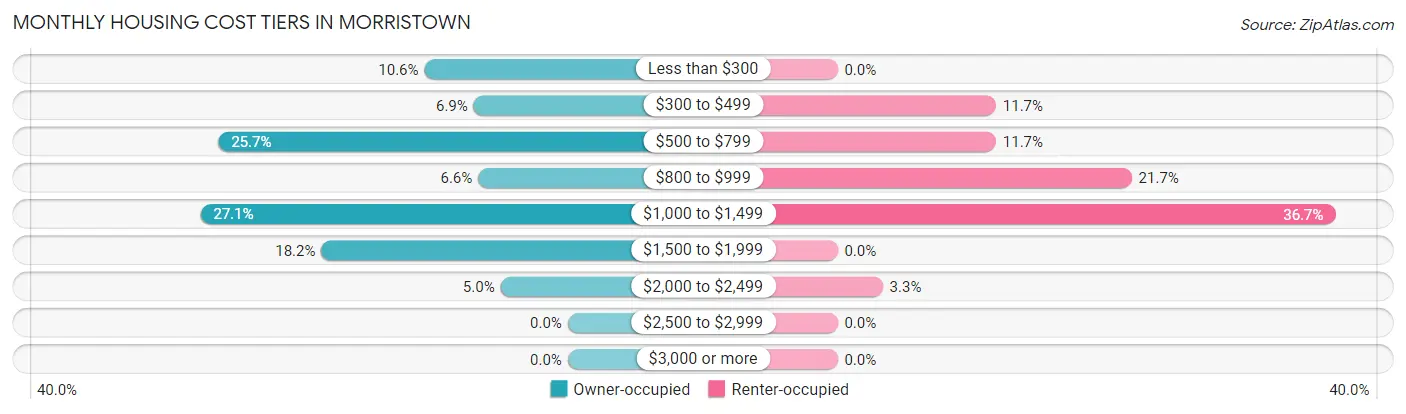
| Monthly Cost | Owner-occupied | Renter-occupied |
| Less than $300 | 32 (10.6%) | 0 (0.0%) |
| $300 to $499 | 21 (6.9%) | 7 (11.7%) |
| $500 to $799 | 78 (25.7%) | 7 (11.7%) |
| $800 to $999 | 20 (6.6%) | 13 (21.7%) |
| $1,000 to $1,499 | 82 (27.1%) | 22 (36.7%) |
| $1,500 to $1,999 | 55 (18.1%) | 0 (0.0%) |
| $2,000 to $2,499 | 15 (5.0%) | 2 (3.3%) |
| $2,500 to $2,999 | 0 (0.0%) | 0 (0.0%) |
| $3,000 or more | 0 (0.0%) | 0 (0.0%) |
| Total | 303 (100.0%) | 60 (100.0%) |
Physical Housing Characteristics in Morristown
Housing Structures in Morristown
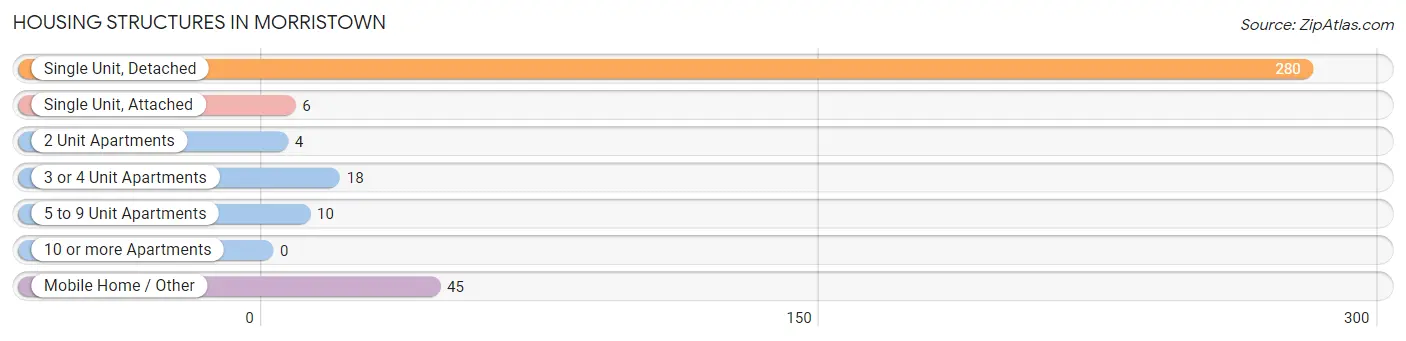
| Structure Type | # Housing Units | % Housing Units |
| Single Unit, Detached | 280 | 77.1% |
| Single Unit, Attached | 6 | 1.7% |
| 2 Unit Apartments | 4 | 1.1% |
| 3 or 4 Unit Apartments | 18 | 5.0% |
| 5 to 9 Unit Apartments | 10 | 2.8% |
| 10 or more Apartments | 0 | 0.0% |
| Mobile Home / Other | 45 | 12.4% |
| Total | 363 | 100.0% |
Housing Structures by Occupancy in Morristown
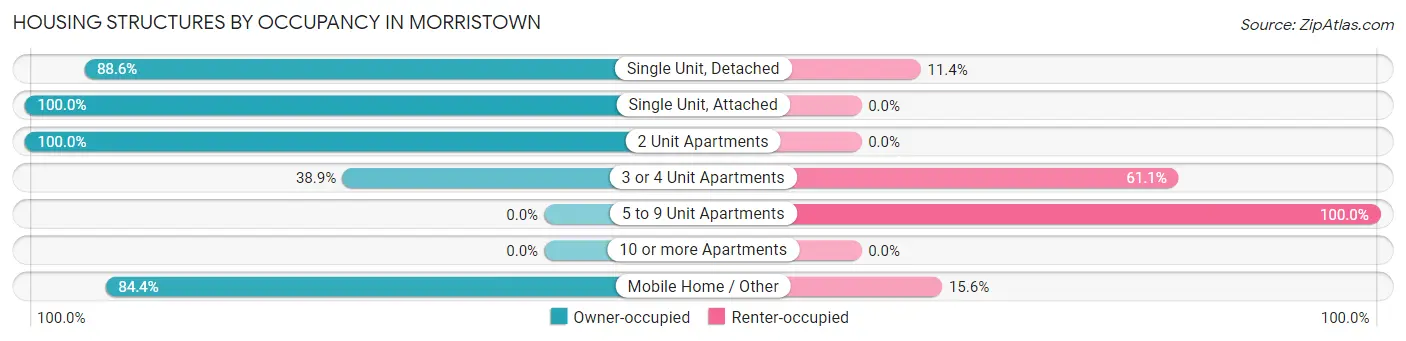
| Structure Type | Owner-occupied | Renter-occupied |
| Single Unit, Detached | 248 (88.6%) | 32 (11.4%) |
| Single Unit, Attached | 6 (100.0%) | 0 (0.0%) |
| 2 Unit Apartments | 4 (100.0%) | 0 (0.0%) |
| 3 or 4 Unit Apartments | 7 (38.9%) | 11 (61.1%) |
| 5 to 9 Unit Apartments | 0 (0.0%) | 10 (100.0%) |
| 10 or more Apartments | 0 (0.0%) | 0 (0.0%) |
| Mobile Home / Other | 38 (84.4%) | 7 (15.6%) |
| Total | 303 (83.5%) | 60 (16.5%) |
Housing Structures by Number of Rooms in Morristown
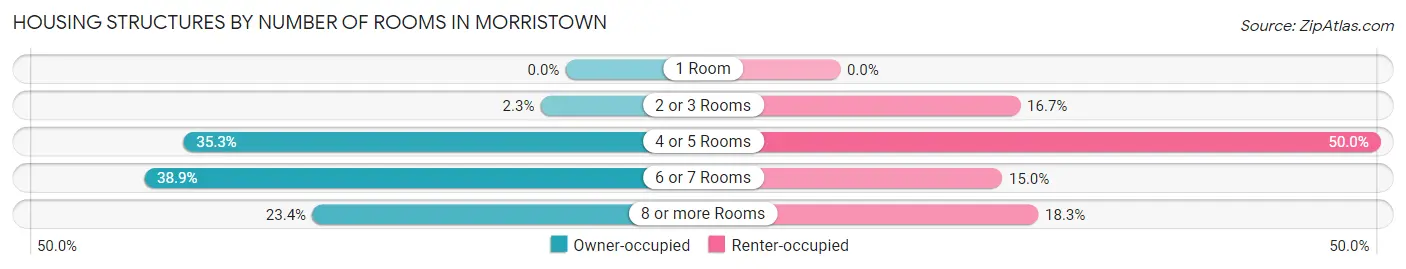
| Number of Rooms | Owner-occupied | Renter-occupied |
| 1 Room | 0 (0.0%) | 0 (0.0%) |
| 2 or 3 Rooms | 7 (2.3%) | 10 (16.7%) |
| 4 or 5 Rooms | 107 (35.3%) | 30 (50.0%) |
| 6 or 7 Rooms | 118 (38.9%) | 9 (15.0%) |
| 8 or more Rooms | 71 (23.4%) | 11 (18.3%) |
| Total | 303 (100.0%) | 60 (100.0%) |
Housing Structure by Heating Type in Morristown
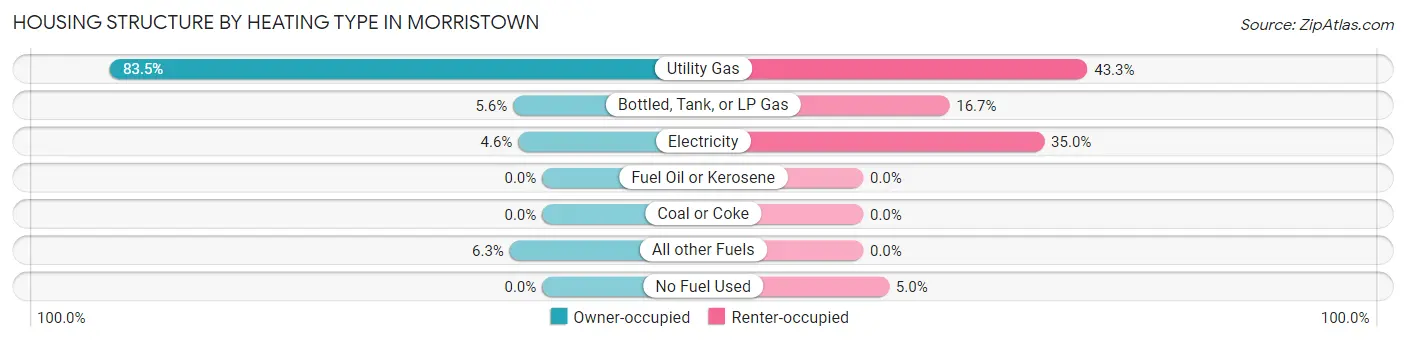
| Heating Type | Owner-occupied | Renter-occupied |
| Utility Gas | 253 (83.5%) | 26 (43.3%) |
| Bottled, Tank, or LP Gas | 17 (5.6%) | 10 (16.7%) |
| Electricity | 14 (4.6%) | 21 (35.0%) |
| Fuel Oil or Kerosene | 0 (0.0%) | 0 (0.0%) |
| Coal or Coke | 0 (0.0%) | 0 (0.0%) |
| All other Fuels | 19 (6.3%) | 0 (0.0%) |
| No Fuel Used | 0 (0.0%) | 3 (5.0%) |
| Total | 303 (100.0%) | 60 (100.0%) |
Household Vehicle Usage in Morristown
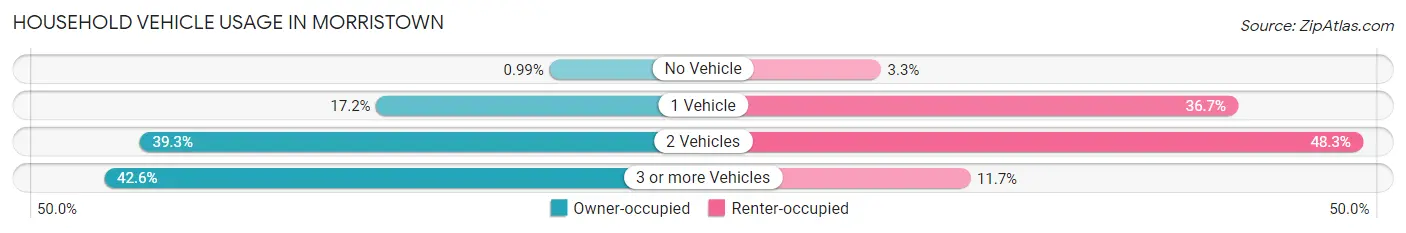
| Vehicles per Household | Owner-occupied | Renter-occupied |
| No Vehicle | 3 (1.0%) | 2 (3.3%) |
| 1 Vehicle | 52 (17.2%) | 22 (36.7%) |
| 2 Vehicles | 119 (39.3%) | 29 (48.3%) |
| 3 or more Vehicles | 129 (42.6%) | 7 (11.7%) |
| Total | 303 (100.0%) | 60 (100.0%) |
Real Estate & Mortgages in Morristown
Real Estate and Mortgage Overview in Morristown
| Characteristic | Without Mortgage | With Mortgage |
| Housing Units | 130 | 173 |
| Median Property Value | $170,500 | $168,800 |
| Median Household Income | $75,326 | $35 |
| Monthly Housing Costs | $567 | $0 |
| Real Estate Taxes | $1,917 | $5 |
Property Value by Mortgage Status in Morristown
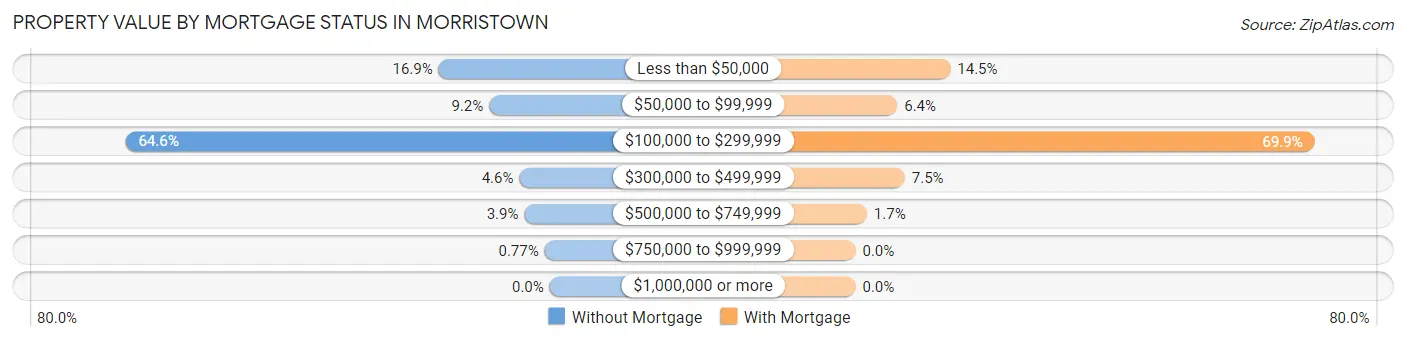
| Property Value | Without Mortgage | With Mortgage |
| Less than $50,000 | 22 (16.9%) | 25 (14.4%) |
| $50,000 to $99,999 | 12 (9.2%) | 11 (6.4%) |
| $100,000 to $299,999 | 84 (64.6%) | 121 (69.9%) |
| $300,000 to $499,999 | 6 (4.6%) | 13 (7.5%) |
| $500,000 to $749,999 | 5 (3.8%) | 3 (1.7%) |
| $750,000 to $999,999 | 1 (0.8%) | 0 (0.0%) |
| $1,000,000 or more | 0 (0.0%) | 0 (0.0%) |
| Total | 130 (100.0%) | 173 (100.0%) |
Household Income by Mortgage Status in Morristown
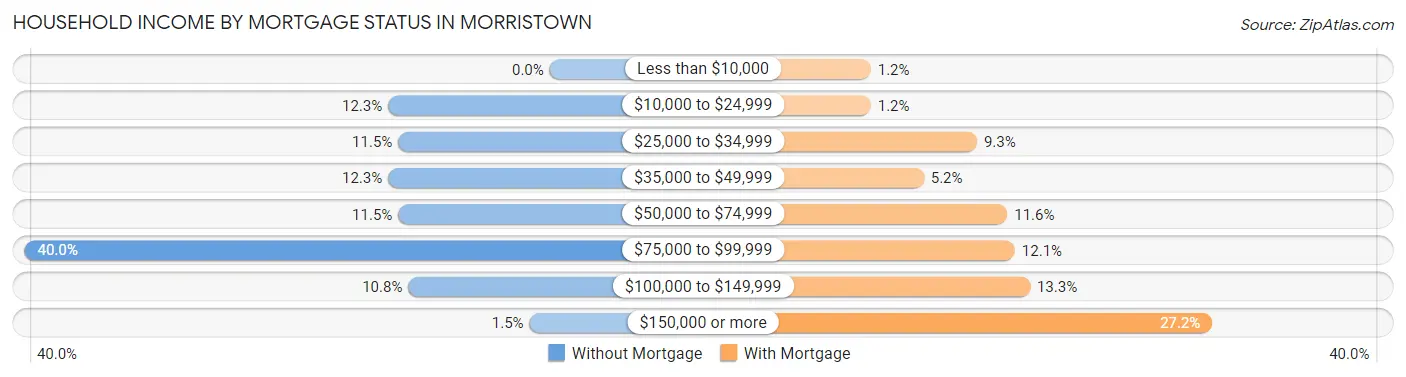
| Household Income | Without Mortgage | With Mortgage |
| Less than $10,000 | 0 (0.0%) | 2 (1.2%) |
| $10,000 to $24,999 | 16 (12.3%) | 2 (1.2%) |
| $25,000 to $34,999 | 15 (11.5%) | 16 (9.2%) |
| $35,000 to $49,999 | 16 (12.3%) | 9 (5.2%) |
| $50,000 to $74,999 | 15 (11.5%) | 20 (11.6%) |
| $75,000 to $99,999 | 52 (40.0%) | 21 (12.1%) |
| $100,000 to $149,999 | 14 (10.8%) | 23 (13.3%) |
| $150,000 or more | 2 (1.5%) | 47 (27.2%) |
| Total | 130 (100.0%) | 173 (100.0%) |
Property Value to Household Income Ratio in Morristown
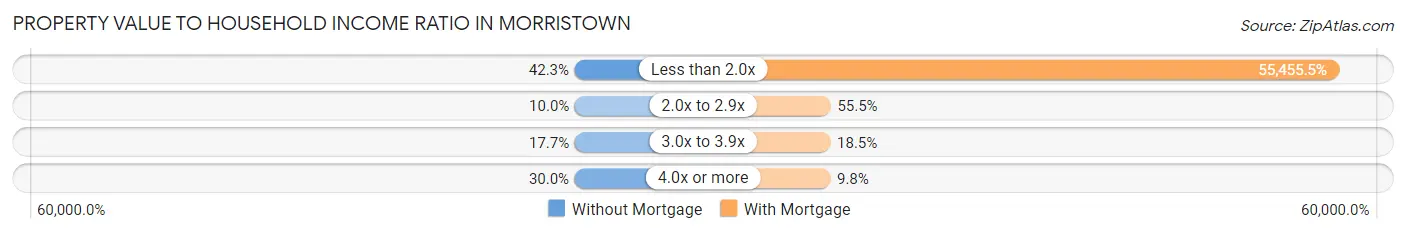
| Value-to-Income Ratio | Without Mortgage | With Mortgage |
| Less than 2.0x | 55 (42.3%) | 95,938 (55,455.5%) |
| 2.0x to 2.9x | 13 (10.0%) | 96 (55.5%) |
| 3.0x to 3.9x | 23 (17.7%) | 32 (18.5%) |
| 4.0x or more | 39 (30.0%) | 17 (9.8%) |
| Total | 130 (100.0%) | 173 (100.0%) |
Real Estate Taxes by Mortgage Status in Morristown
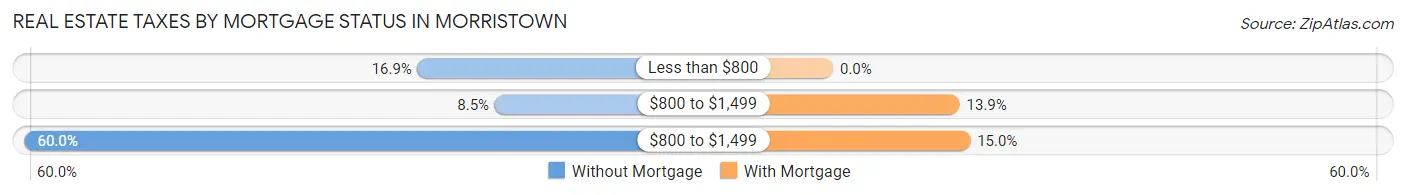
| Property Taxes | Without Mortgage | With Mortgage |
| Less than $800 | 22 (16.9%) | 0 (0.0%) |
| $800 to $1,499 | 11 (8.5%) | 24 (13.9%) |
| $800 to $1,499 | 78 (60.0%) | 26 (15.0%) |
| Total | 130 (100.0%) | 173 (100.0%) |
Health & Disability in Morristown
Health Insurance Coverage by Age in Morristown
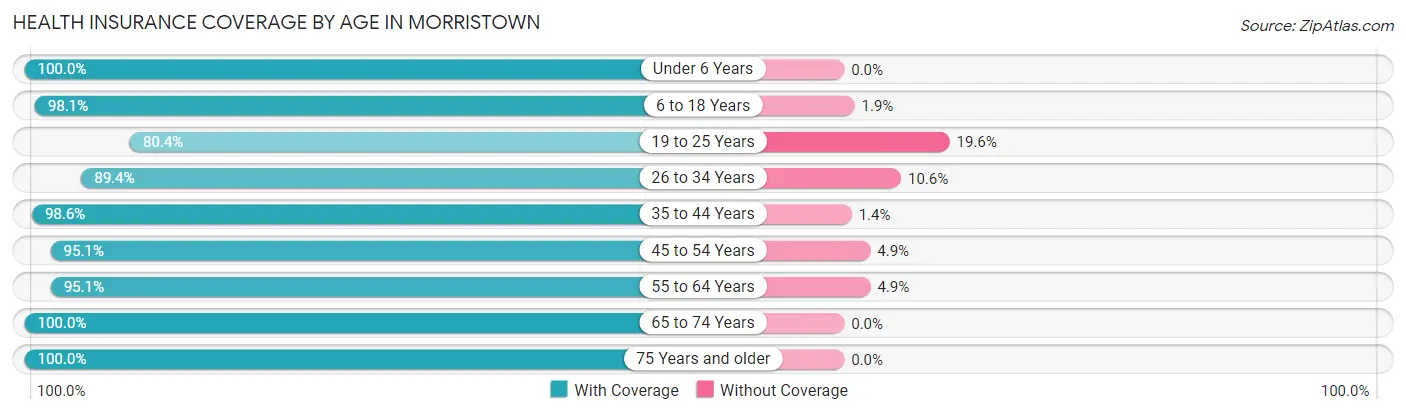
| Age Bracket | With Coverage | Without Coverage |
| Under 6 Years | 63 (100.0%) | 0 (0.0%) |
| 6 to 18 Years | 102 (98.1%) | 2 (1.9%) |
| 19 to 25 Years | 90 (80.4%) | 22 (19.6%) |
| 26 to 34 Years | 93 (89.4%) | 11 (10.6%) |
| 35 to 44 Years | 143 (98.6%) | 2 (1.4%) |
| 45 to 54 Years | 137 (95.1%) | 7 (4.9%) |
| 55 to 64 Years | 117 (95.1%) | 6 (4.9%) |
| 65 to 74 Years | 41 (100.0%) | 0 (0.0%) |
| 75 Years and older | 39 (100.0%) | 0 (0.0%) |
| Total | 825 (94.3%) | 50 (5.7%) |
Health Insurance Coverage by Citizenship Status in Morristown
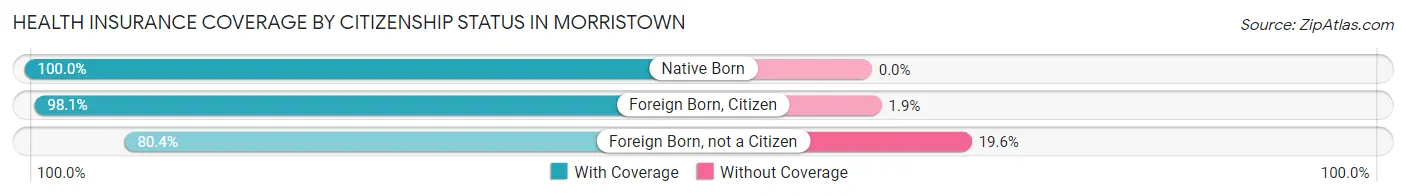
| Citizenship Status | With Coverage | Without Coverage |
| Native Born | 63 (100.0%) | 0 (0.0%) |
| Foreign Born, Citizen | 102 (98.1%) | 2 (1.9%) |
| Foreign Born, not a Citizen | 90 (80.4%) | 22 (19.6%) |
Health Insurance Coverage by Household Income in Morristown
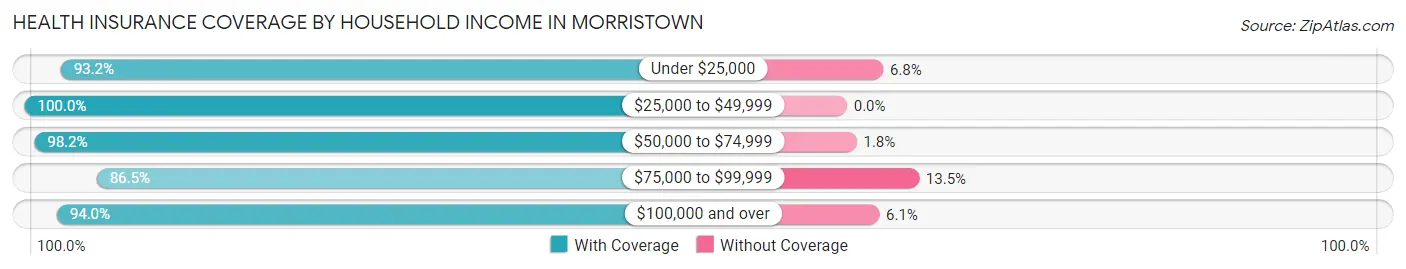
| Household Income | With Coverage | Without Coverage |
| Under $25,000 | 55 (93.2%) | 4 (6.8%) |
| $25,000 to $49,999 | 183 (100.0%) | 0 (0.0%) |
| $50,000 to $74,999 | 108 (98.2%) | 2 (1.8%) |
| $75,000 to $99,999 | 160 (86.5%) | 25 (13.5%) |
| $100,000 and over | 295 (94.0%) | 19 (6.0%) |
Public vs Private Health Insurance Coverage by Age in Morristown
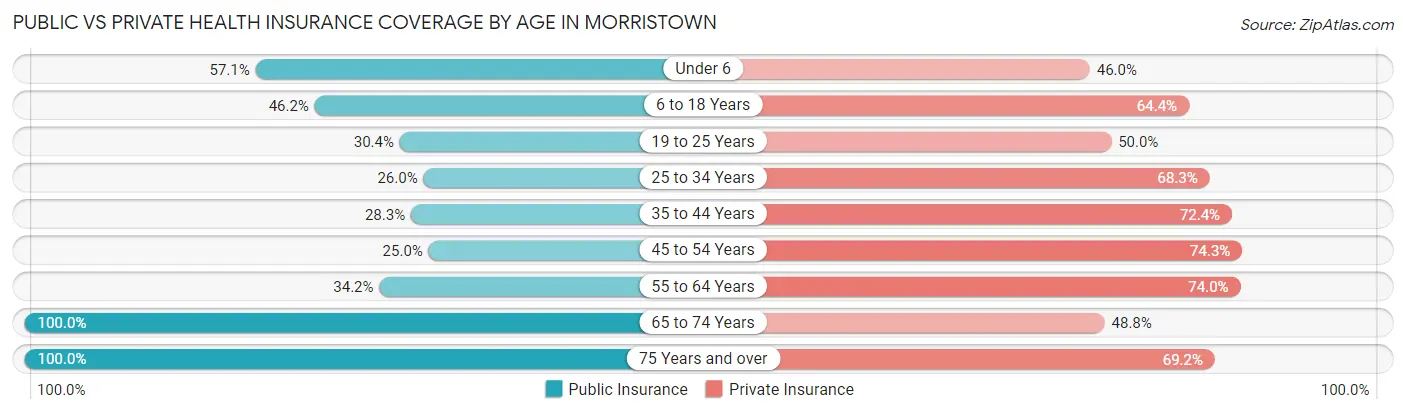
| Age Bracket | Public Insurance | Private Insurance |
| Under 6 | 36 (57.1%) | 29 (46.0%) |
| 6 to 18 Years | 48 (46.2%) | 67 (64.4%) |
| 19 to 25 Years | 34 (30.4%) | 56 (50.0%) |
| 25 to 34 Years | 27 (26.0%) | 71 (68.3%) |
| 35 to 44 Years | 41 (28.3%) | 105 (72.4%) |
| 45 to 54 Years | 36 (25.0%) | 107 (74.3%) |
| 55 to 64 Years | 42 (34.2%) | 91 (74.0%) |
| 65 to 74 Years | 41 (100.0%) | 20 (48.8%) |
| 75 Years and over | 39 (100.0%) | 27 (69.2%) |
| Total | 344 (39.3%) | 573 (65.5%) |
Disability Status by Sex by Age in Morristown
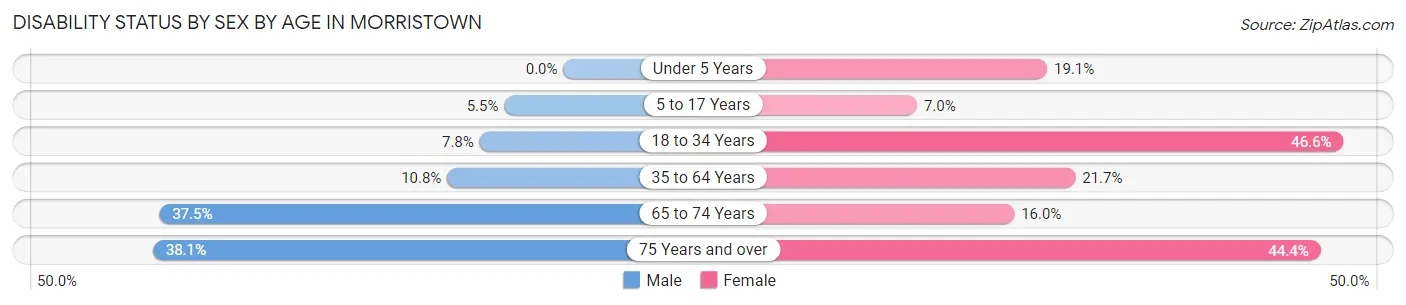
| Age Bracket | Male | Female |
| Under 5 Years | 0 (0.0%) | 4 (19.1%) |
| 5 to 17 Years | 4 (5.5%) | 3 (7.0%) |
| 18 to 34 Years | 8 (7.8%) | 54 (46.6%) |
| 35 to 64 Years | 25 (10.8%) | 39 (21.7%) |
| 65 to 74 Years | 6 (37.5%) | 4 (16.0%) |
| 75 Years and over | 8 (38.1%) | 8 (44.4%) |
Disability Class by Sex by Age in Morristown
Disability Class: Hearing Difficulty
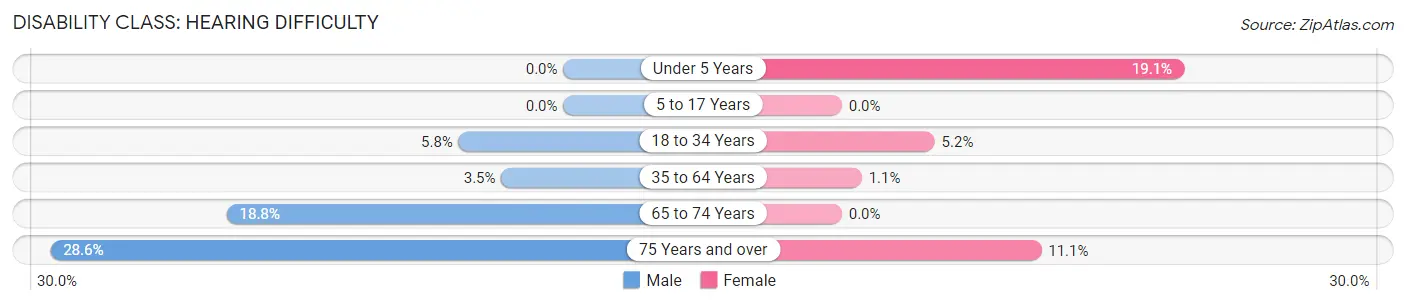
| Age Bracket | Male | Female |
| Under 5 Years | 0 (0.0%) | 4 (19.1%) |
| 5 to 17 Years | 0 (0.0%) | 0 (0.0%) |
| 18 to 34 Years | 6 (5.8%) | 6 (5.2%) |
| 35 to 64 Years | 8 (3.5%) | 2 (1.1%) |
| 65 to 74 Years | 3 (18.8%) | 0 (0.0%) |
| 75 Years and over | 6 (28.6%) | 2 (11.1%) |
Disability Class: Vision Difficulty
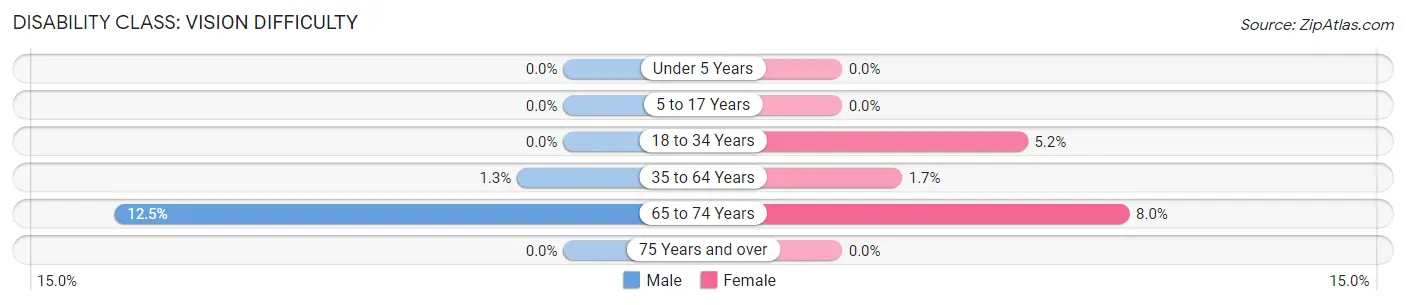
| Age Bracket | Male | Female |
| Under 5 Years | 0 (0.0%) | 0 (0.0%) |
| 5 to 17 Years | 0 (0.0%) | 0 (0.0%) |
| 18 to 34 Years | 0 (0.0%) | 6 (5.2%) |
| 35 to 64 Years | 3 (1.3%) | 3 (1.7%) |
| 65 to 74 Years | 2 (12.5%) | 2 (8.0%) |
| 75 Years and over | 0 (0.0%) | 0 (0.0%) |
Disability Class: Cognitive Difficulty
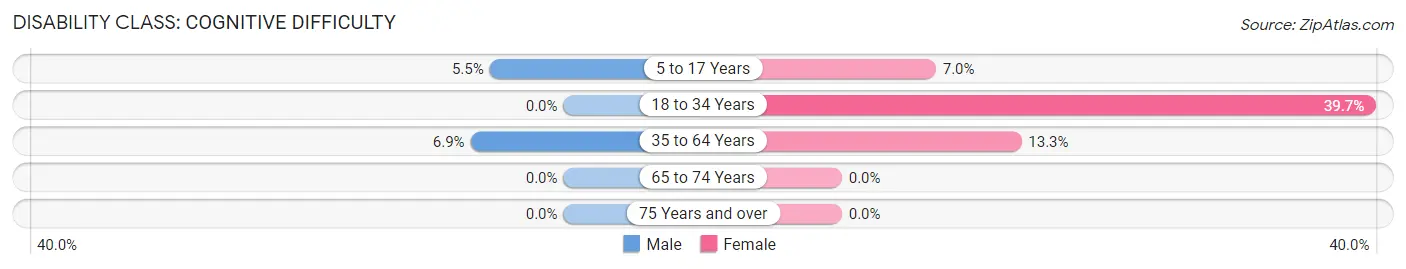
| Age Bracket | Male | Female |
| 5 to 17 Years | 4 (5.5%) | 3 (7.0%) |
| 18 to 34 Years | 0 (0.0%) | 46 (39.7%) |
| 35 to 64 Years | 16 (6.9%) | 24 (13.3%) |
| 65 to 74 Years | 0 (0.0%) | 0 (0.0%) |
| 75 Years and over | 0 (0.0%) | 0 (0.0%) |
Disability Class: Ambulatory Difficulty
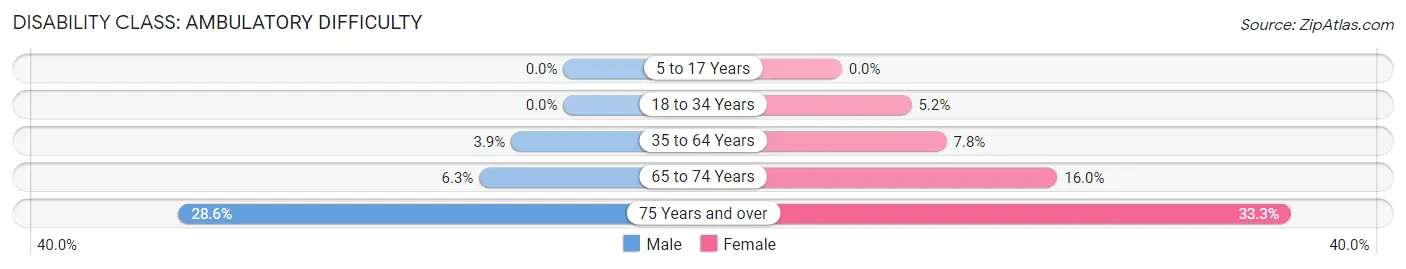
| Age Bracket | Male | Female |
| 5 to 17 Years | 0 (0.0%) | 0 (0.0%) |
| 18 to 34 Years | 0 (0.0%) | 6 (5.2%) |
| 35 to 64 Years | 9 (3.9%) | 14 (7.8%) |
| 65 to 74 Years | 1 (6.2%) | 4 (16.0%) |
| 75 Years and over | 6 (28.6%) | 6 (33.3%) |
Disability Class: Self-Care Difficulty
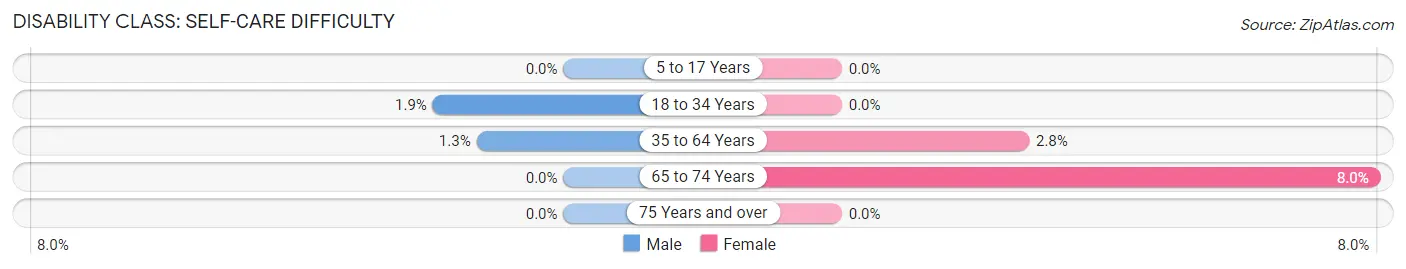
| Age Bracket | Male | Female |
| 5 to 17 Years | 0 (0.0%) | 0 (0.0%) |
| 18 to 34 Years | 2 (1.9%) | 0 (0.0%) |
| 35 to 64 Years | 3 (1.3%) | 5 (2.8%) |
| 65 to 74 Years | 0 (0.0%) | 2 (8.0%) |
| 75 Years and over | 0 (0.0%) | 0 (0.0%) |
Technology Access in Morristown
Computing Device Access in Morristown
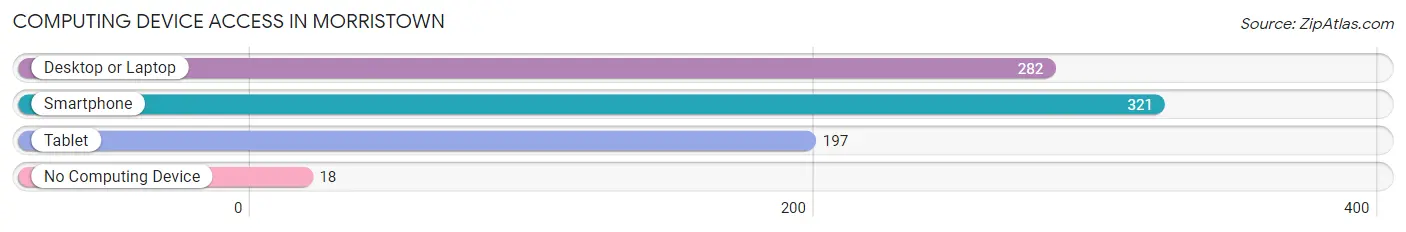
| Device Type | # Households | % Households |
| Desktop or Laptop | 282 | 77.7% |
| Smartphone | 321 | 88.4% |
| Tablet | 197 | 54.3% |
| No Computing Device | 18 | 5.0% |
| Total | 363 | 100.0% |
Internet Access in Morristown
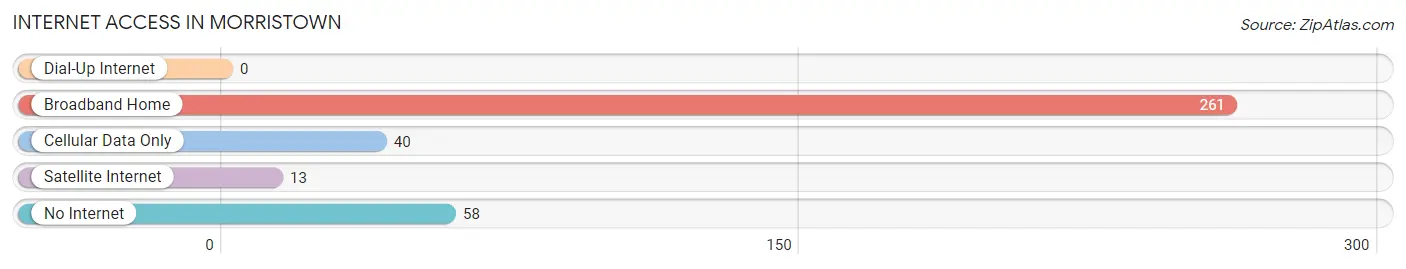
| Internet Type | # Households | % Households |
| Dial-Up Internet | 0 | 0.0% |
| Broadband Home | 261 | 71.9% |
| Cellular Data Only | 40 | 11.0% |
| Satellite Internet | 13 | 3.6% |
| No Internet | 58 | 16.0% |
| Total | 363 | 100.0% |
Morristown Summary
Morristown, Minnesota is a small city located in Rice County, Minnesota. It is situated on the Cannon River, approximately 40 miles south of the Twin Cities. The city has a population of 1,845 people, according to the 2010 census.
History
Morristown was founded in 1856 by William Morris, a settler from England. Morris was a farmer and saw the potential of the area for agricultural production. He purchased land from the Dakota Indians and began to build a settlement. The town was originally called Morrisville, but the name was changed to Morristown in 1858.
The town grew slowly but steadily over the years, and by the turn of the century, it had become a thriving agricultural center. The town was home to several businesses, including a flour mill, a creamery, a lumber yard, and a blacksmith shop.
In the early 1900s, the town began to experience a period of growth and prosperity. The railroad arrived in 1906, and the town was incorporated in 1907. The population grew to over 1,000 by 1910.
Geography
Morristown is located in Rice County, Minnesota. It is situated on the Cannon River, approximately 40 miles south of the Twin Cities. The city has a total area of 1.2 square miles, all of which is land. The terrain is mostly flat, with some rolling hills in the area.
The climate in Morristown is typical of the Midwest, with cold winters and hot summers. The average temperature in January is around 16 degrees Fahrenheit, and the average temperature in July is around 75 degrees Fahrenheit.
Economy
The economy of Morristown is largely based on agriculture. The town is home to several farms, which produce a variety of crops, including corn, soybeans, and wheat. The town is also home to several businesses, including a lumber yard, a hardware store, and a grocery store.
The town is also home to several manufacturing companies, including a plastics manufacturer and a metal fabrication company. The town is also home to a number of small businesses, including restaurants, retail stores, and service providers.
Demographics
According to the 2010 census, the population of Morristown was 1,845. The racial makeup of the town was 97.3% White, 0.7% African American, 0.2% Native American, 0.2% Asian, 0.1% Pacific Islander, 0.5% from other races, and 1.1% from two or more races. Hispanic or Latino of any race were 1.3% of the population.
The median household income in Morristown was $45,938, and the median family income was $54,844. The per capita income was $20,945. About 8.2% of families and 10.2% of the population were below the poverty line, including 14.2% of those under age 18 and 8.3% of those age 65 or over.
Morristown is a small town with a rich history and a strong agricultural economy. The town is home to a diverse population, and it offers a variety of businesses and services. The town is a great place to live, work, and raise a family.
Common Questions
What is the Total Population of Morristown?
Total Population of Morristown is 912.
What is the Total Male Population of Morristown?
Total Male Population of Morristown is 472.
What is the Total Female Population of Morristown?
Total Female Population of Morristown is 440.
What is the Ratio of Males per 100 Females in Morristown?
There are 107.27 Males per 100 Females in Morristown.
What is the Ratio of Females per 100 Males in Morristown?
There are 93.22 Females per 100 Males in Morristown.
What is the Median Population Age in Morristown?
Median Population Age in Morristown is 40.8 Years.
What is the Average Family Size in Morristown
Average Family Size in Morristown is 3.0 People.
What is the Average Household Size in Morristown
Average Household Size in Morristown is 2.3 People.
What is Per Capita Income in Morristown?
Per Capita income in Morristown is $35,271.
What is the Median Family Income in Morristown?
Median Family Income in Morristown is $80,625.
What is the Median Household income in Morristown?
Median Household Income in Morristown is $75,054.
What is Income or Wage Gap in Morristown?
Income or Wage Gap in Morristown is 21.0%.
Women in Morristown earn 79.0 cents for every dollar earned by a man.
What is Inequality or Gini Index in Morristown?
Inequality or Gini Index in Morristown is 0.40.
How Large is the Labor Force in Morristown?
There are 563 People in the Labor Forcein in Morristown.
What is the Percentage of People in the Labor Force in Morristown?
73.3% of People are in the Labor Force in Morristown.
What is the Unemployment Rate in Morristown?
Unemployment Rate in Morristown is 6.7%.