Glennville, GA
Glennville Map
Glennville Overview
5,204
TOTAL POPULATION
3,181
MALE POPULATION
2,023
FEMALE POPULATION
157.24
MALES / 100 FEMALES
63.60
FEMALES / 100 MALES
37.8
MEDIAN AGE
3.0
AVG FAMILY SIZE
2.3
AVG HOUSEHOLD SIZE
$19,329
PER CAPITA INCOME
$63,969
AVG FAMILY INCOME
$47,227
AVG HOUSEHOLD INCOME
0.46
INEQUALITY / GINI INDEX
1,729
LABOR FORCE [ PEOPLE ]
39.2%
PERCENT IN LABOR FORCE
8.4%
UNEMPLOYMENT RATE
Glennville Zip Codes
Glennville Area Codes
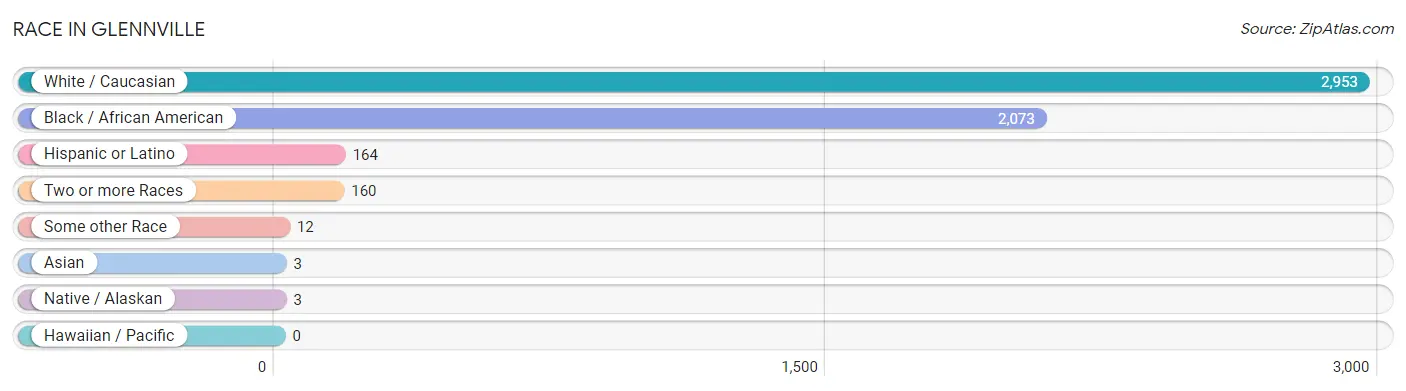
Race in Glennville
The most populous races in Glennville are White / Caucasian (2,953 | 56.7%), Black / African American (2,073 | 39.8%), and Hispanic or Latino (164 | 3.2%).
| Race | # Population | % Population |
| Asian | 3 | 0.1% |
| Black / African American | 2,073 | 39.8% |
| Hawaiian / Pacific | 0 | 0.0% |
| Hispanic or Latino | 164 | 3.2% |
| Native / Alaskan | 3 | 0.1% |
| White / Caucasian | 2,953 | 56.7% |
| Two or more Races | 160 | 3.1% |
| Some other Race | 12 | 0.2% |
| Total | 5,204 | 100.0% |
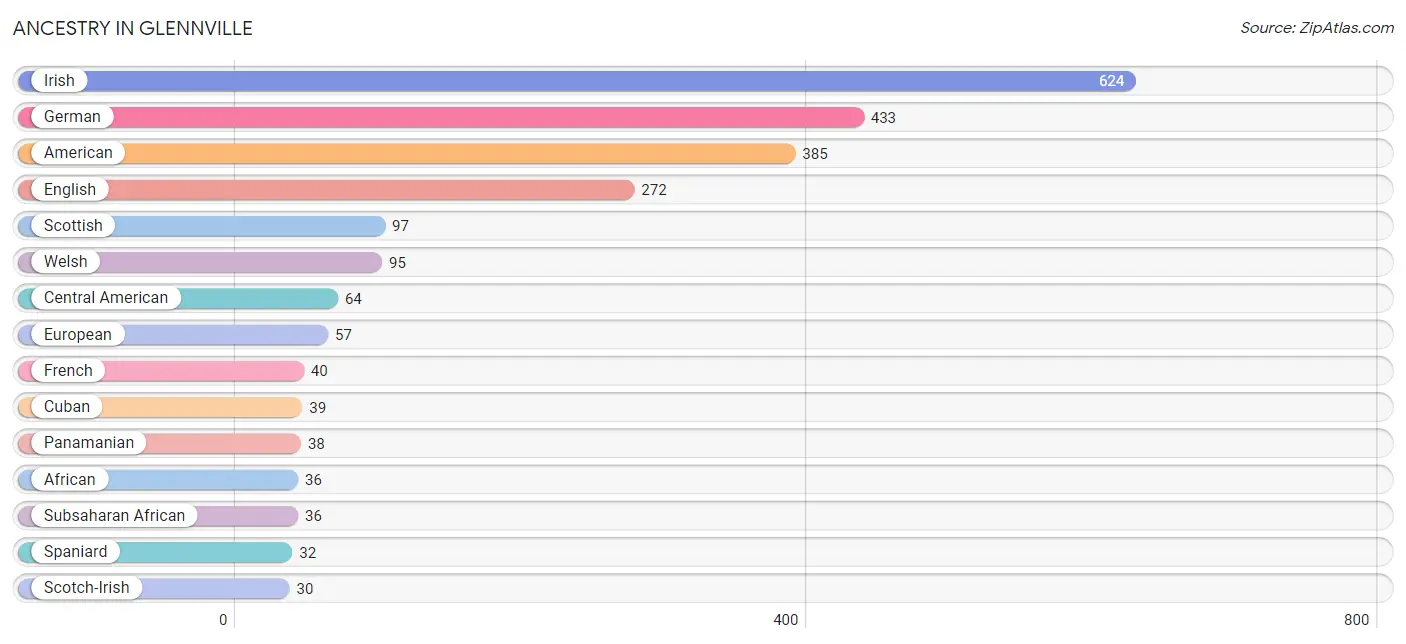
Ancestry in Glennville
The most populous ancestries reported in Glennville are Irish (624 | 12.0%), German (433 | 8.3%), American (385 | 7.4%), English (272 | 5.2%), and Scottish (97 | 1.9%), together accounting for 34.8% of all Glennville residents.
| Ancestry | # Population | % Population |
| African | 36 | 0.7% |
| American | 385 | 7.4% |
| British | 8 | 0.2% |
| Central American | 64 | 1.2% |
| Cherokee | 1 | 0.0% |
| Cuban | 39 | 0.7% |
| Dutch West Indian | 17 | 0.3% |
| English | 272 | 5.2% |
| European | 57 | 1.1% |
| French | 40 | 0.8% |
| German | 433 | 8.3% |
| Guatemalan | 26 | 0.5% |
| Irish | 624 | 12.0% |
| Mexican | 17 | 0.3% |
| Mexican American Indian | 2 | 0.0% |
| Panamanian | 38 | 0.7% |
| Polish | 24 | 0.5% |
| Puerto Rican | 8 | 0.2% |
| Scotch-Irish | 30 | 0.6% |
| Scottish | 97 | 1.9% |
| Serbian | 18 | 0.4% |
| Spaniard | 32 | 0.6% |
| Subsaharan African | 36 | 0.7% |
| Thai | 3 | 0.1% |
| Welsh | 95 | 1.8% | View All 25 Rows |
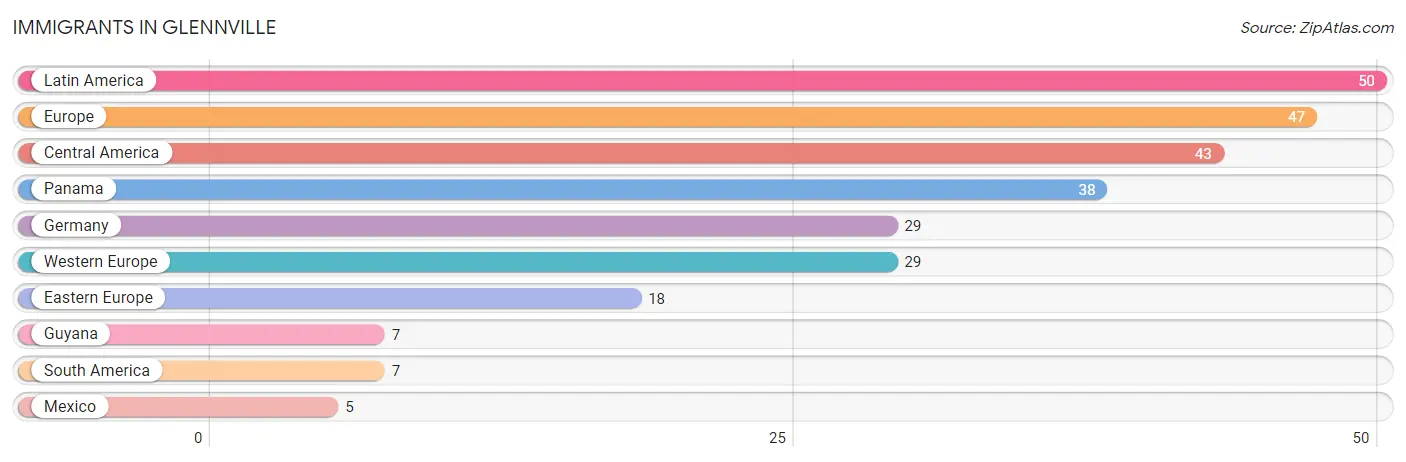
Immigrants in Glennville
The most numerous immigrant groups reported in Glennville came from Latin America (50 | 1.0%), Europe (47 | 0.9%), Central America (43 | 0.8%), Panama (38 | 0.7%), and Germany (29 | 0.6%), together accounting for 4.0% of all Glennville residents.
| Immigration Origin | # Population | % Population |
| Central America | 43 | 0.8% |
| Eastern Europe | 18 | 0.4% |
| Europe | 47 | 0.9% |
| Germany | 29 | 0.6% |
| Guyana | 7 | 0.1% |
| Latin America | 50 | 1.0% |
| Mexico | 5 | 0.1% |
| Panama | 38 | 0.7% |
| South America | 7 | 0.1% |
| Western Europe | 29 | 0.6% | View All 10 Rows |
Sex and Age in Glennville
Sex and Age in Glennville
The most populous age groups in Glennville are 25 to 29 Years (376 | 11.8%) for men and 5 to 9 Years (256 | 12.7%) for women.
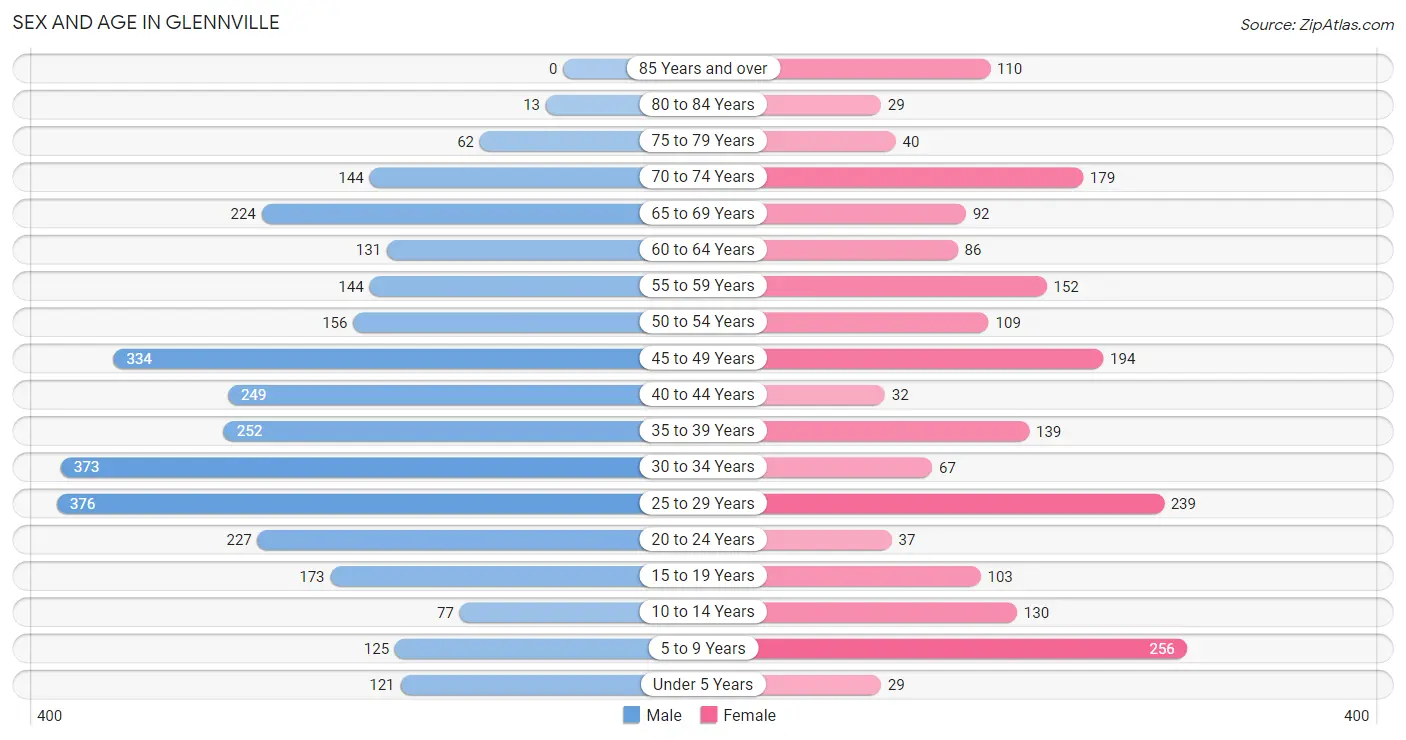
| Age Bracket | Male | Female |
| Under 5 Years | 121 (3.8%) | 29 (1.4%) |
| 5 to 9 Years | 125 (3.9%) | 256 (12.7%) |
| 10 to 14 Years | 77 (2.4%) | 130 (6.4%) |
| 15 to 19 Years | 173 (5.4%) | 103 (5.1%) |
| 20 to 24 Years | 227 (7.1%) | 37 (1.8%) |
| 25 to 29 Years | 376 (11.8%) | 239 (11.8%) |
| 30 to 34 Years | 373 (11.7%) | 67 (3.3%) |
| 35 to 39 Years | 252 (7.9%) | 139 (6.9%) |
| 40 to 44 Years | 249 (7.8%) | 32 (1.6%) |
| 45 to 49 Years | 334 (10.5%) | 194 (9.6%) |
| 50 to 54 Years | 156 (4.9%) | 109 (5.4%) |
| 55 to 59 Years | 144 (4.5%) | 152 (7.5%) |
| 60 to 64 Years | 131 (4.1%) | 86 (4.3%) |
| 65 to 69 Years | 224 (7.0%) | 92 (4.5%) |
| 70 to 74 Years | 144 (4.5%) | 179 (8.8%) |
| 75 to 79 Years | 62 (1.9%) | 40 (2.0%) |
| 80 to 84 Years | 13 (0.4%) | 29 (1.4%) |
| 85 Years and over | 0 (0.0%) | 110 (5.4%) |
| Total | 3,181 (100.0%) | 2,023 (100.0%) |
Families and Households in Glennville
Median Family Size in Glennville
The median family size in Glennville is 3.05 persons per family, with single female/mother families (277 | 29.9%) accounting for the largest median family size of 3.22 persons per family. On the other hand, single male/father families (9 | 1.0%) represent the smallest median family size with 2.11 persons per family.
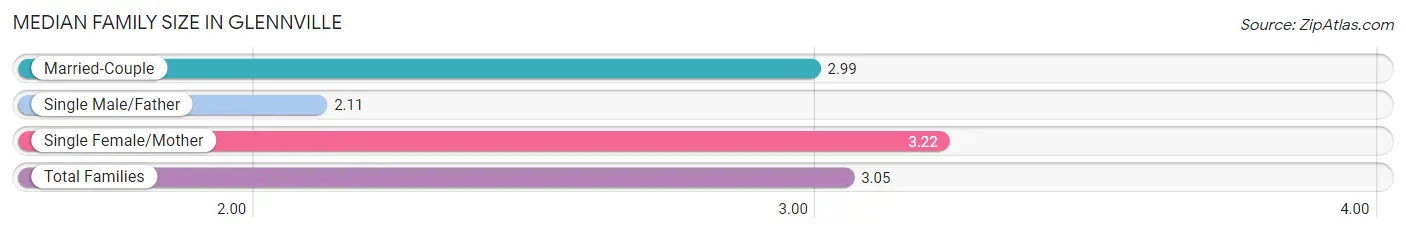
| Family Type | # Families | Family Size |
| Married-Couple | 639 (69.1%) | 2.99 |
| Single Male/Father | 9 (1.0%) | 2.11 |
| Single Female/Mother | 277 (29.9%) | 3.22 |
| Total Families | 925 (100.0%) | 3.05 |
Median Household Size in Glennville
The median household size in Glennville is 2.33 persons per household, with single female/mother households (277 | 18.8%) accounting for the largest median household size of 3.27 persons per household. non-family households (546 | 37.1%) represent the smallest median household size with 1.08 persons per household.
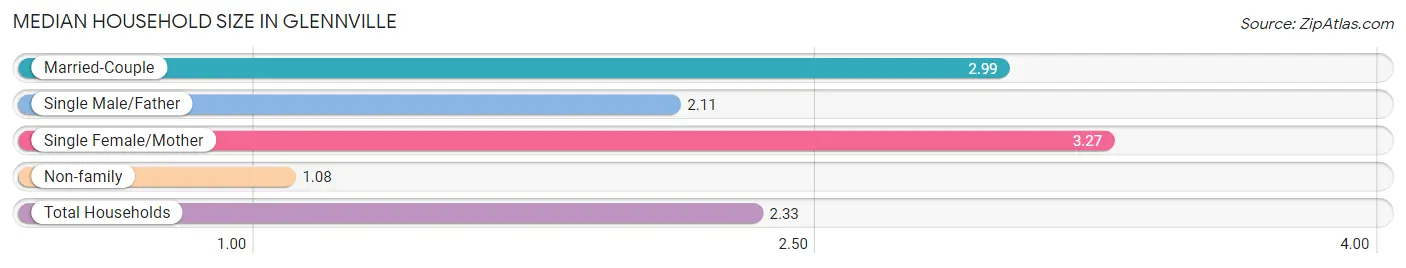
| Household Type | # Households | Household Size |
| Married-Couple | 639 (43.4%) | 2.99 |
| Single Male/Father | 9 (0.6%) | 2.11 |
| Single Female/Mother | 277 (18.8%) | 3.27 |
| Non-family | 546 (37.1%) | 1.08 |
| Total Households | 1,471 (100.0%) | 2.33 |
Household Size by Marriage Status in Glennville
Out of a total of 1,471 households in Glennville, 925 (62.9%) are family households, while 546 (37.1%) are nonfamily households. The most numerous type of family households are 2-person households, comprising 386, and the most common type of nonfamily households are 1-person households, comprising 506.
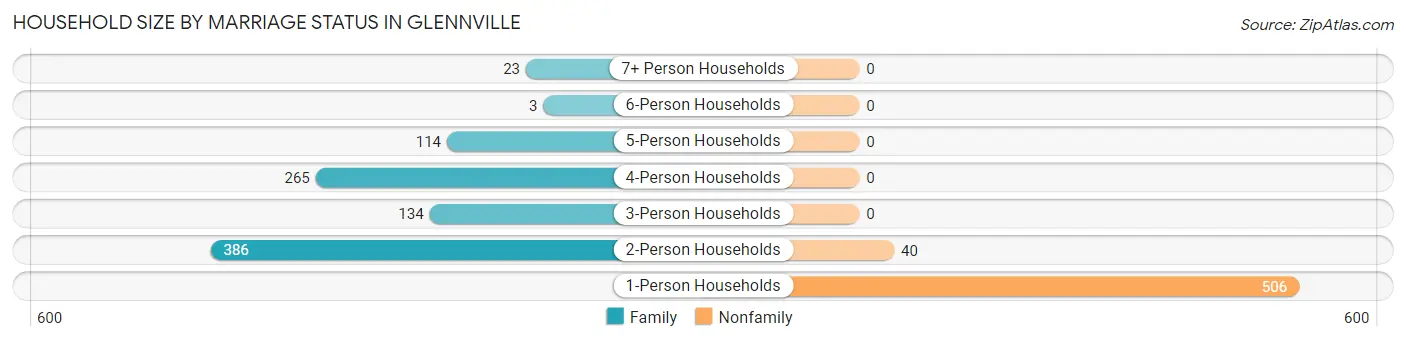
| Household Size | Family Households | Nonfamily Households |
| 1-Person Households | - | 506 (34.4%) |
| 2-Person Households | 386 (26.2%) | 40 (2.7%) |
| 3-Person Households | 134 (9.1%) | 0 (0.0%) |
| 4-Person Households | 265 (18.0%) | 0 (0.0%) |
| 5-Person Households | 114 (7.7%) | 0 (0.0%) |
| 6-Person Households | 3 (0.2%) | 0 (0.0%) |
| 7+ Person Households | 23 (1.6%) | 0 (0.0%) |
| Total | 925 (62.9%) | 546 (37.1%) |
Female Fertility in Glennville
Fertility by Age in Glennville
Average fertility rate in Glennville is 15.0 births per 1,000 women. Women in the age bracket of 20 to 34 years have the highest fertility rate with 38.0 births per 1,000 women. Women in the age bracket of 20 to 34 years acount for 100.0% of all women with births.
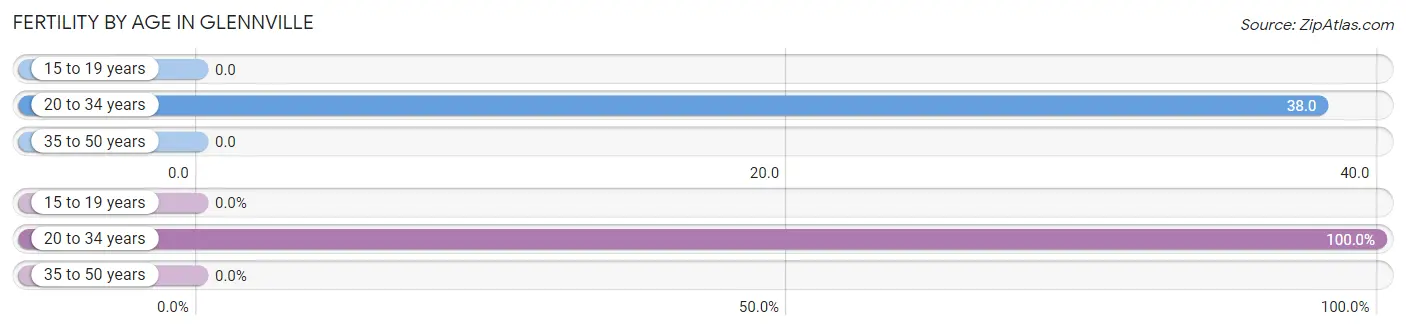
| Age Bracket | Women with Births | Births / 1,000 Women |
| 15 to 19 years | 0 (0.0%) | 0.0 |
| 20 to 34 years | 13 (100.0%) | 38.0 |
| 35 to 50 years | 0 (0.0%) | 0.0 |
| Total | 13 (100.0%) | 15.0 |
Fertility by Age by Marriage Status in Glennville
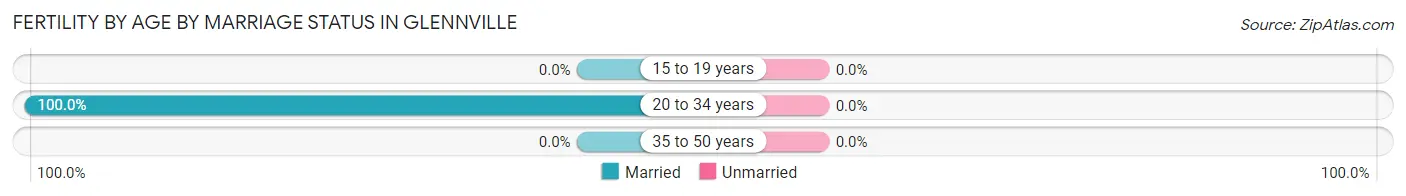
| Age Bracket | Married | Unmarried |
| 15 to 19 years | 0 (0.0%) | 0 (0.0%) |
| 20 to 34 years | 13 (100.0%) | 0 (0.0%) |
| 35 to 50 years | 0 (0.0%) | 0 (0.0%) |
| Total | 13 (100.0%) | 0 (0.0%) |
Fertility by Education in Glennville
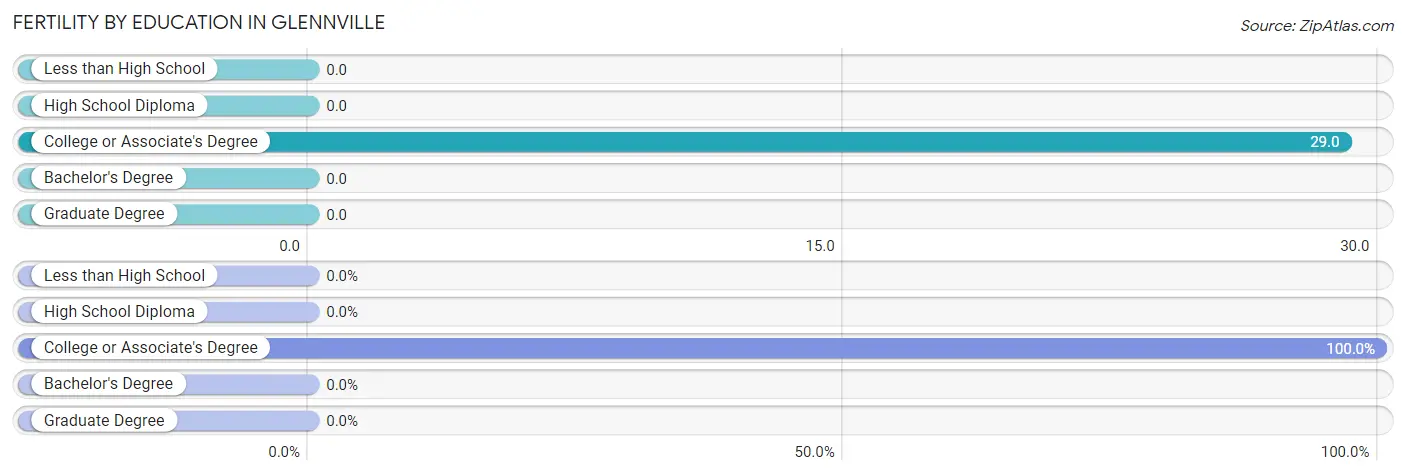
| Educational Attainment | Women with Births | Births / 1,000 Women |
| Less than High School | 0 (0.0%) | 0.0 |
| High School Diploma | 0 (0.0%) | 0.0 |
| College or Associate's Degree | 13 (100.0%) | 29.0 |
| Bachelor's Degree | 0 (0.0%) | 0.0 |
| Graduate Degree | 0 (0.0%) | 0.0 |
| Total | 13 (100.0%) | 15.0 |
Fertility by Education by Marriage Status in Glennville
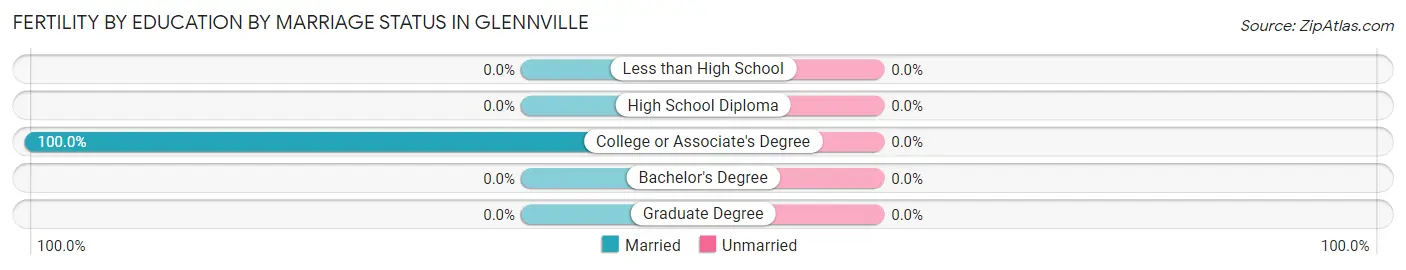
| Educational Attainment | Married | Unmarried |
| Less than High School | 0 (0.0%) | 0 (0.0%) |
| High School Diploma | 0 (0.0%) | 0 (0.0%) |
| College or Associate's Degree | 13 (100.0%) | 0 (0.0%) |
| Bachelor's Degree | 0 (0.0%) | 0 (0.0%) |
| Graduate Degree | 0 (0.0%) | 0 (0.0%) |
| Total | 13 (100.0%) | 0 (0.0%) |
Income in Glennville
Income Overview in Glennville
Per Capita Income in Glennville is $19,329, while median incomes of families and households are $63,969 and $47,227 respectively.
| Characteristic | Number | Measure |
| Per Capita Income | 5,204 | $19,329 |
| Median Family Income | 925 | $63,969 |
| Mean Family Income | 925 | $84,142 |
| Median Household Income | 1,471 | $47,227 |
| Mean Household Income | 1,471 | $63,810 |
| Income Deficit | 925 | $0 |
| Wage / Income Gap (%) | 5,204 | 0.00% |
| Wage / Income Gap ($) | 5,204 | 100.00¢ per $1 |
| Gini / Inequality Index | 5,204 | 0.46 |
Earnings by Sex in Glennville
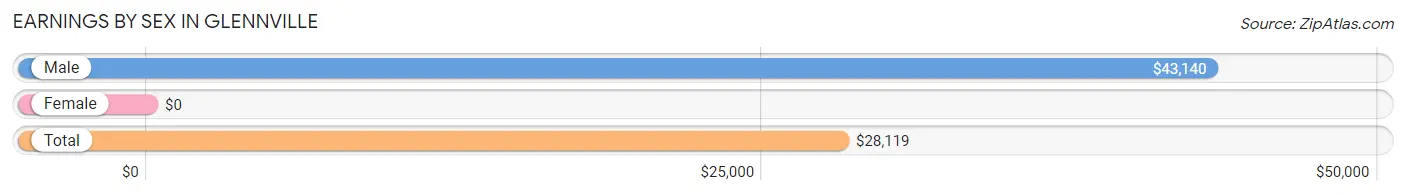
| Sex | Number | Average Earnings |
| Male | 892 (48.7%) | $43,140 |
| Female | 939 (51.3%) | $0 |
| Total | 1,831 (100.0%) | $28,119 |
Earnings by Sex by Income Bracket in Glennville
The most common earnings brackets in Glennville are $2,499 or less for men (189 | 21.2%) and $10,000 to $12,499 for women (151 | 16.1%).
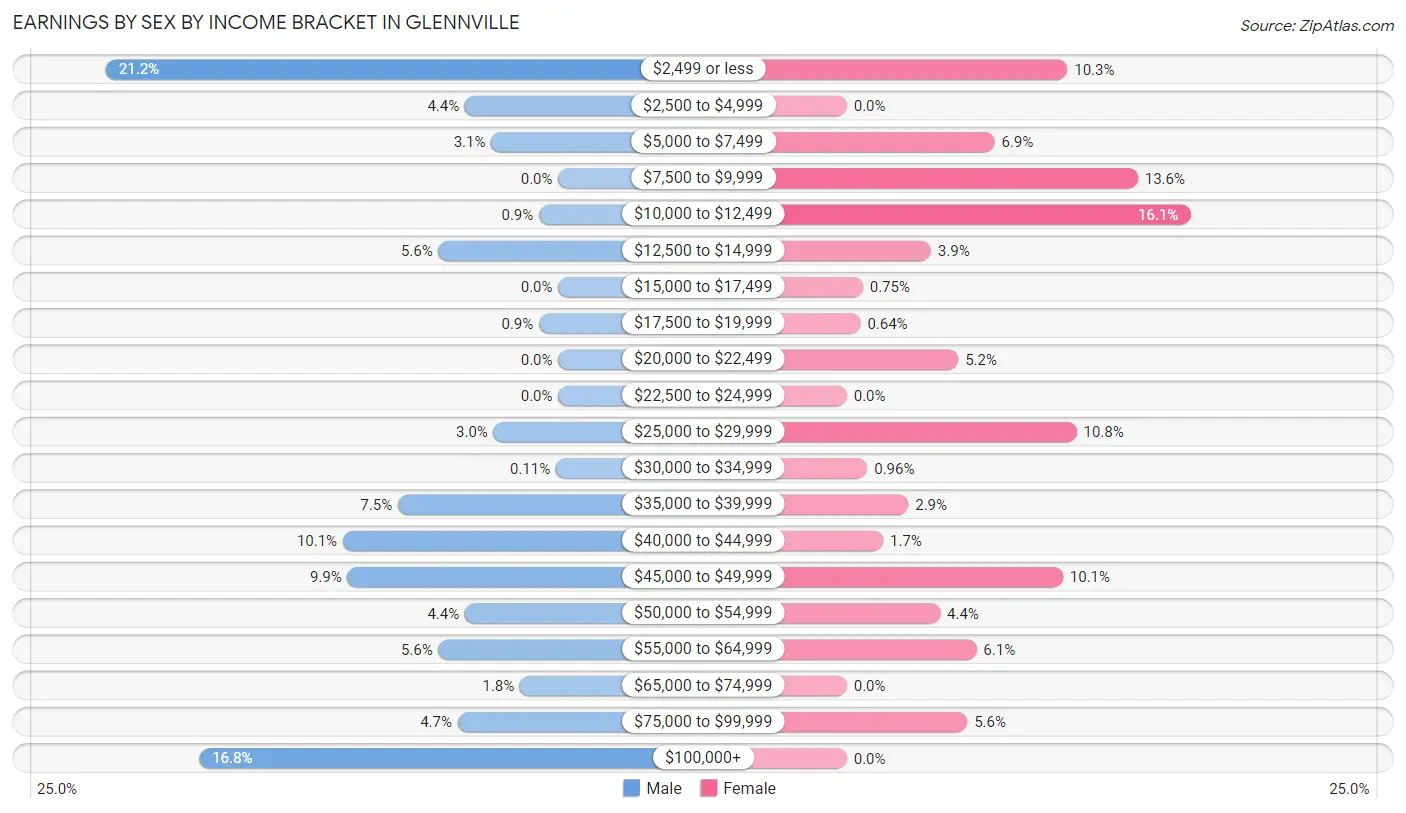
| Income | Male | Female |
| $2,499 or less | 189 (21.2%) | 97 (10.3%) |
| $2,500 to $4,999 | 39 (4.4%) | 0 (0.0%) |
| $5,000 to $7,499 | 28 (3.1%) | 65 (6.9%) |
| $7,500 to $9,999 | 0 (0.0%) | 128 (13.6%) |
| $10,000 to $12,499 | 8 (0.9%) | 151 (16.1%) |
| $12,500 to $14,999 | 50 (5.6%) | 37 (3.9%) |
| $15,000 to $17,499 | 0 (0.0%) | 7 (0.7%) |
| $17,500 to $19,999 | 8 (0.9%) | 6 (0.6%) |
| $20,000 to $22,499 | 0 (0.0%) | 49 (5.2%) |
| $22,500 to $24,999 | 0 (0.0%) | 0 (0.0%) |
| $25,000 to $29,999 | 27 (3.0%) | 101 (10.8%) |
| $30,000 to $34,999 | 1 (0.1%) | 9 (1.0%) |
| $35,000 to $39,999 | 67 (7.5%) | 27 (2.9%) |
| $40,000 to $44,999 | 90 (10.1%) | 16 (1.7%) |
| $45,000 to $49,999 | 88 (9.9%) | 95 (10.1%) |
| $50,000 to $54,999 | 39 (4.4%) | 41 (4.4%) |
| $55,000 to $64,999 | 50 (5.6%) | 57 (6.1%) |
| $65,000 to $74,999 | 16 (1.8%) | 0 (0.0%) |
| $75,000 to $99,999 | 42 (4.7%) | 53 (5.6%) |
| $100,000+ | 150 (16.8%) | 0 (0.0%) |
| Total | 892 (100.0%) | 939 (100.0%) |
Earnings by Sex by Educational Attainment in Glennville
Average earnings in Glennville are $44,055 for men and $20,485 for women, a difference of 53.5%. Men with an educational attainment of high school diploma enjoy the highest average annual earnings of $43,598, while those with high school diploma education earn the least with $43,598. Women with an educational attainment of bachelor's degree earn the most with the average annual earnings of $63,553, while those with bachelor's degree education have the smallest earnings of $63,553.
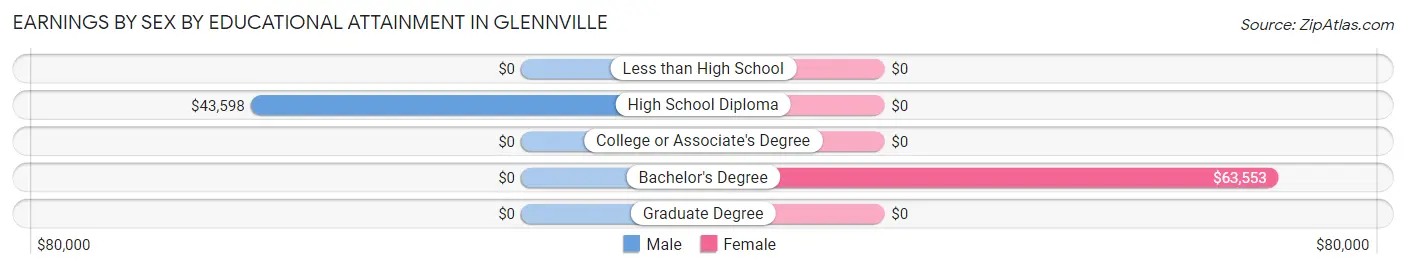
| Educational Attainment | Male Income | Female Income |
| Less than High School | - | - |
| High School Diploma | $43,598 | $0 |
| College or Associate's Degree | - | - |
| Bachelor's Degree | - | - |
| Graduate Degree | - | - |
| Total | $44,055 | $20,485 |
Family Income in Glennville
Family Income Brackets in Glennville
According to the Glennville family income data, there are 325 families falling into the $50,000 to $74,999 income range, which is the most common income bracket and makes up 35.1% of all families. Conversely, the $10,000 to $14,999 income bracket is the least frequent group with only 3 families (0.3%) belonging to this category.
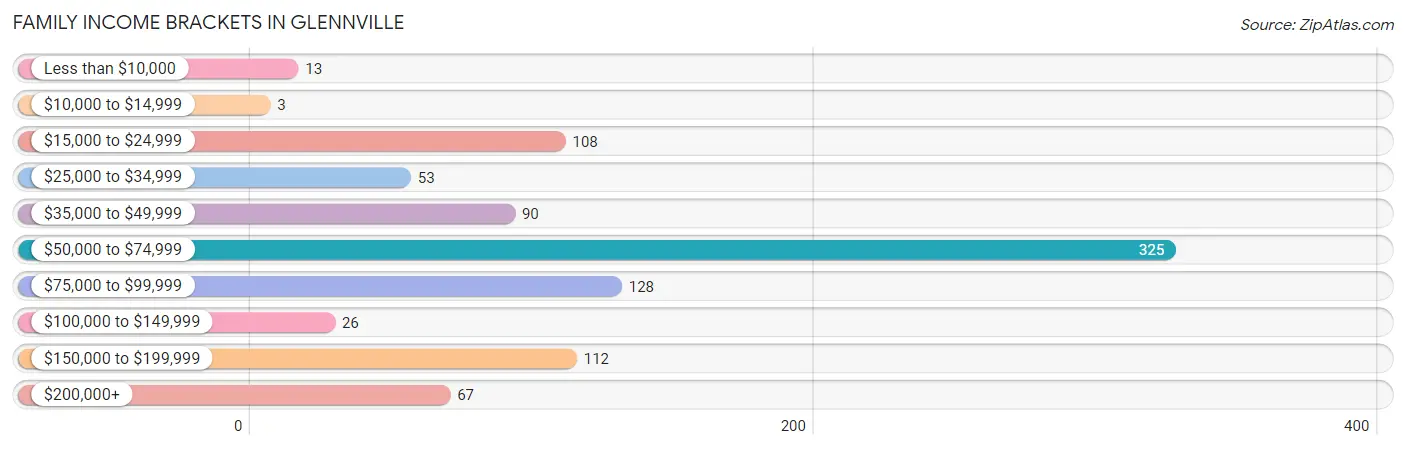
| Income Bracket | # Families | % Families |
| Less than $10,000 | 13 | 1.4% |
| $10,000 to $14,999 | 3 | 0.3% |
| $15,000 to $24,999 | 108 | 11.7% |
| $25,000 to $34,999 | 53 | 5.7% |
| $35,000 to $49,999 | 90 | 9.7% |
| $50,000 to $74,999 | 325 | 35.1% |
| $75,000 to $99,999 | 128 | 13.8% |
| $100,000 to $149,999 | 26 | 2.8% |
| $150,000 to $199,999 | 112 | 12.1% |
| $200,000+ | 67 | 7.2% |
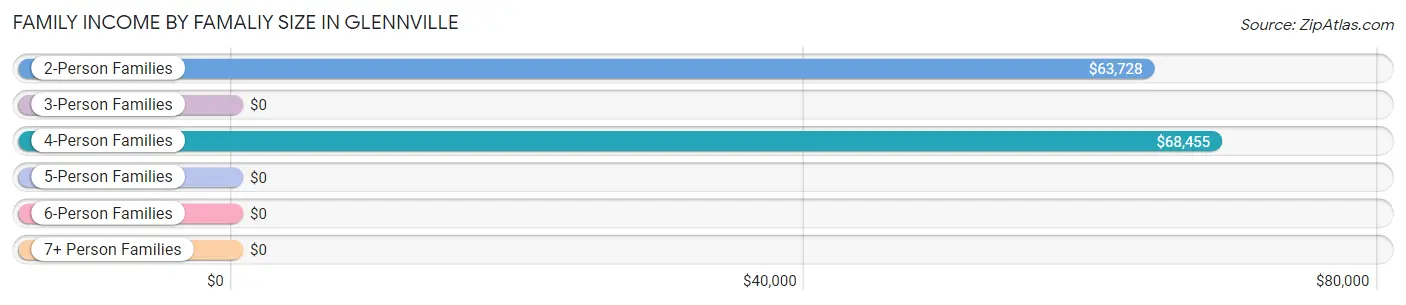
Family Income by Famaliy Size in Glennville
4-person families (265 | 28.6%) account for the highest median family income in Glennville with $68,455 per family, while 2-person families (396 | 42.8%) have the highest median income of $31,864 per family member.
| Income Bracket | # Families | Median Income |
| 2-Person Families | 396 (42.8%) | $63,728 |
| 3-Person Families | 124 (13.4%) | $0 |
| 4-Person Families | 265 (28.6%) | $68,455 |
| 5-Person Families | 114 (12.3%) | $0 |
| 6-Person Families | 3 (0.3%) | $0 |
| 7+ Person Families | 23 (2.5%) | $0 |
| Total | 925 (100.0%) | $63,969 |
Family Income by Number of Earners in Glennville
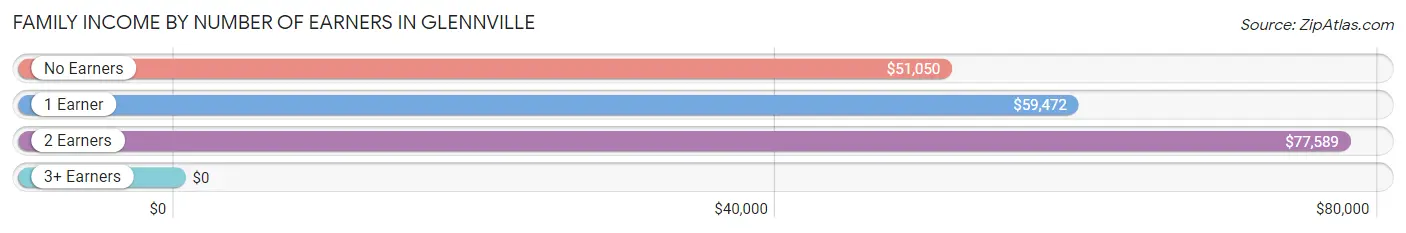
| Number of Earners | # Families | Median Income |
| No Earners | 127 (13.7%) | $51,050 |
| 1 Earner | 360 (38.9%) | $59,472 |
| 2 Earners | 339 (36.6%) | $77,589 |
| 3+ Earners | 99 (10.7%) | $0 |
| Total | 925 (100.0%) | $63,969 |
Household Income in Glennville
Household Income Brackets in Glennville
With 347 households falling in the category, the $50,000 to $74,999 income range is the most frequent in Glennville, accounting for 23.6% of all households. In contrast, only 62 households (4.2%) fall into the $100,000 to $149,999 income bracket, making it the least populous group.
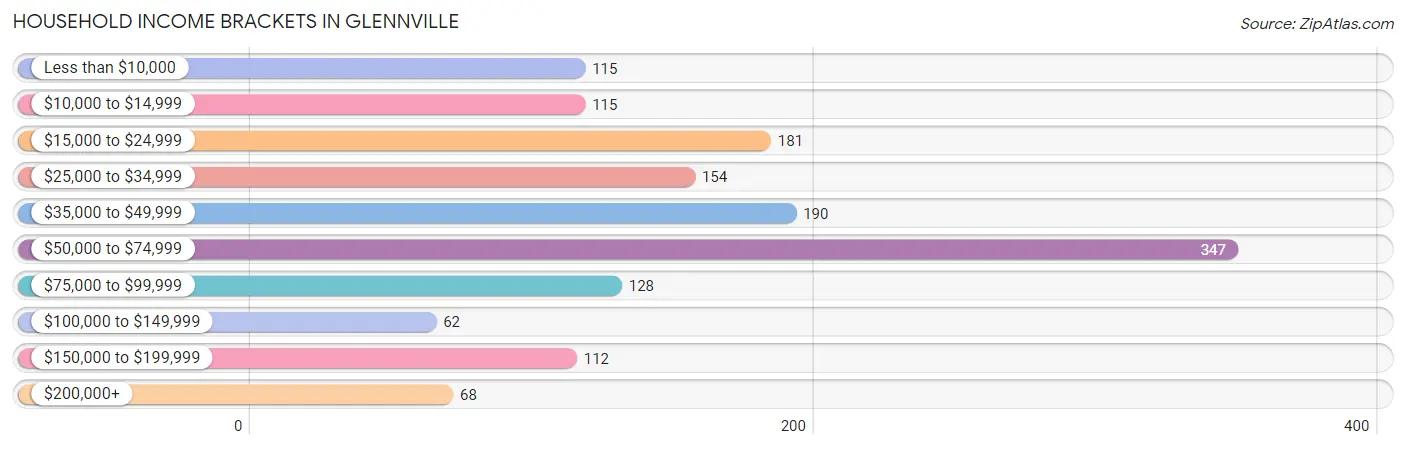
| Income Bracket | # Households | % Households |
| Less than $10,000 | 115 | 7.8% |
| $10,000 to $14,999 | 115 | 7.8% |
| $15,000 to $24,999 | 181 | 12.3% |
| $25,000 to $34,999 | 154 | 10.5% |
| $35,000 to $49,999 | 190 | 12.9% |
| $50,000 to $74,999 | 347 | 23.6% |
| $75,000 to $99,999 | 128 | 8.7% |
| $100,000 to $149,999 | 62 | 4.2% |
| $150,000 to $199,999 | 112 | 7.6% |
| $200,000+ | 68 | 4.6% |
Household Income by Householder Age in Glennville
The median household income in Glennville is $47,227, with the highest median household income of $69,462 found in the 45 to 64 years age bracket for the primary householder. A total of 567 households (38.6%) fall into this category.
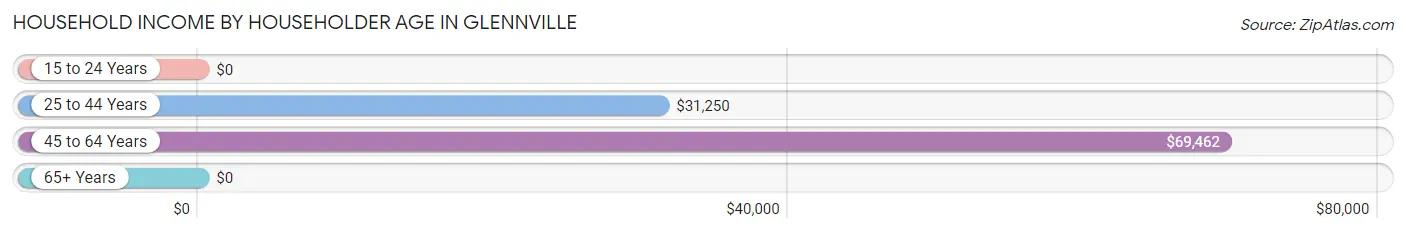
| Income Bracket | # Households | Median Income |
| 15 to 24 Years | 0 (0.0%) | $0 |
| 25 to 44 Years | 342 (23.3%) | $31,250 |
| 45 to 64 Years | 567 (38.6%) | $69,462 |
| 65+ Years | 562 (38.2%) | $0 |
| Total | 1,471 (100.0%) | $47,227 |
Poverty in Glennville
Income Below Poverty by Sex and Age in Glennville
With 17.0% poverty level for males and 12.3% for females among the residents of Glennville, 5 year old males and 65 to 74 year old females are the most vulnerable to poverty, with 5 males (100.0%) and 96 females (36.8%) in their respective age groups living below the poverty level.
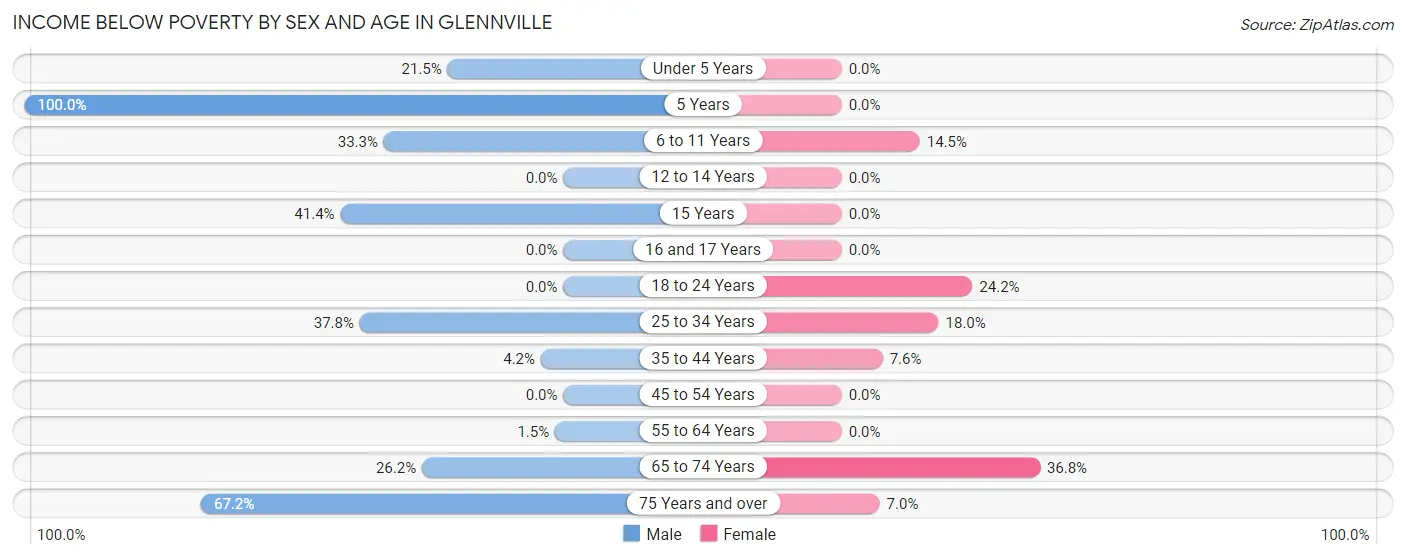
| Age Bracket | Male | Female |
| Under 5 Years | 26 (21.5%) | 0 (0.0%) |
| 5 Years | 5 (100.0%) | 0 (0.0%) |
| 6 to 11 Years | 58 (33.3%) | 43 (14.5%) |
| 12 to 14 Years | 0 (0.0%) | 0 (0.0%) |
| 15 Years | 12 (41.4%) | 0 (0.0%) |
| 16 and 17 Years | 0 (0.0%) | 0 (0.0%) |
| 18 to 24 Years | 0 (0.0%) | 24 (24.2%) |
| 25 to 34 Years | 34 (37.8%) | 55 (18.0%) |
| 35 to 44 Years | 3 (4.2%) | 13 (7.6%) |
| 45 to 54 Years | 0 (0.0%) | 0 (0.0%) |
| 55 to 64 Years | 3 (1.5%) | 0 (0.0%) |
| 65 to 74 Years | 74 (26.2%) | 96 (36.8%) |
| 75 Years and over | 39 (67.2%) | 9 (7.0%) |
| Total | 254 (17.0%) | 240 (12.3%) |
Income Above Poverty by Sex and Age in Glennville
According to the poverty statistics in Glennville, males aged 12 to 14 years and females aged under 5 years are the age groups that are most secure financially, with 100.0% of males and 100.0% of females in these age groups living above the poverty line.
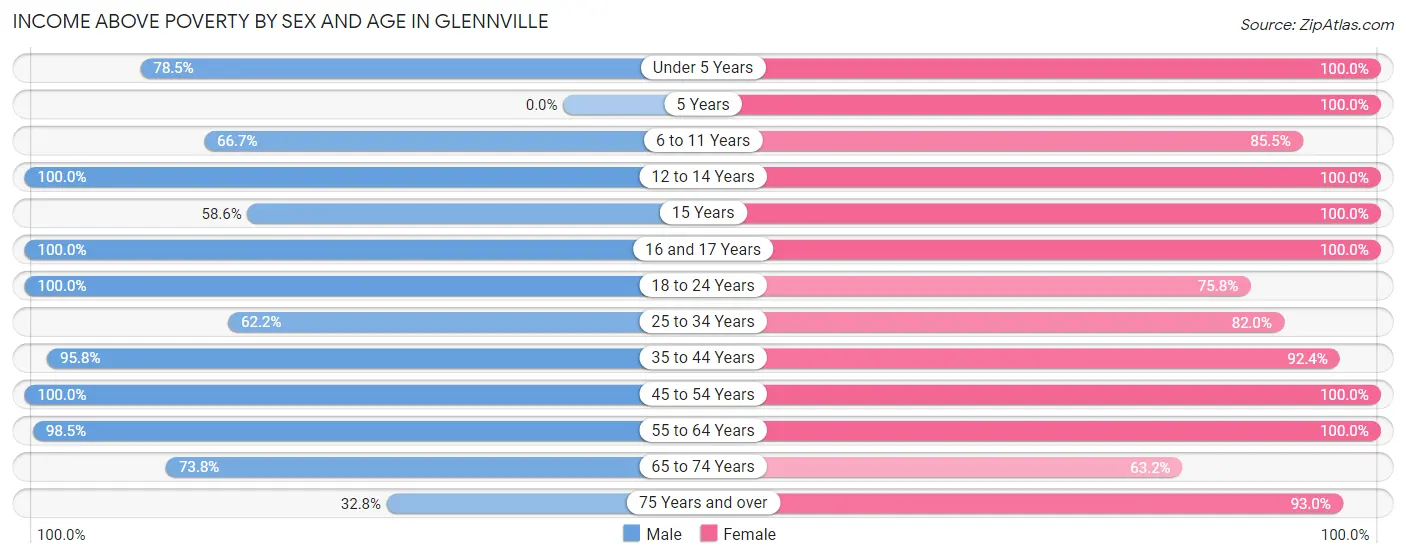
| Age Bracket | Male | Female |
| Under 5 Years | 95 (78.5%) | 29 (100.0%) |
| 5 Years | 0 (0.0%) | 27 (100.0%) |
| 6 to 11 Years | 116 (66.7%) | 254 (85.5%) |
| 12 to 14 Years | 23 (100.0%) | 53 (100.0%) |
| 15 Years | 17 (58.6%) | 27 (100.0%) |
| 16 and 17 Years | 57 (100.0%) | 14 (100.0%) |
| 18 to 24 Years | 115 (100.0%) | 75 (75.8%) |
| 25 to 34 Years | 56 (62.2%) | 251 (82.0%) |
| 35 to 44 Years | 69 (95.8%) | 158 (92.4%) |
| 45 to 54 Years | 275 (100.0%) | 303 (100.0%) |
| 55 to 64 Years | 192 (98.5%) | 238 (100.0%) |
| 65 to 74 Years | 208 (73.8%) | 165 (63.2%) |
| 75 Years and over | 19 (32.8%) | 119 (93.0%) |
| Total | 1,242 (83.0%) | 1,713 (87.7%) |
Income Below Poverty Among Married-Couple Families in Glennville
The poverty statistics for married-couple families in Glennville show that 1.4% or 9 of the total 639 families live below the poverty line. Families with 3 or 4 children have the highest poverty rate of 66.7%, comprising of 6 families. On the other hand, families with 1 or 2 children have the lowest poverty rate of 0.0%, which includes 0 families.
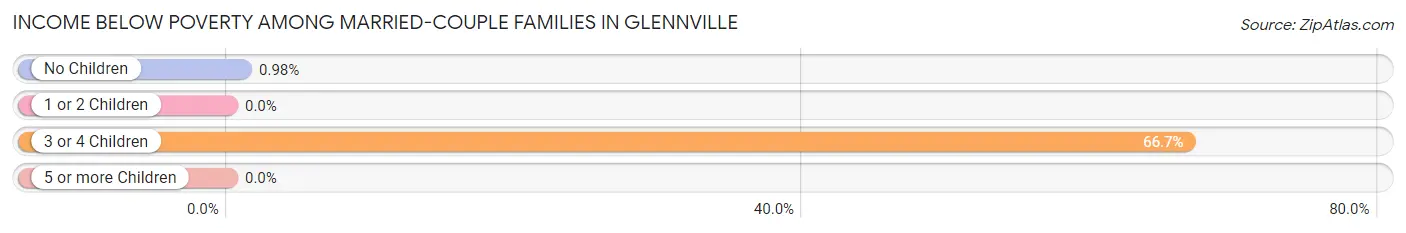
| Children | Above Poverty | Below Poverty |
| No Children | 302 (99.0%) | 3 (1.0%) |
| 1 or 2 Children | 325 (100.0%) | 0 (0.0%) |
| 3 or 4 Children | 3 (33.3%) | 6 (66.7%) |
| 5 or more Children | 0 (0.0%) | 0 (0.0%) |
| Total | 630 (98.6%) | 9 (1.4%) |
Income Below Poverty Among Single-Parent Households in Glennville
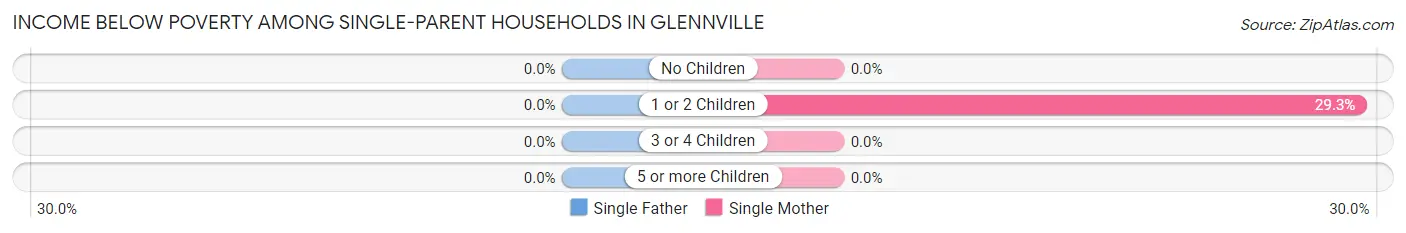
| Children | Single Father | Single Mother |
| No Children | 0 (0.0%) | 0 (0.0%) |
| 1 or 2 Children | 0 (0.0%) | 62 (29.2%) |
| 3 or 4 Children | 0 (0.0%) | 0 (0.0%) |
| 5 or more Children | 0 (0.0%) | 0 (0.0%) |
| Total | 0 (0.0%) | 62 (22.4%) |
Income Below Poverty Among Married-Couple vs Single-Parent Households in Glennville
The poverty data for Glennville shows that 9 of the married-couple family households (1.4%) and 62 of the single-parent households (21.7%) are living below the poverty level. Within the married-couple family households, those with 3 or 4 children have the highest poverty rate, with 6 households (66.7%) falling below the poverty line. Among the single-parent households, those with 1 or 2 children have the highest poverty rate, with 62 household (29.2%) living below poverty.
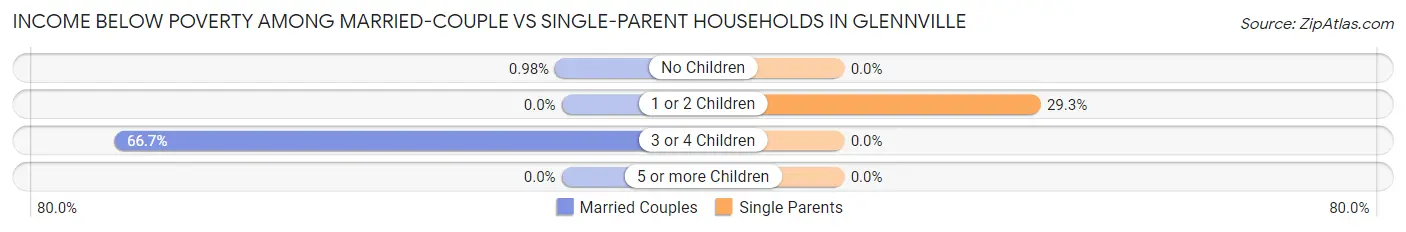
| Children | Married-Couple Families | Single-Parent Households |
| No Children | 3 (1.0%) | 0 (0.0%) |
| 1 or 2 Children | 0 (0.0%) | 62 (29.2%) |
| 3 or 4 Children | 6 (66.7%) | 0 (0.0%) |
| 5 or more Children | 0 (0.0%) | 0 (0.0%) |
| Total | 9 (1.4%) | 62 (21.7%) |
Employment Characteristics in Glennville
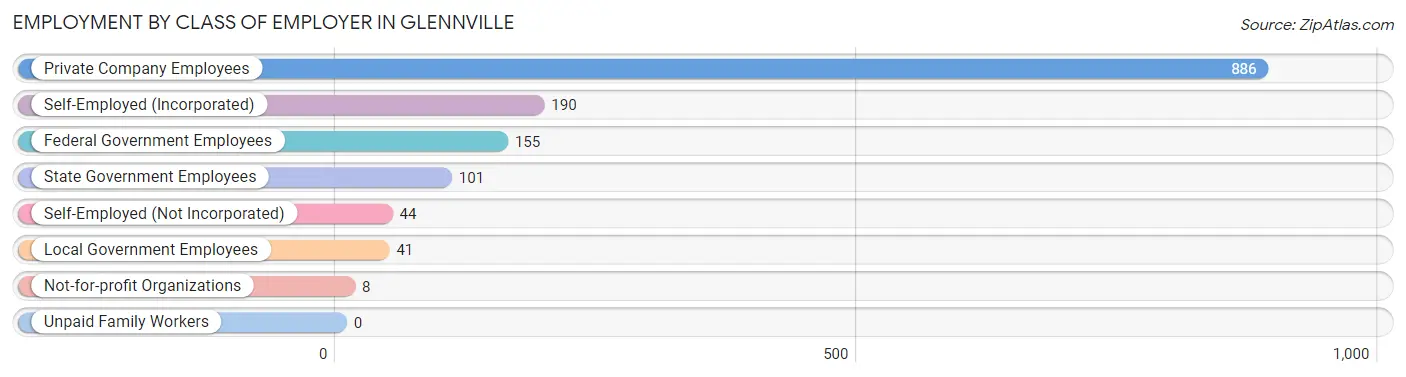
Employment by Class of Employer in Glennville
Among the 1,425 employed individuals in Glennville, private company employees (886 | 62.2%), self-employed (incorporated) (190 | 13.3%), and federal government employees (155 | 10.9%) make up the most common classes of employment.
| Employer Class | # Employees | % Employees |
| Private Company Employees | 886 | 62.2% |
| Self-Employed (Incorporated) | 190 | 13.3% |
| Self-Employed (Not Incorporated) | 44 | 3.1% |
| Not-for-profit Organizations | 8 | 0.6% |
| Local Government Employees | 41 | 2.9% |
| State Government Employees | 101 | 7.1% |
| Federal Government Employees | 155 | 10.9% |
| Unpaid Family Workers | 0 | 0.0% |
| Total | 1,425 | 100.0% |
Employment Status by Age in Glennville
According to the labor force statistics for Glennville, out of the total population over 16 years of age (4,410), 39.2% or 1,729 individuals are in the labor force, with 8.4% or 145 of them unemployed. The age group with the highest labor force participation rate is 16 to 19 years, with 79.1% or 174 individuals in the labor force. Within the labor force, the 20 to 24 years age range has the highest percentage of unemployed individuals, with 42.9% or 18 of them being unemployed.
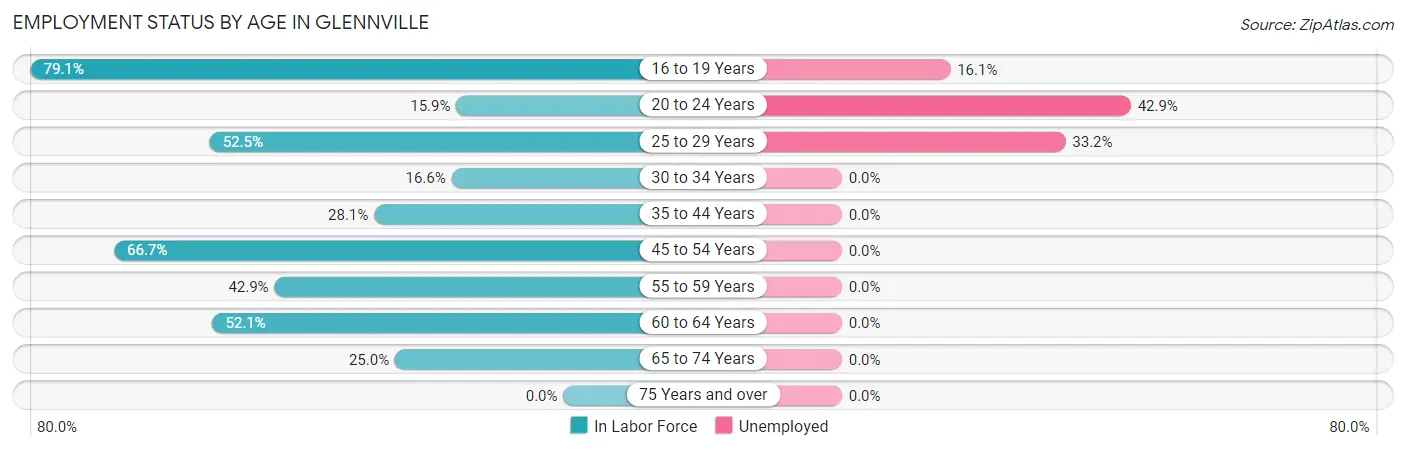
| Age Bracket | In Labor Force | Unemployed |
| 16 to 19 Years | 174 (79.1%) | 28 (16.1%) |
| 20 to 24 Years | 42 (15.9%) | 18 (42.9%) |
| 25 to 29 Years | 323 (52.5%) | 107 (33.2%) |
| 30 to 34 Years | 73 (16.6%) | 0 (0.0%) |
| 35 to 44 Years | 189 (28.1%) | 0 (0.0%) |
| 45 to 54 Years | 529 (66.7%) | 0 (0.0%) |
| 55 to 59 Years | 127 (42.9%) | 0 (0.0%) |
| 60 to 64 Years | 113 (52.1%) | 0 (0.0%) |
| 65 to 74 Years | 160 (25.0%) | 0 (0.0%) |
| 75 Years and over | 0 (0.0%) | 0 (0.0%) |
| Total | 1,729 (39.2%) | 145 (8.4%) |
Employment Status by Educational Attainment in Glennville
According to labor force statistics for Glennville, 44.6% of individuals (1,353) out of the total population between 25 and 64 years of age (3,033) are in the labor force, with 7.4% or 100 of them being unemployed. The group with the highest labor force participation rate are those with the educational attainment of college / associate degree, with 71.9% or 672 individuals in the labor force. Within the labor force, individuals with less than high school education have the highest percentage of unemployment, with 18.4% or 28 of them being unemployed.
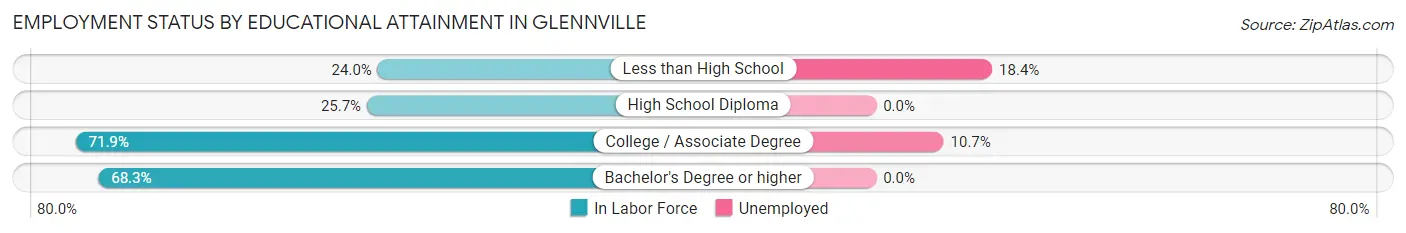
| Educational Attainment | In Labor Force | Unemployed |
| Less than High School | 152 (24.0%) | 116 (18.4%) |
| High School Diploma | 284 (25.7%) | 0 (0.0%) |
| College / Associate Degree | 672 (71.9%) | 100 (10.7%) |
| Bachelor's Degree or higher | 246 (68.3%) | 0 (0.0%) |
| Total | 1,353 (44.6%) | 224 (7.4%) |
Employment Occupations by Sex in Glennville
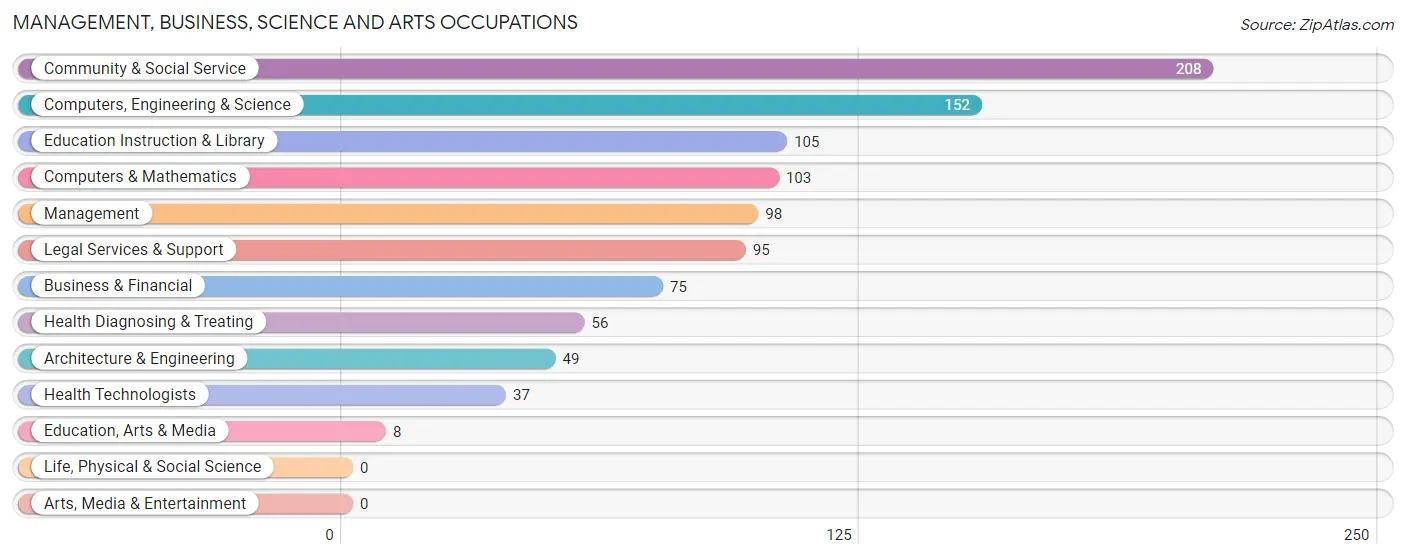
Management, Business, Science and Arts Occupations
The most common Management, Business, Science and Arts occupations in Glennville are Community & Social Service (208 | 13.5%), Computers, Engineering & Science (152 | 9.9%), Education Instruction & Library (105 | 6.8%), Computers & Mathematics (103 | 6.7%), and Management (98 | 6.4%).
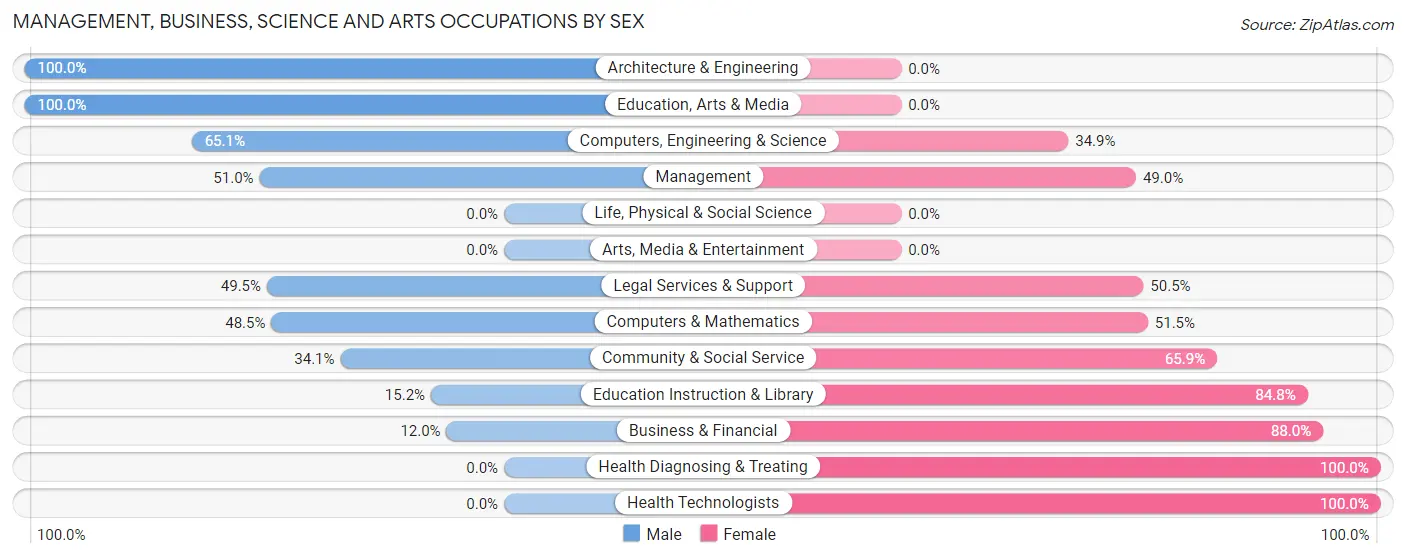
Management, Business, Science and Arts Occupations by Sex
Within the Management, Business, Science and Arts occupations in Glennville, the most male-oriented occupations are Architecture & Engineering (100.0%), Education, Arts & Media (100.0%), and Computers, Engineering & Science (65.1%), while the most female-oriented occupations are Health Diagnosing & Treating (100.0%), Health Technologists (100.0%), and Business & Financial (88.0%).
| Occupation | Male | Female |
| Management | 50 (51.0%) | 48 (49.0%) |
| Business & Financial | 9 (12.0%) | 66 (88.0%) |
| Computers, Engineering & Science | 99 (65.1%) | 53 (34.9%) |
| Computers & Mathematics | 50 (48.5%) | 53 (51.5%) |
| Architecture & Engineering | 49 (100.0%) | 0 (0.0%) |
| Life, Physical & Social Science | 0 (0.0%) | 0 (0.0%) |
| Community & Social Service | 71 (34.1%) | 137 (65.9%) |
| Education, Arts & Media | 8 (100.0%) | 0 (0.0%) |
| Legal Services & Support | 47 (49.5%) | 48 (50.5%) |
| Education Instruction & Library | 16 (15.2%) | 89 (84.8%) |
| Arts, Media & Entertainment | 0 (0.0%) | 0 (0.0%) |
| Health Diagnosing & Treating | 0 (0.0%) | 56 (100.0%) |
| Health Technologists | 0 (0.0%) | 37 (100.0%) |
| Total (Category) | 229 (38.9%) | 360 (61.1%) |
| Total (Overall) | 668 (43.4%) | 871 (56.6%) |
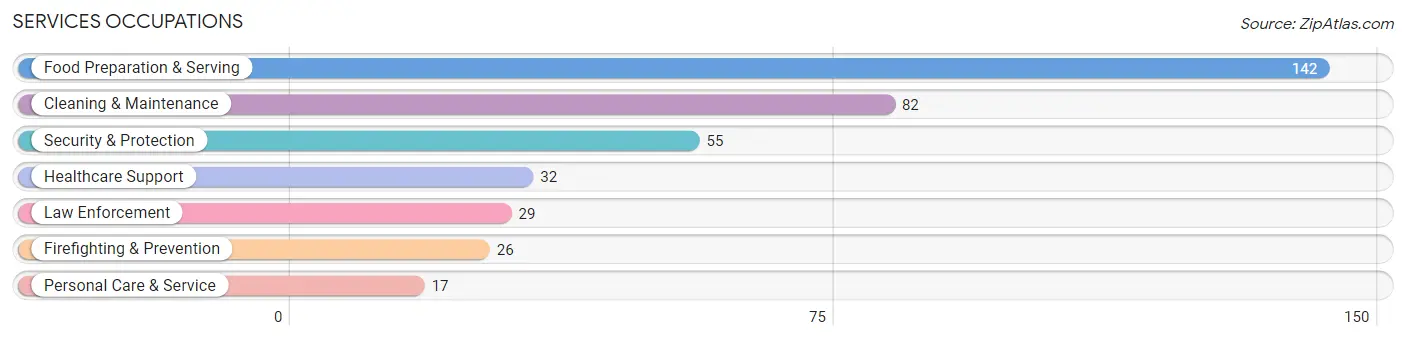
Services Occupations
The most common Services occupations in Glennville are Food Preparation & Serving (142 | 9.2%), Cleaning & Maintenance (82 | 5.3%), Security & Protection (55 | 3.6%), Healthcare Support (32 | 2.1%), and Law Enforcement (29 | 1.9%).
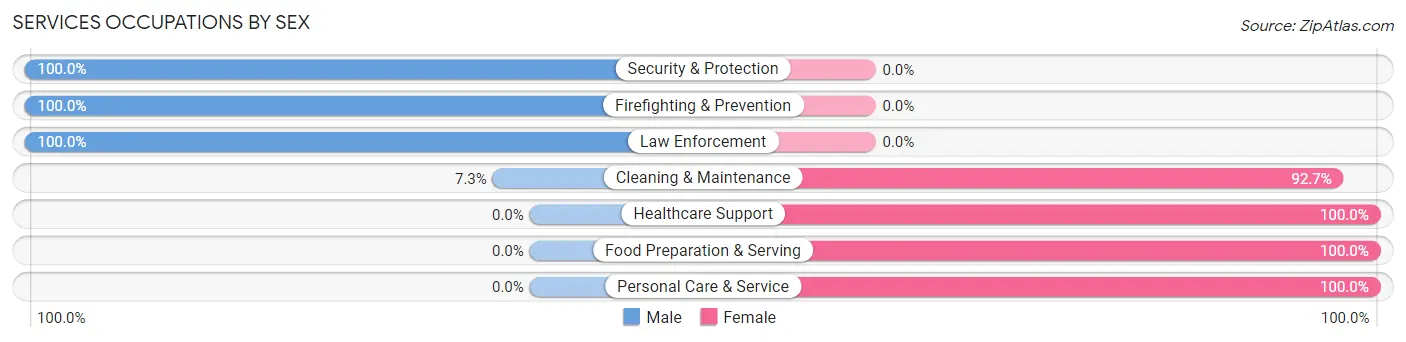
Services Occupations by Sex
Within the Services occupations in Glennville, the most male-oriented occupations are Security & Protection (100.0%), Firefighting & Prevention (100.0%), and Law Enforcement (100.0%), while the most female-oriented occupations are Healthcare Support (100.0%), Food Preparation & Serving (100.0%), and Personal Care & Service (100.0%).
| Occupation | Male | Female |
| Healthcare Support | 0 (0.0%) | 32 (100.0%) |
| Security & Protection | 55 (100.0%) | 0 (0.0%) |
| Firefighting & Prevention | 26 (100.0%) | 0 (0.0%) |
| Law Enforcement | 29 (100.0%) | 0 (0.0%) |
| Food Preparation & Serving | 0 (0.0%) | 142 (100.0%) |
| Cleaning & Maintenance | 6 (7.3%) | 76 (92.7%) |
| Personal Care & Service | 0 (0.0%) | 17 (100.0%) |
| Total (Category) | 61 (18.6%) | 267 (81.4%) |
| Total (Overall) | 668 (43.4%) | 871 (56.6%) |
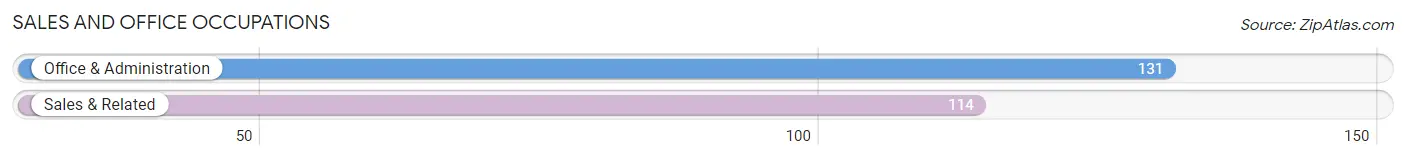
Sales and Office Occupations
The most common Sales and Office occupations in Glennville are Office & Administration (131 | 8.5%), and Sales & Related (114 | 7.4%).
Sales and Office Occupations by Sex
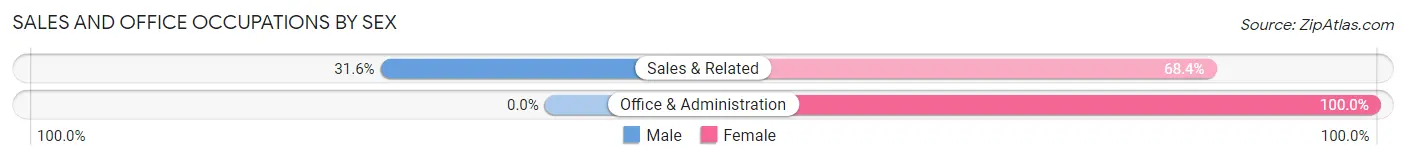
| Occupation | Male | Female |
| Sales & Related | 36 (31.6%) | 78 (68.4%) |
| Office & Administration | 0 (0.0%) | 131 (100.0%) |
| Total (Category) | 36 (14.7%) | 209 (85.3%) |
| Total (Overall) | 668 (43.4%) | 871 (56.6%) |
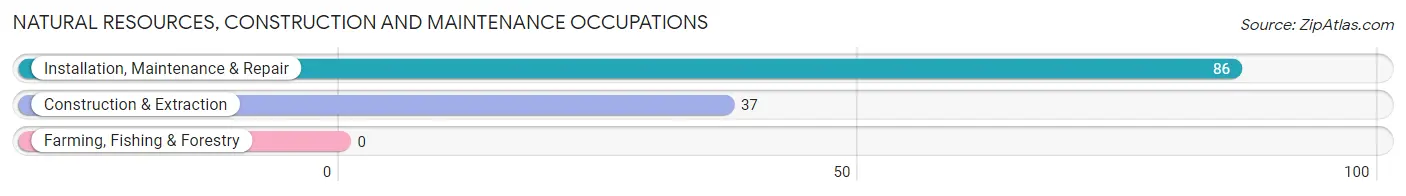
Natural Resources, Construction and Maintenance Occupations
The most common Natural Resources, Construction and Maintenance occupations in Glennville are Installation, Maintenance & Repair (86 | 5.6%), and Construction & Extraction (37 | 2.4%).
Natural Resources, Construction and Maintenance Occupations by Sex
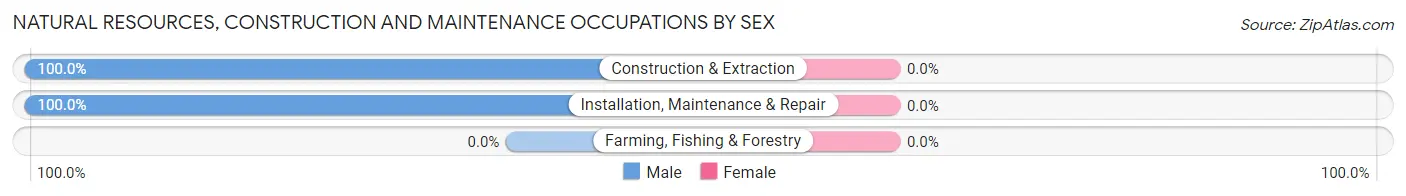
| Occupation | Male | Female |
| Farming, Fishing & Forestry | 0 (0.0%) | 0 (0.0%) |
| Construction & Extraction | 37 (100.0%) | 0 (0.0%) |
| Installation, Maintenance & Repair | 86 (100.0%) | 0 (0.0%) |
| Total (Category) | 123 (100.0%) | 0 (0.0%) |
| Total (Overall) | 668 (43.4%) | 871 (56.6%) |
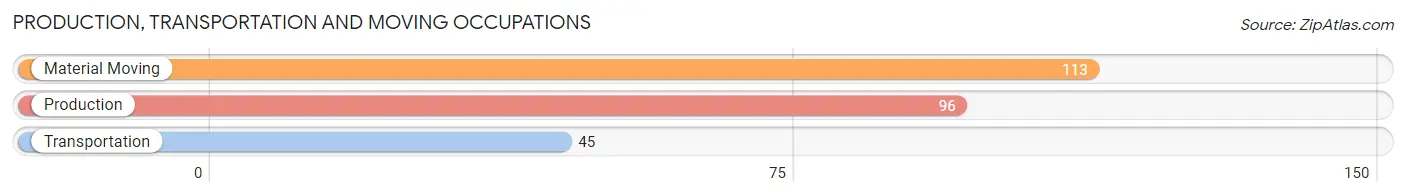
Production, Transportation and Moving Occupations
The most common Production, Transportation and Moving occupations in Glennville are Material Moving (113 | 7.3%), Production (96 | 6.2%), and Transportation (45 | 2.9%).
Production, Transportation and Moving Occupations by Sex
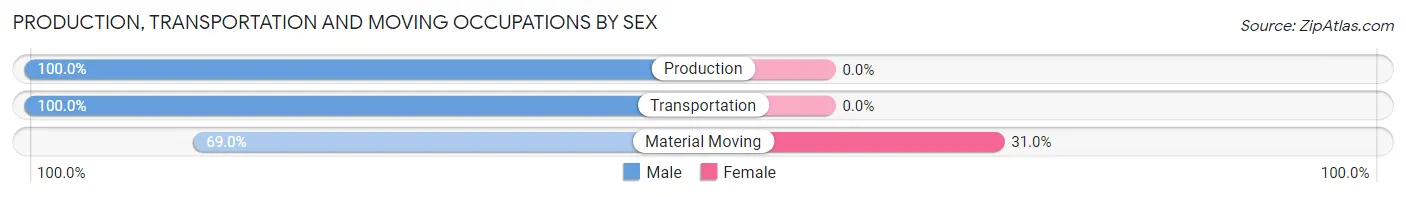
| Occupation | Male | Female |
| Production | 96 (100.0%) | 0 (0.0%) |
| Transportation | 45 (100.0%) | 0 (0.0%) |
| Material Moving | 78 (69.0%) | 35 (31.0%) |
| Total (Category) | 219 (86.2%) | 35 (13.8%) |
| Total (Overall) | 668 (43.4%) | 871 (56.6%) |
Employment Industries by Sex in Glennville
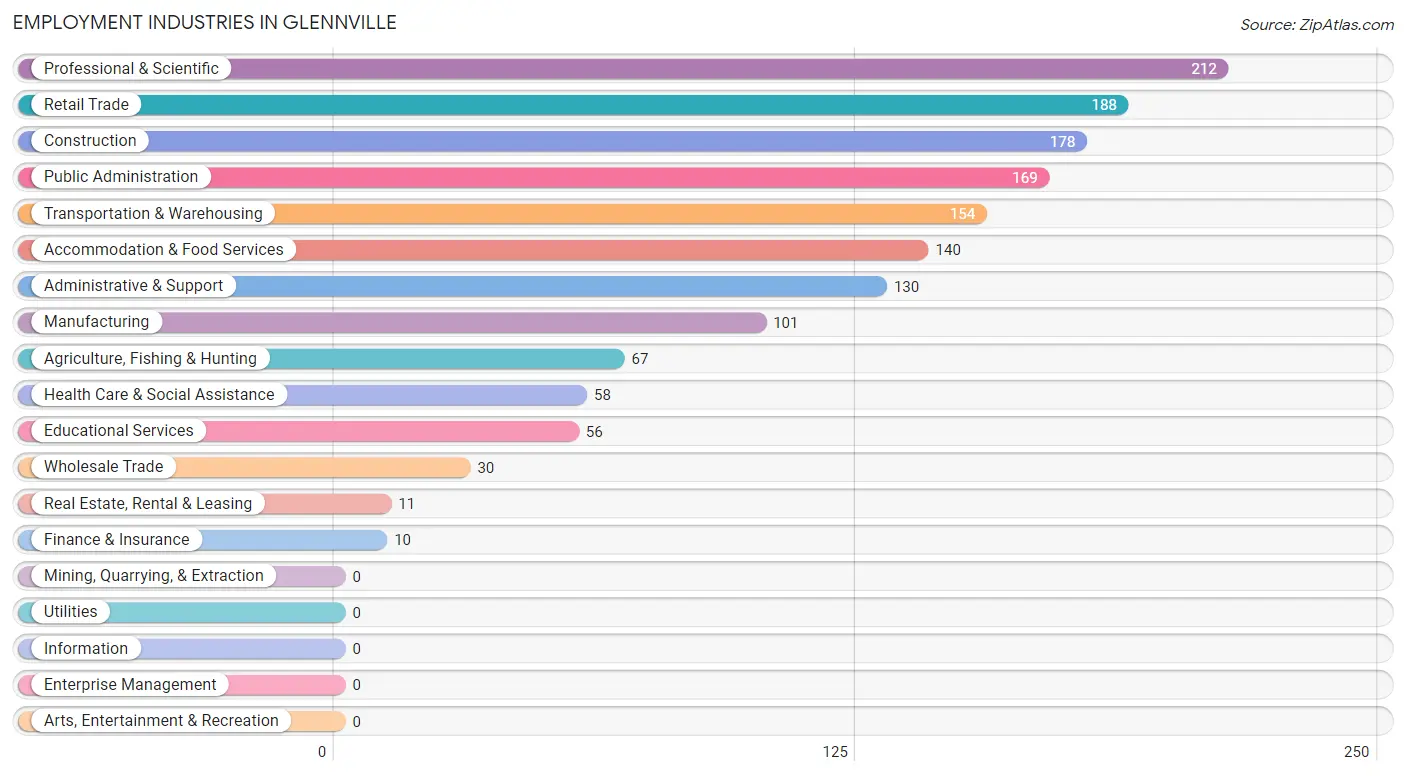
Employment Industries in Glennville
The major employment industries in Glennville include Professional & Scientific (212 | 13.8%), Retail Trade (188 | 12.2%), Construction (178 | 11.6%), Public Administration (169 | 11.0%), and Transportation & Warehousing (154 | 10.0%).
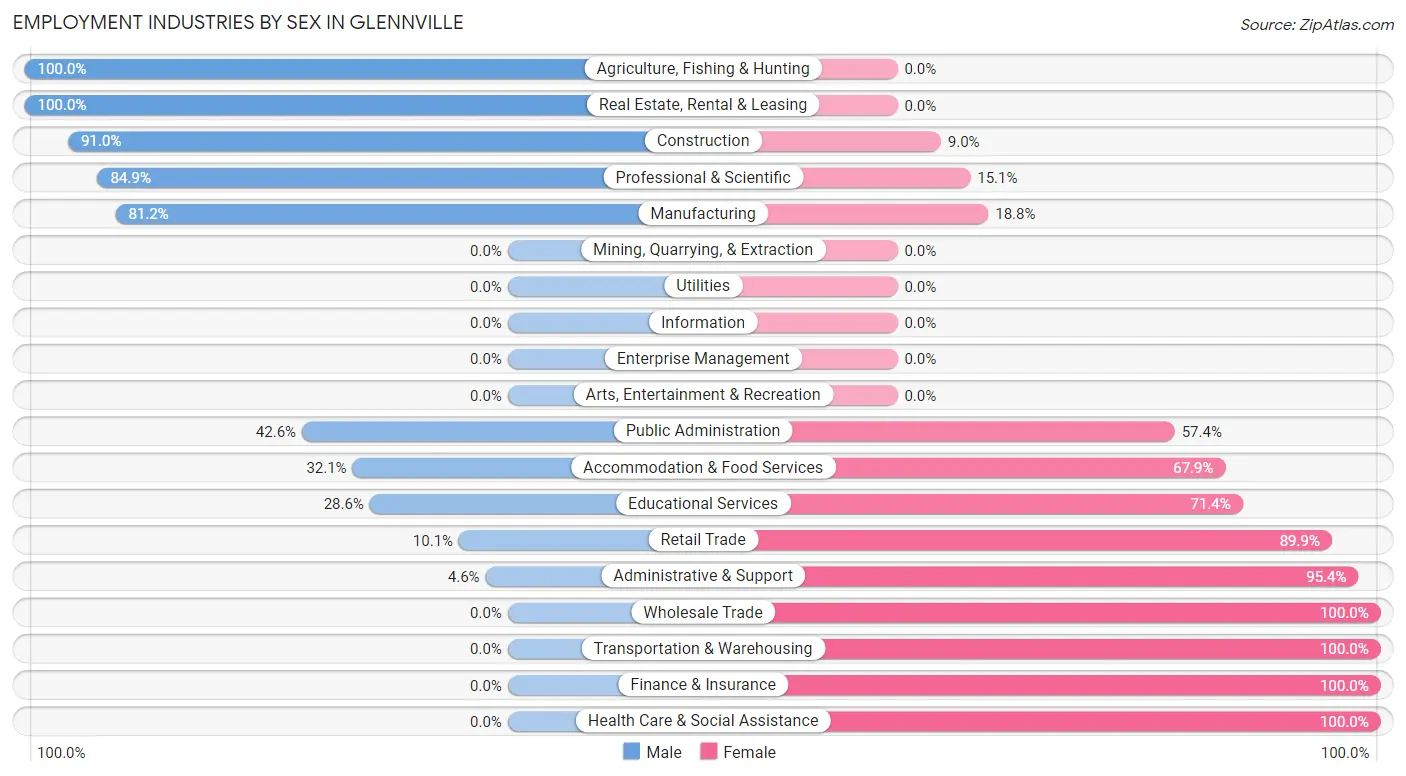
Employment Industries by Sex in Glennville
The Glennville industries that see more men than women are Agriculture, Fishing & Hunting (100.0%), Real Estate, Rental & Leasing (100.0%), and Construction (91.0%), whereas the industries that tend to have a higher number of women are Wholesale Trade (100.0%), Transportation & Warehousing (100.0%), and Finance & Insurance (100.0%).
| Industry | Male | Female |
| Agriculture, Fishing & Hunting | 67 (100.0%) | 0 (0.0%) |
| Mining, Quarrying, & Extraction | 0 (0.0%) | 0 (0.0%) |
| Construction | 162 (91.0%) | 16 (9.0%) |
| Manufacturing | 82 (81.2%) | 19 (18.8%) |
| Wholesale Trade | 0 (0.0%) | 30 (100.0%) |
| Retail Trade | 19 (10.1%) | 169 (89.9%) |
| Transportation & Warehousing | 0 (0.0%) | 154 (100.0%) |
| Utilities | 0 (0.0%) | 0 (0.0%) |
| Information | 0 (0.0%) | 0 (0.0%) |
| Finance & Insurance | 0 (0.0%) | 10 (100.0%) |
| Real Estate, Rental & Leasing | 11 (100.0%) | 0 (0.0%) |
| Professional & Scientific | 180 (84.9%) | 32 (15.1%) |
| Enterprise Management | 0 (0.0%) | 0 (0.0%) |
| Administrative & Support | 6 (4.6%) | 124 (95.4%) |
| Educational Services | 16 (28.6%) | 40 (71.4%) |
| Health Care & Social Assistance | 0 (0.0%) | 58 (100.0%) |
| Arts, Entertainment & Recreation | 0 (0.0%) | 0 (0.0%) |
| Accommodation & Food Services | 45 (32.1%) | 95 (67.9%) |
| Public Administration | 72 (42.6%) | 97 (57.4%) |
| Total | 668 (43.4%) | 871 (56.6%) |
Education in Glennville
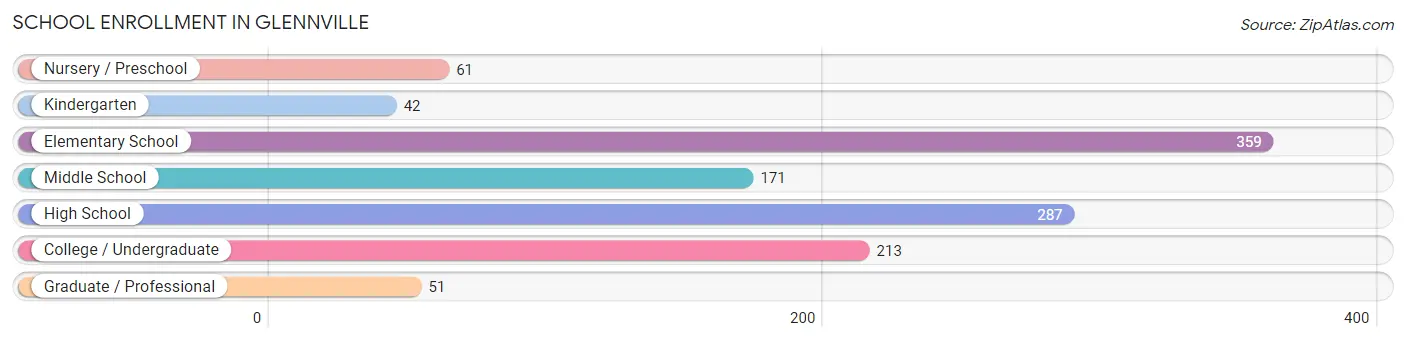
School Enrollment in Glennville
The most common levels of schooling among the 1,184 students in Glennville are elementary school (359 | 30.3%), high school (287 | 24.2%), and college / undergraduate (213 | 18.0%).
| School Level | # Students | % Students |
| Nursery / Preschool | 61 | 5.1% |
| Kindergarten | 42 | 3.5% |
| Elementary School | 359 | 30.3% |
| Middle School | 171 | 14.4% |
| High School | 287 | 24.2% |
| College / Undergraduate | 213 | 18.0% |
| Graduate / Professional | 51 | 4.3% |
| Total | 1,184 | 100.0% |
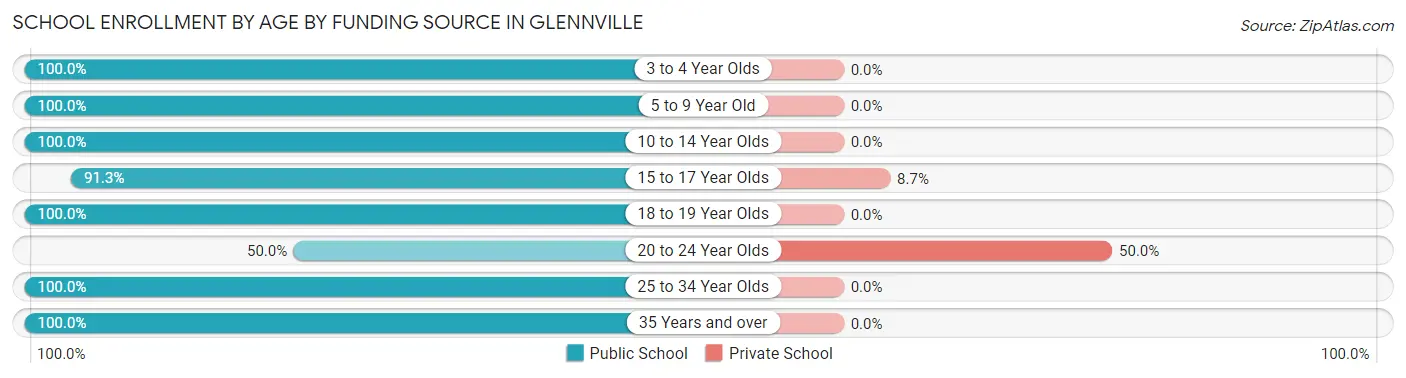
School Enrollment by Age by Funding Source in Glennville
Out of a total of 1,184 students who are enrolled in schools in Glennville, 24 (2.0%) attend a private institution, while the remaining 1,160 (98.0%) are enrolled in public schools. The age group of 20 to 24 year olds has the highest likelihood of being enrolled in private schools, with 13 (50.0% in the age bracket) enrolled. Conversely, the age group of 3 to 4 year olds has the lowest likelihood of being enrolled in a private school, with 54 (100.0% in the age bracket) attending a public institution.
| Age Bracket | Public School | Private School |
| 3 to 4 Year Olds | 54 (100.0%) | 0 (0.0%) |
| 5 to 9 Year Old | 381 (100.0%) | 0 (0.0%) |
| 10 to 14 Year Olds | 207 (100.0%) | 0 (0.0%) |
| 15 to 17 Year Olds | 116 (91.3%) | 11 (8.7%) |
| 18 to 19 Year Olds | 137 (100.0%) | 0 (0.0%) |
| 20 to 24 Year Olds | 13 (50.0%) | 13 (50.0%) |
| 25 to 34 Year Olds | 114 (100.0%) | 0 (0.0%) |
| 35 Years and over | 138 (100.0%) | 0 (0.0%) |
| Total | 1,160 (98.0%) | 24 (2.0%) |
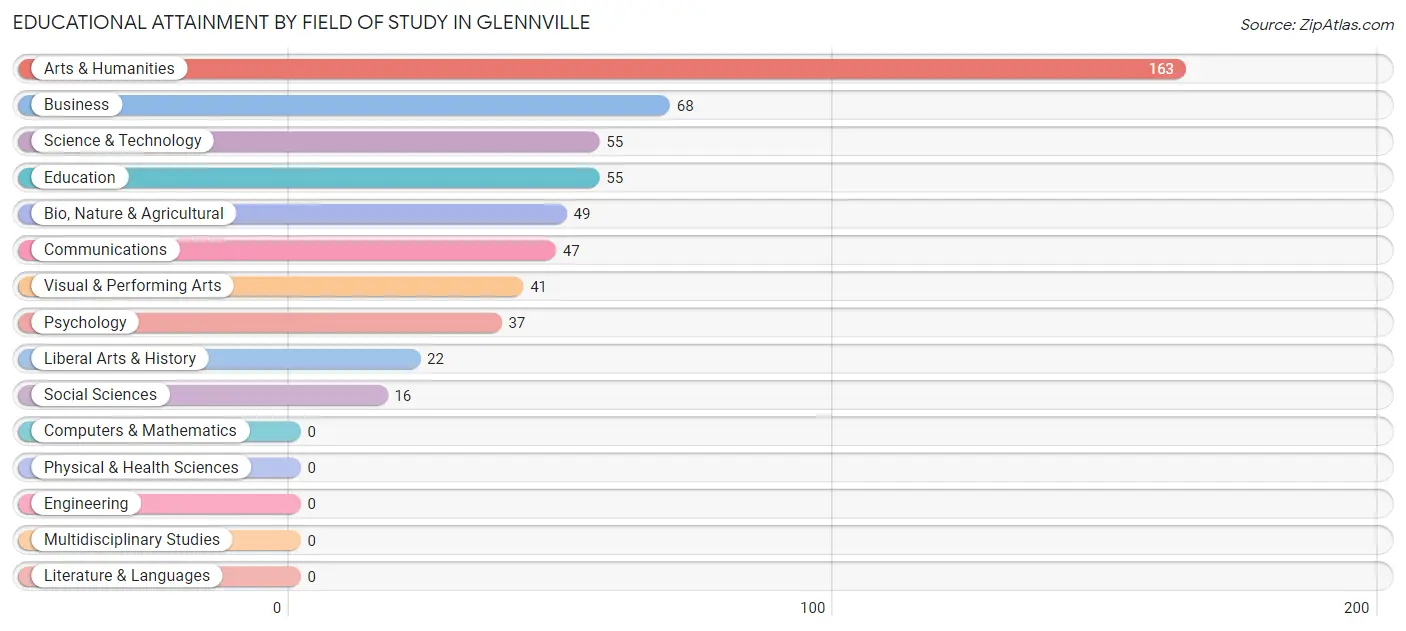
Educational Attainment by Field of Study in Glennville
Arts & humanities (163 | 29.5%), business (68 | 12.3%), science & technology (55 | 10.0%), education (55 | 10.0%), and bio, nature & agricultural (49 | 8.9%) are the most common fields of study among 553 individuals in Glennville who have obtained a bachelor's degree or higher.
| Field of Study | # Graduates | % Graduates |
| Computers & Mathematics | 0 | 0.0% |
| Bio, Nature & Agricultural | 49 | 8.9% |
| Physical & Health Sciences | 0 | 0.0% |
| Psychology | 37 | 6.7% |
| Social Sciences | 16 | 2.9% |
| Engineering | 0 | 0.0% |
| Multidisciplinary Studies | 0 | 0.0% |
| Science & Technology | 55 | 10.0% |
| Business | 68 | 12.3% |
| Education | 55 | 10.0% |
| Literature & Languages | 0 | 0.0% |
| Liberal Arts & History | 22 | 4.0% |
| Visual & Performing Arts | 41 | 7.4% |
| Communications | 47 | 8.5% |
| Arts & Humanities | 163 | 29.5% |
| Total | 553 | 100.0% |
Transportation & Commute in Glennville
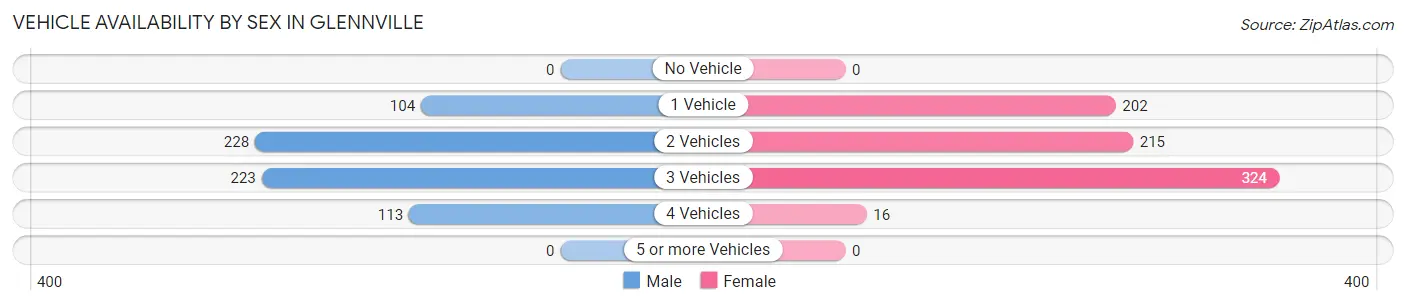
Vehicle Availability by Sex in Glennville
The most prevalent vehicle ownership categories in Glennville are males with 2 vehicles (228, accounting for 34.1%) and females with 2 vehicles (215, making up 30.1%).
| Vehicles Available | Male | Female |
| No Vehicle | 0 (0.0%) | 0 (0.0%) |
| 1 Vehicle | 104 (15.6%) | 202 (26.7%) |
| 2 Vehicles | 228 (34.1%) | 215 (28.4%) |
| 3 Vehicles | 223 (33.4%) | 324 (42.8%) |
| 4 Vehicles | 113 (16.9%) | 16 (2.1%) |
| 5 or more Vehicles | 0 (0.0%) | 0 (0.0%) |
| Total | 668 (100.0%) | 757 (100.0%) |
Commute Time in Glennville
The most frequently occuring commute durations in Glennville are 5 to 9 minutes (306 commuters, 22.7%), 60 to 89 minutes (234 commuters, 17.3%), and 30 to 34 minutes (168 commuters, 12.4%).
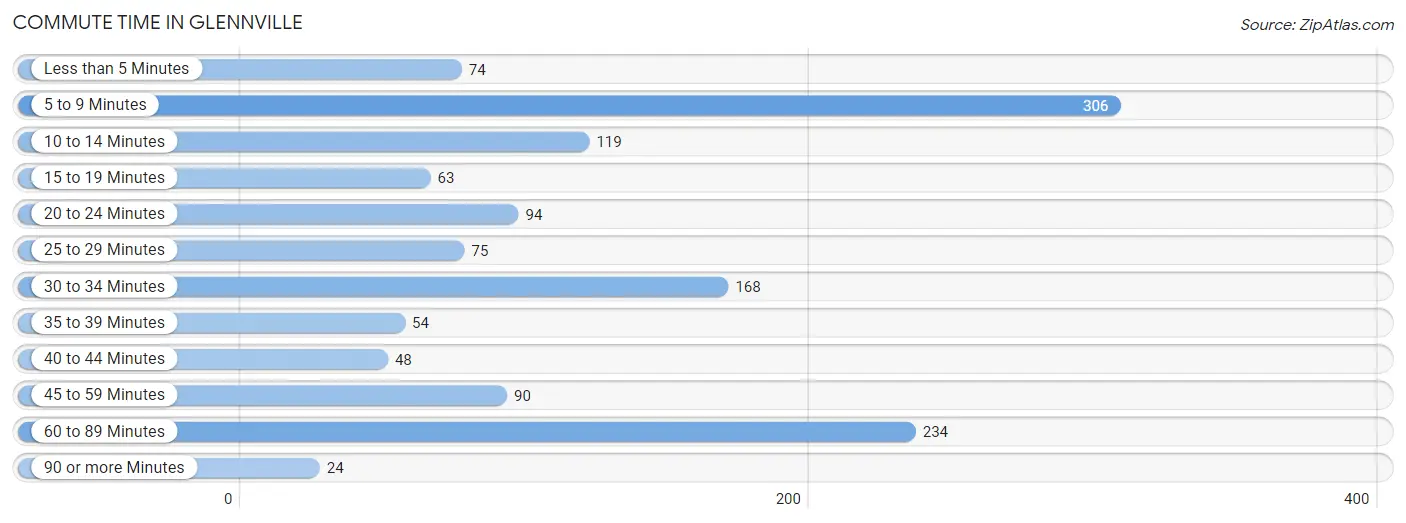
| Commute Time | # Commuters | % Commuters |
| Less than 5 Minutes | 74 | 5.5% |
| 5 to 9 Minutes | 306 | 22.7% |
| 10 to 14 Minutes | 119 | 8.8% |
| 15 to 19 Minutes | 63 | 4.7% |
| 20 to 24 Minutes | 94 | 7.0% |
| 25 to 29 Minutes | 75 | 5.6% |
| 30 to 34 Minutes | 168 | 12.4% |
| 35 to 39 Minutes | 54 | 4.0% |
| 40 to 44 Minutes | 48 | 3.6% |
| 45 to 59 Minutes | 90 | 6.7% |
| 60 to 89 Minutes | 234 | 17.3% |
| 90 or more Minutes | 24 | 1.8% |
Commute Time by Sex in Glennville
The most common commute times in Glennville are 60 to 89 minutes (177 commuters, 28.5%) for males and 5 to 9 minutes (186 commuters, 25.6%) for females.
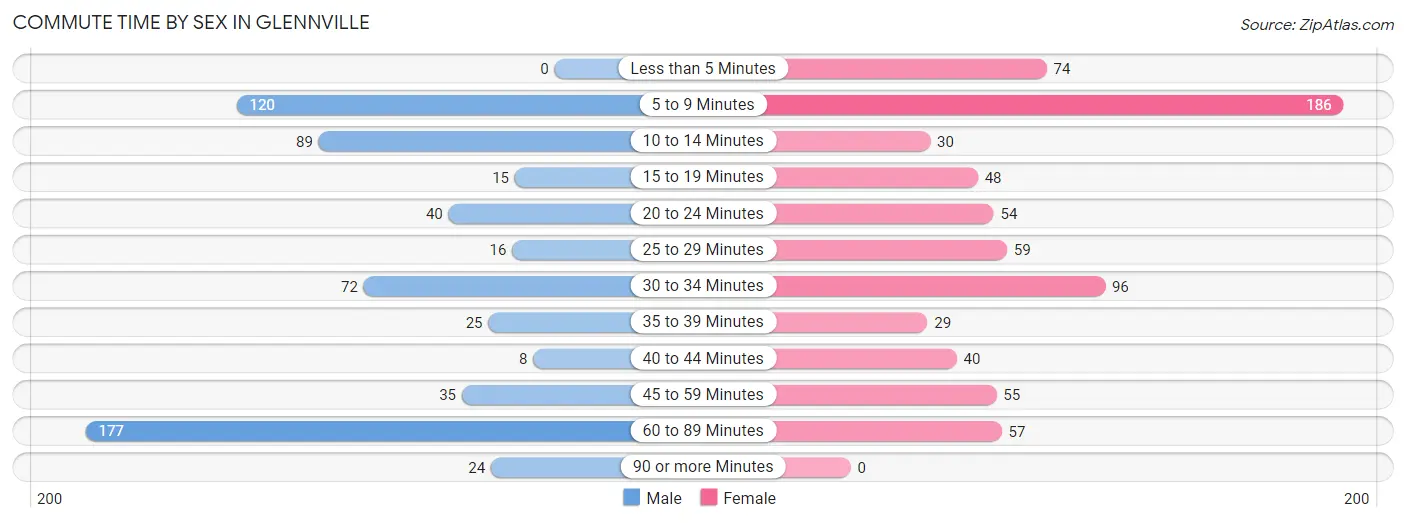
| Commute Time | Male | Female |
| Less than 5 Minutes | 0 (0.0%) | 74 (10.2%) |
| 5 to 9 Minutes | 120 (19.3%) | 186 (25.6%) |
| 10 to 14 Minutes | 89 (14.3%) | 30 (4.1%) |
| 15 to 19 Minutes | 15 (2.4%) | 48 (6.6%) |
| 20 to 24 Minutes | 40 (6.4%) | 54 (7.4%) |
| 25 to 29 Minutes | 16 (2.6%) | 59 (8.1%) |
| 30 to 34 Minutes | 72 (11.6%) | 96 (13.2%) |
| 35 to 39 Minutes | 25 (4.0%) | 29 (4.0%) |
| 40 to 44 Minutes | 8 (1.3%) | 40 (5.5%) |
| 45 to 59 Minutes | 35 (5.6%) | 55 (7.5%) |
| 60 to 89 Minutes | 177 (28.5%) | 57 (7.8%) |
| 90 or more Minutes | 24 (3.9%) | 0 (0.0%) |
Time of Departure to Work by Sex in Glennville
The most frequent times of departure to work in Glennville are 5:30 AM to 5:59 AM (174, 28.0%) for males and 7:00 AM to 7:29 AM (125, 17.2%) for females.
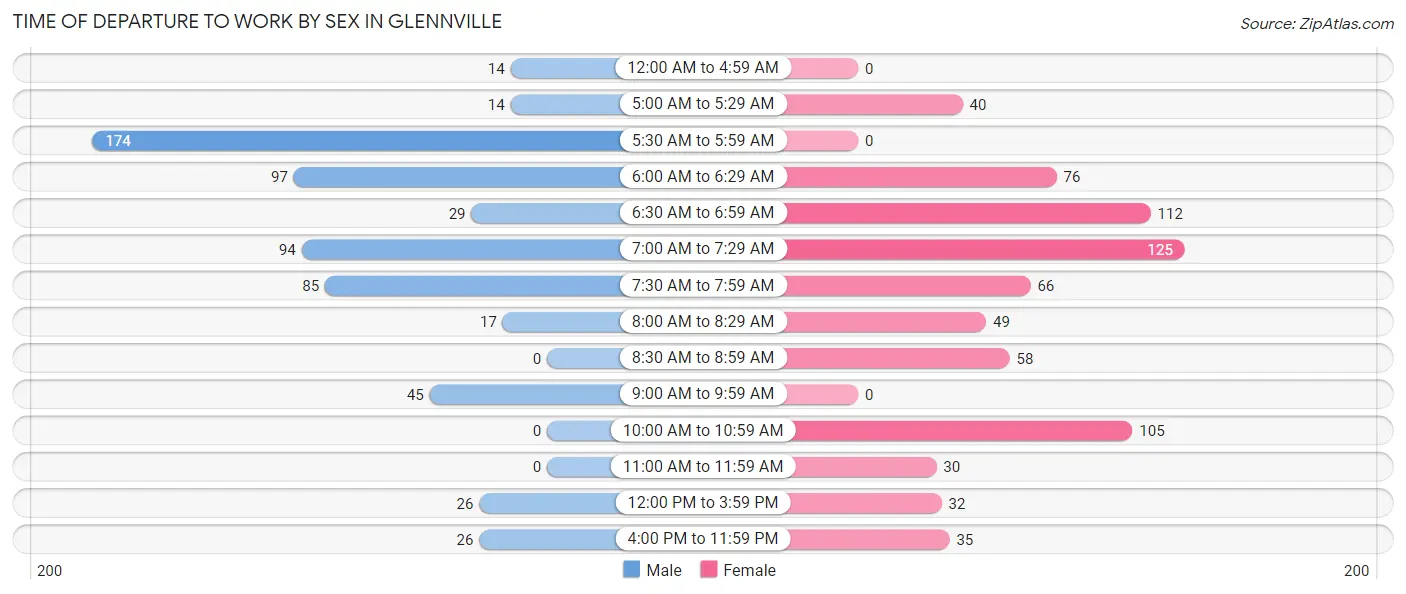
| Time of Departure | Male | Female |
| 12:00 AM to 4:59 AM | 14 (2.2%) | 0 (0.0%) |
| 5:00 AM to 5:29 AM | 14 (2.2%) | 40 (5.5%) |
| 5:30 AM to 5:59 AM | 174 (28.0%) | 0 (0.0%) |
| 6:00 AM to 6:29 AM | 97 (15.6%) | 76 (10.4%) |
| 6:30 AM to 6:59 AM | 29 (4.7%) | 112 (15.4%) |
| 7:00 AM to 7:29 AM | 94 (15.1%) | 125 (17.2%) |
| 7:30 AM to 7:59 AM | 85 (13.7%) | 66 (9.1%) |
| 8:00 AM to 8:29 AM | 17 (2.7%) | 49 (6.7%) |
| 8:30 AM to 8:59 AM | 0 (0.0%) | 58 (8.0%) |
| 9:00 AM to 9:59 AM | 45 (7.2%) | 0 (0.0%) |
| 10:00 AM to 10:59 AM | 0 (0.0%) | 105 (14.4%) |
| 11:00 AM to 11:59 AM | 0 (0.0%) | 30 (4.1%) |
| 12:00 PM to 3:59 PM | 26 (4.2%) | 32 (4.4%) |
| 4:00 PM to 11:59 PM | 26 (4.2%) | 35 (4.8%) |
| Total | 621 (100.0%) | 728 (100.0%) |
Housing Occupancy in Glennville
Occupancy by Ownership in Glennville
Of the total 1,471 dwellings in Glennville, owner-occupied units account for 818 (55.6%), while renter-occupied units make up 653 (44.4%).
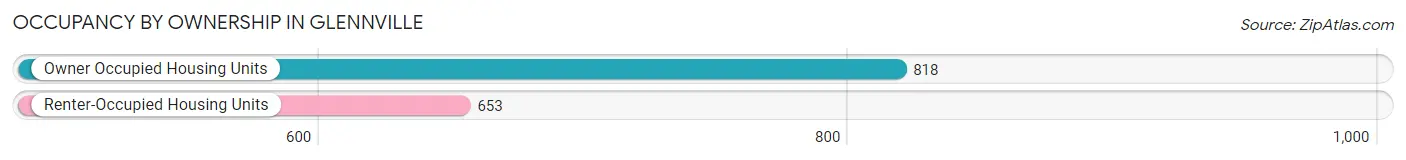
| Occupancy | # Housing Units | % Housing Units |
| Owner Occupied Housing Units | 818 | 55.6% |
| Renter-Occupied Housing Units | 653 | 44.4% |
| Total Occupied Housing Units | 1,471 | 100.0% |
Occupancy by Household Size in Glennville
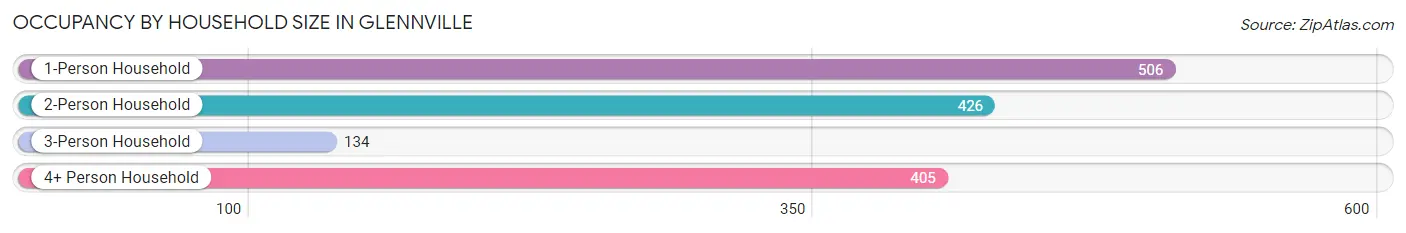
| Household Size | # Housing Units | % Housing Units |
| 1-Person Household | 506 | 34.4% |
| 2-Person Household | 426 | 29.0% |
| 3-Person Household | 134 | 9.1% |
| 4+ Person Household | 405 | 27.5% |
| Total Housing Units | 1,471 | 100.0% |
Occupancy by Ownership by Household Size in Glennville
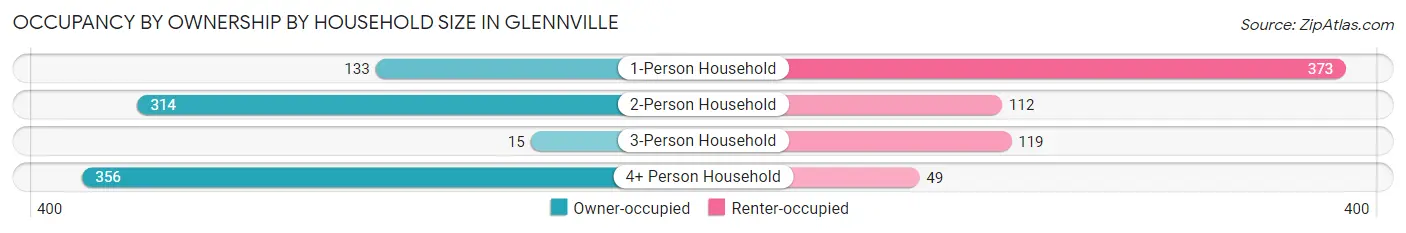
| Household Size | Owner-occupied | Renter-occupied |
| 1-Person Household | 133 (26.3%) | 373 (73.7%) |
| 2-Person Household | 314 (73.7%) | 112 (26.3%) |
| 3-Person Household | 15 (11.2%) | 119 (88.8%) |
| 4+ Person Household | 356 (87.9%) | 49 (12.1%) |
| Total Housing Units | 818 (55.6%) | 653 (44.4%) |
Occupancy by Educational Attainment in Glennville
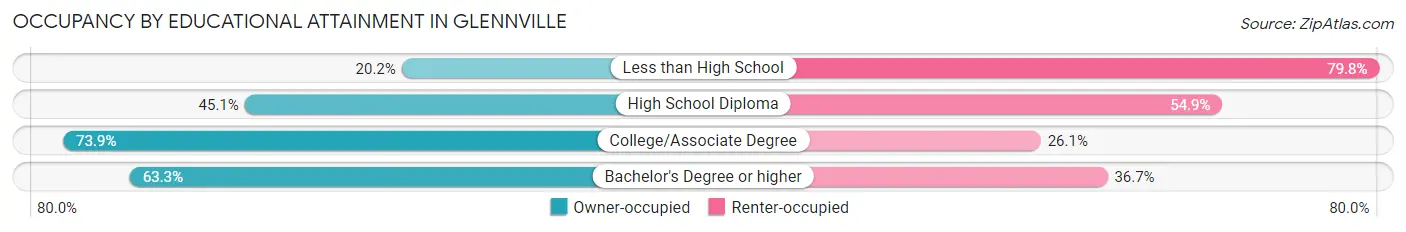
| Household Size | Owner-occupied | Renter-occupied |
| Less than High School | 40 (20.2%) | 158 (79.8%) |
| High School Diploma | 207 (45.1%) | 252 (54.9%) |
| College/Associate Degree | 388 (73.9%) | 137 (26.1%) |
| Bachelor's Degree or higher | 183 (63.3%) | 106 (36.7%) |
Occupancy by Age of Householder in Glennville
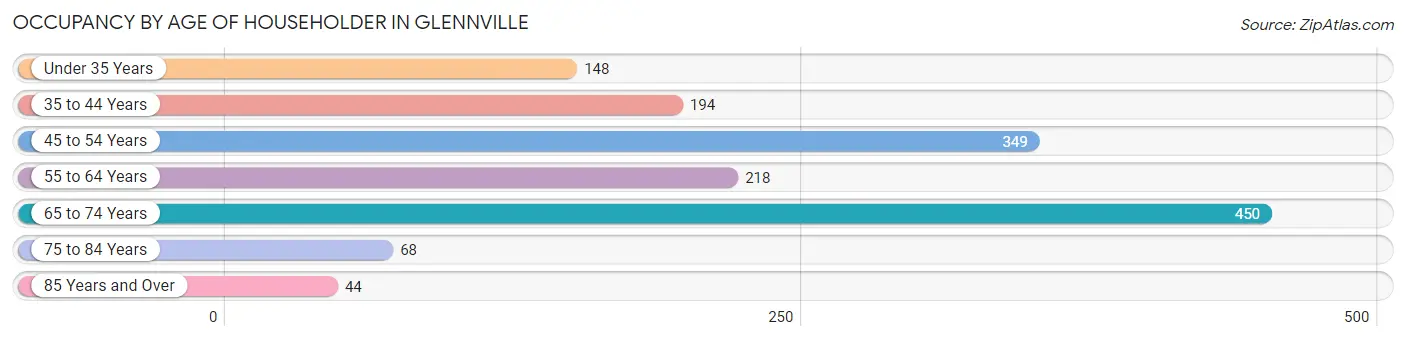
| Age Bracket | # Households | % Households |
| Under 35 Years | 148 | 10.1% |
| 35 to 44 Years | 194 | 13.2% |
| 45 to 54 Years | 349 | 23.7% |
| 55 to 64 Years | 218 | 14.8% |
| 65 to 74 Years | 450 | 30.6% |
| 75 to 84 Years | 68 | 4.6% |
| 85 Years and Over | 44 | 3.0% |
| Total | 1,471 | 100.0% |
Housing Finances in Glennville
Median Income by Occupancy in Glennville
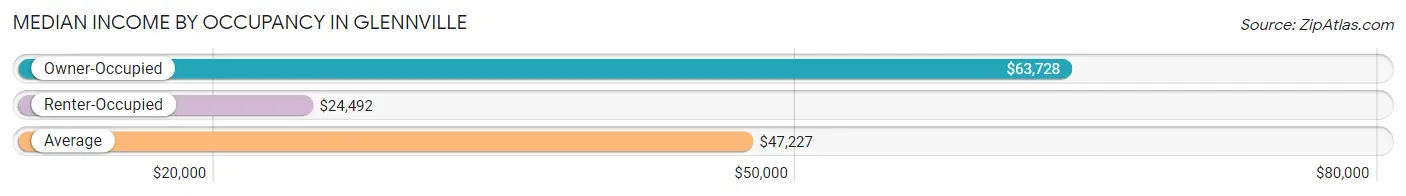
| Occupancy Type | # Households | Median Income |
| Owner-Occupied | 818 (55.6%) | $63,728 |
| Renter-Occupied | 653 (44.4%) | $24,492 |
| Average | 1,471 (100.0%) | $47,227 |
Occupancy by Householder Income Bracket in Glennville
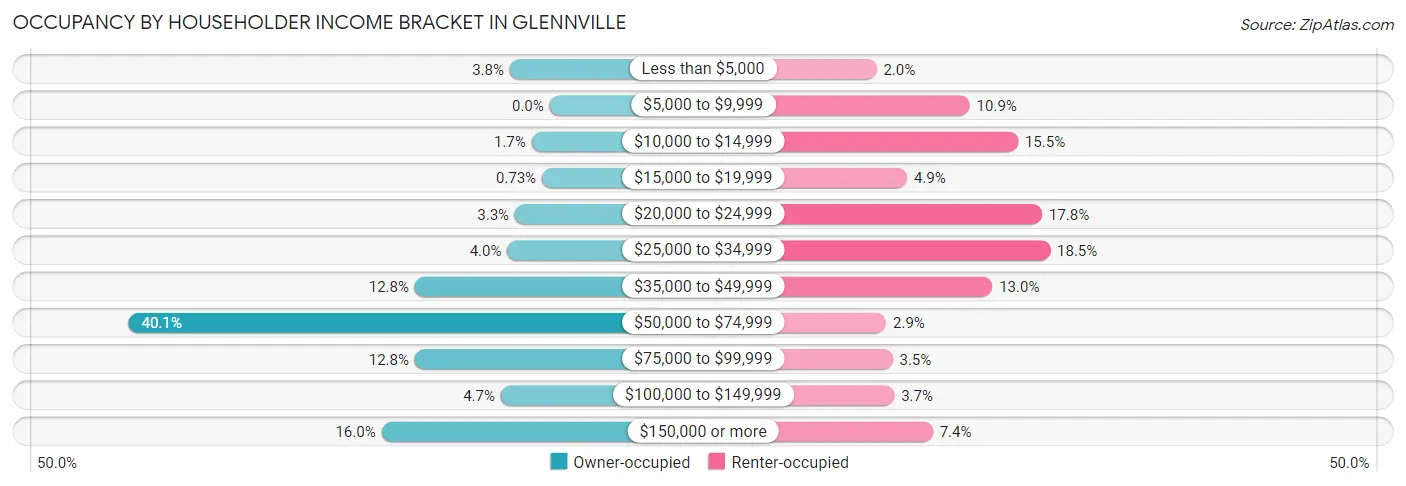
| Income Bracket | Owner-occupied | Renter-occupied |
| Less than $5,000 | 31 (3.8%) | 13 (2.0%) |
| $5,000 to $9,999 | 0 (0.0%) | 71 (10.9%) |
| $10,000 to $14,999 | 14 (1.7%) | 101 (15.5%) |
| $15,000 to $19,999 | 6 (0.7%) | 32 (4.9%) |
| $20,000 to $24,999 | 27 (3.3%) | 116 (17.8%) |
| $25,000 to $34,999 | 33 (4.0%) | 121 (18.5%) |
| $35,000 to $49,999 | 105 (12.8%) | 85 (13.0%) |
| $50,000 to $74,999 | 328 (40.1%) | 19 (2.9%) |
| $75,000 to $99,999 | 105 (12.8%) | 23 (3.5%) |
| $100,000 to $149,999 | 38 (4.6%) | 24 (3.7%) |
| $150,000 or more | 131 (16.0%) | 48 (7.3%) |
| Total | 818 (100.0%) | 653 (100.0%) |
Monthly Housing Cost Tiers in Glennville
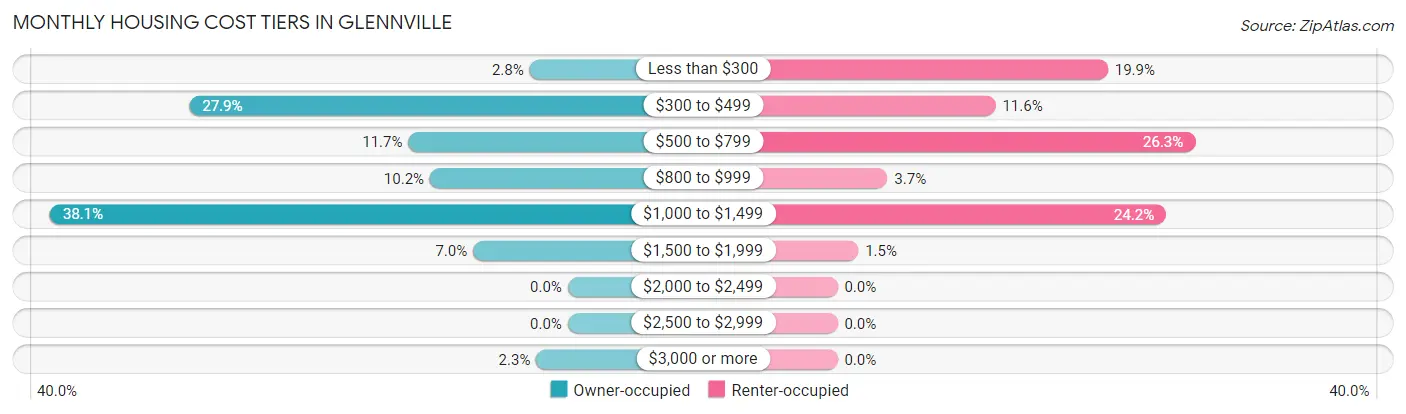
| Monthly Cost | Owner-occupied | Renter-occupied |
| Less than $300 | 23 (2.8%) | 130 (19.9%) |
| $300 to $499 | 228 (27.9%) | 76 (11.6%) |
| $500 to $799 | 96 (11.7%) | 172 (26.3%) |
| $800 to $999 | 83 (10.2%) | 24 (3.7%) |
| $1,000 to $1,499 | 312 (38.1%) | 158 (24.2%) |
| $1,500 to $1,999 | 57 (7.0%) | 10 (1.5%) |
| $2,000 to $2,499 | 0 (0.0%) | 0 (0.0%) |
| $2,500 to $2,999 | 0 (0.0%) | 0 (0.0%) |
| $3,000 or more | 19 (2.3%) | 0 (0.0%) |
| Total | 818 (100.0%) | 653 (100.0%) |
Physical Housing Characteristics in Glennville
Housing Structures in Glennville
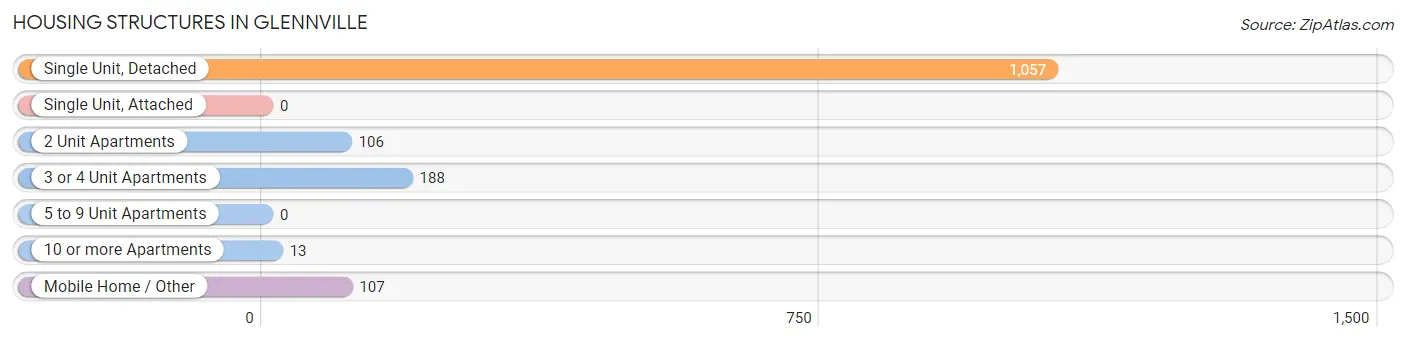
| Structure Type | # Housing Units | % Housing Units |
| Single Unit, Detached | 1,057 | 71.9% |
| Single Unit, Attached | 0 | 0.0% |
| 2 Unit Apartments | 106 | 7.2% |
| 3 or 4 Unit Apartments | 188 | 12.8% |
| 5 to 9 Unit Apartments | 0 | 0.0% |
| 10 or more Apartments | 13 | 0.9% |
| Mobile Home / Other | 107 | 7.3% |
| Total | 1,471 | 100.0% |
Housing Structures by Occupancy in Glennville
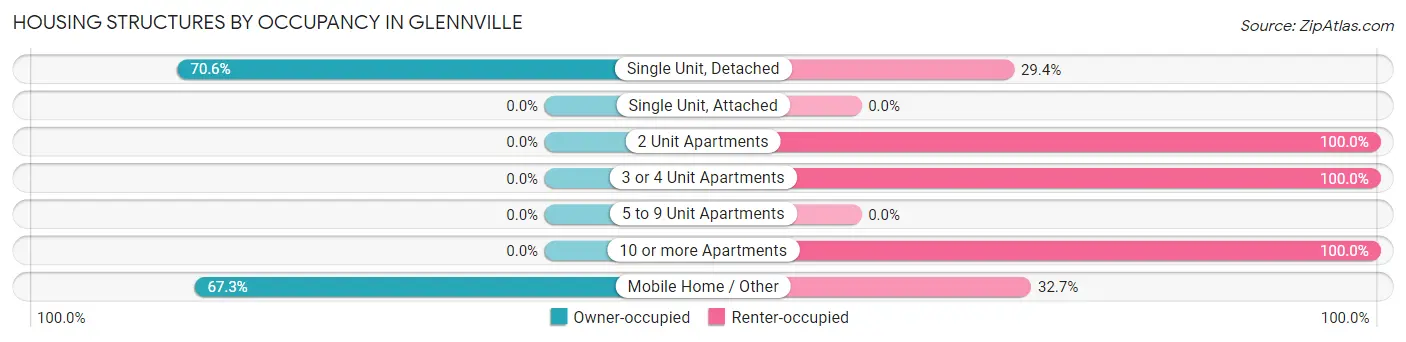
| Structure Type | Owner-occupied | Renter-occupied |
| Single Unit, Detached | 746 (70.6%) | 311 (29.4%) |
| Single Unit, Attached | 0 (0.0%) | 0 (0.0%) |
| 2 Unit Apartments | 0 (0.0%) | 106 (100.0%) |
| 3 or 4 Unit Apartments | 0 (0.0%) | 188 (100.0%) |
| 5 to 9 Unit Apartments | 0 (0.0%) | 0 (0.0%) |
| 10 or more Apartments | 0 (0.0%) | 13 (100.0%) |
| Mobile Home / Other | 72 (67.3%) | 35 (32.7%) |
| Total | 818 (55.6%) | 653 (44.4%) |
Housing Structures by Number of Rooms in Glennville
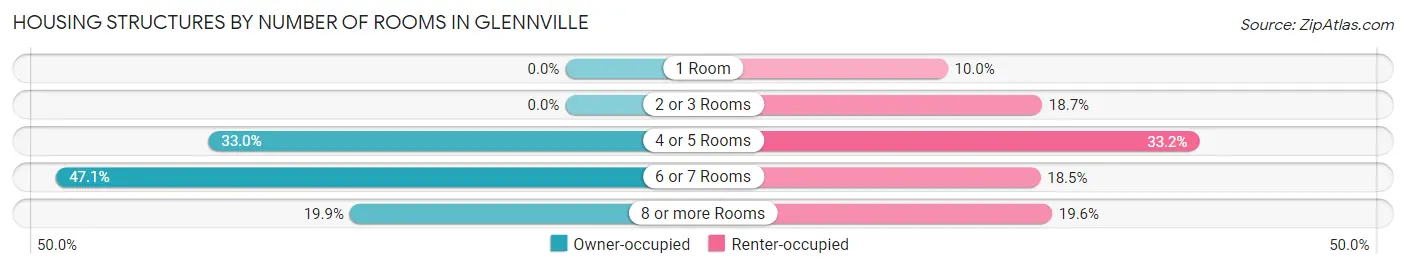
| Number of Rooms | Owner-occupied | Renter-occupied |
| 1 Room | 0 (0.0%) | 65 (10.0%) |
| 2 or 3 Rooms | 0 (0.0%) | 122 (18.7%) |
| 4 or 5 Rooms | 270 (33.0%) | 217 (33.2%) |
| 6 or 7 Rooms | 385 (47.1%) | 121 (18.5%) |
| 8 or more Rooms | 163 (19.9%) | 128 (19.6%) |
| Total | 818 (100.0%) | 653 (100.0%) |
Housing Structure by Heating Type in Glennville
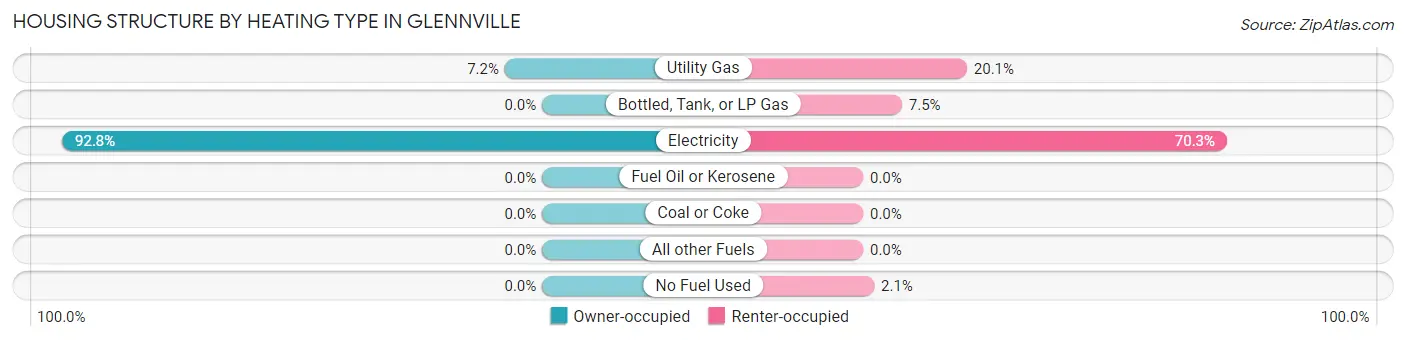
| Heating Type | Owner-occupied | Renter-occupied |
| Utility Gas | 59 (7.2%) | 131 (20.1%) |
| Bottled, Tank, or LP Gas | 0 (0.0%) | 49 (7.5%) |
| Electricity | 759 (92.8%) | 459 (70.3%) |
| Fuel Oil or Kerosene | 0 (0.0%) | 0 (0.0%) |
| Coal or Coke | 0 (0.0%) | 0 (0.0%) |
| All other Fuels | 0 (0.0%) | 0 (0.0%) |
| No Fuel Used | 0 (0.0%) | 14 (2.1%) |
| Total | 818 (100.0%) | 653 (100.0%) |
Household Vehicle Usage in Glennville
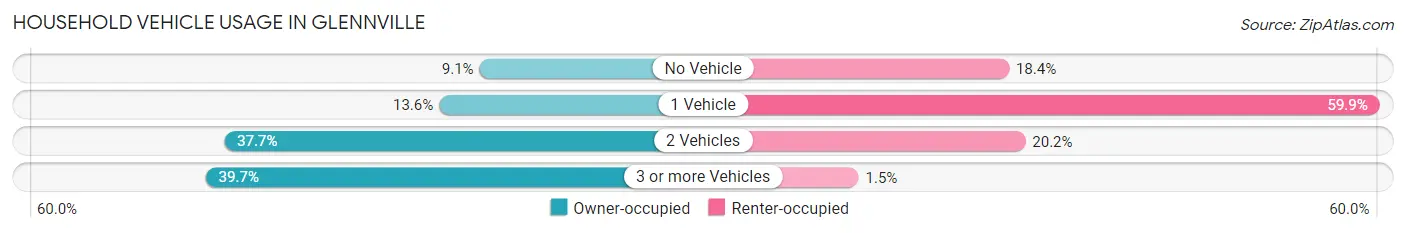
| Vehicles per Household | Owner-occupied | Renter-occupied |
| No Vehicle | 74 (9.0%) | 120 (18.4%) |
| 1 Vehicle | 111 (13.6%) | 391 (59.9%) |
| 2 Vehicles | 308 (37.7%) | 132 (20.2%) |
| 3 or more Vehicles | 325 (39.7%) | 10 (1.5%) |
| Total | 818 (100.0%) | 653 (100.0%) |
Real Estate & Mortgages in Glennville
Real Estate and Mortgage Overview in Glennville
| Characteristic | Without Mortgage | With Mortgage |
| Housing Units | 302 | 516 |
| Median Property Value | $99,700 | $169,600 |
| Median Household Income | $68,160 | $98 |
| Monthly Housing Costs | $399 | $19 |
| Real Estate Taxes | $1,257 | $0 |
Property Value by Mortgage Status in Glennville
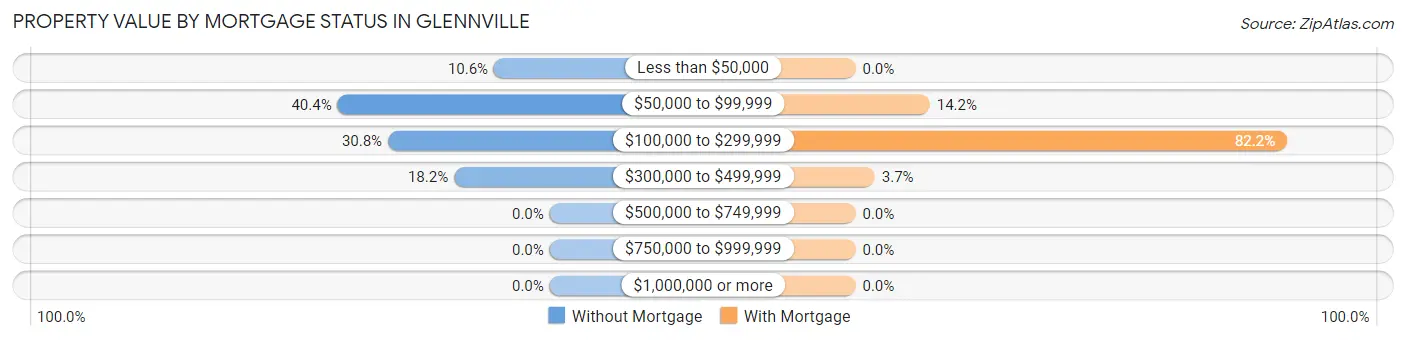
| Property Value | Without Mortgage | With Mortgage |
| Less than $50,000 | 32 (10.6%) | 0 (0.0%) |
| $50,000 to $99,999 | 122 (40.4%) | 73 (14.1%) |
| $100,000 to $299,999 | 93 (30.8%) | 424 (82.2%) |
| $300,000 to $499,999 | 55 (18.2%) | 19 (3.7%) |
| $500,000 to $749,999 | 0 (0.0%) | 0 (0.0%) |
| $750,000 to $999,999 | 0 (0.0%) | 0 (0.0%) |
| $1,000,000 or more | 0 (0.0%) | 0 (0.0%) |
| Total | 302 (100.0%) | 516 (100.0%) |
Household Income by Mortgage Status in Glennville
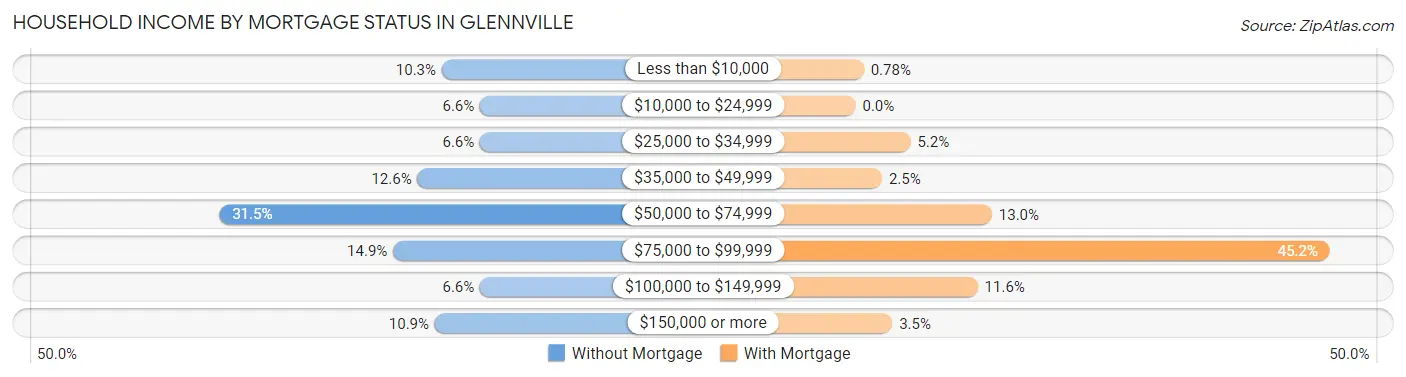
| Household Income | Without Mortgage | With Mortgage |
| Less than $10,000 | 31 (10.3%) | 4 (0.8%) |
| $10,000 to $24,999 | 20 (6.6%) | 0 (0.0%) |
| $25,000 to $34,999 | 20 (6.6%) | 27 (5.2%) |
| $35,000 to $49,999 | 38 (12.6%) | 13 (2.5%) |
| $50,000 to $74,999 | 95 (31.5%) | 67 (13.0%) |
| $75,000 to $99,999 | 45 (14.9%) | 233 (45.2%) |
| $100,000 to $149,999 | 20 (6.6%) | 60 (11.6%) |
| $150,000 or more | 33 (10.9%) | 18 (3.5%) |
| Total | 302 (100.0%) | 516 (100.0%) |
Property Value to Household Income Ratio in Glennville
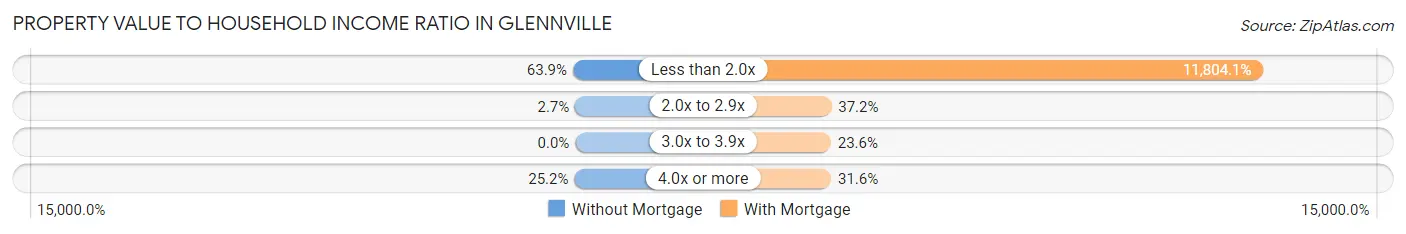
| Value-to-Income Ratio | Without Mortgage | With Mortgage |
| Less than 2.0x | 193 (63.9%) | 60,909 (11,804.1%) |
| 2.0x to 2.9x | 8 (2.6%) | 192 (37.2%) |
| 3.0x to 3.9x | 0 (0.0%) | 122 (23.6%) |
| 4.0x or more | 76 (25.2%) | 163 (31.6%) |
| Total | 302 (100.0%) | 516 (100.0%) |
Real Estate Taxes by Mortgage Status in Glennville
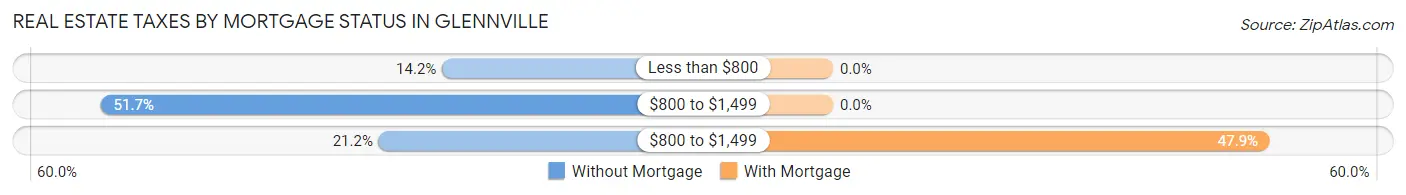
| Property Taxes | Without Mortgage | With Mortgage |
| Less than $800 | 43 (14.2%) | 0 (0.0%) |
| $800 to $1,499 | 156 (51.7%) | 0 (0.0%) |
| $800 to $1,499 | 64 (21.2%) | 247 (47.9%) |
| Total | 302 (100.0%) | 516 (100.0%) |
Health & Disability in Glennville
Health Insurance Coverage by Age in Glennville
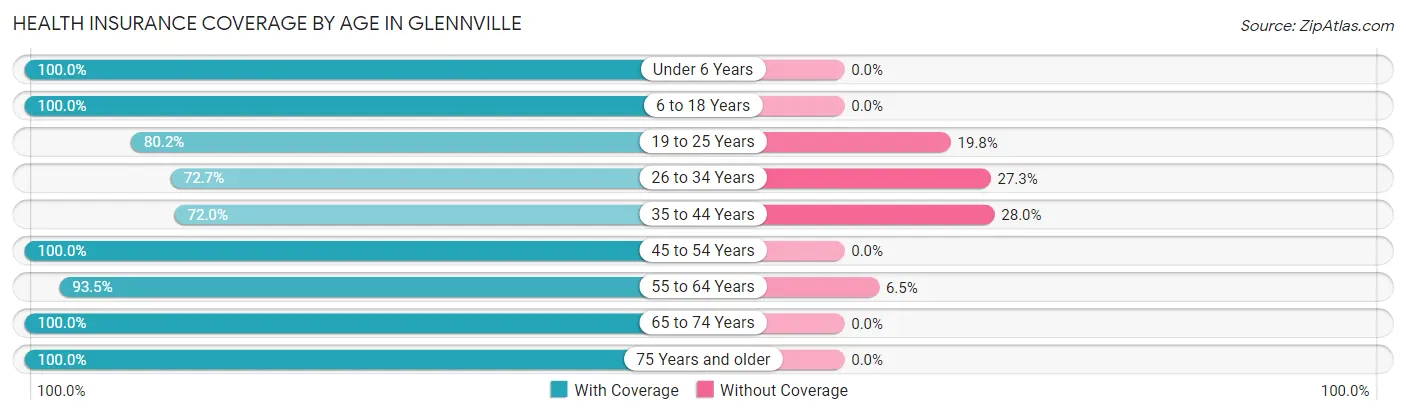
| Age Bracket | With Coverage | Without Coverage |
| Under 6 Years | 182 (100.0%) | 0 (0.0%) |
| 6 to 18 Years | 777 (100.0%) | 0 (0.0%) |
| 19 to 25 Years | 97 (80.2%) | 24 (19.8%) |
| 26 to 34 Years | 256 (72.7%) | 96 (27.3%) |
| 35 to 44 Years | 175 (72.0%) | 68 (28.0%) |
| 45 to 54 Years | 563 (100.0%) | 0 (0.0%) |
| 55 to 64 Years | 405 (93.5%) | 28 (6.5%) |
| 65 to 74 Years | 543 (100.0%) | 0 (0.0%) |
| 75 Years and older | 186 (100.0%) | 0 (0.0%) |
| Total | 3,184 (93.6%) | 216 (6.4%) |
Health Insurance Coverage by Citizenship Status in Glennville
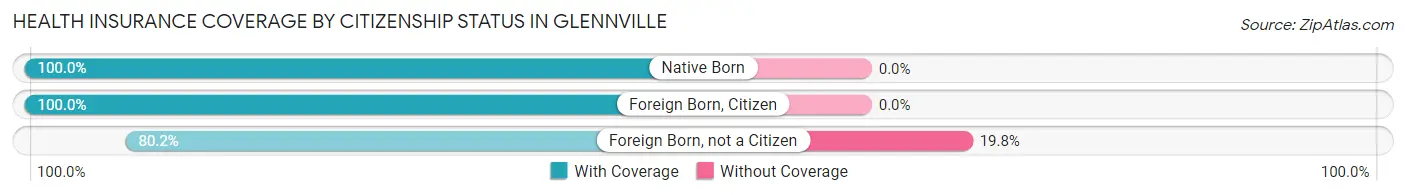
| Citizenship Status | With Coverage | Without Coverage |
| Native Born | 182 (100.0%) | 0 (0.0%) |
| Foreign Born, Citizen | 777 (100.0%) | 0 (0.0%) |
| Foreign Born, not a Citizen | 97 (80.2%) | 24 (19.8%) |
Health Insurance Coverage by Household Income in Glennville
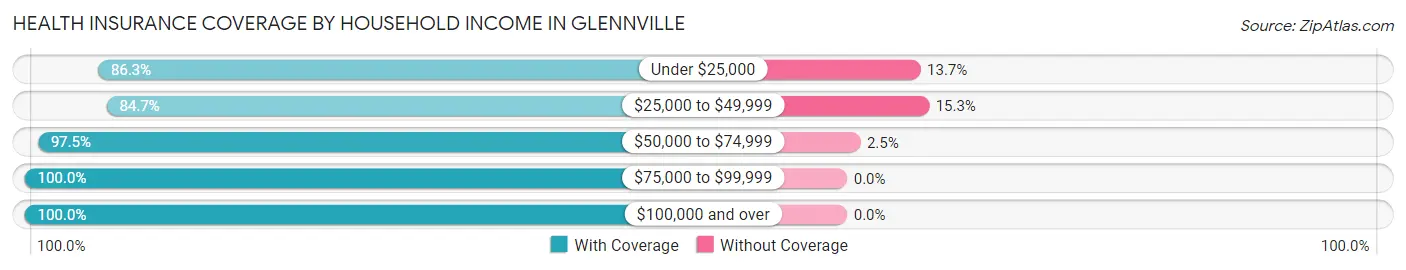
| Household Income | With Coverage | Without Coverage |
| Under $25,000 | 603 (86.3%) | 96 (13.7%) |
| $25,000 to $49,999 | 541 (84.7%) | 98 (15.3%) |
| $50,000 to $74,999 | 872 (97.5%) | 22 (2.5%) |
| $75,000 to $99,999 | 328 (100.0%) | 0 (0.0%) |
| $100,000 and over | 819 (100.0%) | 0 (0.0%) |
Public vs Private Health Insurance Coverage by Age in Glennville
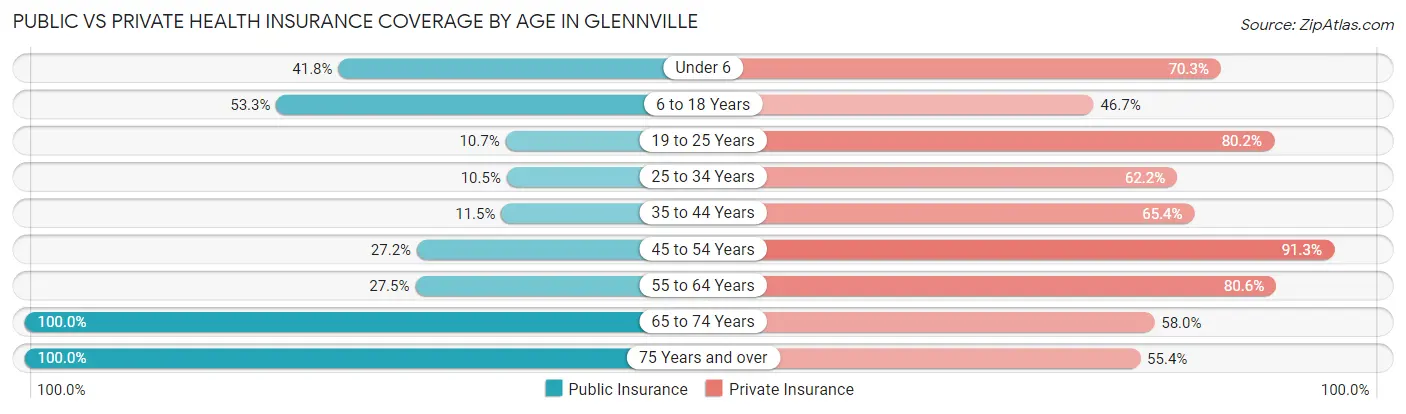
| Age Bracket | Public Insurance | Private Insurance |
| Under 6 | 76 (41.8%) | 128 (70.3%) |
| 6 to 18 Years | 414 (53.3%) | 363 (46.7%) |
| 19 to 25 Years | 13 (10.7%) | 97 (80.2%) |
| 25 to 34 Years | 37 (10.5%) | 219 (62.2%) |
| 35 to 44 Years | 28 (11.5%) | 159 (65.4%) |
| 45 to 54 Years | 153 (27.2%) | 514 (91.3%) |
| 55 to 64 Years | 119 (27.5%) | 349 (80.6%) |
| 65 to 74 Years | 543 (100.0%) | 315 (58.0%) |
| 75 Years and over | 186 (100.0%) | 103 (55.4%) |
| Total | 1,569 (46.2%) | 2,247 (66.1%) |
Disability Status by Sex by Age in Glennville
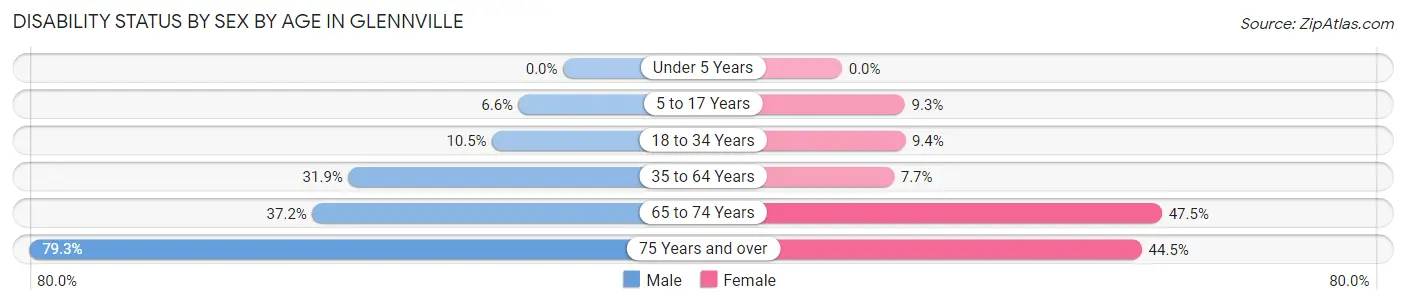
| Age Bracket | Male | Female |
| Under 5 Years | 0 (0.0%) | 0 (0.0%) |
| 5 to 17 Years | 19 (6.6%) | 39 (9.3%) |
| 18 to 34 Years | 18 (10.5%) | 38 (9.4%) |
| 35 to 64 Years | 168 (31.9%) | 55 (7.7%) |
| 65 to 74 Years | 105 (37.2%) | 124 (47.5%) |
| 75 Years and over | 46 (79.3%) | 57 (44.5%) |
Disability Class by Sex by Age in Glennville
Disability Class: Hearing Difficulty
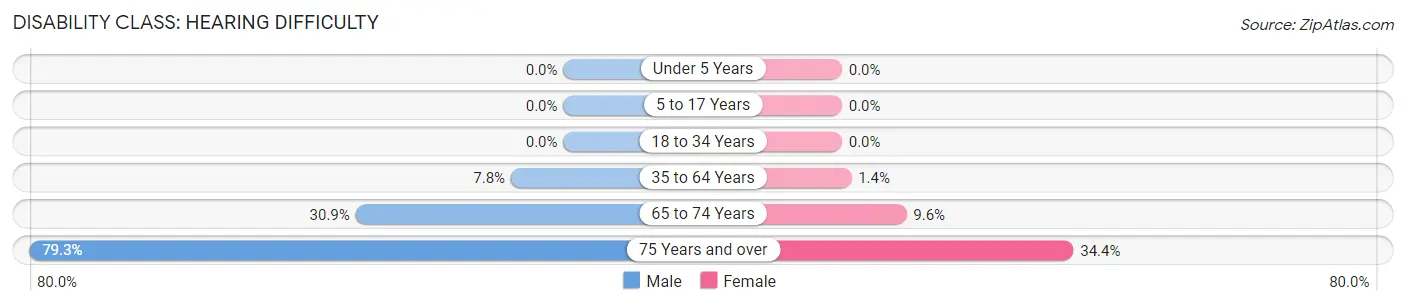
| Age Bracket | Male | Female |
| Under 5 Years | 0 (0.0%) | 0 (0.0%) |
| 5 to 17 Years | 0 (0.0%) | 0 (0.0%) |
| 18 to 34 Years | 0 (0.0%) | 0 (0.0%) |
| 35 to 64 Years | 41 (7.8%) | 10 (1.4%) |
| 65 to 74 Years | 87 (30.8%) | 25 (9.6%) |
| 75 Years and over | 46 (79.3%) | 44 (34.4%) |
Disability Class: Vision Difficulty
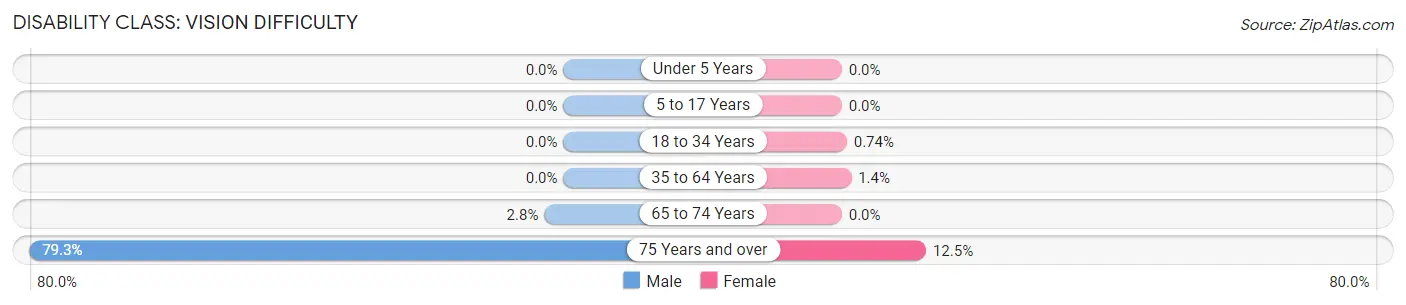
| Age Bracket | Male | Female |
| Under 5 Years | 0 (0.0%) | 0 (0.0%) |
| 5 to 17 Years | 0 (0.0%) | 0 (0.0%) |
| 18 to 34 Years | 0 (0.0%) | 3 (0.7%) |
| 35 to 64 Years | 0 (0.0%) | 10 (1.4%) |
| 65 to 74 Years | 8 (2.8%) | 0 (0.0%) |
| 75 Years and over | 46 (79.3%) | 16 (12.5%) |
Disability Class: Cognitive Difficulty
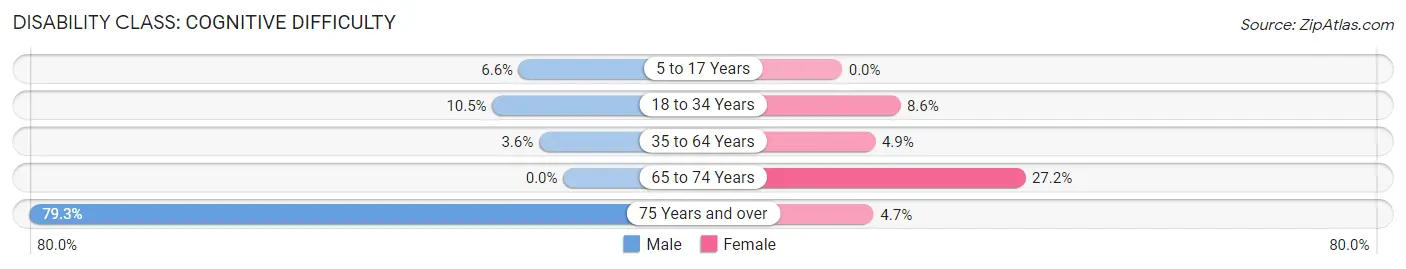
| Age Bracket | Male | Female |
| 5 to 17 Years | 19 (6.6%) | 0 (0.0%) |
| 18 to 34 Years | 18 (10.5%) | 35 (8.6%) |
| 35 to 64 Years | 19 (3.6%) | 35 (4.9%) |
| 65 to 74 Years | 0 (0.0%) | 71 (27.2%) |
| 75 Years and over | 46 (79.3%) | 6 (4.7%) |
Disability Class: Ambulatory Difficulty
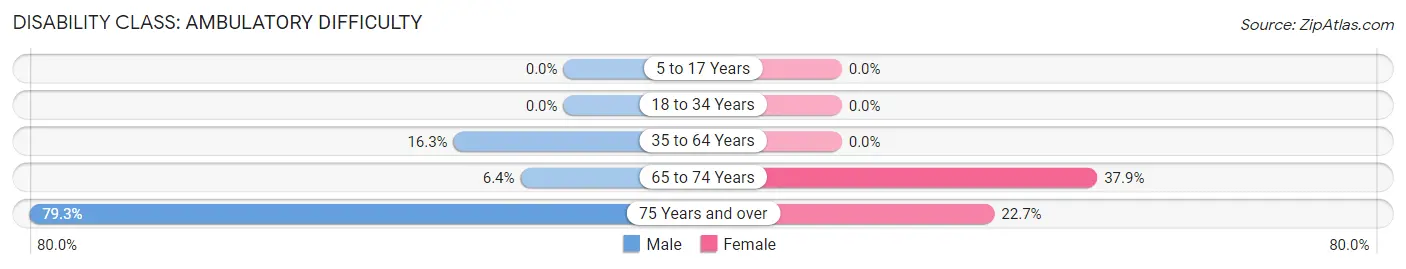
| Age Bracket | Male | Female |
| 5 to 17 Years | 0 (0.0%) | 0 (0.0%) |
| 18 to 34 Years | 0 (0.0%) | 0 (0.0%) |
| 35 to 64 Years | 86 (16.3%) | 0 (0.0%) |
| 65 to 74 Years | 18 (6.4%) | 99 (37.9%) |
| 75 Years and over | 46 (79.3%) | 29 (22.7%) |
Disability Class: Self-Care Difficulty
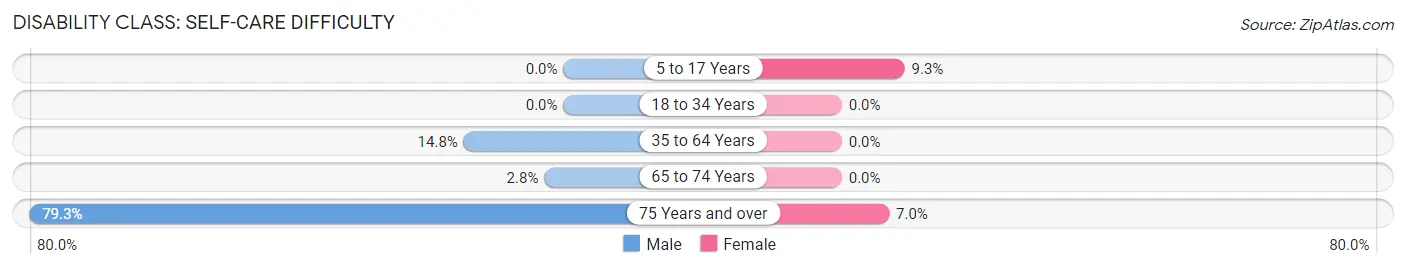
| Age Bracket | Male | Female |
| 5 to 17 Years | 0 (0.0%) | 39 (9.3%) |
| 18 to 34 Years | 0 (0.0%) | 0 (0.0%) |
| 35 to 64 Years | 78 (14.8%) | 0 (0.0%) |
| 65 to 74 Years | 8 (2.8%) | 0 (0.0%) |
| 75 Years and over | 46 (79.3%) | 9 (7.0%) |
Technology Access in Glennville
Computing Device Access in Glennville
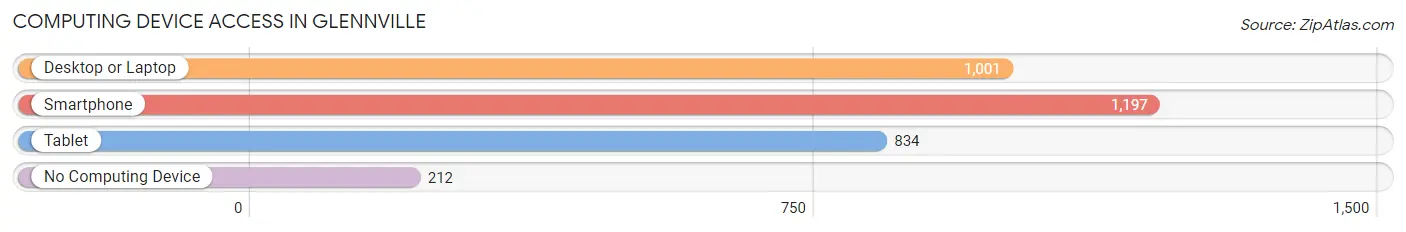
| Device Type | # Households | % Households |
| Desktop or Laptop | 1,001 | 68.0% |
| Smartphone | 1,197 | 81.4% |
| Tablet | 834 | 56.7% |
| No Computing Device | 212 | 14.4% |
| Total | 1,471 | 100.0% |
Internet Access in Glennville
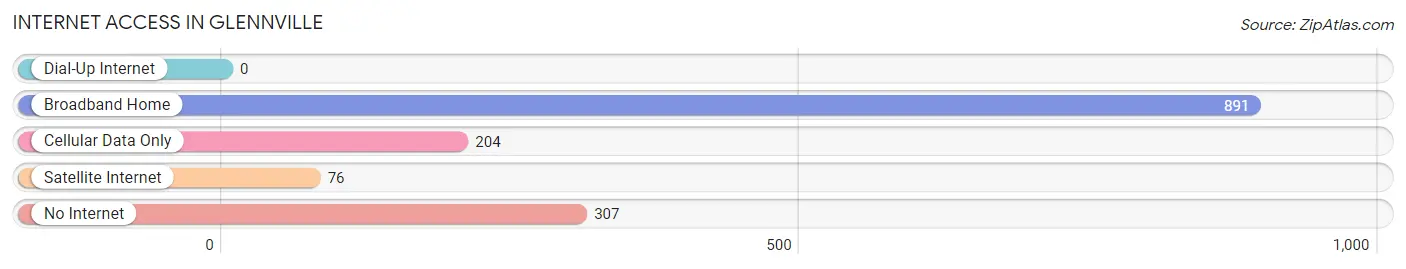
| Internet Type | # Households | % Households |
| Dial-Up Internet | 0 | 0.0% |
| Broadband Home | 891 | 60.6% |
| Cellular Data Only | 204 | 13.9% |
| Satellite Internet | 76 | 5.2% |
| No Internet | 307 | 20.9% |
| Total | 1,471 | 100.0% |
Glennville Summary
Glennville is a small city located in Tattnall County, Georgia, United States. It is the county seat of Tattnall County and is located about 50 miles west of Savannah. The population of Glennville was 2,731 at the 2010 census.
History
Glennville was founded in 1854 by William Glenn, a planter from South Carolina. He named the town after his father, John Glenn. The town was incorporated in 1856 and was the county seat of Tattnall County.
In the late 19th century, Glennville was a major center for the production of cotton and tobacco. The town was also home to several sawmills and gristmills.
In the early 20th century, Glennville was a major center for the production of turpentine. The town was also home to several stores, a bank, a hotel, and a post office.
Geography
Glennville is located at 31°51'25" North, 82°2'25" West (31.856944, -82.040278). The city is situated in the southeastern corner of Tattnall County, about 50 miles west of Savannah.
The city has a total area of 2.2 square miles, all of which is land. The city is located in the Altamaha River watershed.
Economy
The economy of Glennville is largely based on agriculture. The city is home to several farms that produce cotton, tobacco, and other crops. The city is also home to several sawmills and gristmills.
The city is home to several stores, a bank, a hotel, and a post office. The city is also home to several churches and schools.
Demographics
As of the 2010 census, there were 2,731 people, 1,093 households, and 717 families residing in the city. The population density was 1,228.2 people per square mile. There were 1,223 housing units at an average density of 551.2 per square mile.
The racial makeup of the city was 57.2% White, 39.2% African American, 0.2% Native American, 0.4% Asian, 0.1% Pacific Islander, 1.7% from other races, and 1.2% from two or more races. Hispanic or Latino of any race were 3.2% of the population.
There were 1,093 households, out of which 28.2% had children under the age of 18 living with them, 43.2% were married couples living together, 17.3% had a female householder with no husband present, and 34.2% were non-families. 29.2% of all households were made up of individuals, and 13.2% had someone living alone who was 65 years of age or older. The average household size was 2.50 and the average family size was 3.09.
In the city, the population was spread out, with 25.2% under the age of 18, 8.2% from 18 to 24, 25.2% from 25 to 44, 24.2% from 45 to 64, and 17.2% who were 65 years of age or older. The median age was 38 years. For every 100 females, there were 87.2 males. For every 100 females age 18 and over, there were 81.2 males.
The median income for a household in the city was $27,917, and the median income for a family was $33,750. Males had a median income of $27,917 versus $20,000 for females. The per capita income for the city was $14,845. About 17.2% of families and 20.2% of the population were below the poverty line, including 28.2% of those under age 18 and 16.2% of those age 65 or over.
Common Questions
What is the Total Population of Glennville?
Total Population of Glennville is 5,204.
What is the Total Male Population of Glennville?
Total Male Population of Glennville is 3,181.
What is the Total Female Population of Glennville?
Total Female Population of Glennville is 2,023.
What is the Ratio of Males per 100 Females in Glennville?
There are 157.24 Males per 100 Females in Glennville.
What is the Ratio of Females per 100 Males in Glennville?
There are 63.60 Females per 100 Males in Glennville.
What is the Median Population Age in Glennville?
Median Population Age in Glennville is 37.8 Years.
What is the Average Family Size in Glennville
Average Family Size in Glennville is 3.0 People.
What is the Average Household Size in Glennville
Average Household Size in Glennville is 2.3 People.
What is Per Capita Income in Glennville?
Per Capita income in Glennville is $19,329.
What is the Median Family Income in Glennville?
Median Family Income in Glennville is $63,969.
What is the Median Household income in Glennville?
Median Household Income in Glennville is $47,227.
What is Inequality or Gini Index in Glennville?
Inequality or Gini Index in Glennville is 0.46.
How Large is the Labor Force in Glennville?
There are 1,729 People in the Labor Forcein in Glennville.
What is the Percentage of People in the Labor Force in Glennville?
39.2% of People are in the Labor Force in Glennville.
What is the Unemployment Rate in Glennville?
Unemployment Rate in Glennville is 8.4%.