Washington, VA
Washington Map
Washington Overview
54
TOTAL POPULATION
17
MALE POPULATION
37
FEMALE POPULATION
45.95
MALES / 100 FEMALES
217.65
FEMALES / 100 MALES
68.5
MEDIAN AGE
2.7
AVG FAMILY SIZE
1.2
AVG HOUSEHOLD SIZE
$52,626
PER CAPITA INCOME
$40,000
AVG HOUSEHOLD INCOME
0.35
INEQUALITY / GINI INDEX
34
LABOR FORCE [ PEOPLE ]
63.0%
PERCENT IN LABOR FORCE
Washington Zip Codes
Washington Area Codes
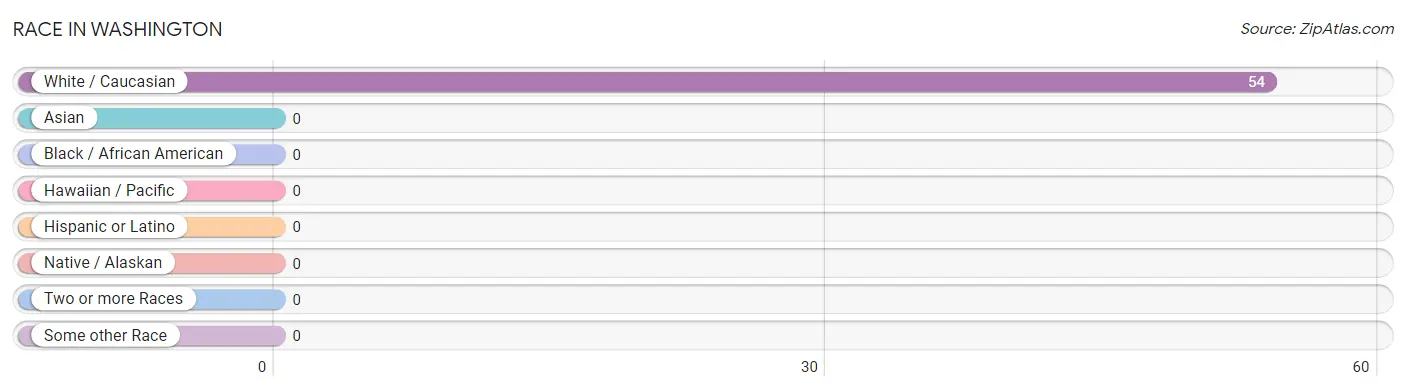
Race in Washington
The most populous races in Washington are , and White / Caucasian (54 | 100.0%).
| Race | # Population | % Population |
| Asian | 0 | 0.0% |
| Black / African American | 0 | 0.0% |
| Hawaiian / Pacific | 0 | 0.0% |
| Hispanic or Latino | 0 | 0.0% |
| Native / Alaskan | 0 | 0.0% |
| White / Caucasian | 54 | 100.0% |
| Two or more Races | 0 | 0.0% |
| Some other Race | 0 | 0.0% |
| Total | 54 | 100.0% |
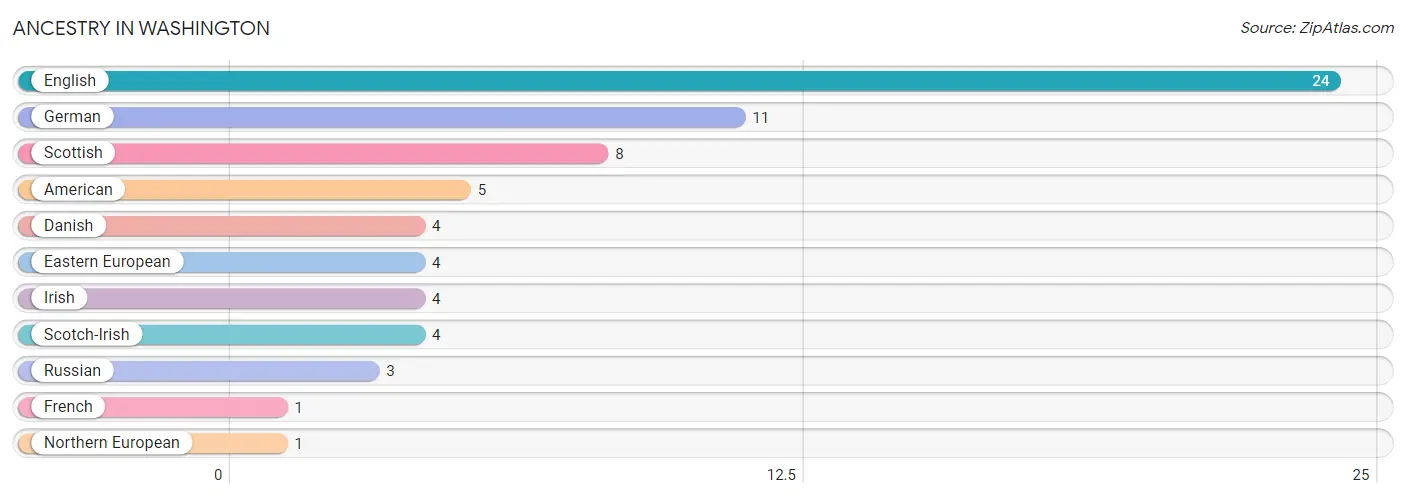
Ancestry in Washington
The most populous ancestries reported in Washington are English (24 | 44.4%), German (11 | 20.4%), Scottish (8 | 14.8%), American (5 | 9.3%), and Danish (4 | 7.4%), together accounting for 96.3% of all Washington residents.
| Ancestry | # Population | % Population |
| American | 5 | 9.3% |
| Danish | 4 | 7.4% |
| Eastern European | 4 | 7.4% |
| English | 24 | 44.4% |
| French | 1 | 1.8% |
| German | 11 | 20.4% |
| Irish | 4 | 7.4% |
| Northern European | 1 | 1.8% |
| Russian | 3 | 5.6% |
| Scotch-Irish | 4 | 7.4% |
| Scottish | 8 | 14.8% | View All 11 Rows |
Immigrants in Washington

| Immigration Origin | # Population | % Population | View All 0 Rows |
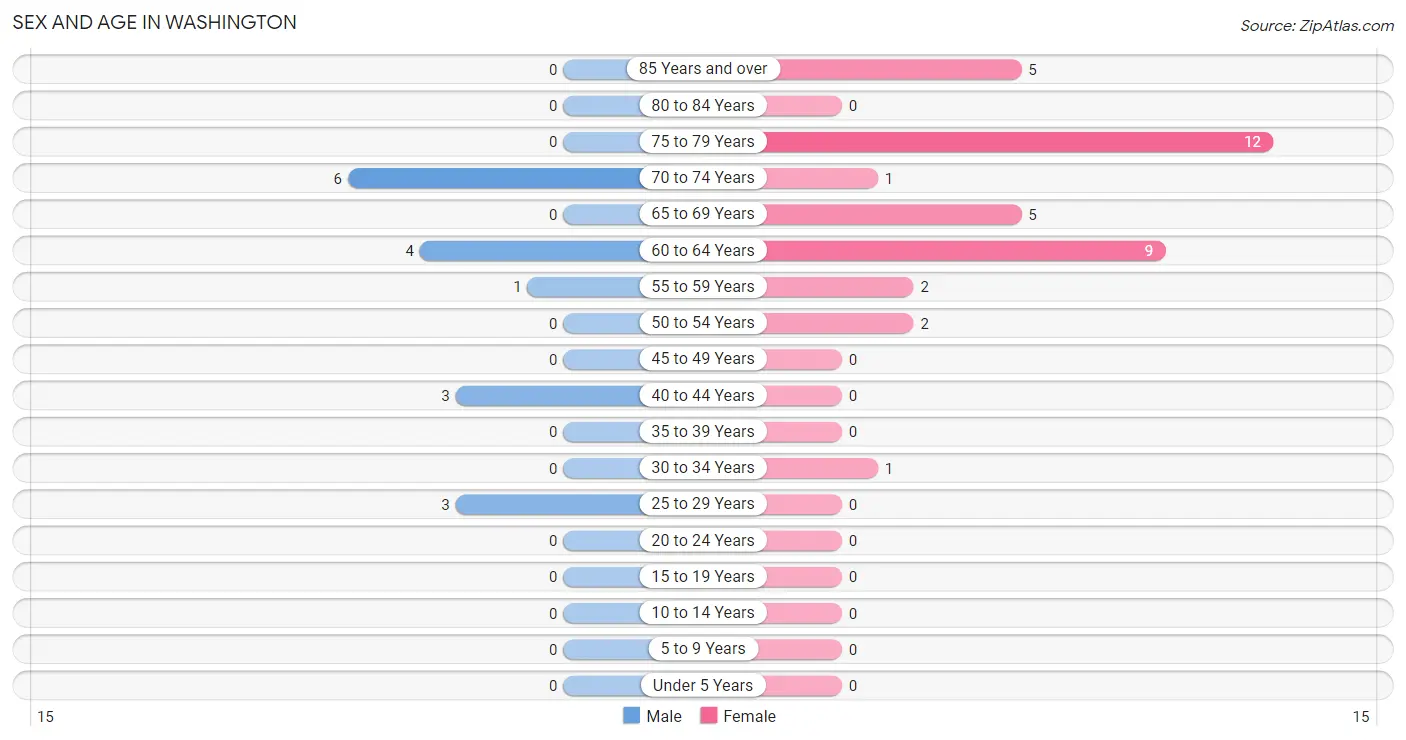
Sex and Age in Washington
Sex and Age in Washington
The most populous age groups in Washington are 70 to 74 Years (6 | 35.3%) for men and 75 to 79 Years (12 | 32.4%) for women.
| Age Bracket | Male | Female |
| Under 5 Years | 0 (0.0%) | 0 (0.0%) |
| 5 to 9 Years | 0 (0.0%) | 0 (0.0%) |
| 10 to 14 Years | 0 (0.0%) | 0 (0.0%) |
| 15 to 19 Years | 0 (0.0%) | 0 (0.0%) |
| 20 to 24 Years | 0 (0.0%) | 0 (0.0%) |
| 25 to 29 Years | 3 (17.6%) | 0 (0.0%) |
| 30 to 34 Years | 0 (0.0%) | 1 (2.7%) |
| 35 to 39 Years | 0 (0.0%) | 0 (0.0%) |
| 40 to 44 Years | 3 (17.6%) | 0 (0.0%) |
| 45 to 49 Years | 0 (0.0%) | 0 (0.0%) |
| 50 to 54 Years | 0 (0.0%) | 2 (5.4%) |
| 55 to 59 Years | 1 (5.9%) | 2 (5.4%) |
| 60 to 64 Years | 4 (23.5%) | 9 (24.3%) |
| 65 to 69 Years | 0 (0.0%) | 5 (13.5%) |
| 70 to 74 Years | 6 (35.3%) | 1 (2.7%) |
| 75 to 79 Years | 0 (0.0%) | 12 (32.4%) |
| 80 to 84 Years | 0 (0.0%) | 0 (0.0%) |
| 85 Years and over | 0 (0.0%) | 5 (13.5%) |
| Total | 17 (100.0%) | 37 (100.0%) |
Families and Households in Washington
Median Family Size in Washington
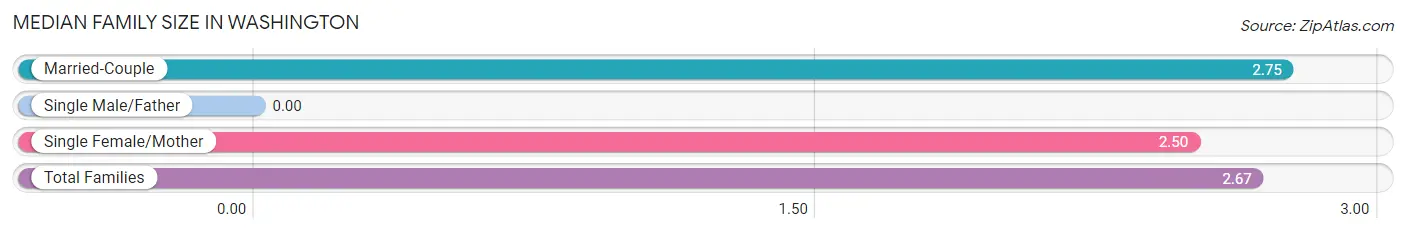
| Family Type | # Families | Family Size |
| Married-Couple | 4 (66.7%) | 2.75 |
| Single Male/Father | 0 (0.0%) | - |
| Single Female/Mother | 2 (33.3%) | 2.50 |
| Total Families | 6 (100.0%) | 2.67 |
Median Household Size in Washington
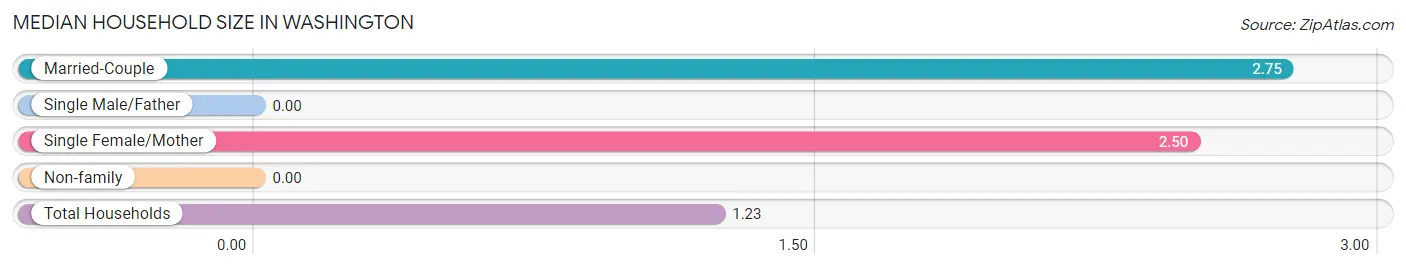
| Household Type | # Households | Household Size |
| Married-Couple | 4 (9.1%) | 2.75 |
| Single Male/Father | 0 (0.0%) | - |
| Single Female/Mother | 2 (4.5%) | 2.50 |
| Non-family | 38 (86.4%) | - |
| Total Households | 44 (100.0%) | 1.23 |
Household Size by Marriage Status in Washington
Out of a total of 44 households in Washington, 6 (13.6%) are family households, while 38 (86.4%) are nonfamily households. The most numerous type of family households are 2-person households, comprising 5, and the most common type of nonfamily households are 1-person households, comprising 38.
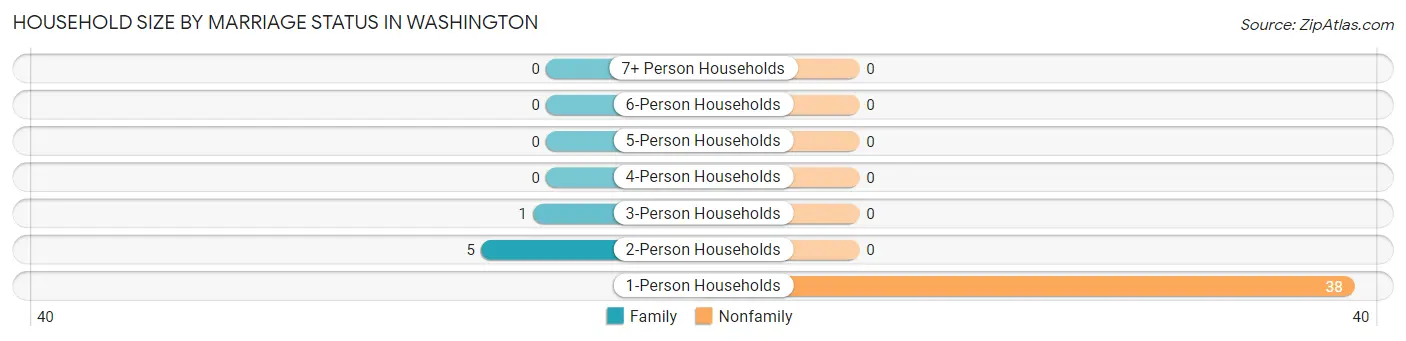
| Household Size | Family Households | Nonfamily Households |
| 1-Person Households | - | 38 (86.4%) |
| 2-Person Households | 5 (11.4%) | 0 (0.0%) |
| 3-Person Households | 1 (2.3%) | 0 (0.0%) |
| 4-Person Households | 0 (0.0%) | 0 (0.0%) |
| 5-Person Households | 0 (0.0%) | 0 (0.0%) |
| 6-Person Households | 0 (0.0%) | 0 (0.0%) |
| 7+ Person Households | 0 (0.0%) | 0 (0.0%) |
| Total | 6 (13.6%) | 38 (86.4%) |
Female Fertility in Washington
Fertility by Age in Washington
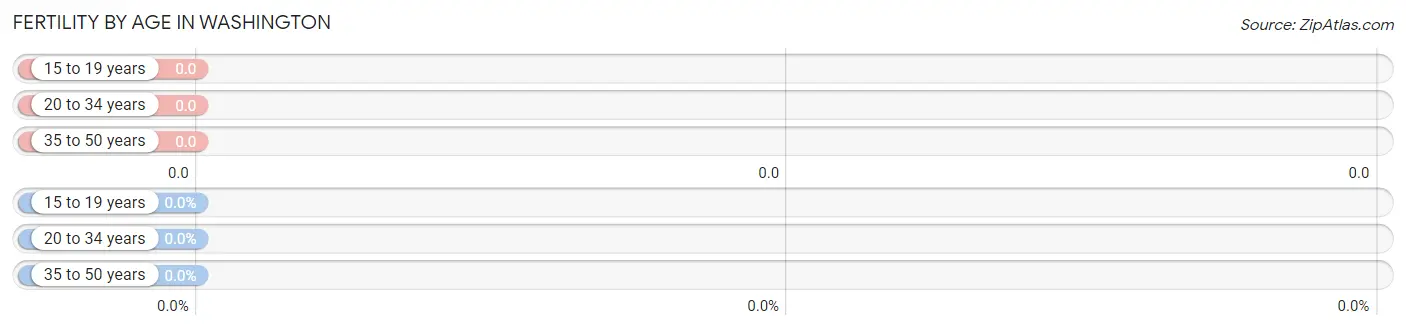
| Age Bracket | Women with Births | Births / 1,000 Women |
| 15 to 19 years | 0 (0.0%) | 0.0 |
| 20 to 34 years | 0 (0.0%) | 0.0 |
| 35 to 50 years | 0 (0.0%) | 0.0 |
| Total | 0 (0.0%) | 0.0 |
Fertility by Age by Marriage Status in Washington
| Age Bracket | Married | Unmarried |
| 15 to 19 years | 0 (0.0%) | 0 (0.0%) |
| 20 to 34 years | 0 (0.0%) | 0 (0.0%) |
| 35 to 50 years | 0 (0.0%) | 0 (0.0%) |
| Total | 0 (0.0%) | 0 (0.0%) |
Fertility by Education in Washington
| Educational Attainment | Women with Births | Births / 1,000 Women |
| Less than High School | 0 (0.0%) | 0.0 |
| High School Diploma | 0 (0.0%) | 0.0 |
| College or Associate's Degree | 0 (0.0%) | 0.0 |
| Bachelor's Degree | 0 (0.0%) | 0.0 |
| Graduate Degree | 0 (0.0%) | 0.0 |
| Total | 0 (0.0%) | 0.0 |
Fertility by Education by Marriage Status in Washington
| Educational Attainment | Married | Unmarried |
| Less than High School | 0 (0.0%) | 0 (0.0%) |
| High School Diploma | 0 (0.0%) | 0 (0.0%) |
| College or Associate's Degree | 0 (0.0%) | 0 (0.0%) |
| Bachelor's Degree | 0 (0.0%) | 0 (0.0%) |
| Graduate Degree | 0 (0.0%) | 0 (0.0%) |
| Total | 0 (0.0%) | 0 (0.0%) |
Income in Washington
Income Overview in Washington
| Characteristic | Number | Measure |
| Per Capita Income | 54 | $52,626 |
| Median Family Income | 6 | $0 |
| Mean Family Income | 6 | $114,583 |
| Median Household Income | 44 | $40,000 |
| Mean Household Income | 44 | $61,295 |
| Income Deficit | 6 | $0 |
| Wage / Income Gap (%) | 54 | 0.00% |
| Wage / Income Gap ($) | 54 | 100.00¢ per $1 |
| Gini / Inequality Index | 54 | 0.35 |
Earnings by Sex in Washington
| Sex | Number | Average Earnings |
| Male | 13 (37.1%) | $0 |
| Female | 22 (62.9%) | $0 |
| Total | 35 (100.0%) | $0 |
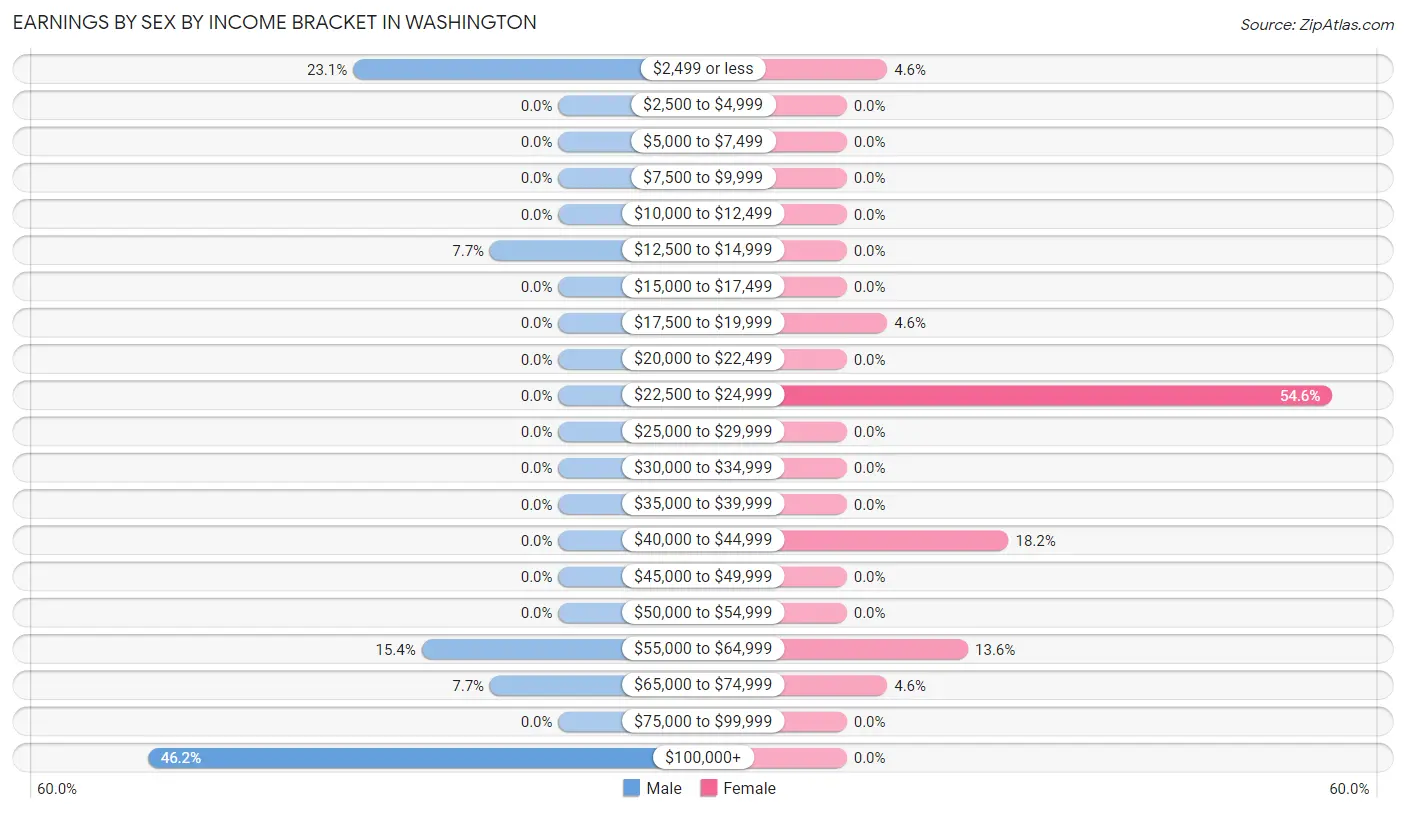
Earnings by Sex by Income Bracket in Washington
The most common earnings brackets in Washington are $100,000+ for men (6 | 46.2%) and $22,500 to $24,999 for women (12 | 54.5%).
| Income | Male | Female |
| $2,499 or less | 3 (23.1%) | 1 (4.5%) |
| $2,500 to $4,999 | 0 (0.0%) | 0 (0.0%) |
| $5,000 to $7,499 | 0 (0.0%) | 0 (0.0%) |
| $7,500 to $9,999 | 0 (0.0%) | 0 (0.0%) |
| $10,000 to $12,499 | 0 (0.0%) | 0 (0.0%) |
| $12,500 to $14,999 | 1 (7.7%) | 0 (0.0%) |
| $15,000 to $17,499 | 0 (0.0%) | 0 (0.0%) |
| $17,500 to $19,999 | 0 (0.0%) | 1 (4.5%) |
| $20,000 to $22,499 | 0 (0.0%) | 0 (0.0%) |
| $22,500 to $24,999 | 0 (0.0%) | 12 (54.5%) |
| $25,000 to $29,999 | 0 (0.0%) | 0 (0.0%) |
| $30,000 to $34,999 | 0 (0.0%) | 0 (0.0%) |
| $35,000 to $39,999 | 0 (0.0%) | 0 (0.0%) |
| $40,000 to $44,999 | 0 (0.0%) | 4 (18.2%) |
| $45,000 to $49,999 | 0 (0.0%) | 0 (0.0%) |
| $50,000 to $54,999 | 0 (0.0%) | 0 (0.0%) |
| $55,000 to $64,999 | 2 (15.4%) | 3 (13.6%) |
| $65,000 to $74,999 | 1 (7.7%) | 1 (4.5%) |
| $75,000 to $99,999 | 0 (0.0%) | 0 (0.0%) |
| $100,000+ | 6 (46.2%) | 0 (0.0%) |
| Total | 13 (100.0%) | 22 (100.0%) |
Earnings by Sex by Educational Attainment in Washington
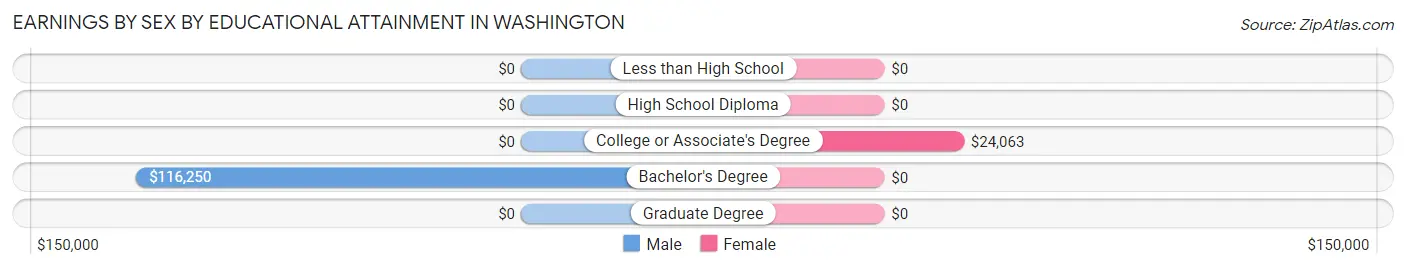
| Educational Attainment | Male Income | Female Income |
| Less than High School | - | - |
| High School Diploma | - | - |
| College or Associate's Degree | - | - |
| Bachelor's Degree | $116,250 | $0 |
| Graduate Degree | - | - |
| Total | - | - |
Family Income in Washington
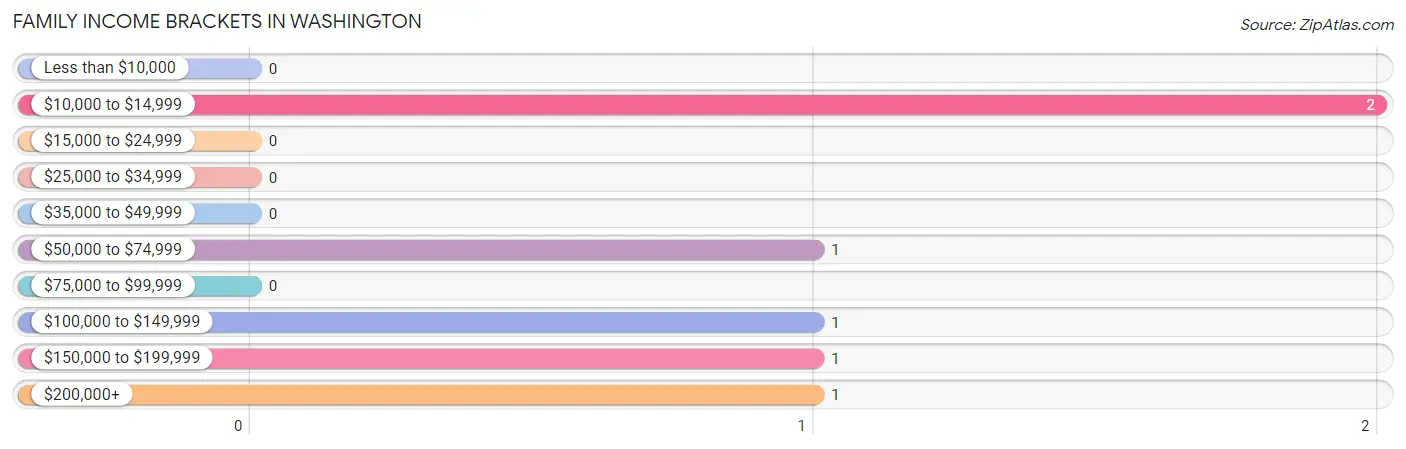
Family Income Brackets in Washington
According to the Washington family income data, there are 2 families falling into the $10,000 to $14,999 income range, which is the most common income bracket and makes up 33.3% of all families.
| Income Bracket | # Families | % Families |
| Less than $10,000 | 0 | 0.0% |
| $10,000 to $14,999 | 2 | 33.3% |
| $15,000 to $24,999 | 0 | 0.0% |
| $25,000 to $34,999 | 0 | 0.0% |
| $35,000 to $49,999 | 0 | 0.0% |
| $50,000 to $74,999 | 1 | 16.7% |
| $75,000 to $99,999 | 0 | 0.0% |
| $100,000 to $149,999 | 1 | 16.7% |
| $150,000 to $199,999 | 1 | 16.7% |
| $200,000+ | 1 | 16.7% |
Family Income by Famaliy Size in Washington
| Income Bracket | # Families | Median Income |
| 2-Person Families | 5 (83.3%) | $0 |
| 3-Person Families | 1 (16.7%) | $0 |
| 4-Person Families | 0 (0.0%) | $0 |
| 5-Person Families | 0 (0.0%) | $0 |
| 6-Person Families | 0 (0.0%) | $0 |
| 7+ Person Families | 0 (0.0%) | $0 |
| Total | 6 (100.0%) | $0 |
Family Income by Number of Earners in Washington
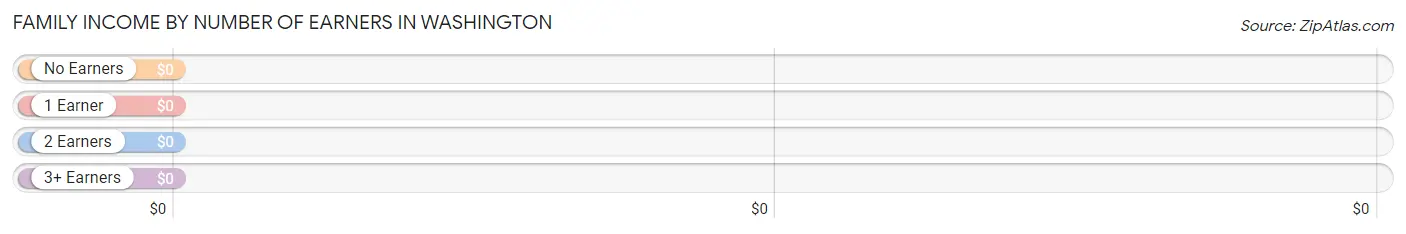
| Number of Earners | # Families | Median Income |
| No Earners | 0 (0.0%) | $0 |
| 1 Earner | 3 (50.0%) | $0 |
| 2 Earners | 2 (33.3%) | $0 |
| 3+ Earners | 1 (16.7%) | $0 |
| Total | 6 (100.0%) | $0 |
Household Income in Washington
Household Income Brackets in Washington
With 25 households falling in the category, the $35,000 to $49,999 income range is the most frequent in Washington, accounting for 56.8% of all households.
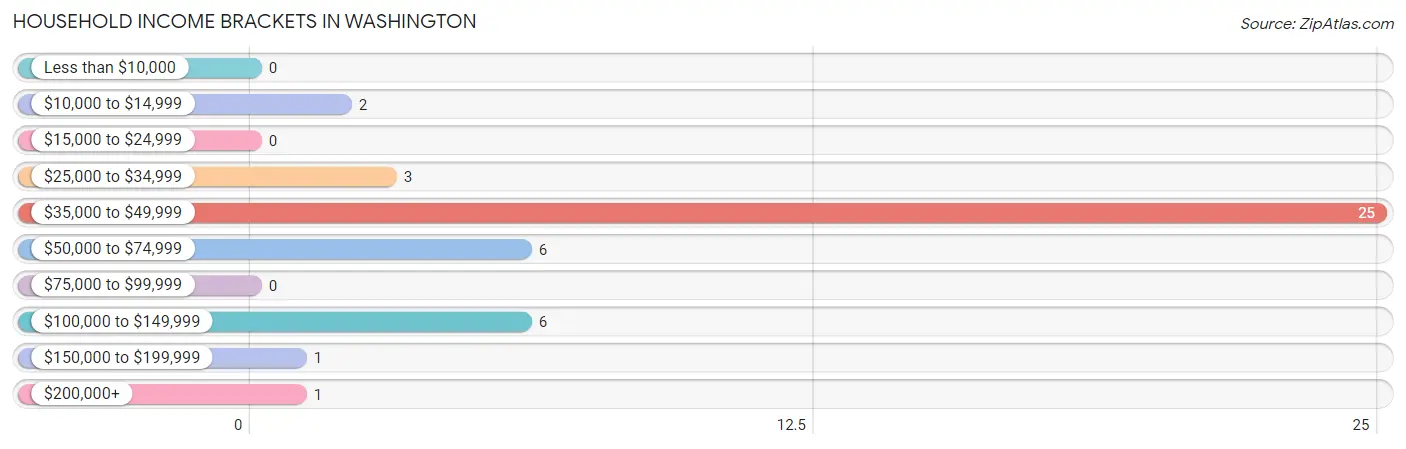
| Income Bracket | # Households | % Households |
| Less than $10,000 | 0 | 0.0% |
| $10,000 to $14,999 | 2 | 4.5% |
| $15,000 to $24,999 | 0 | 0.0% |
| $25,000 to $34,999 | 3 | 6.8% |
| $35,000 to $49,999 | 25 | 56.8% |
| $50,000 to $74,999 | 6 | 13.6% |
| $75,000 to $99,999 | 0 | 0.0% |
| $100,000 to $149,999 | 6 | 13.6% |
| $150,000 to $199,999 | 1 | 2.3% |
| $200,000+ | 1 | 2.3% |
Household Income by Householder Age in Washington
The median household income in Washington is $40,000, with the highest median household income of $43,750 found in the 45 to 64 years age bracket for the primary householder. A total of 14 households (31.8%) fall into this category.
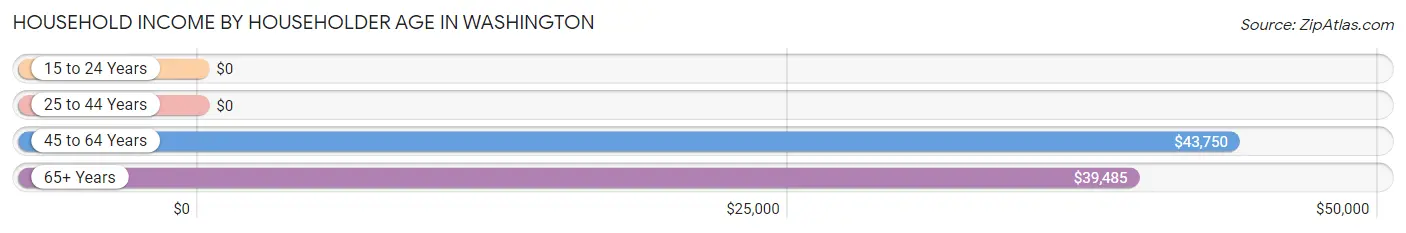
| Income Bracket | # Households | Median Income |
| 15 to 24 Years | 0 (0.0%) | $0 |
| 25 to 44 Years | 3 (6.8%) | $0 |
| 45 to 64 Years | 14 (31.8%) | $43,750 |
| 65+ Years | 27 (61.4%) | $39,485 |
| Total | 44 (100.0%) | $40,000 |
Poverty in Washington
Income Below Poverty by Sex and Age in Washington
With 17.6% poverty level for males and 5.4% for females among the residents of Washington, 25 to 34 year old males and 55 to 64 year old females are the most vulnerable to poverty, with 3 males (100.0%) and 2 females (18.2%) in their respective age groups living below the poverty level.
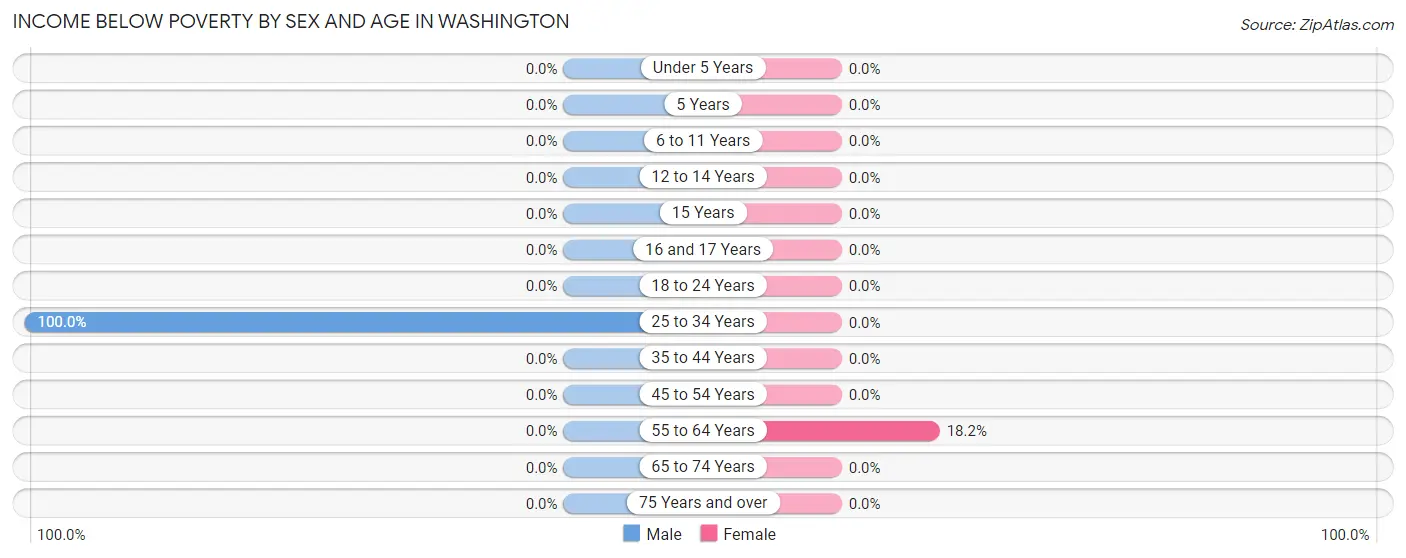
| Age Bracket | Male | Female |
| Under 5 Years | 0 (0.0%) | 0 (0.0%) |
| 5 Years | 0 (0.0%) | 0 (0.0%) |
| 6 to 11 Years | 0 (0.0%) | 0 (0.0%) |
| 12 to 14 Years | 0 (0.0%) | 0 (0.0%) |
| 15 Years | 0 (0.0%) | 0 (0.0%) |
| 16 and 17 Years | 0 (0.0%) | 0 (0.0%) |
| 18 to 24 Years | 0 (0.0%) | 0 (0.0%) |
| 25 to 34 Years | 3 (100.0%) | 0 (0.0%) |
| 35 to 44 Years | 0 (0.0%) | 0 (0.0%) |
| 45 to 54 Years | 0 (0.0%) | 0 (0.0%) |
| 55 to 64 Years | 0 (0.0%) | 2 (18.2%) |
| 65 to 74 Years | 0 (0.0%) | 0 (0.0%) |
| 75 Years and over | 0 (0.0%) | 0 (0.0%) |
| Total | 3 (17.6%) | 2 (5.4%) |
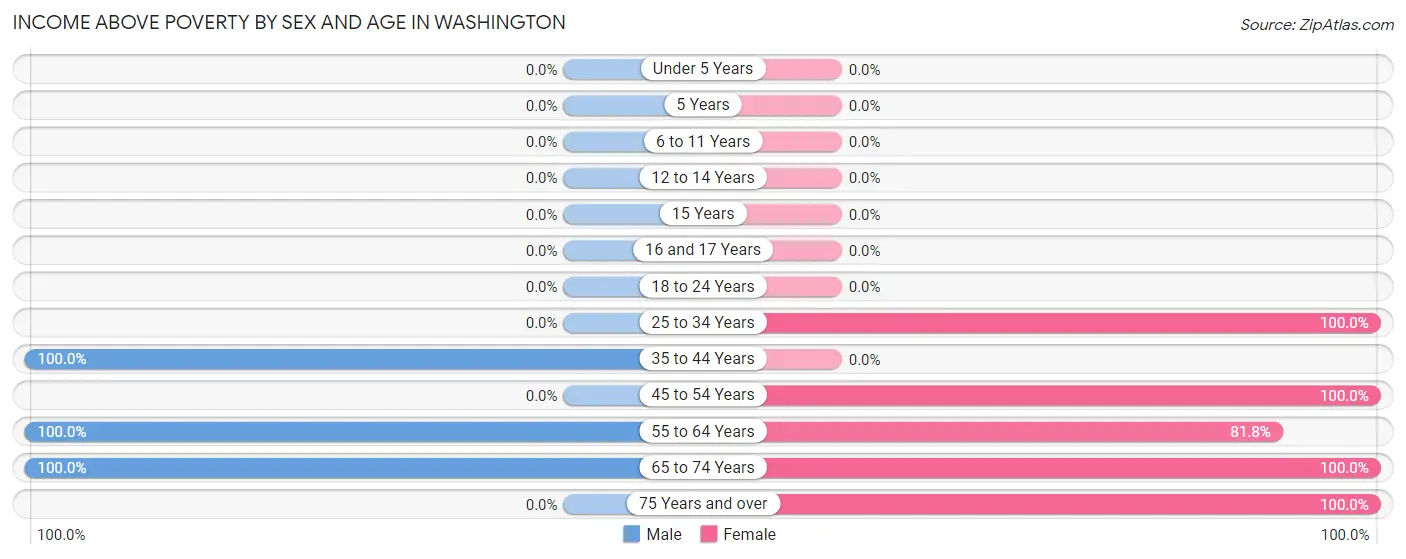
Income Above Poverty by Sex and Age in Washington
According to the poverty statistics in Washington, males aged 35 to 44 years and females aged 25 to 34 years are the age groups that are most secure financially, with 100.0% of males and 100.0% of females in these age groups living above the poverty line.
| Age Bracket | Male | Female |
| Under 5 Years | 0 (0.0%) | 0 (0.0%) |
| 5 Years | 0 (0.0%) | 0 (0.0%) |
| 6 to 11 Years | 0 (0.0%) | 0 (0.0%) |
| 12 to 14 Years | 0 (0.0%) | 0 (0.0%) |
| 15 Years | 0 (0.0%) | 0 (0.0%) |
| 16 and 17 Years | 0 (0.0%) | 0 (0.0%) |
| 18 to 24 Years | 0 (0.0%) | 0 (0.0%) |
| 25 to 34 Years | 0 (0.0%) | 1 (100.0%) |
| 35 to 44 Years | 3 (100.0%) | 0 (0.0%) |
| 45 to 54 Years | 0 (0.0%) | 2 (100.0%) |
| 55 to 64 Years | 5 (100.0%) | 9 (81.8%) |
| 65 to 74 Years | 6 (100.0%) | 6 (100.0%) |
| 75 Years and over | 0 (0.0%) | 17 (100.0%) |
| Total | 14 (82.4%) | 35 (94.6%) |
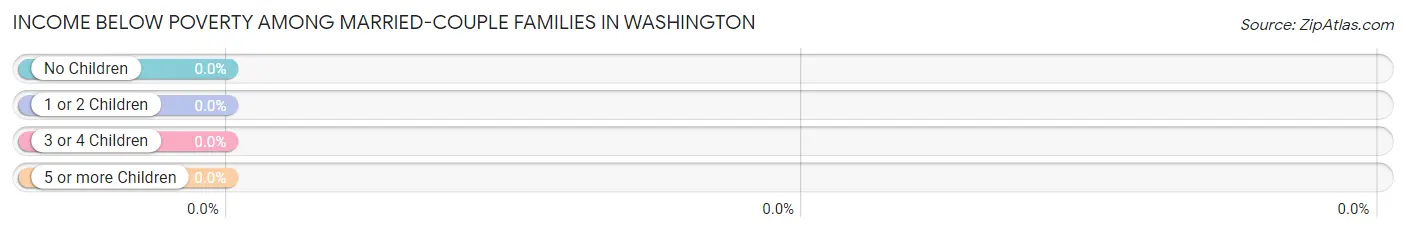
Income Below Poverty Among Married-Couple Families in Washington
| Children | Above Poverty | Below Poverty |
| No Children | 4 (100.0%) | 0 (0.0%) |
| 1 or 2 Children | 0 (0.0%) | 0 (0.0%) |
| 3 or 4 Children | 0 (0.0%) | 0 (0.0%) |
| 5 or more Children | 0 (0.0%) | 0 (0.0%) |
| Total | 4 (100.0%) | 0 (0.0%) |
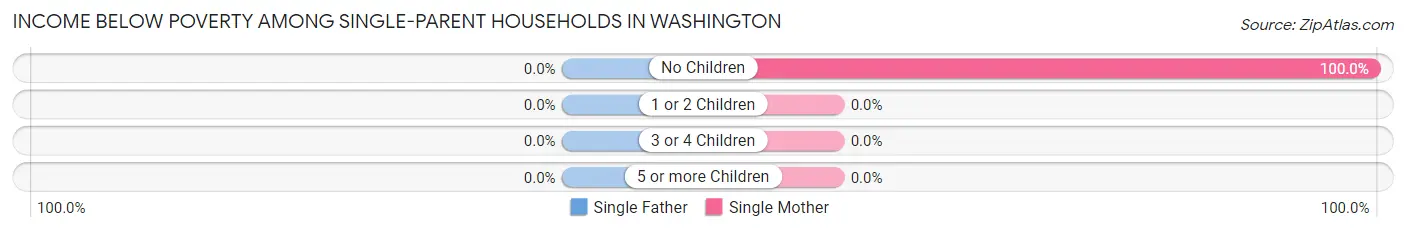
Income Below Poverty Among Single-Parent Households in Washington
| Children | Single Father | Single Mother |
| No Children | 0 (0.0%) | 2 (100.0%) |
| 1 or 2 Children | 0 (0.0%) | 0 (0.0%) |
| 3 or 4 Children | 0 (0.0%) | 0 (0.0%) |
| 5 or more Children | 0 (0.0%) | 0 (0.0%) |
| Total | 0 (0.0%) | 2 (100.0%) |
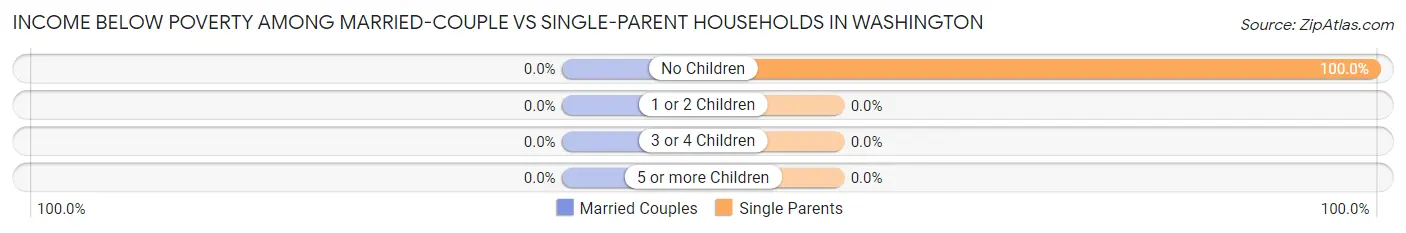
Income Below Poverty Among Married-Couple vs Single-Parent Households in Washington
| Children | Married-Couple Families | Single-Parent Households |
| No Children | 0 (0.0%) | 2 (100.0%) |
| 1 or 2 Children | 0 (0.0%) | 0 (0.0%) |
| 3 or 4 Children | 0 (0.0%) | 0 (0.0%) |
| 5 or more Children | 0 (0.0%) | 0 (0.0%) |
| Total | 0 (0.0%) | 2 (100.0%) |
Employment Characteristics in Washington
Employment by Class of Employer in Washington
Among the 34 employed individuals in Washington, private company employees (25 | 73.5%), not-for-profit organizations (4 | 11.8%), and self-employed (incorporated) (3 | 8.8%) make up the most common classes of employment.
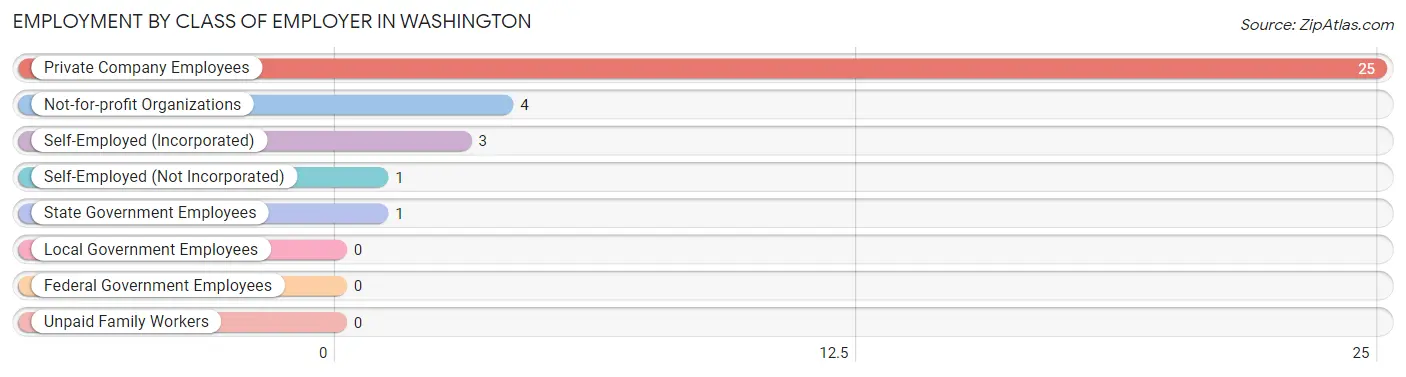
| Employer Class | # Employees | % Employees |
| Private Company Employees | 25 | 73.5% |
| Self-Employed (Incorporated) | 3 | 8.8% |
| Self-Employed (Not Incorporated) | 1 | 2.9% |
| Not-for-profit Organizations | 4 | 11.8% |
| Local Government Employees | 0 | 0.0% |
| State Government Employees | 1 | 2.9% |
| Federal Government Employees | 0 | 0.0% |
| Unpaid Family Workers | 0 | 0.0% |
| Total | 34 | 100.0% |
Employment Status by Age in Washington
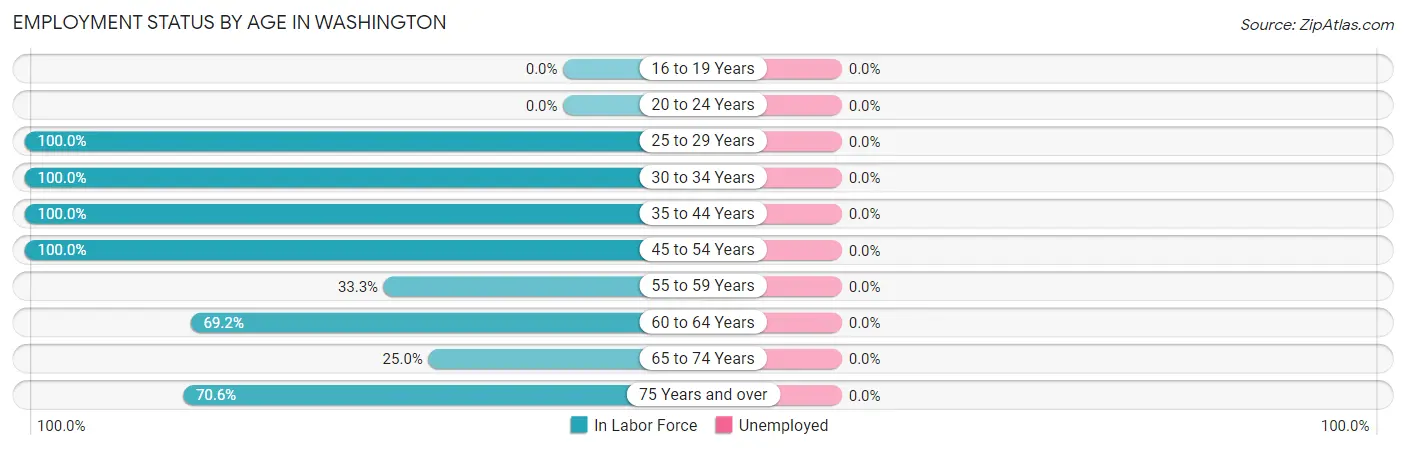
| Age Bracket | In Labor Force | Unemployed |
| 16 to 19 Years | 0 (0.0%) | 0 (0.0%) |
| 20 to 24 Years | 0 (0.0%) | 0 (0.0%) |
| 25 to 29 Years | 3 (100.0%) | 0 (0.0%) |
| 30 to 34 Years | 1 (100.0%) | 0 (0.0%) |
| 35 to 44 Years | 3 (100.0%) | 0 (0.0%) |
| 45 to 54 Years | 2 (100.0%) | 0 (0.0%) |
| 55 to 59 Years | 1 (33.3%) | 0 (0.0%) |
| 60 to 64 Years | 9 (69.2%) | 0 (0.0%) |
| 65 to 74 Years | 3 (25.0%) | 0 (0.0%) |
| 75 Years and over | 12 (70.6%) | 0 (0.0%) |
| Total | 34 (63.0%) | 0 (0.0%) |
Employment Status by Educational Attainment in Washington
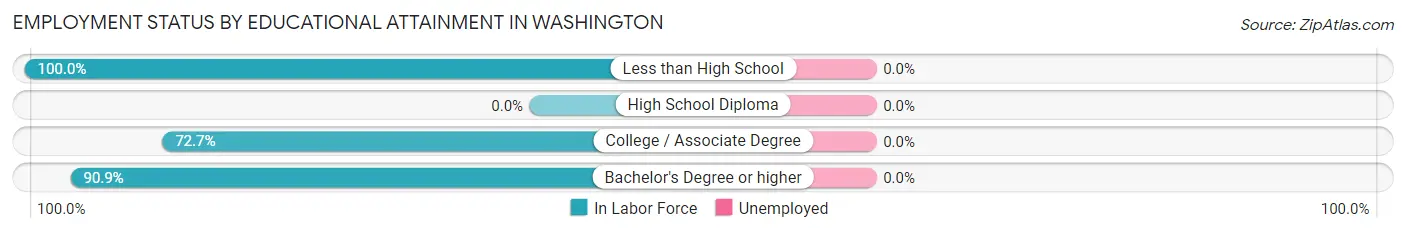
| Educational Attainment | In Labor Force | Unemployed |
| Less than High School | 1 (100.0%) | 0 (0.0%) |
| High School Diploma | 0 (0.0%) | 0 (0.0%) |
| College / Associate Degree | 8 (72.7%) | 0 (0.0%) |
| Bachelor's Degree or higher | 10 (90.9%) | 0 (0.0%) |
| Total | 19 (76.0%) | 0 (0.0%) |
Employment Occupations by Sex in Washington
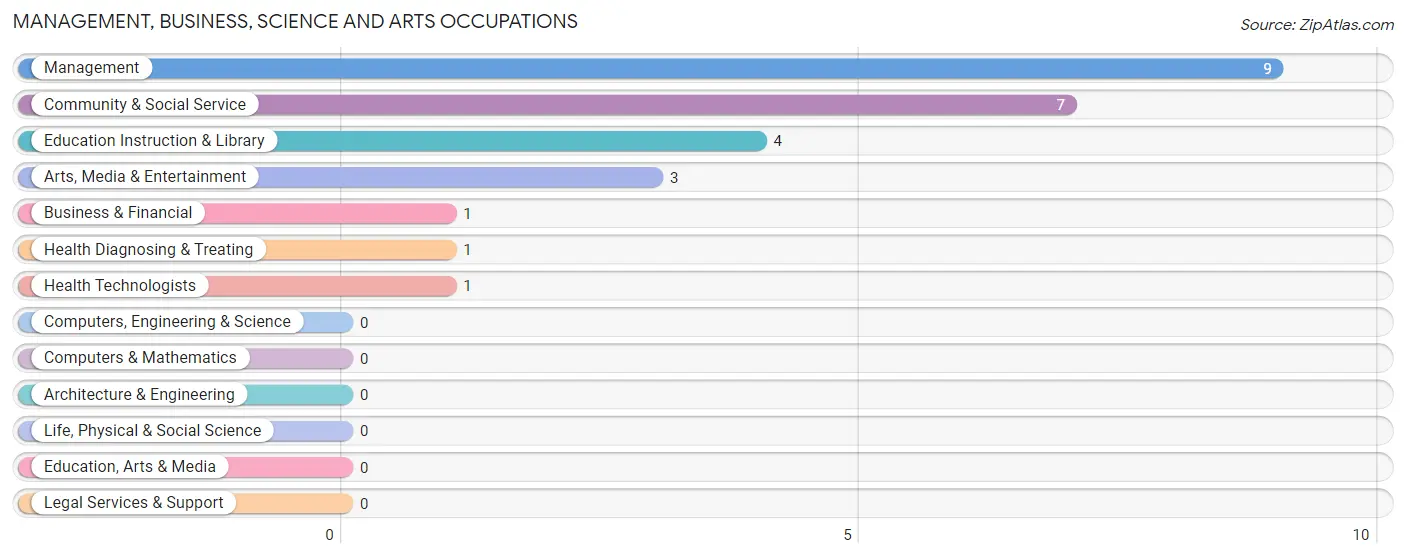
Management, Business, Science and Arts Occupations
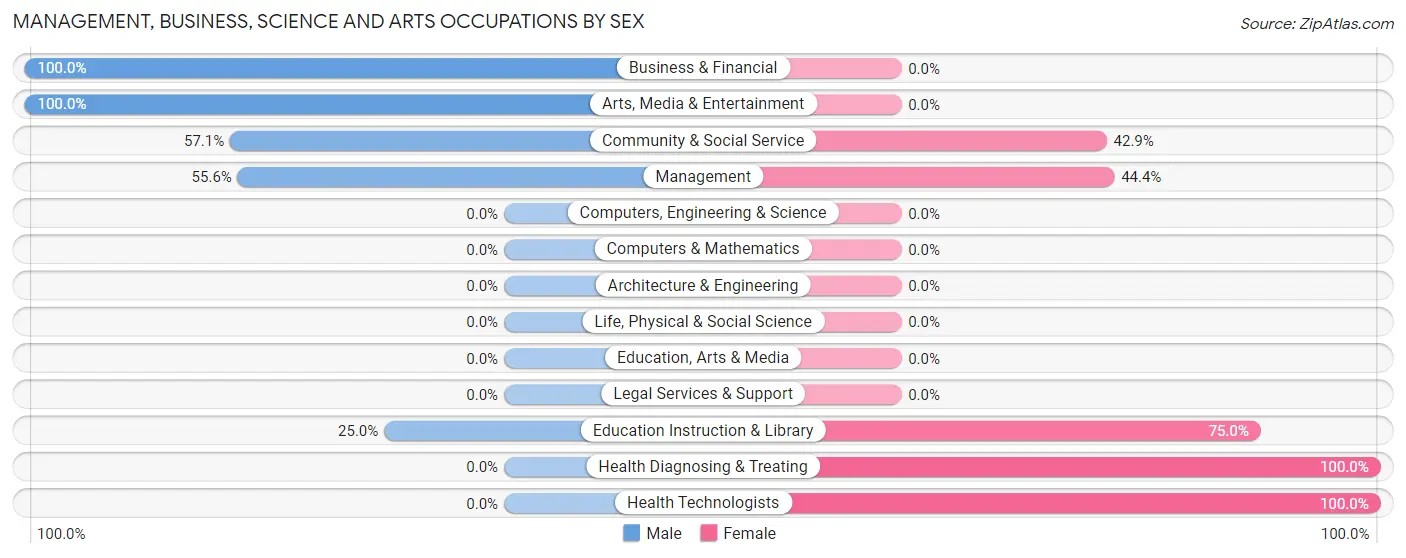
The most common Management, Business, Science and Arts occupations in Washington are Management (9 | 26.5%), Community & Social Service (7 | 20.6%), Education Instruction & Library (4 | 11.8%), Arts, Media & Entertainment (3 | 8.8%), and Business & Financial (1 | 2.9%).
Management, Business, Science and Arts Occupations by Sex
Within the Management, Business, Science and Arts occupations in Washington, the most male-oriented occupations are Business & Financial (100.0%), Arts, Media & Entertainment (100.0%), and Community & Social Service (57.1%), while the most female-oriented occupations are Health Diagnosing & Treating (100.0%), Health Technologists (100.0%), and Education Instruction & Library (75.0%).
| Occupation | Male | Female |
| Management | 5 (55.6%) | 4 (44.4%) |
| Business & Financial | 1 (100.0%) | 0 (0.0%) |
| Computers, Engineering & Science | 0 (0.0%) | 0 (0.0%) |
| Computers & Mathematics | 0 (0.0%) | 0 (0.0%) |
| Architecture & Engineering | 0 (0.0%) | 0 (0.0%) |
| Life, Physical & Social Science | 0 (0.0%) | 0 (0.0%) |
| Community & Social Service | 4 (57.1%) | 3 (42.9%) |
| Education, Arts & Media | 0 (0.0%) | 0 (0.0%) |
| Legal Services & Support | 0 (0.0%) | 0 (0.0%) |
| Education Instruction & Library | 1 (25.0%) | 3 (75.0%) |
| Arts, Media & Entertainment | 3 (100.0%) | 0 (0.0%) |
| Health Diagnosing & Treating | 0 (0.0%) | 1 (100.0%) |
| Health Technologists | 0 (0.0%) | 1 (100.0%) |
| Total (Category) | 10 (55.6%) | 8 (44.4%) |
| Total (Overall) | 13 (38.2%) | 21 (61.8%) |
Services Occupations
Services Occupations by Sex
| Occupation | Male | Female |
| Healthcare Support | 0 (0.0%) | 0 (0.0%) |
| Security & Protection | 0 (0.0%) | 0 (0.0%) |
| Firefighting & Prevention | 0 (0.0%) | 0 (0.0%) |
| Law Enforcement | 0 (0.0%) | 0 (0.0%) |
| Food Preparation & Serving | 0 (0.0%) | 0 (0.0%) |
| Cleaning & Maintenance | 0 (0.0%) | 0 (0.0%) |
| Personal Care & Service | 0 (0.0%) | 0 (0.0%) |
| Total (Category) | 0 (0.0%) | 0 (0.0%) |
| Total (Overall) | 13 (38.2%) | 21 (61.8%) |
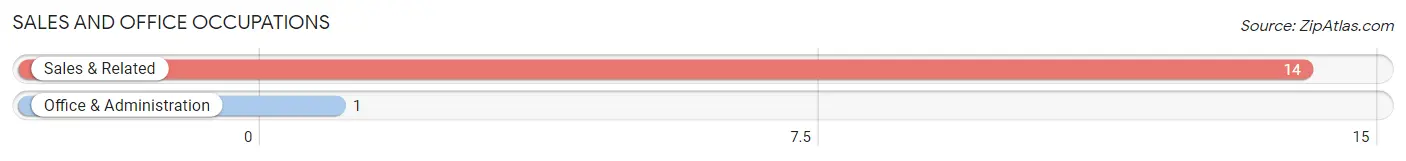
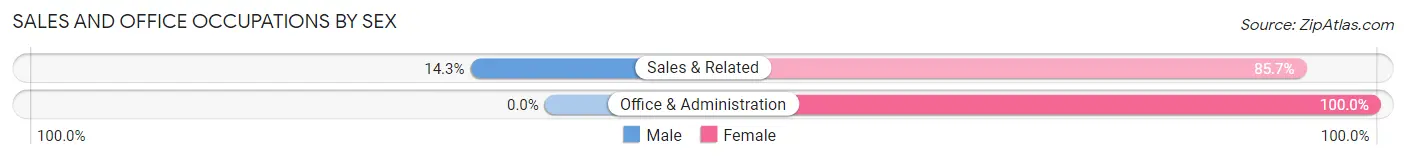
Sales and Office Occupations
The most common Sales and Office occupations in Washington are Sales & Related (14 | 41.2%), and Office & Administration (1 | 2.9%).
Sales and Office Occupations by Sex
| Occupation | Male | Female |
| Sales & Related | 2 (14.3%) | 12 (85.7%) |
| Office & Administration | 0 (0.0%) | 1 (100.0%) |
| Total (Category) | 2 (13.3%) | 13 (86.7%) |
| Total (Overall) | 13 (38.2%) | 21 (61.8%) |
Natural Resources, Construction and Maintenance Occupations
The most common Natural Resources, Construction and Maintenance occupations in Washington are , and Farming, Fishing & Forestry (1 | 2.9%).
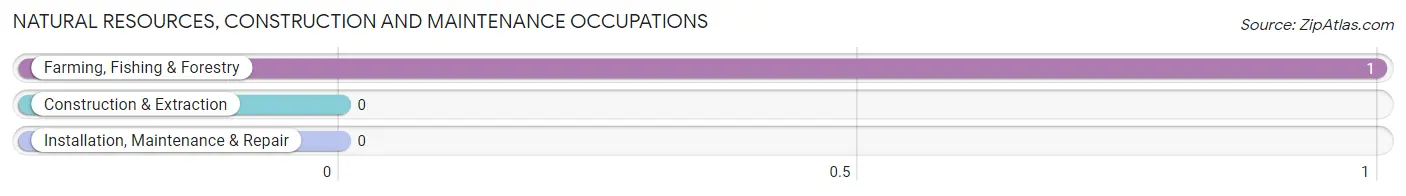
Natural Resources, Construction and Maintenance Occupations by Sex
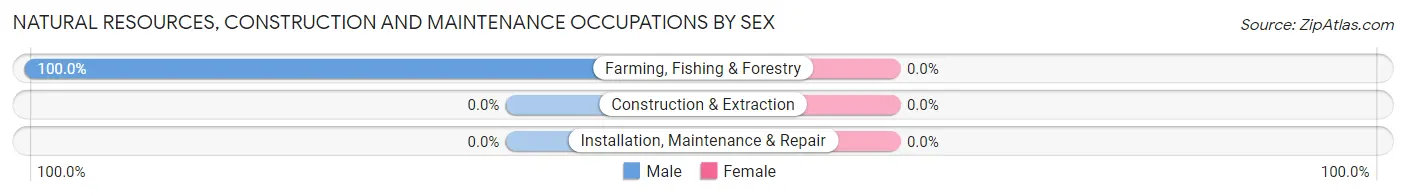
| Occupation | Male | Female |
| Farming, Fishing & Forestry | 1 (100.0%) | 0 (0.0%) |
| Construction & Extraction | 0 (0.0%) | 0 (0.0%) |
| Installation, Maintenance & Repair | 0 (0.0%) | 0 (0.0%) |
| Total (Category) | 1 (100.0%) | 0 (0.0%) |
| Total (Overall) | 13 (38.2%) | 21 (61.8%) |
Production, Transportation and Moving Occupations
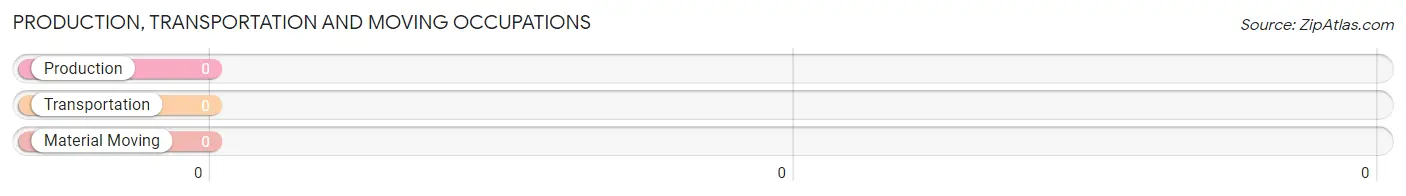
Production, Transportation and Moving Occupations by Sex
| Occupation | Male | Female |
| Production | 0 (0.0%) | 0 (0.0%) |
| Transportation | 0 (0.0%) | 0 (0.0%) |
| Material Moving | 0 (0.0%) | 0 (0.0%) |
| Total (Category) | 0 (0.0%) | 0 (0.0%) |
| Total (Overall) | 13 (38.2%) | 21 (61.8%) |
Employment Industries by Sex in Washington
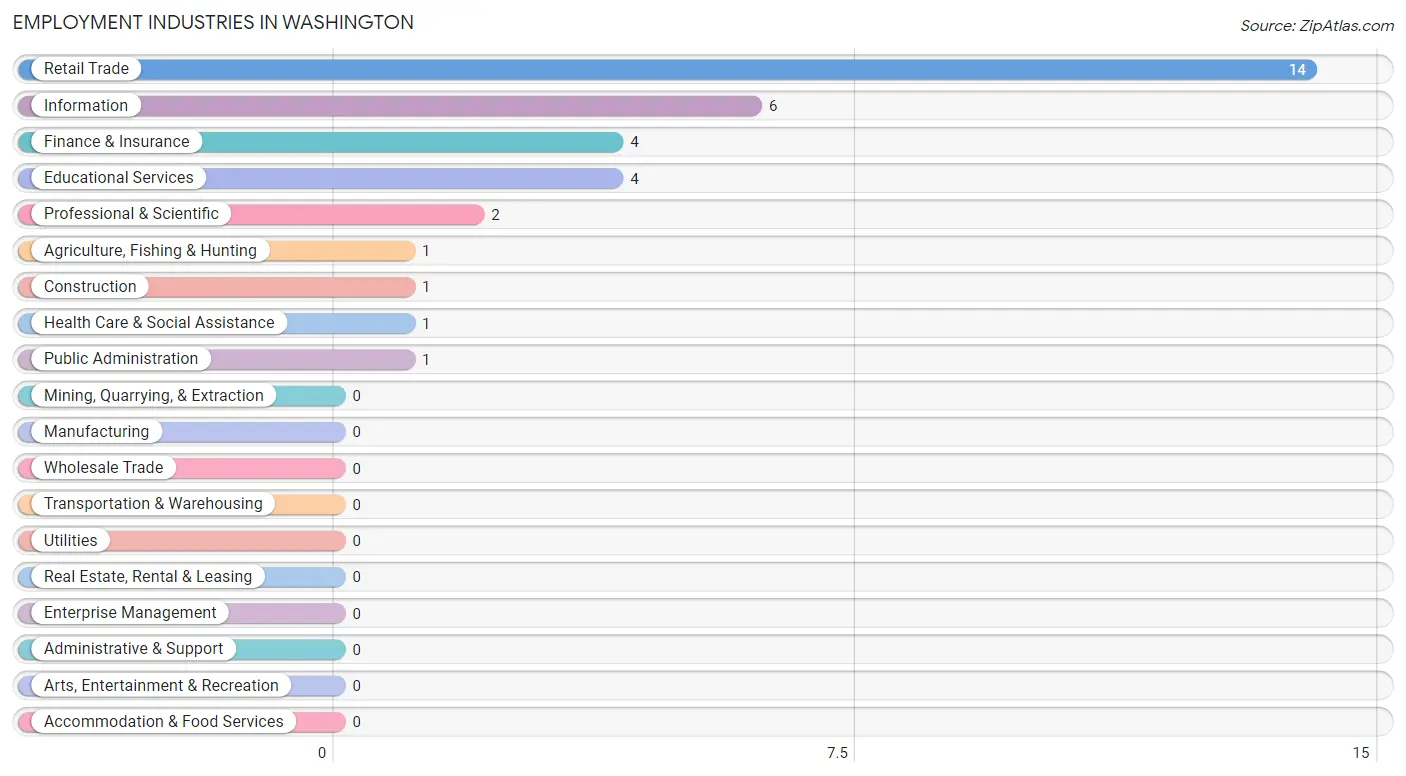
Employment Industries in Washington
The major employment industries in Washington include Retail Trade (14 | 41.2%), Information (6 | 17.6%), Finance & Insurance (4 | 11.8%), Educational Services (4 | 11.8%), and Professional & Scientific (2 | 5.9%).
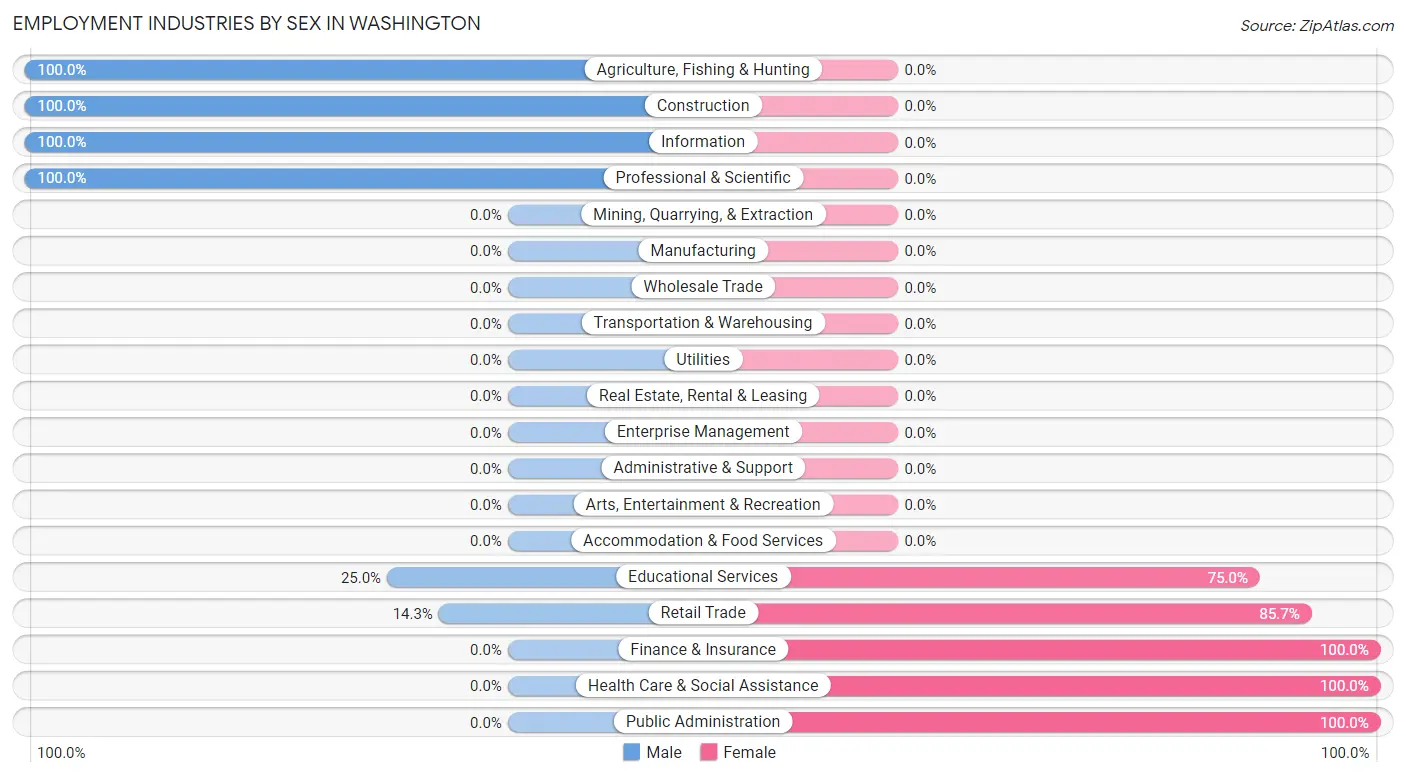
Employment Industries by Sex in Washington
The Washington industries that see more men than women are Agriculture, Fishing & Hunting (100.0%), Construction (100.0%), and Information (100.0%), whereas the industries that tend to have a higher number of women are Finance & Insurance (100.0%), Health Care & Social Assistance (100.0%), and Public Administration (100.0%).
| Industry | Male | Female |
| Agriculture, Fishing & Hunting | 1 (100.0%) | 0 (0.0%) |
| Mining, Quarrying, & Extraction | 0 (0.0%) | 0 (0.0%) |
| Construction | 1 (100.0%) | 0 (0.0%) |
| Manufacturing | 0 (0.0%) | 0 (0.0%) |
| Wholesale Trade | 0 (0.0%) | 0 (0.0%) |
| Retail Trade | 2 (14.3%) | 12 (85.7%) |
| Transportation & Warehousing | 0 (0.0%) | 0 (0.0%) |
| Utilities | 0 (0.0%) | 0 (0.0%) |
| Information | 6 (100.0%) | 0 (0.0%) |
| Finance & Insurance | 0 (0.0%) | 4 (100.0%) |
| Real Estate, Rental & Leasing | 0 (0.0%) | 0 (0.0%) |
| Professional & Scientific | 2 (100.0%) | 0 (0.0%) |
| Enterprise Management | 0 (0.0%) | 0 (0.0%) |
| Administrative & Support | 0 (0.0%) | 0 (0.0%) |
| Educational Services | 1 (25.0%) | 3 (75.0%) |
| Health Care & Social Assistance | 0 (0.0%) | 1 (100.0%) |
| Arts, Entertainment & Recreation | 0 (0.0%) | 0 (0.0%) |
| Accommodation & Food Services | 0 (0.0%) | 0 (0.0%) |
| Public Administration | 0 (0.0%) | 1 (100.0%) |
| Total | 13 (38.2%) | 21 (61.8%) |
Education in Washington
School Enrollment in Washington
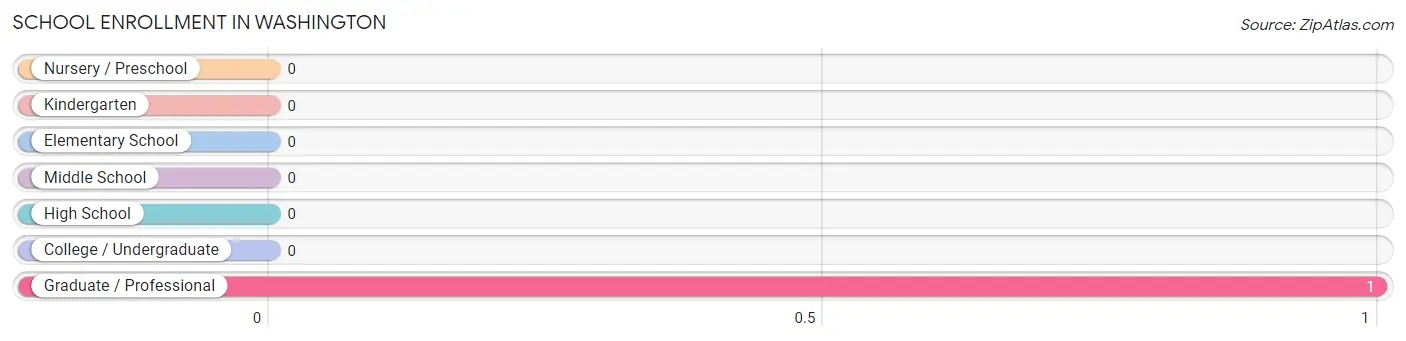
| School Level | # Students | % Students |
| Nursery / Preschool | 0 | 0.0% |
| Kindergarten | 0 | 0.0% |
| Elementary School | 0 | 0.0% |
| Middle School | 0 | 0.0% |
| High School | 0 | 0.0% |
| College / Undergraduate | 0 | 0.0% |
| Graduate / Professional | 1 | 100.0% |
| Total | 1 | 100.0% |
School Enrollment by Age by Funding Source in Washington
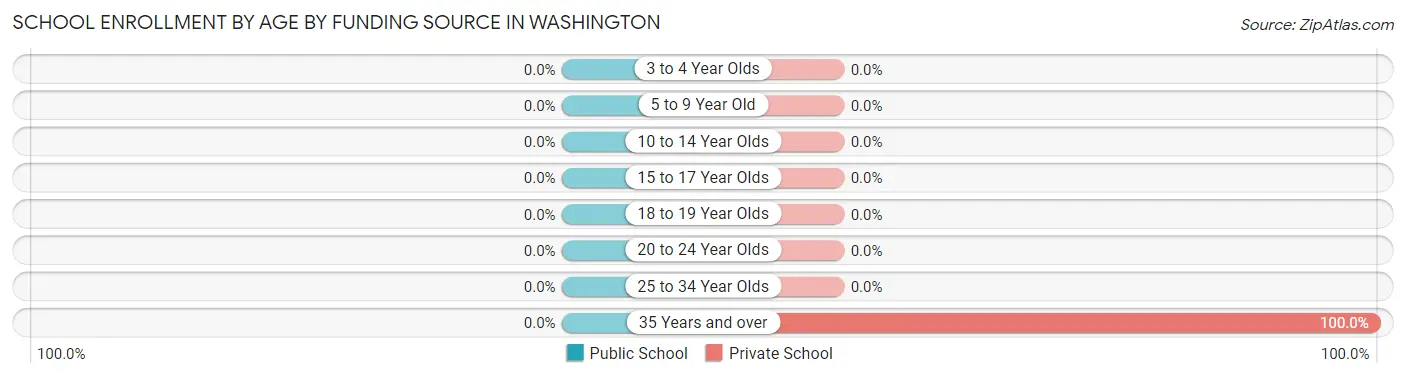
| Age Bracket | Public School | Private School |
| 3 to 4 Year Olds | 0 (0.0%) | 0 (0.0%) |
| 5 to 9 Year Old | 0 (0.0%) | 0 (0.0%) |
| 10 to 14 Year Olds | 0 (0.0%) | 0 (0.0%) |
| 15 to 17 Year Olds | 0 (0.0%) | 0 (0.0%) |
| 18 to 19 Year Olds | 0 (0.0%) | 0 (0.0%) |
| 20 to 24 Year Olds | 0 (0.0%) | 0 (0.0%) |
| 25 to 34 Year Olds | 0 (0.0%) | 0 (0.0%) |
| 35 Years and over | 0 (0.0%) | 1 (100.0%) |
| Total | 0 (0.0%) | 1 (100.0%) |
Educational Attainment by Field of Study in Washington
Literature & languages (8 | 40.0%), business (4 | 20.0%), communications (4 | 20.0%), bio, nature & agricultural (1 | 5.0%), and social sciences (1 | 5.0%) are the most common fields of study among 20 individuals in Washington who have obtained a bachelor's degree or higher.
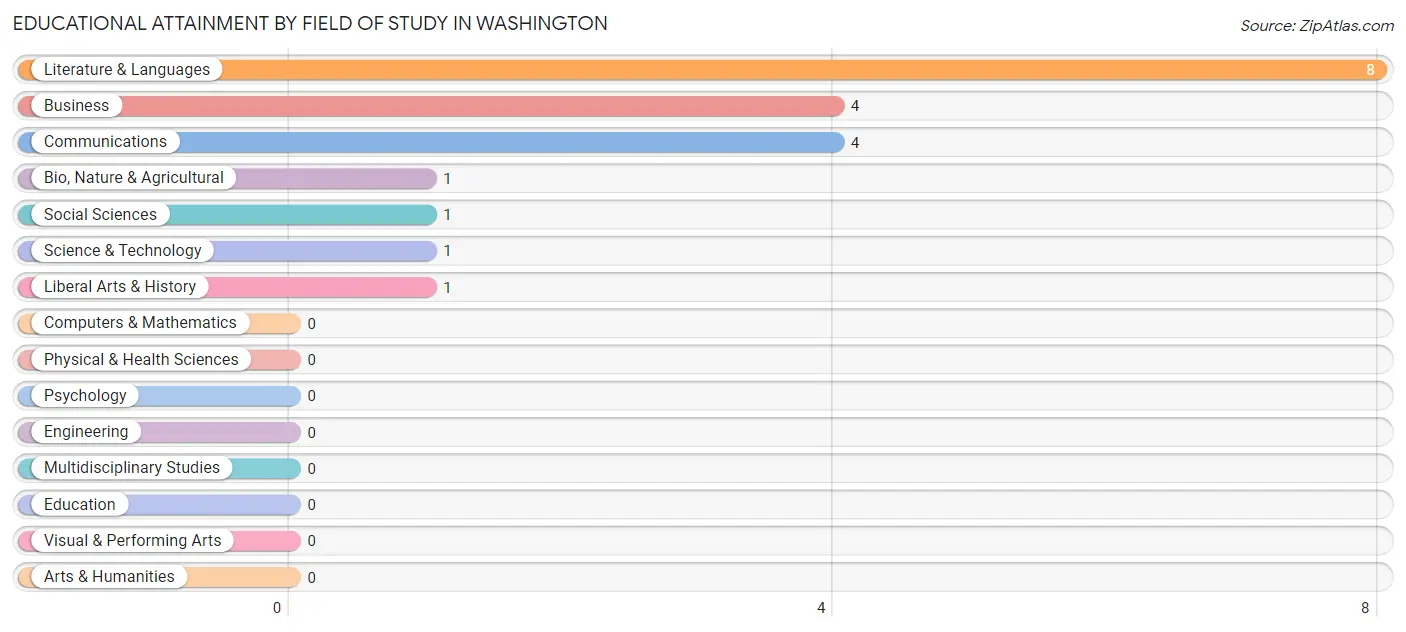
| Field of Study | # Graduates | % Graduates |
| Computers & Mathematics | 0 | 0.0% |
| Bio, Nature & Agricultural | 1 | 5.0% |
| Physical & Health Sciences | 0 | 0.0% |
| Psychology | 0 | 0.0% |
| Social Sciences | 1 | 5.0% |
| Engineering | 0 | 0.0% |
| Multidisciplinary Studies | 0 | 0.0% |
| Science & Technology | 1 | 5.0% |
| Business | 4 | 20.0% |
| Education | 0 | 0.0% |
| Literature & Languages | 8 | 40.0% |
| Liberal Arts & History | 1 | 5.0% |
| Visual & Performing Arts | 0 | 0.0% |
| Communications | 4 | 20.0% |
| Arts & Humanities | 0 | 0.0% |
| Total | 20 | 100.0% |
Transportation & Commute in Washington
Vehicle Availability by Sex in Washington
The most prevalent vehicle ownership categories in Washington are males with 1 vehicle (8, accounting for 61.5%) and females with 1 vehicle (16, making up 38.1%).
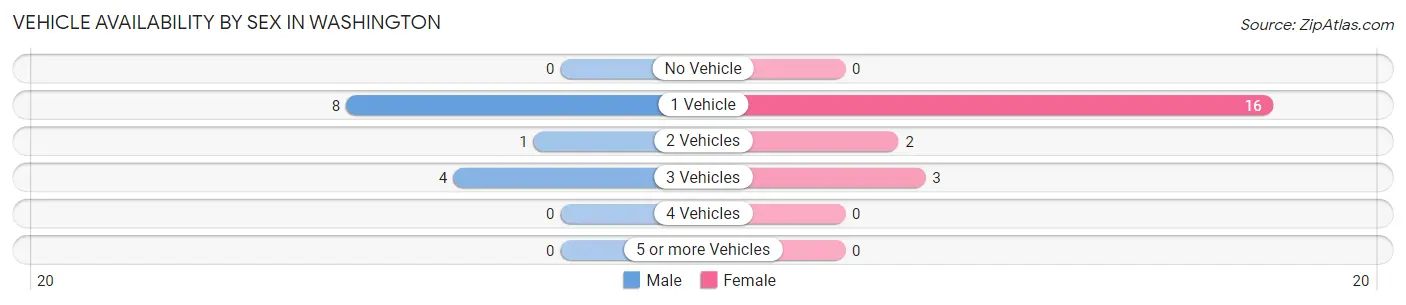
| Vehicles Available | Male | Female |
| No Vehicle | 0 (0.0%) | 0 (0.0%) |
| 1 Vehicle | 8 (61.5%) | 16 (76.2%) |
| 2 Vehicles | 1 (7.7%) | 2 (9.5%) |
| 3 Vehicles | 4 (30.8%) | 3 (14.3%) |
| 4 Vehicles | 0 (0.0%) | 0 (0.0%) |
| 5 or more Vehicles | 0 (0.0%) | 0 (0.0%) |
| Total | 13 (100.0%) | 21 (100.0%) |
Commute Time in Washington
The most frequently occuring commute durations in Washington are 10 to 14 minutes (12 commuters, 41.4%), 60 to 89 minutes (5 commuters, 17.2%), and less than 5 minutes (4 commuters, 13.8%).
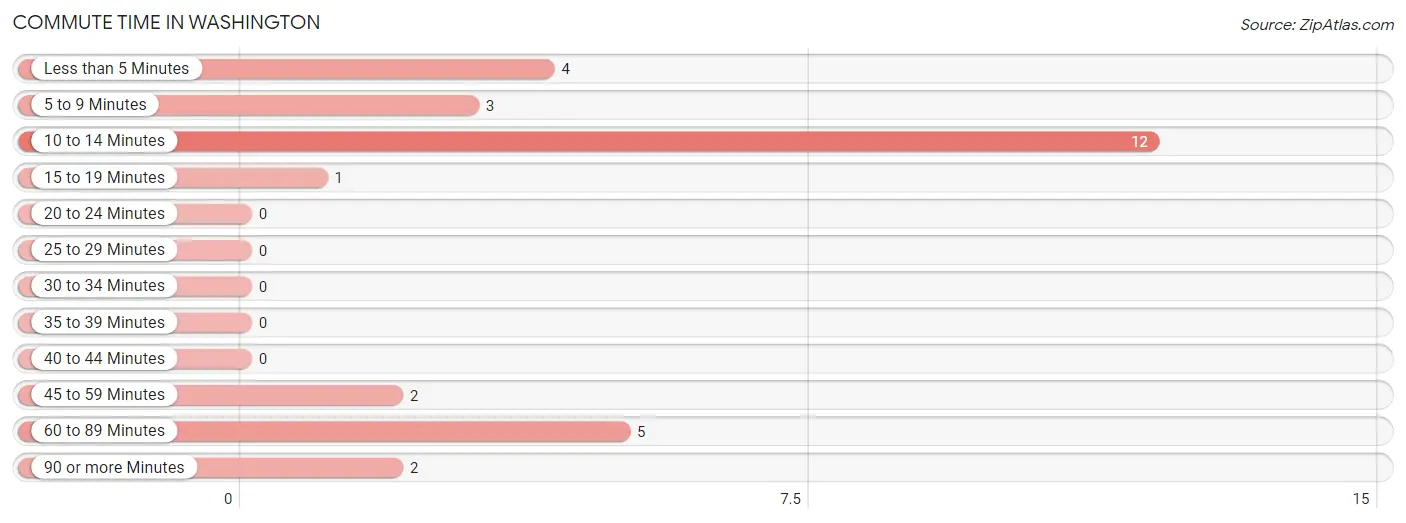
| Commute Time | # Commuters | % Commuters |
| Less than 5 Minutes | 4 | 13.8% |
| 5 to 9 Minutes | 3 | 10.3% |
| 10 to 14 Minutes | 12 | 41.4% |
| 15 to 19 Minutes | 1 | 3.5% |
| 20 to 24 Minutes | 0 | 0.0% |
| 25 to 29 Minutes | 0 | 0.0% |
| 30 to 34 Minutes | 0 | 0.0% |
| 35 to 39 Minutes | 0 | 0.0% |
| 40 to 44 Minutes | 0 | 0.0% |
| 45 to 59 Minutes | 2 | 6.9% |
| 60 to 89 Minutes | 5 | 17.2% |
| 90 or more Minutes | 2 | 6.9% |
Commute Time by Sex in Washington
The most common commute times in Washington are 5 to 9 minutes (3 commuters, 37.5%) for males and 10 to 14 minutes (12 commuters, 57.1%) for females.
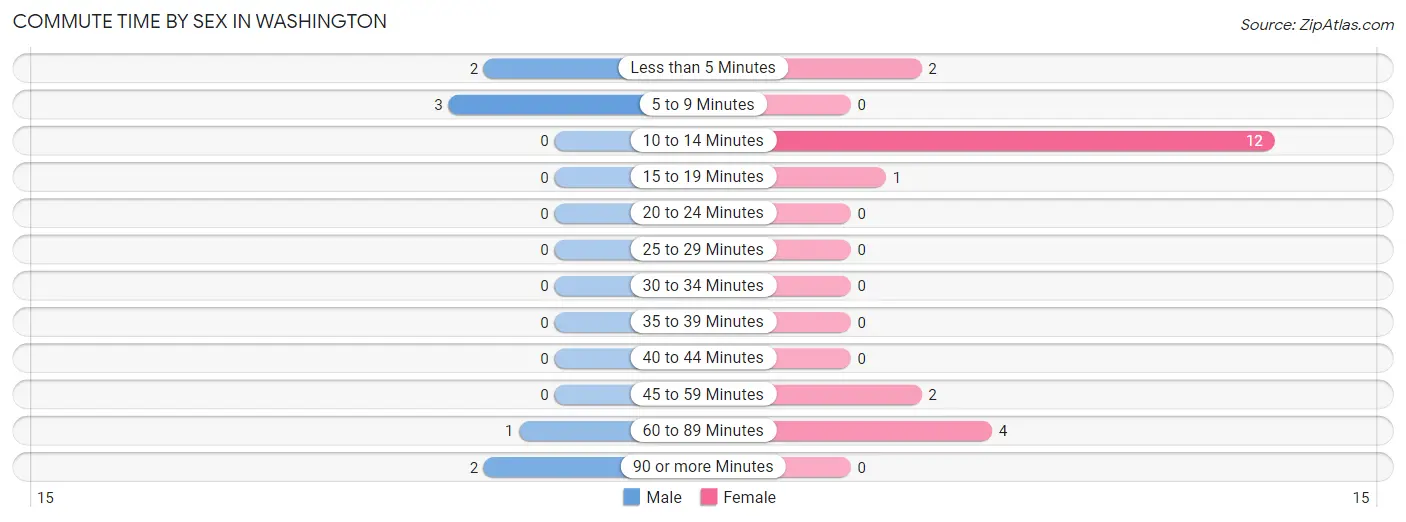
| Commute Time | Male | Female |
| Less than 5 Minutes | 2 (25.0%) | 2 (9.5%) |
| 5 to 9 Minutes | 3 (37.5%) | 0 (0.0%) |
| 10 to 14 Minutes | 0 (0.0%) | 12 (57.1%) |
| 15 to 19 Minutes | 0 (0.0%) | 1 (4.8%) |
| 20 to 24 Minutes | 0 (0.0%) | 0 (0.0%) |
| 25 to 29 Minutes | 0 (0.0%) | 0 (0.0%) |
| 30 to 34 Minutes | 0 (0.0%) | 0 (0.0%) |
| 35 to 39 Minutes | 0 (0.0%) | 0 (0.0%) |
| 40 to 44 Minutes | 0 (0.0%) | 0 (0.0%) |
| 45 to 59 Minutes | 0 (0.0%) | 2 (9.5%) |
| 60 to 89 Minutes | 1 (12.5%) | 4 (19.1%) |
| 90 or more Minutes | 2 (25.0%) | 0 (0.0%) |
Time of Departure to Work by Sex in Washington
The most frequent times of departure to work in Washington are 9:00 AM to 9:59 AM (4, 50.0%) for males and 10:00 AM to 10:59 AM (12, 57.1%) for females.
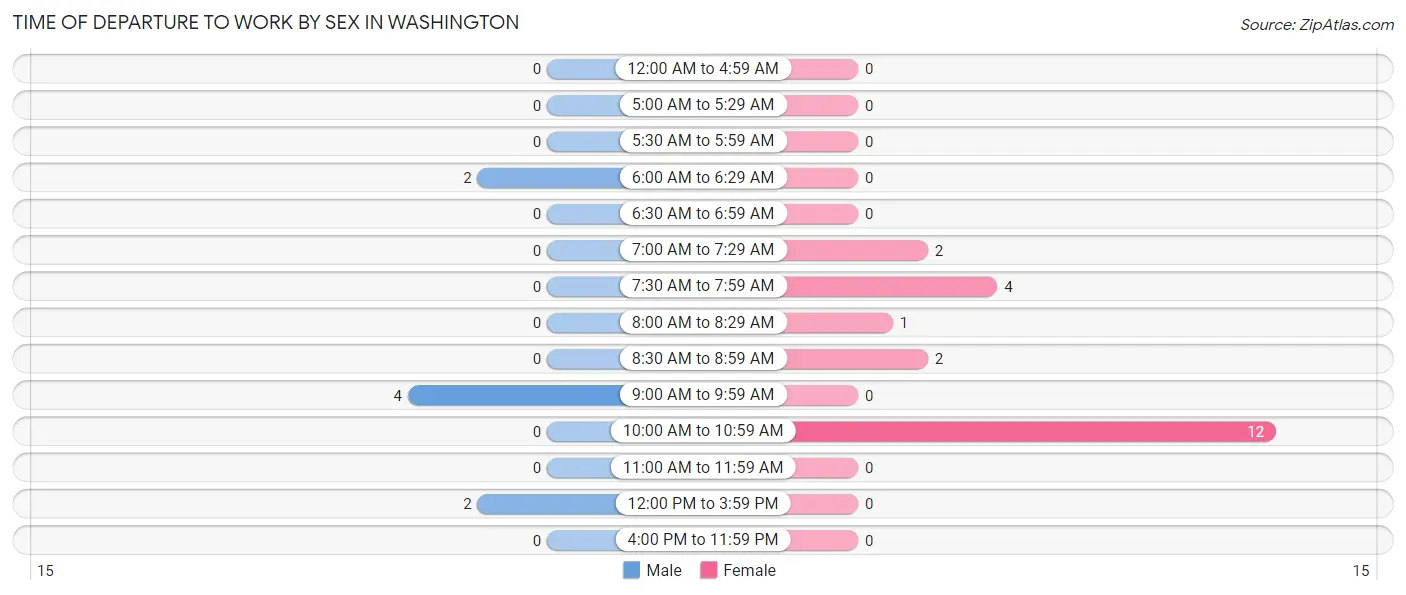
| Time of Departure | Male | Female |
| 12:00 AM to 4:59 AM | 0 (0.0%) | 0 (0.0%) |
| 5:00 AM to 5:29 AM | 0 (0.0%) | 0 (0.0%) |
| 5:30 AM to 5:59 AM | 0 (0.0%) | 0 (0.0%) |
| 6:00 AM to 6:29 AM | 2 (25.0%) | 0 (0.0%) |
| 6:30 AM to 6:59 AM | 0 (0.0%) | 0 (0.0%) |
| 7:00 AM to 7:29 AM | 0 (0.0%) | 2 (9.5%) |
| 7:30 AM to 7:59 AM | 0 (0.0%) | 4 (19.1%) |
| 8:00 AM to 8:29 AM | 0 (0.0%) | 1 (4.8%) |
| 8:30 AM to 8:59 AM | 0 (0.0%) | 2 (9.5%) |
| 9:00 AM to 9:59 AM | 4 (50.0%) | 0 (0.0%) |
| 10:00 AM to 10:59 AM | 0 (0.0%) | 12 (57.1%) |
| 11:00 AM to 11:59 AM | 0 (0.0%) | 0 (0.0%) |
| 12:00 PM to 3:59 PM | 2 (25.0%) | 0 (0.0%) |
| 4:00 PM to 11:59 PM | 0 (0.0%) | 0 (0.0%) |
| Total | 8 (100.0%) | 21 (100.0%) |
Housing Occupancy in Washington
Occupancy by Ownership in Washington
Of the total 44 dwellings in Washington, owner-occupied units account for 10 (22.7%), while renter-occupied units make up 34 (77.3%).
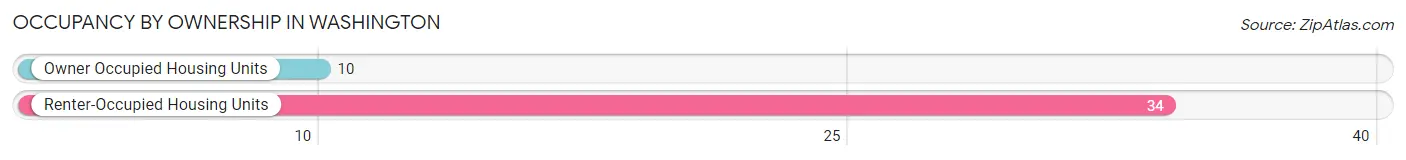
| Occupancy | # Housing Units | % Housing Units |
| Owner Occupied Housing Units | 10 | 22.7% |
| Renter-Occupied Housing Units | 34 | 77.3% |
| Total Occupied Housing Units | 44 | 100.0% |
Occupancy by Household Size in Washington
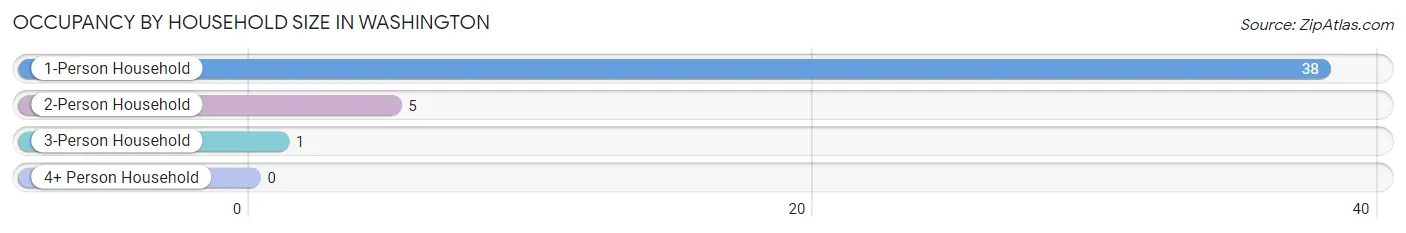
| Household Size | # Housing Units | % Housing Units |
| 1-Person Household | 38 | 86.4% |
| 2-Person Household | 5 | 11.4% |
| 3-Person Household | 1 | 2.3% |
| 4+ Person Household | 0 | 0.0% |
| Total Housing Units | 44 | 100.0% |
Occupancy by Ownership by Household Size in Washington
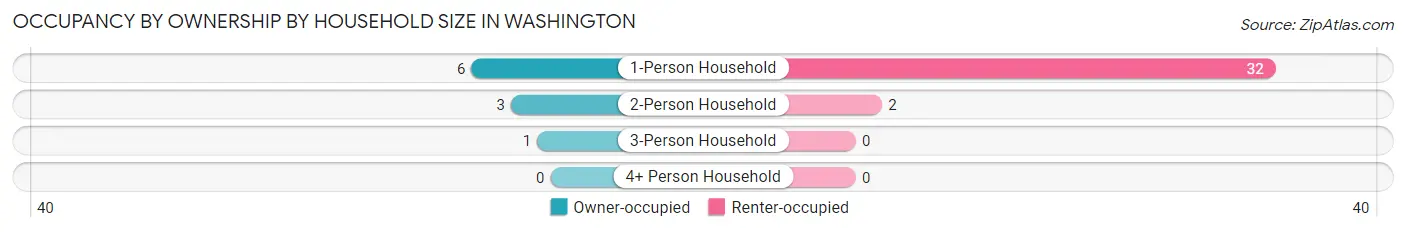
| Household Size | Owner-occupied | Renter-occupied |
| 1-Person Household | 6 (15.8%) | 32 (84.2%) |
| 2-Person Household | 3 (60.0%) | 2 (40.0%) |
| 3-Person Household | 1 (100.0%) | 0 (0.0%) |
| 4+ Person Household | 0 (0.0%) | 0 (0.0%) |
| Total Housing Units | 10 (22.7%) | 34 (77.3%) |
Occupancy by Educational Attainment in Washington
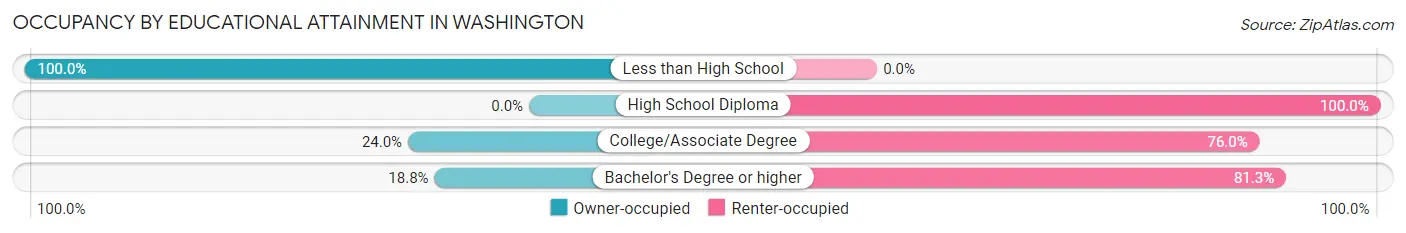
| Household Size | Owner-occupied | Renter-occupied |
| Less than High School | 1 (100.0%) | 0 (0.0%) |
| High School Diploma | 0 (0.0%) | 2 (100.0%) |
| College/Associate Degree | 6 (24.0%) | 19 (76.0%) |
| Bachelor's Degree or higher | 3 (18.8%) | 13 (81.2%) |
Occupancy by Age of Householder in Washington
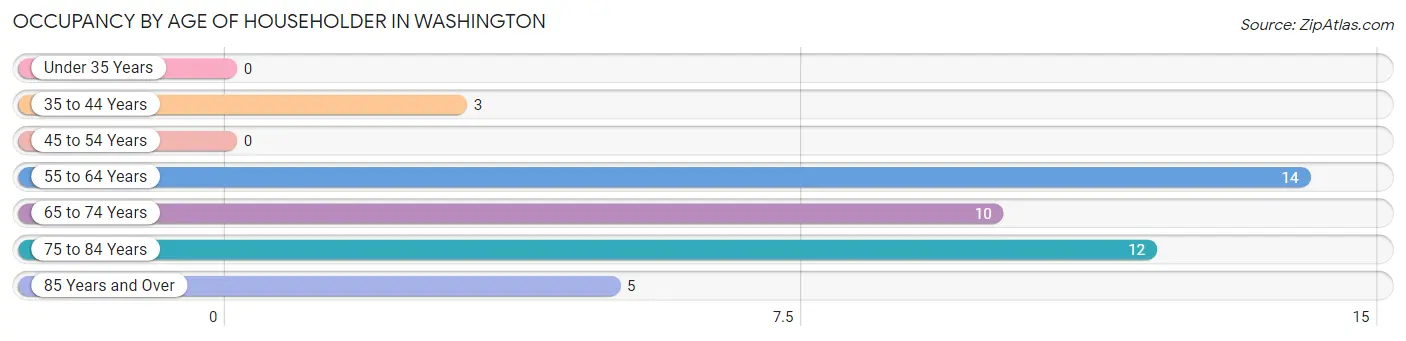
| Age Bracket | # Households | % Households |
| Under 35 Years | 0 | 0.0% |
| 35 to 44 Years | 3 | 6.8% |
| 45 to 54 Years | 0 | 0.0% |
| 55 to 64 Years | 14 | 31.8% |
| 65 to 74 Years | 10 | 22.7% |
| 75 to 84 Years | 12 | 27.3% |
| 85 Years and Over | 5 | 11.4% |
| Total | 44 | 100.0% |
Housing Finances in Washington
Median Income by Occupancy in Washington
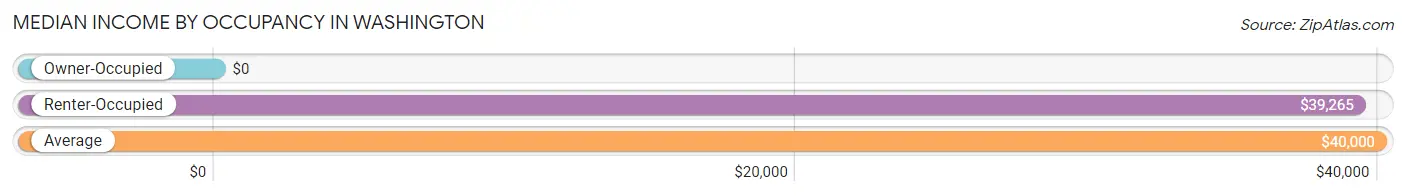
| Occupancy Type | # Households | Median Income |
| Owner-Occupied | 10 (22.7%) | $0 |
| Renter-Occupied | 34 (77.3%) | $39,265 |
| Average | 44 (100.0%) | $40,000 |
Occupancy by Householder Income Bracket in Washington
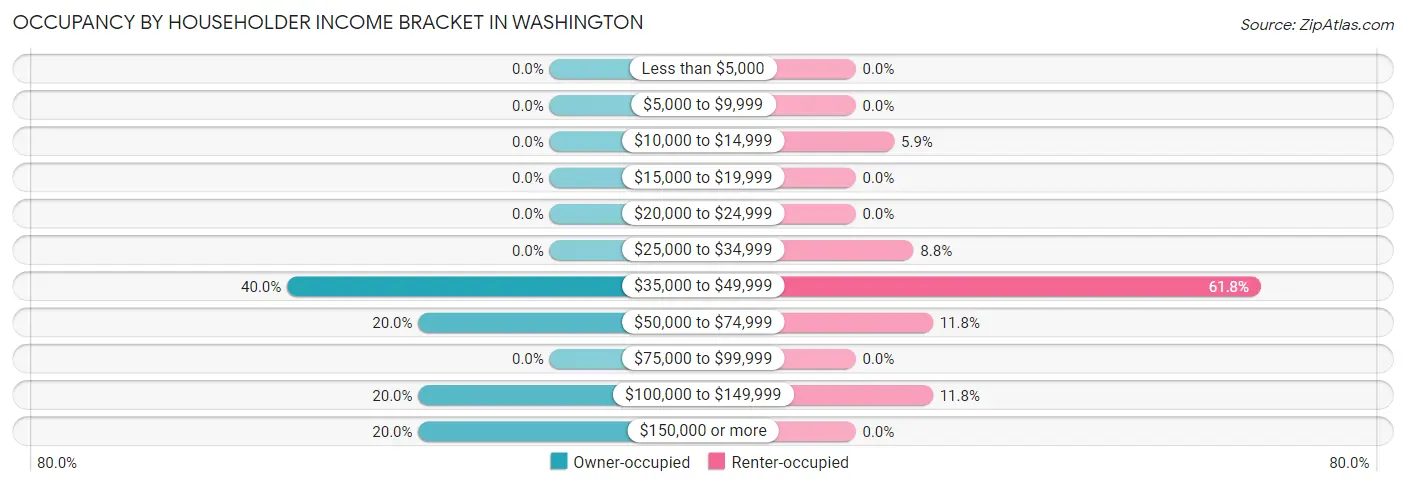
| Income Bracket | Owner-occupied | Renter-occupied |
| Less than $5,000 | 0 (0.0%) | 0 (0.0%) |
| $5,000 to $9,999 | 0 (0.0%) | 0 (0.0%) |
| $10,000 to $14,999 | 0 (0.0%) | 2 (5.9%) |
| $15,000 to $19,999 | 0 (0.0%) | 0 (0.0%) |
| $20,000 to $24,999 | 0 (0.0%) | 0 (0.0%) |
| $25,000 to $34,999 | 0 (0.0%) | 3 (8.8%) |
| $35,000 to $49,999 | 4 (40.0%) | 21 (61.8%) |
| $50,000 to $74,999 | 2 (20.0%) | 4 (11.8%) |
| $75,000 to $99,999 | 0 (0.0%) | 0 (0.0%) |
| $100,000 to $149,999 | 2 (20.0%) | 4 (11.8%) |
| $150,000 or more | 2 (20.0%) | 0 (0.0%) |
| Total | 10 (100.0%) | 34 (100.0%) |
Monthly Housing Cost Tiers in Washington
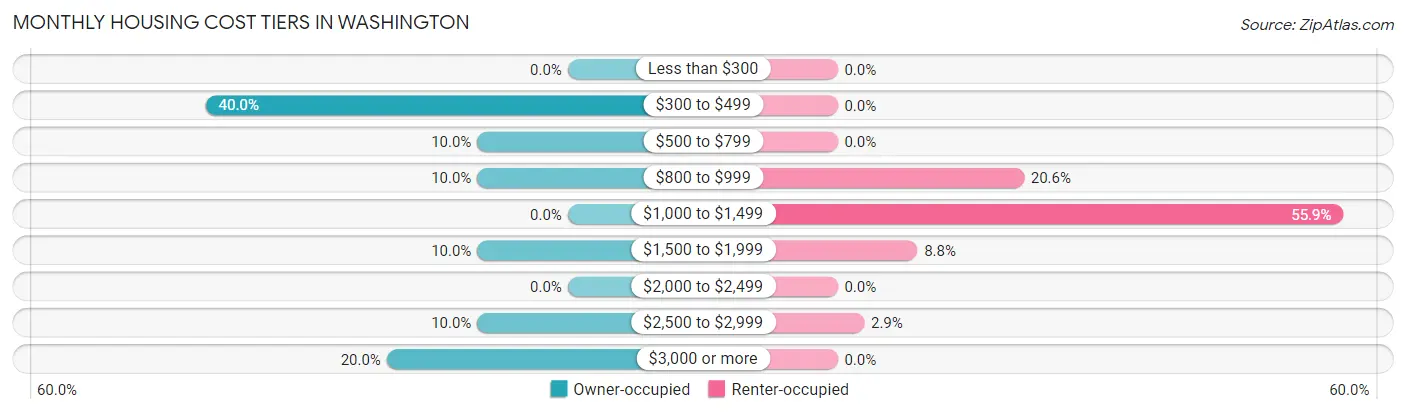
| Monthly Cost | Owner-occupied | Renter-occupied |
| Less than $300 | 0 (0.0%) | 0 (0.0%) |
| $300 to $499 | 4 (40.0%) | 0 (0.0%) |
| $500 to $799 | 1 (10.0%) | 0 (0.0%) |
| $800 to $999 | 1 (10.0%) | 7 (20.6%) |
| $1,000 to $1,499 | 0 (0.0%) | 19 (55.9%) |
| $1,500 to $1,999 | 1 (10.0%) | 3 (8.8%) |
| $2,000 to $2,499 | 0 (0.0%) | 0 (0.0%) |
| $2,500 to $2,999 | 1 (10.0%) | 1 (2.9%) |
| $3,000 or more | 2 (20.0%) | 0 (0.0%) |
| Total | 10 (100.0%) | 34 (100.0%) |
Physical Housing Characteristics in Washington
Housing Structures in Washington
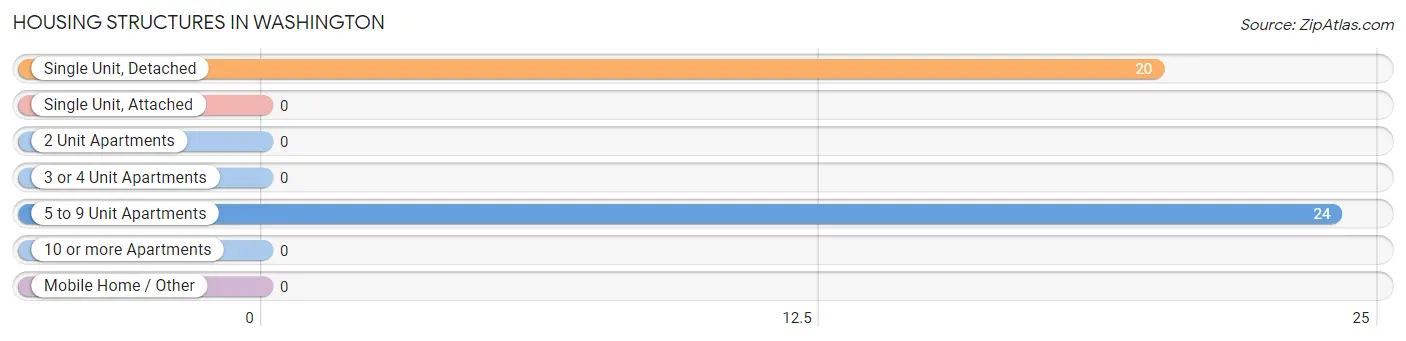
| Structure Type | # Housing Units | % Housing Units |
| Single Unit, Detached | 20 | 45.5% |
| Single Unit, Attached | 0 | 0.0% |
| 2 Unit Apartments | 0 | 0.0% |
| 3 or 4 Unit Apartments | 0 | 0.0% |
| 5 to 9 Unit Apartments | 24 | 54.5% |
| 10 or more Apartments | 0 | 0.0% |
| Mobile Home / Other | 0 | 0.0% |
| Total | 44 | 100.0% |
Housing Structures by Occupancy in Washington
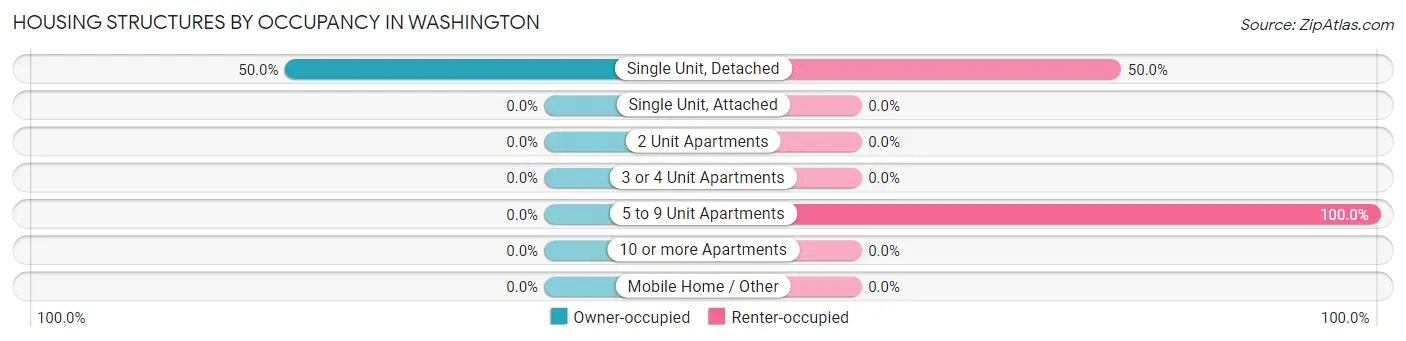
| Structure Type | Owner-occupied | Renter-occupied |
| Single Unit, Detached | 10 (50.0%) | 10 (50.0%) |
| Single Unit, Attached | 0 (0.0%) | 0 (0.0%) |
| 2 Unit Apartments | 0 (0.0%) | 0 (0.0%) |
| 3 or 4 Unit Apartments | 0 (0.0%) | 0 (0.0%) |
| 5 to 9 Unit Apartments | 0 (0.0%) | 24 (100.0%) |
| 10 or more Apartments | 0 (0.0%) | 0 (0.0%) |
| Mobile Home / Other | 0 (0.0%) | 0 (0.0%) |
| Total | 10 (22.7%) | 34 (77.3%) |
Housing Structures by Number of Rooms in Washington
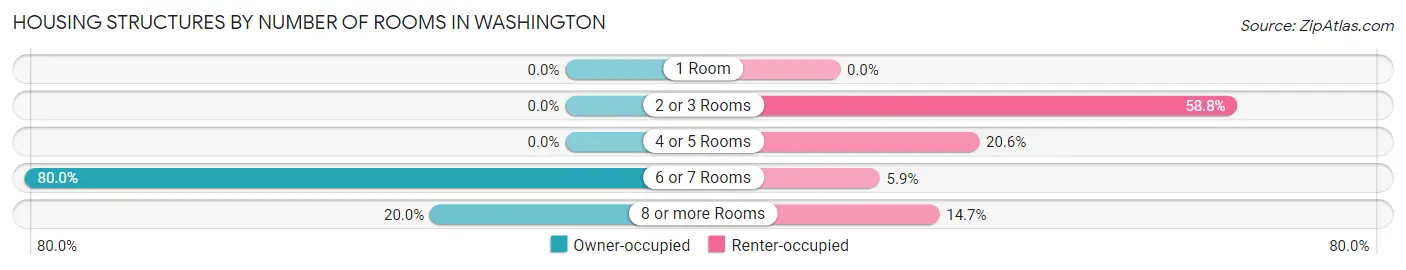
| Number of Rooms | Owner-occupied | Renter-occupied |
| 1 Room | 0 (0.0%) | 0 (0.0%) |
| 2 or 3 Rooms | 0 (0.0%) | 20 (58.8%) |
| 4 or 5 Rooms | 0 (0.0%) | 7 (20.6%) |
| 6 or 7 Rooms | 8 (80.0%) | 2 (5.9%) |
| 8 or more Rooms | 2 (20.0%) | 5 (14.7%) |
| Total | 10 (100.0%) | 34 (100.0%) |
Housing Structure by Heating Type in Washington
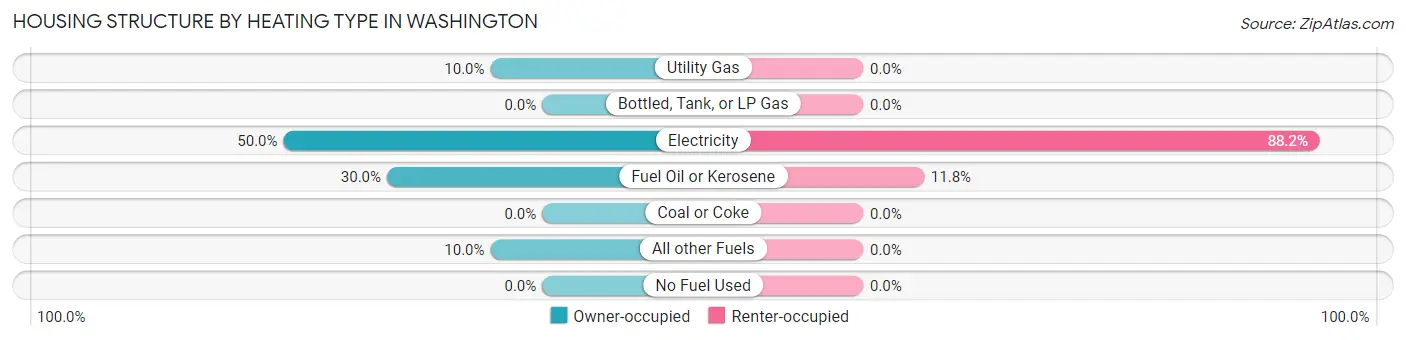
| Heating Type | Owner-occupied | Renter-occupied |
| Utility Gas | 1 (10.0%) | 0 (0.0%) |
| Bottled, Tank, or LP Gas | 0 (0.0%) | 0 (0.0%) |
| Electricity | 5 (50.0%) | 30 (88.2%) |
| Fuel Oil or Kerosene | 3 (30.0%) | 4 (11.8%) |
| Coal or Coke | 0 (0.0%) | 0 (0.0%) |
| All other Fuels | 1 (10.0%) | 0 (0.0%) |
| No Fuel Used | 0 (0.0%) | 0 (0.0%) |
| Total | 10 (100.0%) | 34 (100.0%) |
Household Vehicle Usage in Washington
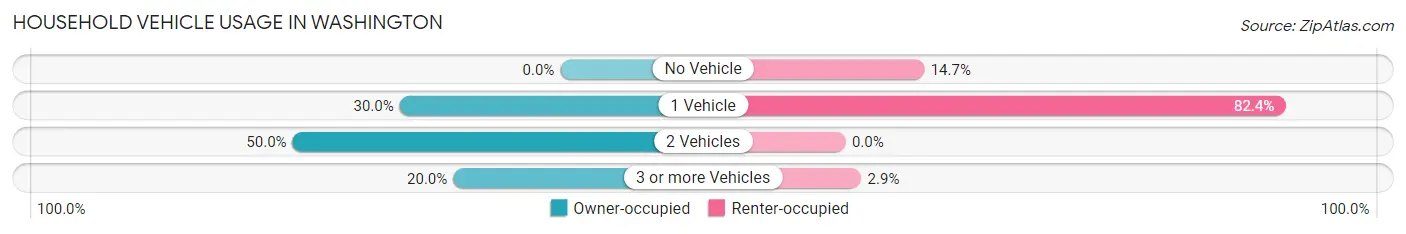
| Vehicles per Household | Owner-occupied | Renter-occupied |
| No Vehicle | 0 (0.0%) | 5 (14.7%) |
| 1 Vehicle | 3 (30.0%) | 28 (82.4%) |
| 2 Vehicles | 5 (50.0%) | 0 (0.0%) |
| 3 or more Vehicles | 2 (20.0%) | 1 (2.9%) |
| Total | 10 (100.0%) | 34 (100.0%) |
Real Estate & Mortgages in Washington
Real Estate and Mortgage Overview in Washington
| Characteristic | Without Mortgage | With Mortgage |
| Housing Units | 6 | 4 |
| Median Property Value | $375,000 | $500,000 |
| Median Household Income | - | - |
| Monthly Housing Costs | $475 | $2 |
| Real Estate Taxes | $1,875 | $1 |
Property Value by Mortgage Status in Washington
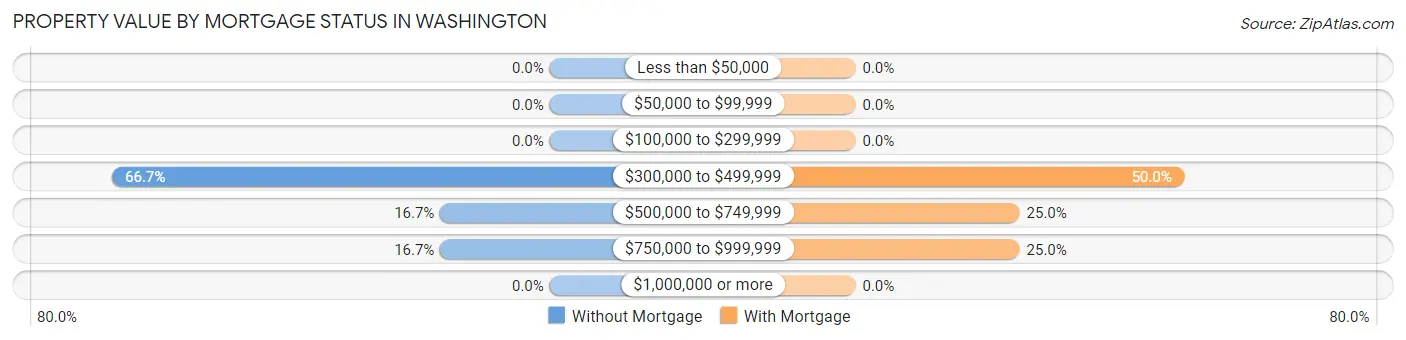
| Property Value | Without Mortgage | With Mortgage |
| Less than $50,000 | 0 (0.0%) | 0 (0.0%) |
| $50,000 to $99,999 | 0 (0.0%) | 0 (0.0%) |
| $100,000 to $299,999 | 0 (0.0%) | 0 (0.0%) |
| $300,000 to $499,999 | 4 (66.7%) | 2 (50.0%) |
| $500,000 to $749,999 | 1 (16.7%) | 1 (25.0%) |
| $750,000 to $999,999 | 1 (16.7%) | 1 (25.0%) |
| $1,000,000 or more | 0 (0.0%) | 0 (0.0%) |
| Total | 6 (100.0%) | 4 (100.0%) |
Household Income by Mortgage Status in Washington
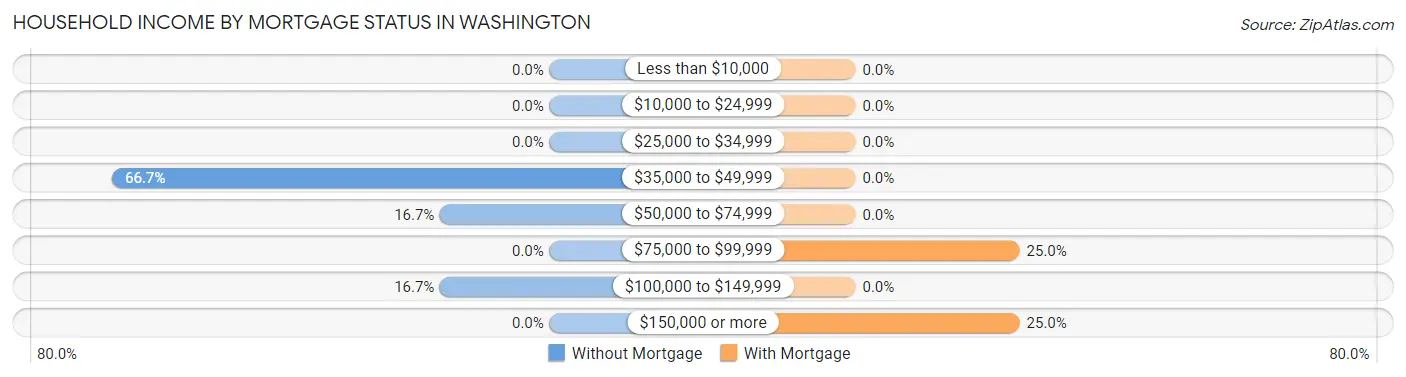
| Household Income | Without Mortgage | With Mortgage |
| Less than $10,000 | 0 (0.0%) | 0 (0.0%) |
| $10,000 to $24,999 | 0 (0.0%) | 0 (0.0%) |
| $25,000 to $34,999 | 0 (0.0%) | 0 (0.0%) |
| $35,000 to $49,999 | 4 (66.7%) | 0 (0.0%) |
| $50,000 to $74,999 | 1 (16.7%) | 0 (0.0%) |
| $75,000 to $99,999 | 0 (0.0%) | 1 (25.0%) |
| $100,000 to $149,999 | 1 (16.7%) | 0 (0.0%) |
| $150,000 or more | 0 (0.0%) | 1 (25.0%) |
| Total | 6 (100.0%) | 4 (100.0%) |
Property Value to Household Income Ratio in Washington
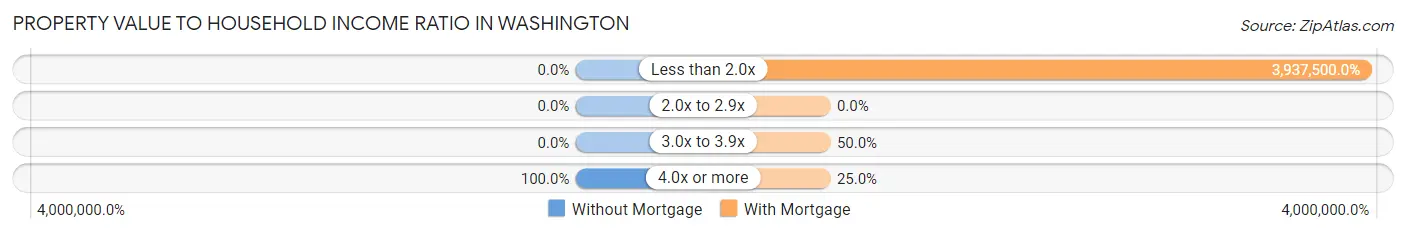
| Value-to-Income Ratio | Without Mortgage | With Mortgage |
| Less than 2.0x | 0 (0.0%) | 157,500 (3,937,500.0%) |
| 2.0x to 2.9x | 0 (0.0%) | 0 (0.0%) |
| 3.0x to 3.9x | 0 (0.0%) | 2 (50.0%) |
| 4.0x or more | 6 (100.0%) | 1 (25.0%) |
| Total | 6 (100.0%) | 4 (100.0%) |
Real Estate Taxes by Mortgage Status in Washington
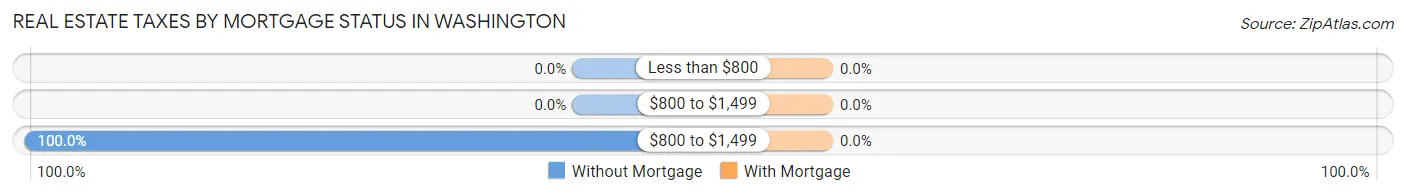
| Property Taxes | Without Mortgage | With Mortgage |
| Less than $800 | 0 (0.0%) | 0 (0.0%) |
| $800 to $1,499 | 0 (0.0%) | 0 (0.0%) |
| $800 to $1,499 | 6 (100.0%) | 0 (0.0%) |
| Total | 6 (100.0%) | 4 (100.0%) |
Health & Disability in Washington
Health Insurance Coverage by Age in Washington
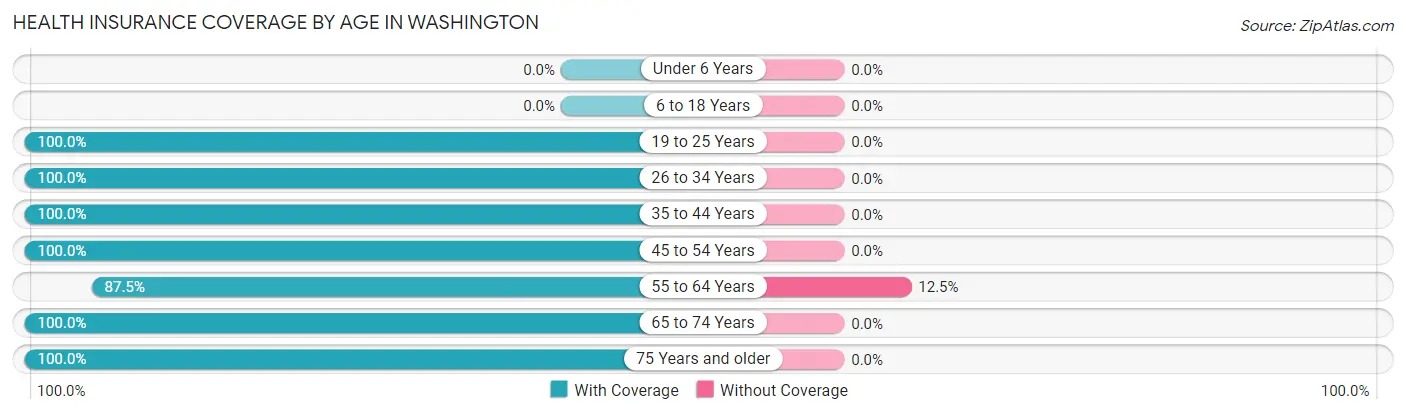
| Age Bracket | With Coverage | Without Coverage |
| Under 6 Years | 0 (0.0%) | 0 (0.0%) |
| 6 to 18 Years | 0 (0.0%) | 0 (0.0%) |
| 19 to 25 Years | 3 (100.0%) | 0 (0.0%) |
| 26 to 34 Years | 1 (100.0%) | 0 (0.0%) |
| 35 to 44 Years | 3 (100.0%) | 0 (0.0%) |
| 45 to 54 Years | 2 (100.0%) | 0 (0.0%) |
| 55 to 64 Years | 14 (87.5%) | 2 (12.5%) |
| 65 to 74 Years | 12 (100.0%) | 0 (0.0%) |
| 75 Years and older | 17 (100.0%) | 0 (0.0%) |
| Total | 52 (96.3%) | 2 (3.7%) |
Health Insurance Coverage by Citizenship Status in Washington
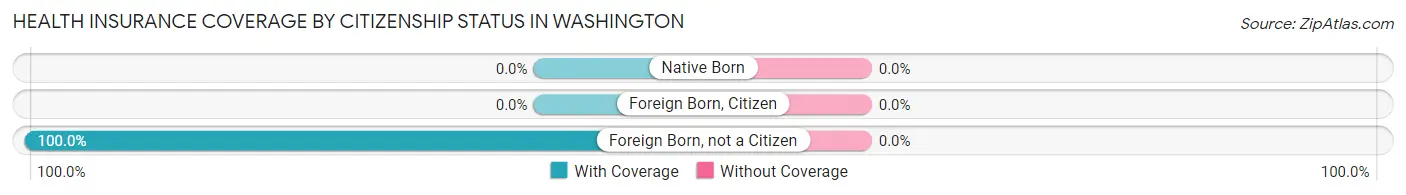
| Citizenship Status | With Coverage | Without Coverage |
| Native Born | 0 (0.0%) | 0 (0.0%) |
| Foreign Born, Citizen | 0 (0.0%) | 0 (0.0%) |
| Foreign Born, not a Citizen | 3 (100.0%) | 0 (0.0%) |
Health Insurance Coverage by Household Income in Washington
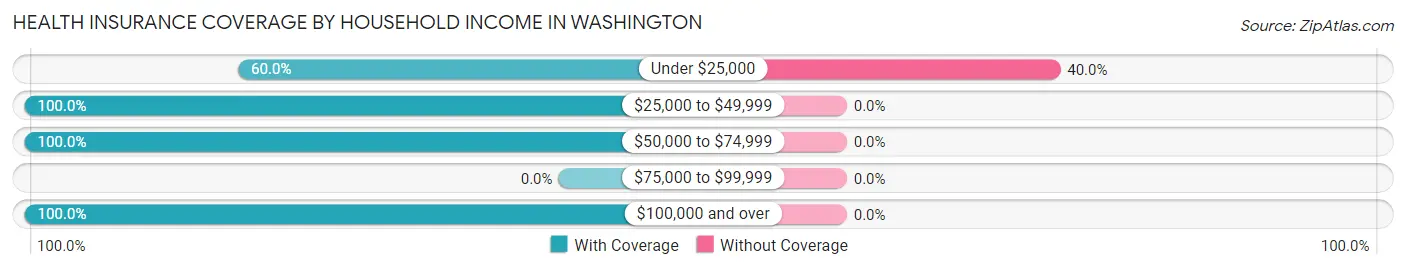
| Household Income | With Coverage | Without Coverage |
| Under $25,000 | 3 (60.0%) | 2 (40.0%) |
| $25,000 to $49,999 | 28 (100.0%) | 0 (0.0%) |
| $50,000 to $74,999 | 8 (100.0%) | 0 (0.0%) |
| $75,000 to $99,999 | 0 (0.0%) | 0 (0.0%) |
| $100,000 and over | 13 (100.0%) | 0 (0.0%) |
Public vs Private Health Insurance Coverage by Age in Washington
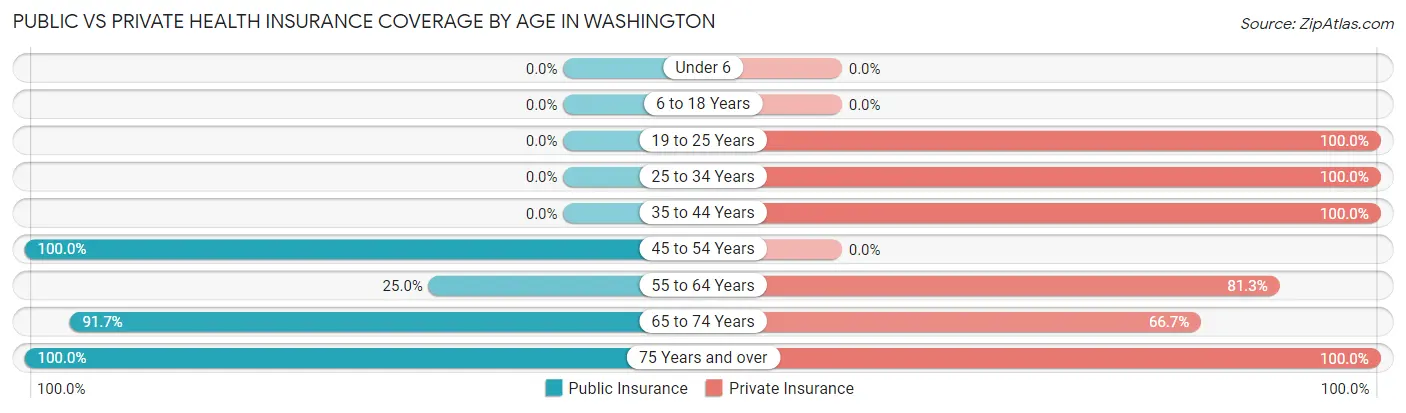
| Age Bracket | Public Insurance | Private Insurance |
| Under 6 | 0 (0.0%) | 0 (0.0%) |
| 6 to 18 Years | 0 (0.0%) | 0 (0.0%) |
| 19 to 25 Years | 0 (0.0%) | 3 (100.0%) |
| 25 to 34 Years | 0 (0.0%) | 1 (100.0%) |
| 35 to 44 Years | 0 (0.0%) | 3 (100.0%) |
| 45 to 54 Years | 2 (100.0%) | 0 (0.0%) |
| 55 to 64 Years | 4 (25.0%) | 13 (81.2%) |
| 65 to 74 Years | 11 (91.7%) | 8 (66.7%) |
| 75 Years and over | 17 (100.0%) | 17 (100.0%) |
| Total | 34 (63.0%) | 45 (83.3%) |
Disability Status by Sex by Age in Washington
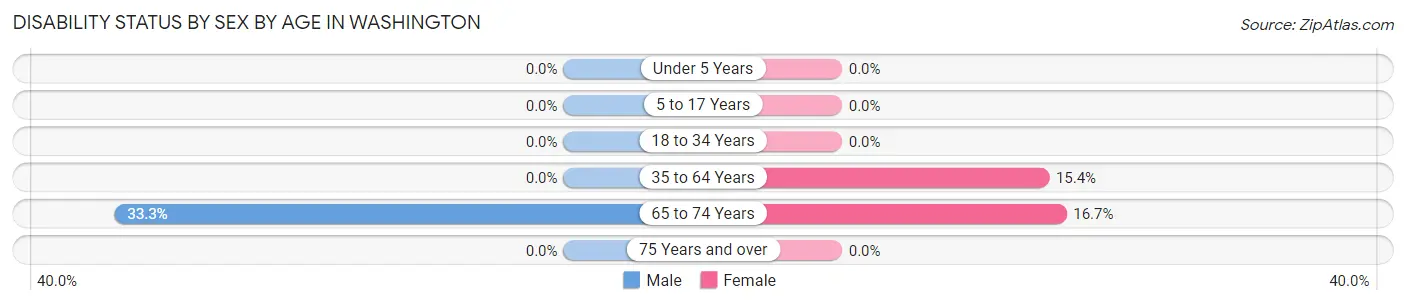
| Age Bracket | Male | Female |
| Under 5 Years | 0 (0.0%) | 0 (0.0%) |
| 5 to 17 Years | 0 (0.0%) | 0 (0.0%) |
| 18 to 34 Years | 0 (0.0%) | 0 (0.0%) |
| 35 to 64 Years | 0 (0.0%) | 2 (15.4%) |
| 65 to 74 Years | 2 (33.3%) | 1 (16.7%) |
| 75 Years and over | 0 (0.0%) | 0 (0.0%) |
Disability Class by Sex by Age in Washington
Disability Class: Hearing Difficulty
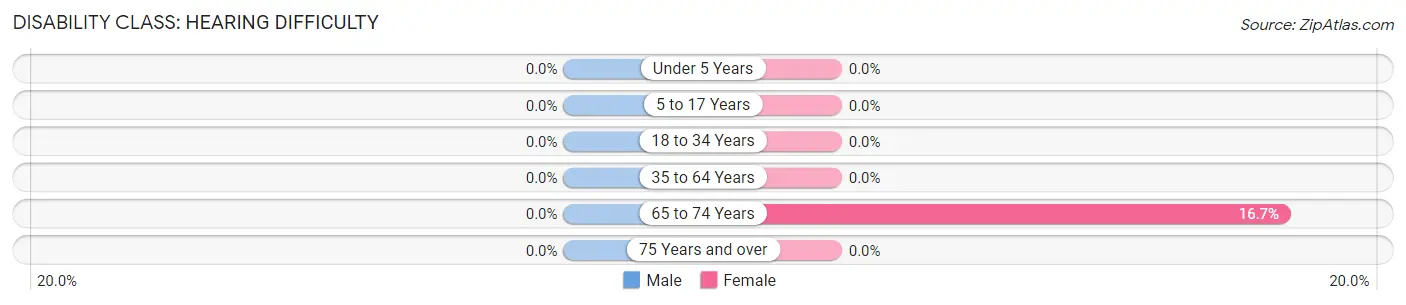
| Age Bracket | Male | Female |
| Under 5 Years | 0 (0.0%) | 0 (0.0%) |
| 5 to 17 Years | 0 (0.0%) | 0 (0.0%) |
| 18 to 34 Years | 0 (0.0%) | 0 (0.0%) |
| 35 to 64 Years | 0 (0.0%) | 0 (0.0%) |
| 65 to 74 Years | 0 (0.0%) | 1 (16.7%) |
| 75 Years and over | 0 (0.0%) | 0 (0.0%) |
Disability Class: Vision Difficulty
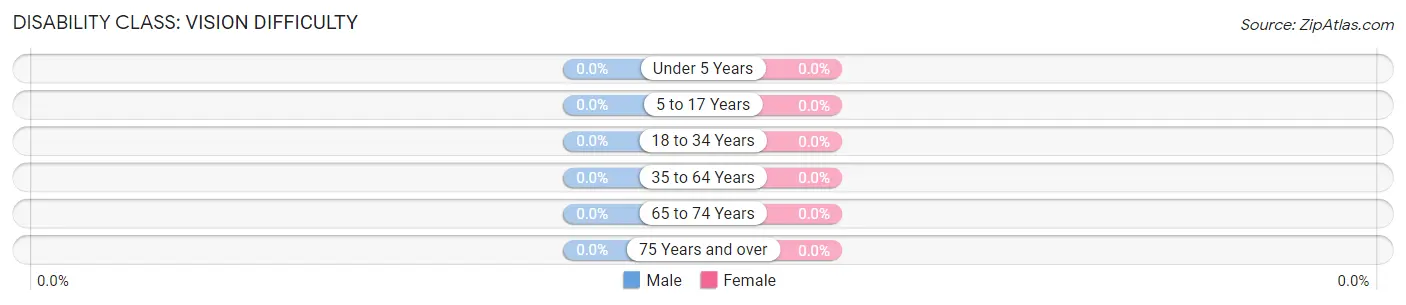
| Age Bracket | Male | Female |
| Under 5 Years | 0 (0.0%) | 0 (0.0%) |
| 5 to 17 Years | 0 (0.0%) | 0 (0.0%) |
| 18 to 34 Years | 0 (0.0%) | 0 (0.0%) |
| 35 to 64 Years | 0 (0.0%) | 0 (0.0%) |
| 65 to 74 Years | 0 (0.0%) | 0 (0.0%) |
| 75 Years and over | 0 (0.0%) | 0 (0.0%) |
Disability Class: Cognitive Difficulty
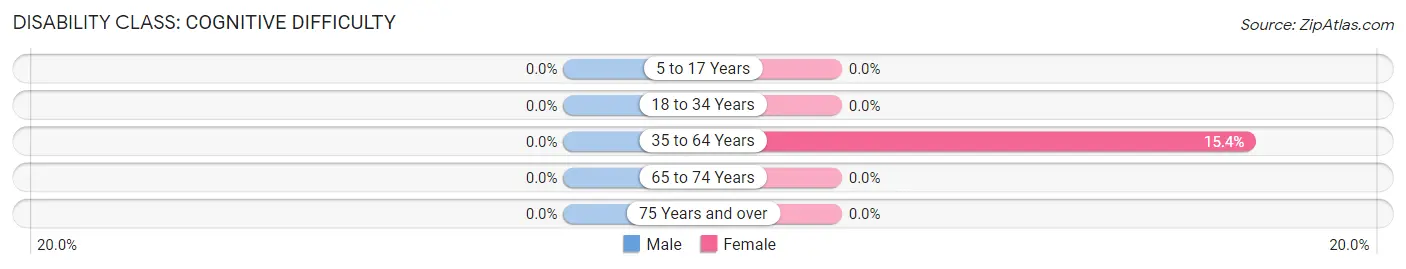
| Age Bracket | Male | Female |
| 5 to 17 Years | 0 (0.0%) | 0 (0.0%) |
| 18 to 34 Years | 0 (0.0%) | 0 (0.0%) |
| 35 to 64 Years | 0 (0.0%) | 2 (15.4%) |
| 65 to 74 Years | 0 (0.0%) | 0 (0.0%) |
| 75 Years and over | 0 (0.0%) | 0 (0.0%) |
Disability Class: Ambulatory Difficulty
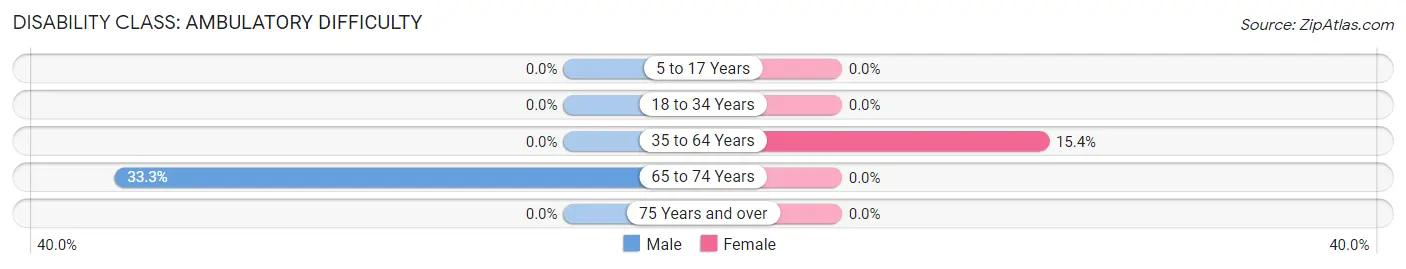
| Age Bracket | Male | Female |
| 5 to 17 Years | 0 (0.0%) | 0 (0.0%) |
| 18 to 34 Years | 0 (0.0%) | 0 (0.0%) |
| 35 to 64 Years | 0 (0.0%) | 2 (15.4%) |
| 65 to 74 Years | 2 (33.3%) | 0 (0.0%) |
| 75 Years and over | 0 (0.0%) | 0 (0.0%) |
Disability Class: Self-Care Difficulty
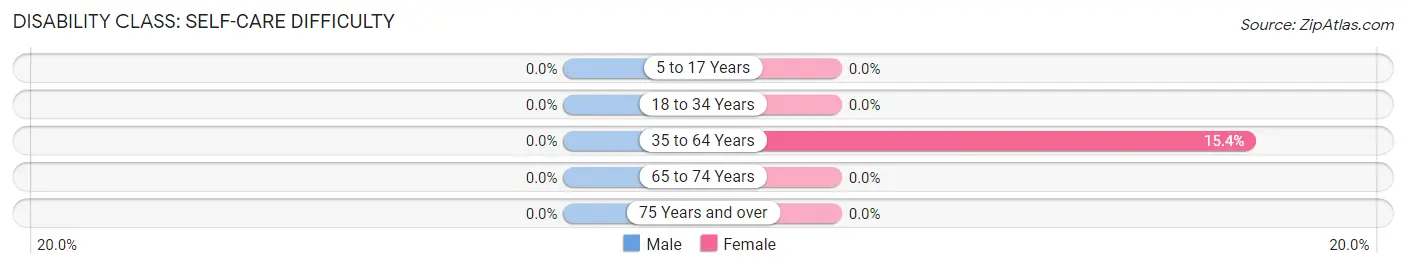
| Age Bracket | Male | Female |
| 5 to 17 Years | 0 (0.0%) | 0 (0.0%) |
| 18 to 34 Years | 0 (0.0%) | 0 (0.0%) |
| 35 to 64 Years | 0 (0.0%) | 2 (15.4%) |
| 65 to 74 Years | 0 (0.0%) | 0 (0.0%) |
| 75 Years and over | 0 (0.0%) | 0 (0.0%) |
Technology Access in Washington
Computing Device Access in Washington
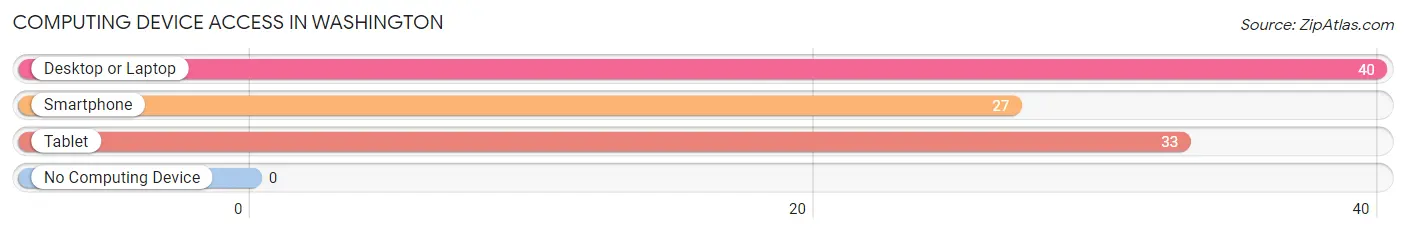
| Device Type | # Households | % Households |
| Desktop or Laptop | 40 | 90.9% |
| Smartphone | 27 | 61.4% |
| Tablet | 33 | 75.0% |
| No Computing Device | 0 | 0.0% |
| Total | 44 | 100.0% |
Internet Access in Washington
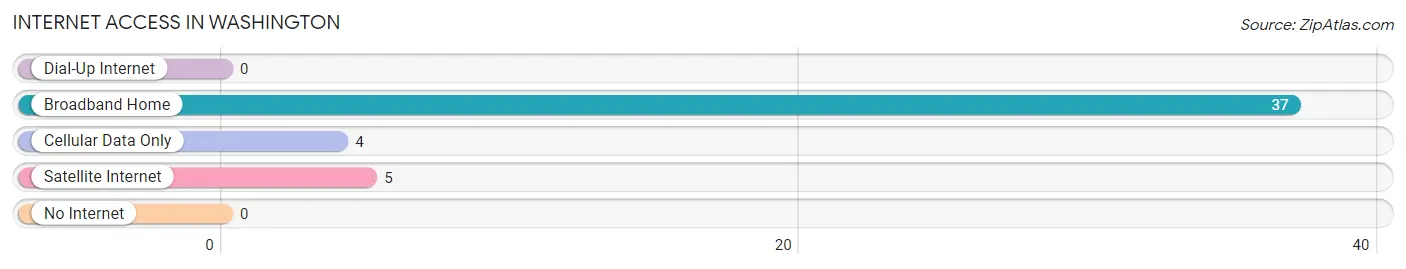
| Internet Type | # Households | % Households |
| Dial-Up Internet | 0 | 0.0% |
| Broadband Home | 37 | 84.1% |
| Cellular Data Only | 4 | 9.1% |
| Satellite Internet | 5 | 11.4% |
| No Internet | 0 | 0.0% |
| Total | 44 | 100.0% |
Washington Summary
Washington, Virginia is a small town located in Rappahannock County, Virginia. It is situated in the foothills of the Blue Ridge Mountains, about 70 miles west of Washington, D.C. The town is home to a population of approximately 1,000 people and is the county seat of Rappahannock County.
History
Washington, Virginia was founded in 1795 by Colonel Joseph Washington, a Revolutionary War veteran and the great-grandnephew of George Washington. The town was named in honor of the first president of the United States. The town was originally a trading post and was the first county seat of Rappahannock County.
In the early 19th century, Washington, Virginia was a bustling center of commerce and industry. The town was home to several mills, a tannery, a blacksmith shop, and a variety of other businesses. The town was also home to a number of churches, including the Washington Presbyterian Church, which was founded in 1802.
In the late 19th century, the town began to decline as the railroad bypassed it and the local economy shifted away from agriculture. The town was nearly abandoned by the early 20th century, but was revived in the 1950s when the town was designated as the county seat of Rappahannock County.
Geography
Washington, Virginia is located in the foothills of the Blue Ridge Mountains in Rappahannock County. The town is situated at the intersection of U.S. Route 211 and Virginia State Route 622. The town is surrounded by the Shenandoah National Park to the north and the George Washington National Forest to the south.
The town is located in a rural area and is surrounded by rolling hills and farmland. The town is located at an elevation of 1,000 feet and has a humid subtropical climate. The average annual temperature is around 55 degrees Fahrenheit and the average annual precipitation is around 40 inches.
Economy
Washington, Virginia is a small town with a limited economy. The town is home to a variety of small businesses, including restaurants, antique stores, and a variety of other retail stores. The town is also home to a number of farms and orchards, which produce a variety of fruits and vegetables.
The town is also home to a number of wineries, which produce a variety of wines. The town is also home to a number of bed and breakfasts, which attract tourists from around the region.
Demographics
As of the 2010 census, the population of Washington, Virginia was 1,000 people. The town is predominantly white, with 92.7% of the population identifying as white. The town is also home to a small African American population, with 4.2% of the population identifying as African American. The town is also home to a small Hispanic population, with 1.7% of the population identifying as Hispanic or Latino.
The median household income in Washington, Virginia is $45,000, and the median home value is $175,000. The town has a poverty rate of 11.3%, which is slightly higher than the national average. The town also has a high rate of educational attainment, with 94.3% of the population having at least a high school diploma.
Common Questions
What is the Total Population of Washington?
Total Population of Washington is 54.
What is the Total Male Population of Washington?
Total Male Population of Washington is 17.
What is the Total Female Population of Washington?
Total Female Population of Washington is 37.
What is the Ratio of Males per 100 Females in Washington?
There are 45.95 Males per 100 Females in Washington.
What is the Ratio of Females per 100 Males in Washington?
There are 217.65 Females per 100 Males in Washington.
What is the Median Population Age in Washington?
Median Population Age in Washington is 68.5 Years.
What is the Average Family Size in Washington
Average Family Size in Washington is 2.7 People.
What is the Average Household Size in Washington
Average Household Size in Washington is 1.2 People.
What is Per Capita Income in Washington?
Per Capita income in Washington is $52,626.
What is the Median Household income in Washington?
Median Household Income in Washington is $40,000.
What is Inequality or Gini Index in Washington?
Inequality or Gini Index in Washington is 0.35.
How Large is the Labor Force in Washington?
There are 34 People in the Labor Forcein in Washington.
What is the Percentage of People in the Labor Force in Washington?
63.0% of People are in the Labor Force in Washington.