New Kent, VA
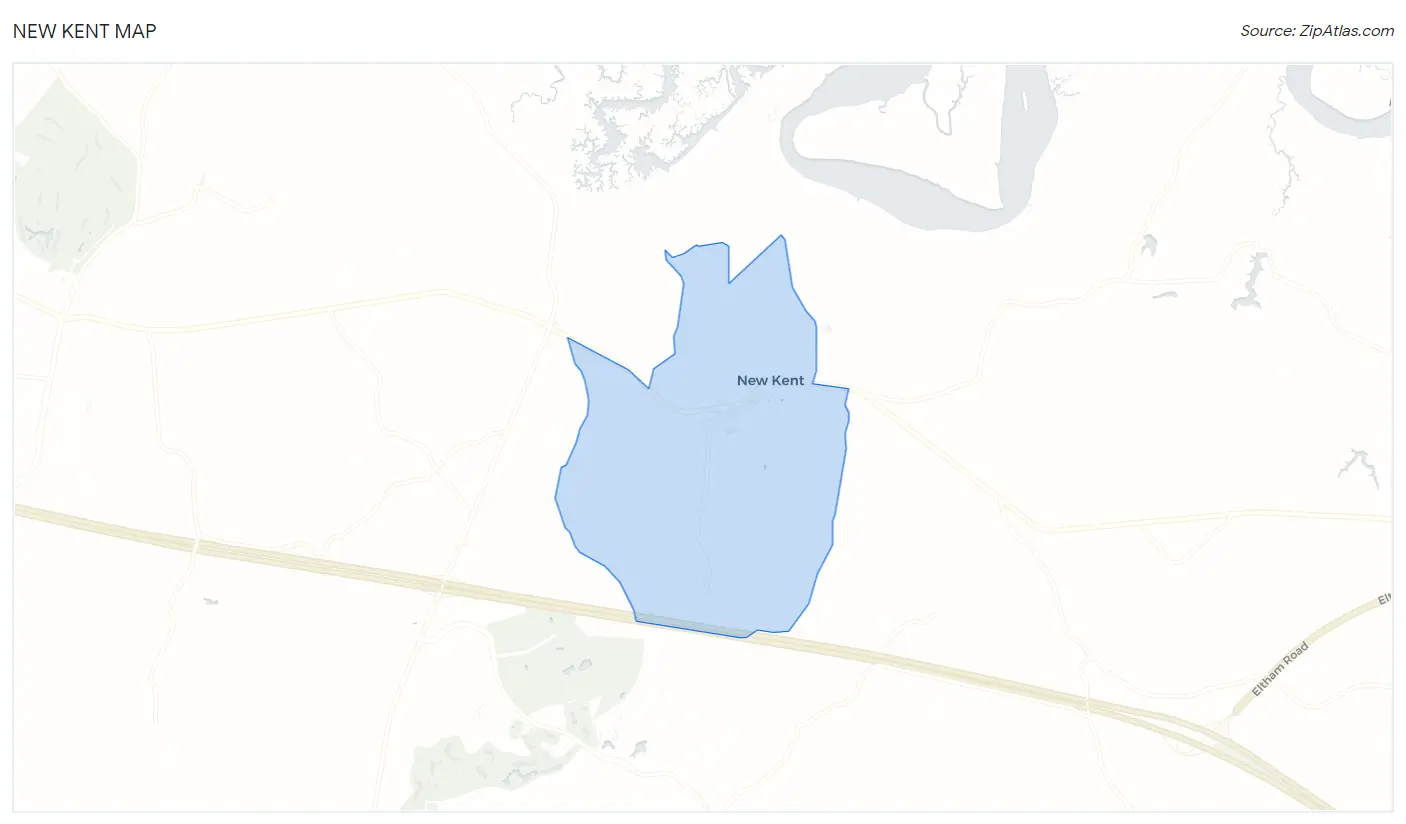
New Kent Map
New Kent Overview
796
TOTAL POPULATION
339
MALE POPULATION
457
FEMALE POPULATION
74.18
MALES / 100 FEMALES
134.81
FEMALES / 100 MALES
31.1
MEDIAN AGE
2.9
AVG FAMILY SIZE
2.9
AVG HOUSEHOLD SIZE
$68,850
PER CAPITA INCOME
$161,572
AVG FAMILY INCOME
$161,572
AVG HOUSEHOLD INCOME
2.5%
WAGE / INCOME GAP [ % ]
97.5¢/ $1
WAGE / INCOME GAP [ $ ]
0.29
INEQUALITY / GINI INDEX
518
LABOR FORCE [ PEOPLE ]
92.7%
PERCENT IN LABOR FORCE
New Kent Zip Codes
New Kent Area Codes
Race in New Kent
The most populous races in New Kent are White / Caucasian (517 | 64.9%), and Black / African American (279 | 35.0%).
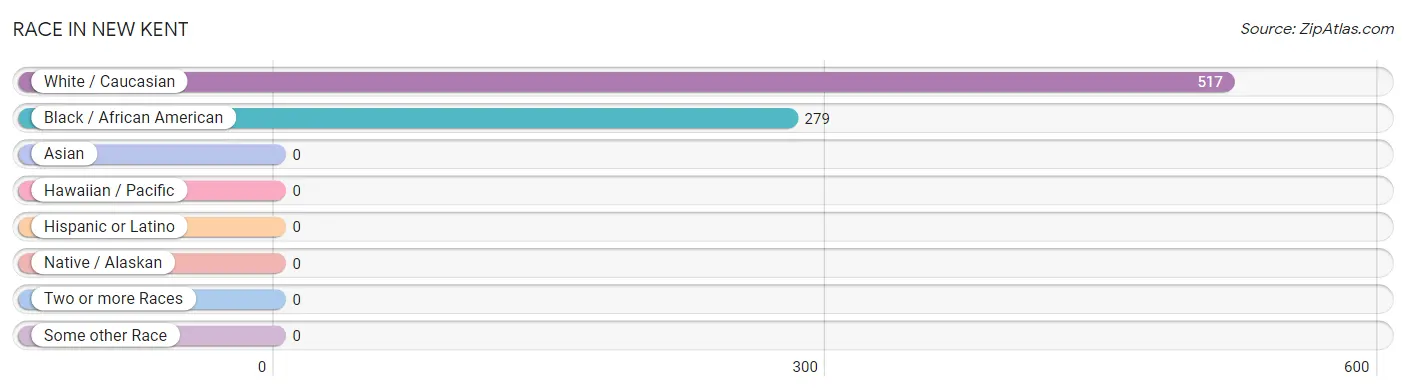
| Race | # Population | % Population |
| Asian | 0 | 0.0% |
| Black / African American | 279 | 35.0% |
| Hawaiian / Pacific | 0 | 0.0% |
| Hispanic or Latino | 0 | 0.0% |
| Native / Alaskan | 0 | 0.0% |
| White / Caucasian | 517 | 64.9% |
| Two or more Races | 0 | 0.0% |
| Some other Race | 0 | 0.0% |
| Total | 796 | 100.0% |
Ancestry in New Kent
The most populous ancestries reported in New Kent are English (154 | 19.4%), Italian (124 | 15.6%), German (81 | 10.2%), Irish (77 | 9.7%), and Hungarian (42 | 5.3%), together accounting for 60.1% of all New Kent residents.
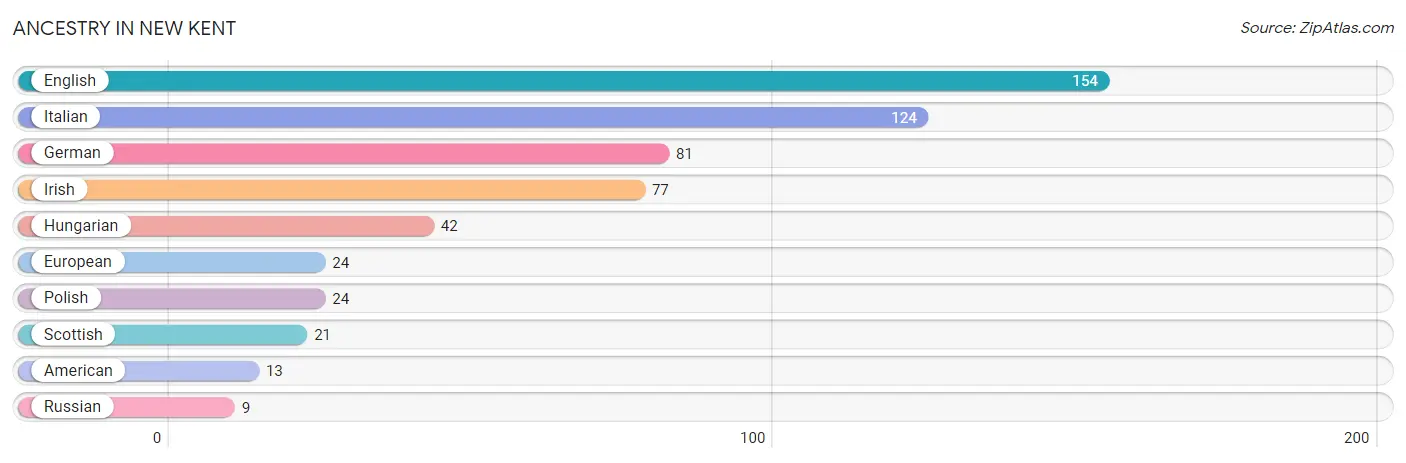
| Ancestry | # Population | % Population |
| American | 13 | 1.6% |
| English | 154 | 19.4% |
| European | 24 | 3.0% |
| German | 81 | 10.2% |
| Hungarian | 42 | 5.3% |
| Irish | 77 | 9.7% |
| Italian | 124 | 15.6% |
| Polish | 24 | 3.0% |
| Russian | 9 | 1.1% |
| Scottish | 21 | 2.6% | View All 10 Rows |
Immigrants in New Kent

| Immigration Origin | # Population | % Population | View All 0 Rows |
Sex and Age in New Kent
Sex and Age in New Kent
The most populous age groups in New Kent are 40 to 44 Years (100 | 29.5%) for men and 40 to 44 Years (102 | 22.3%) for women.
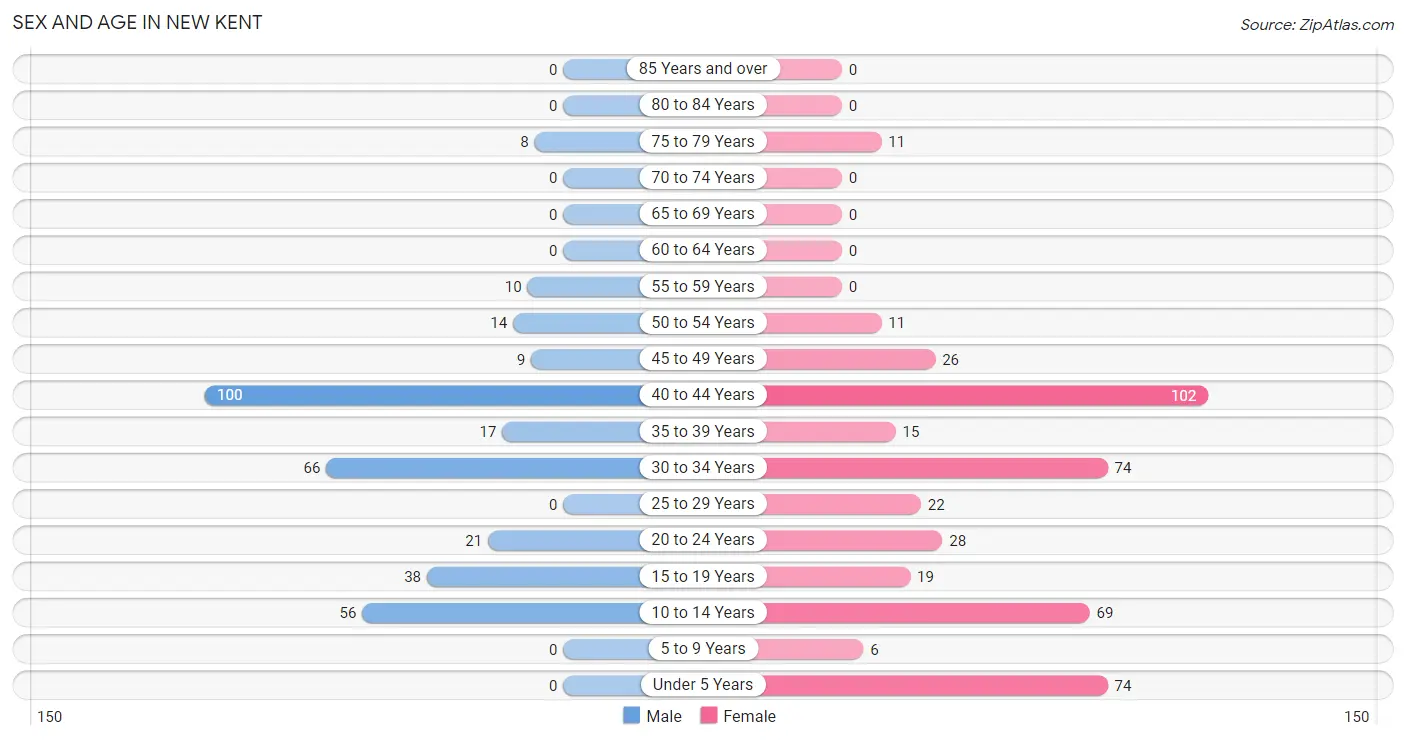
| Age Bracket | Male | Female |
| Under 5 Years | 0 (0.0%) | 74 (16.2%) |
| 5 to 9 Years | 0 (0.0%) | 6 (1.3%) |
| 10 to 14 Years | 56 (16.5%) | 69 (15.1%) |
| 15 to 19 Years | 38 (11.2%) | 19 (4.2%) |
| 20 to 24 Years | 21 (6.2%) | 28 (6.1%) |
| 25 to 29 Years | 0 (0.0%) | 22 (4.8%) |
| 30 to 34 Years | 66 (19.5%) | 74 (16.2%) |
| 35 to 39 Years | 17 (5.0%) | 15 (3.3%) |
| 40 to 44 Years | 100 (29.5%) | 102 (22.3%) |
| 45 to 49 Years | 9 (2.6%) | 26 (5.7%) |
| 50 to 54 Years | 14 (4.1%) | 11 (2.4%) |
| 55 to 59 Years | 10 (2.9%) | 0 (0.0%) |
| 60 to 64 Years | 0 (0.0%) | 0 (0.0%) |
| 65 to 69 Years | 0 (0.0%) | 0 (0.0%) |
| 70 to 74 Years | 0 (0.0%) | 0 (0.0%) |
| 75 to 79 Years | 8 (2.4%) | 11 (2.4%) |
| 80 to 84 Years | 0 (0.0%) | 0 (0.0%) |
| 85 Years and over | 0 (0.0%) | 0 (0.0%) |
| Total | 339 (100.0%) | 457 (100.0%) |
Families and Households in New Kent
Median Family Size in New Kent
The median family size in New Kent is 2.92 persons per family, with single male/father families (10 | 3.7%) accounting for the largest median family size of 3.2 persons per family. On the other hand, single female/mother families (18 | 6.6%) represent the smallest median family size with 2.39 persons per family.
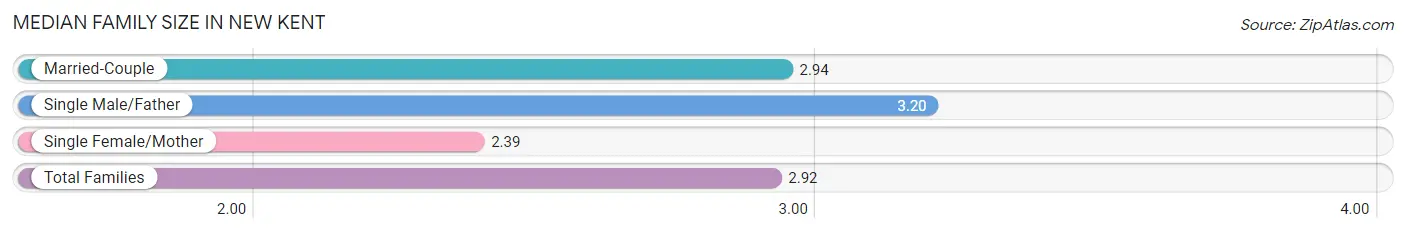
| Family Type | # Families | Family Size |
| Married-Couple | 245 (89.7%) | 2.94 |
| Single Male/Father | 10 (3.7%) | 3.20 |
| Single Female/Mother | 18 (6.6%) | 2.39 |
| Total Families | 273 (100.0%) | 2.92 |
Median Household Size in New Kent
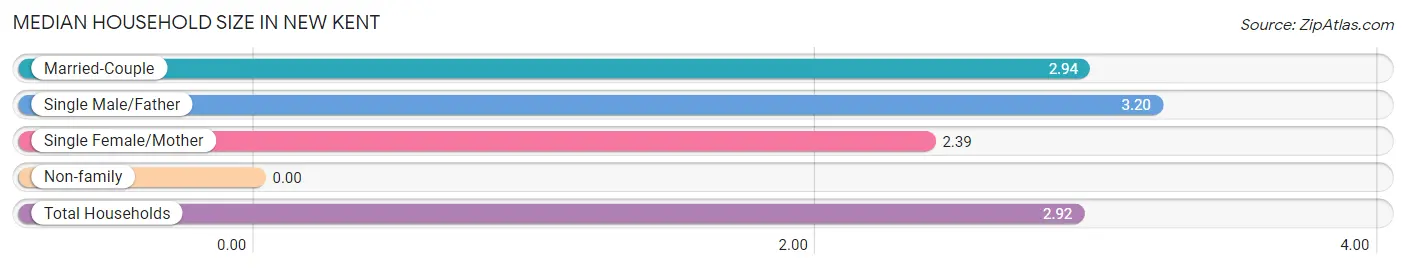
| Household Type | # Households | Household Size |
| Married-Couple | 245 (89.7%) | 2.94 |
| Single Male/Father | 10 (3.7%) | 3.20 |
| Single Female/Mother | 18 (6.6%) | 2.39 |
| Non-family | 0 (0.0%) | - |
| Total Households | 273 (100.0%) | 2.92 |
Household Size by Marriage Status in New Kent
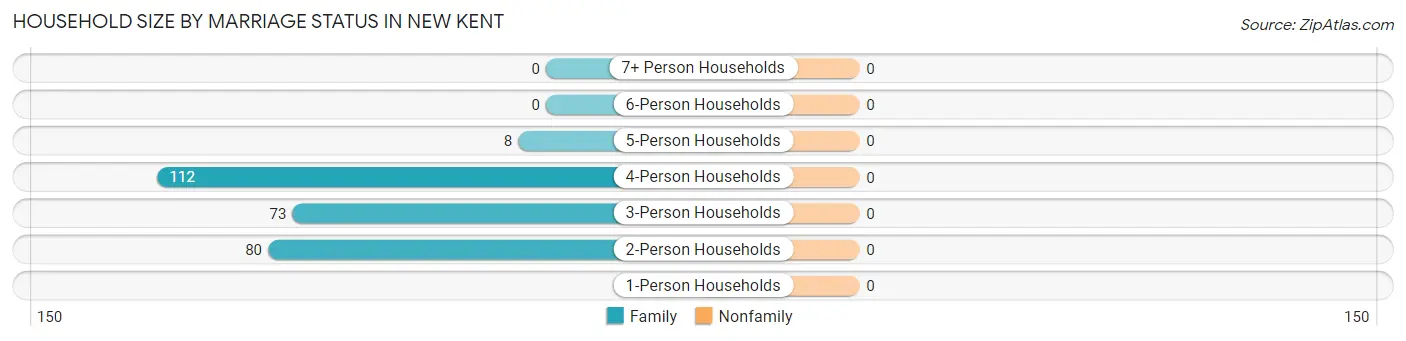
| Household Size | Family Households | Nonfamily Households |
| 1-Person Households | - | 0 (0.0%) |
| 2-Person Households | 80 (29.3%) | 0 (0.0%) |
| 3-Person Households | 73 (26.7%) | 0 (0.0%) |
| 4-Person Households | 112 (41.0%) | 0 (0.0%) |
| 5-Person Households | 8 (2.9%) | 0 (0.0%) |
| 6-Person Households | 0 (0.0%) | 0 (0.0%) |
| 7+ Person Households | 0 (0.0%) | 0 (0.0%) |
| Total | 273 (100.0%) | 0 (0.0%) |
Female Fertility in New Kent
Fertility by Age in New Kent
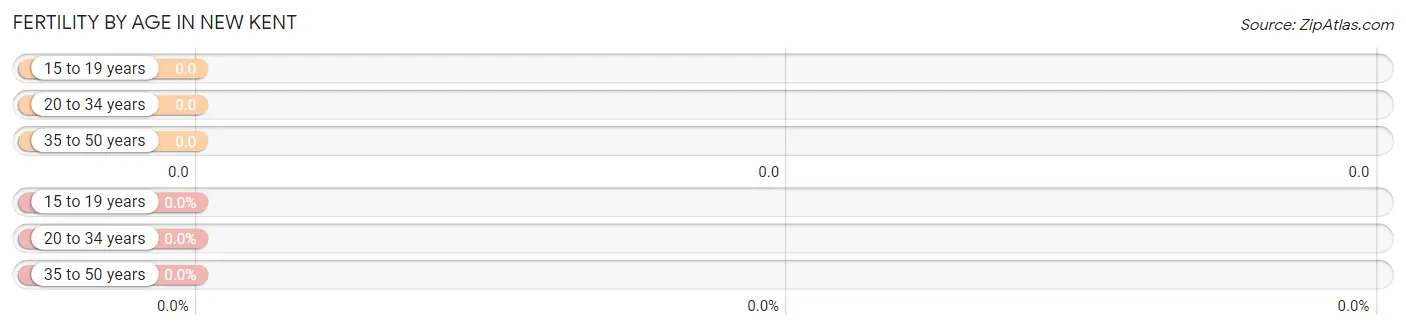
| Age Bracket | Women with Births | Births / 1,000 Women |
| 15 to 19 years | 0 (0.0%) | 0.0 |
| 20 to 34 years | 0 (0.0%) | 0.0 |
| 35 to 50 years | 0 (0.0%) | 0.0 |
| Total | 0 (0.0%) | 0.0 |
Fertility by Age by Marriage Status in New Kent
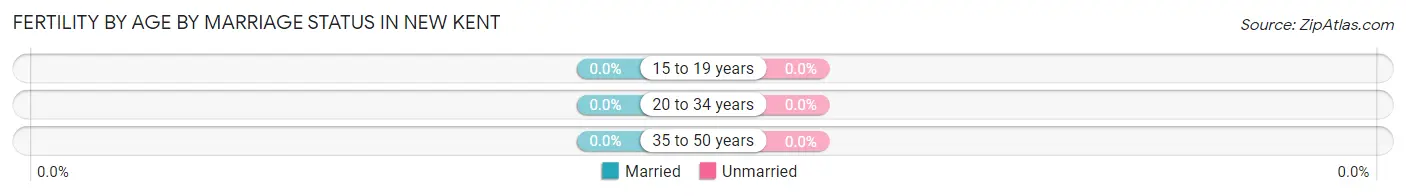
| Age Bracket | Married | Unmarried |
| 15 to 19 years | 0 (0.0%) | 0 (0.0%) |
| 20 to 34 years | 0 (0.0%) | 0 (0.0%) |
| 35 to 50 years | 0 (0.0%) | 0 (0.0%) |
| Total | 0 (0.0%) | 0 (0.0%) |
Fertility by Education in New Kent
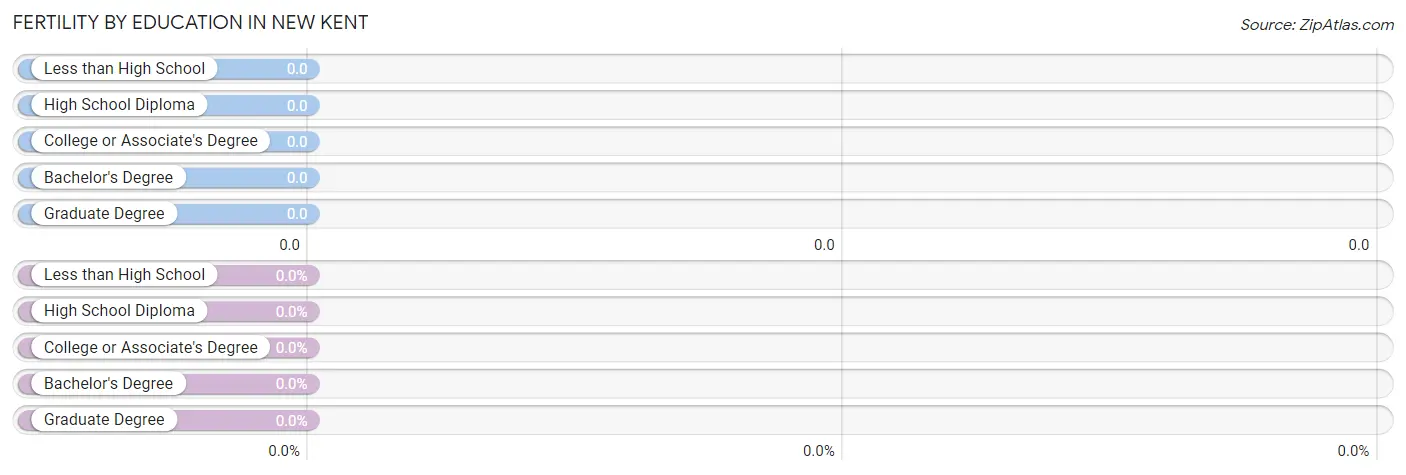
| Educational Attainment | Women with Births | Births / 1,000 Women |
| Less than High School | 0 (0.0%) | 0.0 |
| High School Diploma | 0 (0.0%) | 0.0 |
| College or Associate's Degree | 0 (0.0%) | 0.0 |
| Bachelor's Degree | 0 (0.0%) | 0.0 |
| Graduate Degree | 0 (0.0%) | 0.0 |
| Total | 0 (0.0%) | 0.0 |
Fertility by Education by Marriage Status in New Kent
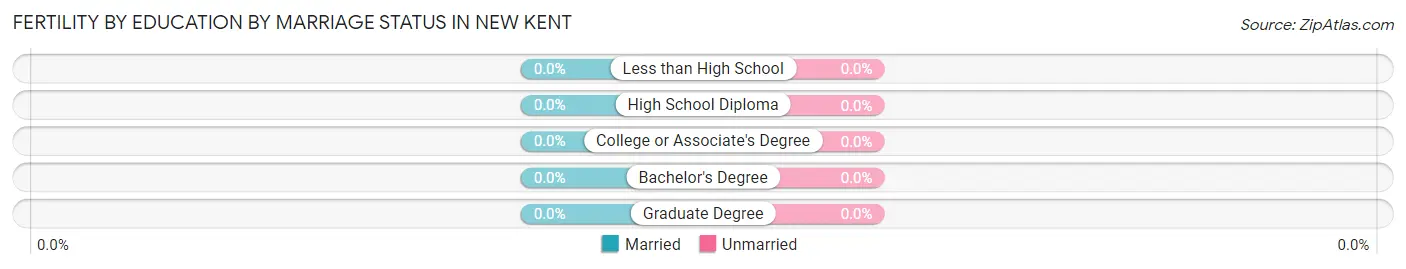
| Educational Attainment | Married | Unmarried |
| Less than High School | 0 (0.0%) | 0 (0.0%) |
| High School Diploma | 0 (0.0%) | 0 (0.0%) |
| College or Associate's Degree | 0 (0.0%) | 0 (0.0%) |
| Bachelor's Degree | 0 (0.0%) | 0 (0.0%) |
| Graduate Degree | 0 (0.0%) | 0 (0.0%) |
| Total | 0 (0.0%) | 0 (0.0%) |
Income in New Kent
Income Overview in New Kent
Per Capita Income in New Kent is $68,850, while median incomes of families and households are $161,572 and $161,572 respectively.
| Characteristic | Number | Measure |
| Per Capita Income | 796 | $68,850 |
| Median Family Income | 273 | $161,572 |
| Mean Family Income | 273 | $204,382 |
| Median Household Income | 273 | $161,572 |
| Mean Household Income | 273 | $204,382 |
| Income Deficit | 273 | $0 |
| Wage / Income Gap (%) | 796 | 2.49% |
| Wage / Income Gap ($) | 796 | 97.51¢ per $1 |
| Gini / Inequality Index | 796 | 0.29 |
Earnings by Sex in New Kent
Average Earnings in New Kent are $81,667, $81,667 for men and $83,750 for women, a difference of 2.5%.
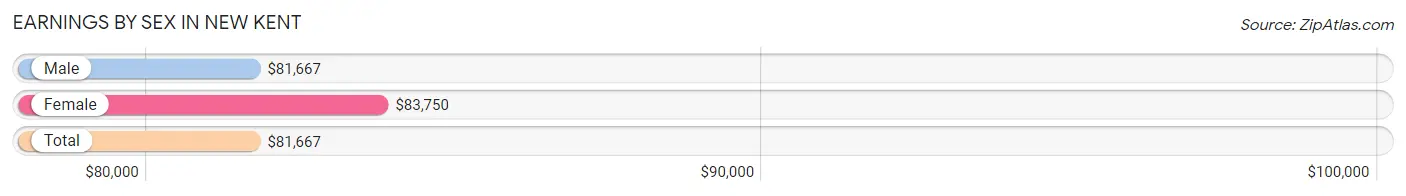
| Sex | Number | Average Earnings |
| Male | 262 (50.6%) | $81,667 |
| Female | 256 (49.4%) | $83,750 |
| Total | 518 (100.0%) | $81,667 |
Earnings by Sex by Income Bracket in New Kent
The most common earnings brackets in New Kent are $100,000+ for men (104 | 39.7%) and $100,000+ for women (102 | 39.8%).
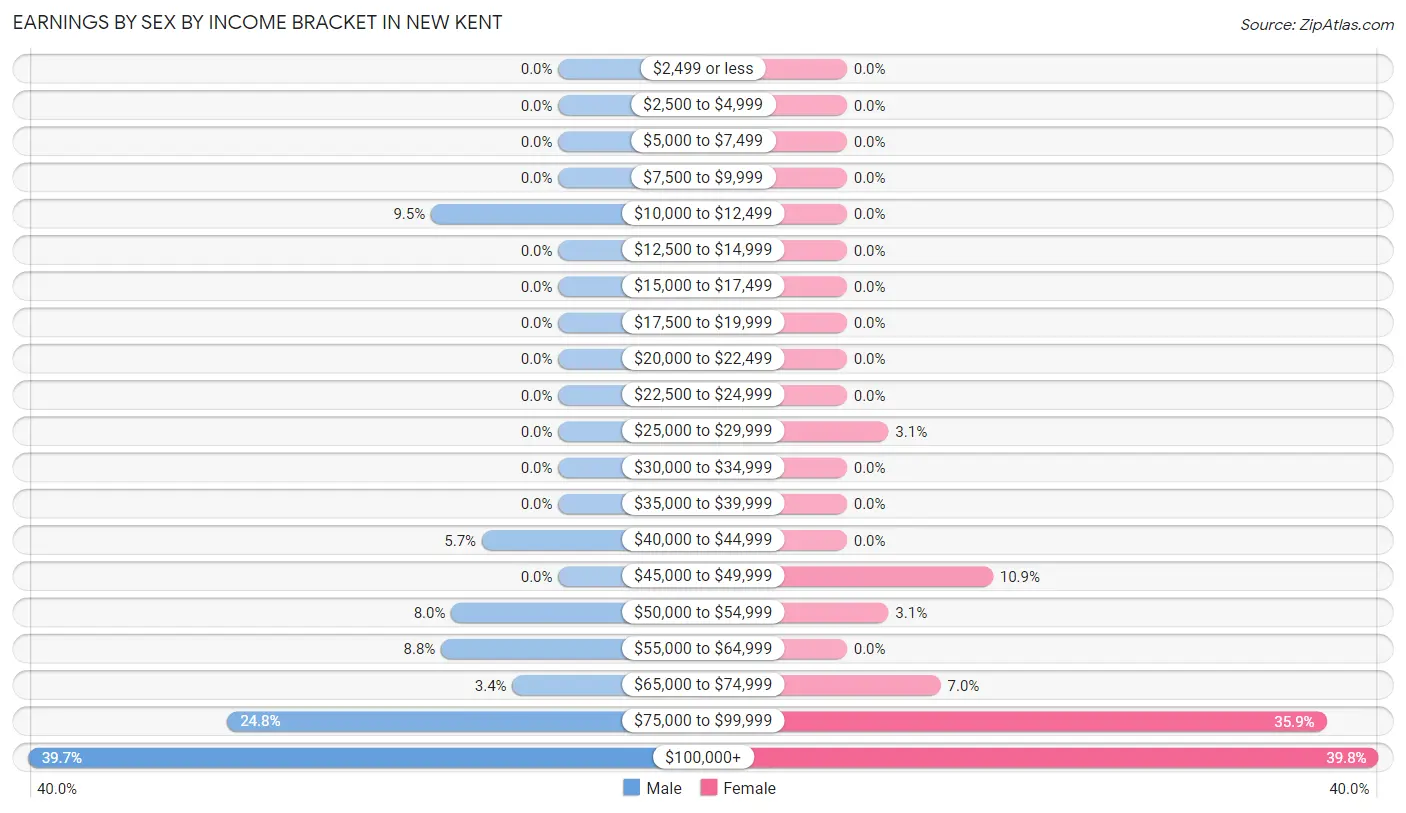
| Income | Male | Female |
| $2,499 or less | 0 (0.0%) | 0 (0.0%) |
| $2,500 to $4,999 | 0 (0.0%) | 0 (0.0%) |
| $5,000 to $7,499 | 0 (0.0%) | 0 (0.0%) |
| $7,500 to $9,999 | 0 (0.0%) | 0 (0.0%) |
| $10,000 to $12,499 | 25 (9.5%) | 0 (0.0%) |
| $12,500 to $14,999 | 0 (0.0%) | 0 (0.0%) |
| $15,000 to $17,499 | 0 (0.0%) | 0 (0.0%) |
| $17,500 to $19,999 | 0 (0.0%) | 0 (0.0%) |
| $20,000 to $22,499 | 0 (0.0%) | 0 (0.0%) |
| $22,500 to $24,999 | 0 (0.0%) | 0 (0.0%) |
| $25,000 to $29,999 | 0 (0.0%) | 8 (3.1%) |
| $30,000 to $34,999 | 0 (0.0%) | 0 (0.0%) |
| $35,000 to $39,999 | 0 (0.0%) | 0 (0.0%) |
| $40,000 to $44,999 | 15 (5.7%) | 0 (0.0%) |
| $45,000 to $49,999 | 0 (0.0%) | 28 (10.9%) |
| $50,000 to $54,999 | 21 (8.0%) | 8 (3.1%) |
| $55,000 to $64,999 | 23 (8.8%) | 0 (0.0%) |
| $65,000 to $74,999 | 9 (3.4%) | 18 (7.0%) |
| $75,000 to $99,999 | 65 (24.8%) | 92 (35.9%) |
| $100,000+ | 104 (39.7%) | 102 (39.8%) |
| Total | 262 (100.0%) | 256 (100.0%) |
Earnings by Sex by Educational Attainment in New Kent
Average earnings in New Kent are $88,750 for men and $91,591 for women, a difference of 3.1%. Men with an educational attainment of college or associate's degree enjoy the highest average annual earnings of $100,059, while those with college or associate's degree education earn the least with $100,059. Women with an educational attainment of college or associate's degree earn the most with the average annual earnings of $138,153, while those with college or associate's degree education have the smallest earnings of $138,153.
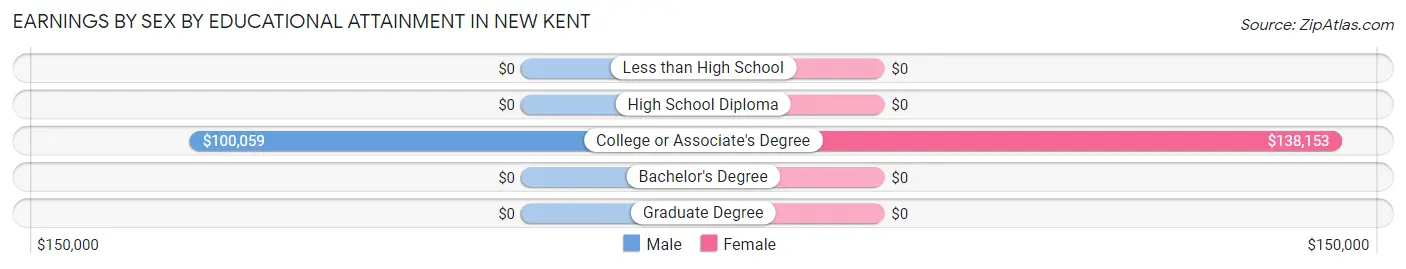
| Educational Attainment | Male Income | Female Income |
| Less than High School | - | - |
| High School Diploma | - | - |
| College or Associate's Degree | $100,059 | $138,153 |
| Bachelor's Degree | - | - |
| Graduate Degree | - | - |
| Total | $88,750 | $91,591 |
Family Income in New Kent
Family Income Brackets in New Kent
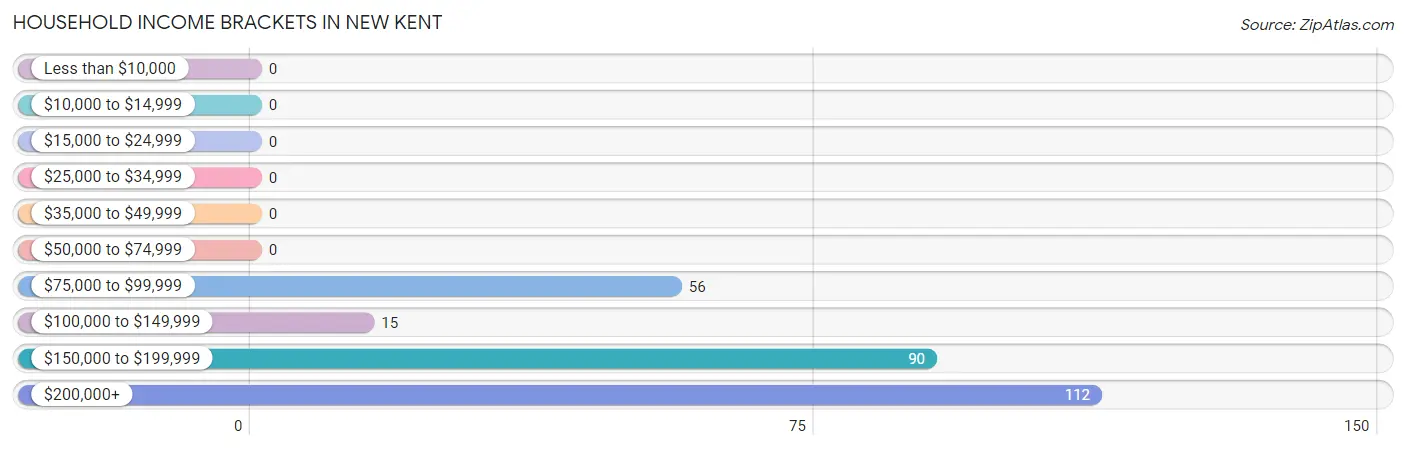
According to the New Kent family income data, there are 112 families falling into the $200,000+ income range, which is the most common income bracket and makes up 41.0% of all families.
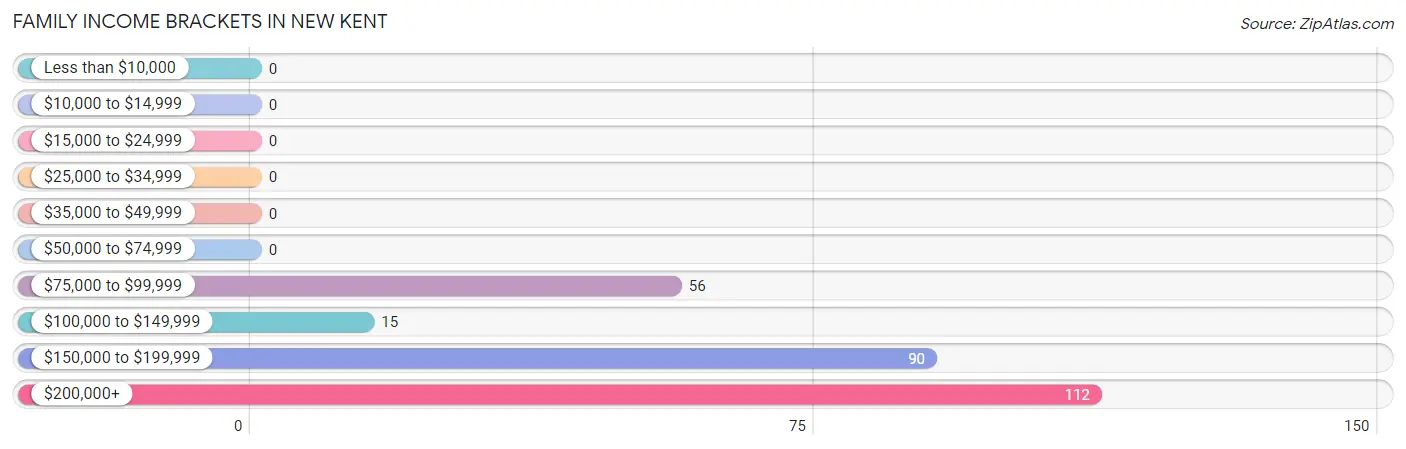
| Income Bracket | # Families | % Families |
| Less than $10,000 | 0 | 0.0% |
| $10,000 to $14,999 | 0 | 0.0% |
| $15,000 to $24,999 | 0 | 0.0% |
| $25,000 to $34,999 | 0 | 0.0% |
| $35,000 to $49,999 | 0 | 0.0% |
| $50,000 to $74,999 | 0 | 0.0% |
| $75,000 to $99,999 | 56 | 20.5% |
| $100,000 to $149,999 | 15 | 5.5% |
| $150,000 to $199,999 | 90 | 33.0% |
| $200,000+ | 112 | 41.0% |
Family Income by Famaliy Size in New Kent
4-person families (112 | 41.0%) account for the highest median family income in New Kent with $241,165 per family, while 4-person families (112 | 41.0%) have the highest median income of $60,291 per family member.
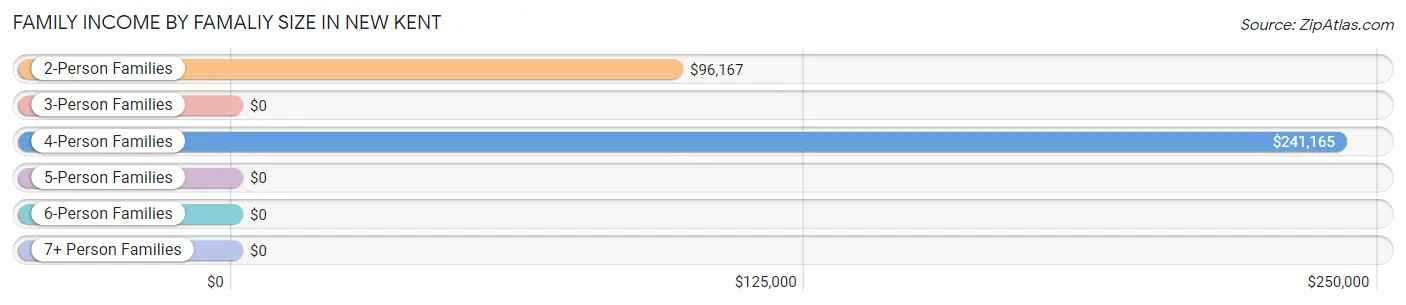
| Income Bracket | # Families | Median Income |
| 2-Person Families | 80 (29.3%) | $96,167 |
| 3-Person Families | 73 (26.7%) | $0 |
| 4-Person Families | 112 (41.0%) | $241,165 |
| 5-Person Families | 8 (2.9%) | $0 |
| 6-Person Families | 0 (0.0%) | $0 |
| 7+ Person Families | 0 (0.0%) | $0 |
| Total | 273 (100.0%) | $161,572 |
Family Income by Number of Earners in New Kent
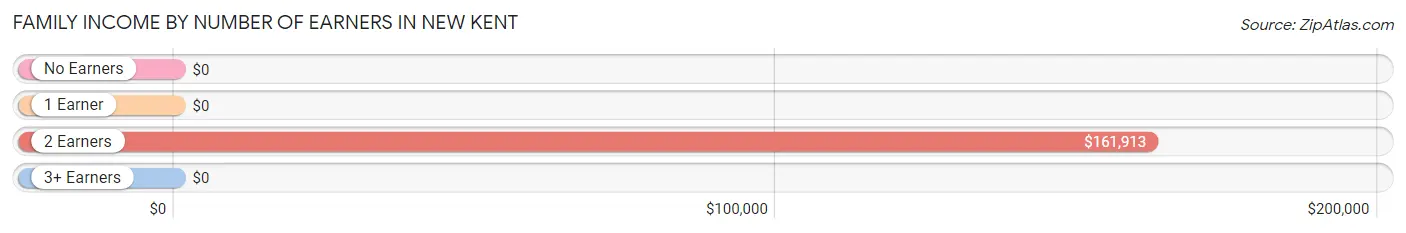
| Number of Earners | # Families | Median Income |
| No Earners | 8 (2.9%) | $0 |
| 1 Earner | 10 (3.7%) | $0 |
| 2 Earners | 255 (93.4%) | $161,913 |
| 3+ Earners | 0 (0.0%) | $0 |
| Total | 273 (100.0%) | $161,572 |
Household Income in New Kent
Household Income Brackets in New Kent
With 112 households falling in the category, the $200,000+ income range is the most frequent in New Kent, accounting for 41.0% of all households.
| Income Bracket | # Households | % Households |
| Less than $10,000 | 0 | 0.0% |
| $10,000 to $14,999 | 0 | 0.0% |
| $15,000 to $24,999 | 0 | 0.0% |
| $25,000 to $34,999 | 0 | 0.0% |
| $35,000 to $49,999 | 0 | 0.0% |
| $50,000 to $74,999 | 0 | 0.0% |
| $75,000 to $99,999 | 56 | 20.5% |
| $100,000 to $149,999 | 15 | 5.5% |
| $150,000 to $199,999 | 90 | 33.0% |
| $200,000+ | 112 | 41.0% |
Household Income by Householder Age in New Kent
The median household income in New Kent is $161,572, with the highest median household income of $211,083 found in the 25 to 44 years age bracket for the primary householder. A total of 193 households (70.7%) fall into this category. Meanwhile, the 15 to 24 years age bracket for the primary householder has the lowest median household income of $0, with 21 households (7.7%) in this group.
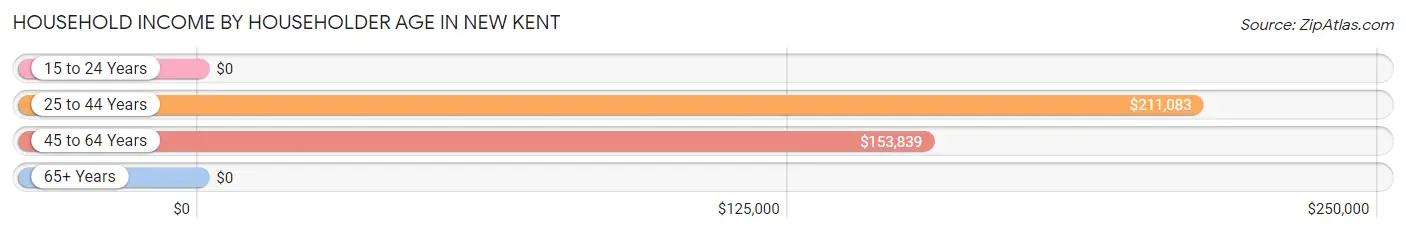
| Income Bracket | # Households | Median Income |
| 15 to 24 Years | 21 (7.7%) | $0 |
| 25 to 44 Years | 193 (70.7%) | $211,083 |
| 45 to 64 Years | 51 (18.7%) | $153,839 |
| 65+ Years | 8 (2.9%) | $0 |
| Total | 273 (100.0%) | $161,572 |
Poverty in New Kent
Income Below Poverty by Sex and Age in New Kent
| Age Bracket | Male | Female |
| Under 5 Years | 0 (0.0%) | 0 (0.0%) |
| 5 Years | 0 (0.0%) | 0 (0.0%) |
| 6 to 11 Years | 0 (0.0%) | 0 (0.0%) |
| 12 to 14 Years | 0 (0.0%) | 0 (0.0%) |
| 15 Years | 0 (0.0%) | 0 (0.0%) |
| 16 and 17 Years | 0 (0.0%) | 0 (0.0%) |
| 18 to 24 Years | 0 (0.0%) | 0 (0.0%) |
| 25 to 34 Years | 0 (0.0%) | 0 (0.0%) |
| 35 to 44 Years | 0 (0.0%) | 0 (0.0%) |
| 45 to 54 Years | 0 (0.0%) | 0 (0.0%) |
| 55 to 64 Years | 0 (0.0%) | 0 (0.0%) |
| 65 to 74 Years | 0 (0.0%) | 0 (0.0%) |
| 75 Years and over | 0 (0.0%) | 0 (0.0%) |
| Total | 0 (0.0%) | 0 (0.0%) |
Income Above Poverty by Sex and Age in New Kent
According to the poverty statistics in New Kent, males aged 12 to 14 years and females aged under 5 years are the age groups that are most secure financially, with 100.0% of males and 100.0% of females in these age groups living above the poverty line.
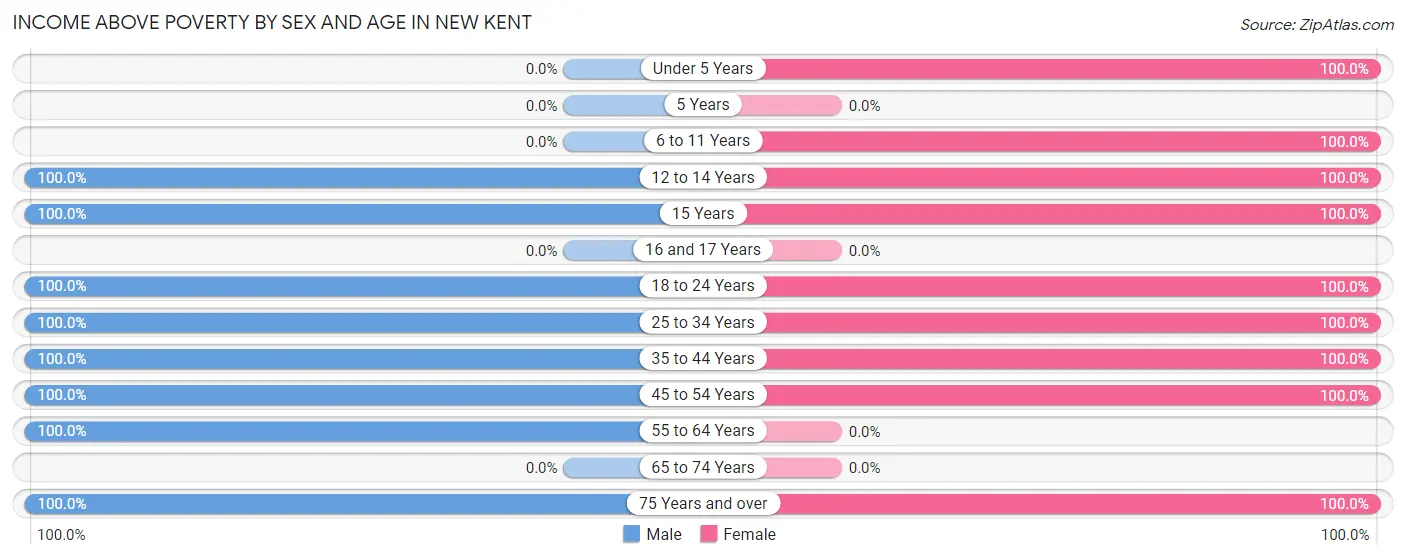
| Age Bracket | Male | Female |
| Under 5 Years | 0 (0.0%) | 74 (100.0%) |
| 5 Years | 0 (0.0%) | 0 (0.0%) |
| 6 to 11 Years | 0 (0.0%) | 6 (100.0%) |
| 12 to 14 Years | 56 (100.0%) | 69 (100.0%) |
| 15 Years | 13 (100.0%) | 19 (100.0%) |
| 16 and 17 Years | 0 (0.0%) | 0 (0.0%) |
| 18 to 24 Years | 46 (100.0%) | 28 (100.0%) |
| 25 to 34 Years | 66 (100.0%) | 96 (100.0%) |
| 35 to 44 Years | 117 (100.0%) | 117 (100.0%) |
| 45 to 54 Years | 23 (100.0%) | 37 (100.0%) |
| 55 to 64 Years | 10 (100.0%) | 0 (0.0%) |
| 65 to 74 Years | 0 (0.0%) | 0 (0.0%) |
| 75 Years and over | 8 (100.0%) | 11 (100.0%) |
| Total | 339 (100.0%) | 457 (100.0%) |
Income Below Poverty Among Married-Couple Families in New Kent
| Children | Above Poverty | Below Poverty |
| No Children | 52 (100.0%) | 0 (0.0%) |
| 1 or 2 Children | 185 (100.0%) | 0 (0.0%) |
| 3 or 4 Children | 8 (100.0%) | 0 (0.0%) |
| 5 or more Children | 0 (0.0%) | 0 (0.0%) |
| Total | 245 (100.0%) | 0 (0.0%) |
Income Below Poverty Among Single-Parent Households in New Kent
| Children | Single Father | Single Mother |
| No Children | 0 (0.0%) | 0 (0.0%) |
| 1 or 2 Children | 0 (0.0%) | 0 (0.0%) |
| 3 or 4 Children | 0 (0.0%) | 0 (0.0%) |
| 5 or more Children | 0 (0.0%) | 0 (0.0%) |
| Total | 0 (0.0%) | 0 (0.0%) |
Income Below Poverty Among Married-Couple vs Single-Parent Households in New Kent
| Children | Married-Couple Families | Single-Parent Households |
| No Children | 0 (0.0%) | 0 (0.0%) |
| 1 or 2 Children | 0 (0.0%) | 0 (0.0%) |
| 3 or 4 Children | 0 (0.0%) | 0 (0.0%) |
| 5 or more Children | 0 (0.0%) | 0 (0.0%) |
| Total | 0 (0.0%) | 0 (0.0%) |
Employment Characteristics in New Kent
Employment by Class of Employer in New Kent
Among the 493 employed individuals in New Kent, private company employees (378 | 76.7%), federal government employees (57 | 11.6%), and state government employees (18 | 3.6%) make up the most common classes of employment.
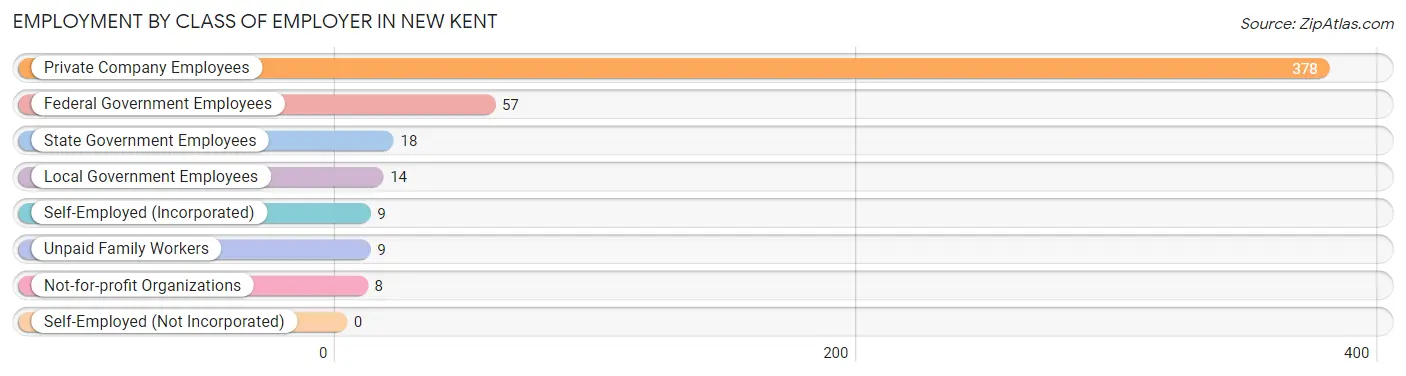
| Employer Class | # Employees | % Employees |
| Private Company Employees | 378 | 76.7% |
| Self-Employed (Incorporated) | 9 | 1.8% |
| Self-Employed (Not Incorporated) | 0 | 0.0% |
| Not-for-profit Organizations | 8 | 1.6% |
| Local Government Employees | 14 | 2.8% |
| State Government Employees | 18 | 3.6% |
| Federal Government Employees | 57 | 11.6% |
| Unpaid Family Workers | 9 | 1.8% |
| Total | 493 | 100.0% |
Employment Status by Age in New Kent
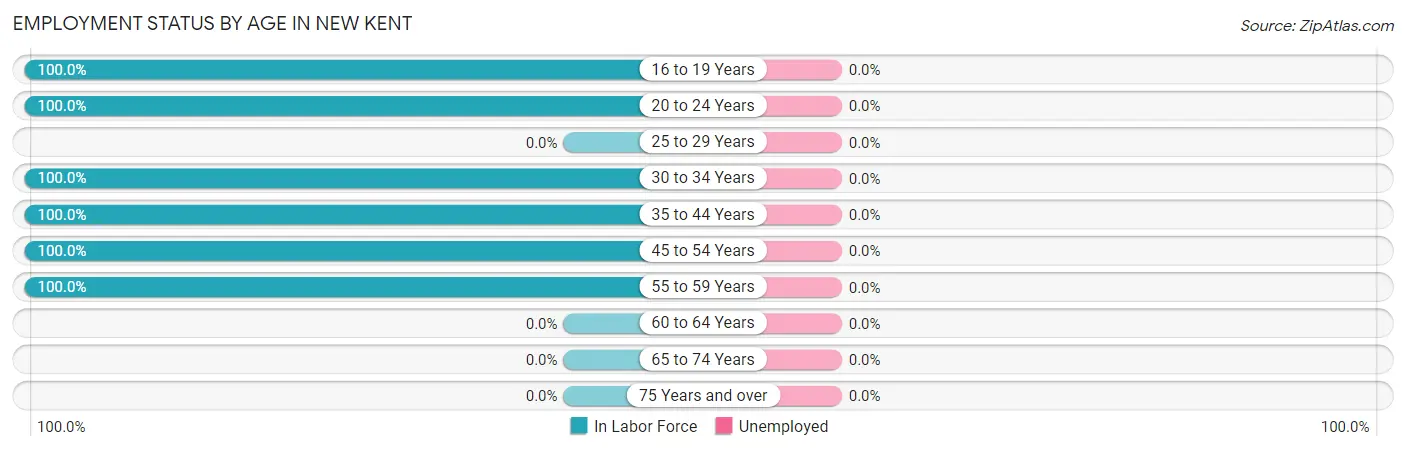
| Age Bracket | In Labor Force | Unemployed |
| 16 to 19 Years | 25 (100.0%) | 0 (0.0%) |
| 20 to 24 Years | 49 (100.0%) | 0 (0.0%) |
| 25 to 29 Years | 0 (0.0%) | 0 (0.0%) |
| 30 to 34 Years | 140 (100.0%) | 0 (0.0%) |
| 35 to 44 Years | 234 (100.0%) | 0 (0.0%) |
| 45 to 54 Years | 60 (100.0%) | 0 (0.0%) |
| 55 to 59 Years | 10 (100.0%) | 0 (0.0%) |
| 60 to 64 Years | 0 (0.0%) | 0 (0.0%) |
| 65 to 74 Years | 0 (0.0%) | 0 (0.0%) |
| 75 Years and over | 0 (0.0%) | 0 (0.0%) |
| Total | 518 (92.7%) | 0 (0.0%) |
Employment Status by Educational Attainment in New Kent
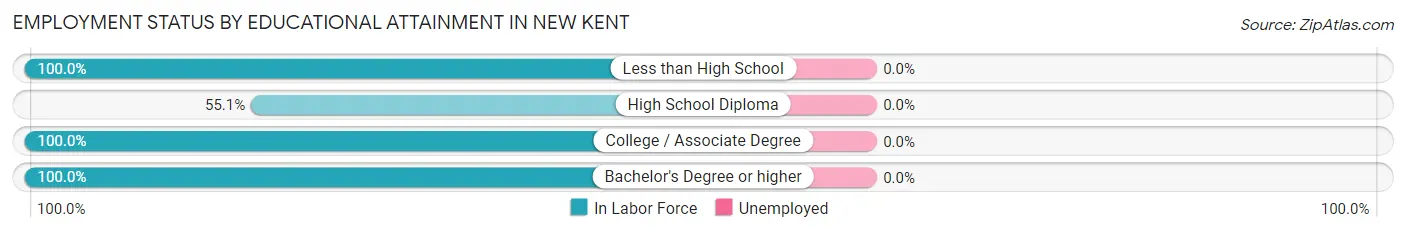
| Educational Attainment | In Labor Force | Unemployed |
| Less than High School | 14 (100.0%) | 0 (0.0%) |
| High School Diploma | 27 (55.1%) | 0 (0.0%) |
| College / Associate Degree | 296 (100.0%) | 0 (0.0%) |
| Bachelor's Degree or higher | 107 (100.0%) | 0 (0.0%) |
| Total | 444 (95.3%) | 0 (0.0%) |
Employment Occupations by Sex in New Kent
Management, Business, Science and Arts Occupations
The most common Management, Business, Science and Arts occupations in New Kent are Management (240 | 46.3%), Business & Financial (66 | 12.7%), Health Diagnosing & Treating (28 | 5.4%), Health Technologists (28 | 5.4%), and Community & Social Service (8 | 1.5%).
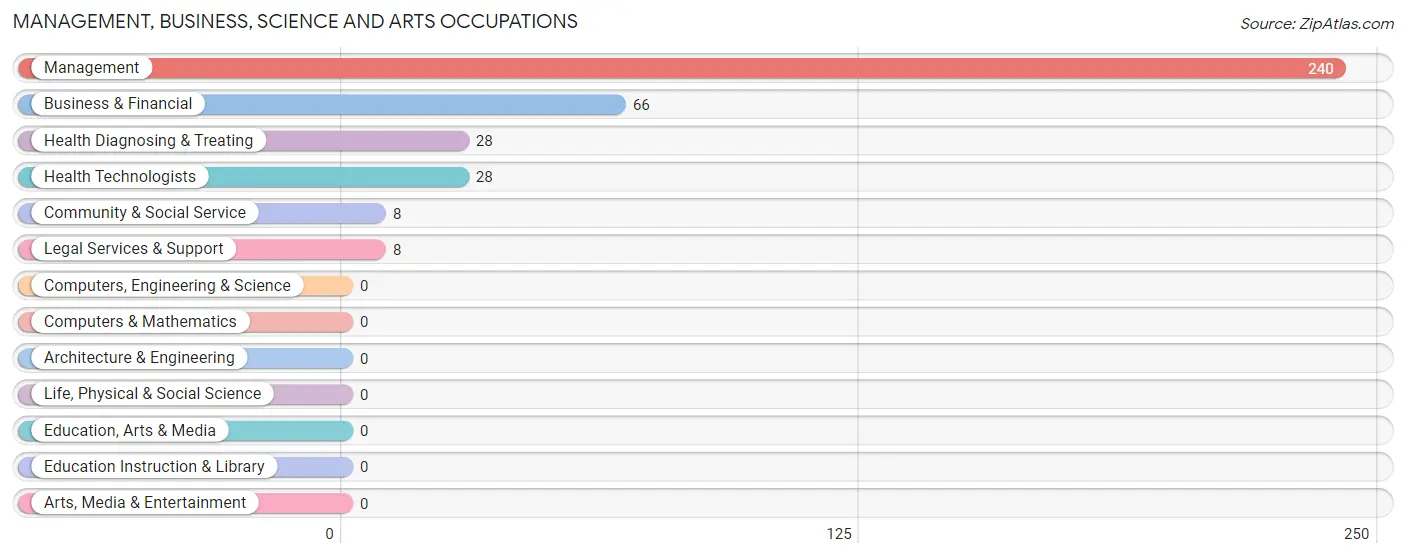
Management, Business, Science and Arts Occupations by Sex
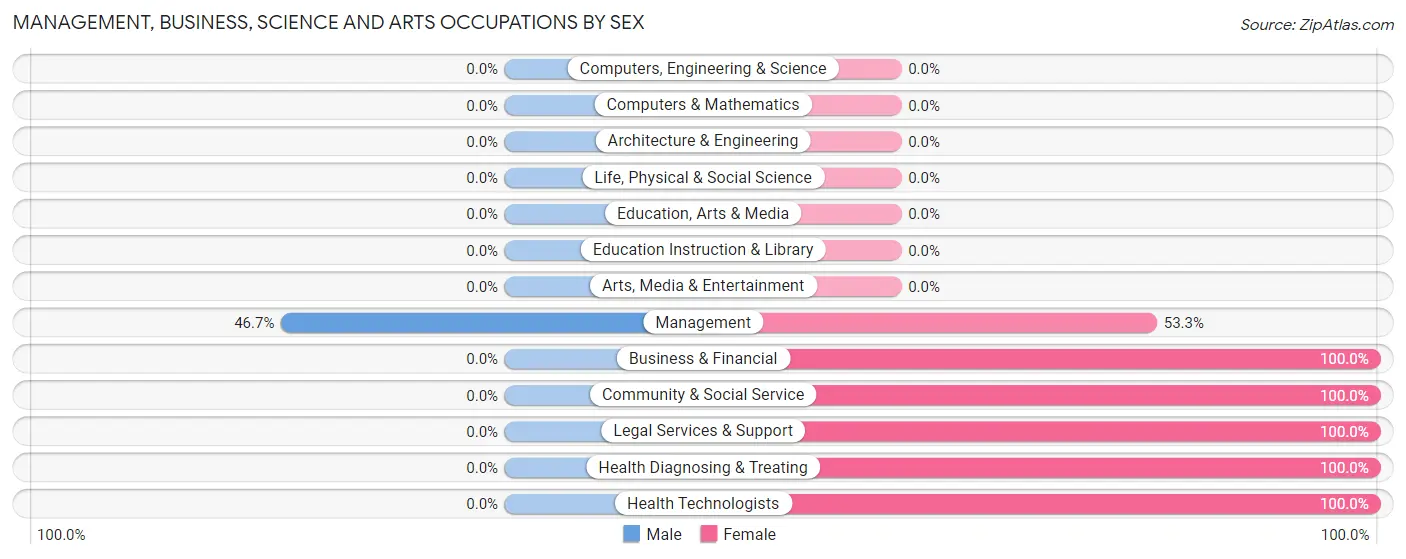
| Occupation | Male | Female |
| Management | 112 (46.7%) | 128 (53.3%) |
| Business & Financial | 0 (0.0%) | 66 (100.0%) |
| Computers, Engineering & Science | 0 (0.0%) | 0 (0.0%) |
| Computers & Mathematics | 0 (0.0%) | 0 (0.0%) |
| Architecture & Engineering | 0 (0.0%) | 0 (0.0%) |
| Life, Physical & Social Science | 0 (0.0%) | 0 (0.0%) |
| Community & Social Service | 0 (0.0%) | 8 (100.0%) |
| Education, Arts & Media | 0 (0.0%) | 0 (0.0%) |
| Legal Services & Support | 0 (0.0%) | 8 (100.0%) |
| Education Instruction & Library | 0 (0.0%) | 0 (0.0%) |
| Arts, Media & Entertainment | 0 (0.0%) | 0 (0.0%) |
| Health Diagnosing & Treating | 0 (0.0%) | 28 (100.0%) |
| Health Technologists | 0 (0.0%) | 28 (100.0%) |
| Total (Category) | 112 (32.8%) | 230 (67.2%) |
| Total (Overall) | 262 (50.6%) | 256 (49.4%) |
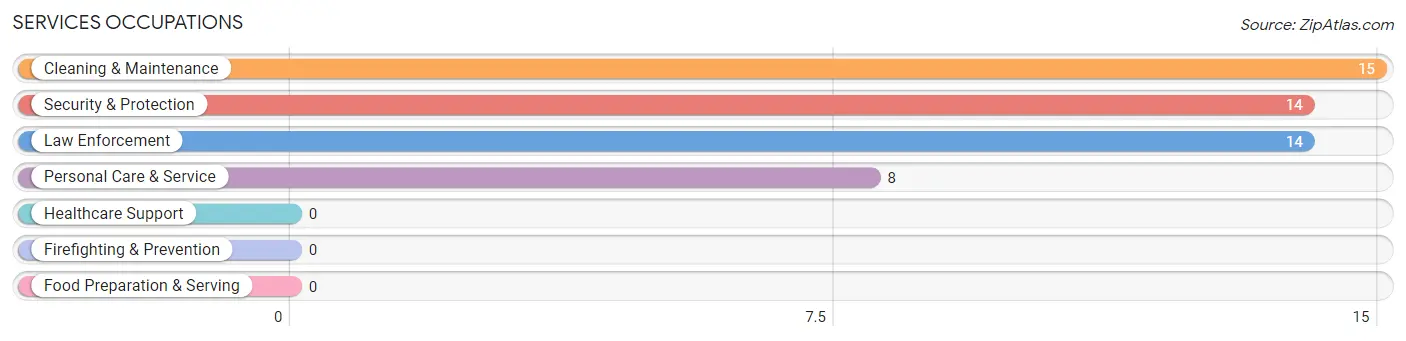
Services Occupations
The most common Services occupations in New Kent are Cleaning & Maintenance (15 | 2.9%), Security & Protection (14 | 2.7%), Law Enforcement (14 | 2.7%), and Personal Care & Service (8 | 1.5%).
Services Occupations by Sex
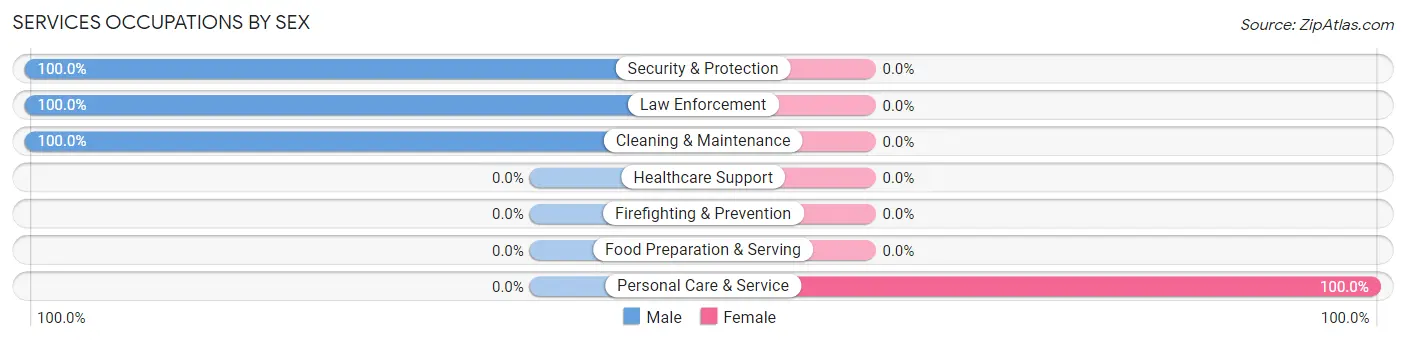
| Occupation | Male | Female |
| Healthcare Support | 0 (0.0%) | 0 (0.0%) |
| Security & Protection | 14 (100.0%) | 0 (0.0%) |
| Firefighting & Prevention | 0 (0.0%) | 0 (0.0%) |
| Law Enforcement | 14 (100.0%) | 0 (0.0%) |
| Food Preparation & Serving | 0 (0.0%) | 0 (0.0%) |
| Cleaning & Maintenance | 15 (100.0%) | 0 (0.0%) |
| Personal Care & Service | 0 (0.0%) | 8 (100.0%) |
| Total (Category) | 29 (78.4%) | 8 (21.6%) |
| Total (Overall) | 262 (50.6%) | 256 (49.4%) |
Sales and Office Occupations
The most common Sales and Office occupations in New Kent are Sales & Related (21 | 4.1%), and Office & Administration (18 | 3.5%).

Sales and Office Occupations by Sex

| Occupation | Male | Female |
| Sales & Related | 21 (100.0%) | 0 (0.0%) |
| Office & Administration | 0 (0.0%) | 18 (100.0%) |
| Total (Category) | 21 (53.8%) | 18 (46.2%) |
| Total (Overall) | 262 (50.6%) | 256 (49.4%) |
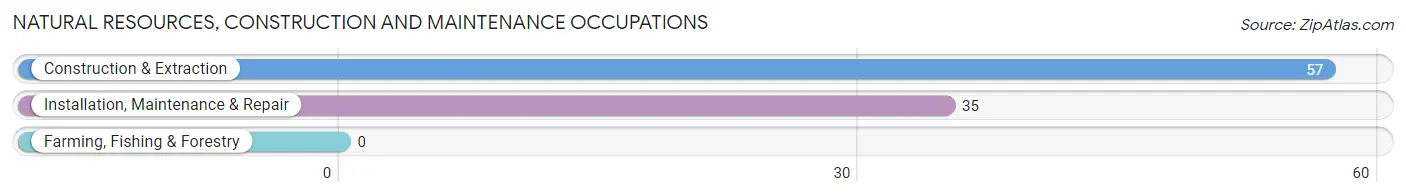
Natural Resources, Construction and Maintenance Occupations
The most common Natural Resources, Construction and Maintenance occupations in New Kent are Construction & Extraction (57 | 11.0%), and Installation, Maintenance & Repair (35 | 6.8%).
Natural Resources, Construction and Maintenance Occupations by Sex

| Occupation | Male | Female |
| Farming, Fishing & Forestry | 0 (0.0%) | 0 (0.0%) |
| Construction & Extraction | 57 (100.0%) | 0 (0.0%) |
| Installation, Maintenance & Repair | 35 (100.0%) | 0 (0.0%) |
| Total (Category) | 92 (100.0%) | 0 (0.0%) |
| Total (Overall) | 262 (50.6%) | 256 (49.4%) |
Production, Transportation and Moving Occupations
The most common Production, Transportation and Moving occupations in New Kent are , and Production (8 | 1.5%).
Production, Transportation and Moving Occupations by Sex
| Occupation | Male | Female |
| Production | 8 (100.0%) | 0 (0.0%) |
| Transportation | 0 (0.0%) | 0 (0.0%) |
| Material Moving | 0 (0.0%) | 0 (0.0%) |
| Total (Category) | 8 (100.0%) | 0 (0.0%) |
| Total (Overall) | 262 (50.6%) | 256 (49.4%) |
Employment Industries by Sex in New Kent
Employment Industries in New Kent
The major employment industries in New Kent include Health Care & Social Assistance (130 | 25.1%), Manufacturing (103 | 19.9%), Public Administration (78 | 15.1%), Professional & Scientific (74 | 14.3%), and Finance & Insurance (35 | 6.8%).
Employment Industries by Sex in New Kent
The New Kent industries that see more men than women are Construction (100.0%), Manufacturing (100.0%), and Retail Trade (100.0%), whereas the industries that tend to have a higher number of women are Professional & Scientific (100.0%), Educational Services (100.0%), and Health Care & Social Assistance (100.0%).
| Industry | Male | Female |
| Agriculture, Fishing & Hunting | 0 (0.0%) | 0 (0.0%) |
| Mining, Quarrying, & Extraction | 0 (0.0%) | 0 (0.0%) |
| Construction | 34 (100.0%) | 0 (0.0%) |
| Manufacturing | 103 (100.0%) | 0 (0.0%) |
| Wholesale Trade | 0 (0.0%) | 0 (0.0%) |
| Retail Trade | 21 (100.0%) | 0 (0.0%) |
| Transportation & Warehousing | 9 (100.0%) | 0 (0.0%) |
| Utilities | 0 (0.0%) | 0 (0.0%) |
| Information | 0 (0.0%) | 0 (0.0%) |
| Finance & Insurance | 9 (25.7%) | 26 (74.3%) |
| Real Estate, Rental & Leasing | 0 (0.0%) | 0 (0.0%) |
| Professional & Scientific | 0 (0.0%) | 74 (100.0%) |
| Enterprise Management | 0 (0.0%) | 0 (0.0%) |
| Administrative & Support | 0 (0.0%) | 0 (0.0%) |
| Educational Services | 0 (0.0%) | 11 (100.0%) |
| Health Care & Social Assistance | 0 (0.0%) | 130 (100.0%) |
| Arts, Entertainment & Recreation | 0 (0.0%) | 8 (100.0%) |
| Accommodation & Food Services | 0 (0.0%) | 0 (0.0%) |
| Public Administration | 71 (91.0%) | 7 (9.0%) |
| Total | 262 (50.6%) | 256 (49.4%) |
Education in New Kent
School Enrollment in New Kent
The most common levels of schooling among the 171 students in New Kent are high school (138 | 80.7%), middle school (19 | 11.1%), and nursery / preschool (8 | 4.7%).
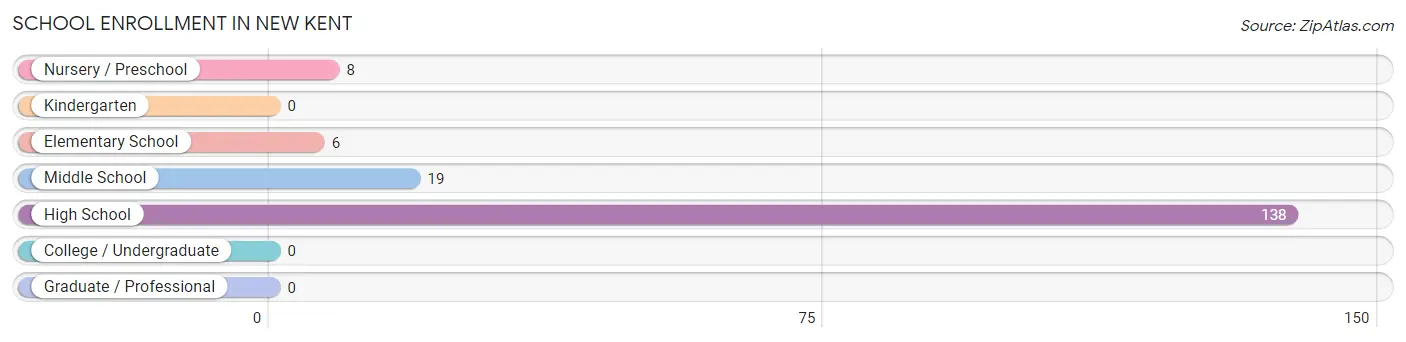
| School Level | # Students | % Students |
| Nursery / Preschool | 8 | 4.7% |
| Kindergarten | 0 | 0.0% |
| Elementary School | 6 | 3.5% |
| Middle School | 19 | 11.1% |
| High School | 138 | 80.7% |
| College / Undergraduate | 0 | 0.0% |
| Graduate / Professional | 0 | 0.0% |
| Total | 171 | 100.0% |
School Enrollment by Age by Funding Source in New Kent
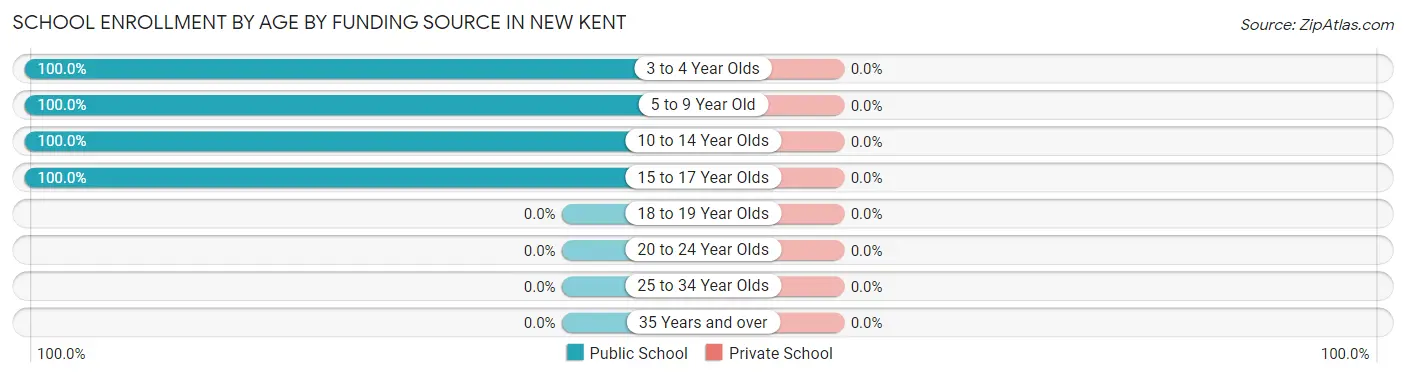
| Age Bracket | Public School | Private School |
| 3 to 4 Year Olds | 8 (100.0%) | 0 (0.0%) |
| 5 to 9 Year Old | 6 (100.0%) | 0 (0.0%) |
| 10 to 14 Year Olds | 125 (100.0%) | 0 (0.0%) |
| 15 to 17 Year Olds | 32 (100.0%) | 0 (0.0%) |
| 18 to 19 Year Olds | 0 (0.0%) | 0 (0.0%) |
| 20 to 24 Year Olds | 0 (0.0%) | 0 (0.0%) |
| 25 to 34 Year Olds | 0 (0.0%) | 0 (0.0%) |
| 35 Years and over | 0 (0.0%) | 0 (0.0%) |
| Total | 171 (100.0%) | 0 (0.0%) |
Educational Attainment by Field of Study in New Kent
Physical & health sciences (66 | 61.7%), science & technology (14 | 13.1%), literature & languages (11 | 10.3%), business (9 | 8.4%), and arts & humanities (7 | 6.5%) are the most common fields of study among 107 individuals in New Kent who have obtained a bachelor's degree or higher.
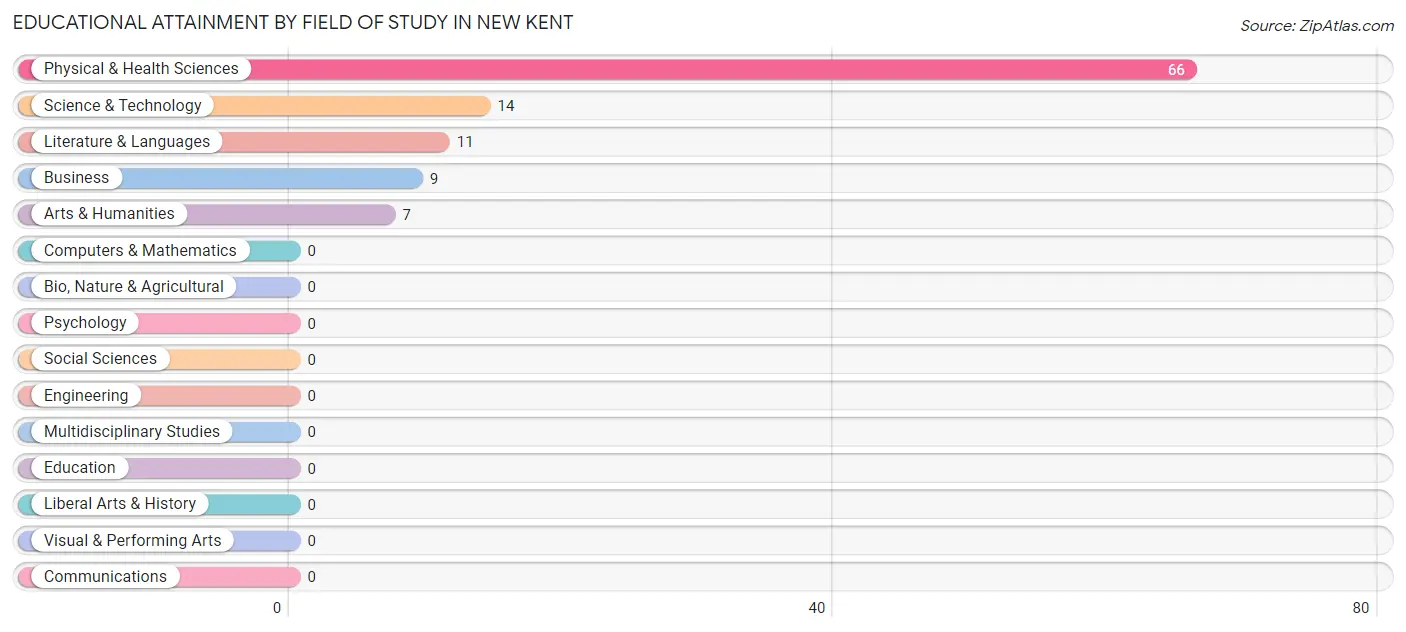
| Field of Study | # Graduates | % Graduates |
| Computers & Mathematics | 0 | 0.0% |
| Bio, Nature & Agricultural | 0 | 0.0% |
| Physical & Health Sciences | 66 | 61.7% |
| Psychology | 0 | 0.0% |
| Social Sciences | 0 | 0.0% |
| Engineering | 0 | 0.0% |
| Multidisciplinary Studies | 0 | 0.0% |
| Science & Technology | 14 | 13.1% |
| Business | 9 | 8.4% |
| Education | 0 | 0.0% |
| Literature & Languages | 11 | 10.3% |
| Liberal Arts & History | 0 | 0.0% |
| Visual & Performing Arts | 0 | 0.0% |
| Communications | 0 | 0.0% |
| Arts & Humanities | 7 | 6.5% |
| Total | 107 | 100.0% |
Transportation & Commute in New Kent
Vehicle Availability by Sex in New Kent
The most prevalent vehicle ownership categories in New Kent are males with 5 or more vehicles (85, accounting for 35.9%) and females with 5 or more vehicles (88, making up 33.2%).
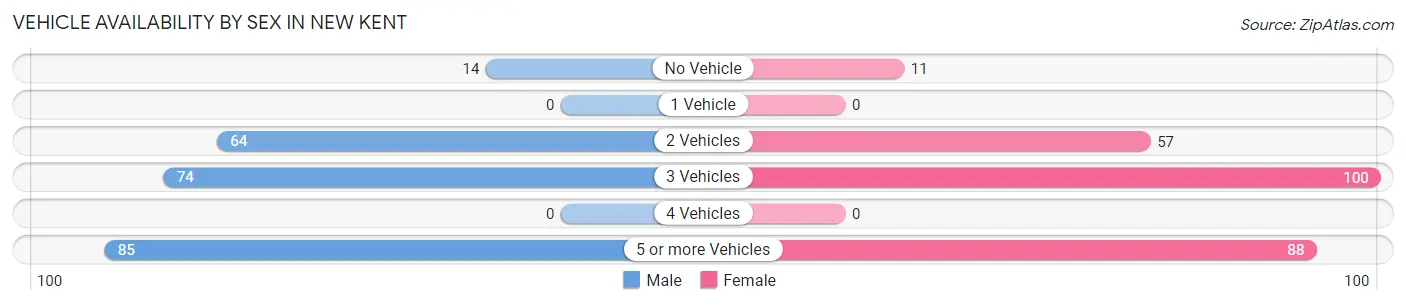
| Vehicles Available | Male | Female |
| No Vehicle | 14 (5.9%) | 11 (4.3%) |
| 1 Vehicle | 0 (0.0%) | 0 (0.0%) |
| 2 Vehicles | 64 (27.0%) | 57 (22.3%) |
| 3 Vehicles | 74 (31.2%) | 100 (39.1%) |
| 4 Vehicles | 0 (0.0%) | 0 (0.0%) |
| 5 or more Vehicles | 85 (35.9%) | 88 (34.4%) |
| Total | 237 (100.0%) | 256 (100.0%) |
Commute Time in New Kent
The most frequently occuring commute durations in New Kent are 30 to 34 minutes (143 commuters, 34.1%), 45 to 59 minutes (124 commuters, 29.5%), and 40 to 44 minutes (85 commuters, 20.2%).
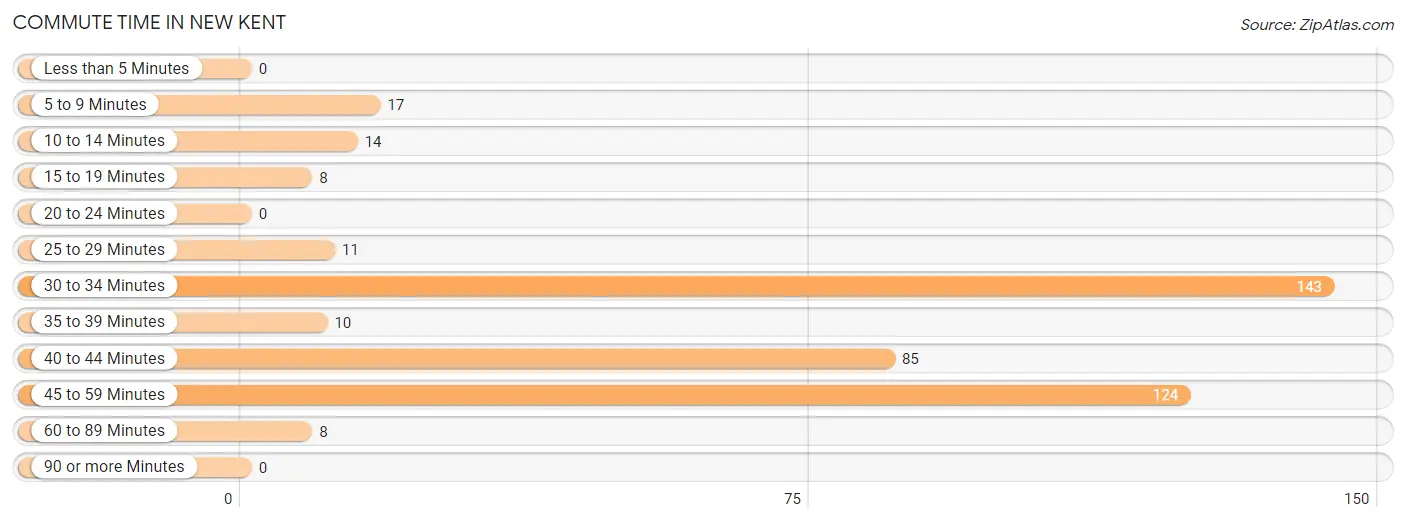
| Commute Time | # Commuters | % Commuters |
| Less than 5 Minutes | 0 | 0.0% |
| 5 to 9 Minutes | 17 | 4.1% |
| 10 to 14 Minutes | 14 | 3.3% |
| 15 to 19 Minutes | 8 | 1.9% |
| 20 to 24 Minutes | 0 | 0.0% |
| 25 to 29 Minutes | 11 | 2.6% |
| 30 to 34 Minutes | 143 | 34.1% |
| 35 to 39 Minutes | 10 | 2.4% |
| 40 to 44 Minutes | 85 | 20.2% |
| 45 to 59 Minutes | 124 | 29.5% |
| 60 to 89 Minutes | 8 | 1.9% |
| 90 or more Minutes | 0 | 0.0% |
Commute Time by Sex in New Kent
The most common commute times in New Kent are 30 to 34 minutes (101 commuters, 42.6%) for males and 45 to 59 minutes (106 commuters, 57.9%) for females.
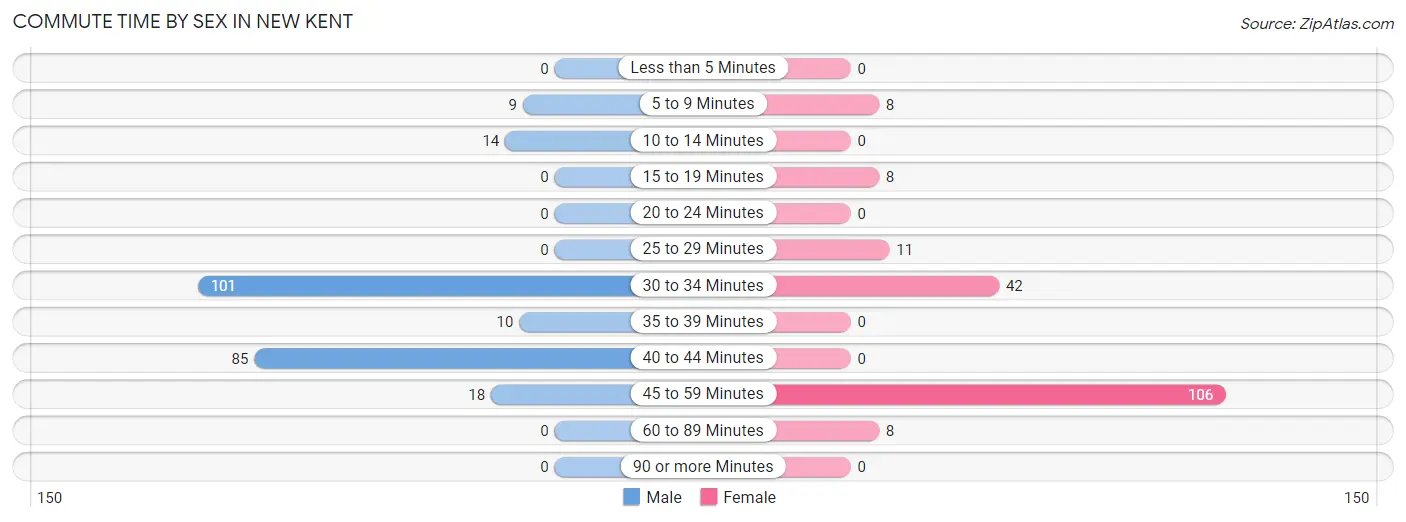
| Commute Time | Male | Female |
| Less than 5 Minutes | 0 (0.0%) | 0 (0.0%) |
| 5 to 9 Minutes | 9 (3.8%) | 8 (4.4%) |
| 10 to 14 Minutes | 14 (5.9%) | 0 (0.0%) |
| 15 to 19 Minutes | 0 (0.0%) | 8 (4.4%) |
| 20 to 24 Minutes | 0 (0.0%) | 0 (0.0%) |
| 25 to 29 Minutes | 0 (0.0%) | 11 (6.0%) |
| 30 to 34 Minutes | 101 (42.6%) | 42 (23.0%) |
| 35 to 39 Minutes | 10 (4.2%) | 0 (0.0%) |
| 40 to 44 Minutes | 85 (35.9%) | 0 (0.0%) |
| 45 to 59 Minutes | 18 (7.6%) | 106 (57.9%) |
| 60 to 89 Minutes | 0 (0.0%) | 8 (4.4%) |
| 90 or more Minutes | 0 (0.0%) | 0 (0.0%) |
Time of Departure to Work by Sex in New Kent
The most frequent times of departure to work in New Kent are 5:00 AM to 5:29 AM (85, 35.9%) for males and 7:00 AM to 7:29 AM (88, 48.1%) for females.
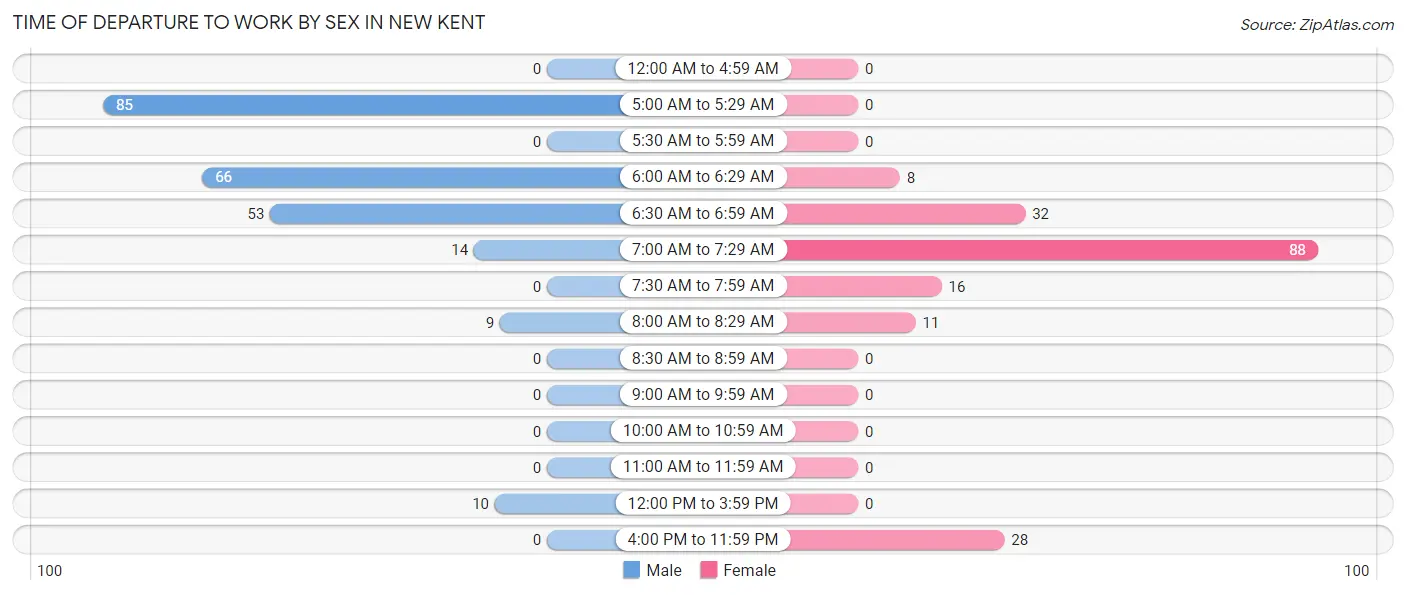
| Time of Departure | Male | Female |
| 12:00 AM to 4:59 AM | 0 (0.0%) | 0 (0.0%) |
| 5:00 AM to 5:29 AM | 85 (35.9%) | 0 (0.0%) |
| 5:30 AM to 5:59 AM | 0 (0.0%) | 0 (0.0%) |
| 6:00 AM to 6:29 AM | 66 (27.9%) | 8 (4.4%) |
| 6:30 AM to 6:59 AM | 53 (22.4%) | 32 (17.5%) |
| 7:00 AM to 7:29 AM | 14 (5.9%) | 88 (48.1%) |
| 7:30 AM to 7:59 AM | 0 (0.0%) | 16 (8.7%) |
| 8:00 AM to 8:29 AM | 9 (3.8%) | 11 (6.0%) |
| 8:30 AM to 8:59 AM | 0 (0.0%) | 0 (0.0%) |
| 9:00 AM to 9:59 AM | 0 (0.0%) | 0 (0.0%) |
| 10:00 AM to 10:59 AM | 0 (0.0%) | 0 (0.0%) |
| 11:00 AM to 11:59 AM | 0 (0.0%) | 0 (0.0%) |
| 12:00 PM to 3:59 PM | 10 (4.2%) | 0 (0.0%) |
| 4:00 PM to 11:59 PM | 0 (0.0%) | 28 (15.3%) |
| Total | 237 (100.0%) | 183 (100.0%) |
Housing Occupancy in New Kent
Occupancy by Ownership in New Kent
Of the total 273 dwellings in New Kent, owner-occupied units account for 273 (100.0%), while renter-occupied units make up 0 (0.0%).
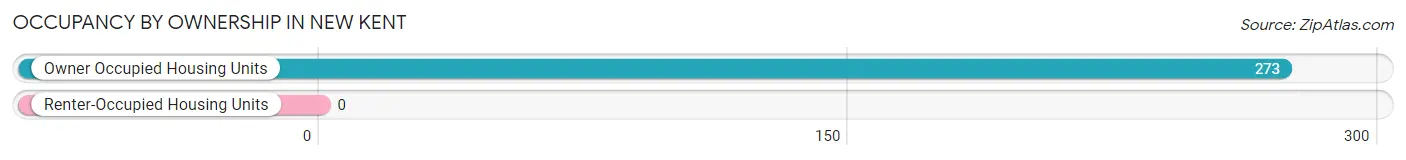
| Occupancy | # Housing Units | % Housing Units |
| Owner Occupied Housing Units | 273 | 100.0% |
| Renter-Occupied Housing Units | 0 | 0.0% |
| Total Occupied Housing Units | 273 | 100.0% |
Occupancy by Household Size in New Kent
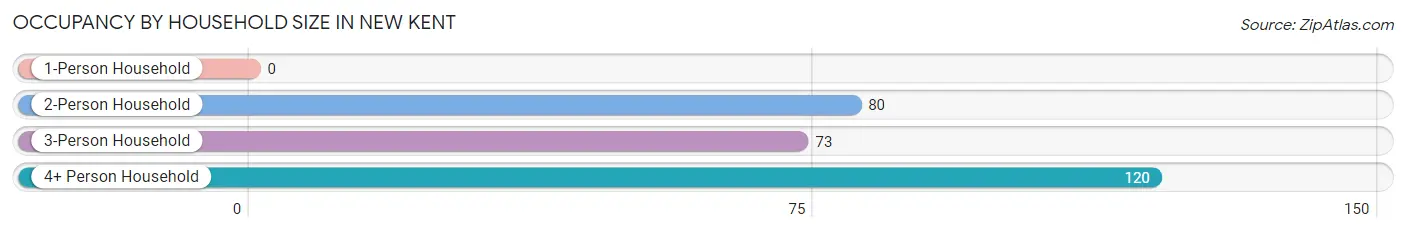
| Household Size | # Housing Units | % Housing Units |
| 1-Person Household | 0 | 0.0% |
| 2-Person Household | 80 | 29.3% |
| 3-Person Household | 73 | 26.7% |
| 4+ Person Household | 120 | 44.0% |
| Total Housing Units | 273 | 100.0% |
Occupancy by Ownership by Household Size in New Kent
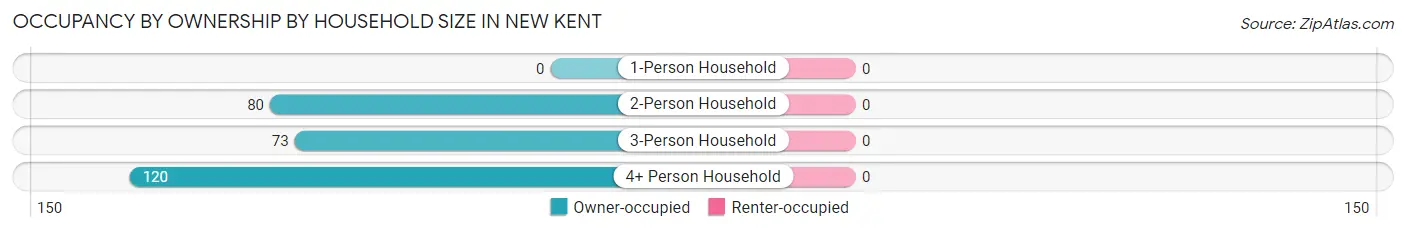
| Household Size | Owner-occupied | Renter-occupied |
| 1-Person Household | 0 (0.0%) | 0 (0.0%) |
| 2-Person Household | 80 (100.0%) | 0 (0.0%) |
| 3-Person Household | 73 (100.0%) | 0 (0.0%) |
| 4+ Person Household | 120 (100.0%) | 0 (0.0%) |
| Total Housing Units | 273 (100.0%) | 0 (0.0%) |
Occupancy by Educational Attainment in New Kent
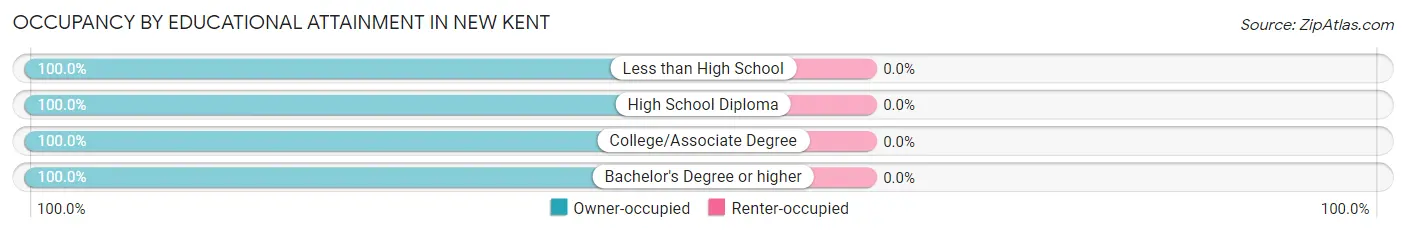
| Household Size | Owner-occupied | Renter-occupied |
| Less than High School | 14 (100.0%) | 0 (0.0%) |
| High School Diploma | 18 (100.0%) | 0 (0.0%) |
| College/Associate Degree | 159 (100.0%) | 0 (0.0%) |
| Bachelor's Degree or higher | 82 (100.0%) | 0 (0.0%) |
Occupancy by Age of Householder in New Kent
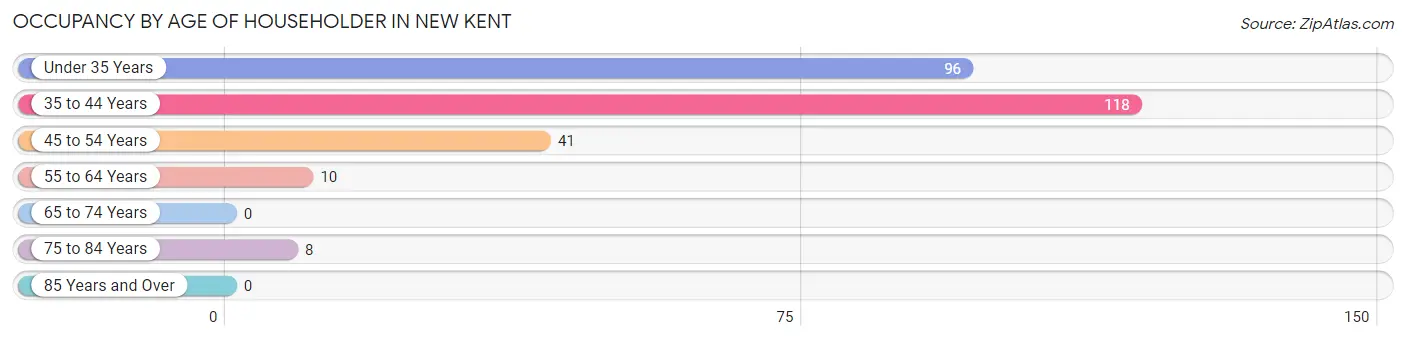
| Age Bracket | # Households | % Households |
| Under 35 Years | 96 | 35.2% |
| 35 to 44 Years | 118 | 43.2% |
| 45 to 54 Years | 41 | 15.0% |
| 55 to 64 Years | 10 | 3.7% |
| 65 to 74 Years | 0 | 0.0% |
| 75 to 84 Years | 8 | 2.9% |
| 85 Years and Over | 0 | 0.0% |
| Total | 273 | 100.0% |
Housing Finances in New Kent
Median Income by Occupancy in New Kent
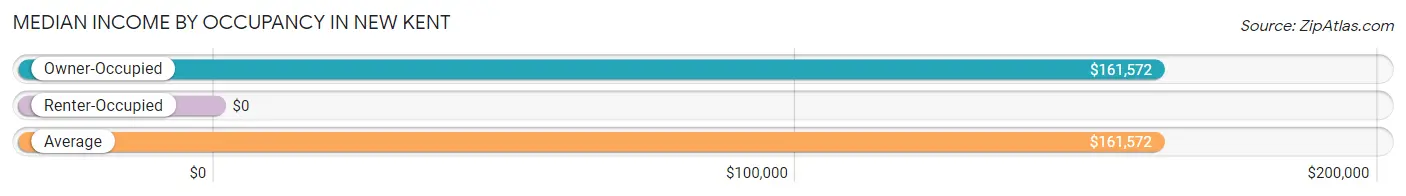
| Occupancy Type | # Households | Median Income |
| Owner-Occupied | 273 (100.0%) | $161,572 |
| Renter-Occupied | 0 (0.0%) | $0 |
| Average | 273 (100.0%) | $161,572 |
Occupancy by Householder Income Bracket in New Kent
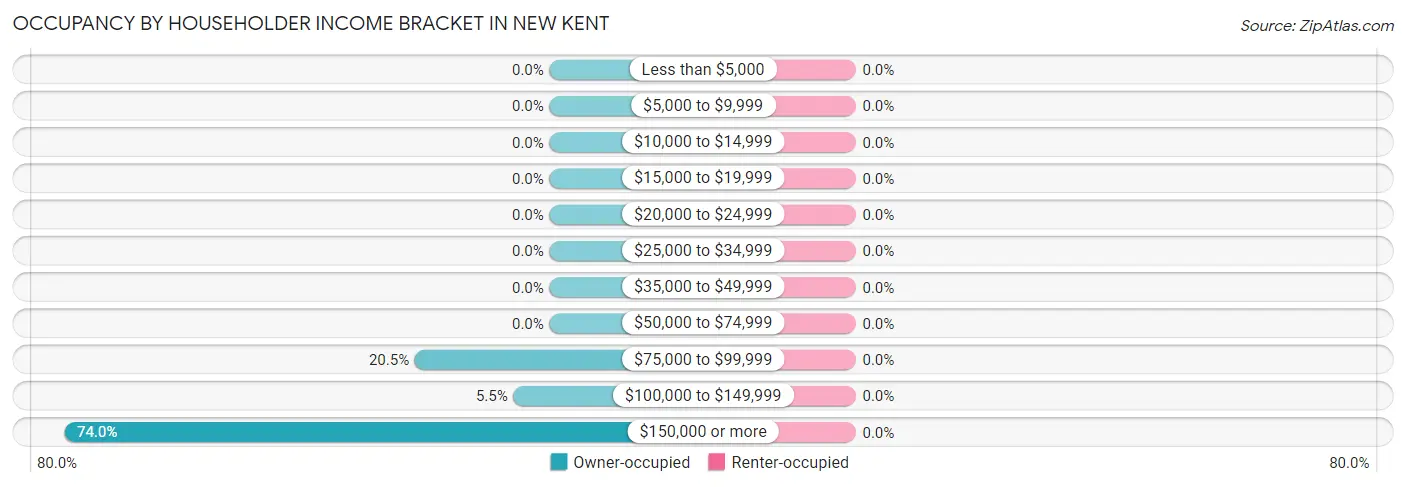
| Income Bracket | Owner-occupied | Renter-occupied |
| Less than $5,000 | 0 (0.0%) | 0 (0.0%) |
| $5,000 to $9,999 | 0 (0.0%) | 0 (0.0%) |
| $10,000 to $14,999 | 0 (0.0%) | 0 (0.0%) |
| $15,000 to $19,999 | 0 (0.0%) | 0 (0.0%) |
| $20,000 to $24,999 | 0 (0.0%) | 0 (0.0%) |
| $25,000 to $34,999 | 0 (0.0%) | 0 (0.0%) |
| $35,000 to $49,999 | 0 (0.0%) | 0 (0.0%) |
| $50,000 to $74,999 | 0 (0.0%) | 0 (0.0%) |
| $75,000 to $99,999 | 56 (20.5%) | 0 (0.0%) |
| $100,000 to $149,999 | 15 (5.5%) | 0 (0.0%) |
| $150,000 or more | 202 (74.0%) | 0 (0.0%) |
| Total | 273 (100.0%) | 0 (0.0%) |
Monthly Housing Cost Tiers in New Kent
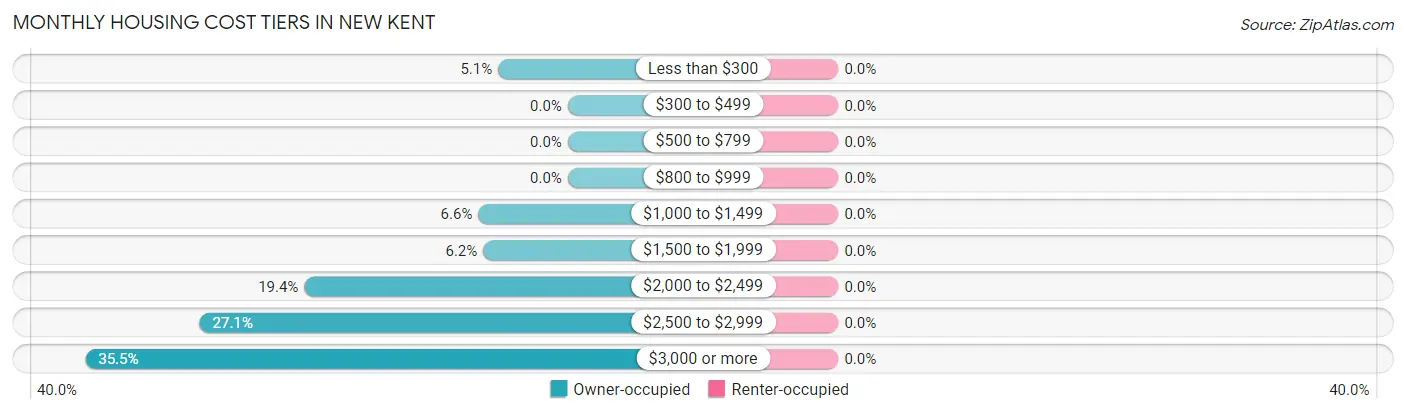
| Monthly Cost | Owner-occupied | Renter-occupied |
| Less than $300 | 14 (5.1%) | 0 (0.0%) |
| $300 to $499 | 0 (0.0%) | 0 (0.0%) |
| $500 to $799 | 0 (0.0%) | 0 (0.0%) |
| $800 to $999 | 0 (0.0%) | 0 (0.0%) |
| $1,000 to $1,499 | 18 (6.6%) | 0 (0.0%) |
| $1,500 to $1,999 | 17 (6.2%) | 0 (0.0%) |
| $2,000 to $2,499 | 53 (19.4%) | 0 (0.0%) |
| $2,500 to $2,999 | 74 (27.1%) | 0 (0.0%) |
| $3,000 or more | 97 (35.5%) | 0 (0.0%) |
| Total | 273 (100.0%) | 0 (0.0%) |
Physical Housing Characteristics in New Kent
Housing Structures in New Kent
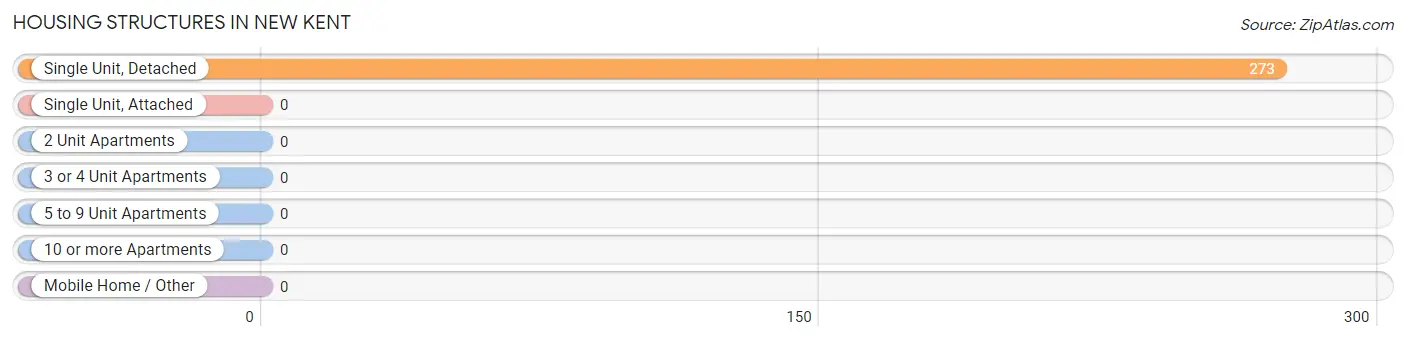
| Structure Type | # Housing Units | % Housing Units |
| Single Unit, Detached | 273 | 100.0% |
| Single Unit, Attached | 0 | 0.0% |
| 2 Unit Apartments | 0 | 0.0% |
| 3 or 4 Unit Apartments | 0 | 0.0% |
| 5 to 9 Unit Apartments | 0 | 0.0% |
| 10 or more Apartments | 0 | 0.0% |
| Mobile Home / Other | 0 | 0.0% |
| Total | 273 | 100.0% |
Housing Structures by Occupancy in New Kent
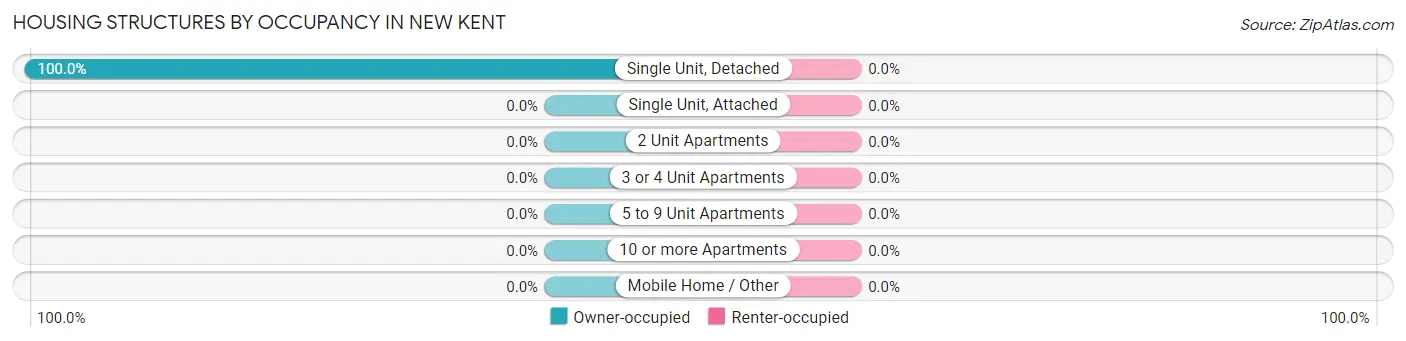
| Structure Type | Owner-occupied | Renter-occupied |
| Single Unit, Detached | 273 (100.0%) | 0 (0.0%) |
| Single Unit, Attached | 0 (0.0%) | 0 (0.0%) |
| 2 Unit Apartments | 0 (0.0%) | 0 (0.0%) |
| 3 or 4 Unit Apartments | 0 (0.0%) | 0 (0.0%) |
| 5 to 9 Unit Apartments | 0 (0.0%) | 0 (0.0%) |
| 10 or more Apartments | 0 (0.0%) | 0 (0.0%) |
| Mobile Home / Other | 0 (0.0%) | 0 (0.0%) |
| Total | 273 (100.0%) | 0 (0.0%) |
Housing Structures by Number of Rooms in New Kent
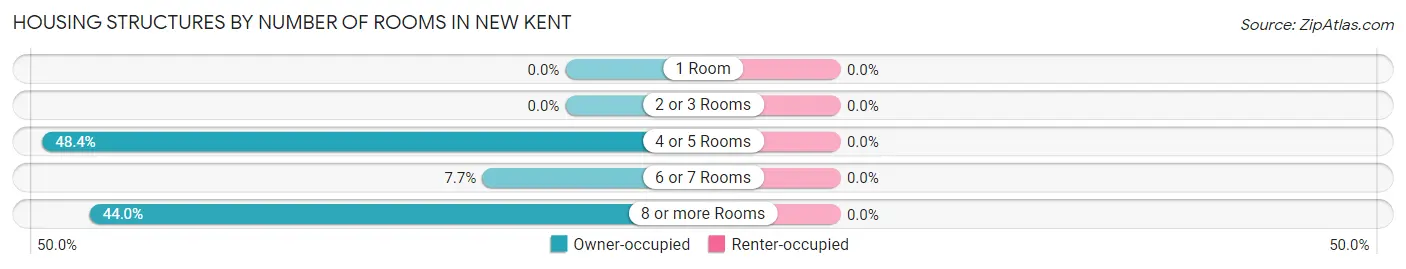
| Number of Rooms | Owner-occupied | Renter-occupied |
| 1 Room | 0 (0.0%) | 0 (0.0%) |
| 2 or 3 Rooms | 0 (0.0%) | 0 (0.0%) |
| 4 or 5 Rooms | 132 (48.3%) | 0 (0.0%) |
| 6 or 7 Rooms | 21 (7.7%) | 0 (0.0%) |
| 8 or more Rooms | 120 (44.0%) | 0 (0.0%) |
| Total | 273 (100.0%) | 0 (0.0%) |
Housing Structure by Heating Type in New Kent
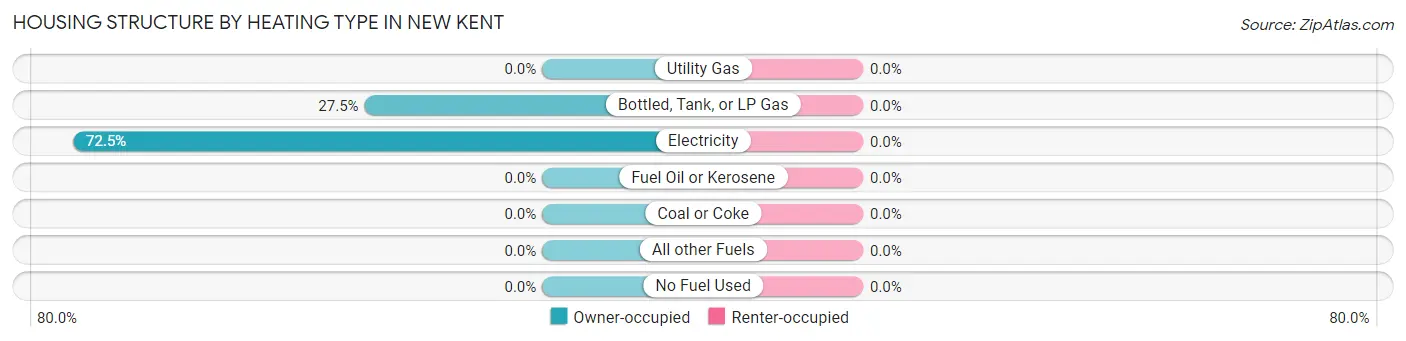
| Heating Type | Owner-occupied | Renter-occupied |
| Utility Gas | 0 (0.0%) | 0 (0.0%) |
| Bottled, Tank, or LP Gas | 75 (27.5%) | 0 (0.0%) |
| Electricity | 198 (72.5%) | 0 (0.0%) |
| Fuel Oil or Kerosene | 0 (0.0%) | 0 (0.0%) |
| Coal or Coke | 0 (0.0%) | 0 (0.0%) |
| All other Fuels | 0 (0.0%) | 0 (0.0%) |
| No Fuel Used | 0 (0.0%) | 0 (0.0%) |
| Total | 273 (100.0%) | 0 (0.0%) |
Household Vehicle Usage in New Kent
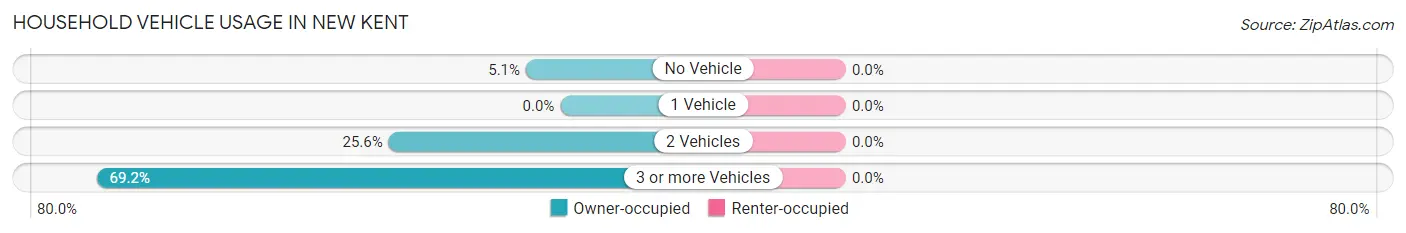
| Vehicles per Household | Owner-occupied | Renter-occupied |
| No Vehicle | 14 (5.1%) | 0 (0.0%) |
| 1 Vehicle | 0 (0.0%) | 0 (0.0%) |
| 2 Vehicles | 70 (25.6%) | 0 (0.0%) |
| 3 or more Vehicles | 189 (69.2%) | 0 (0.0%) |
| Total | 273 (100.0%) | 0 (0.0%) |
Real Estate & Mortgages in New Kent
Real Estate and Mortgage Overview in New Kent
| Characteristic | Without Mortgage | With Mortgage |
| Housing Units | 14 | 259 |
| Median Property Value | - | - |
| Median Household Income | - | - |
| Monthly Housing Costs | - | - |
| Real Estate Taxes | - | - |
Property Value by Mortgage Status in New Kent
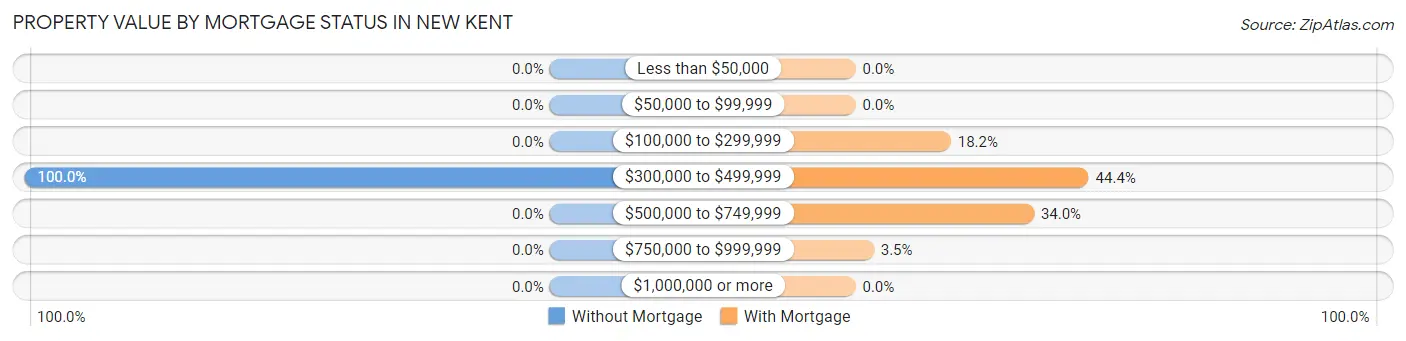
| Property Value | Without Mortgage | With Mortgage |
| Less than $50,000 | 0 (0.0%) | 0 (0.0%) |
| $50,000 to $99,999 | 0 (0.0%) | 0 (0.0%) |
| $100,000 to $299,999 | 0 (0.0%) | 47 (18.1%) |
| $300,000 to $499,999 | 14 (100.0%) | 115 (44.4%) |
| $500,000 to $749,999 | 0 (0.0%) | 88 (34.0%) |
| $750,000 to $999,999 | 0 (0.0%) | 9 (3.5%) |
| $1,000,000 or more | 0 (0.0%) | 0 (0.0%) |
| Total | 14 (100.0%) | 259 (100.0%) |
Household Income by Mortgage Status in New Kent
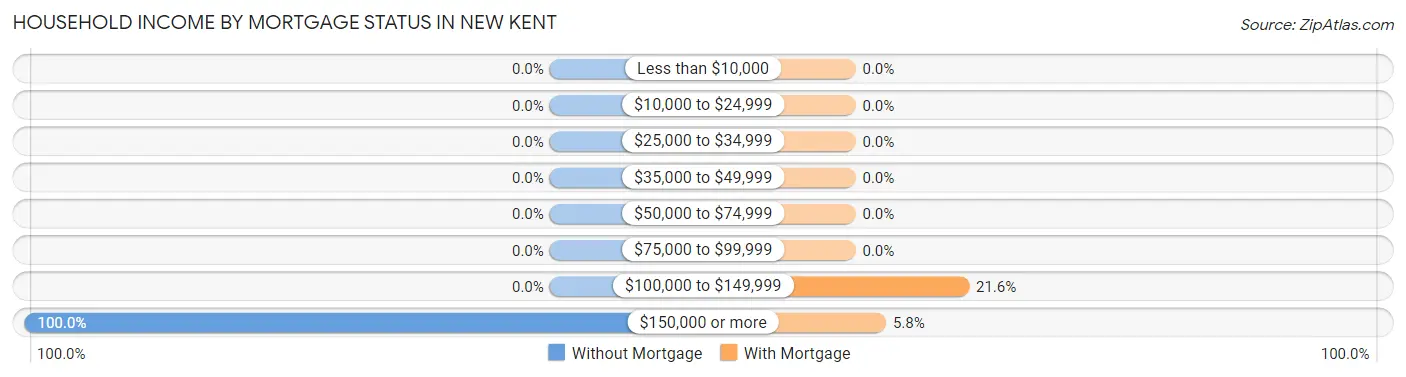
| Household Income | Without Mortgage | With Mortgage |
| Less than $10,000 | 0 (0.0%) | 0 (0.0%) |
| $10,000 to $24,999 | 0 (0.0%) | 0 (0.0%) |
| $25,000 to $34,999 | 0 (0.0%) | 0 (0.0%) |
| $35,000 to $49,999 | 0 (0.0%) | 0 (0.0%) |
| $50,000 to $74,999 | 0 (0.0%) | 0 (0.0%) |
| $75,000 to $99,999 | 0 (0.0%) | 0 (0.0%) |
| $100,000 to $149,999 | 0 (0.0%) | 56 (21.6%) |
| $150,000 or more | 14 (100.0%) | 15 (5.8%) |
| Total | 14 (100.0%) | 259 (100.0%) |
Property Value to Household Income Ratio in New Kent
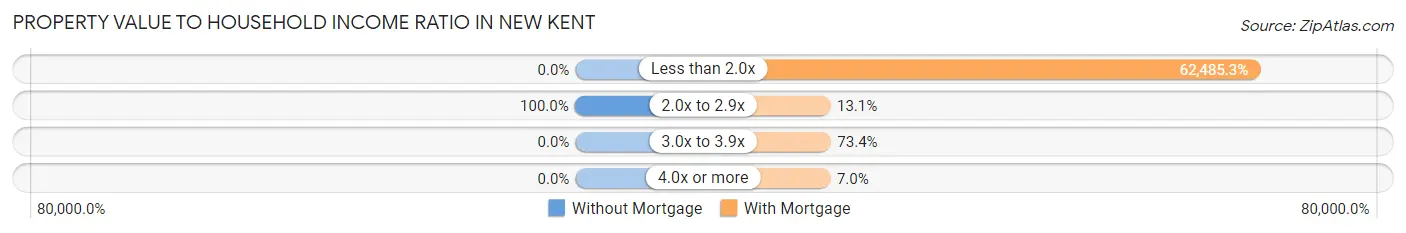
| Value-to-Income Ratio | Without Mortgage | With Mortgage |
| Less than 2.0x | 0 (0.0%) | 161,837 (62,485.3%) |
| 2.0x to 2.9x | 14 (100.0%) | 34 (13.1%) |
| 3.0x to 3.9x | 0 (0.0%) | 190 (73.4%) |
| 4.0x or more | 0 (0.0%) | 18 (7.0%) |
| Total | 14 (100.0%) | 259 (100.0%) |
Real Estate Taxes by Mortgage Status in New Kent
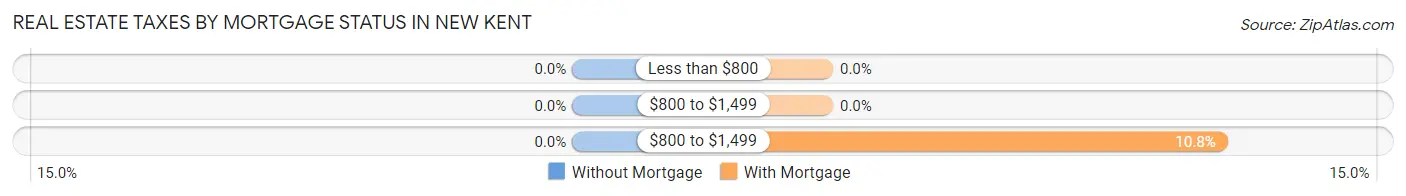
| Property Taxes | Without Mortgage | With Mortgage |
| Less than $800 | 0 (0.0%) | 0 (0.0%) |
| $800 to $1,499 | 0 (0.0%) | 0 (0.0%) |
| $800 to $1,499 | 0 (0.0%) | 28 (10.8%) |
| Total | 14 (100.0%) | 259 (100.0%) |
Health & Disability in New Kent
Health Insurance Coverage by Age in New Kent
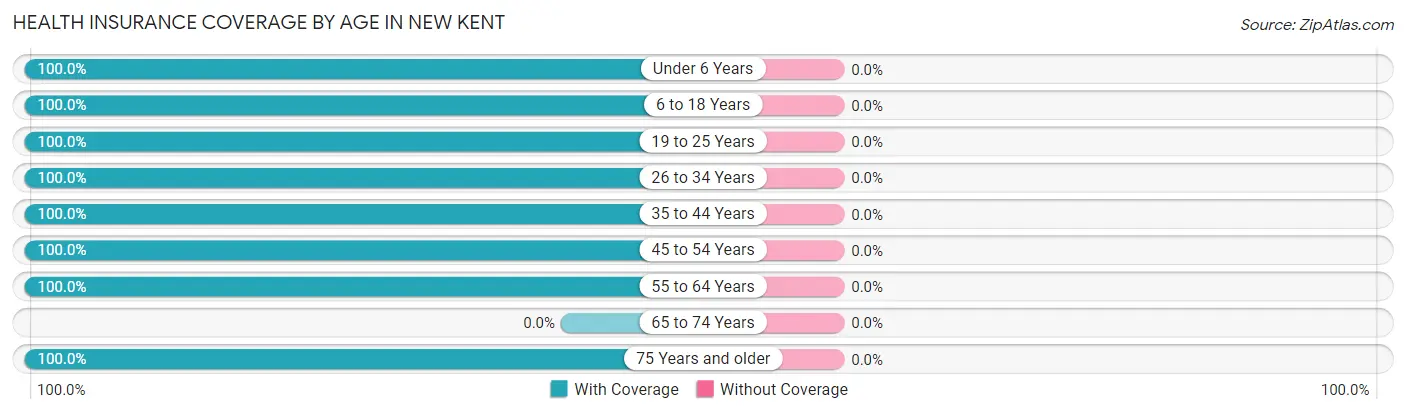
| Age Bracket | With Coverage | Without Coverage |
| Under 6 Years | 74 (100.0%) | 0 (0.0%) |
| 6 to 18 Years | 163 (100.0%) | 0 (0.0%) |
| 19 to 25 Years | 74 (100.0%) | 0 (0.0%) |
| 26 to 34 Years | 162 (100.0%) | 0 (0.0%) |
| 35 to 44 Years | 234 (100.0%) | 0 (0.0%) |
| 45 to 54 Years | 60 (100.0%) | 0 (0.0%) |
| 55 to 64 Years | 10 (100.0%) | 0 (0.0%) |
| 65 to 74 Years | 0 (0.0%) | 0 (0.0%) |
| 75 Years and older | 19 (100.0%) | 0 (0.0%) |
| Total | 796 (100.0%) | 0 (0.0%) |
Health Insurance Coverage by Citizenship Status in New Kent
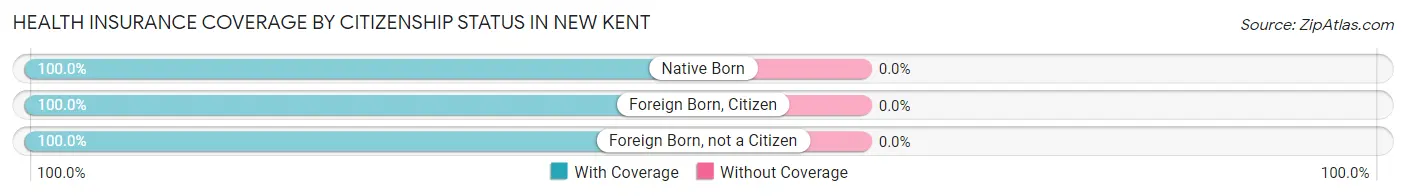
| Citizenship Status | With Coverage | Without Coverage |
| Native Born | 74 (100.0%) | 0 (0.0%) |
| Foreign Born, Citizen | 163 (100.0%) | 0 (0.0%) |
| Foreign Born, not a Citizen | 74 (100.0%) | 0 (0.0%) |
Health Insurance Coverage by Household Income in New Kent
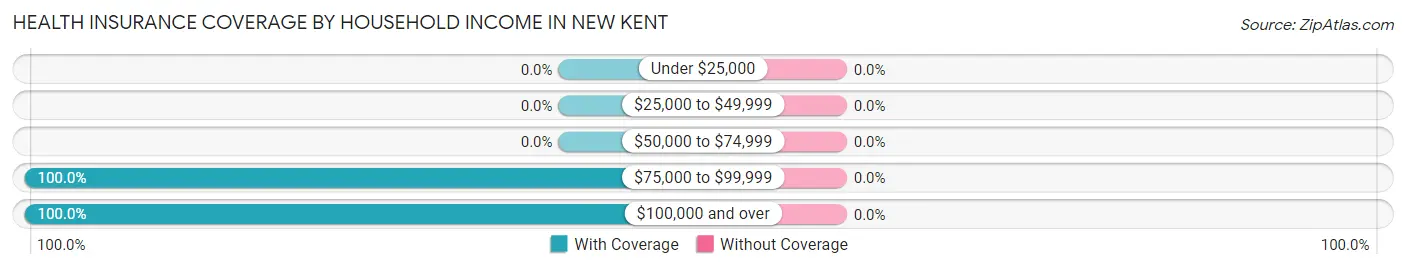
| Household Income | With Coverage | Without Coverage |
| Under $25,000 | 0 (0.0%) | 0 (0.0%) |
| $25,000 to $49,999 | 0 (0.0%) | 0 (0.0%) |
| $50,000 to $74,999 | 0 (0.0%) | 0 (0.0%) |
| $75,000 to $99,999 | 128 (100.0%) | 0 (0.0%) |
| $100,000 and over | 668 (100.0%) | 0 (0.0%) |
Public vs Private Health Insurance Coverage by Age in New Kent
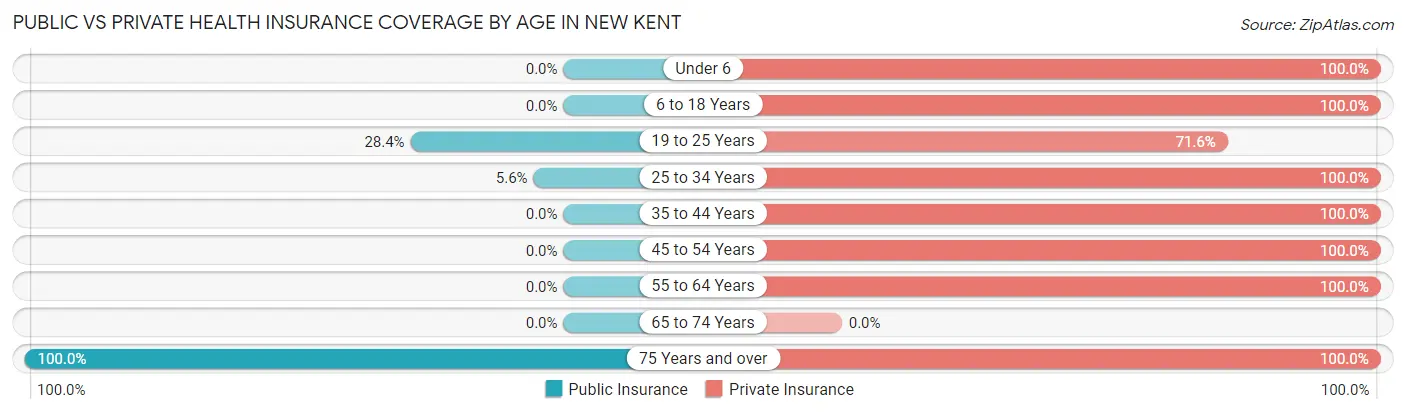
| Age Bracket | Public Insurance | Private Insurance |
| Under 6 | 0 (0.0%) | 74 (100.0%) |
| 6 to 18 Years | 0 (0.0%) | 163 (100.0%) |
| 19 to 25 Years | 21 (28.4%) | 53 (71.6%) |
| 25 to 34 Years | 9 (5.6%) | 162 (100.0%) |
| 35 to 44 Years | 0 (0.0%) | 234 (100.0%) |
| 45 to 54 Years | 0 (0.0%) | 60 (100.0%) |
| 55 to 64 Years | 0 (0.0%) | 10 (100.0%) |
| 65 to 74 Years | 0 (0.0%) | 0 (0.0%) |
| 75 Years and over | 19 (100.0%) | 19 (100.0%) |
| Total | 49 (6.2%) | 775 (97.4%) |
Disability Status by Sex by Age in New Kent
| Age Bracket | Male | Female |
| Under 5 Years | 0 (0.0%) | 0 (0.0%) |
| 5 to 17 Years | 0 (0.0%) | 0 (0.0%) |
| 18 to 34 Years | 0 (0.0%) | 0 (0.0%) |
| 35 to 64 Years | 0 (0.0%) | 0 (0.0%) |
| 65 to 74 Years | 0 (0.0%) | 0 (0.0%) |
| 75 Years and over | 0 (0.0%) | 0 (0.0%) |
Disability Class by Sex by Age in New Kent
Disability Class: Hearing Difficulty
| Age Bracket | Male | Female |
| Under 5 Years | 0 (0.0%) | 0 (0.0%) |
| 5 to 17 Years | 0 (0.0%) | 0 (0.0%) |
| 18 to 34 Years | 0 (0.0%) | 0 (0.0%) |
| 35 to 64 Years | 0 (0.0%) | 0 (0.0%) |
| 65 to 74 Years | 0 (0.0%) | 0 (0.0%) |
| 75 Years and over | 0 (0.0%) | 0 (0.0%) |
Disability Class: Vision Difficulty
| Age Bracket | Male | Female |
| Under 5 Years | 0 (0.0%) | 0 (0.0%) |
| 5 to 17 Years | 0 (0.0%) | 0 (0.0%) |
| 18 to 34 Years | 0 (0.0%) | 0 (0.0%) |
| 35 to 64 Years | 0 (0.0%) | 0 (0.0%) |
| 65 to 74 Years | 0 (0.0%) | 0 (0.0%) |
| 75 Years and over | 0 (0.0%) | 0 (0.0%) |
Disability Class: Cognitive Difficulty
| Age Bracket | Male | Female |
| 5 to 17 Years | 0 (0.0%) | 0 (0.0%) |
| 18 to 34 Years | 0 (0.0%) | 0 (0.0%) |
| 35 to 64 Years | 0 (0.0%) | 0 (0.0%) |
| 65 to 74 Years | 0 (0.0%) | 0 (0.0%) |
| 75 Years and over | 0 (0.0%) | 0 (0.0%) |
Disability Class: Ambulatory Difficulty
| Age Bracket | Male | Female |
| 5 to 17 Years | 0 (0.0%) | 0 (0.0%) |
| 18 to 34 Years | 0 (0.0%) | 0 (0.0%) |
| 35 to 64 Years | 0 (0.0%) | 0 (0.0%) |
| 65 to 74 Years | 0 (0.0%) | 0 (0.0%) |
| 75 Years and over | 0 (0.0%) | 0 (0.0%) |
Disability Class: Self-Care Difficulty
| Age Bracket | Male | Female |
| 5 to 17 Years | 0 (0.0%) | 0 (0.0%) |
| 18 to 34 Years | 0 (0.0%) | 0 (0.0%) |
| 35 to 64 Years | 0 (0.0%) | 0 (0.0%) |
| 65 to 74 Years | 0 (0.0%) | 0 (0.0%) |
| 75 Years and over | 0 (0.0%) | 0 (0.0%) |
Technology Access in New Kent
Computing Device Access in New Kent
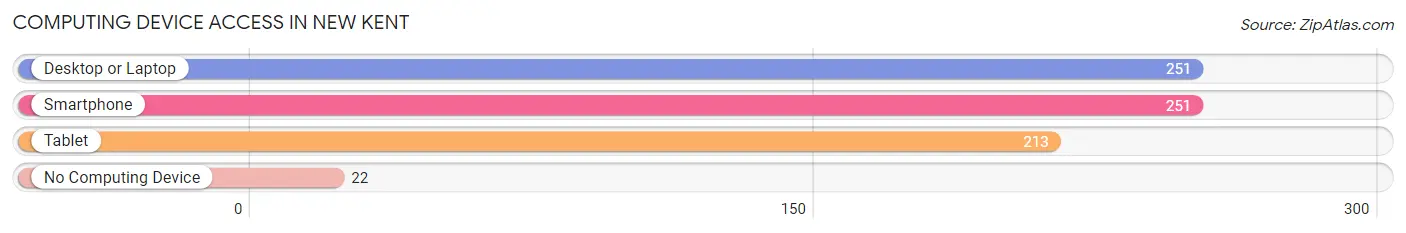
| Device Type | # Households | % Households |
| Desktop or Laptop | 251 | 91.9% |
| Smartphone | 251 | 91.9% |
| Tablet | 213 | 78.0% |
| No Computing Device | 22 | 8.1% |
| Total | 273 | 100.0% |
Internet Access in New Kent
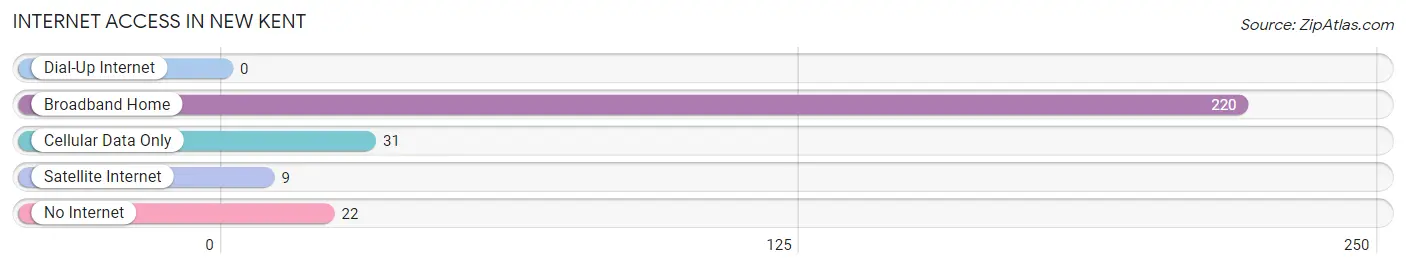
| Internet Type | # Households | % Households |
| Dial-Up Internet | 0 | 0.0% |
| Broadband Home | 220 | 80.6% |
| Cellular Data Only | 31 | 11.4% |
| Satellite Internet | 9 | 3.3% |
| No Internet | 22 | 8.1% |
| Total | 273 | 100.0% |
New Kent Summary
Kent is a small unincorporated community located in New Kent County, Virginia. It is situated on the south bank of the Pamunkey River, approximately 25 miles east of Richmond. The community is part of the Richmond-Petersburg metropolitan area and is home to a population of approximately 1,000 people.
History
The area that is now New Kent was first settled by English colonists in the early 1600s. The area was originally part of New Kent County, which was created in 1654. The county was named after the English county of Kent, and the name “New Kent” was chosen to distinguish it from the original county.
The area was initially used for farming and timber production, and the first settlers built a small village near the Pamunkey River. The village was known as “New Kent Courthouse” and was the county seat of New Kent County.
In the late 1700s, the area began to experience rapid growth due to the construction of the Richmond-Petersburg Turnpike, which connected Richmond to Petersburg. This new road made it easier for people to travel between the two cities, and the population of New Kent began to grow.
In the early 1800s, the area was home to several large plantations, and the population of New Kent continued to grow. By the mid-1800s, the population had reached approximately 1,000 people.
Geography
New Kent is located in the southeastern part of Virginia, approximately 25 miles east of Richmond. The community is situated on the south bank of the Pamunkey River, and is part of the Richmond-Petersburg metropolitan area.
The area is mostly flat, with some rolling hills in the northern part of the county. The climate is humid subtropical, with hot, humid summers and mild winters.
Economy
The economy of New Kent is largely based on agriculture and timber production. The area is home to several large farms, and the timber industry is also an important part of the local economy.
In addition, the area is home to several small businesses, including restaurants, retail stores, and service providers. The area is also home to a number of manufacturing companies, including a furniture factory and a paper mill.
Demographics
As of the 2010 census, the population of New Kent was 1,068. The racial makeup of the community was 94.3% White, 3.2% African American, 0.3% Native American, 0.2% Asian, 0.1% Pacific Islander, and 1.9% from other races.
The median household income in New Kent was $50,938, and the median family income was $60,938. The per capita income was $25,938. The poverty rate was 8.3%.
Conclusion
New Kent is a small unincorporated community located in New Kent County, Virginia. It is situated on the south bank of the Pamunkey River, approximately 25 miles east of Richmond. The community is part of the Richmond-Petersburg metropolitan area and is home to a population of approximately 1,000 people. The economy of New Kent is largely based on agriculture and timber production, and the area is also home to several small businesses. The racial makeup of the community is 94.3% White, 3.2% African American, 0.3% Native American, 0.2% Asian, 0.1% Pacific Islander, and 1.9% from other races. The median household income in New Kent was $50,938, and the poverty rate was 8.3%.
Common Questions
What is the Total Population of New Kent?
Total Population of New Kent is 796.
What is the Total Male Population of New Kent?
Total Male Population of New Kent is 339.
What is the Total Female Population of New Kent?
Total Female Population of New Kent is 457.
What is the Ratio of Males per 100 Females in New Kent?
There are 74.18 Males per 100 Females in New Kent.
What is the Ratio of Females per 100 Males in New Kent?
There are 134.81 Females per 100 Males in New Kent.
What is the Median Population Age in New Kent?
Median Population Age in New Kent is 31.1 Years.
What is the Average Family Size in New Kent
Average Family Size in New Kent is 2.9 People.
What is the Average Household Size in New Kent
Average Household Size in New Kent is 2.9 People.
What is Per Capita Income in New Kent?
Per Capita income in New Kent is $68,850.
What is the Median Family Income in New Kent?
Median Family Income in New Kent is $161,572.
What is the Median Household income in New Kent?
Median Household Income in New Kent is $161,572.
What is Income or Wage Gap in New Kent?
Income or Wage Gap in New Kent is 2.5%.
Women in New Kent earn 97.5 cents for every dollar earned by a man.
What is Inequality or Gini Index in New Kent?
Inequality or Gini Index in New Kent is 0.29.
How Large is the Labor Force in New Kent?
There are 518 People in the Labor Forcein in New Kent.
What is the Percentage of People in the Labor Force in New Kent?
92.7% of People are in the Labor Force in New Kent.