McKenney, VA
McKenney Map
McKenney Overview
559
TOTAL POPULATION
322
MALE POPULATION
237
FEMALE POPULATION
135.86
MALES / 100 FEMALES
73.60
FEMALES / 100 MALES
42.5
MEDIAN AGE
3.5
AVG FAMILY SIZE
2.6
AVG HOUSEHOLD SIZE
$22,306
PER CAPITA INCOME
$57,361
AVG FAMILY INCOME
$59,107
AVG HOUSEHOLD INCOME
23.0%
WAGE / INCOME GAP [ % ]
77.0¢/ $1
WAGE / INCOME GAP [ $ ]
0.37
INEQUALITY / GINI INDEX
255
LABOR FORCE [ PEOPLE ]
60.4%
PERCENT IN LABOR FORCE
24.3%
UNEMPLOYMENT RATE
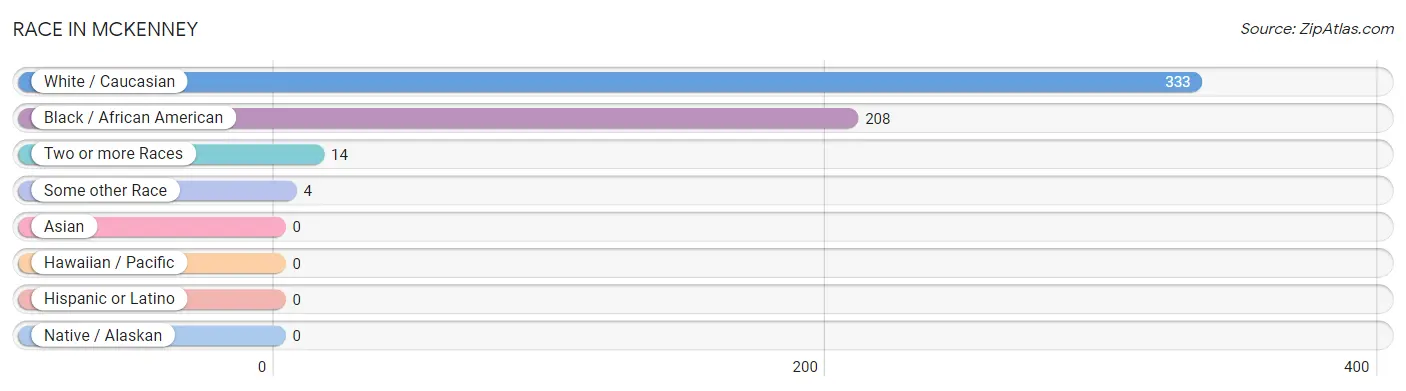
Race in McKenney
The most populous races in McKenney are White / Caucasian (333 | 59.6%), Black / African American (208 | 37.2%), and Two or more Races (14 | 2.5%).
| Race | # Population | % Population |
| Asian | 0 | 0.0% |
| Black / African American | 208 | 37.2% |
| Hawaiian / Pacific | 0 | 0.0% |
| Hispanic or Latino | 0 | 0.0% |
| Native / Alaskan | 0 | 0.0% |
| White / Caucasian | 333 | 59.6% |
| Two or more Races | 14 | 2.5% |
| Some other Race | 4 | 0.7% |
| Total | 559 | 100.0% |
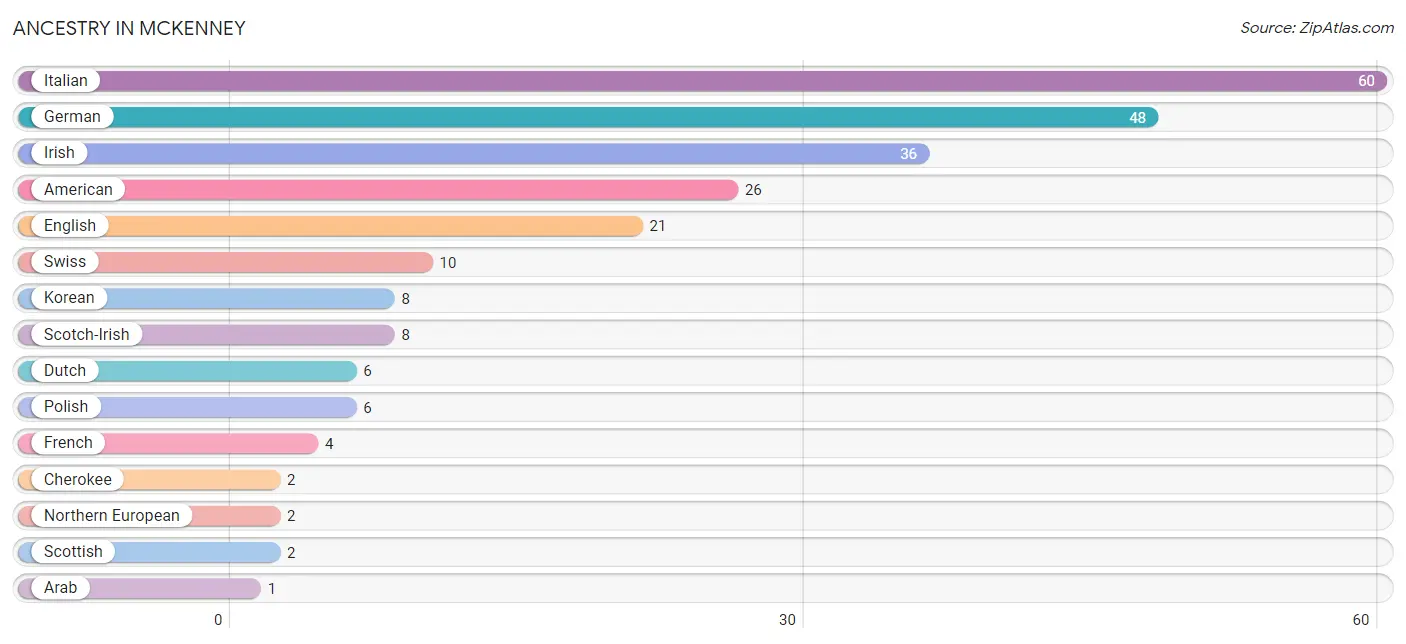
Ancestry in McKenney
The most populous ancestries reported in McKenney are Italian (60 | 10.7%), German (48 | 8.6%), Irish (36 | 6.4%), American (26 | 4.6%), and English (21 | 3.8%), together accounting for 34.2% of all McKenney residents.
| Ancestry | # Population | % Population |
| American | 26 | 4.6% |
| Arab | 1 | 0.2% |
| Cherokee | 2 | 0.4% |
| Dutch | 6 | 1.1% |
| English | 21 | 3.8% |
| French | 4 | 0.7% |
| German | 48 | 8.6% |
| Irish | 36 | 6.4% |
| Italian | 60 | 10.7% |
| Korean | 8 | 1.4% |
| Lebanese | 1 | 0.2% |
| Northern European | 2 | 0.4% |
| Polish | 6 | 1.1% |
| Russian | 1 | 0.2% |
| Scotch-Irish | 8 | 1.4% |
| Scottish | 2 | 0.4% |
| Swiss | 10 | 1.8% | View All 17 Rows |
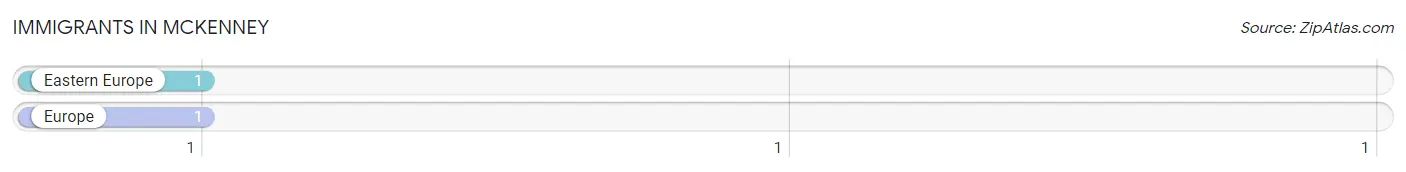
Immigrants in McKenney
The most numerous immigrant groups reported in McKenney came from Eastern Europe (1 | 0.2%), and Europe (1 | 0.2%), together accounting for 0.4% of all McKenney residents.
| Immigration Origin | # Population | % Population |
| Eastern Europe | 1 | 0.2% |
| Europe | 1 | 0.2% | View All 2 Rows |
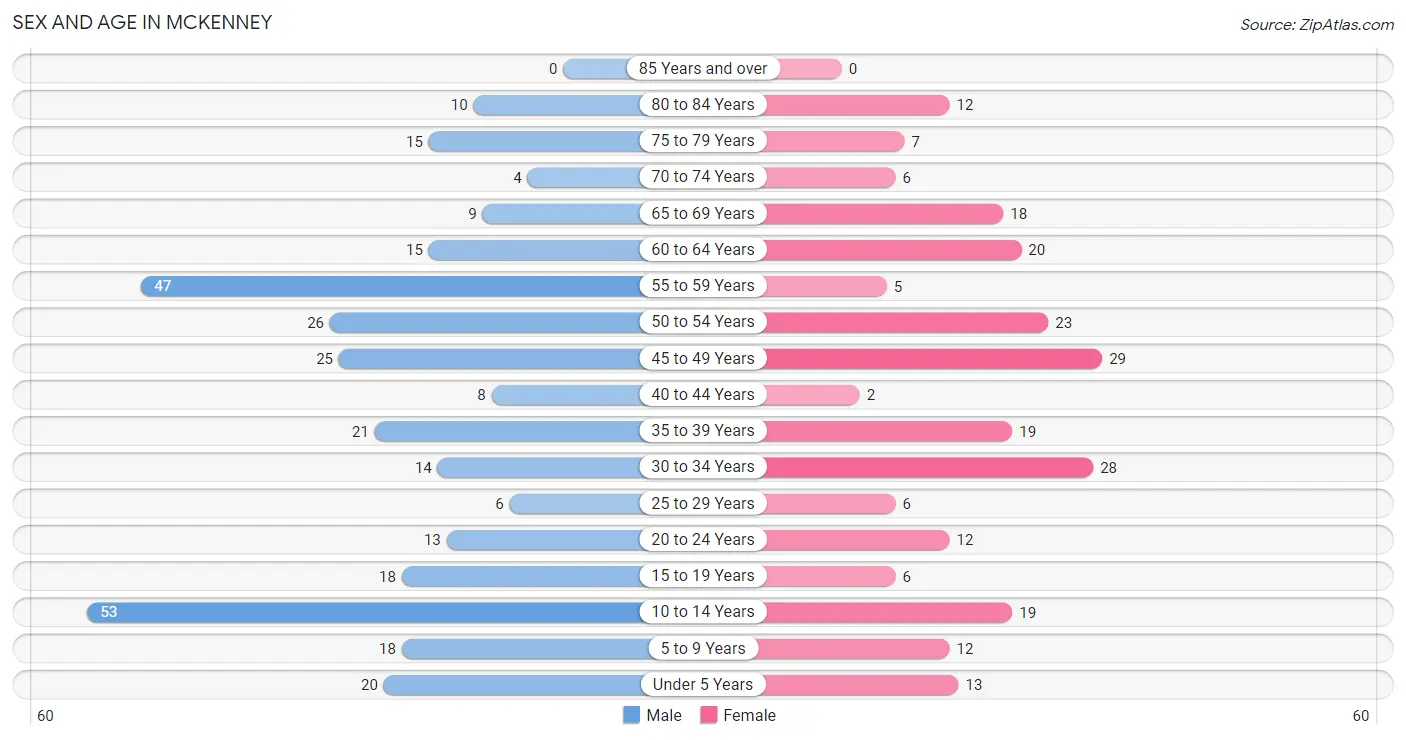
Sex and Age in McKenney
Sex and Age in McKenney
The most populous age groups in McKenney are 10 to 14 Years (53 | 16.5%) for men and 45 to 49 Years (29 | 12.2%) for women.
| Age Bracket | Male | Female |
| Under 5 Years | 20 (6.2%) | 13 (5.5%) |
| 5 to 9 Years | 18 (5.6%) | 12 (5.1%) |
| 10 to 14 Years | 53 (16.5%) | 19 (8.0%) |
| 15 to 19 Years | 18 (5.6%) | 6 (2.5%) |
| 20 to 24 Years | 13 (4.0%) | 12 (5.1%) |
| 25 to 29 Years | 6 (1.9%) | 6 (2.5%) |
| 30 to 34 Years | 14 (4.3%) | 28 (11.8%) |
| 35 to 39 Years | 21 (6.5%) | 19 (8.0%) |
| 40 to 44 Years | 8 (2.5%) | 2 (0.8%) |
| 45 to 49 Years | 25 (7.8%) | 29 (12.2%) |
| 50 to 54 Years | 26 (8.1%) | 23 (9.7%) |
| 55 to 59 Years | 47 (14.6%) | 5 (2.1%) |
| 60 to 64 Years | 15 (4.7%) | 20 (8.4%) |
| 65 to 69 Years | 9 (2.8%) | 18 (7.6%) |
| 70 to 74 Years | 4 (1.2%) | 6 (2.5%) |
| 75 to 79 Years | 15 (4.7%) | 7 (2.9%) |
| 80 to 84 Years | 10 (3.1%) | 12 (5.1%) |
| 85 Years and over | 0 (0.0%) | 0 (0.0%) |
| Total | 322 (100.0%) | 237 (100.0%) |
Families and Households in McKenney
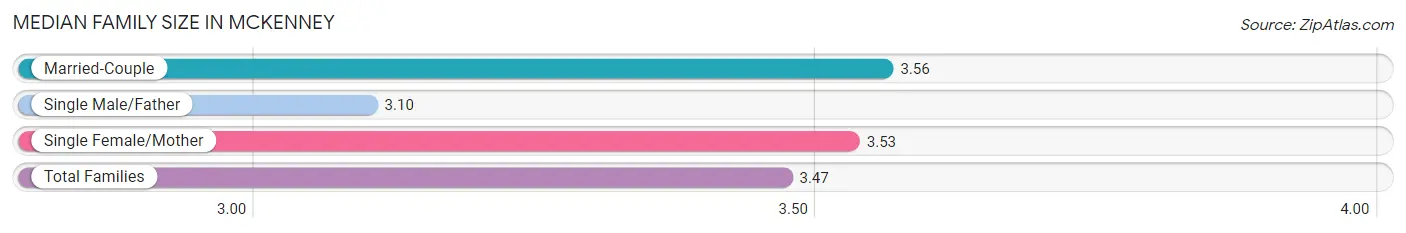
Median Family Size in McKenney
The median family size in McKenney is 3.47 persons per family, with married-couple families (64 | 53.8%) accounting for the largest median family size of 3.56 persons per family. On the other hand, single male/father families (21 | 17.6%) represent the smallest median family size with 3.10 persons per family.
| Family Type | # Families | Family Size |
| Married-Couple | 64 (53.8%) | 3.56 |
| Single Male/Father | 21 (17.6%) | 3.10 |
| Single Female/Mother | 34 (28.6%) | 3.53 |
| Total Families | 119 (100.0%) | 3.47 |
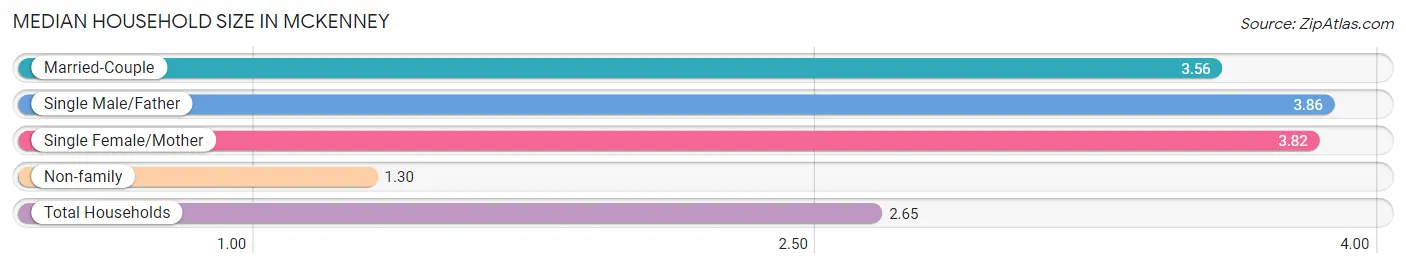
Median Household Size in McKenney
The median household size in McKenney is 2.65 persons per household, with single male/father households (21 | 10.0%) accounting for the largest median household size of 3.86 persons per household. non-family households (92 | 43.6%) represent the smallest median household size with 1.30 persons per household.
| Household Type | # Households | Household Size |
| Married-Couple | 64 (30.3%) | 3.56 |
| Single Male/Father | 21 (10.0%) | 3.86 |
| Single Female/Mother | 34 (16.1%) | 3.82 |
| Non-family | 92 (43.6%) | 1.30 |
| Total Households | 211 (100.0%) | 2.65 |
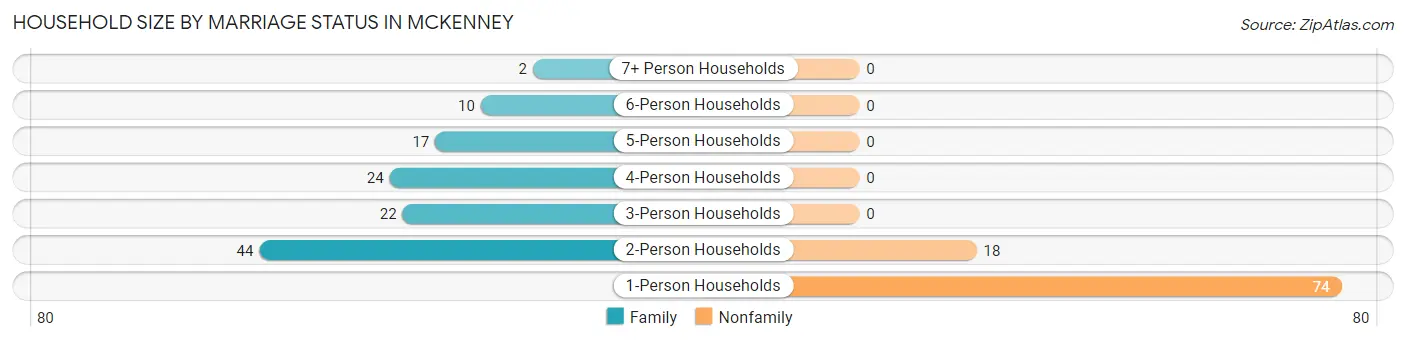
Household Size by Marriage Status in McKenney
Out of a total of 211 households in McKenney, 119 (56.4%) are family households, while 92 (43.6%) are nonfamily households. The most numerous type of family households are 2-person households, comprising 44, and the most common type of nonfamily households are 1-person households, comprising 74.
| Household Size | Family Households | Nonfamily Households |
| 1-Person Households | - | 74 (35.1%) |
| 2-Person Households | 44 (20.8%) | 18 (8.5%) |
| 3-Person Households | 22 (10.4%) | 0 (0.0%) |
| 4-Person Households | 24 (11.4%) | 0 (0.0%) |
| 5-Person Households | 17 (8.1%) | 0 (0.0%) |
| 6-Person Households | 10 (4.7%) | 0 (0.0%) |
| 7+ Person Households | 2 (0.9%) | 0 (0.0%) |
| Total | 119 (56.4%) | 92 (43.6%) |
Female Fertility in McKenney
Fertility by Age in McKenney
Average fertility rate in McKenney is 16.0 births per 1,000 women. Women in the age bracket of 20 to 34 years have the highest fertility rate with 22.0 births per 1,000 women. Women in the age bracket of 20 to 34 years acount for 50.0% of all women with births.
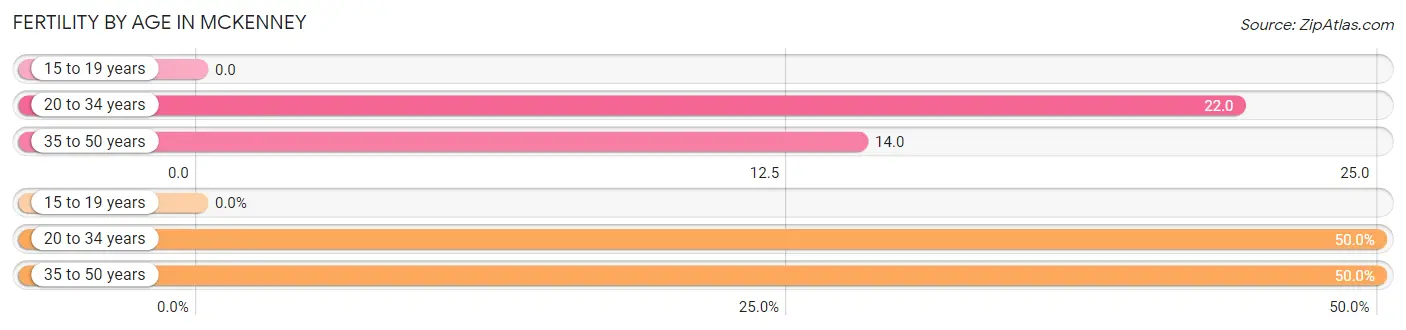
| Age Bracket | Women with Births | Births / 1,000 Women |
| 15 to 19 years | 0 (0.0%) | 0.0 |
| 20 to 34 years | 1 (50.0%) | 22.0 |
| 35 to 50 years | 1 (50.0%) | 14.0 |
| Total | 2 (100.0%) | 16.0 |
Fertility by Age by Marriage Status in McKenney
50.0% of women with births (2) in McKenney are married. The highest percentage of unmarried women with births falls into 20 to 34 years age bracket with 100.0% of them unmarried at the time of birth, while the lowest percentage of unmarried women with births belong to 35 to 50 years age bracket with 0.0% of them unmarried.
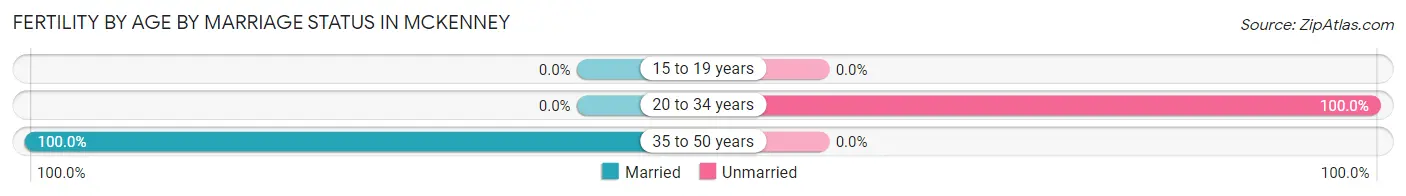
| Age Bracket | Married | Unmarried |
| 15 to 19 years | 0 (0.0%) | 0 (0.0%) |
| 20 to 34 years | 0 (0.0%) | 1 (100.0%) |
| 35 to 50 years | 1 (100.0%) | 0 (0.0%) |
| Total | 1 (50.0%) | 1 (50.0%) |
Fertility by Education in McKenney
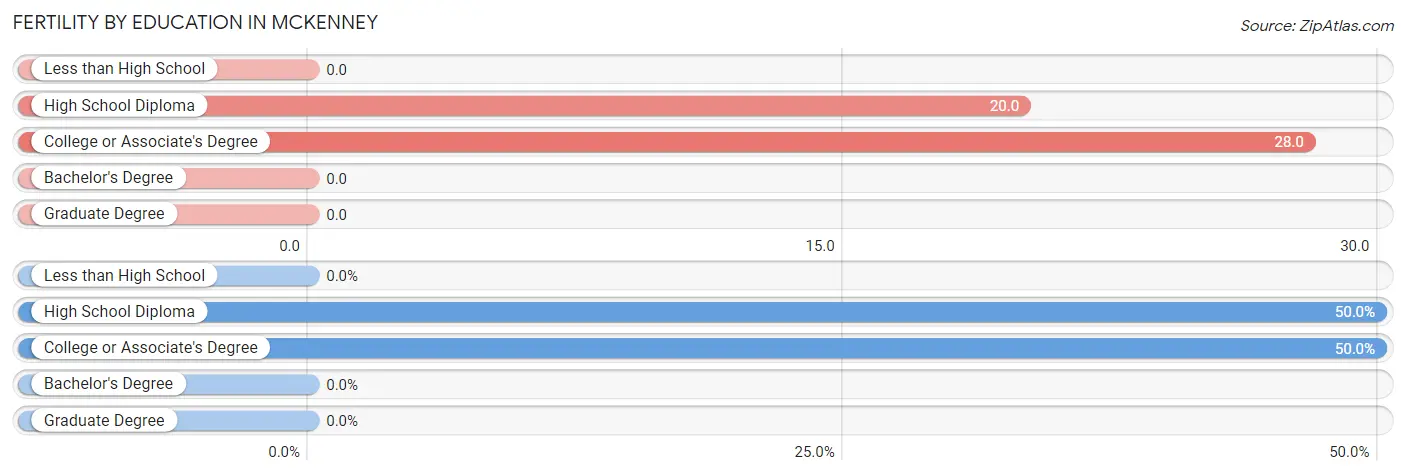
| Educational Attainment | Women with Births | Births / 1,000 Women |
| Less than High School | 0 (0.0%) | 0.0 |
| High School Diploma | 1 (50.0%) | 20.0 |
| College or Associate's Degree | 1 (50.0%) | 28.0 |
| Bachelor's Degree | 0 (0.0%) | 0.0 |
| Graduate Degree | 0 (0.0%) | 0.0 |
| Total | 2 (100.0%) | 16.0 |
Fertility by Education by Marriage Status in McKenney
50.0% of women with births in McKenney are unmarried. Women with the educational attainment of college or associate's degree are most likely to be married with 100.0% of them married at childbirth, while women with the educational attainment of high school diploma are least likely to be married with 100.0% of them unmarried at childbirth.
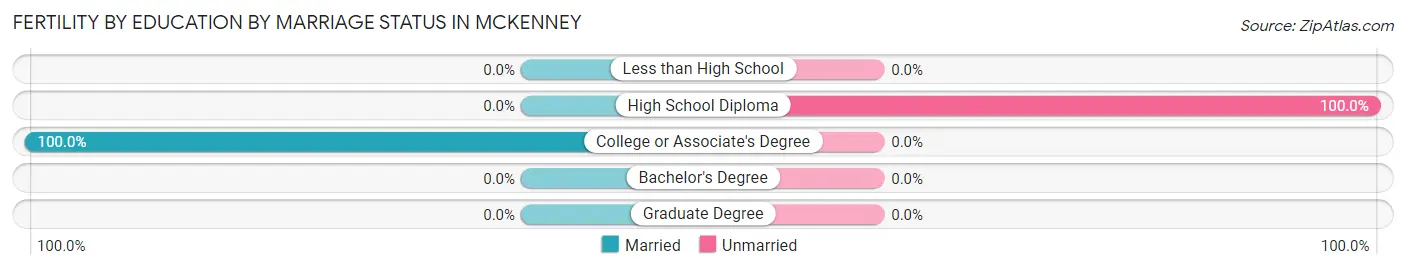
| Educational Attainment | Married | Unmarried |
| Less than High School | 0 (0.0%) | 0 (0.0%) |
| High School Diploma | 0 (0.0%) | 1 (100.0%) |
| College or Associate's Degree | 1 (100.0%) | 0 (0.0%) |
| Bachelor's Degree | 0 (0.0%) | 0 (0.0%) |
| Graduate Degree | 0 (0.0%) | 0 (0.0%) |
| Total | 1 (50.0%) | 1 (50.0%) |
Income in McKenney
Income Overview in McKenney
Per Capita Income in McKenney is $22,306, while median incomes of families and households are $57,361 and $59,107 respectively.
| Characteristic | Number | Measure |
| Per Capita Income | 559 | $22,306 |
| Median Family Income | 119 | $57,361 |
| Mean Family Income | 119 | $66,997 |
| Median Household Income | 211 | $59,107 |
| Mean Household Income | 211 | $58,805 |
| Income Deficit | 119 | $0 |
| Wage / Income Gap (%) | 559 | 22.97% |
| Wage / Income Gap ($) | 559 | 77.03¢ per $1 |
| Gini / Inequality Index | 559 | 0.37 |
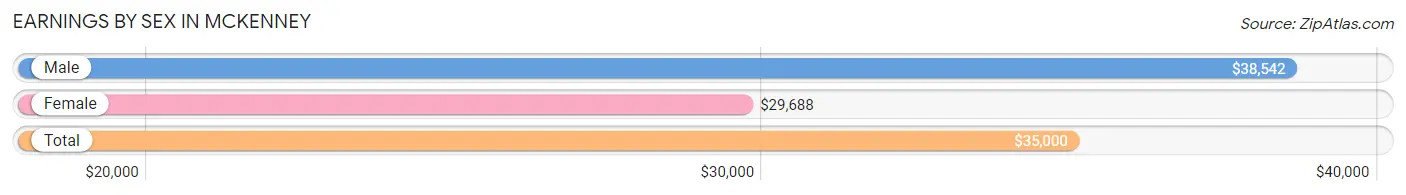
Earnings by Sex in McKenney
Average Earnings in McKenney are $35,000, $38,542 for men and $29,688 for women, a difference of 23.0%.
| Sex | Number | Average Earnings |
| Male | 137 (60.6%) | $38,542 |
| Female | 89 (39.4%) | $29,688 |
| Total | 226 (100.0%) | $35,000 |
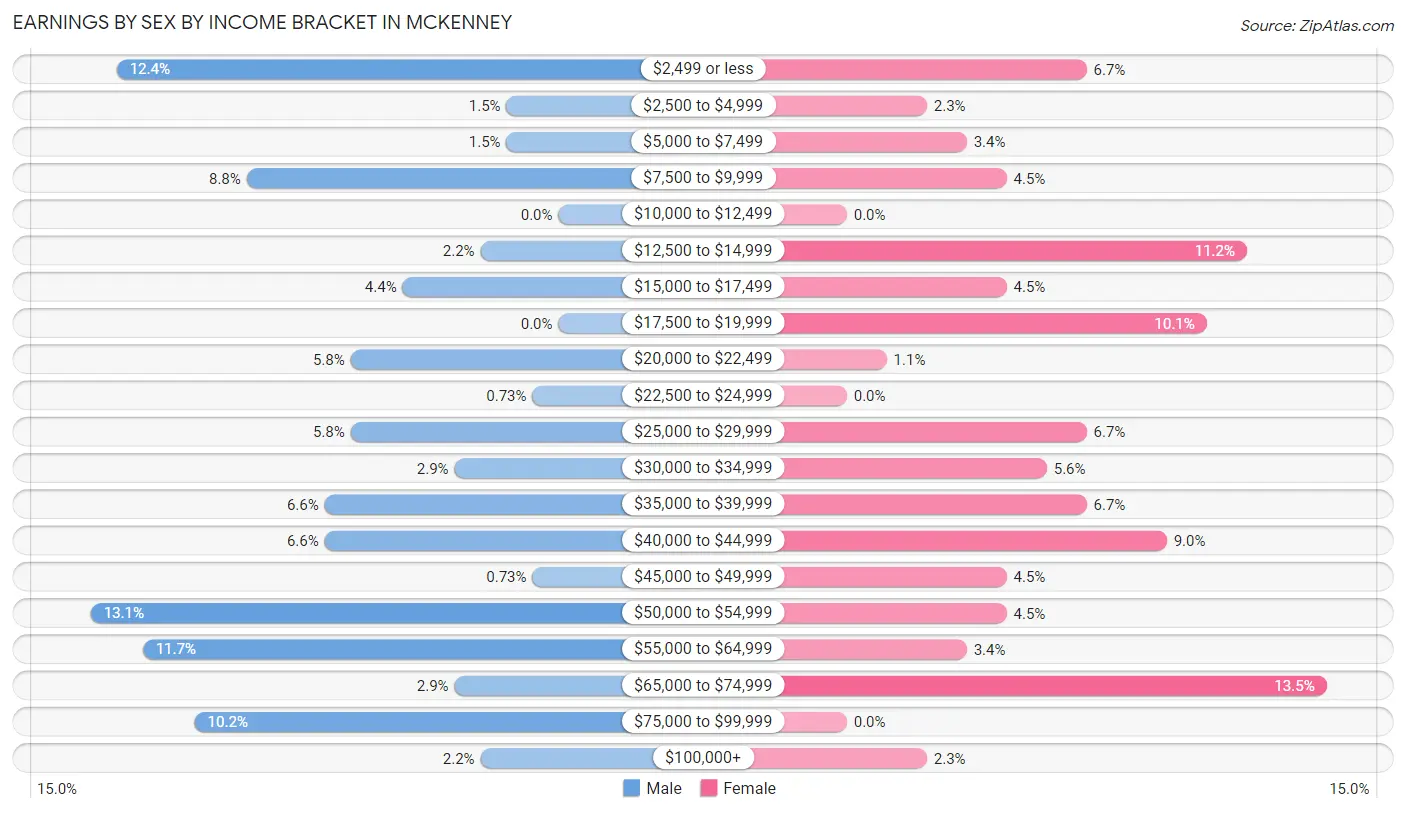
Earnings by Sex by Income Bracket in McKenney
The most common earnings brackets in McKenney are $50,000 to $54,999 for men (18 | 13.1%) and $65,000 to $74,999 for women (12 | 13.5%).
| Income | Male | Female |
| $2,499 or less | 17 (12.4%) | 6 (6.7%) |
| $2,500 to $4,999 | 2 (1.5%) | 2 (2.2%) |
| $5,000 to $7,499 | 2 (1.5%) | 3 (3.4%) |
| $7,500 to $9,999 | 12 (8.8%) | 4 (4.5%) |
| $10,000 to $12,499 | 0 (0.0%) | 0 (0.0%) |
| $12,500 to $14,999 | 3 (2.2%) | 10 (11.2%) |
| $15,000 to $17,499 | 6 (4.4%) | 4 (4.5%) |
| $17,500 to $19,999 | 0 (0.0%) | 9 (10.1%) |
| $20,000 to $22,499 | 8 (5.8%) | 1 (1.1%) |
| $22,500 to $24,999 | 1 (0.7%) | 0 (0.0%) |
| $25,000 to $29,999 | 8 (5.8%) | 6 (6.7%) |
| $30,000 to $34,999 | 4 (2.9%) | 5 (5.6%) |
| $35,000 to $39,999 | 9 (6.6%) | 6 (6.7%) |
| $40,000 to $44,999 | 9 (6.6%) | 8 (9.0%) |
| $45,000 to $49,999 | 1 (0.7%) | 4 (4.5%) |
| $50,000 to $54,999 | 18 (13.1%) | 4 (4.5%) |
| $55,000 to $64,999 | 16 (11.7%) | 3 (3.4%) |
| $65,000 to $74,999 | 4 (2.9%) | 12 (13.5%) |
| $75,000 to $99,999 | 14 (10.2%) | 0 (0.0%) |
| $100,000+ | 3 (2.2%) | 2 (2.2%) |
| Total | 137 (100.0%) | 89 (100.0%) |
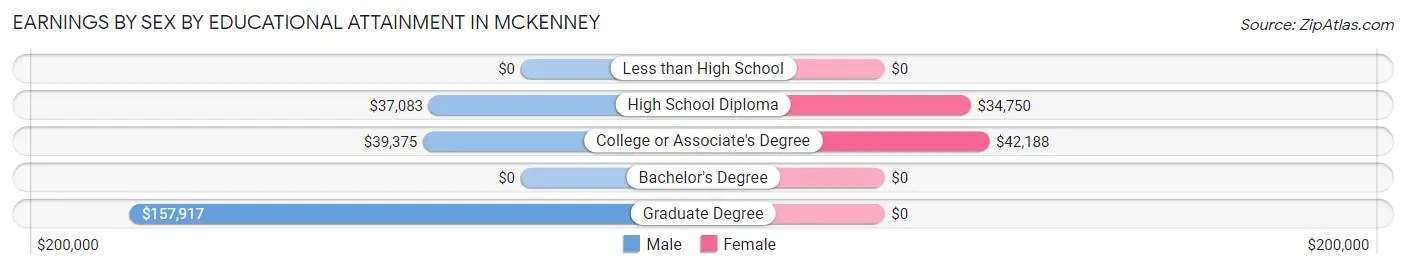
Earnings by Sex by Educational Attainment in McKenney
Average earnings in McKenney are $42,639 for men and $37,708 for women, a difference of 11.6%. Men with an educational attainment of graduate degree enjoy the highest average annual earnings of $157,917, while those with high school diploma education earn the least with $37,083. Women with an educational attainment of college or associate's degree earn the most with the average annual earnings of $42,188, while those with high school diploma education have the smallest earnings of $34,750.
| Educational Attainment | Male Income | Female Income |
| Less than High School | - | - |
| High School Diploma | $37,083 | $34,750 |
| College or Associate's Degree | $39,375 | $42,188 |
| Bachelor's Degree | - | - |
| Graduate Degree | $157,917 | $0 |
| Total | $42,639 | $37,708 |
Family Income in McKenney
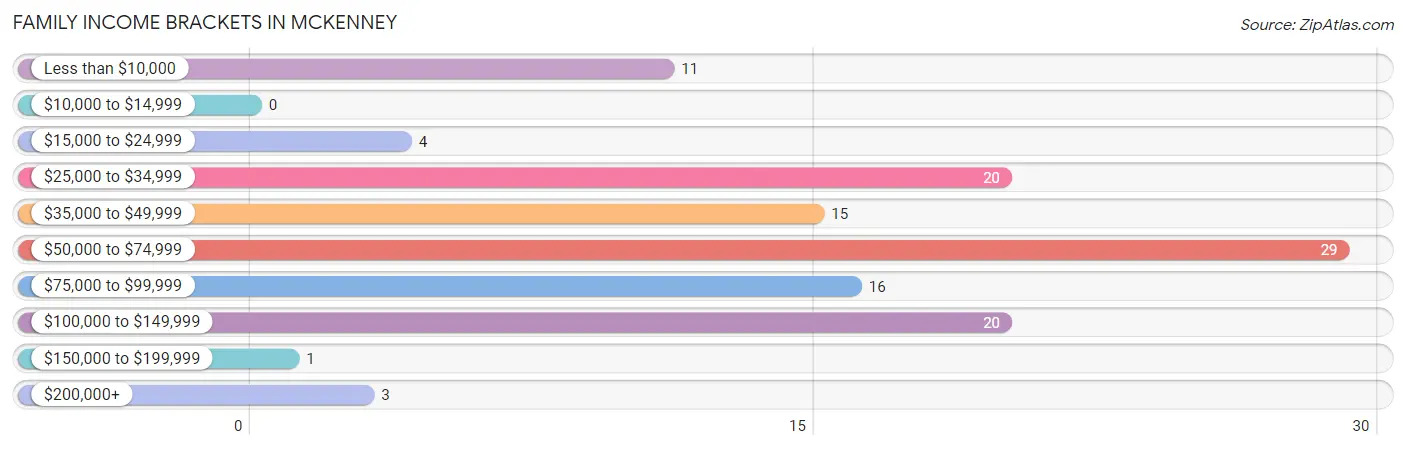
Family Income Brackets in McKenney
According to the McKenney family income data, there are 29 families falling into the $50,000 to $74,999 income range, which is the most common income bracket and makes up 24.4% of all families.
| Income Bracket | # Families | % Families |
| Less than $10,000 | 11 | 9.2% |
| $10,000 to $14,999 | 0 | 0.0% |
| $15,000 to $24,999 | 4 | 3.4% |
| $25,000 to $34,999 | 20 | 16.8% |
| $35,000 to $49,999 | 15 | 12.6% |
| $50,000 to $74,999 | 29 | 24.4% |
| $75,000 to $99,999 | 16 | 13.4% |
| $100,000 to $149,999 | 20 | 16.8% |
| $150,000 to $199,999 | 1 | 0.8% |
| $200,000+ | 3 | 2.5% |
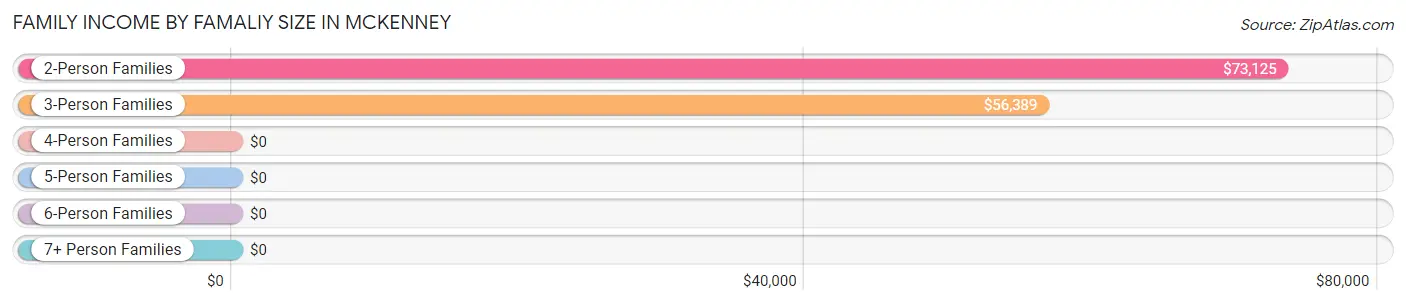
Family Income by Famaliy Size in McKenney
2-person families (47 | 39.5%) account for the highest median family income in McKenney with $73,125 per family, while 2-person families (47 | 39.5%) have the highest median income of $36,562 per family member.
| Income Bracket | # Families | Median Income |
| 2-Person Families | 47 (39.5%) | $73,125 |
| 3-Person Families | 30 (25.2%) | $56,389 |
| 4-Person Families | 27 (22.7%) | $0 |
| 5-Person Families | 3 (2.5%) | $0 |
| 6-Person Families | 10 (8.4%) | $0 |
| 7+ Person Families | 2 (1.7%) | $0 |
| Total | 119 (100.0%) | $57,361 |
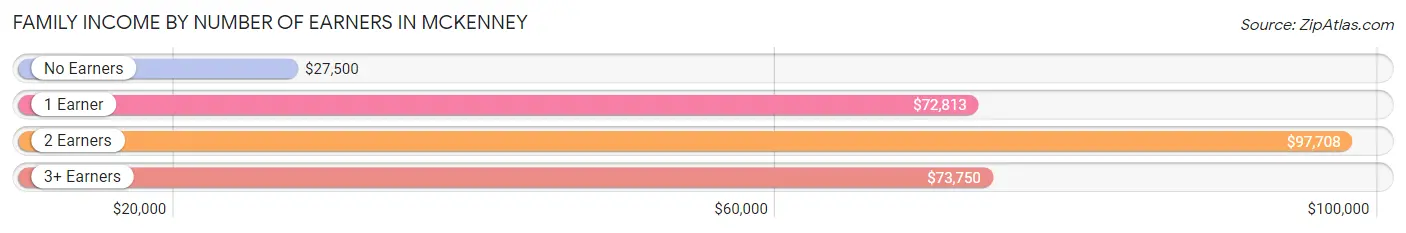
Family Income by Number of Earners in McKenney
The median family income in McKenney is $57,361, with families comprising 2 earners (53) having the highest median family income of $97,708, while families with no earners (30) have the lowest median family income of $27,500, accounting for 44.5% and 25.2% of families, respectively.
| Number of Earners | # Families | Median Income |
| No Earners | 30 (25.2%) | $27,500 |
| 1 Earner | 30 (25.2%) | $72,813 |
| 2 Earners | 53 (44.5%) | $97,708 |
| 3+ Earners | 6 (5.0%) | $73,750 |
| Total | 119 (100.0%) | $57,361 |
Household Income in McKenney
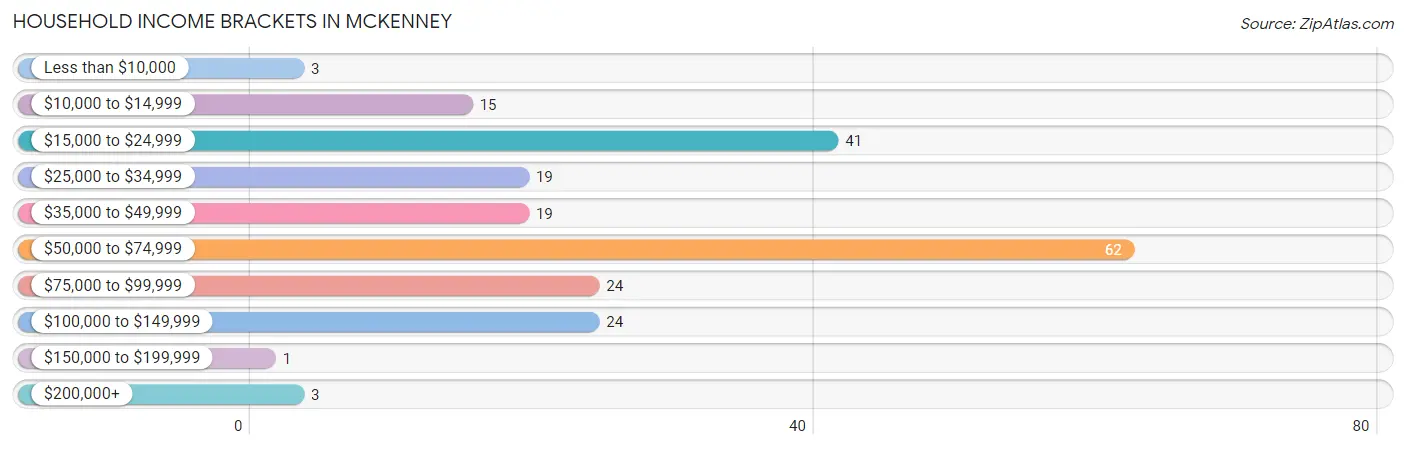
Household Income Brackets in McKenney
With 62 households falling in the category, the $50,000 to $74,999 income range is the most frequent in McKenney, accounting for 29.4% of all households. In contrast, only 1 households (0.5%) fall into the $150,000 to $199,999 income bracket, making it the least populous group.
| Income Bracket | # Households | % Households |
| Less than $10,000 | 3 | 1.4% |
| $10,000 to $14,999 | 15 | 7.1% |
| $15,000 to $24,999 | 41 | 19.4% |
| $25,000 to $34,999 | 19 | 9.0% |
| $35,000 to $49,999 | 19 | 9.0% |
| $50,000 to $74,999 | 62 | 29.4% |
| $75,000 to $99,999 | 24 | 11.4% |
| $100,000 to $149,999 | 24 | 11.4% |
| $150,000 to $199,999 | 1 | 0.5% |
| $200,000+ | 3 | 1.4% |
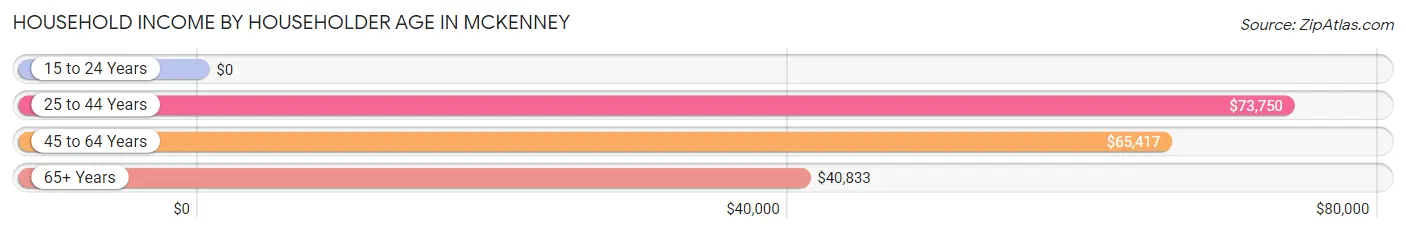
Household Income by Householder Age in McKenney
The median household income in McKenney is $59,107, with the highest median household income of $73,750 found in the 25 to 44 years age bracket for the primary householder. A total of 48 households (22.8%) fall into this category. Meanwhile, the 15 to 24 years age bracket for the primary householder has the lowest median household income of $0, with 2 households (0.9%) in this group.
| Income Bracket | # Households | Median Income |
| 15 to 24 Years | 2 (0.9%) | $0 |
| 25 to 44 Years | 48 (22.8%) | $73,750 |
| 45 to 64 Years | 97 (46.0%) | $65,417 |
| 65+ Years | 64 (30.3%) | $40,833 |
| Total | 211 (100.0%) | $59,107 |
Poverty in McKenney
Income Below Poverty by Sex and Age in McKenney
With 34.8% poverty level for males and 29.1% for females among the residents of McKenney, 16 and 17 year old males and 18 to 24 year old females are the most vulnerable to poverty, with 9 males (90.0%) and 17 females (94.4%) in their respective age groups living below the poverty level.
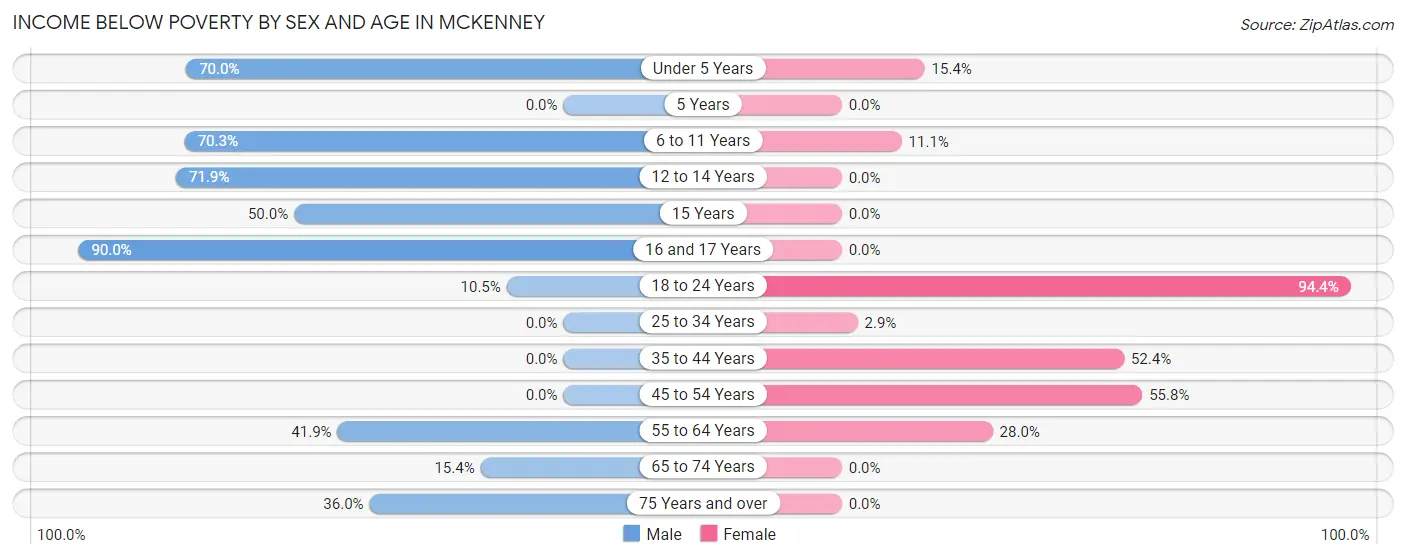
| Age Bracket | Male | Female |
| Under 5 Years | 14 (70.0%) | 2 (15.4%) |
| 5 Years | 0 (0.0%) | 0 (0.0%) |
| 6 to 11 Years | 26 (70.3%) | 2 (11.1%) |
| 12 to 14 Years | 23 (71.9%) | 0 (0.0%) |
| 15 Years | 1 (50.0%) | 0 (0.0%) |
| 16 and 17 Years | 9 (90.0%) | 0 (0.0%) |
| 18 to 24 Years | 2 (10.5%) | 17 (94.4%) |
| 25 to 34 Years | 0 (0.0%) | 1 (2.9%) |
| 35 to 44 Years | 0 (0.0%) | 11 (52.4%) |
| 45 to 54 Years | 0 (0.0%) | 29 (55.8%) |
| 55 to 64 Years | 26 (41.9%) | 7 (28.0%) |
| 65 to 74 Years | 2 (15.4%) | 0 (0.0%) |
| 75 Years and over | 9 (36.0%) | 0 (0.0%) |
| Total | 112 (34.8%) | 69 (29.1%) |
Income Above Poverty by Sex and Age in McKenney
According to the poverty statistics in McKenney, males aged 5 years and females aged 12 to 14 years are the age groups that are most secure financially, with 100.0% of males and 100.0% of females in these age groups living above the poverty line.
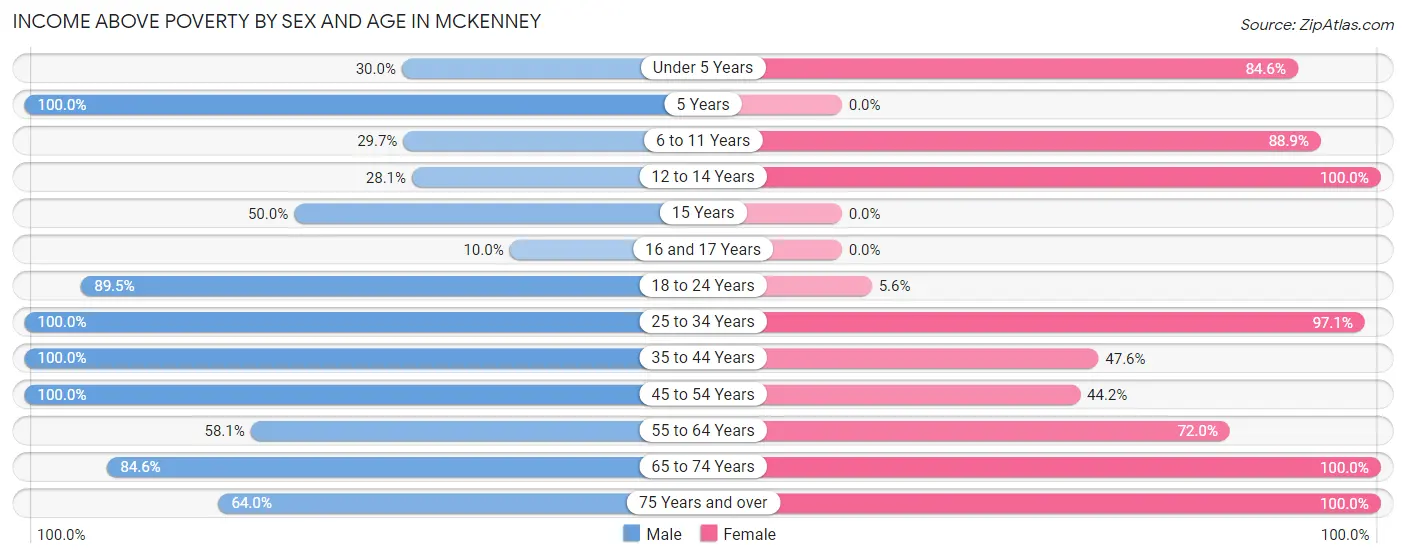
| Age Bracket | Male | Female |
| Under 5 Years | 6 (30.0%) | 11 (84.6%) |
| 5 Years | 2 (100.0%) | 0 (0.0%) |
| 6 to 11 Years | 11 (29.7%) | 16 (88.9%) |
| 12 to 14 Years | 9 (28.1%) | 13 (100.0%) |
| 15 Years | 1 (50.0%) | 0 (0.0%) |
| 16 and 17 Years | 1 (10.0%) | 0 (0.0%) |
| 18 to 24 Years | 17 (89.5%) | 1 (5.6%) |
| 25 to 34 Years | 20 (100.0%) | 33 (97.1%) |
| 35 to 44 Years | 29 (100.0%) | 10 (47.6%) |
| 45 to 54 Years | 51 (100.0%) | 23 (44.2%) |
| 55 to 64 Years | 36 (58.1%) | 18 (72.0%) |
| 65 to 74 Years | 11 (84.6%) | 24 (100.0%) |
| 75 Years and over | 16 (64.0%) | 19 (100.0%) |
| Total | 210 (65.2%) | 168 (70.9%) |
Income Below Poverty Among Married-Couple Families in McKenney
The poverty statistics for married-couple families in McKenney show that 17.2% or 11 of the total 64 families live below the poverty line. Families with 1 or 2 children have the highest poverty rate of 34.4%, comprising of 11 families. On the other hand, families with no children have the lowest poverty rate of 0.0%, which includes 0 families.
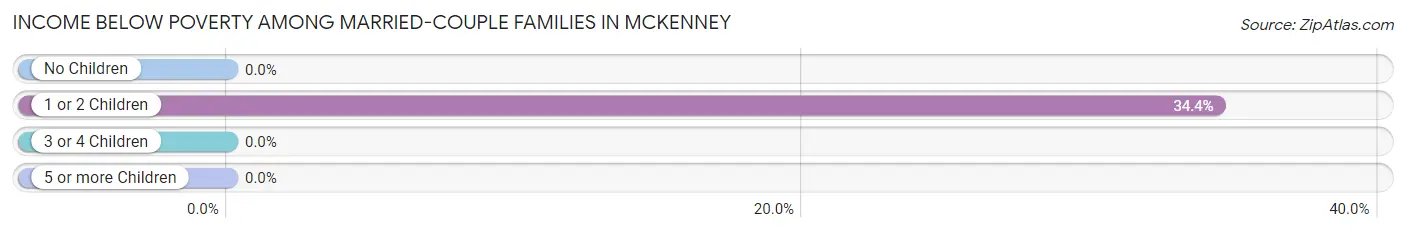
| Children | Above Poverty | Below Poverty |
| No Children | 31 (100.0%) | 0 (0.0%) |
| 1 or 2 Children | 21 (65.6%) | 11 (34.4%) |
| 3 or 4 Children | 0 (0.0%) | 0 (0.0%) |
| 5 or more Children | 1 (100.0%) | 0 (0.0%) |
| Total | 53 (82.8%) | 11 (17.2%) |
Income Below Poverty Among Single-Parent Households in McKenney
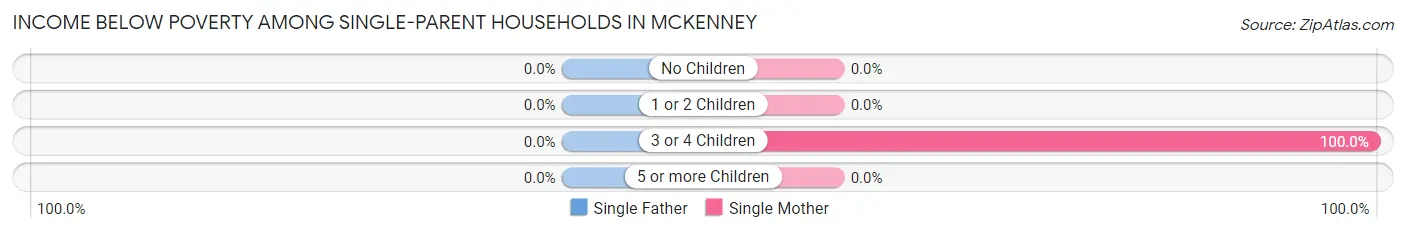
| Children | Single Father | Single Mother |
| No Children | 0 (0.0%) | 0 (0.0%) |
| 1 or 2 Children | 0 (0.0%) | 0 (0.0%) |
| 3 or 4 Children | 0 (0.0%) | 13 (100.0%) |
| 5 or more Children | 0 (0.0%) | 0 (0.0%) |
| Total | 0 (0.0%) | 13 (38.2%) |
Income Below Poverty Among Married-Couple vs Single-Parent Households in McKenney
The poverty data for McKenney shows that 11 of the married-couple family households (17.2%) and 13 of the single-parent households (23.6%) are living below the poverty level. Within the married-couple family households, those with 1 or 2 children have the highest poverty rate, with 11 households (34.4%) falling below the poverty line. Among the single-parent households, those with 3 or 4 children have the highest poverty rate, with 13 household (81.2%) living below poverty.
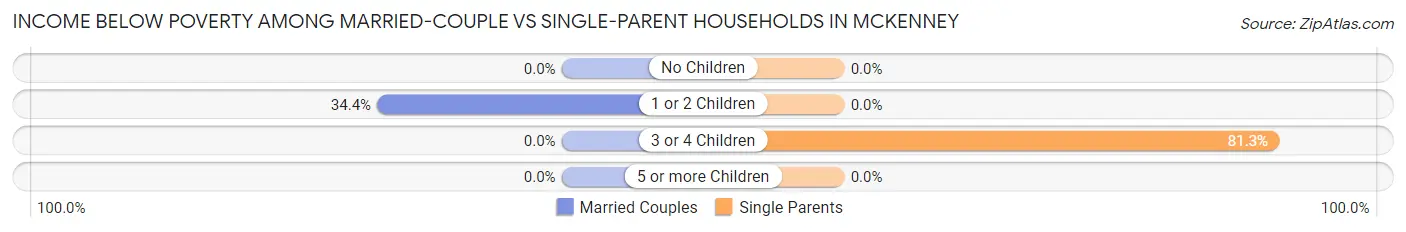
| Children | Married-Couple Families | Single-Parent Households |
| No Children | 0 (0.0%) | 0 (0.0%) |
| 1 or 2 Children | 11 (34.4%) | 0 (0.0%) |
| 3 or 4 Children | 0 (0.0%) | 13 (81.2%) |
| 5 or more Children | 0 (0.0%) | 0 (0.0%) |
| Total | 11 (17.2%) | 13 (23.6%) |
Employment Characteristics in McKenney
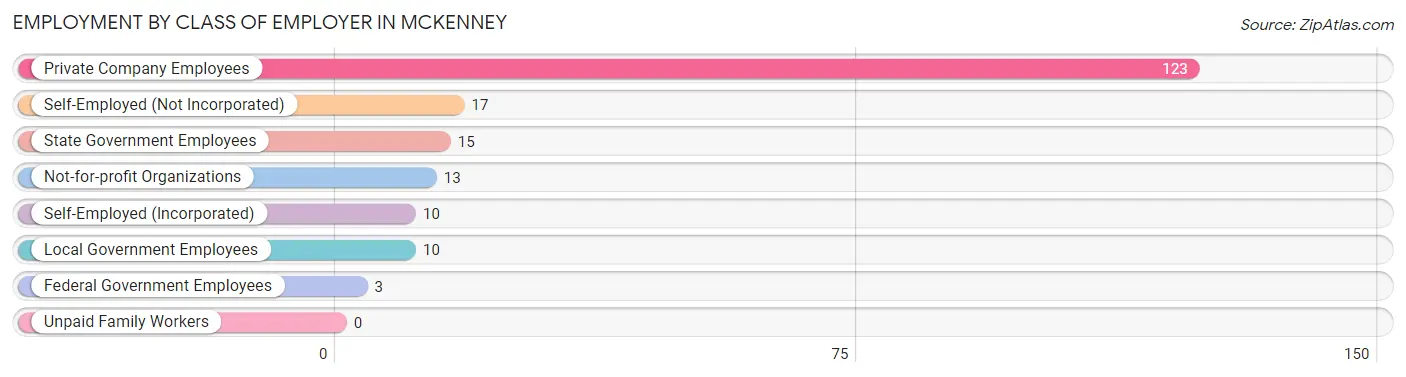
Employment by Class of Employer in McKenney
Among the 191 employed individuals in McKenney, private company employees (123 | 64.4%), self-employed (not incorporated) (17 | 8.9%), and state government employees (15 | 7.9%) make up the most common classes of employment.
| Employer Class | # Employees | % Employees |
| Private Company Employees | 123 | 64.4% |
| Self-Employed (Incorporated) | 10 | 5.2% |
| Self-Employed (Not Incorporated) | 17 | 8.9% |
| Not-for-profit Organizations | 13 | 6.8% |
| Local Government Employees | 10 | 5.2% |
| State Government Employees | 15 | 7.9% |
| Federal Government Employees | 3 | 1.6% |
| Unpaid Family Workers | 0 | 0.0% |
| Total | 191 | 100.0% |
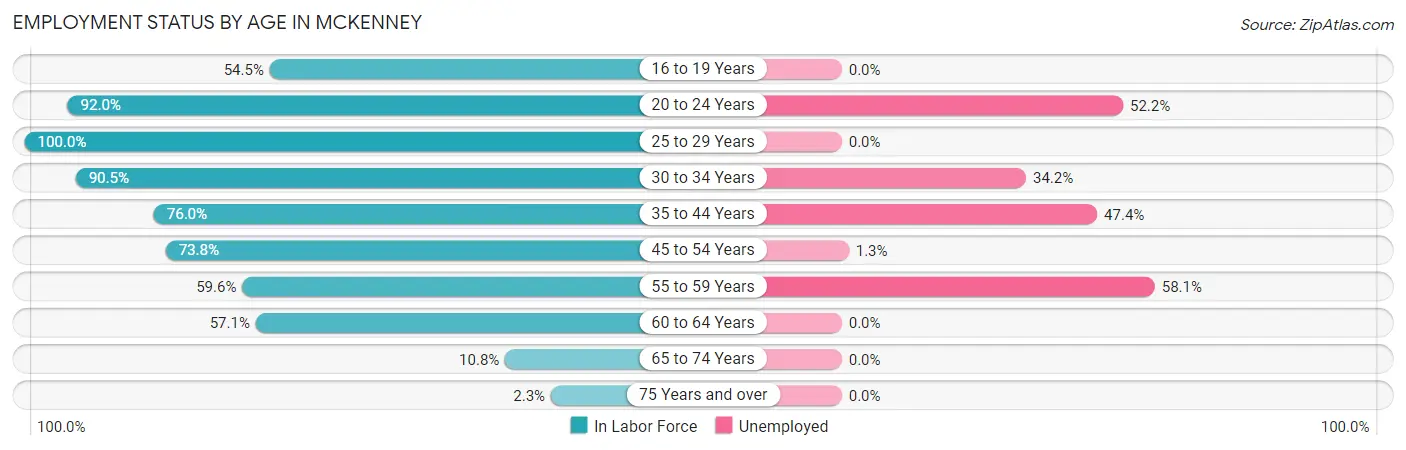
Employment Status by Age in McKenney
According to the labor force statistics for McKenney, out of the total population over 16 years of age (422), 60.4% or 255 individuals are in the labor force, with 24.3% or 62 of them unemployed. The age group with the highest labor force participation rate is 25 to 29 years, with 100.0% or 12 individuals in the labor force. Within the labor force, the 55 to 59 years age range has the highest percentage of unemployed individuals, with 58.1% or 18 of them being unemployed.
| Age Bracket | In Labor Force | Unemployed |
| 16 to 19 Years | 12 (54.5%) | 0 (0.0%) |
| 20 to 24 Years | 23 (92.0%) | 12 (52.2%) |
| 25 to 29 Years | 12 (100.0%) | 0 (0.0%) |
| 30 to 34 Years | 38 (90.5%) | 13 (34.2%) |
| 35 to 44 Years | 38 (76.0%) | 18 (47.4%) |
| 45 to 54 Years | 76 (73.8%) | 1 (1.3%) |
| 55 to 59 Years | 31 (59.6%) | 18 (58.1%) |
| 60 to 64 Years | 20 (57.1%) | 0 (0.0%) |
| 65 to 74 Years | 4 (10.8%) | 0 (0.0%) |
| 75 Years and over | 1 (2.3%) | 0 (0.0%) |
| Total | 255 (60.4%) | 62 (24.3%) |
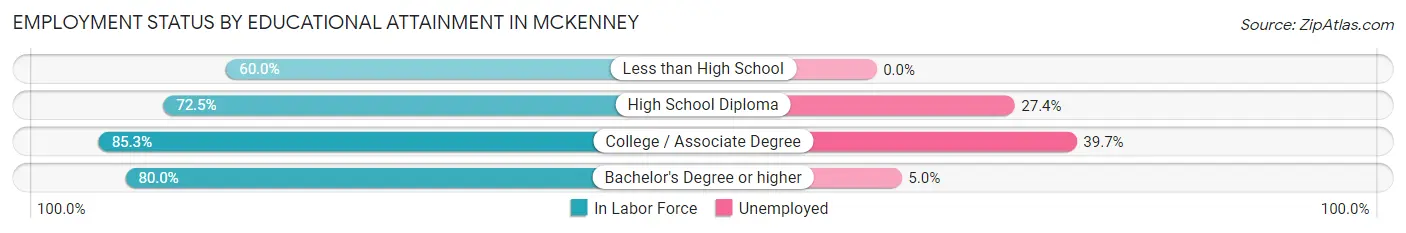
Employment Status by Educational Attainment in McKenney
According to labor force statistics for McKenney, 73.1% of individuals (215) out of the total population between 25 and 64 years of age (294) are in the labor force, with 23.3% or 50 of them being unemployed. The group with the highest labor force participation rate are those with the educational attainment of college / associate degree, with 85.3% or 58 individuals in the labor force. Within the labor force, individuals with college / associate degree education have the highest percentage of unemployment, with 39.7% or 23 of them being unemployed.
| Educational Attainment | In Labor Force | Unemployed |
| Less than High School | 42 (60.0%) | 0 (0.0%) |
| High School Diploma | 95 (72.5%) | 36 (27.4%) |
| College / Associate Degree | 58 (85.3%) | 27 (39.7%) |
| Bachelor's Degree or higher | 20 (80.0%) | 1 (5.0%) |
| Total | 215 (73.1%) | 69 (23.3%) |
Employment Occupations by Sex in McKenney
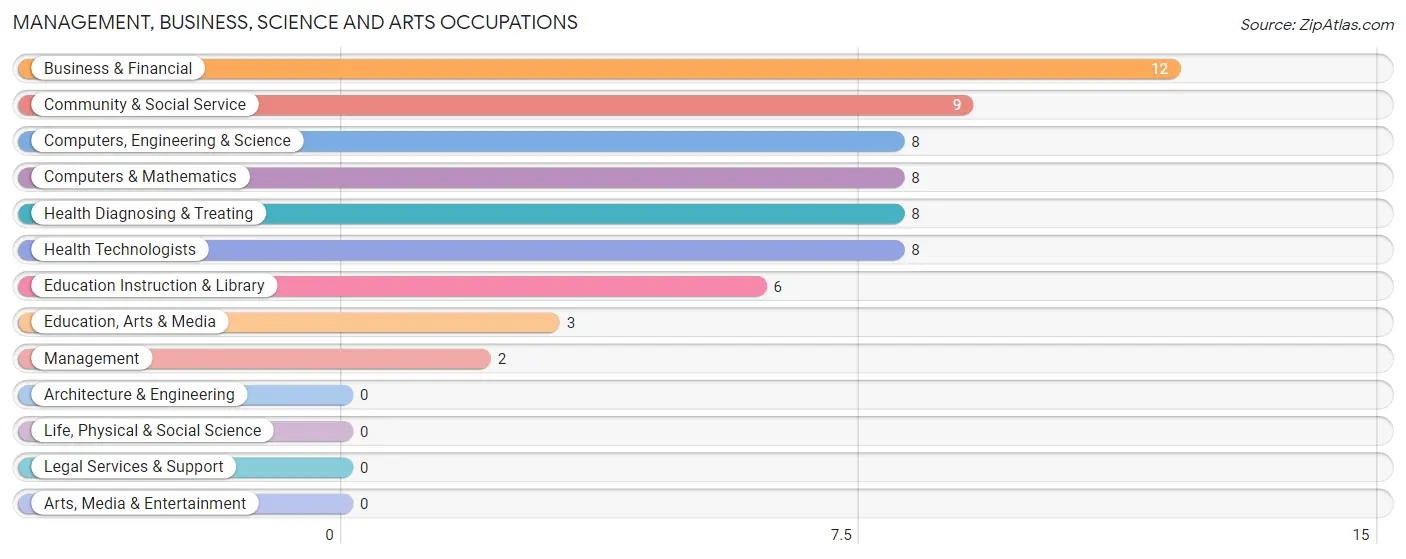
Management, Business, Science and Arts Occupations
The most common Management, Business, Science and Arts occupations in McKenney are Business & Financial (12 | 6.2%), Community & Social Service (9 | 4.7%), Computers, Engineering & Science (8 | 4.2%), Computers & Mathematics (8 | 4.2%), and Health Diagnosing & Treating (8 | 4.2%).
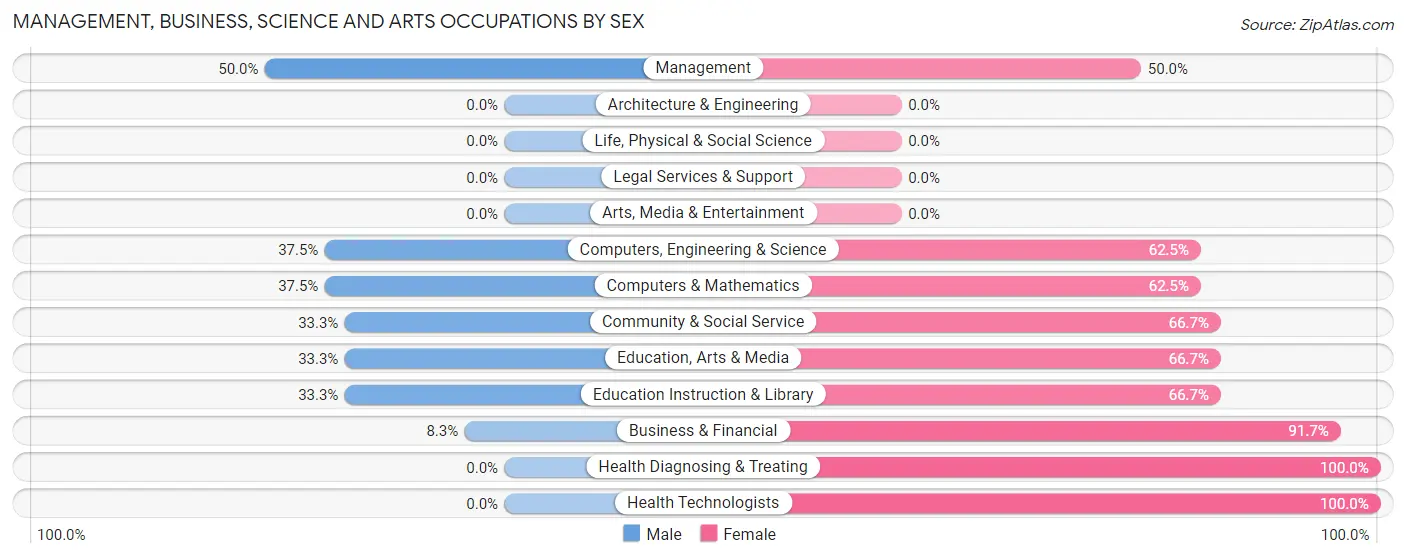
Management, Business, Science and Arts Occupations by Sex
Within the Management, Business, Science and Arts occupations in McKenney, the most male-oriented occupations are Management (50.0%), Computers, Engineering & Science (37.5%), and Computers & Mathematics (37.5%), while the most female-oriented occupations are Health Diagnosing & Treating (100.0%), Health Technologists (100.0%), and Business & Financial (91.7%).
| Occupation | Male | Female |
| Management | 1 (50.0%) | 1 (50.0%) |
| Business & Financial | 1 (8.3%) | 11 (91.7%) |
| Computers, Engineering & Science | 3 (37.5%) | 5 (62.5%) |
| Computers & Mathematics | 3 (37.5%) | 5 (62.5%) |
| Architecture & Engineering | 0 (0.0%) | 0 (0.0%) |
| Life, Physical & Social Science | 0 (0.0%) | 0 (0.0%) |
| Community & Social Service | 3 (33.3%) | 6 (66.7%) |
| Education, Arts & Media | 1 (33.3%) | 2 (66.7%) |
| Legal Services & Support | 0 (0.0%) | 0 (0.0%) |
| Education Instruction & Library | 2 (33.3%) | 4 (66.7%) |
| Arts, Media & Entertainment | 0 (0.0%) | 0 (0.0%) |
| Health Diagnosing & Treating | 0 (0.0%) | 8 (100.0%) |
| Health Technologists | 0 (0.0%) | 8 (100.0%) |
| Total (Category) | 8 (20.5%) | 31 (79.5%) |
| Total (Overall) | 111 (57.5%) | 82 (42.5%) |
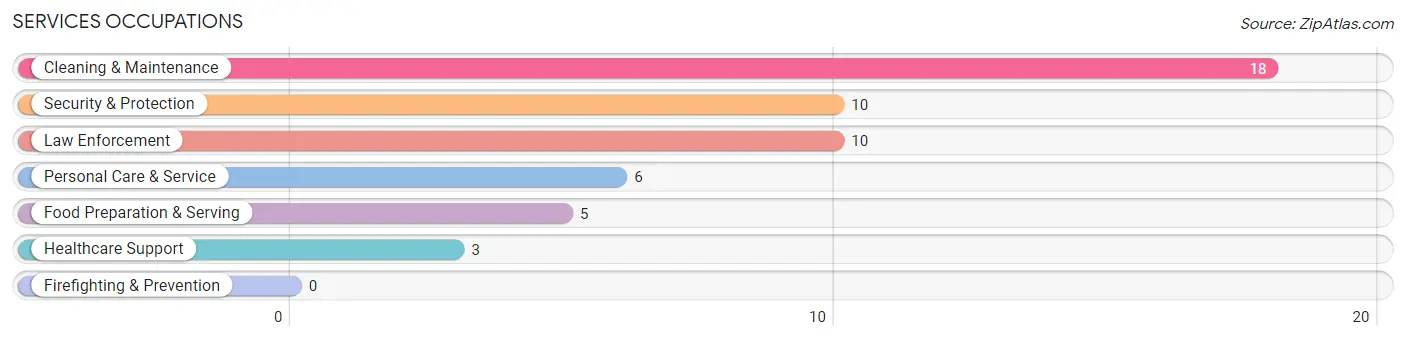
Services Occupations
The most common Services occupations in McKenney are Cleaning & Maintenance (18 | 9.3%), Security & Protection (10 | 5.2%), Law Enforcement (10 | 5.2%), Personal Care & Service (6 | 3.1%), and Food Preparation & Serving (5 | 2.6%).
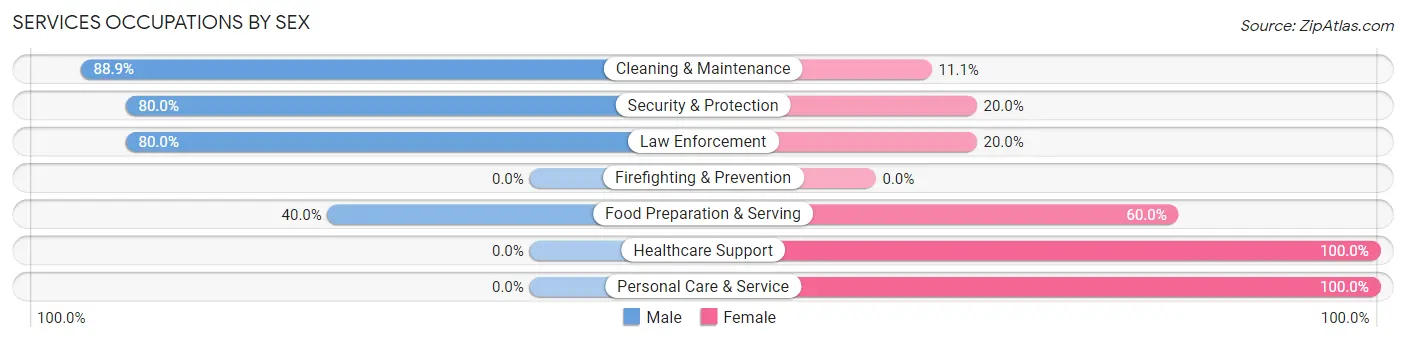
Services Occupations by Sex
Within the Services occupations in McKenney, the most male-oriented occupations are Cleaning & Maintenance (88.9%), Security & Protection (80.0%), and Law Enforcement (80.0%), while the most female-oriented occupations are Healthcare Support (100.0%), Personal Care & Service (100.0%), and Food Preparation & Serving (60.0%).
| Occupation | Male | Female |
| Healthcare Support | 0 (0.0%) | 3 (100.0%) |
| Security & Protection | 8 (80.0%) | 2 (20.0%) |
| Firefighting & Prevention | 0 (0.0%) | 0 (0.0%) |
| Law Enforcement | 8 (80.0%) | 2 (20.0%) |
| Food Preparation & Serving | 2 (40.0%) | 3 (60.0%) |
| Cleaning & Maintenance | 16 (88.9%) | 2 (11.1%) |
| Personal Care & Service | 0 (0.0%) | 6 (100.0%) |
| Total (Category) | 26 (61.9%) | 16 (38.1%) |
| Total (Overall) | 111 (57.5%) | 82 (42.5%) |
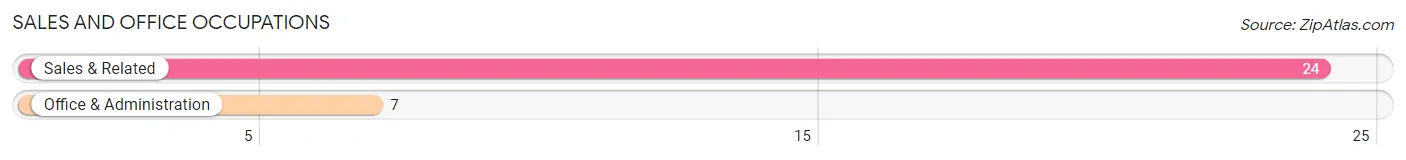
Sales and Office Occupations
The most common Sales and Office occupations in McKenney are Sales & Related (24 | 12.4%), and Office & Administration (7 | 3.6%).
Sales and Office Occupations by Sex
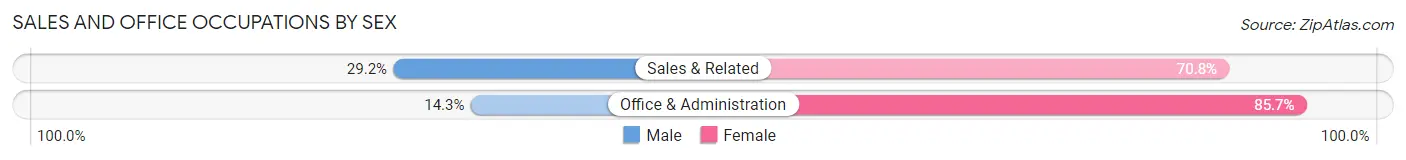
| Occupation | Male | Female |
| Sales & Related | 7 (29.2%) | 17 (70.8%) |
| Office & Administration | 1 (14.3%) | 6 (85.7%) |
| Total (Category) | 8 (25.8%) | 23 (74.2%) |
| Total (Overall) | 111 (57.5%) | 82 (42.5%) |
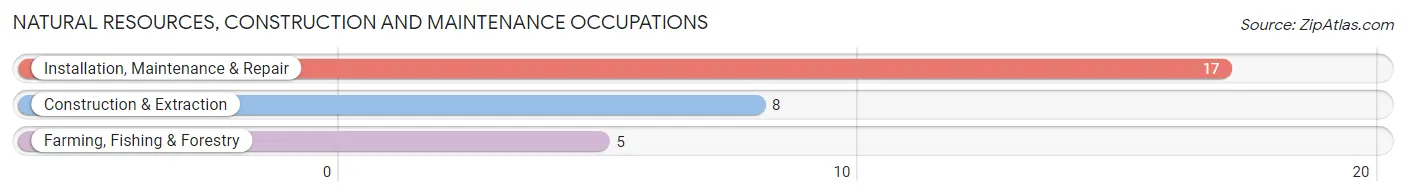
Natural Resources, Construction and Maintenance Occupations
The most common Natural Resources, Construction and Maintenance occupations in McKenney are Installation, Maintenance & Repair (17 | 8.8%), Construction & Extraction (8 | 4.2%), and Farming, Fishing & Forestry (5 | 2.6%).
Natural Resources, Construction and Maintenance Occupations by Sex
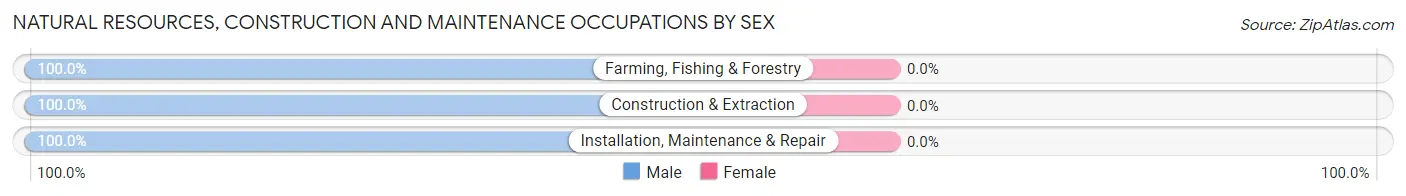
| Occupation | Male | Female |
| Farming, Fishing & Forestry | 5 (100.0%) | 0 (0.0%) |
| Construction & Extraction | 8 (100.0%) | 0 (0.0%) |
| Installation, Maintenance & Repair | 17 (100.0%) | 0 (0.0%) |
| Total (Category) | 30 (100.0%) | 0 (0.0%) |
| Total (Overall) | 111 (57.5%) | 82 (42.5%) |
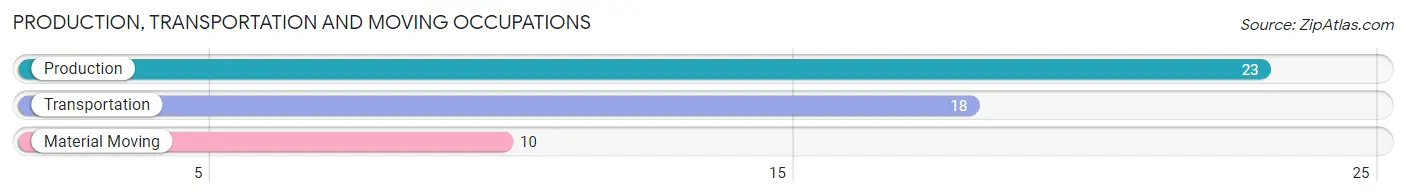
Production, Transportation and Moving Occupations
The most common Production, Transportation and Moving occupations in McKenney are Production (23 | 11.9%), Transportation (18 | 9.3%), and Material Moving (10 | 5.2%).
Production, Transportation and Moving Occupations by Sex
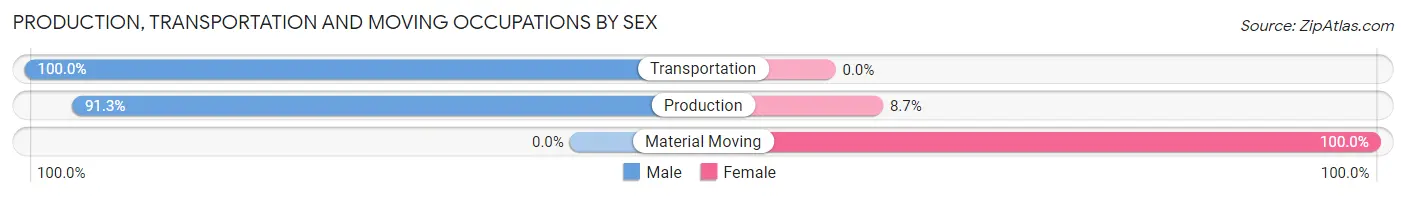
| Occupation | Male | Female |
| Production | 21 (91.3%) | 2 (8.7%) |
| Transportation | 18 (100.0%) | 0 (0.0%) |
| Material Moving | 0 (0.0%) | 10 (100.0%) |
| Total (Category) | 39 (76.5%) | 12 (23.5%) |
| Total (Overall) | 111 (57.5%) | 82 (42.5%) |
Employment Industries by Sex in McKenney
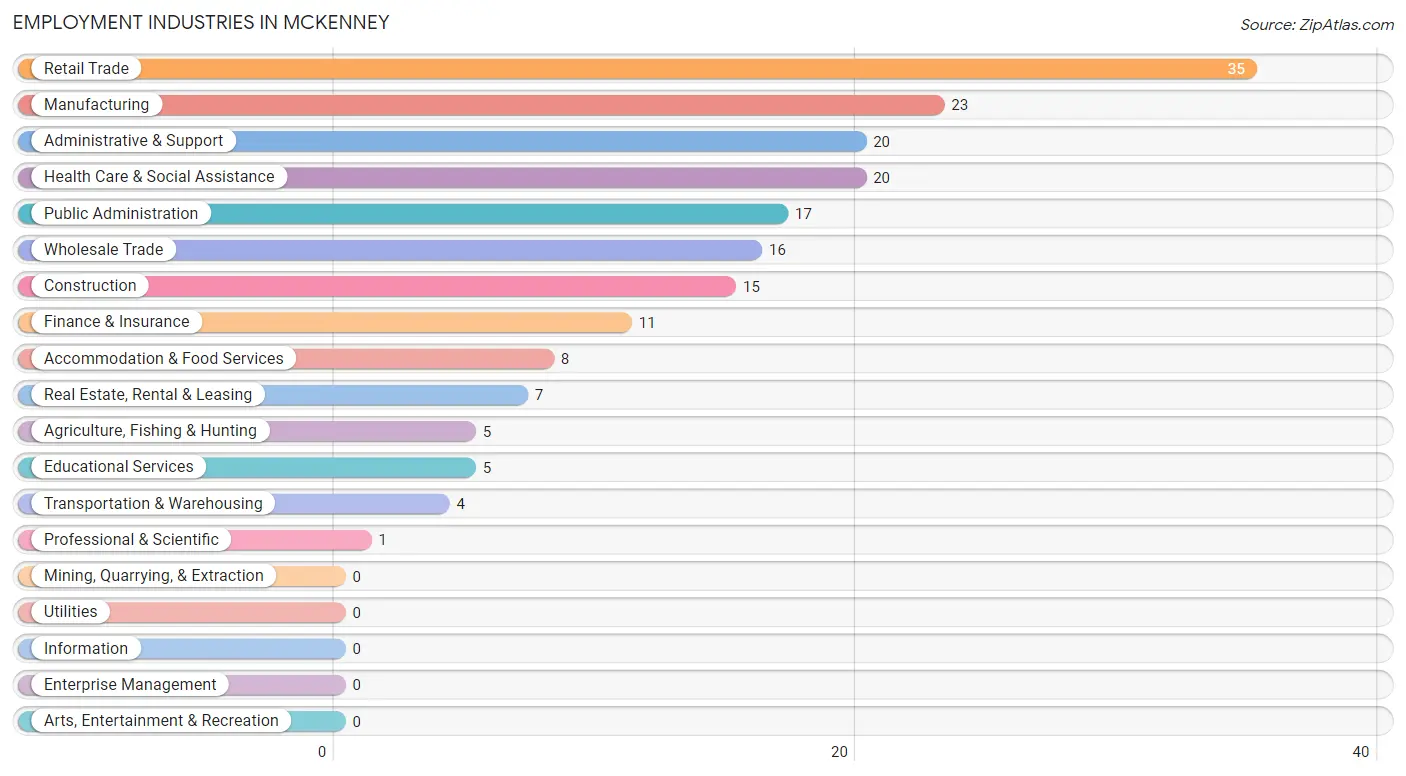
Employment Industries in McKenney
The major employment industries in McKenney include Retail Trade (35 | 18.1%), Manufacturing (23 | 11.9%), Administrative & Support (20 | 10.4%), Health Care & Social Assistance (20 | 10.4%), and Public Administration (17 | 8.8%).
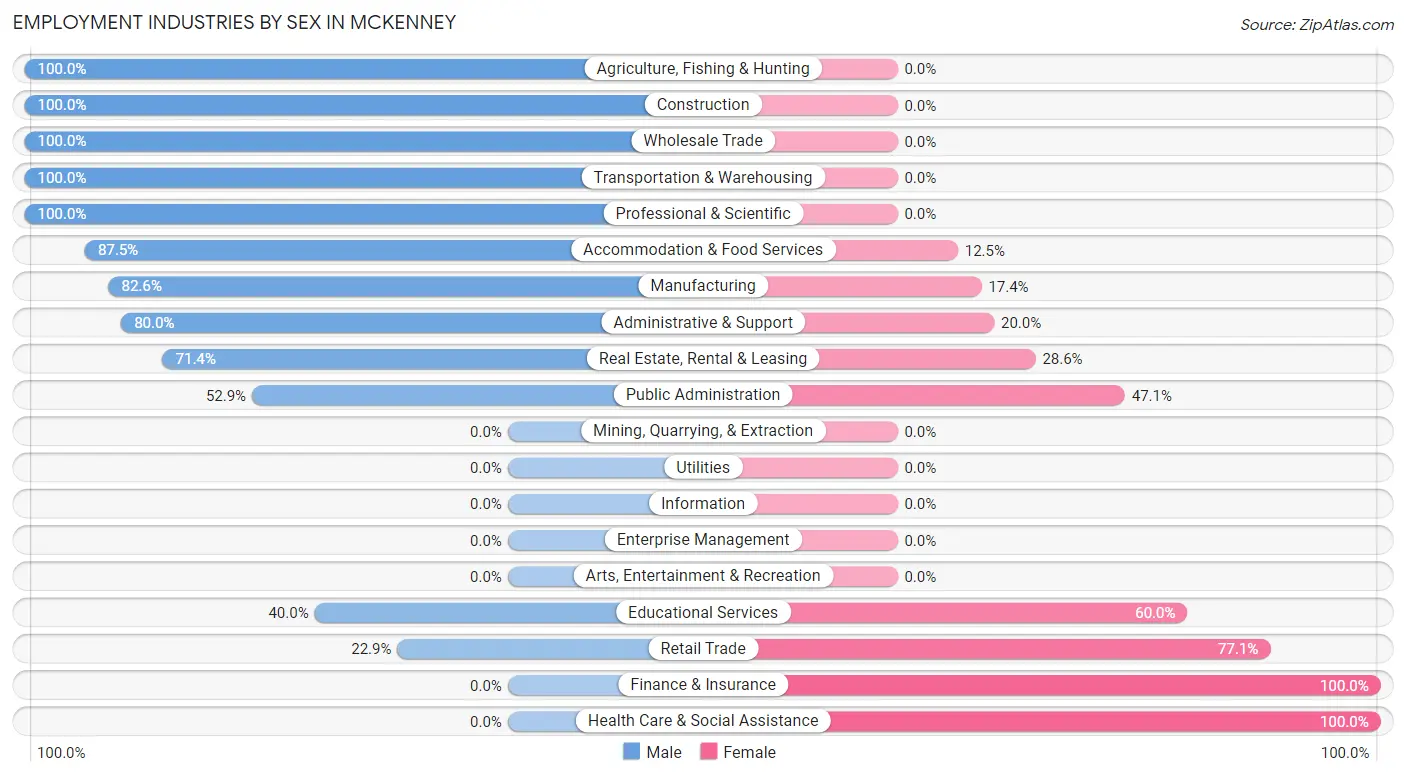
Employment Industries by Sex in McKenney
The McKenney industries that see more men than women are Agriculture, Fishing & Hunting (100.0%), Construction (100.0%), and Wholesale Trade (100.0%), whereas the industries that tend to have a higher number of women are Finance & Insurance (100.0%), Health Care & Social Assistance (100.0%), and Retail Trade (77.1%).
| Industry | Male | Female |
| Agriculture, Fishing & Hunting | 5 (100.0%) | 0 (0.0%) |
| Mining, Quarrying, & Extraction | 0 (0.0%) | 0 (0.0%) |
| Construction | 15 (100.0%) | 0 (0.0%) |
| Manufacturing | 19 (82.6%) | 4 (17.4%) |
| Wholesale Trade | 16 (100.0%) | 0 (0.0%) |
| Retail Trade | 8 (22.9%) | 27 (77.1%) |
| Transportation & Warehousing | 4 (100.0%) | 0 (0.0%) |
| Utilities | 0 (0.0%) | 0 (0.0%) |
| Information | 0 (0.0%) | 0 (0.0%) |
| Finance & Insurance | 0 (0.0%) | 11 (100.0%) |
| Real Estate, Rental & Leasing | 5 (71.4%) | 2 (28.6%) |
| Professional & Scientific | 1 (100.0%) | 0 (0.0%) |
| Enterprise Management | 0 (0.0%) | 0 (0.0%) |
| Administrative & Support | 16 (80.0%) | 4 (20.0%) |
| Educational Services | 2 (40.0%) | 3 (60.0%) |
| Health Care & Social Assistance | 0 (0.0%) | 20 (100.0%) |
| Arts, Entertainment & Recreation | 0 (0.0%) | 0 (0.0%) |
| Accommodation & Food Services | 7 (87.5%) | 1 (12.5%) |
| Public Administration | 9 (52.9%) | 8 (47.1%) |
| Total | 111 (57.5%) | 82 (42.5%) |
Education in McKenney
School Enrollment in McKenney
The most common levels of schooling among the 136 students in McKenney are middle school (63 | 46.3%), elementary school (34 | 25.0%), and college / undergraduate (17 | 12.5%).
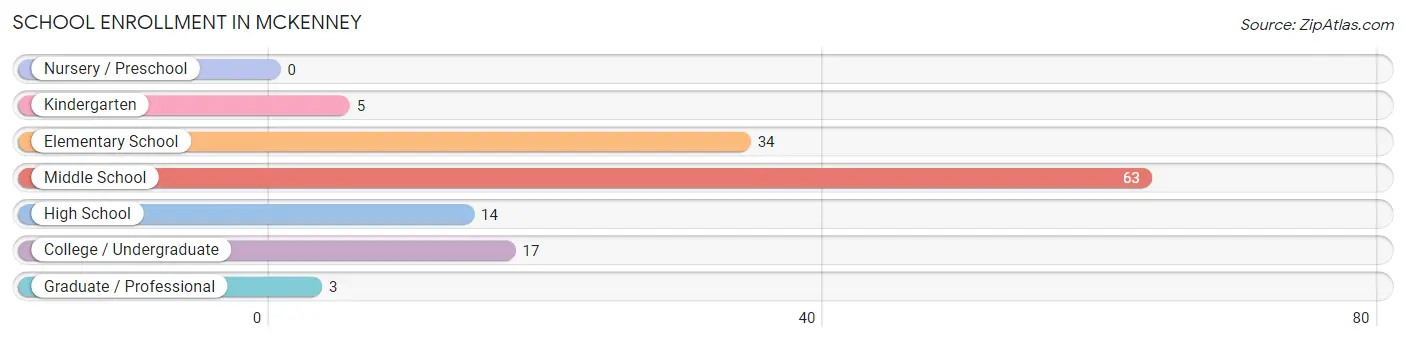
| School Level | # Students | % Students |
| Nursery / Preschool | 0 | 0.0% |
| Kindergarten | 5 | 3.7% |
| Elementary School | 34 | 25.0% |
| Middle School | 63 | 46.3% |
| High School | 14 | 10.3% |
| College / Undergraduate | 17 | 12.5% |
| Graduate / Professional | 3 | 2.2% |
| Total | 136 | 100.0% |
School Enrollment by Age by Funding Source in McKenney
Out of a total of 136 students who are enrolled in schools in McKenney, 10 (7.4%) attend a private institution, while the remaining 126 (92.6%) are enrolled in public schools. The age group of 35 years and over has the highest likelihood of being enrolled in private schools, with 2 (22.2% in the age bracket) enrolled. Conversely, the age group of 18 to 19 year olds has the lowest likelihood of being enrolled in a private school, with 5 (100.0% in the age bracket) attending a public institution.
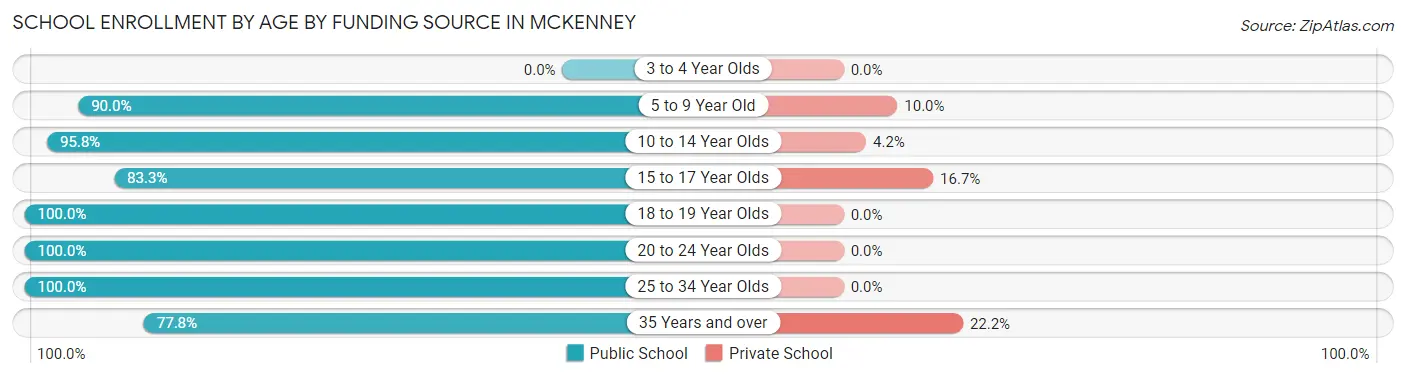
| Age Bracket | Public School | Private School |
| 3 to 4 Year Olds | 0 (0.0%) | 0 (0.0%) |
| 5 to 9 Year Old | 27 (90.0%) | 3 (10.0%) |
| 10 to 14 Year Olds | 69 (95.8%) | 3 (4.2%) |
| 15 to 17 Year Olds | 10 (83.3%) | 2 (16.7%) |
| 18 to 19 Year Olds | 5 (100.0%) | 0 (0.0%) |
| 20 to 24 Year Olds | 2 (100.0%) | 0 (0.0%) |
| 25 to 34 Year Olds | 6 (100.0%) | 0 (0.0%) |
| 35 Years and over | 7 (77.8%) | 2 (22.2%) |
| Total | 126 (92.6%) | 10 (7.4%) |
Educational Attainment by Field of Study in McKenney
Business (13 | 34.2%), science & technology (7 | 18.4%), multidisciplinary studies (4 | 10.5%), computers & mathematics (3 | 7.9%), and bio, nature & agricultural (2 | 5.3%) are the most common fields of study among 38 individuals in McKenney who have obtained a bachelor's degree or higher.
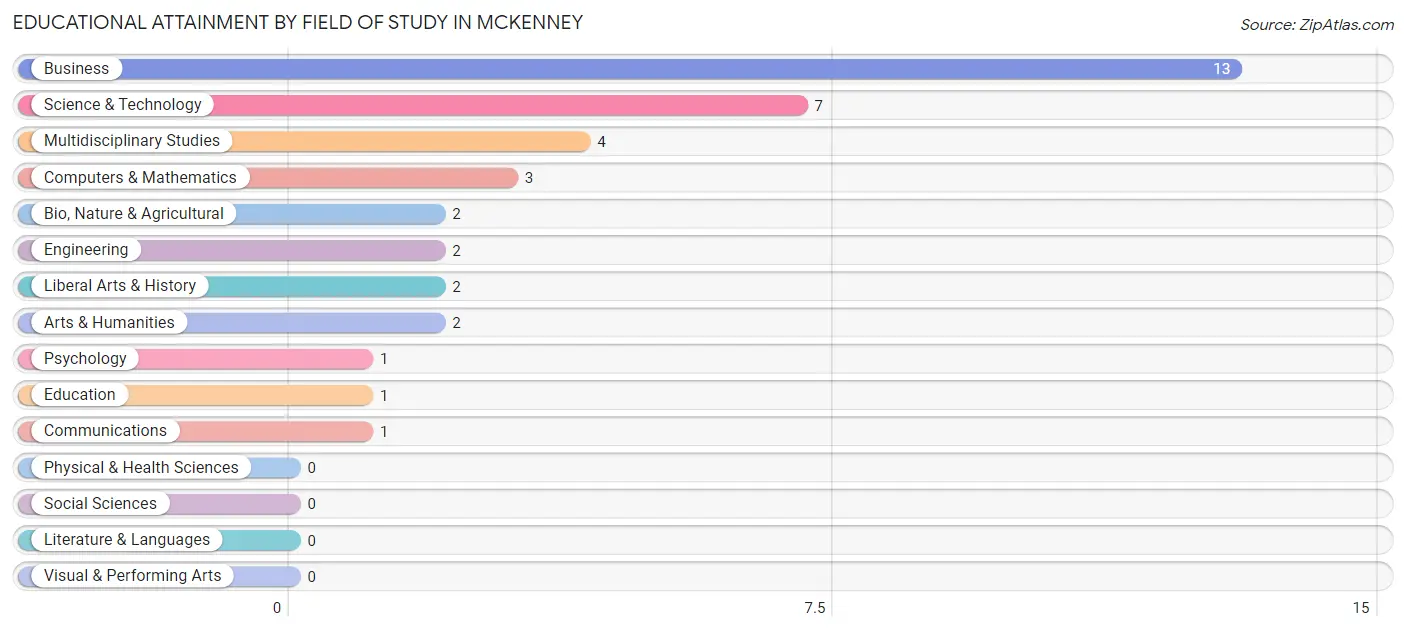
| Field of Study | # Graduates | % Graduates |
| Computers & Mathematics | 3 | 7.9% |
| Bio, Nature & Agricultural | 2 | 5.3% |
| Physical & Health Sciences | 0 | 0.0% |
| Psychology | 1 | 2.6% |
| Social Sciences | 0 | 0.0% |
| Engineering | 2 | 5.3% |
| Multidisciplinary Studies | 4 | 10.5% |
| Science & Technology | 7 | 18.4% |
| Business | 13 | 34.2% |
| Education | 1 | 2.6% |
| Literature & Languages | 0 | 0.0% |
| Liberal Arts & History | 2 | 5.3% |
| Visual & Performing Arts | 0 | 0.0% |
| Communications | 1 | 2.6% |
| Arts & Humanities | 2 | 5.3% |
| Total | 38 | 100.0% |
Transportation & Commute in McKenney
Vehicle Availability by Sex in McKenney
The most prevalent vehicle ownership categories in McKenney are males with 2 vehicles (43, accounting for 39.5%) and females with 2 vehicles (32, making up 52.4%).
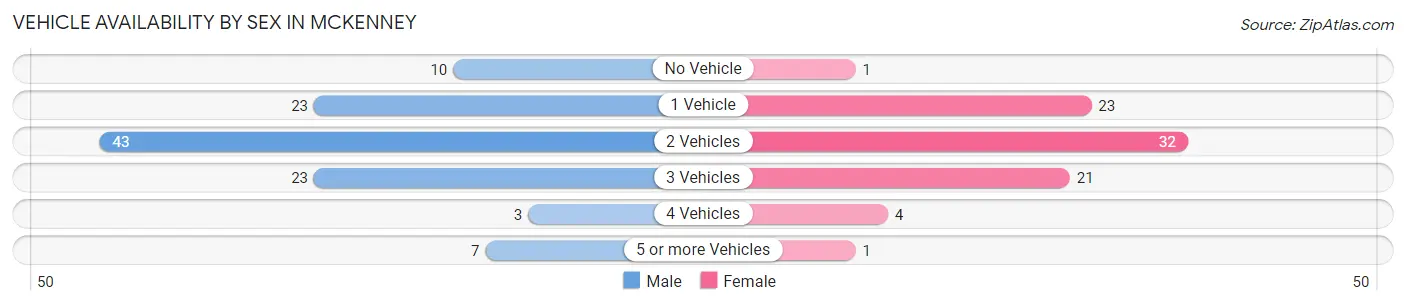
| Vehicles Available | Male | Female |
| No Vehicle | 10 (9.2%) | 1 (1.2%) |
| 1 Vehicle | 23 (21.1%) | 23 (28.1%) |
| 2 Vehicles | 43 (39.5%) | 32 (39.0%) |
| 3 Vehicles | 23 (21.1%) | 21 (25.6%) |
| 4 Vehicles | 3 (2.8%) | 4 (4.9%) |
| 5 or more Vehicles | 7 (6.4%) | 1 (1.2%) |
| Total | 109 (100.0%) | 82 (100.0%) |
Commute Time in McKenney
The most frequently occuring commute durations in McKenney are 60 to 89 minutes (42 commuters, 22.3%), 40 to 44 minutes (25 commuters, 13.3%), and 20 to 24 minutes (24 commuters, 12.8%).
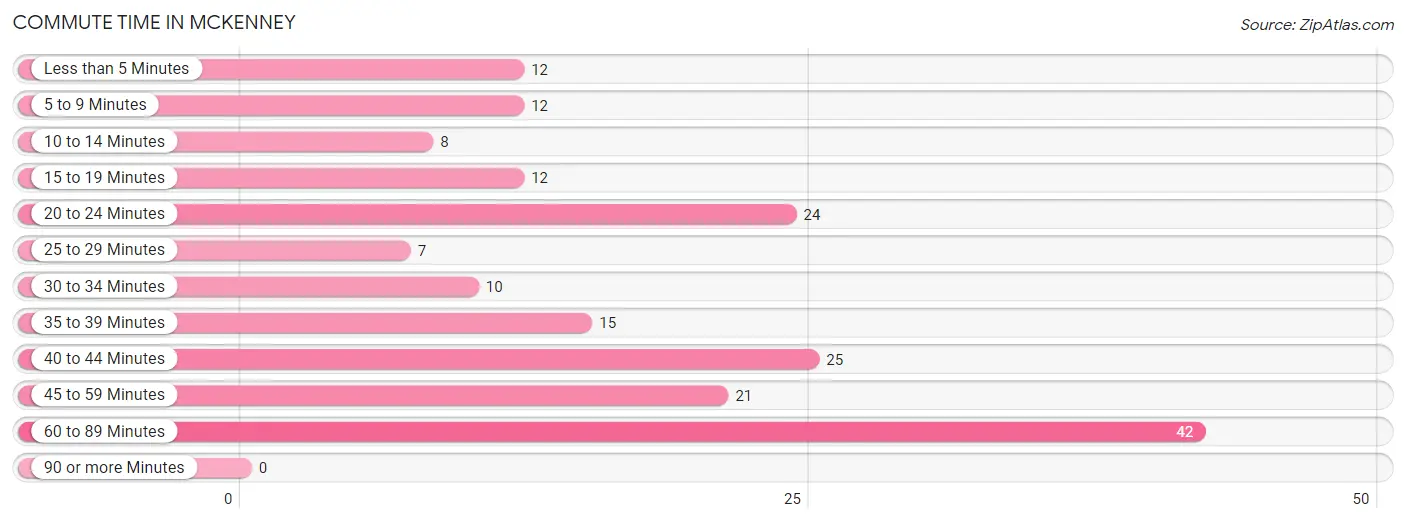
| Commute Time | # Commuters | % Commuters |
| Less than 5 Minutes | 12 | 6.4% |
| 5 to 9 Minutes | 12 | 6.4% |
| 10 to 14 Minutes | 8 | 4.3% |
| 15 to 19 Minutes | 12 | 6.4% |
| 20 to 24 Minutes | 24 | 12.8% |
| 25 to 29 Minutes | 7 | 3.7% |
| 30 to 34 Minutes | 10 | 5.3% |
| 35 to 39 Minutes | 15 | 8.0% |
| 40 to 44 Minutes | 25 | 13.3% |
| 45 to 59 Minutes | 21 | 11.2% |
| 60 to 89 Minutes | 42 | 22.3% |
| 90 or more Minutes | 0 | 0.0% |
Commute Time by Sex in McKenney
The most common commute times in McKenney are 60 to 89 minutes (36 commuters, 33.3%) for males and 20 to 24 minutes (16 commuters, 20.0%) for females.
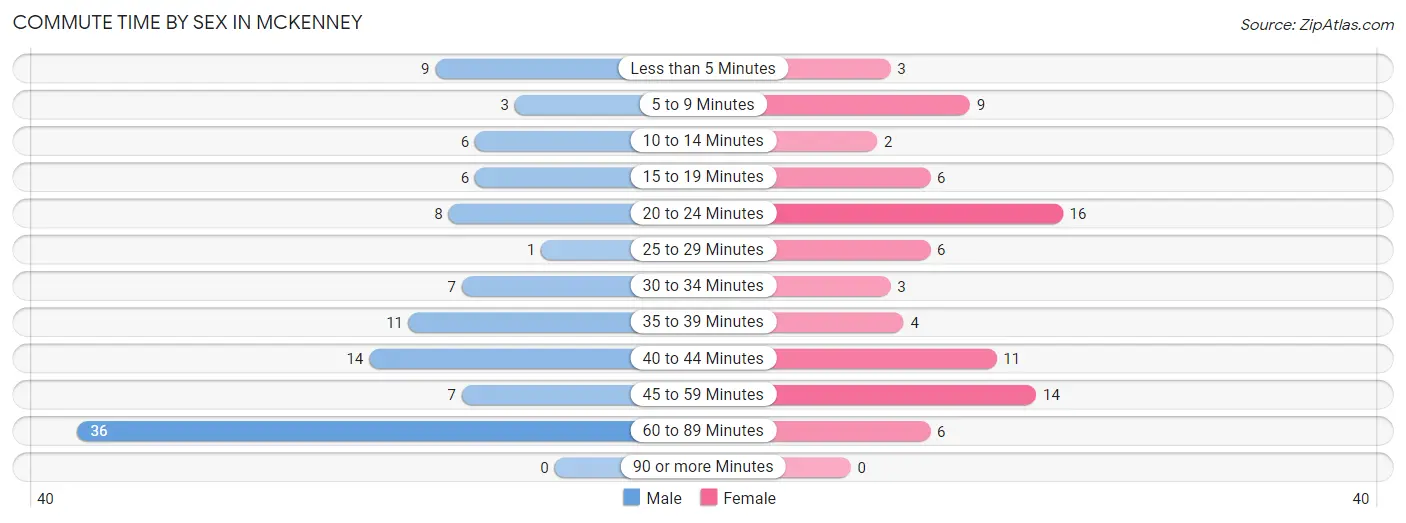
| Commute Time | Male | Female |
| Less than 5 Minutes | 9 (8.3%) | 3 (3.7%) |
| 5 to 9 Minutes | 3 (2.8%) | 9 (11.3%) |
| 10 to 14 Minutes | 6 (5.6%) | 2 (2.5%) |
| 15 to 19 Minutes | 6 (5.6%) | 6 (7.5%) |
| 20 to 24 Minutes | 8 (7.4%) | 16 (20.0%) |
| 25 to 29 Minutes | 1 (0.9%) | 6 (7.5%) |
| 30 to 34 Minutes | 7 (6.5%) | 3 (3.7%) |
| 35 to 39 Minutes | 11 (10.2%) | 4 (5.0%) |
| 40 to 44 Minutes | 14 (13.0%) | 11 (13.8%) |
| 45 to 59 Minutes | 7 (6.5%) | 14 (17.5%) |
| 60 to 89 Minutes | 36 (33.3%) | 6 (7.5%) |
| 90 or more Minutes | 0 (0.0%) | 0 (0.0%) |
Time of Departure to Work by Sex in McKenney
The most frequent times of departure to work in McKenney are 5:30 AM to 5:59 AM (25, 23.2%) for males and 7:30 AM to 7:59 AM (22, 27.5%) for females.
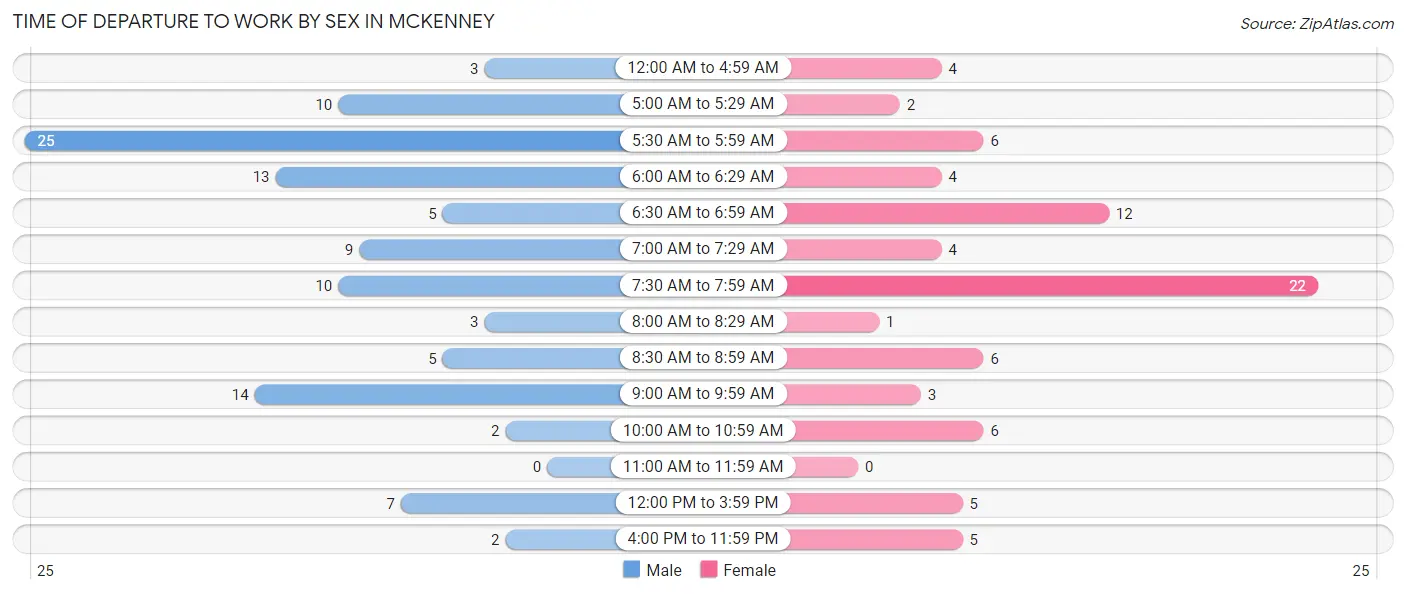
| Time of Departure | Male | Female |
| 12:00 AM to 4:59 AM | 3 (2.8%) | 4 (5.0%) |
| 5:00 AM to 5:29 AM | 10 (9.3%) | 2 (2.5%) |
| 5:30 AM to 5:59 AM | 25 (23.2%) | 6 (7.5%) |
| 6:00 AM to 6:29 AM | 13 (12.0%) | 4 (5.0%) |
| 6:30 AM to 6:59 AM | 5 (4.6%) | 12 (15.0%) |
| 7:00 AM to 7:29 AM | 9 (8.3%) | 4 (5.0%) |
| 7:30 AM to 7:59 AM | 10 (9.3%) | 22 (27.5%) |
| 8:00 AM to 8:29 AM | 3 (2.8%) | 1 (1.3%) |
| 8:30 AM to 8:59 AM | 5 (4.6%) | 6 (7.5%) |
| 9:00 AM to 9:59 AM | 14 (13.0%) | 3 (3.7%) |
| 10:00 AM to 10:59 AM | 2 (1.8%) | 6 (7.5%) |
| 11:00 AM to 11:59 AM | 0 (0.0%) | 0 (0.0%) |
| 12:00 PM to 3:59 PM | 7 (6.5%) | 5 (6.2%) |
| 4:00 PM to 11:59 PM | 2 (1.8%) | 5 (6.2%) |
| Total | 108 (100.0%) | 80 (100.0%) |
Housing Occupancy in McKenney
Occupancy by Ownership in McKenney
Of the total 211 dwellings in McKenney, owner-occupied units account for 141 (66.8%), while renter-occupied units make up 70 (33.2%).
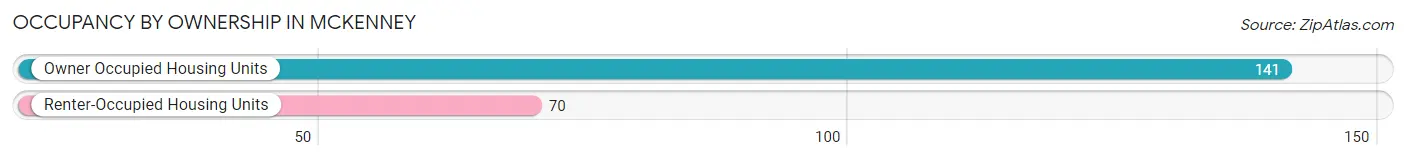
| Occupancy | # Housing Units | % Housing Units |
| Owner Occupied Housing Units | 141 | 66.8% |
| Renter-Occupied Housing Units | 70 | 33.2% |
| Total Occupied Housing Units | 211 | 100.0% |
Occupancy by Household Size in McKenney
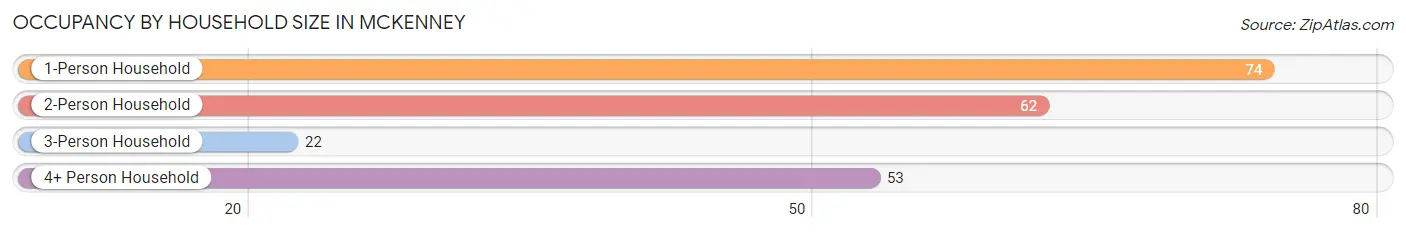
| Household Size | # Housing Units | % Housing Units |
| 1-Person Household | 74 | 35.1% |
| 2-Person Household | 62 | 29.4% |
| 3-Person Household | 22 | 10.4% |
| 4+ Person Household | 53 | 25.1% |
| Total Housing Units | 211 | 100.0% |
Occupancy by Ownership by Household Size in McKenney
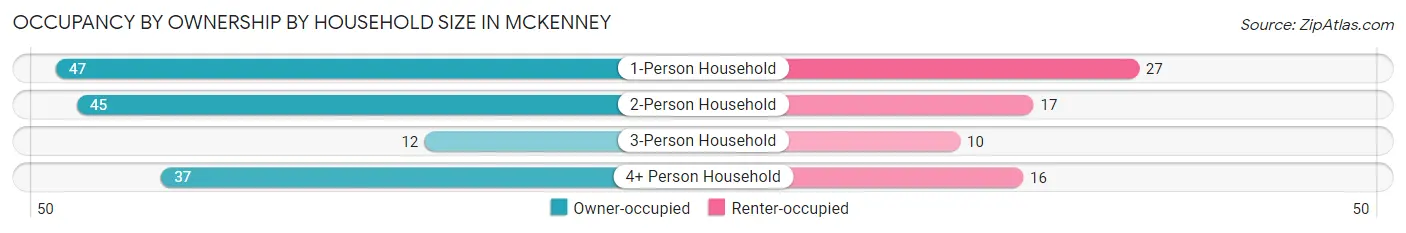
| Household Size | Owner-occupied | Renter-occupied |
| 1-Person Household | 47 (63.5%) | 27 (36.5%) |
| 2-Person Household | 45 (72.6%) | 17 (27.4%) |
| 3-Person Household | 12 (54.5%) | 10 (45.5%) |
| 4+ Person Household | 37 (69.8%) | 16 (30.2%) |
| Total Housing Units | 141 (66.8%) | 70 (33.2%) |
Occupancy by Educational Attainment in McKenney
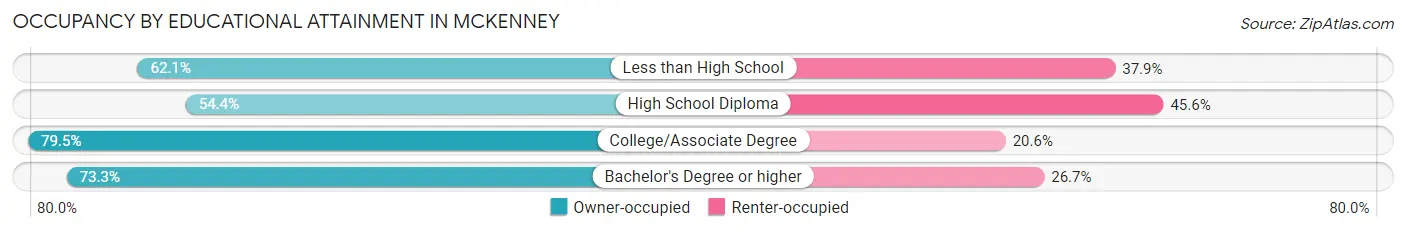
| Household Size | Owner-occupied | Renter-occupied |
| Less than High School | 18 (62.1%) | 11 (37.9%) |
| High School Diploma | 43 (54.4%) | 36 (45.6%) |
| College/Associate Degree | 58 (79.4%) | 15 (20.5%) |
| Bachelor's Degree or higher | 22 (73.3%) | 8 (26.7%) |
Occupancy by Age of Householder in McKenney
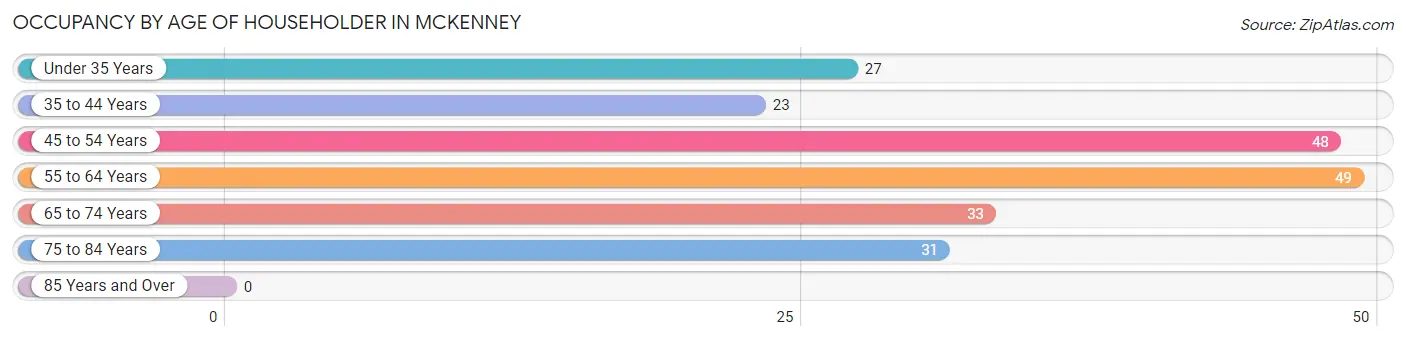
| Age Bracket | # Households | % Households |
| Under 35 Years | 27 | 12.8% |
| 35 to 44 Years | 23 | 10.9% |
| 45 to 54 Years | 48 | 22.8% |
| 55 to 64 Years | 49 | 23.2% |
| 65 to 74 Years | 33 | 15.6% |
| 75 to 84 Years | 31 | 14.7% |
| 85 Years and Over | 0 | 0.0% |
| Total | 211 | 100.0% |
Housing Finances in McKenney
Median Income by Occupancy in McKenney
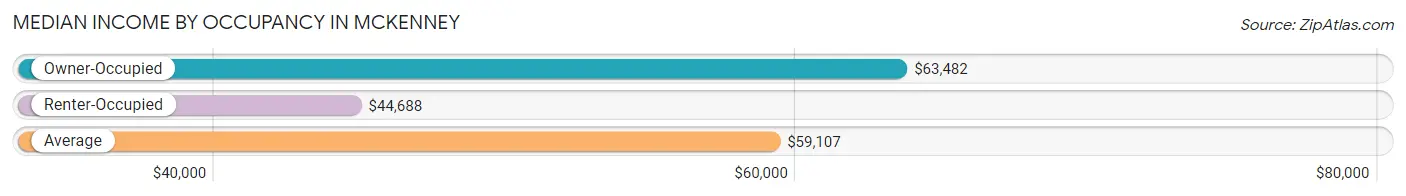
| Occupancy Type | # Households | Median Income |
| Owner-Occupied | 141 (66.8%) | $63,482 |
| Renter-Occupied | 70 (33.2%) | $44,688 |
| Average | 211 (100.0%) | $59,107 |
Occupancy by Householder Income Bracket in McKenney
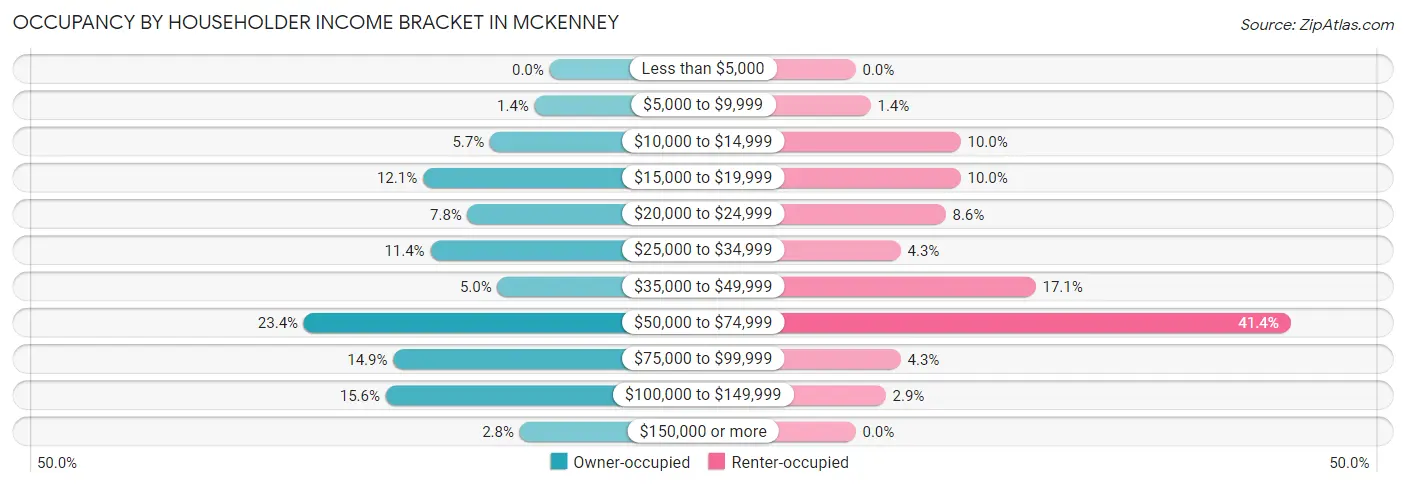
| Income Bracket | Owner-occupied | Renter-occupied |
| Less than $5,000 | 0 (0.0%) | 0 (0.0%) |
| $5,000 to $9,999 | 2 (1.4%) | 1 (1.4%) |
| $10,000 to $14,999 | 8 (5.7%) | 7 (10.0%) |
| $15,000 to $19,999 | 17 (12.1%) | 7 (10.0%) |
| $20,000 to $24,999 | 11 (7.8%) | 6 (8.6%) |
| $25,000 to $34,999 | 16 (11.4%) | 3 (4.3%) |
| $35,000 to $49,999 | 7 (5.0%) | 12 (17.1%) |
| $50,000 to $74,999 | 33 (23.4%) | 29 (41.4%) |
| $75,000 to $99,999 | 21 (14.9%) | 3 (4.3%) |
| $100,000 to $149,999 | 22 (15.6%) | 2 (2.9%) |
| $150,000 or more | 4 (2.8%) | 0 (0.0%) |
| Total | 141 (100.0%) | 70 (100.0%) |
Monthly Housing Cost Tiers in McKenney
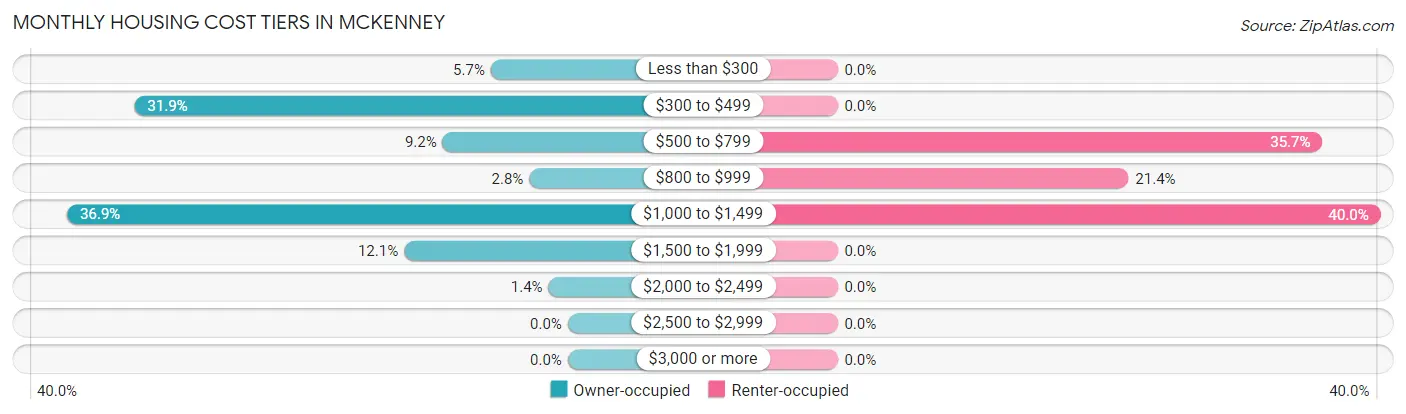
| Monthly Cost | Owner-occupied | Renter-occupied |
| Less than $300 | 8 (5.7%) | 0 (0.0%) |
| $300 to $499 | 45 (31.9%) | 0 (0.0%) |
| $500 to $799 | 13 (9.2%) | 25 (35.7%) |
| $800 to $999 | 4 (2.8%) | 15 (21.4%) |
| $1,000 to $1,499 | 52 (36.9%) | 28 (40.0%) |
| $1,500 to $1,999 | 17 (12.1%) | 0 (0.0%) |
| $2,000 to $2,499 | 2 (1.4%) | 0 (0.0%) |
| $2,500 to $2,999 | 0 (0.0%) | 0 (0.0%) |
| $3,000 or more | 0 (0.0%) | 0 (0.0%) |
| Total | 141 (100.0%) | 70 (100.0%) |
Physical Housing Characteristics in McKenney
Housing Structures in McKenney
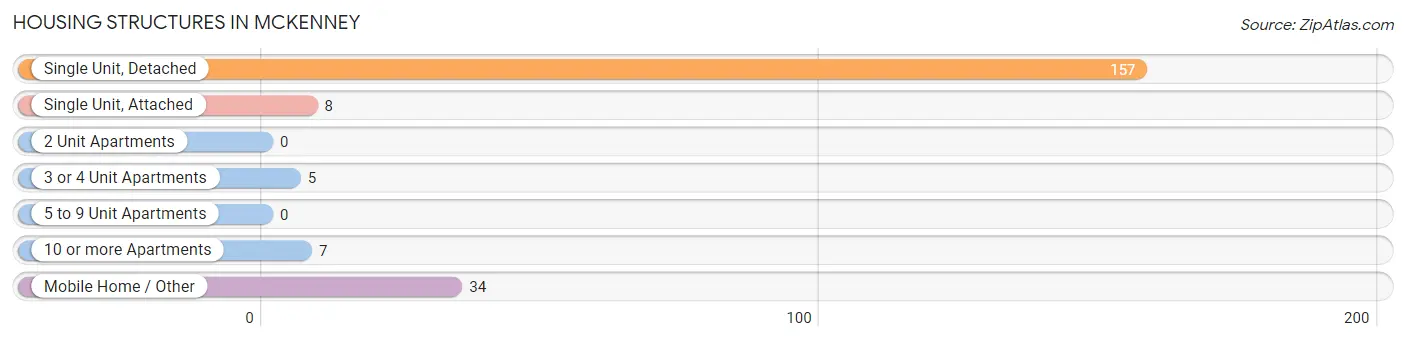
| Structure Type | # Housing Units | % Housing Units |
| Single Unit, Detached | 157 | 74.4% |
| Single Unit, Attached | 8 | 3.8% |
| 2 Unit Apartments | 0 | 0.0% |
| 3 or 4 Unit Apartments | 5 | 2.4% |
| 5 to 9 Unit Apartments | 0 | 0.0% |
| 10 or more Apartments | 7 | 3.3% |
| Mobile Home / Other | 34 | 16.1% |
| Total | 211 | 100.0% |
Housing Structures by Occupancy in McKenney
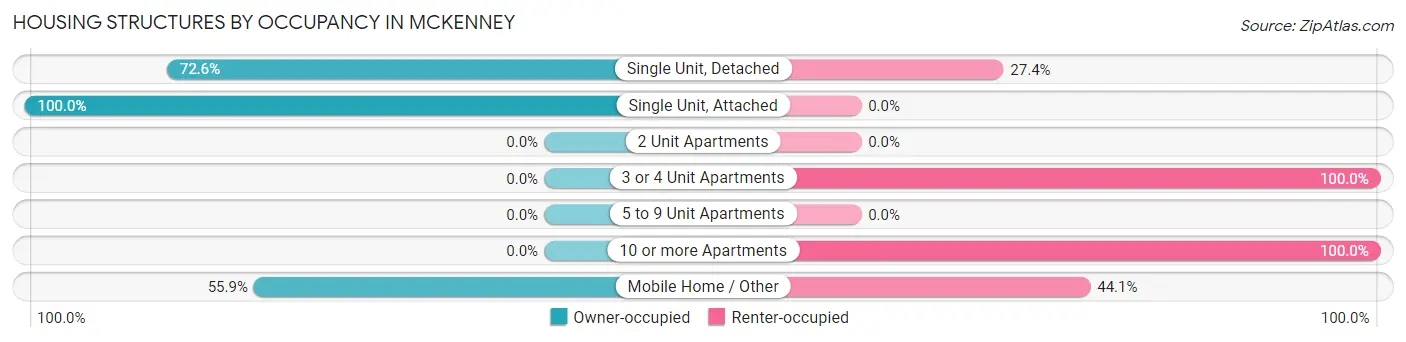
| Structure Type | Owner-occupied | Renter-occupied |
| Single Unit, Detached | 114 (72.6%) | 43 (27.4%) |
| Single Unit, Attached | 8 (100.0%) | 0 (0.0%) |
| 2 Unit Apartments | 0 (0.0%) | 0 (0.0%) |
| 3 or 4 Unit Apartments | 0 (0.0%) | 5 (100.0%) |
| 5 to 9 Unit Apartments | 0 (0.0%) | 0 (0.0%) |
| 10 or more Apartments | 0 (0.0%) | 7 (100.0%) |
| Mobile Home / Other | 19 (55.9%) | 15 (44.1%) |
| Total | 141 (66.8%) | 70 (33.2%) |
Housing Structures by Number of Rooms in McKenney
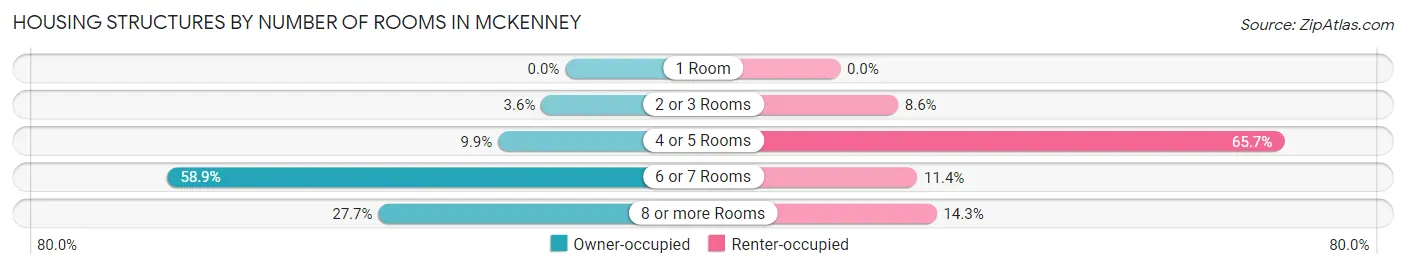
| Number of Rooms | Owner-occupied | Renter-occupied |
| 1 Room | 0 (0.0%) | 0 (0.0%) |
| 2 or 3 Rooms | 5 (3.5%) | 6 (8.6%) |
| 4 or 5 Rooms | 14 (9.9%) | 46 (65.7%) |
| 6 or 7 Rooms | 83 (58.9%) | 8 (11.4%) |
| 8 or more Rooms | 39 (27.7%) | 10 (14.3%) |
| Total | 141 (100.0%) | 70 (100.0%) |
Housing Structure by Heating Type in McKenney
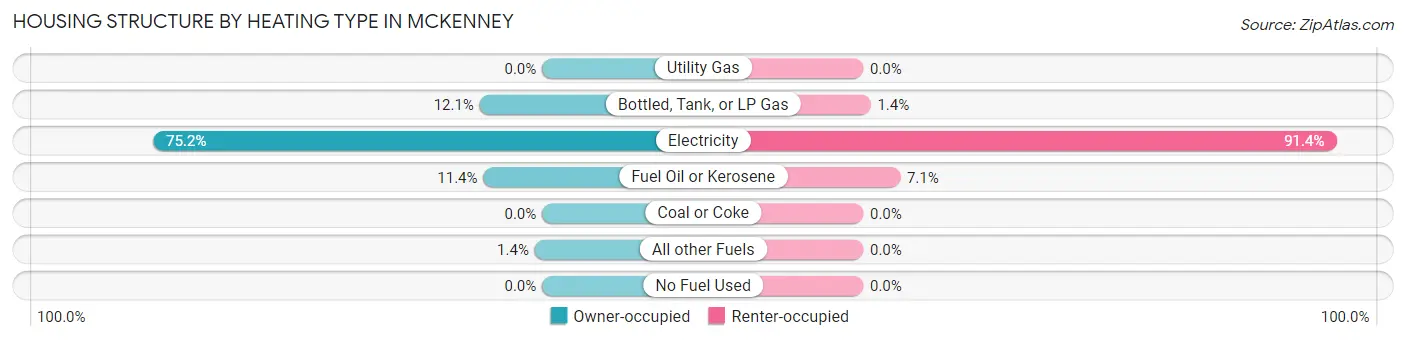
| Heating Type | Owner-occupied | Renter-occupied |
| Utility Gas | 0 (0.0%) | 0 (0.0%) |
| Bottled, Tank, or LP Gas | 17 (12.1%) | 1 (1.4%) |
| Electricity | 106 (75.2%) | 64 (91.4%) |
| Fuel Oil or Kerosene | 16 (11.4%) | 5 (7.1%) |
| Coal or Coke | 0 (0.0%) | 0 (0.0%) |
| All other Fuels | 2 (1.4%) | 0 (0.0%) |
| No Fuel Used | 0 (0.0%) | 0 (0.0%) |
| Total | 141 (100.0%) | 70 (100.0%) |
Household Vehicle Usage in McKenney
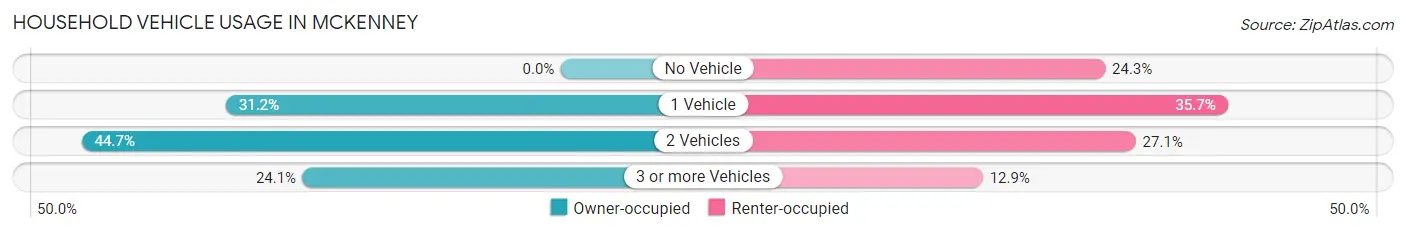
| Vehicles per Household | Owner-occupied | Renter-occupied |
| No Vehicle | 0 (0.0%) | 17 (24.3%) |
| 1 Vehicle | 44 (31.2%) | 25 (35.7%) |
| 2 Vehicles | 63 (44.7%) | 19 (27.1%) |
| 3 or more Vehicles | 34 (24.1%) | 9 (12.9%) |
| Total | 141 (100.0%) | 70 (100.0%) |
Real Estate & Mortgages in McKenney
Real Estate and Mortgage Overview in McKenney
| Characteristic | Without Mortgage | With Mortgage |
| Housing Units | 66 | 75 |
| Median Property Value | $104,500 | $206,300 |
| Median Household Income | - | - |
| Monthly Housing Costs | $434 | $0 |
| Real Estate Taxes | $918 | $1 |
Property Value by Mortgage Status in McKenney
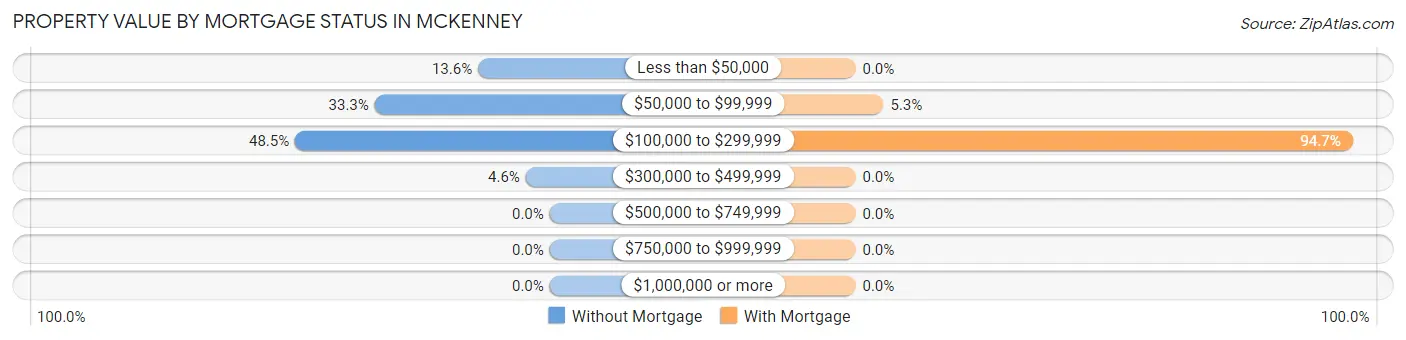
| Property Value | Without Mortgage | With Mortgage |
| Less than $50,000 | 9 (13.6%) | 0 (0.0%) |
| $50,000 to $99,999 | 22 (33.3%) | 4 (5.3%) |
| $100,000 to $299,999 | 32 (48.5%) | 71 (94.7%) |
| $300,000 to $499,999 | 3 (4.5%) | 0 (0.0%) |
| $500,000 to $749,999 | 0 (0.0%) | 0 (0.0%) |
| $750,000 to $999,999 | 0 (0.0%) | 0 (0.0%) |
| $1,000,000 or more | 0 (0.0%) | 0 (0.0%) |
| Total | 66 (100.0%) | 75 (100.0%) |
Household Income by Mortgage Status in McKenney
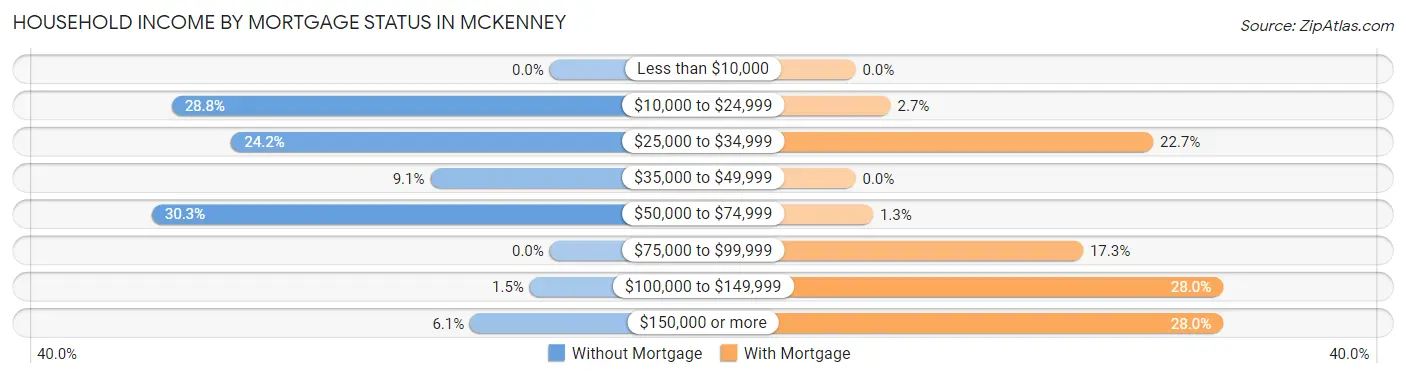
| Household Income | Without Mortgage | With Mortgage |
| Less than $10,000 | 0 (0.0%) | 0 (0.0%) |
| $10,000 to $24,999 | 19 (28.8%) | 2 (2.7%) |
| $25,000 to $34,999 | 16 (24.2%) | 17 (22.7%) |
| $35,000 to $49,999 | 6 (9.1%) | 0 (0.0%) |
| $50,000 to $74,999 | 20 (30.3%) | 1 (1.3%) |
| $75,000 to $99,999 | 0 (0.0%) | 13 (17.3%) |
| $100,000 to $149,999 | 1 (1.5%) | 21 (28.0%) |
| $150,000 or more | 4 (6.1%) | 21 (28.0%) |
| Total | 66 (100.0%) | 75 (100.0%) |
Property Value to Household Income Ratio in McKenney
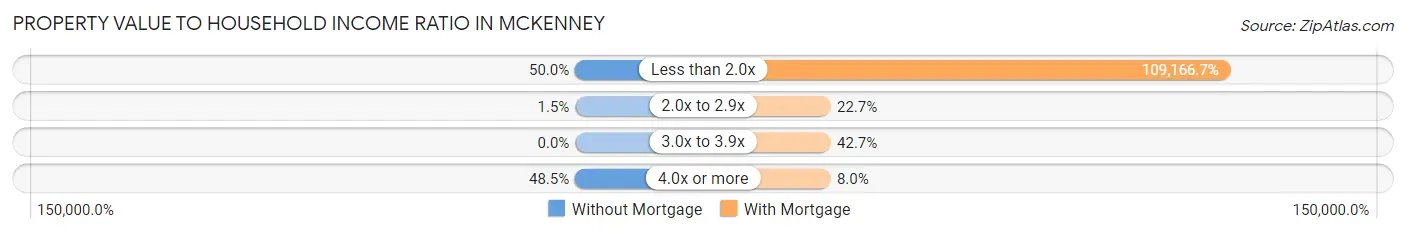
| Value-to-Income Ratio | Without Mortgage | With Mortgage |
| Less than 2.0x | 33 (50.0%) | 81,875 (109,166.7%) |
| 2.0x to 2.9x | 1 (1.5%) | 17 (22.7%) |
| 3.0x to 3.9x | 0 (0.0%) | 32 (42.7%) |
| 4.0x or more | 32 (48.5%) | 6 (8.0%) |
| Total | 66 (100.0%) | 75 (100.0%) |
Real Estate Taxes by Mortgage Status in McKenney
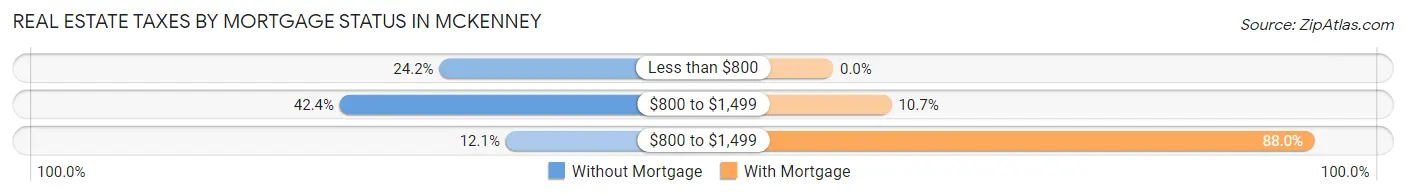
| Property Taxes | Without Mortgage | With Mortgage |
| Less than $800 | 16 (24.2%) | 0 (0.0%) |
| $800 to $1,499 | 28 (42.4%) | 8 (10.7%) |
| $800 to $1,499 | 8 (12.1%) | 66 (88.0%) |
| Total | 66 (100.0%) | 75 (100.0%) |
Health & Disability in McKenney
Health Insurance Coverage by Age in McKenney
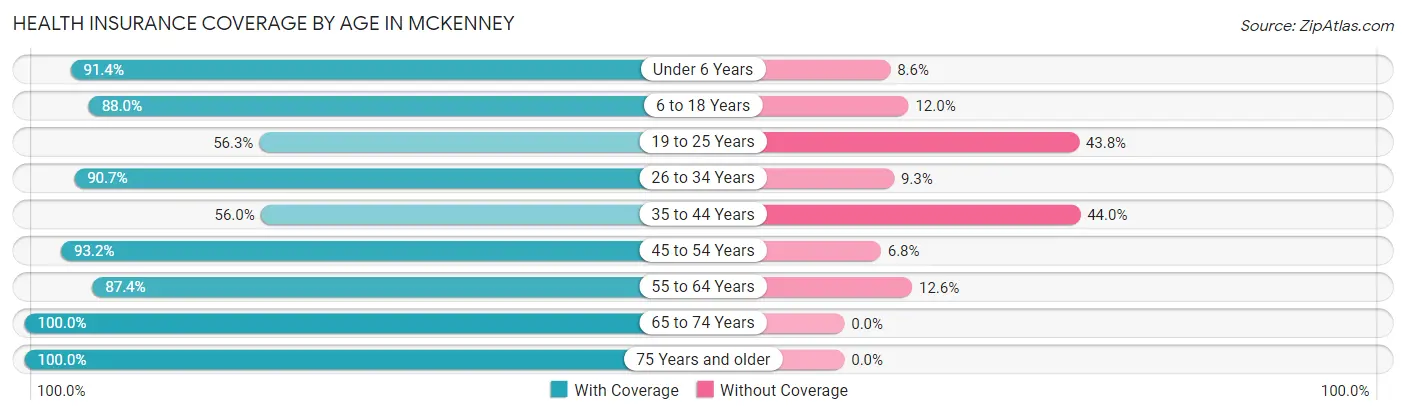
| Age Bracket | With Coverage | Without Coverage |
| Under 6 Years | 32 (91.4%) | 3 (8.6%) |
| 6 to 18 Years | 103 (88.0%) | 14 (12.0%) |
| 19 to 25 Years | 18 (56.2%) | 14 (43.8%) |
| 26 to 34 Years | 49 (90.7%) | 5 (9.3%) |
| 35 to 44 Years | 28 (56.0%) | 22 (44.0%) |
| 45 to 54 Years | 96 (93.2%) | 7 (6.8%) |
| 55 to 64 Years | 76 (87.4%) | 11 (12.6%) |
| 65 to 74 Years | 37 (100.0%) | 0 (0.0%) |
| 75 Years and older | 44 (100.0%) | 0 (0.0%) |
| Total | 483 (86.4%) | 76 (13.6%) |
Health Insurance Coverage by Citizenship Status in McKenney
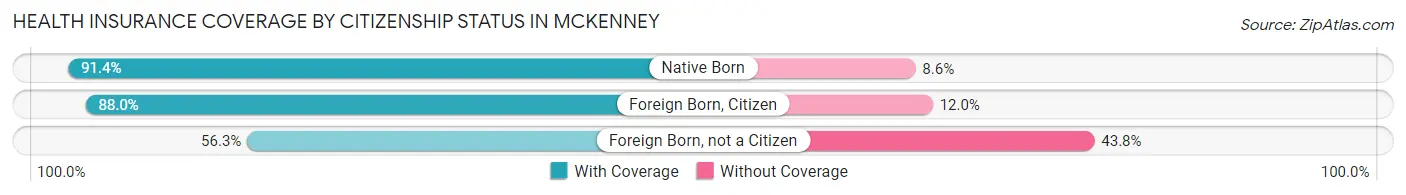
| Citizenship Status | With Coverage | Without Coverage |
| Native Born | 32 (91.4%) | 3 (8.6%) |
| Foreign Born, Citizen | 103 (88.0%) | 14 (12.0%) |
| Foreign Born, not a Citizen | 18 (56.2%) | 14 (43.8%) |
Health Insurance Coverage by Household Income in McKenney
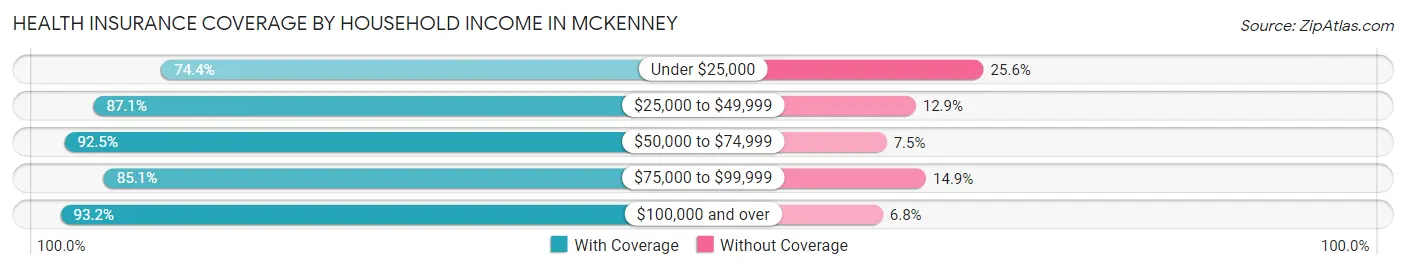
| Household Income | With Coverage | Without Coverage |
| Under $25,000 | 87 (74.4%) | 30 (25.6%) |
| $25,000 to $49,999 | 128 (87.1%) | 19 (12.9%) |
| $50,000 to $74,999 | 136 (92.5%) | 11 (7.5%) |
| $75,000 to $99,999 | 63 (85.1%) | 11 (14.9%) |
| $100,000 and over | 69 (93.2%) | 5 (6.8%) |
Public vs Private Health Insurance Coverage by Age in McKenney
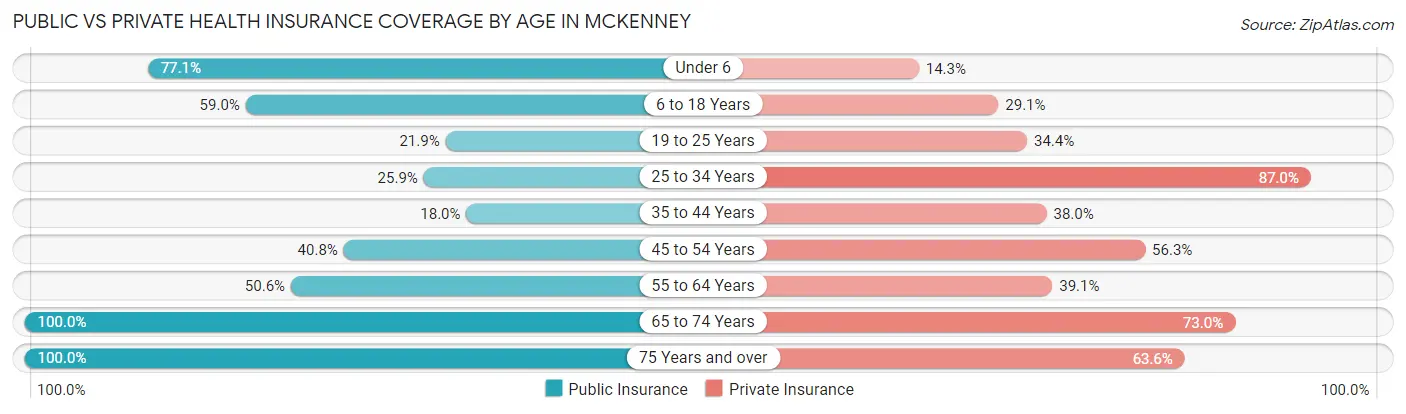
| Age Bracket | Public Insurance | Private Insurance |
| Under 6 | 27 (77.1%) | 5 (14.3%) |
| 6 to 18 Years | 69 (59.0%) | 34 (29.1%) |
| 19 to 25 Years | 7 (21.9%) | 11 (34.4%) |
| 25 to 34 Years | 14 (25.9%) | 47 (87.0%) |
| 35 to 44 Years | 9 (18.0%) | 19 (38.0%) |
| 45 to 54 Years | 42 (40.8%) | 58 (56.3%) |
| 55 to 64 Years | 44 (50.6%) | 34 (39.1%) |
| 65 to 74 Years | 37 (100.0%) | 27 (73.0%) |
| 75 Years and over | 44 (100.0%) | 28 (63.6%) |
| Total | 293 (52.4%) | 263 (47.0%) |
Disability Status by Sex by Age in McKenney
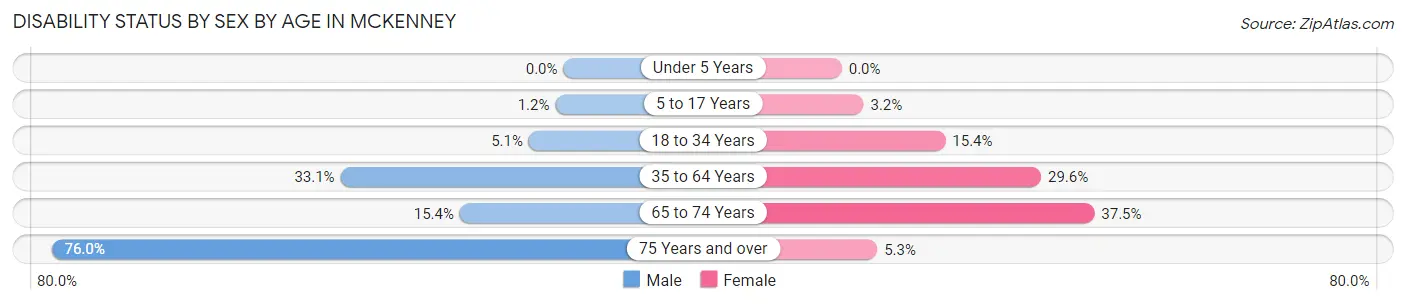
| Age Bracket | Male | Female |
| Under 5 Years | 0 (0.0%) | 0 (0.0%) |
| 5 to 17 Years | 1 (1.2%) | 1 (3.2%) |
| 18 to 34 Years | 2 (5.1%) | 8 (15.4%) |
| 35 to 64 Years | 47 (33.1%) | 29 (29.6%) |
| 65 to 74 Years | 2 (15.4%) | 9 (37.5%) |
| 75 Years and over | 19 (76.0%) | 1 (5.3%) |
Disability Class by Sex by Age in McKenney
Disability Class: Hearing Difficulty
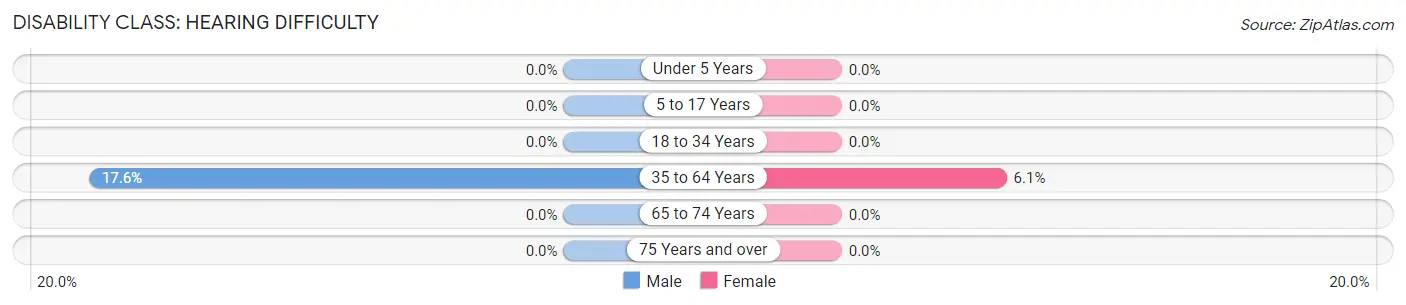
| Age Bracket | Male | Female |
| Under 5 Years | 0 (0.0%) | 0 (0.0%) |
| 5 to 17 Years | 0 (0.0%) | 0 (0.0%) |
| 18 to 34 Years | 0 (0.0%) | 0 (0.0%) |
| 35 to 64 Years | 25 (17.6%) | 6 (6.1%) |
| 65 to 74 Years | 0 (0.0%) | 0 (0.0%) |
| 75 Years and over | 0 (0.0%) | 0 (0.0%) |
Disability Class: Vision Difficulty
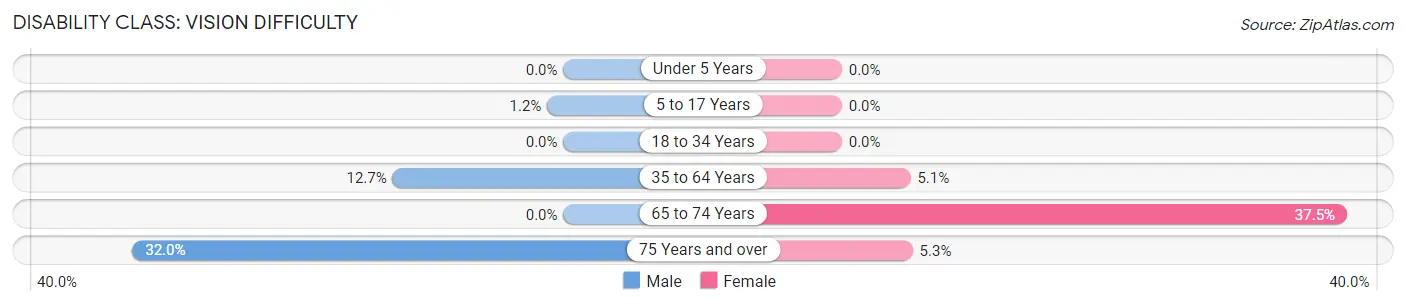
| Age Bracket | Male | Female |
| Under 5 Years | 0 (0.0%) | 0 (0.0%) |
| 5 to 17 Years | 1 (1.2%) | 0 (0.0%) |
| 18 to 34 Years | 0 (0.0%) | 0 (0.0%) |
| 35 to 64 Years | 18 (12.7%) | 5 (5.1%) |
| 65 to 74 Years | 0 (0.0%) | 9 (37.5%) |
| 75 Years and over | 8 (32.0%) | 1 (5.3%) |
Disability Class: Cognitive Difficulty
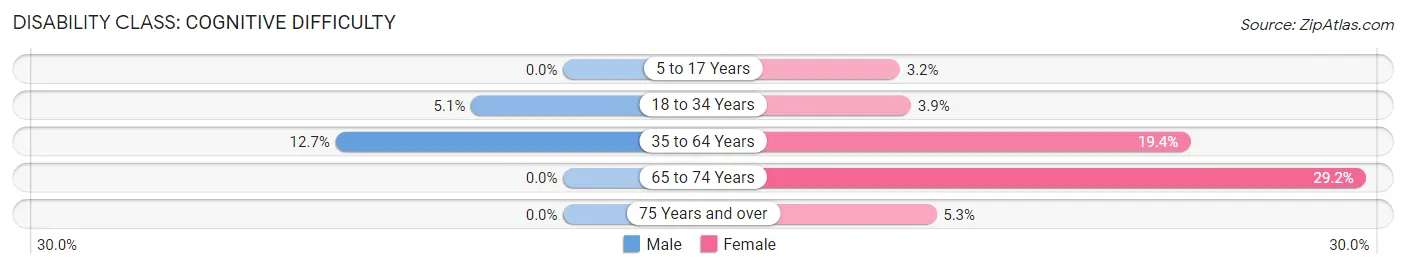
| Age Bracket | Male | Female |
| 5 to 17 Years | 0 (0.0%) | 1 (3.2%) |
| 18 to 34 Years | 2 (5.1%) | 2 (3.8%) |
| 35 to 64 Years | 18 (12.7%) | 19 (19.4%) |
| 65 to 74 Years | 0 (0.0%) | 7 (29.2%) |
| 75 Years and over | 0 (0.0%) | 1 (5.3%) |
Disability Class: Ambulatory Difficulty
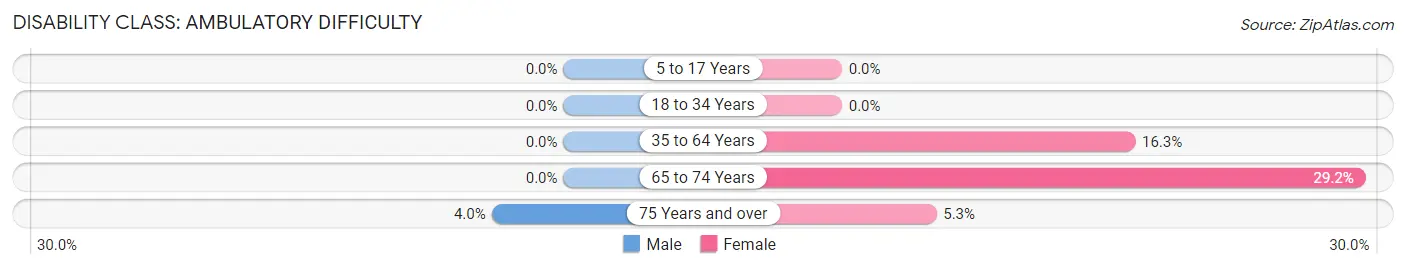
| Age Bracket | Male | Female |
| 5 to 17 Years | 0 (0.0%) | 0 (0.0%) |
| 18 to 34 Years | 0 (0.0%) | 0 (0.0%) |
| 35 to 64 Years | 0 (0.0%) | 16 (16.3%) |
| 65 to 74 Years | 0 (0.0%) | 7 (29.2%) |
| 75 Years and over | 1 (4.0%) | 1 (5.3%) |
Disability Class: Self-Care Difficulty
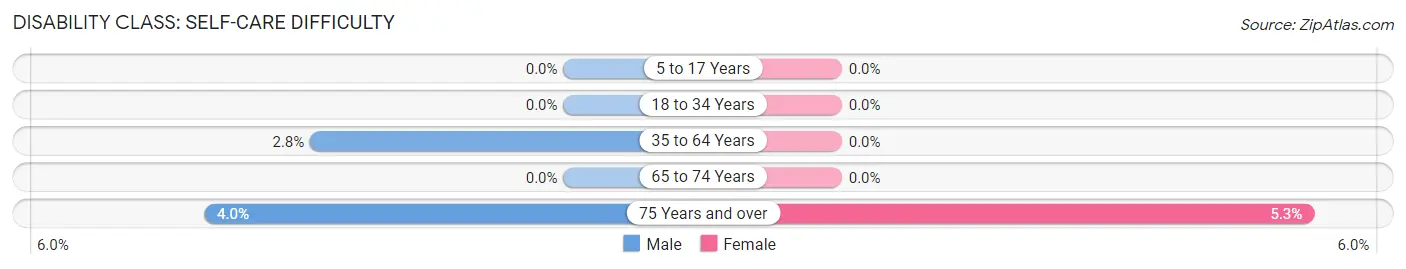
| Age Bracket | Male | Female |
| 5 to 17 Years | 0 (0.0%) | 0 (0.0%) |
| 18 to 34 Years | 0 (0.0%) | 0 (0.0%) |
| 35 to 64 Years | 4 (2.8%) | 0 (0.0%) |
| 65 to 74 Years | 0 (0.0%) | 0 (0.0%) |
| 75 Years and over | 1 (4.0%) | 1 (5.3%) |
Technology Access in McKenney
Computing Device Access in McKenney
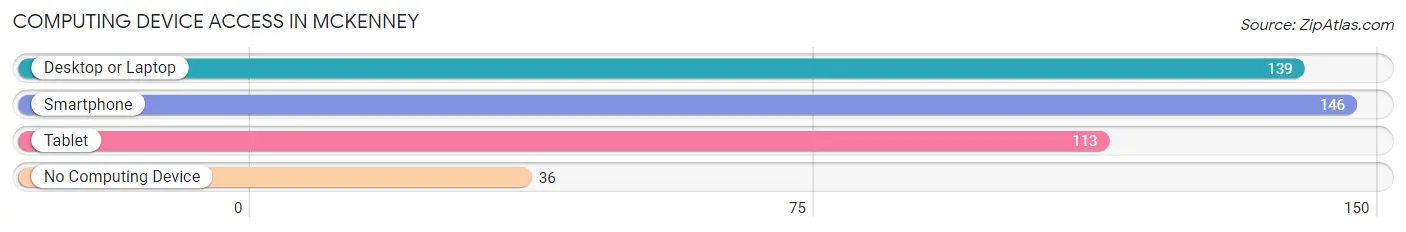
| Device Type | # Households | % Households |
| Desktop or Laptop | 139 | 65.9% |
| Smartphone | 146 | 69.2% |
| Tablet | 113 | 53.5% |
| No Computing Device | 36 | 17.1% |
| Total | 211 | 100.0% |
Internet Access in McKenney
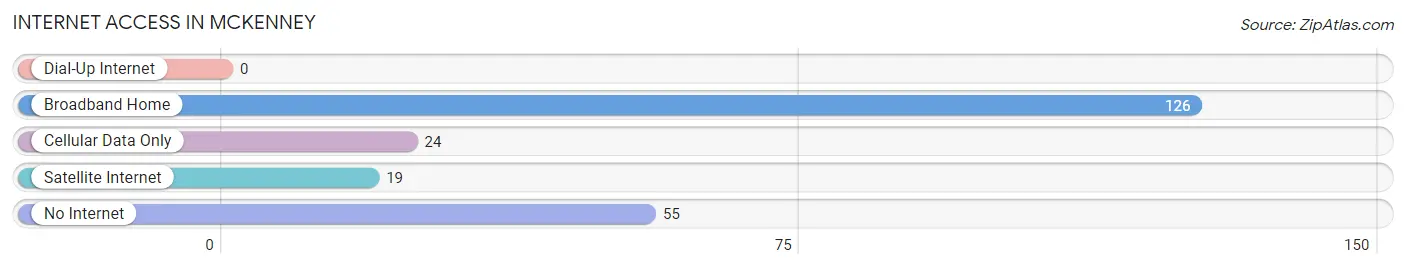
| Internet Type | # Households | % Households |
| Dial-Up Internet | 0 | 0.0% |
| Broadband Home | 126 | 59.7% |
| Cellular Data Only | 24 | 11.4% |
| Satellite Internet | 19 | 9.0% |
| No Internet | 55 | 26.1% |
| Total | 211 | 100.0% |
McKenney Summary
Mckenney is a small town located in Dinwiddie County, Virginia. It is situated on the south side of the Appomattox River, about 25 miles south of Petersburg. The town was founded in 1820 and named after William McKenney, a prominent local landowner. The population of Mckenney was 1,845 at the 2010 census.
History
Mckenney was founded in 1820 by William McKenney, a prominent local landowner. The town was originally known as McKenneyville, but the name was changed to Mckenney in 1824. The town was incorporated in 1836.
Mckenney was a major stop on the Southside Railroad, which connected Petersburg to Lynchburg. The railroad was completed in 1854 and was a major factor in the town's growth. The railroad brought new businesses and industries to the area, including a cotton mill, a sawmill, and a gristmill.
The town was also home to several Civil War battles, including the Battle of Mckenney in 1864. The town was occupied by Union forces during the war and suffered significant damage. After the war, the town slowly recovered and continued to grow.
Geography
Mckenney is located in Dinwiddie County, Virginia. It is situated on the south side of the Appomattox River, about 25 miles south of Petersburg. The town is located in the Coastal Plain region of Virginia, and the terrain is mostly flat. The climate is humid subtropical, with hot, humid summers and mild winters.
Economy
Mckenney's economy is largely based on agriculture and manufacturing. The town is home to several farms, which produce a variety of crops, including corn, soybeans, and cotton. The town is also home to several manufacturing companies, including a furniture factory, a plastics factory, and a paper mill.
Demographics
Mckenney has a population of 1,845, according to the 2010 census. The town is predominantly white, with a small African American population. The median household income is $37,941, and the median home value is $117,400. The town has a poverty rate of 17.3%, and the unemployment rate is 5.2%.
Conclusion
Mckenney is a small town located in Dinwiddie County, Virginia. It was founded in 1820 and has a population of 1,845. The town is situated on the south side of the Appomattox River and is home to several farms and manufacturing companies. The town has a predominantly white population, with a small African American population. The median household income is $37,941, and the median home value is $117,400. The town has a poverty rate of 17.3%, and the unemployment rate is 5.2%.
Common Questions
What is the Total Population of McKenney?
Total Population of McKenney is 559.
What is the Total Male Population of McKenney?
Total Male Population of McKenney is 322.
What is the Total Female Population of McKenney?
Total Female Population of McKenney is 237.
What is the Ratio of Males per 100 Females in McKenney?
There are 135.86 Males per 100 Females in McKenney.
What is the Ratio of Females per 100 Males in McKenney?
There are 73.60 Females per 100 Males in McKenney.
What is the Median Population Age in McKenney?
Median Population Age in McKenney is 42.5 Years.
What is the Average Family Size in McKenney
Average Family Size in McKenney is 3.5 People.
What is the Average Household Size in McKenney
Average Household Size in McKenney is 2.6 People.
What is Per Capita Income in McKenney?
Per Capita income in McKenney is $22,306.
What is the Median Family Income in McKenney?
Median Family Income in McKenney is $57,361.
What is the Median Household income in McKenney?
Median Household Income in McKenney is $59,107.
What is Income or Wage Gap in McKenney?
Income or Wage Gap in McKenney is 23.0%.
Women in McKenney earn 77.0 cents for every dollar earned by a man.
What is Inequality or Gini Index in McKenney?
Inequality or Gini Index in McKenney is 0.37.
How Large is the Labor Force in McKenney?
There are 255 People in the Labor Forcein in McKenney.
What is the Percentage of People in the Labor Force in McKenney?
60.4% of People are in the Labor Force in McKenney.
What is the Unemployment Rate in McKenney?
Unemployment Rate in McKenney is 24.3%.