Cluster Springs, VA
Cluster Springs Map
Cluster Springs Overview
953
TOTAL POPULATION
559
MALE POPULATION
394
FEMALE POPULATION
141.88
MALES / 100 FEMALES
70.48
FEMALES / 100 MALES
42.3
MEDIAN AGE
3.9
AVG FAMILY SIZE
3.2
AVG HOUSEHOLD SIZE
$27,777
PER CAPITA INCOME
$54,510
AVG FAMILY INCOME
$60,875
AVG HOUSEHOLD INCOME
49.1%
WAGE / INCOME GAP [ % ]
50.9¢/ $1
WAGE / INCOME GAP [ $ ]
0.36
INEQUALITY / GINI INDEX
413
LABOR FORCE [ PEOPLE ]
61.9%
PERCENT IN LABOR FORCE
Cluster Springs Area Codes
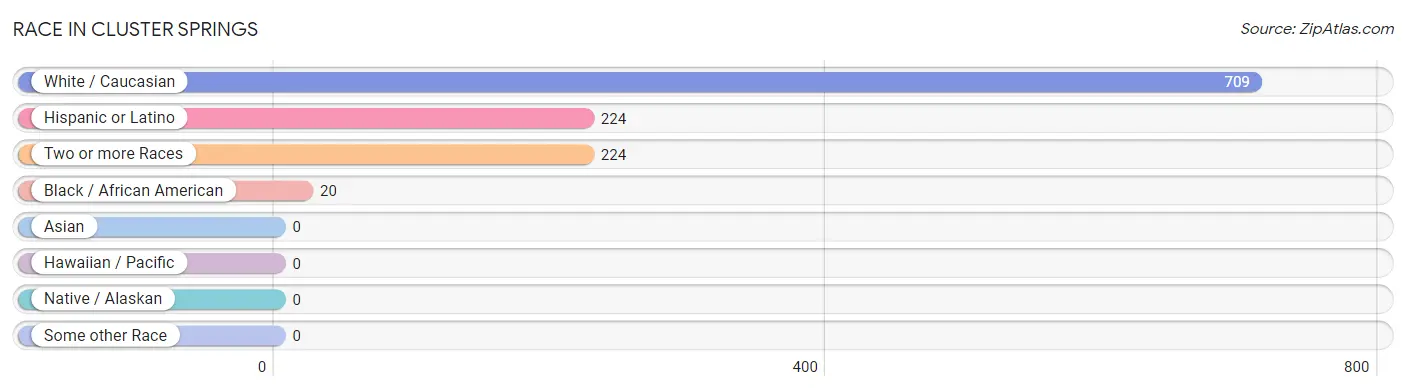
Race in Cluster Springs
The most populous races in Cluster Springs are White / Caucasian (709 | 74.4%), Hispanic or Latino (224 | 23.5%), and Two or more Races (224 | 23.5%).
| Race | # Population | % Population |
| Asian | 0 | 0.0% |
| Black / African American | 20 | 2.1% |
| Hawaiian / Pacific | 0 | 0.0% |
| Hispanic or Latino | 224 | 23.5% |
| Native / Alaskan | 0 | 0.0% |
| White / Caucasian | 709 | 74.4% |
| Two or more Races | 224 | 23.5% |
| Some other Race | 0 | 0.0% |
| Total | 953 | 100.0% |
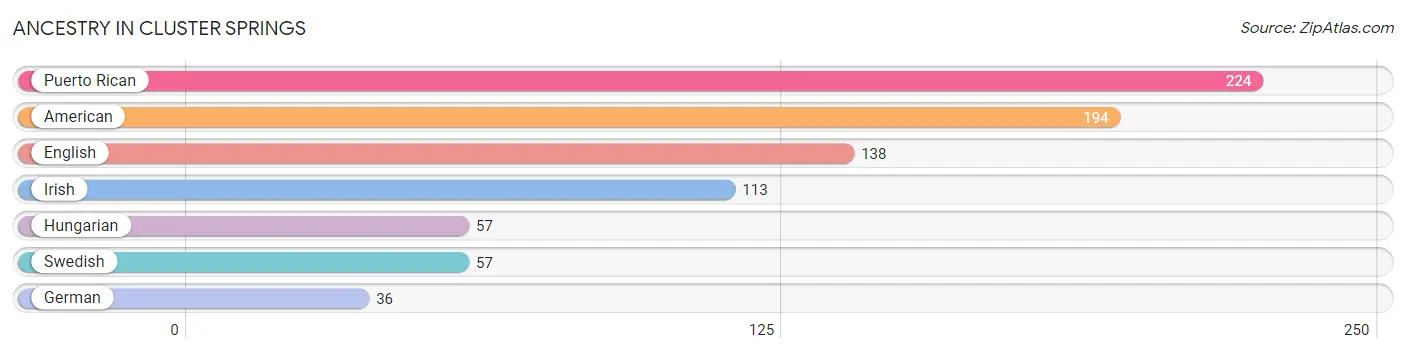
Ancestry in Cluster Springs
The most populous ancestries reported in Cluster Springs are Puerto Rican (224 | 23.5%), American (194 | 20.4%), English (138 | 14.5%), Irish (113 | 11.9%), and Hungarian (57 | 6.0%), together accounting for 76.2% of all Cluster Springs residents.
| Ancestry | # Population | % Population |
| American | 194 | 20.4% |
| English | 138 | 14.5% |
| German | 36 | 3.8% |
| Hungarian | 57 | 6.0% |
| Irish | 113 | 11.9% |
| Puerto Rican | 224 | 23.5% |
| Swedish | 57 | 6.0% | View All 7 Rows |
Immigrants in Cluster Springs

| Immigration Origin | # Population | % Population | View All 0 Rows |
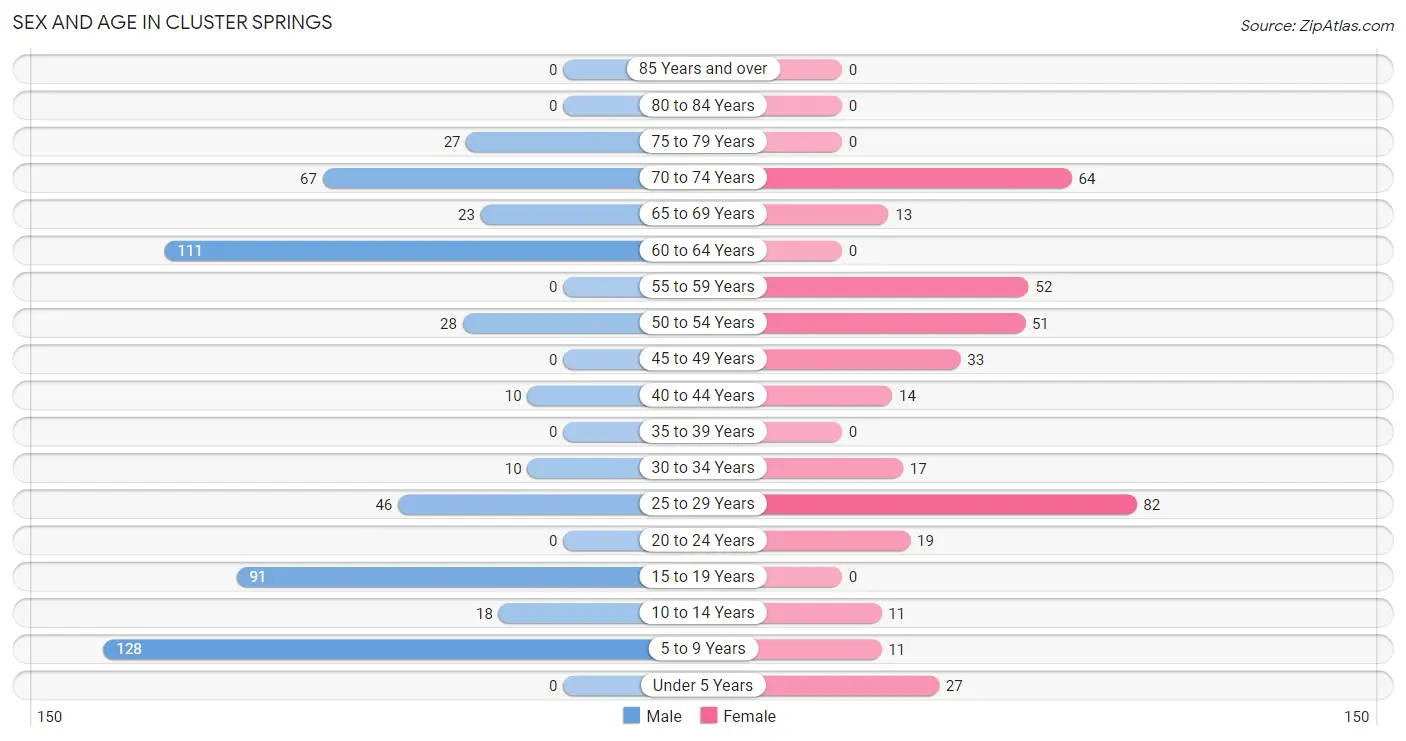
Sex and Age in Cluster Springs
Sex and Age in Cluster Springs
The most populous age groups in Cluster Springs are 5 to 9 Years (128 | 22.9%) for men and 25 to 29 Years (82 | 20.8%) for women.
| Age Bracket | Male | Female |
| Under 5 Years | 0 (0.0%) | 27 (6.9%) |
| 5 to 9 Years | 128 (22.9%) | 11 (2.8%) |
| 10 to 14 Years | 18 (3.2%) | 11 (2.8%) |
| 15 to 19 Years | 91 (16.3%) | 0 (0.0%) |
| 20 to 24 Years | 0 (0.0%) | 19 (4.8%) |
| 25 to 29 Years | 46 (8.2%) | 82 (20.8%) |
| 30 to 34 Years | 10 (1.8%) | 17 (4.3%) |
| 35 to 39 Years | 0 (0.0%) | 0 (0.0%) |
| 40 to 44 Years | 10 (1.8%) | 14 (3.5%) |
| 45 to 49 Years | 0 (0.0%) | 33 (8.4%) |
| 50 to 54 Years | 28 (5.0%) | 51 (12.9%) |
| 55 to 59 Years | 0 (0.0%) | 52 (13.2%) |
| 60 to 64 Years | 111 (19.9%) | 0 (0.0%) |
| 65 to 69 Years | 23 (4.1%) | 13 (3.3%) |
| 70 to 74 Years | 67 (12.0%) | 64 (16.2%) |
| 75 to 79 Years | 27 (4.8%) | 0 (0.0%) |
| 80 to 84 Years | 0 (0.0%) | 0 (0.0%) |
| 85 Years and over | 0 (0.0%) | 0 (0.0%) |
| Total | 559 (100.0%) | 394 (100.0%) |
Families and Households in Cluster Springs
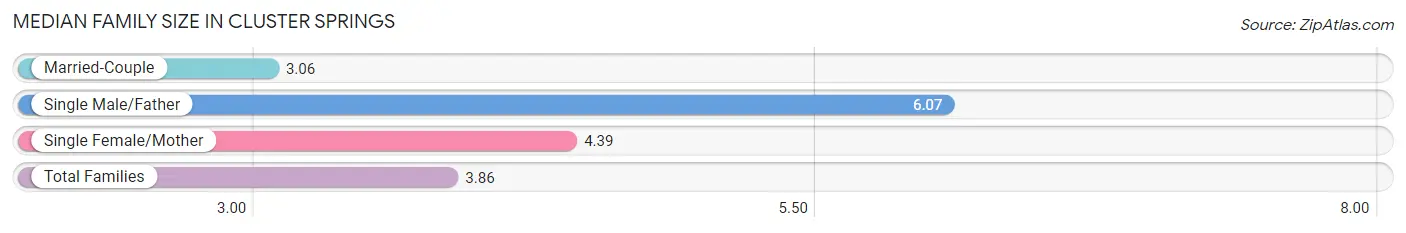
Median Family Size in Cluster Springs
The median family size in Cluster Springs is 3.86 persons per family, with single male/father families (27 | 14.4%) accounting for the largest median family size of 6.07 persons per family. On the other hand, married-couple families (110 | 58.5%) represent the smallest median family size with 3.06 persons per family.
| Family Type | # Families | Family Size |
| Married-Couple | 110 (58.5%) | 3.06 |
| Single Male/Father | 27 (14.4%) | 6.07 |
| Single Female/Mother | 51 (27.1%) | 4.39 |
| Total Families | 188 (100.0%) | 3.86 |
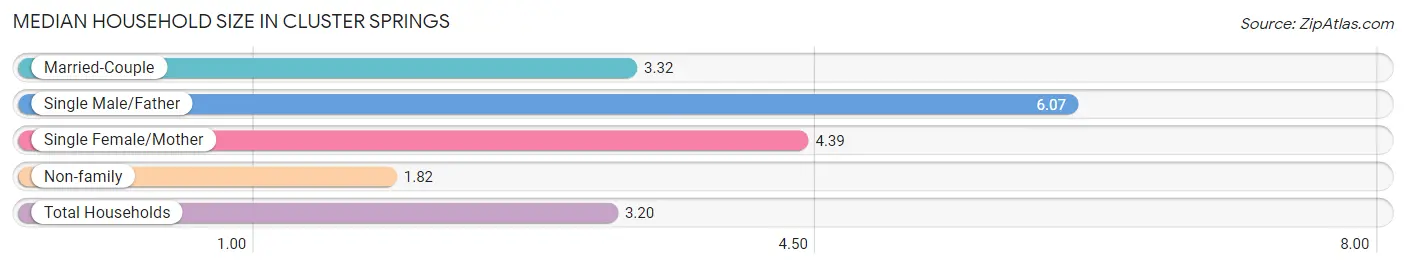
Median Household Size in Cluster Springs
The median household size in Cluster Springs is 3.20 persons per household, with single male/father households (27 | 9.1%) accounting for the largest median household size of 6.07 persons per household. non-family households (110 | 36.9%) represent the smallest median household size with 1.82 persons per household.
| Household Type | # Households | Household Size |
| Married-Couple | 110 (36.9%) | 3.32 |
| Single Male/Father | 27 (9.1%) | 6.07 |
| Single Female/Mother | 51 (17.1%) | 4.39 |
| Non-family | 110 (36.9%) | 1.82 |
| Total Households | 298 (100.0%) | 3.20 |
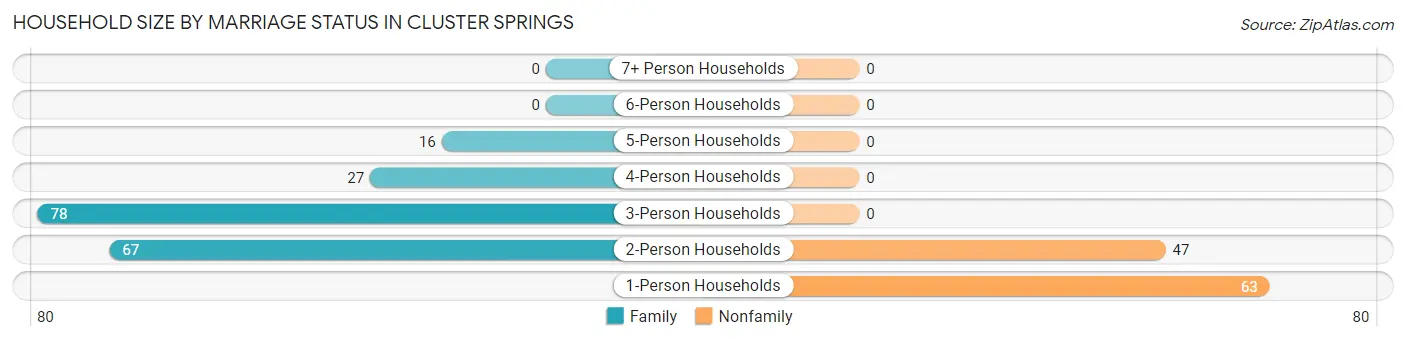
Household Size by Marriage Status in Cluster Springs
Out of a total of 298 households in Cluster Springs, 188 (63.1%) are family households, while 110 (36.9%) are nonfamily households. The most numerous type of family households are 3-person households, comprising 78, and the most common type of nonfamily households are 1-person households, comprising 63.
| Household Size | Family Households | Nonfamily Households |
| 1-Person Households | - | 63 (21.1%) |
| 2-Person Households | 67 (22.5%) | 47 (15.8%) |
| 3-Person Households | 78 (26.2%) | 0 (0.0%) |
| 4-Person Households | 27 (9.1%) | 0 (0.0%) |
| 5-Person Households | 16 (5.4%) | 0 (0.0%) |
| 6-Person Households | 0 (0.0%) | 0 (0.0%) |
| 7+ Person Households | 0 (0.0%) | 0 (0.0%) |
| Total | 188 (63.1%) | 110 (36.9%) |
Female Fertility in Cluster Springs
Fertility by Age in Cluster Springs
| Age Bracket | Women with Births | Births / 1,000 Women |
| 15 to 19 years | 0 (0.0%) | 0.0 |
| 20 to 34 years | 0 (0.0%) | 0.0 |
| 35 to 50 years | 0 (0.0%) | 0.0 |
| Total | 0 (0.0%) | 0.0 |
Fertility by Age by Marriage Status in Cluster Springs
| Age Bracket | Married | Unmarried |
| 15 to 19 years | 0 (0.0%) | 0 (0.0%) |
| 20 to 34 years | 0 (0.0%) | 0 (0.0%) |
| 35 to 50 years | 0 (0.0%) | 0 (0.0%) |
| Total | 0 (0.0%) | 0 (0.0%) |
Fertility by Education in Cluster Springs
| Educational Attainment | Women with Births | Births / 1,000 Women |
| Less than High School | 0 (0.0%) | 0.0 |
| High School Diploma | 0 (0.0%) | 0.0 |
| College or Associate's Degree | 0 (0.0%) | 0.0 |
| Bachelor's Degree | 0 (0.0%) | 0.0 |
| Graduate Degree | 0 (0.0%) | 0.0 |
| Total | 0 (0.0%) | 0.0 |
Fertility by Education by Marriage Status in Cluster Springs
| Educational Attainment | Married | Unmarried |
| Less than High School | 0 (0.0%) | 0 (0.0%) |
| High School Diploma | 0 (0.0%) | 0 (0.0%) |
| College or Associate's Degree | 0 (0.0%) | 0 (0.0%) |
| Bachelor's Degree | 0 (0.0%) | 0 (0.0%) |
| Graduate Degree | 0 (0.0%) | 0 (0.0%) |
| Total | 0 (0.0%) | 0 (0.0%) |
Income in Cluster Springs
Income Overview in Cluster Springs
Per Capita Income in Cluster Springs is $27,777, while median incomes of families and households are $54,510 and $60,875 respectively.
| Characteristic | Number | Measure |
| Per Capita Income | 953 | $27,777 |
| Median Family Income | 188 | $54,510 |
| Mean Family Income | 188 | $66,943 |
| Median Household Income | 298 | $60,875 |
| Mean Household Income | 298 | $80,006 |
| Income Deficit | 188 | $0 |
| Wage / Income Gap (%) | 953 | 49.06% |
| Wage / Income Gap ($) | 953 | 50.94¢ per $1 |
| Gini / Inequality Index | 953 | 0.36 |
Earnings by Sex in Cluster Springs
Average Earnings in Cluster Springs are $35,682, $58,705 for men and $29,904 for women, a difference of 49.1%.
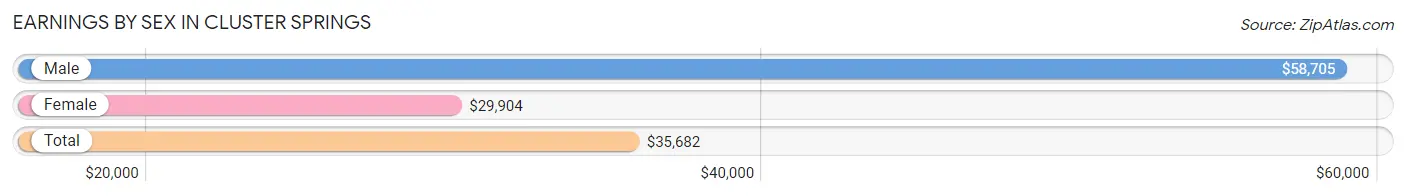
| Sex | Number | Average Earnings |
| Male | 143 (33.7%) | $58,705 |
| Female | 281 (66.3%) | $29,904 |
| Total | 424 (100.0%) | $35,682 |
Earnings by Sex by Income Bracket in Cluster Springs
The most common earnings brackets in Cluster Springs are $55,000 to $64,999 for men (28 | 19.6%) and $20,000 to $22,499 for women (82 | 29.2%).
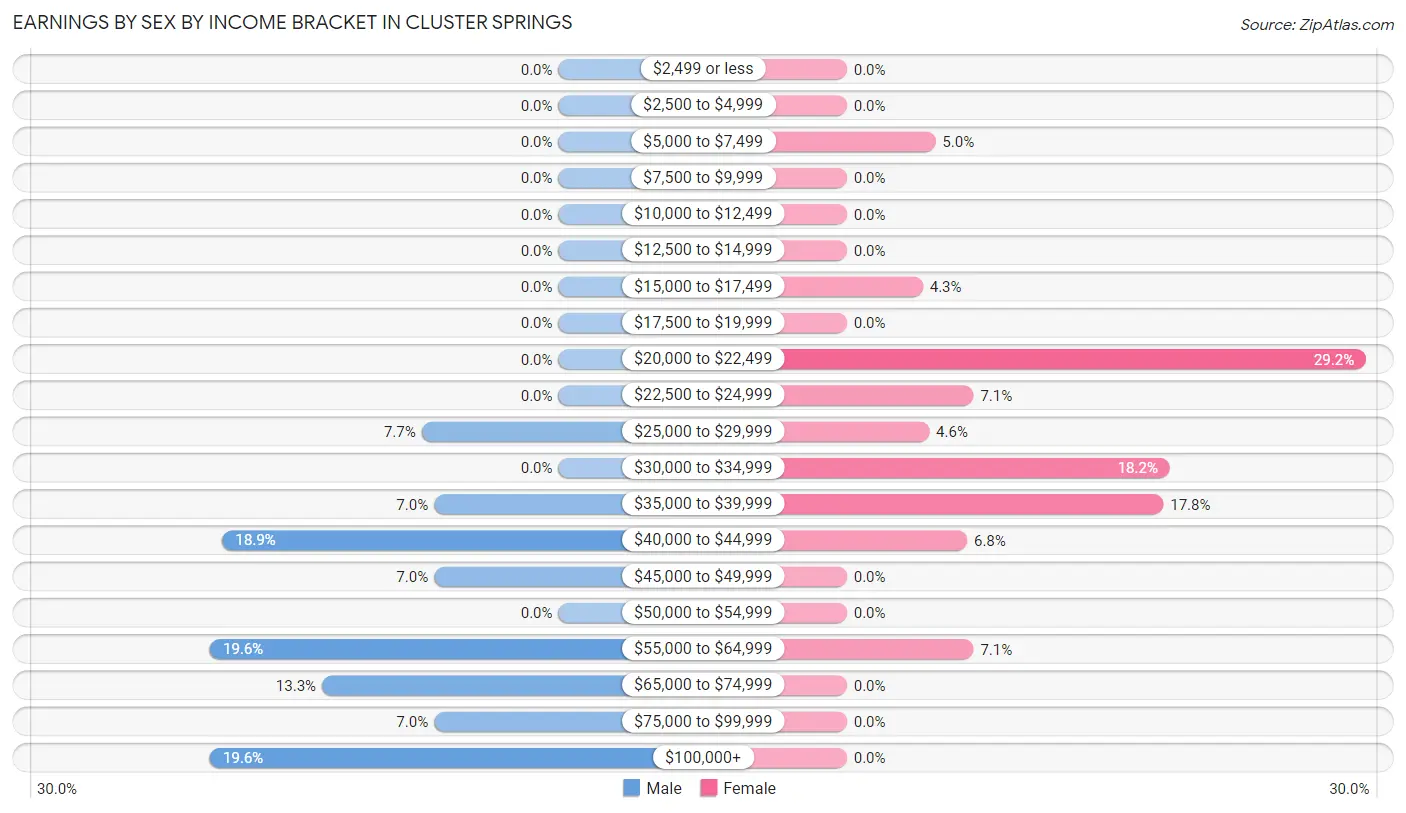
| Income | Male | Female |
| $2,499 or less | 0 (0.0%) | 0 (0.0%) |
| $2,500 to $4,999 | 0 (0.0%) | 0 (0.0%) |
| $5,000 to $7,499 | 0 (0.0%) | 14 (5.0%) |
| $7,500 to $9,999 | 0 (0.0%) | 0 (0.0%) |
| $10,000 to $12,499 | 0 (0.0%) | 0 (0.0%) |
| $12,500 to $14,999 | 0 (0.0%) | 0 (0.0%) |
| $15,000 to $17,499 | 0 (0.0%) | 12 (4.3%) |
| $17,500 to $19,999 | 0 (0.0%) | 0 (0.0%) |
| $20,000 to $22,499 | 0 (0.0%) | 82 (29.2%) |
| $22,500 to $24,999 | 0 (0.0%) | 20 (7.1%) |
| $25,000 to $29,999 | 11 (7.7%) | 13 (4.6%) |
| $30,000 to $34,999 | 0 (0.0%) | 51 (18.1%) |
| $35,000 to $39,999 | 10 (7.0%) | 50 (17.8%) |
| $40,000 to $44,999 | 27 (18.9%) | 19 (6.8%) |
| $45,000 to $49,999 | 10 (7.0%) | 0 (0.0%) |
| $50,000 to $54,999 | 0 (0.0%) | 0 (0.0%) |
| $55,000 to $64,999 | 28 (19.6%) | 20 (7.1%) |
| $65,000 to $74,999 | 19 (13.3%) | 0 (0.0%) |
| $75,000 to $99,999 | 10 (7.0%) | 0 (0.0%) |
| $100,000+ | 28 (19.6%) | 0 (0.0%) |
| Total | 143 (100.0%) | 281 (100.0%) |
Earnings by Sex by Educational Attainment in Cluster Springs
Average earnings in Cluster Springs are $58,705 for men and $28,077 for women, a difference of 52.2%. Men with an educational attainment of college or associate's degree enjoy the highest average annual earnings of $41,620, while those with college or associate's degree education earn the least with $41,620. Women with an educational attainment of college or associate's degree earn the most with the average annual earnings of $21,601, while those with college or associate's degree education have the smallest earnings of $21,601.
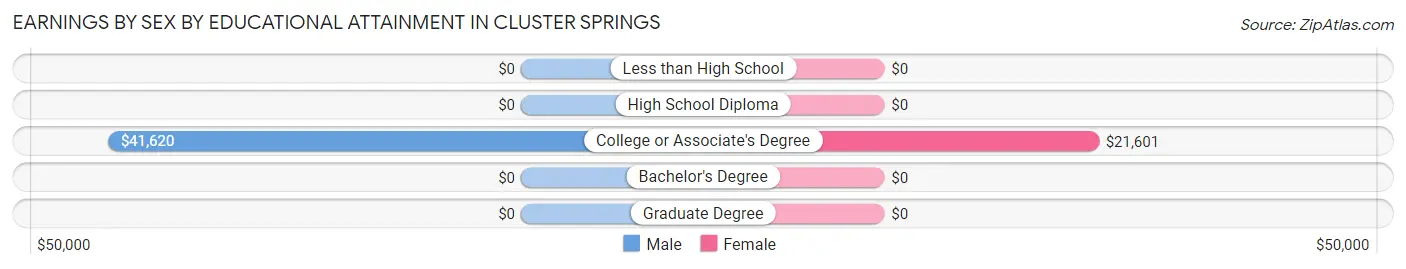
| Educational Attainment | Male Income | Female Income |
| Less than High School | - | - |
| High School Diploma | - | - |
| College or Associate's Degree | $41,620 | $21,601 |
| Bachelor's Degree | - | - |
| Graduate Degree | - | - |
| Total | $58,705 | $28,077 |
Family Income in Cluster Springs
Family Income Brackets in Cluster Springs
According to the Cluster Springs family income data, there are 76 families falling into the $50,000 to $74,999 income range, which is the most common income bracket and makes up 40.4% of all families.
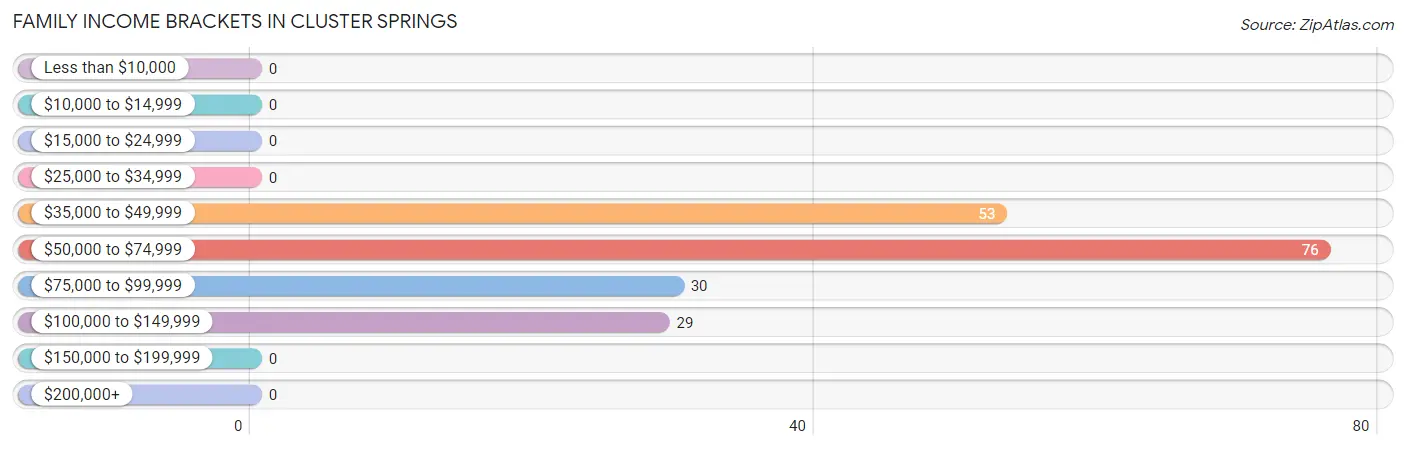
| Income Bracket | # Families | % Families |
| Less than $10,000 | 0 | 0.0% |
| $10,000 to $14,999 | 0 | 0.0% |
| $15,000 to $24,999 | 0 | 0.0% |
| $25,000 to $34,999 | 0 | 0.0% |
| $35,000 to $49,999 | 53 | 28.2% |
| $50,000 to $74,999 | 76 | 40.4% |
| $75,000 to $99,999 | 30 | 16.0% |
| $100,000 to $149,999 | 29 | 15.4% |
| $150,000 to $199,999 | 0 | 0.0% |
| $200,000+ | 0 | 0.0% |
Family Income by Famaliy Size in Cluster Springs
2-person families (67 | 35.6%) account for the highest median family income in Cluster Springs with $89,135 per family, while 2-person families (67 | 35.6%) have the highest median income of $44,568 per family member.
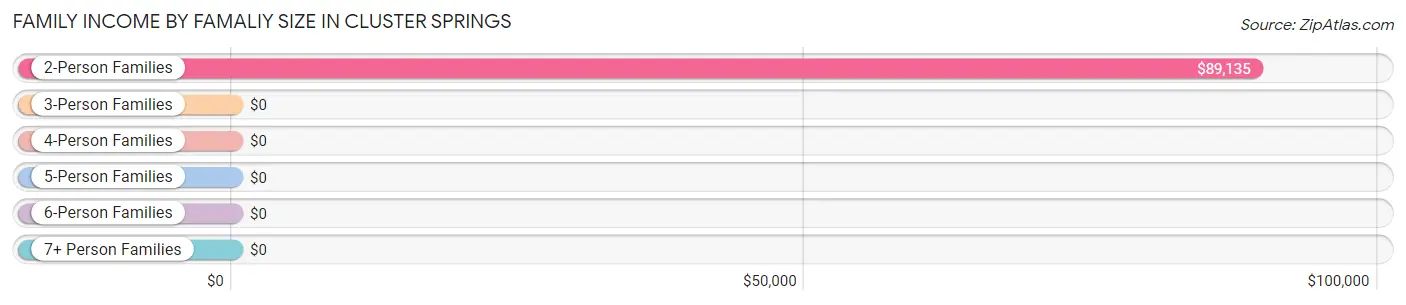
| Income Bracket | # Families | Median Income |
| 2-Person Families | 67 (35.6%) | $89,135 |
| 3-Person Families | 78 (41.5%) | $0 |
| 4-Person Families | 43 (22.9%) | $0 |
| 5-Person Families | 0 (0.0%) | $0 |
| 6-Person Families | 0 (0.0%) | $0 |
| 7+ Person Families | 0 (0.0%) | $0 |
| Total | 188 (100.0%) | $54,510 |
Family Income by Number of Earners in Cluster Springs
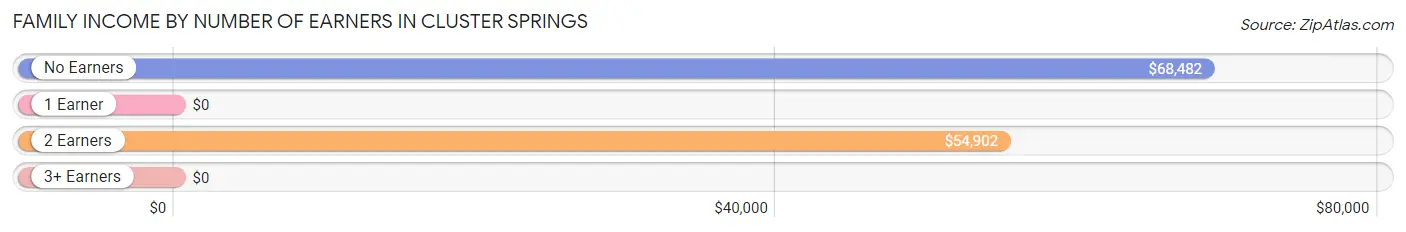
| Number of Earners | # Families | Median Income |
| No Earners | 43 (22.9%) | $68,482 |
| 1 Earner | 27 (14.4%) | $0 |
| 2 Earners | 118 (62.8%) | $54,902 |
| 3+ Earners | 0 (0.0%) | $0 |
| Total | 188 (100.0%) | $54,510 |
Household Income in Cluster Springs
Household Income Brackets in Cluster Springs
With 115 households falling in the category, the $50,000 to $74,999 income range is the most frequent in Cluster Springs, accounting for 38.6% of all households.
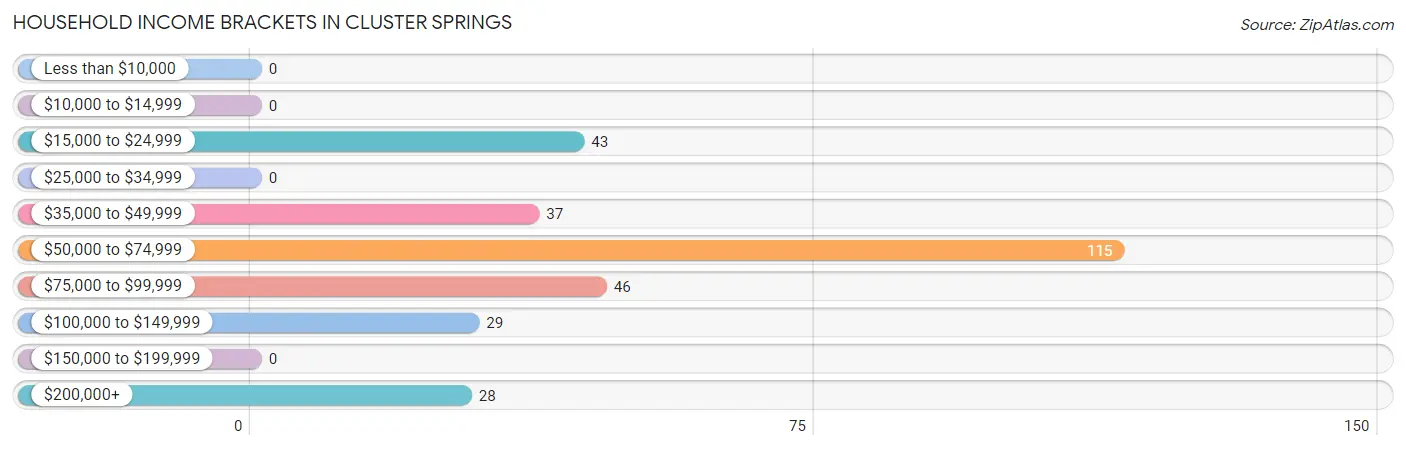
| Income Bracket | # Households | % Households |
| Less than $10,000 | 0 | 0.0% |
| $10,000 to $14,999 | 0 | 0.0% |
| $15,000 to $24,999 | 43 | 14.4% |
| $25,000 to $34,999 | 0 | 0.0% |
| $35,000 to $49,999 | 37 | 12.4% |
| $50,000 to $74,999 | 115 | 38.6% |
| $75,000 to $99,999 | 46 | 15.4% |
| $100,000 to $149,999 | 29 | 9.7% |
| $150,000 to $199,999 | 0 | 0.0% |
| $200,000+ | 28 | 9.4% |
Household Income by Householder Age in Cluster Springs
The median household income in Cluster Springs is $60,875, with the highest median household income of $70,329 found in the 65+ years age bracket for the primary householder. A total of 79 households (26.5%) fall into this category.
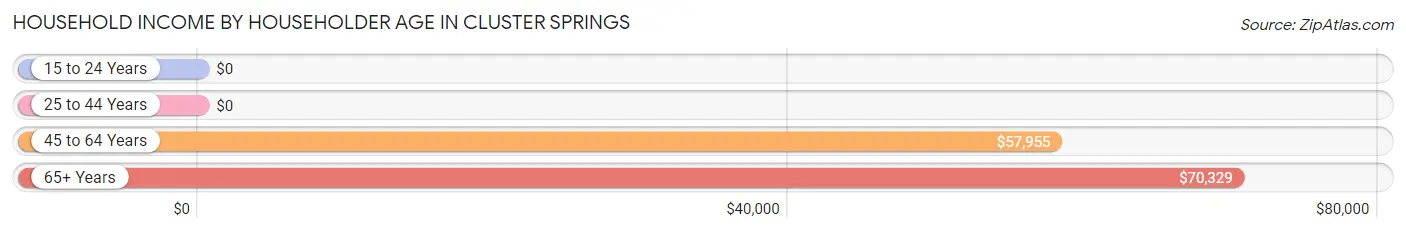
| Income Bracket | # Households | Median Income |
| 15 to 24 Years | 0 (0.0%) | $0 |
| 25 to 44 Years | 73 (24.5%) | $0 |
| 45 to 64 Years | 146 (49.0%) | $57,955 |
| 65+ Years | 79 (26.5%) | $70,329 |
| Total | 298 (100.0%) | $60,875 |
Poverty in Cluster Springs
Income Below Poverty by Sex and Age in Cluster Springs
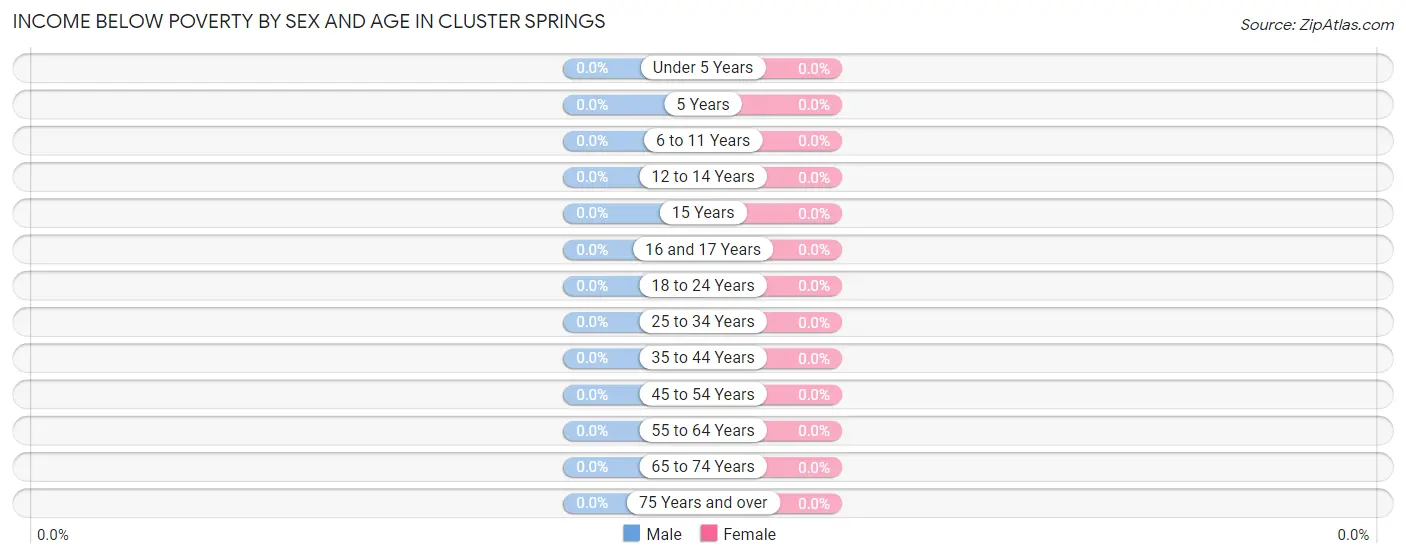
| Age Bracket | Male | Female |
| Under 5 Years | 0 (0.0%) | 0 (0.0%) |
| 5 Years | 0 (0.0%) | 0 (0.0%) |
| 6 to 11 Years | 0 (0.0%) | 0 (0.0%) |
| 12 to 14 Years | 0 (0.0%) | 0 (0.0%) |
| 15 Years | 0 (0.0%) | 0 (0.0%) |
| 16 and 17 Years | 0 (0.0%) | 0 (0.0%) |
| 18 to 24 Years | 0 (0.0%) | 0 (0.0%) |
| 25 to 34 Years | 0 (0.0%) | 0 (0.0%) |
| 35 to 44 Years | 0 (0.0%) | 0 (0.0%) |
| 45 to 54 Years | 0 (0.0%) | 0 (0.0%) |
| 55 to 64 Years | 0 (0.0%) | 0 (0.0%) |
| 65 to 74 Years | 0 (0.0%) | 0 (0.0%) |
| 75 Years and over | 0 (0.0%) | 0 (0.0%) |
| Total | 0 (0.0%) | 0 (0.0%) |
Income Above Poverty by Sex and Age in Cluster Springs
According to the poverty statistics in Cluster Springs, males aged 6 to 11 years and females aged under 5 years are the age groups that are most secure financially, with 100.0% of males and 100.0% of females in these age groups living above the poverty line.
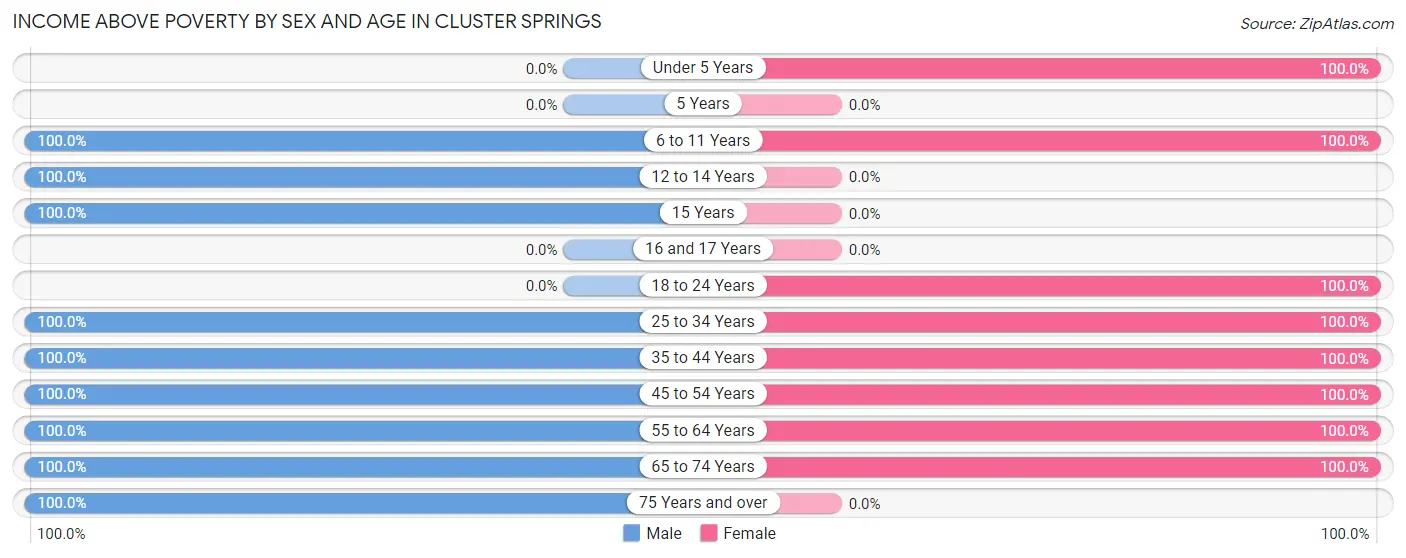
| Age Bracket | Male | Female |
| Under 5 Years | 0 (0.0%) | 27 (100.0%) |
| 5 Years | 0 (0.0%) | 0 (0.0%) |
| 6 to 11 Years | 128 (100.0%) | 22 (100.0%) |
| 12 to 14 Years | 18 (100.0%) | 0 (0.0%) |
| 15 Years | 91 (100.0%) | 0 (0.0%) |
| 16 and 17 Years | 0 (0.0%) | 0 (0.0%) |
| 18 to 24 Years | 0 (0.0%) | 19 (100.0%) |
| 25 to 34 Years | 56 (100.0%) | 99 (100.0%) |
| 35 to 44 Years | 10 (100.0%) | 14 (100.0%) |
| 45 to 54 Years | 28 (100.0%) | 84 (100.0%) |
| 55 to 64 Years | 111 (100.0%) | 52 (100.0%) |
| 65 to 74 Years | 90 (100.0%) | 77 (100.0%) |
| 75 Years and over | 27 (100.0%) | 0 (0.0%) |
| Total | 559 (100.0%) | 394 (100.0%) |
Income Below Poverty Among Married-Couple Families in Cluster Springs
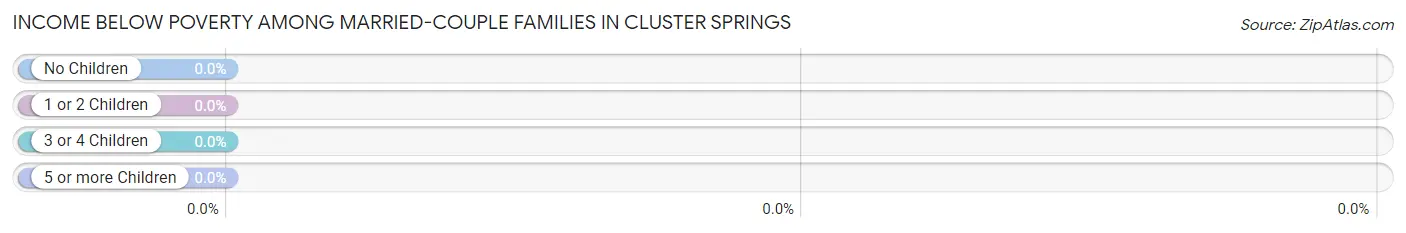
| Children | Above Poverty | Below Poverty |
| No Children | 83 (100.0%) | 0 (0.0%) |
| 1 or 2 Children | 27 (100.0%) | 0 (0.0%) |
| 3 or 4 Children | 0 (0.0%) | 0 (0.0%) |
| 5 or more Children | 0 (0.0%) | 0 (0.0%) |
| Total | 110 (100.0%) | 0 (0.0%) |
Income Below Poverty Among Single-Parent Households in Cluster Springs
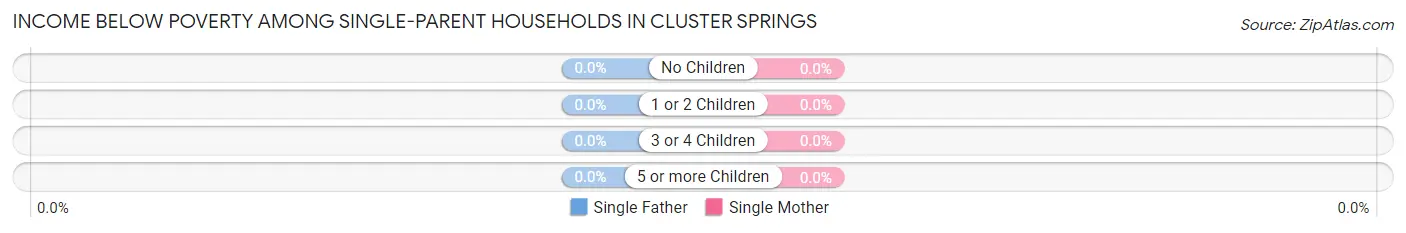
| Children | Single Father | Single Mother |
| No Children | 0 (0.0%) | 0 (0.0%) |
| 1 or 2 Children | 0 (0.0%) | 0 (0.0%) |
| 3 or 4 Children | 0 (0.0%) | 0 (0.0%) |
| 5 or more Children | 0 (0.0%) | 0 (0.0%) |
| Total | 0 (0.0%) | 0 (0.0%) |
Income Below Poverty Among Married-Couple vs Single-Parent Households in Cluster Springs
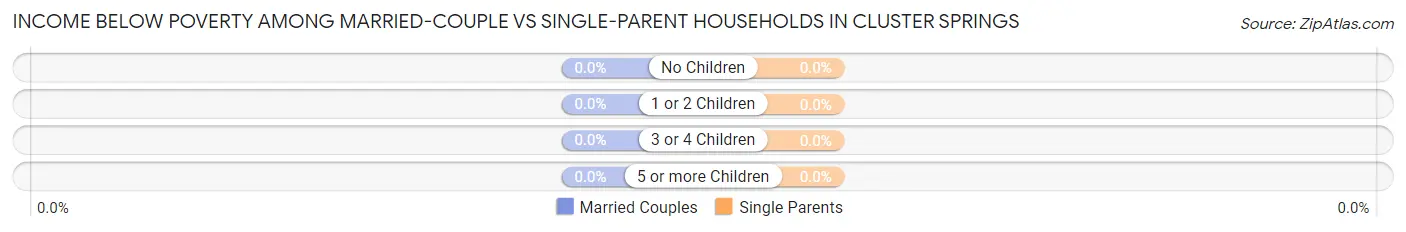
| Children | Married-Couple Families | Single-Parent Households |
| No Children | 0 (0.0%) | 0 (0.0%) |
| 1 or 2 Children | 0 (0.0%) | 0 (0.0%) |
| 3 or 4 Children | 0 (0.0%) | 0 (0.0%) |
| 5 or more Children | 0 (0.0%) | 0 (0.0%) |
| Total | 0 (0.0%) | 0 (0.0%) |
Employment Characteristics in Cluster Springs
Employment by Class of Employer in Cluster Springs
Among the 413 employed individuals in Cluster Springs, private company employees (233 | 56.4%), local government employees (131 | 31.7%), and not-for-profit organizations (49 | 11.9%) make up the most common classes of employment.
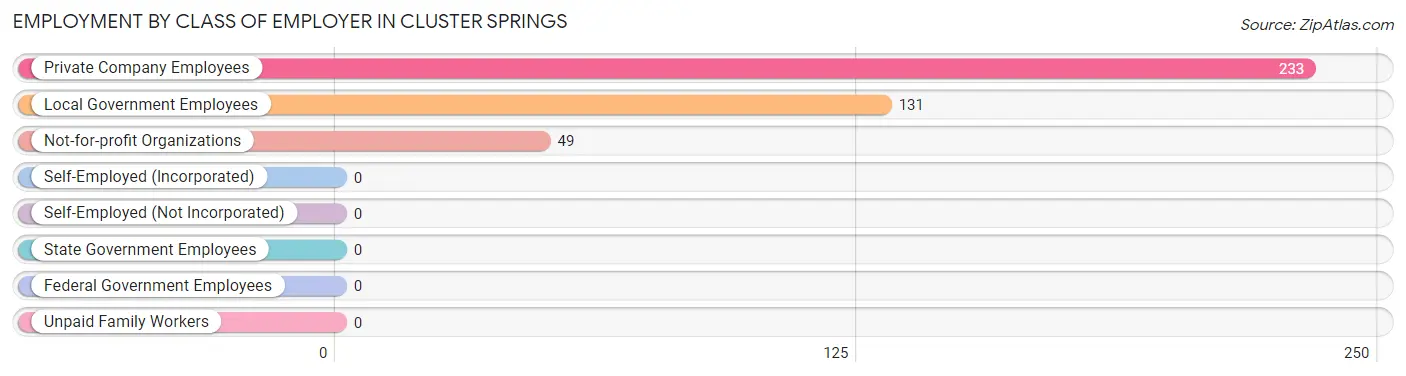
| Employer Class | # Employees | % Employees |
| Private Company Employees | 233 | 56.4% |
| Self-Employed (Incorporated) | 0 | 0.0% |
| Self-Employed (Not Incorporated) | 0 | 0.0% |
| Not-for-profit Organizations | 49 | 11.9% |
| Local Government Employees | 131 | 31.7% |
| State Government Employees | 0 | 0.0% |
| Federal Government Employees | 0 | 0.0% |
| Unpaid Family Workers | 0 | 0.0% |
| Total | 413 | 100.0% |
Employment Status by Age in Cluster Springs
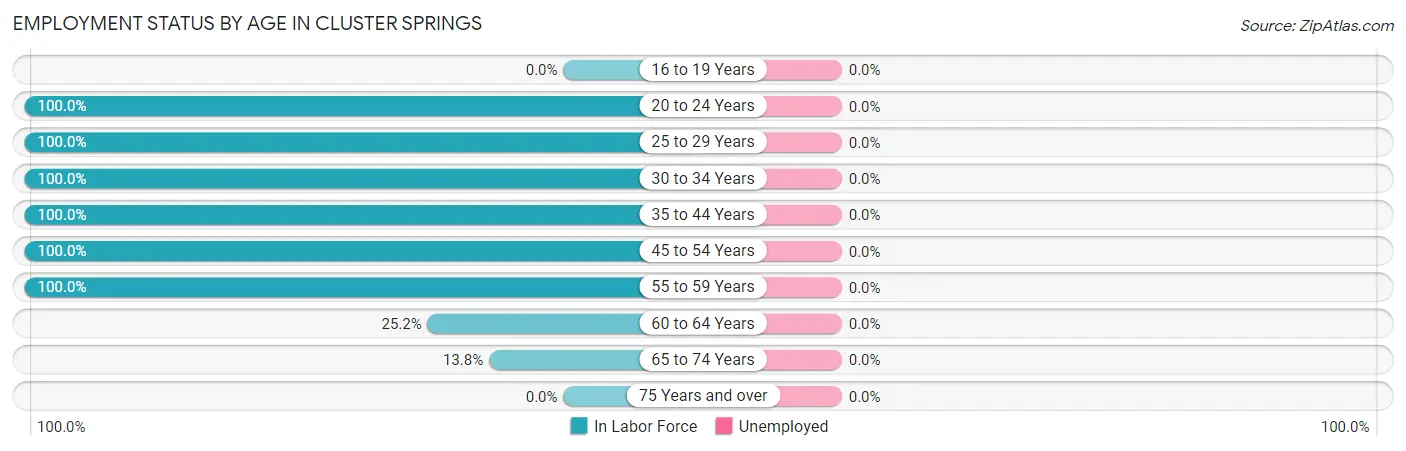
| Age Bracket | In Labor Force | Unemployed |
| 16 to 19 Years | 0 (0.0%) | 0 (0.0%) |
| 20 to 24 Years | 19 (100.0%) | 0 (0.0%) |
| 25 to 29 Years | 128 (100.0%) | 0 (0.0%) |
| 30 to 34 Years | 27 (100.0%) | 0 (0.0%) |
| 35 to 44 Years | 24 (100.0%) | 0 (0.0%) |
| 45 to 54 Years | 112 (100.0%) | 0 (0.0%) |
| 55 to 59 Years | 52 (100.0%) | 0 (0.0%) |
| 60 to 64 Years | 28 (25.2%) | 0 (0.0%) |
| 65 to 74 Years | 23 (13.8%) | 0 (0.0%) |
| 75 Years and over | 0 (0.0%) | 0 (0.0%) |
| Total | 413 (61.9%) | 0 (0.0%) |
Employment Status by Educational Attainment in Cluster Springs
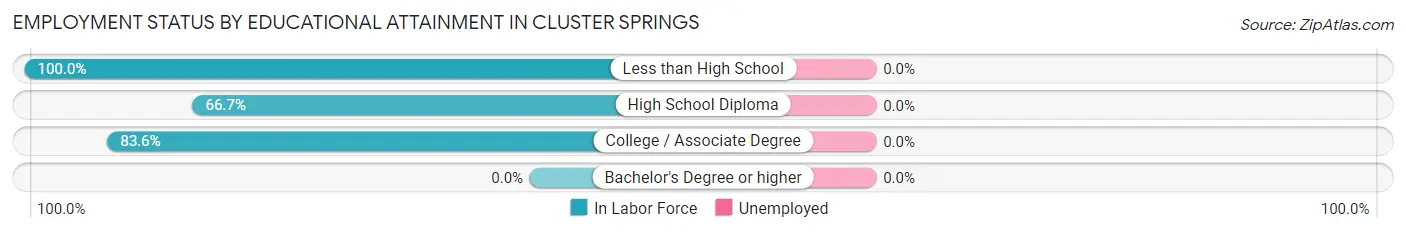
| Educational Attainment | In Labor Force | Unemployed |
| Less than High School | 84 (100.0%) | 0 (0.0%) |
| High School Diploma | 88 (66.7%) | 0 (0.0%) |
| College / Associate Degree | 199 (83.6%) | 0 (0.0%) |
| Bachelor's Degree or higher | 0 (0.0%) | 0 (0.0%) |
| Total | 371 (81.7%) | 0 (0.0%) |
Employment Occupations by Sex in Cluster Springs
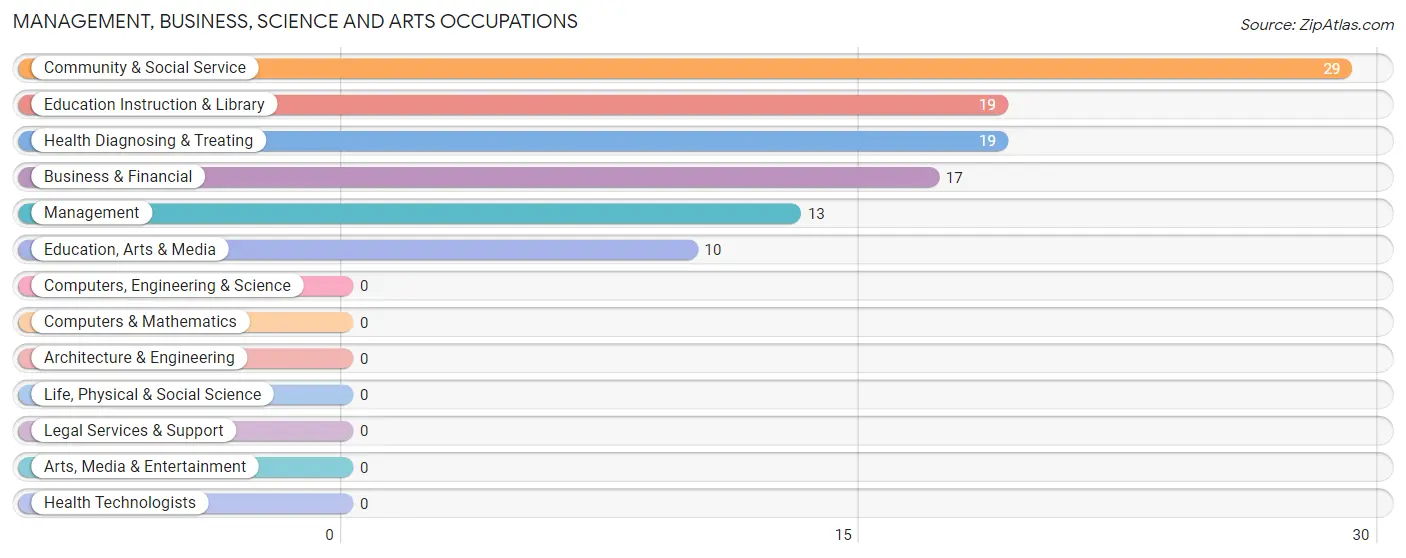
Management, Business, Science and Arts Occupations
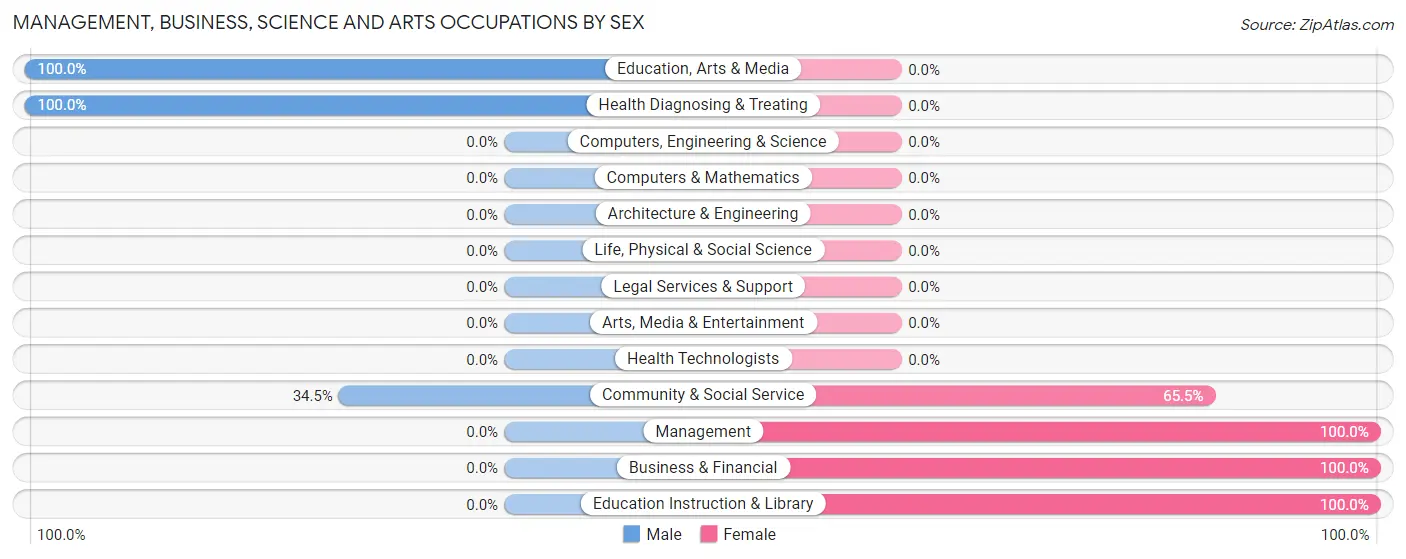
The most common Management, Business, Science and Arts occupations in Cluster Springs are Community & Social Service (29 | 7.0%), Education Instruction & Library (19 | 4.6%), Health Diagnosing & Treating (19 | 4.6%), Business & Financial (17 | 4.1%), and Management (13 | 3.2%).
Management, Business, Science and Arts Occupations by Sex
Within the Management, Business, Science and Arts occupations in Cluster Springs, the most male-oriented occupations are Education, Arts & Media (100.0%), Health Diagnosing & Treating (100.0%), and Community & Social Service (34.5%), while the most female-oriented occupations are Management (100.0%), Business & Financial (100.0%), and Education Instruction & Library (100.0%).
| Occupation | Male | Female |
| Management | 0 (0.0%) | 13 (100.0%) |
| Business & Financial | 0 (0.0%) | 17 (100.0%) |
| Computers, Engineering & Science | 0 (0.0%) | 0 (0.0%) |
| Computers & Mathematics | 0 (0.0%) | 0 (0.0%) |
| Architecture & Engineering | 0 (0.0%) | 0 (0.0%) |
| Life, Physical & Social Science | 0 (0.0%) | 0 (0.0%) |
| Community & Social Service | 10 (34.5%) | 19 (65.5%) |
| Education, Arts & Media | 10 (100.0%) | 0 (0.0%) |
| Legal Services & Support | 0 (0.0%) | 0 (0.0%) |
| Education Instruction & Library | 0 (0.0%) | 19 (100.0%) |
| Arts, Media & Entertainment | 0 (0.0%) | 0 (0.0%) |
| Health Diagnosing & Treating | 19 (100.0%) | 0 (0.0%) |
| Health Technologists | 0 (0.0%) | 0 (0.0%) |
| Total (Category) | 29 (37.2%) | 49 (62.8%) |
| Total (Overall) | 132 (32.0%) | 281 (68.0%) |
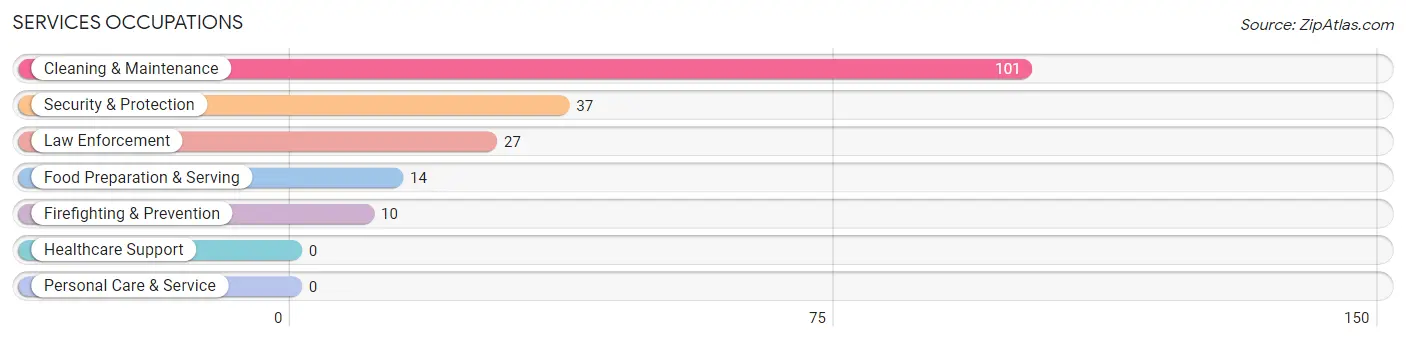
Services Occupations
The most common Services occupations in Cluster Springs are Cleaning & Maintenance (101 | 24.5%), Security & Protection (37 | 9.0%), Law Enforcement (27 | 6.5%), Food Preparation & Serving (14 | 3.4%), and Firefighting & Prevention (10 | 2.4%).
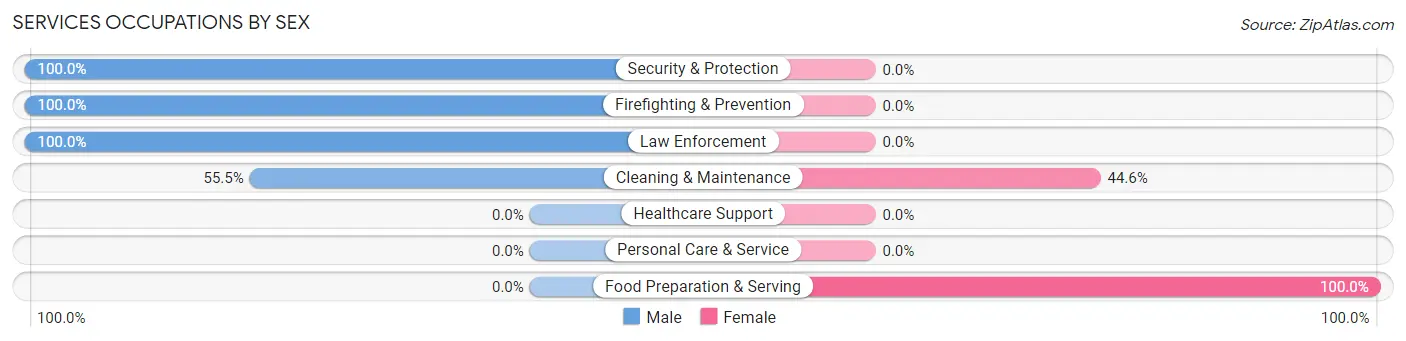
Services Occupations by Sex
Within the Services occupations in Cluster Springs, the most male-oriented occupations are Security & Protection (100.0%), Firefighting & Prevention (100.0%), and Law Enforcement (100.0%), while the most female-oriented occupations are Food Preparation & Serving (100.0%), and Cleaning & Maintenance (44.6%).
| Occupation | Male | Female |
| Healthcare Support | 0 (0.0%) | 0 (0.0%) |
| Security & Protection | 37 (100.0%) | 0 (0.0%) |
| Firefighting & Prevention | 10 (100.0%) | 0 (0.0%) |
| Law Enforcement | 27 (100.0%) | 0 (0.0%) |
| Food Preparation & Serving | 0 (0.0%) | 14 (100.0%) |
| Cleaning & Maintenance | 56 (55.4%) | 45 (44.6%) |
| Personal Care & Service | 0 (0.0%) | 0 (0.0%) |
| Total (Category) | 93 (61.2%) | 59 (38.8%) |
| Total (Overall) | 132 (32.0%) | 281 (68.0%) |
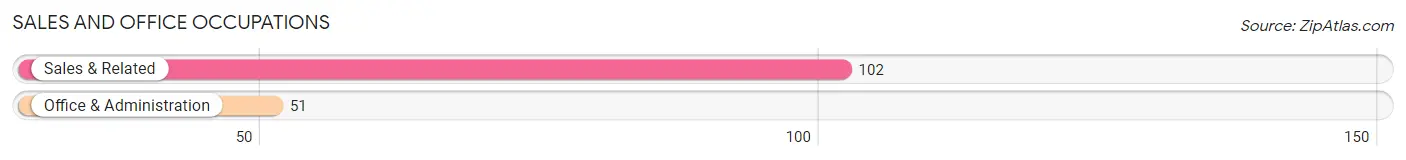
Sales and Office Occupations
The most common Sales and Office occupations in Cluster Springs are Sales & Related (102 | 24.7%), and Office & Administration (51 | 12.3%).
Sales and Office Occupations by Sex
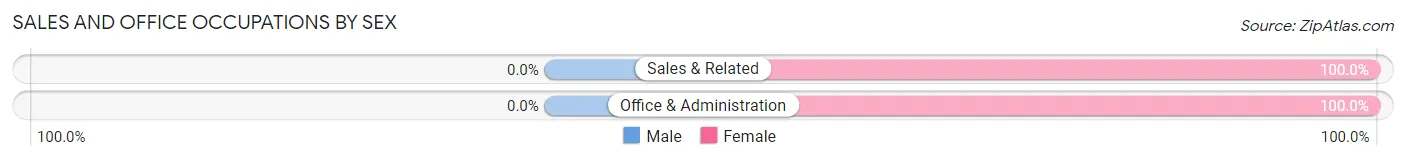
| Occupation | Male | Female |
| Sales & Related | 0 (0.0%) | 102 (100.0%) |
| Office & Administration | 0 (0.0%) | 51 (100.0%) |
| Total (Category) | 0 (0.0%) | 153 (100.0%) |
| Total (Overall) | 132 (32.0%) | 281 (68.0%) |
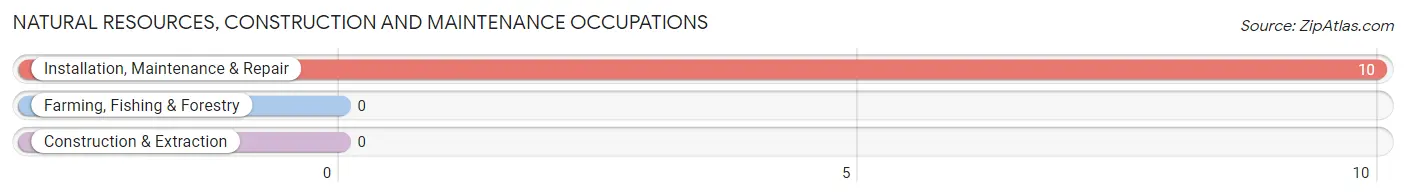
Natural Resources, Construction and Maintenance Occupations
The most common Natural Resources, Construction and Maintenance occupations in Cluster Springs are , and Installation, Maintenance & Repair (10 | 2.4%).
Natural Resources, Construction and Maintenance Occupations by Sex
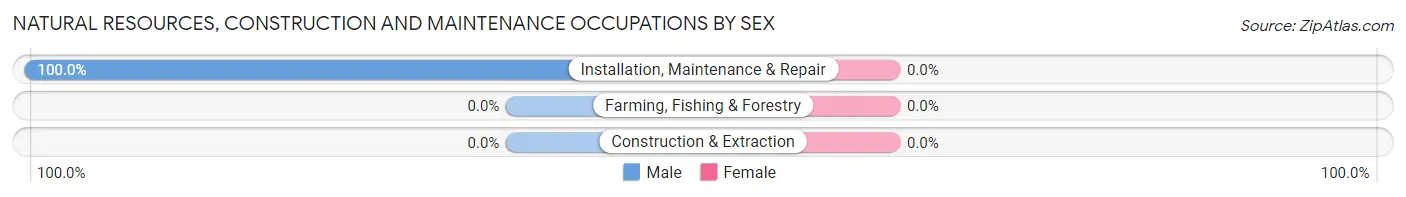
| Occupation | Male | Female |
| Farming, Fishing & Forestry | 0 (0.0%) | 0 (0.0%) |
| Construction & Extraction | 0 (0.0%) | 0 (0.0%) |
| Installation, Maintenance & Repair | 10 (100.0%) | 0 (0.0%) |
| Total (Category) | 10 (100.0%) | 0 (0.0%) |
| Total (Overall) | 132 (32.0%) | 281 (68.0%) |
Production, Transportation and Moving Occupations
The most common Production, Transportation and Moving occupations in Cluster Springs are , and Production (20 | 4.8%).
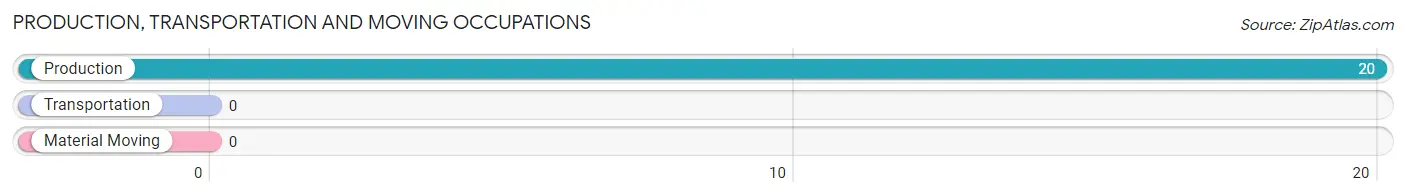
Production, Transportation and Moving Occupations by Sex
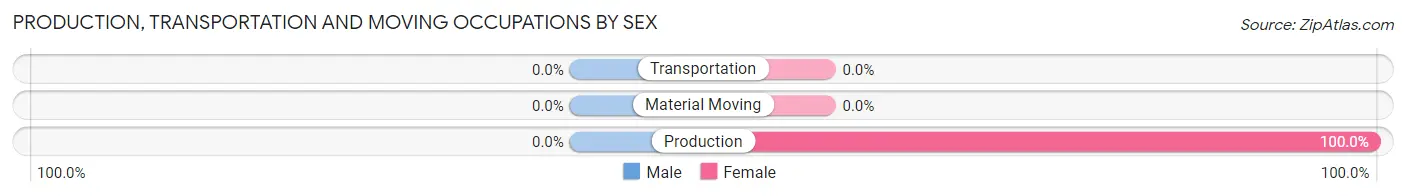
| Occupation | Male | Female |
| Production | 0 (0.0%) | 20 (100.0%) |
| Transportation | 0 (0.0%) | 0 (0.0%) |
| Material Moving | 0 (0.0%) | 0 (0.0%) |
| Total (Category) | 0 (0.0%) | 20 (100.0%) |
| Total (Overall) | 132 (32.0%) | 281 (68.0%) |
Employment Industries by Sex in Cluster Springs
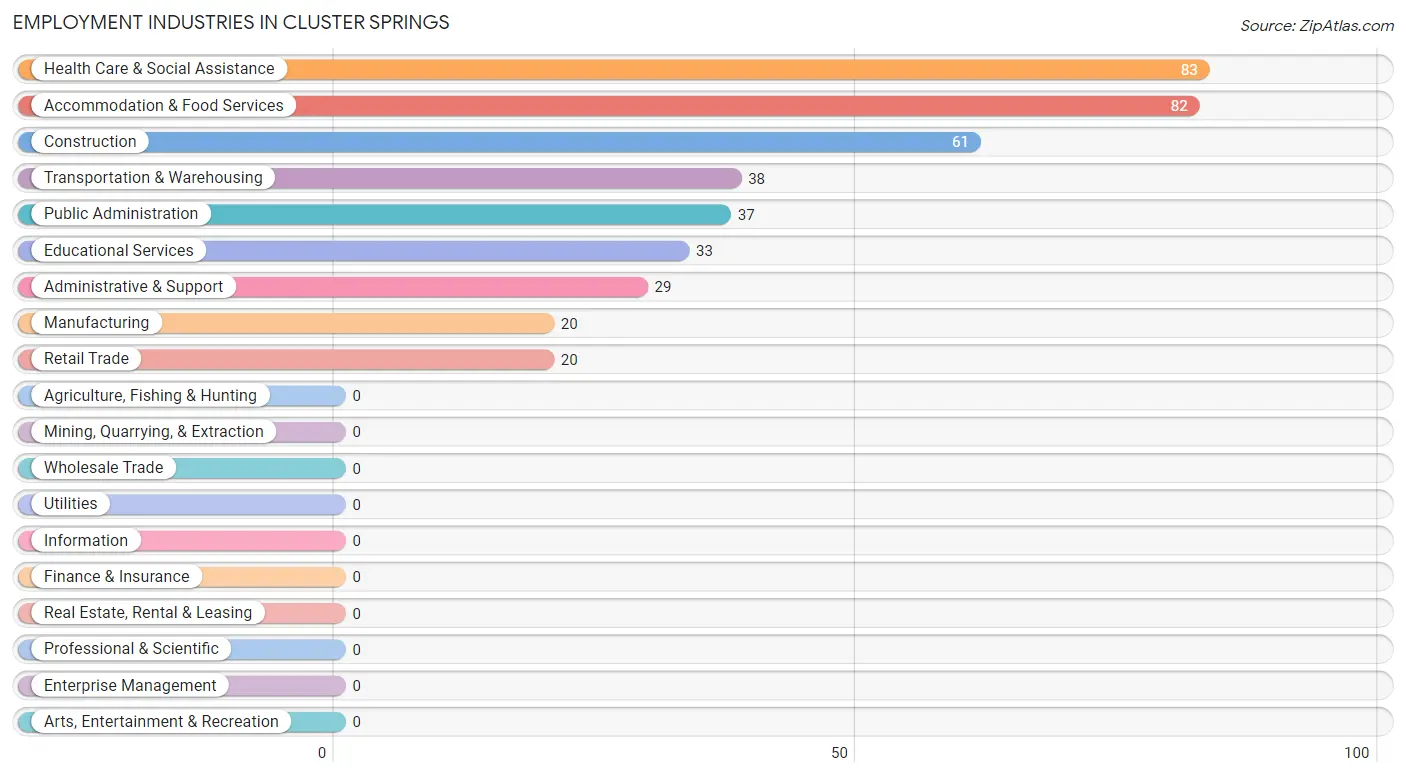
Employment Industries in Cluster Springs
The major employment industries in Cluster Springs include Health Care & Social Assistance (83 | 20.1%), Accommodation & Food Services (82 | 19.9%), Construction (61 | 14.8%), Transportation & Warehousing (38 | 9.2%), and Public Administration (37 | 9.0%).
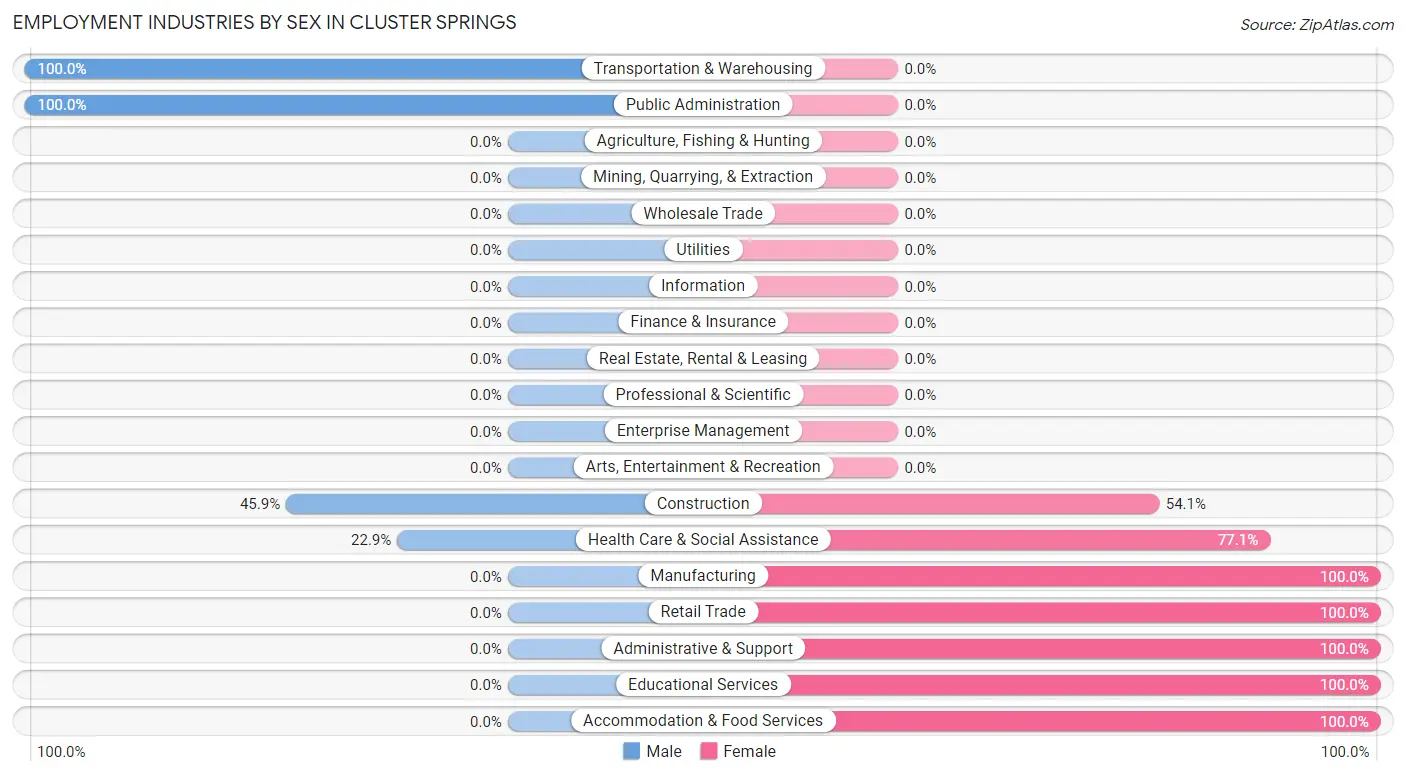
Employment Industries by Sex in Cluster Springs
The Cluster Springs industries that see more men than women are Transportation & Warehousing (100.0%), Public Administration (100.0%), and Construction (45.9%), whereas the industries that tend to have a higher number of women are Manufacturing (100.0%), Retail Trade (100.0%), and Administrative & Support (100.0%).
| Industry | Male | Female |
| Agriculture, Fishing & Hunting | 0 (0.0%) | 0 (0.0%) |
| Mining, Quarrying, & Extraction | 0 (0.0%) | 0 (0.0%) |
| Construction | 28 (45.9%) | 33 (54.1%) |
| Manufacturing | 0 (0.0%) | 20 (100.0%) |
| Wholesale Trade | 0 (0.0%) | 0 (0.0%) |
| Retail Trade | 0 (0.0%) | 20 (100.0%) |
| Transportation & Warehousing | 38 (100.0%) | 0 (0.0%) |
| Utilities | 0 (0.0%) | 0 (0.0%) |
| Information | 0 (0.0%) | 0 (0.0%) |
| Finance & Insurance | 0 (0.0%) | 0 (0.0%) |
| Real Estate, Rental & Leasing | 0 (0.0%) | 0 (0.0%) |
| Professional & Scientific | 0 (0.0%) | 0 (0.0%) |
| Enterprise Management | 0 (0.0%) | 0 (0.0%) |
| Administrative & Support | 0 (0.0%) | 29 (100.0%) |
| Educational Services | 0 (0.0%) | 33 (100.0%) |
| Health Care & Social Assistance | 19 (22.9%) | 64 (77.1%) |
| Arts, Entertainment & Recreation | 0 (0.0%) | 0 (0.0%) |
| Accommodation & Food Services | 0 (0.0%) | 82 (100.0%) |
| Public Administration | 37 (100.0%) | 0 (0.0%) |
| Total | 132 (32.0%) | 281 (68.0%) |
Education in Cluster Springs
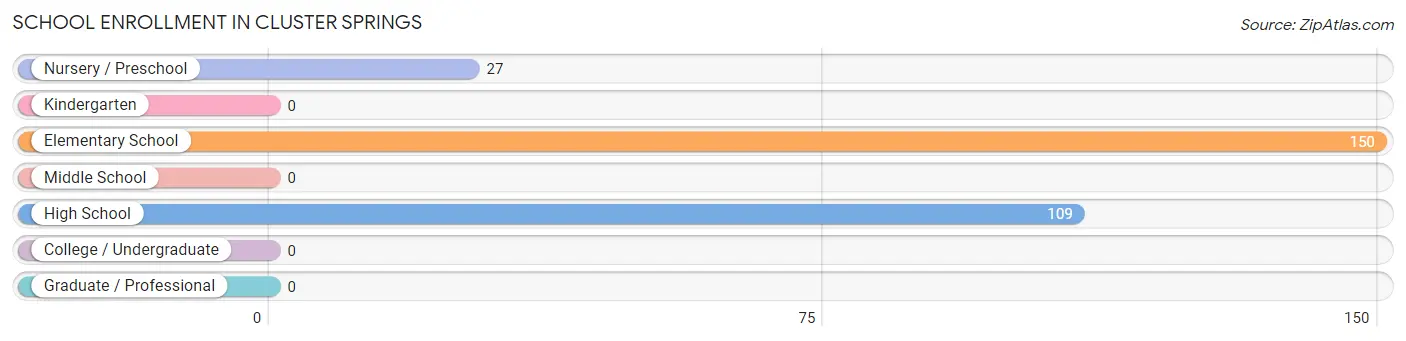
School Enrollment in Cluster Springs
The most common levels of schooling among the 286 students in Cluster Springs are elementary school (150 | 52.4%), high school (109 | 38.1%), and nursery / preschool (27 | 9.4%).
| School Level | # Students | % Students |
| Nursery / Preschool | 27 | 9.4% |
| Kindergarten | 0 | 0.0% |
| Elementary School | 150 | 52.4% |
| Middle School | 0 | 0.0% |
| High School | 109 | 38.1% |
| College / Undergraduate | 0 | 0.0% |
| Graduate / Professional | 0 | 0.0% |
| Total | 286 | 100.0% |
School Enrollment by Age by Funding Source in Cluster Springs
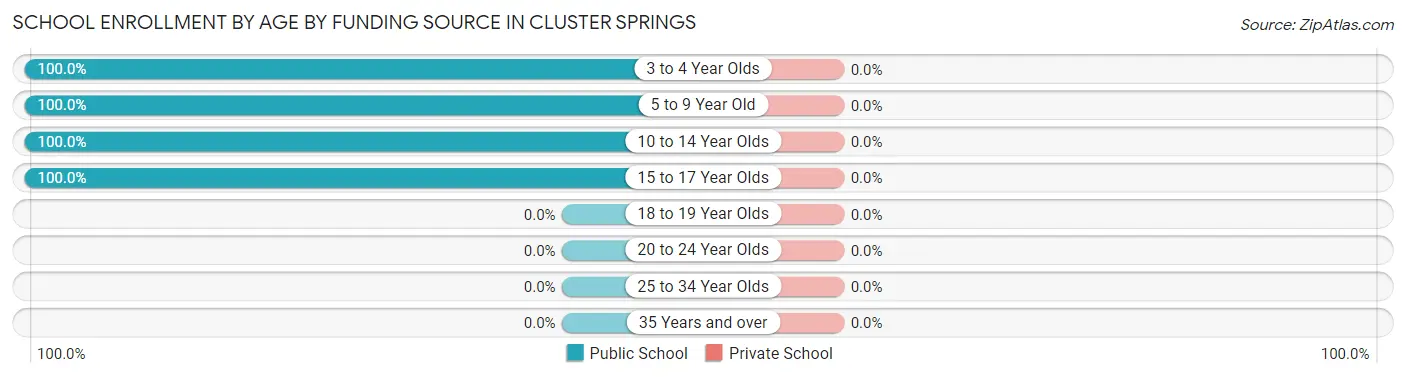
| Age Bracket | Public School | Private School |
| 3 to 4 Year Olds | 27 (100.0%) | 0 (0.0%) |
| 5 to 9 Year Old | 139 (100.0%) | 0 (0.0%) |
| 10 to 14 Year Olds | 29 (100.0%) | 0 (0.0%) |
| 15 to 17 Year Olds | 91 (100.0%) | 0 (0.0%) |
| 18 to 19 Year Olds | 0 (0.0%) | 0 (0.0%) |
| 20 to 24 Year Olds | 0 (0.0%) | 0 (0.0%) |
| 25 to 34 Year Olds | 0 (0.0%) | 0 (0.0%) |
| 35 Years and over | 0 (0.0%) | 0 (0.0%) |
| Total | 286 (100.0%) | 0 (0.0%) |
Educational Attainment by Field of Study in Cluster Springs
Liberal arts & history (80 | 86.0%), and literature & languages (13 | 14.0%) are the most common fields of study among 93 individuals in Cluster Springs who have obtained a bachelor's degree or higher.
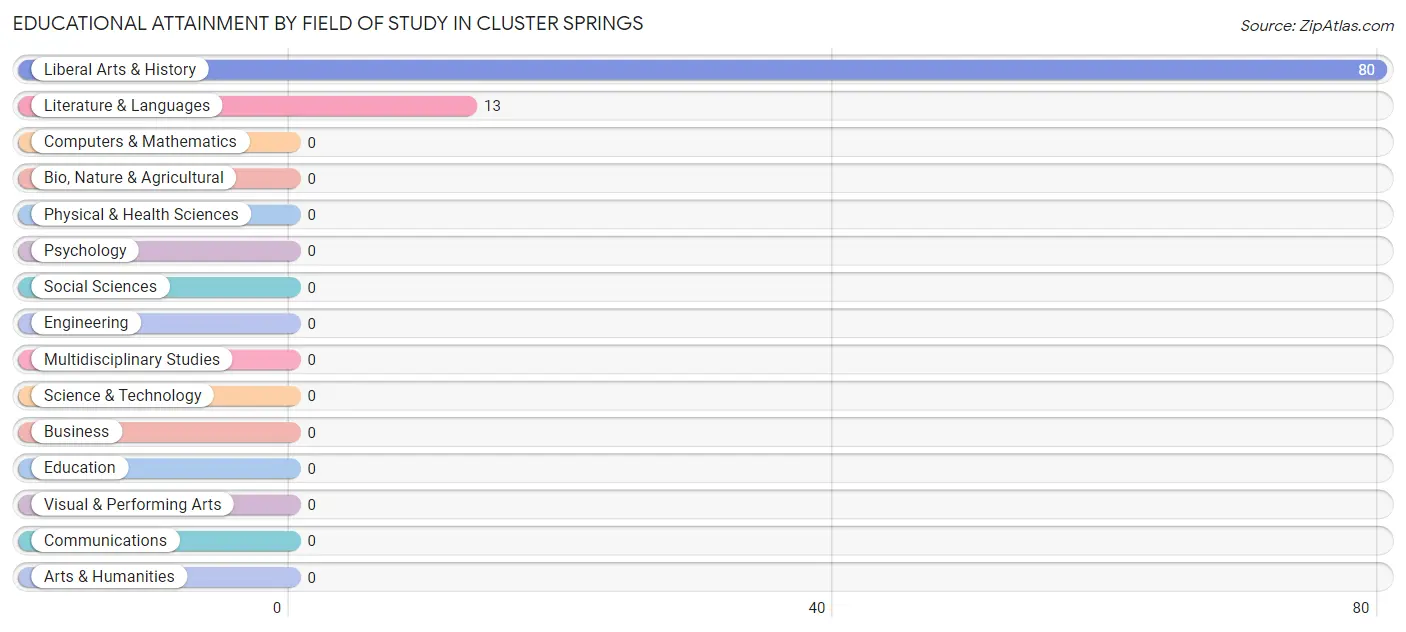
| Field of Study | # Graduates | % Graduates |
| Computers & Mathematics | 0 | 0.0% |
| Bio, Nature & Agricultural | 0 | 0.0% |
| Physical & Health Sciences | 0 | 0.0% |
| Psychology | 0 | 0.0% |
| Social Sciences | 0 | 0.0% |
| Engineering | 0 | 0.0% |
| Multidisciplinary Studies | 0 | 0.0% |
| Science & Technology | 0 | 0.0% |
| Business | 0 | 0.0% |
| Education | 0 | 0.0% |
| Literature & Languages | 13 | 14.0% |
| Liberal Arts & History | 80 | 86.0% |
| Visual & Performing Arts | 0 | 0.0% |
| Communications | 0 | 0.0% |
| Arts & Humanities | 0 | 0.0% |
| Total | 93 | 100.0% |
Transportation & Commute in Cluster Springs
Vehicle Availability by Sex in Cluster Springs
The most prevalent vehicle ownership categories in Cluster Springs are males with 2 vehicles (103, accounting for 78.0%) and females with 2 vehicles (225, making up 36.6%).
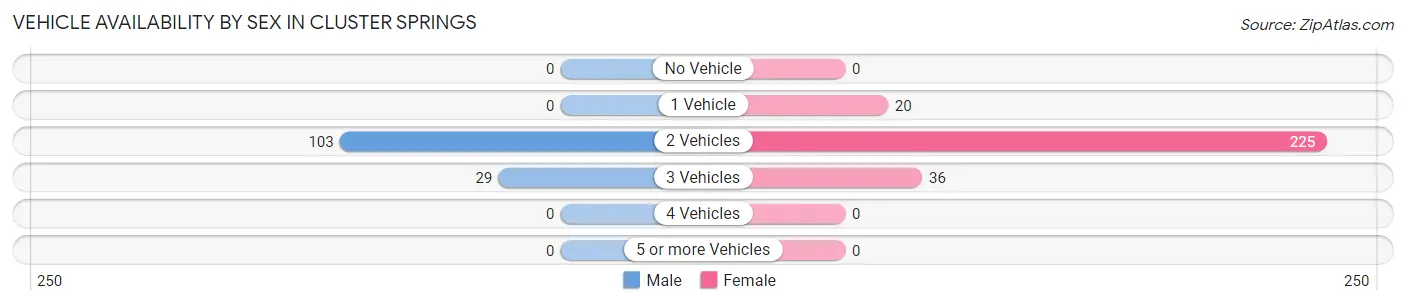
| Vehicles Available | Male | Female |
| No Vehicle | 0 (0.0%) | 0 (0.0%) |
| 1 Vehicle | 0 (0.0%) | 20 (7.1%) |
| 2 Vehicles | 103 (78.0%) | 225 (80.1%) |
| 3 Vehicles | 29 (22.0%) | 36 (12.8%) |
| 4 Vehicles | 0 (0.0%) | 0 (0.0%) |
| 5 or more Vehicles | 0 (0.0%) | 0 (0.0%) |
| Total | 132 (100.0%) | 281 (100.0%) |
Commute Time in Cluster Springs
The most frequently occuring commute durations in Cluster Springs are 20 to 24 minutes (172 commuters, 43.4%), 30 to 34 minutes (133 commuters, 33.6%), and 25 to 29 minutes (52 commuters, 13.1%).
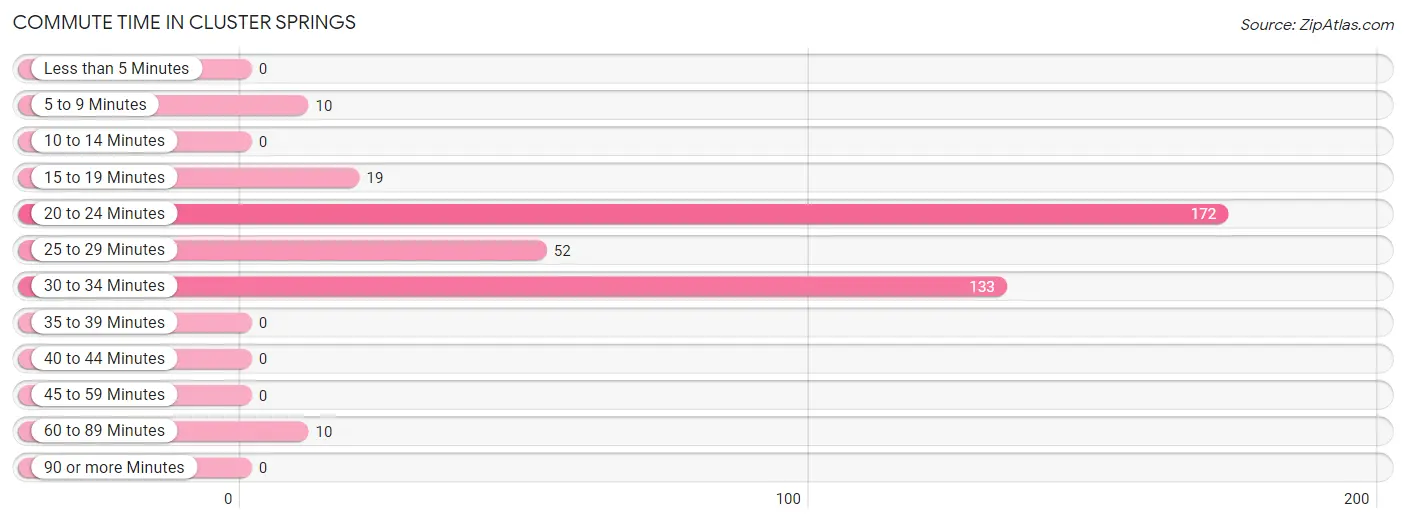
| Commute Time | # Commuters | % Commuters |
| Less than 5 Minutes | 0 | 0.0% |
| 5 to 9 Minutes | 10 | 2.5% |
| 10 to 14 Minutes | 0 | 0.0% |
| 15 to 19 Minutes | 19 | 4.8% |
| 20 to 24 Minutes | 172 | 43.4% |
| 25 to 29 Minutes | 52 | 13.1% |
| 30 to 34 Minutes | 133 | 33.6% |
| 35 to 39 Minutes | 0 | 0.0% |
| 40 to 44 Minutes | 0 | 0.0% |
| 45 to 59 Minutes | 0 | 0.0% |
| 60 to 89 Minutes | 10 | 2.5% |
| 90 or more Minutes | 0 | 0.0% |
Commute Time by Sex in Cluster Springs
The most common commute times in Cluster Springs are 20 to 24 minutes (55 commuters, 41.7%) for males and 30 to 34 minutes (133 commuters, 50.4%) for females.
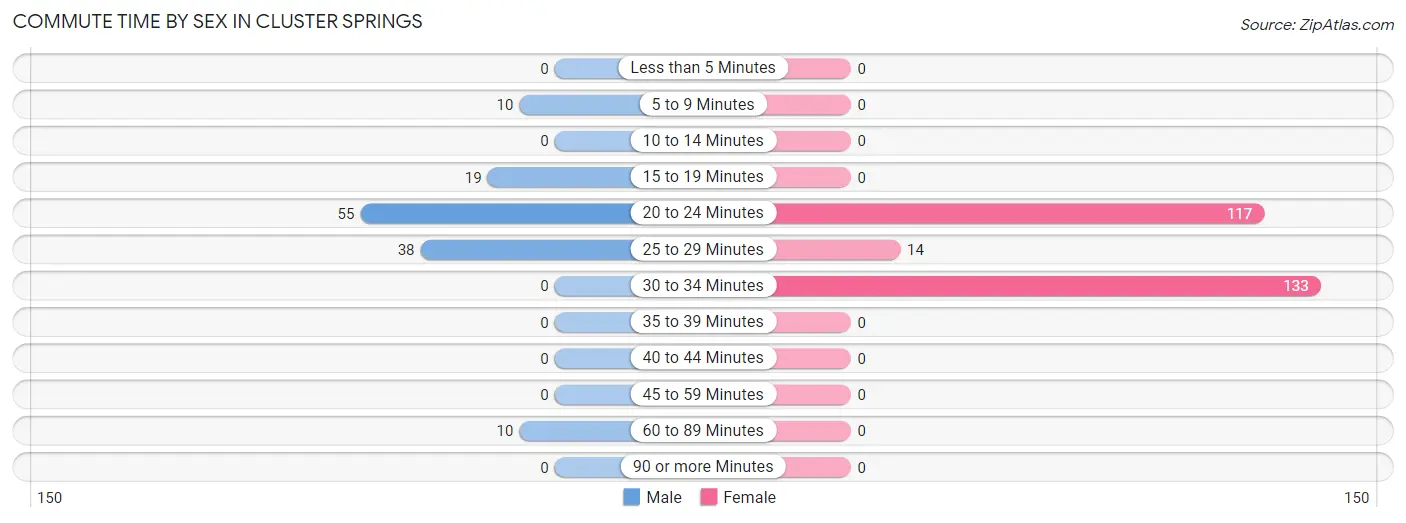
| Commute Time | Male | Female |
| Less than 5 Minutes | 0 (0.0%) | 0 (0.0%) |
| 5 to 9 Minutes | 10 (7.6%) | 0 (0.0%) |
| 10 to 14 Minutes | 0 (0.0%) | 0 (0.0%) |
| 15 to 19 Minutes | 19 (14.4%) | 0 (0.0%) |
| 20 to 24 Minutes | 55 (41.7%) | 117 (44.3%) |
| 25 to 29 Minutes | 38 (28.8%) | 14 (5.3%) |
| 30 to 34 Minutes | 0 (0.0%) | 133 (50.4%) |
| 35 to 39 Minutes | 0 (0.0%) | 0 (0.0%) |
| 40 to 44 Minutes | 0 (0.0%) | 0 (0.0%) |
| 45 to 59 Minutes | 0 (0.0%) | 0 (0.0%) |
| 60 to 89 Minutes | 10 (7.6%) | 0 (0.0%) |
| 90 or more Minutes | 0 (0.0%) | 0 (0.0%) |
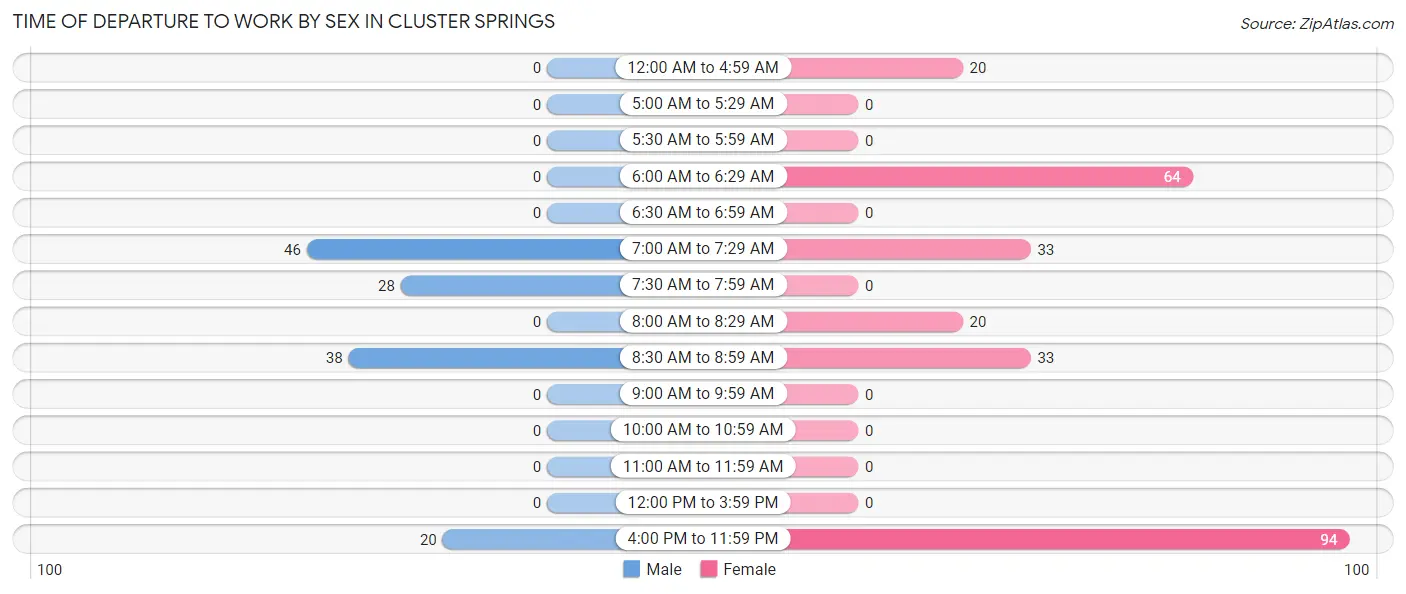
Time of Departure to Work by Sex in Cluster Springs
The most frequent times of departure to work in Cluster Springs are 7:00 AM to 7:29 AM (46, 34.8%) for males and 4:00 PM to 11:59 PM (94, 35.6%) for females.
| Time of Departure | Male | Female |
| 12:00 AM to 4:59 AM | 0 (0.0%) | 20 (7.6%) |
| 5:00 AM to 5:29 AM | 0 (0.0%) | 0 (0.0%) |
| 5:30 AM to 5:59 AM | 0 (0.0%) | 0 (0.0%) |
| 6:00 AM to 6:29 AM | 0 (0.0%) | 64 (24.2%) |
| 6:30 AM to 6:59 AM | 0 (0.0%) | 0 (0.0%) |
| 7:00 AM to 7:29 AM | 46 (34.8%) | 33 (12.5%) |
| 7:30 AM to 7:59 AM | 28 (21.2%) | 0 (0.0%) |
| 8:00 AM to 8:29 AM | 0 (0.0%) | 20 (7.6%) |
| 8:30 AM to 8:59 AM | 38 (28.8%) | 33 (12.5%) |
| 9:00 AM to 9:59 AM | 0 (0.0%) | 0 (0.0%) |
| 10:00 AM to 10:59 AM | 0 (0.0%) | 0 (0.0%) |
| 11:00 AM to 11:59 AM | 0 (0.0%) | 0 (0.0%) |
| 12:00 PM to 3:59 PM | 0 (0.0%) | 0 (0.0%) |
| 4:00 PM to 11:59 PM | 20 (15.1%) | 94 (35.6%) |
| Total | 132 (100.0%) | 264 (100.0%) |
Housing Occupancy in Cluster Springs
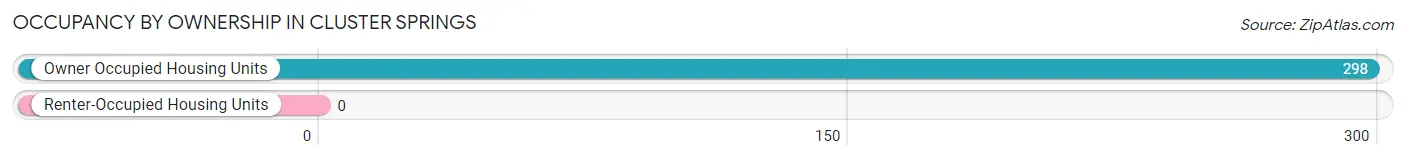
Occupancy by Ownership in Cluster Springs
Of the total 298 dwellings in Cluster Springs, owner-occupied units account for 298 (100.0%), while renter-occupied units make up 0 (0.0%).
| Occupancy | # Housing Units | % Housing Units |
| Owner Occupied Housing Units | 298 | 100.0% |
| Renter-Occupied Housing Units | 0 | 0.0% |
| Total Occupied Housing Units | 298 | 100.0% |
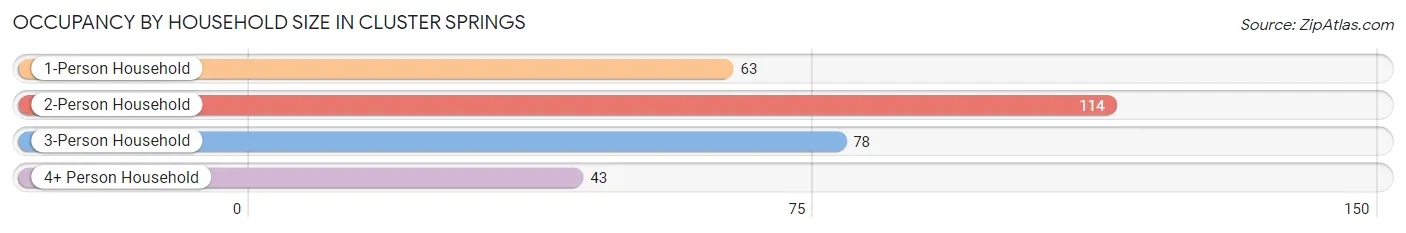
Occupancy by Household Size in Cluster Springs
| Household Size | # Housing Units | % Housing Units |
| 1-Person Household | 63 | 21.1% |
| 2-Person Household | 114 | 38.3% |
| 3-Person Household | 78 | 26.2% |
| 4+ Person Household | 43 | 14.4% |
| Total Housing Units | 298 | 100.0% |
Occupancy by Ownership by Household Size in Cluster Springs
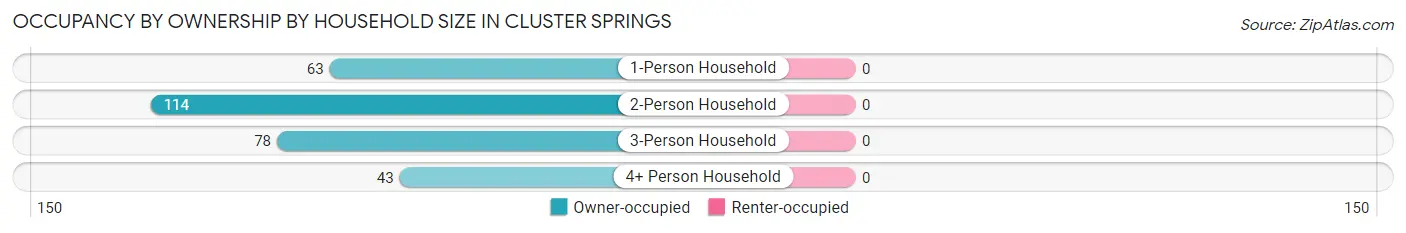
| Household Size | Owner-occupied | Renter-occupied |
| 1-Person Household | 63 (100.0%) | 0 (0.0%) |
| 2-Person Household | 114 (100.0%) | 0 (0.0%) |
| 3-Person Household | 78 (100.0%) | 0 (0.0%) |
| 4+ Person Household | 43 (100.0%) | 0 (0.0%) |
| Total Housing Units | 298 (100.0%) | 0 (0.0%) |
Occupancy by Educational Attainment in Cluster Springs
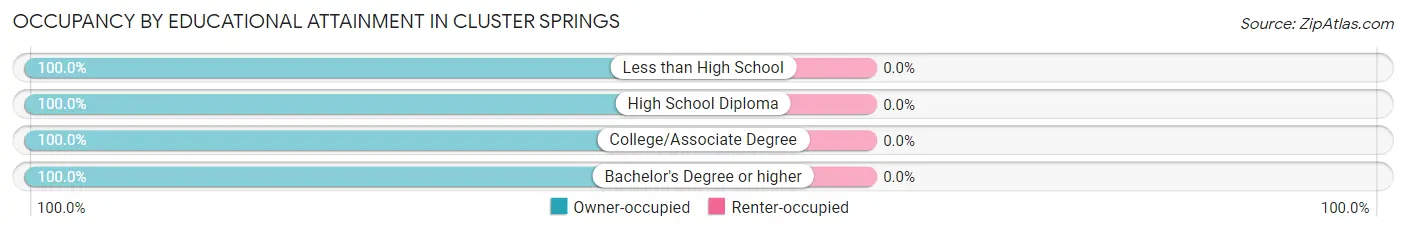
| Household Size | Owner-occupied | Renter-occupied |
| Less than High School | 51 (100.0%) | 0 (0.0%) |
| High School Diploma | 91 (100.0%) | 0 (0.0%) |
| College/Associate Degree | 133 (100.0%) | 0 (0.0%) |
| Bachelor's Degree or higher | 23 (100.0%) | 0 (0.0%) |
Occupancy by Age of Householder in Cluster Springs
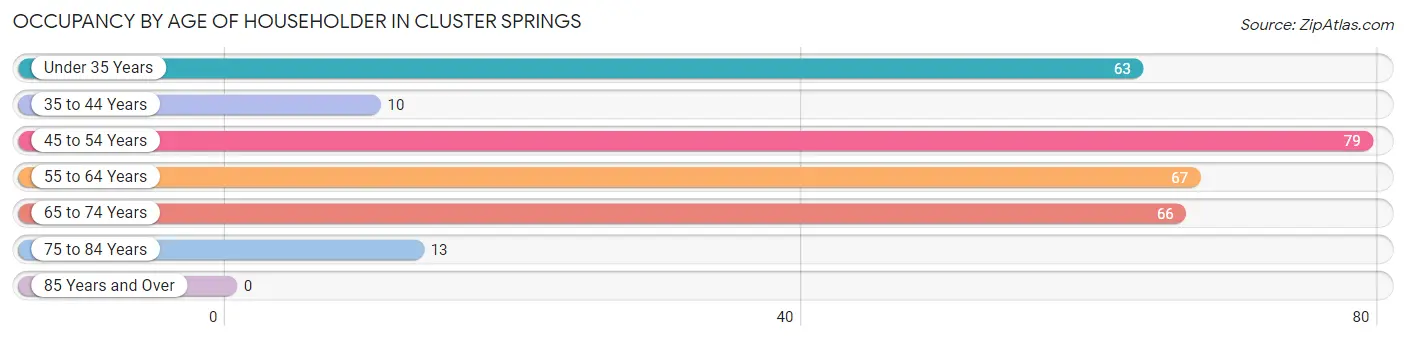
| Age Bracket | # Households | % Households |
| Under 35 Years | 63 | 21.1% |
| 35 to 44 Years | 10 | 3.4% |
| 45 to 54 Years | 79 | 26.5% |
| 55 to 64 Years | 67 | 22.5% |
| 65 to 74 Years | 66 | 22.2% |
| 75 to 84 Years | 13 | 4.4% |
| 85 Years and Over | 0 | 0.0% |
| Total | 298 | 100.0% |
Housing Finances in Cluster Springs
Median Income by Occupancy in Cluster Springs
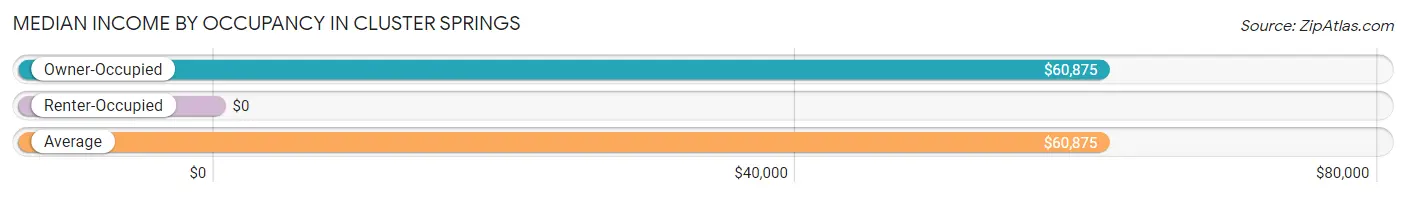
| Occupancy Type | # Households | Median Income |
| Owner-Occupied | 298 (100.0%) | $60,875 |
| Renter-Occupied | 0 (0.0%) | $0 |
| Average | 298 (100.0%) | $60,875 |
Occupancy by Householder Income Bracket in Cluster Springs
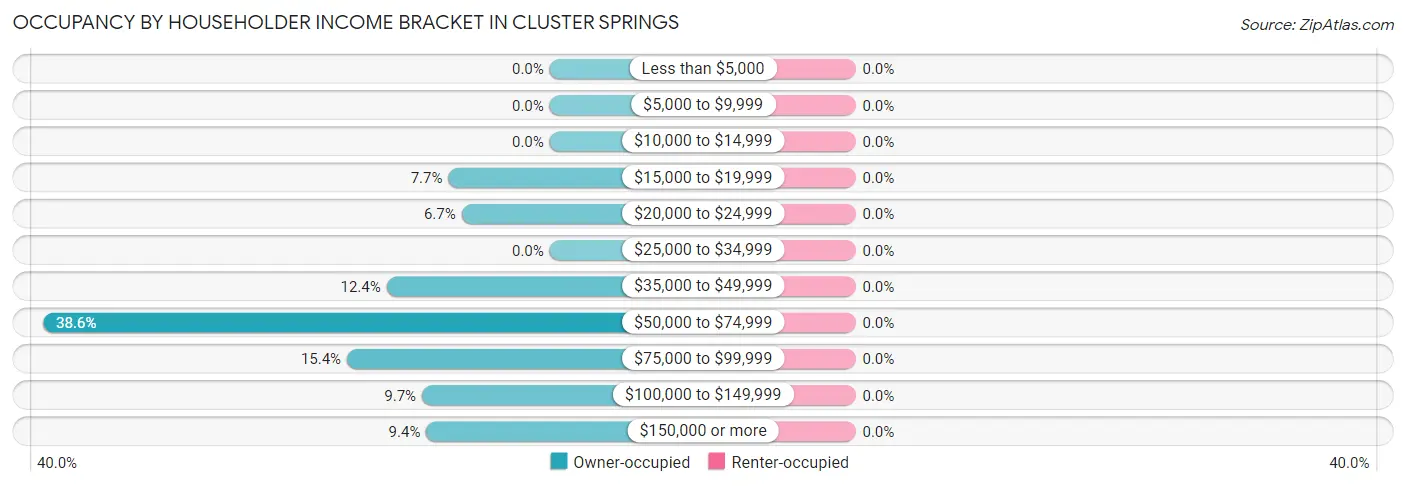
| Income Bracket | Owner-occupied | Renter-occupied |
| Less than $5,000 | 0 (0.0%) | 0 (0.0%) |
| $5,000 to $9,999 | 0 (0.0%) | 0 (0.0%) |
| $10,000 to $14,999 | 0 (0.0%) | 0 (0.0%) |
| $15,000 to $19,999 | 23 (7.7%) | 0 (0.0%) |
| $20,000 to $24,999 | 20 (6.7%) | 0 (0.0%) |
| $25,000 to $34,999 | 0 (0.0%) | 0 (0.0%) |
| $35,000 to $49,999 | 37 (12.4%) | 0 (0.0%) |
| $50,000 to $74,999 | 115 (38.6%) | 0 (0.0%) |
| $75,000 to $99,999 | 46 (15.4%) | 0 (0.0%) |
| $100,000 to $149,999 | 29 (9.7%) | 0 (0.0%) |
| $150,000 or more | 28 (9.4%) | 0 (0.0%) |
| Total | 298 (100.0%) | 0 (0.0%) |
Monthly Housing Cost Tiers in Cluster Springs
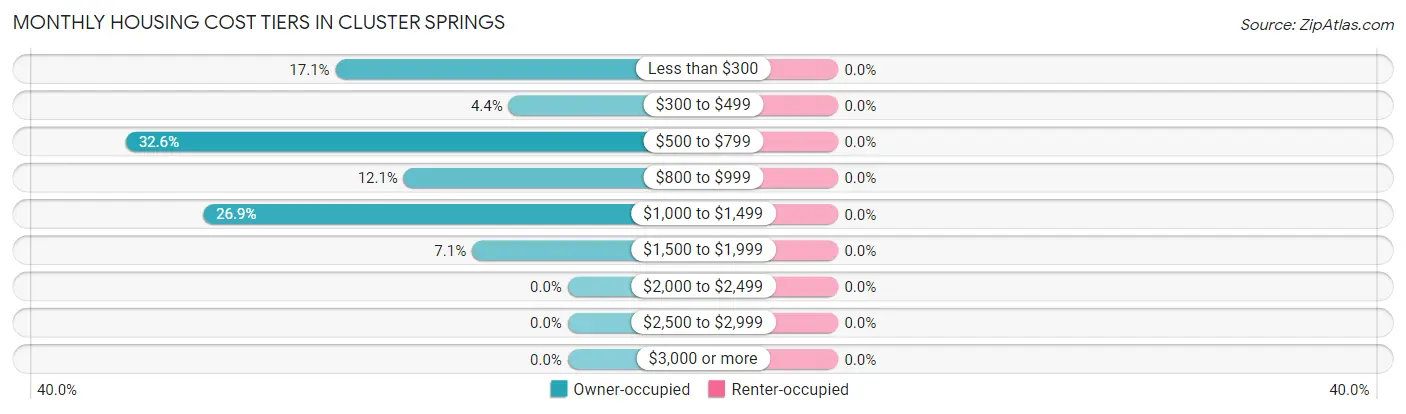
| Monthly Cost | Owner-occupied | Renter-occupied |
| Less than $300 | 51 (17.1%) | 0 (0.0%) |
| $300 to $499 | 13 (4.4%) | 0 (0.0%) |
| $500 to $799 | 97 (32.6%) | 0 (0.0%) |
| $800 to $999 | 36 (12.1%) | 0 (0.0%) |
| $1,000 to $1,499 | 80 (26.9%) | 0 (0.0%) |
| $1,500 to $1,999 | 21 (7.0%) | 0 (0.0%) |
| $2,000 to $2,499 | 0 (0.0%) | 0 (0.0%) |
| $2,500 to $2,999 | 0 (0.0%) | 0 (0.0%) |
| $3,000 or more | 0 (0.0%) | 0 (0.0%) |
| Total | 298 (100.0%) | 0 (0.0%) |
Physical Housing Characteristics in Cluster Springs
Housing Structures in Cluster Springs
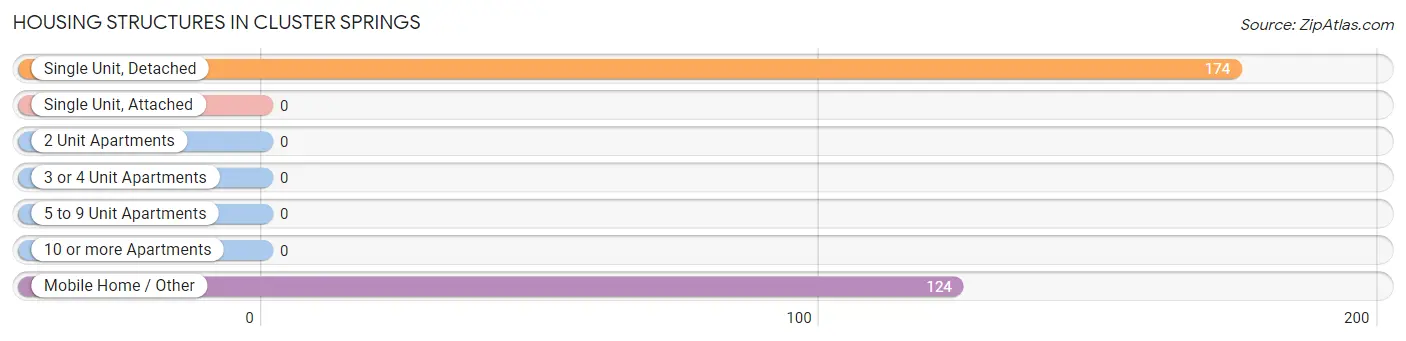
| Structure Type | # Housing Units | % Housing Units |
| Single Unit, Detached | 174 | 58.4% |
| Single Unit, Attached | 0 | 0.0% |
| 2 Unit Apartments | 0 | 0.0% |
| 3 or 4 Unit Apartments | 0 | 0.0% |
| 5 to 9 Unit Apartments | 0 | 0.0% |
| 10 or more Apartments | 0 | 0.0% |
| Mobile Home / Other | 124 | 41.6% |
| Total | 298 | 100.0% |
Housing Structures by Occupancy in Cluster Springs
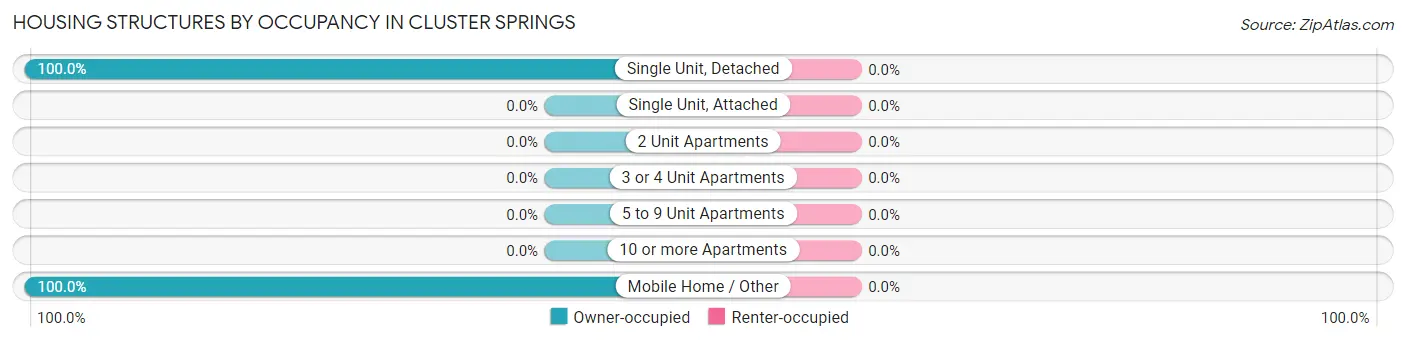
| Structure Type | Owner-occupied | Renter-occupied |
| Single Unit, Detached | 174 (100.0%) | 0 (0.0%) |
| Single Unit, Attached | 0 (0.0%) | 0 (0.0%) |
| 2 Unit Apartments | 0 (0.0%) | 0 (0.0%) |
| 3 or 4 Unit Apartments | 0 (0.0%) | 0 (0.0%) |
| 5 to 9 Unit Apartments | 0 (0.0%) | 0 (0.0%) |
| 10 or more Apartments | 0 (0.0%) | 0 (0.0%) |
| Mobile Home / Other | 124 (100.0%) | 0 (0.0%) |
| Total | 298 (100.0%) | 0 (0.0%) |
Housing Structures by Number of Rooms in Cluster Springs
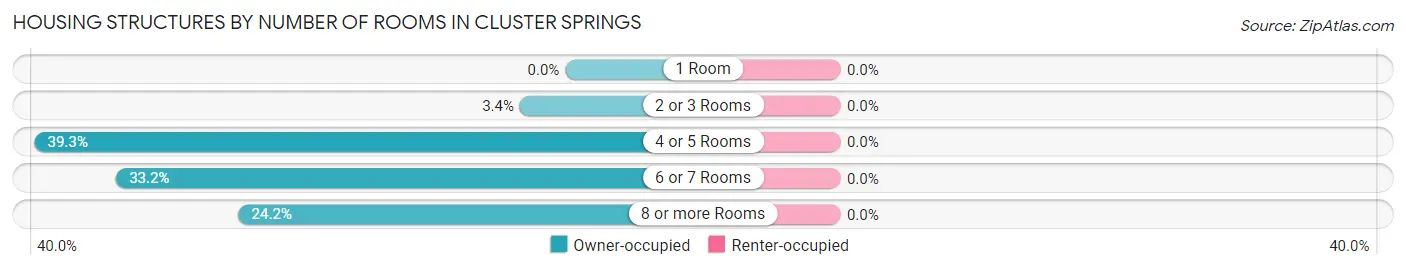
| Number of Rooms | Owner-occupied | Renter-occupied |
| 1 Room | 0 (0.0%) | 0 (0.0%) |
| 2 or 3 Rooms | 10 (3.4%) | 0 (0.0%) |
| 4 or 5 Rooms | 117 (39.3%) | 0 (0.0%) |
| 6 or 7 Rooms | 99 (33.2%) | 0 (0.0%) |
| 8 or more Rooms | 72 (24.2%) | 0 (0.0%) |
| Total | 298 (100.0%) | 0 (0.0%) |
Housing Structure by Heating Type in Cluster Springs
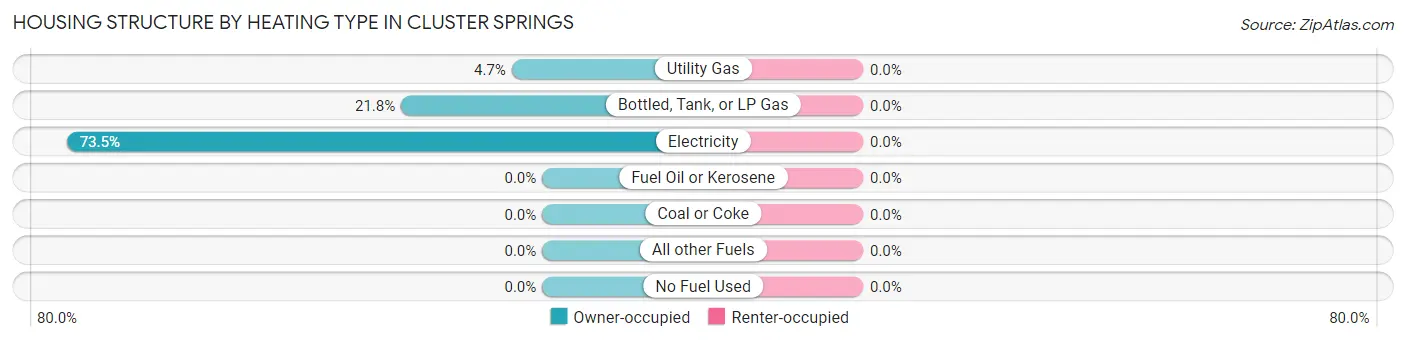
| Heating Type | Owner-occupied | Renter-occupied |
| Utility Gas | 14 (4.7%) | 0 (0.0%) |
| Bottled, Tank, or LP Gas | 65 (21.8%) | 0 (0.0%) |
| Electricity | 219 (73.5%) | 0 (0.0%) |
| Fuel Oil or Kerosene | 0 (0.0%) | 0 (0.0%) |
| Coal or Coke | 0 (0.0%) | 0 (0.0%) |
| All other Fuels | 0 (0.0%) | 0 (0.0%) |
| No Fuel Used | 0 (0.0%) | 0 (0.0%) |
| Total | 298 (100.0%) | 0 (0.0%) |
Household Vehicle Usage in Cluster Springs
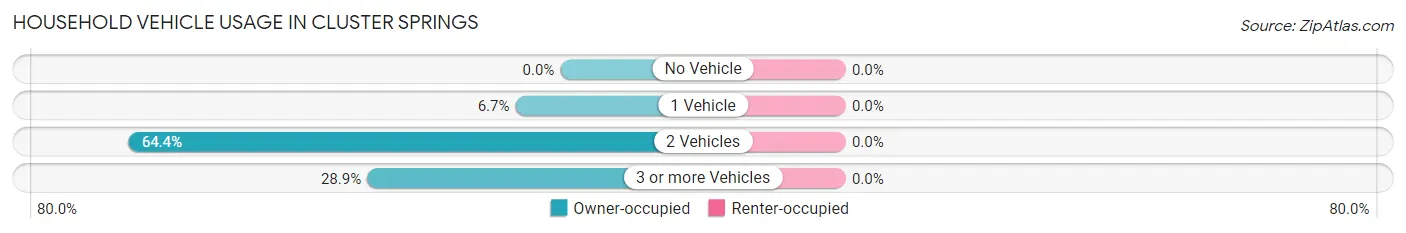
| Vehicles per Household | Owner-occupied | Renter-occupied |
| No Vehicle | 0 (0.0%) | 0 (0.0%) |
| 1 Vehicle | 20 (6.7%) | 0 (0.0%) |
| 2 Vehicles | 192 (64.4%) | 0 (0.0%) |
| 3 or more Vehicles | 86 (28.9%) | 0 (0.0%) |
| Total | 298 (100.0%) | 0 (0.0%) |
Real Estate & Mortgages in Cluster Springs
Real Estate and Mortgage Overview in Cluster Springs
| Characteristic | Without Mortgage | With Mortgage |
| Housing Units | 98 | 200 |
| Median Property Value | - | - |
| Median Household Income | - | - |
| Monthly Housing Costs | - | - |
| Real Estate Taxes | $736 | $35 |
Property Value by Mortgage Status in Cluster Springs
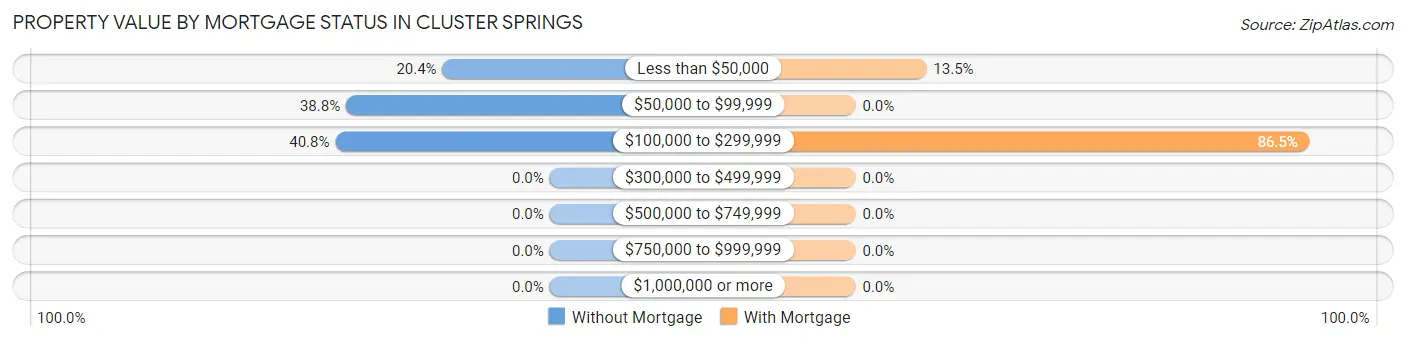
| Property Value | Without Mortgage | With Mortgage |
| Less than $50,000 | 20 (20.4%) | 27 (13.5%) |
| $50,000 to $99,999 | 38 (38.8%) | 0 (0.0%) |
| $100,000 to $299,999 | 40 (40.8%) | 173 (86.5%) |
| $300,000 to $499,999 | 0 (0.0%) | 0 (0.0%) |
| $500,000 to $749,999 | 0 (0.0%) | 0 (0.0%) |
| $750,000 to $999,999 | 0 (0.0%) | 0 (0.0%) |
| $1,000,000 or more | 0 (0.0%) | 0 (0.0%) |
| Total | 98 (100.0%) | 200 (100.0%) |
Household Income by Mortgage Status in Cluster Springs
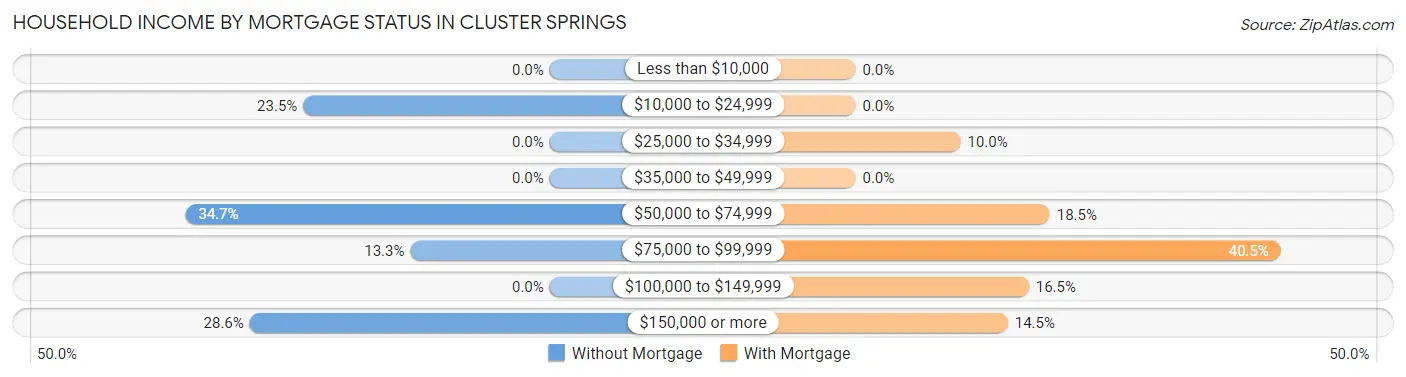
| Household Income | Without Mortgage | With Mortgage |
| Less than $10,000 | 0 (0.0%) | 0 (0.0%) |
| $10,000 to $24,999 | 23 (23.5%) | 0 (0.0%) |
| $25,000 to $34,999 | 0 (0.0%) | 20 (10.0%) |
| $35,000 to $49,999 | 0 (0.0%) | 0 (0.0%) |
| $50,000 to $74,999 | 34 (34.7%) | 37 (18.5%) |
| $75,000 to $99,999 | 13 (13.3%) | 81 (40.5%) |
| $100,000 to $149,999 | 0 (0.0%) | 33 (16.5%) |
| $150,000 or more | 28 (28.6%) | 29 (14.5%) |
| Total | 98 (100.0%) | 200 (100.0%) |
Property Value to Household Income Ratio in Cluster Springs
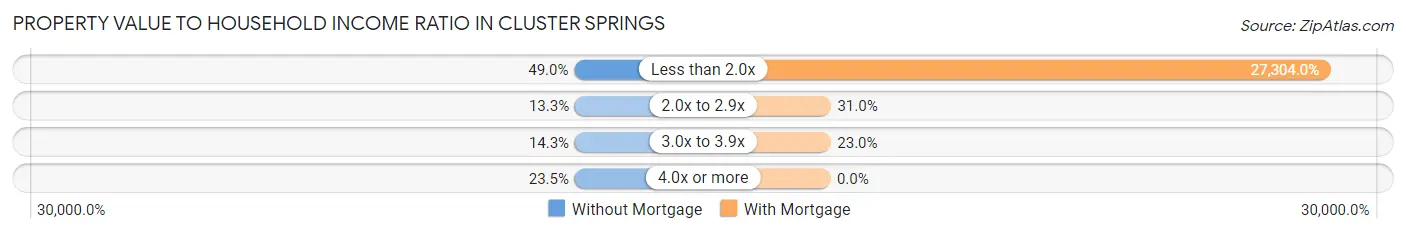
| Value-to-Income Ratio | Without Mortgage | With Mortgage |
| Less than 2.0x | 48 (49.0%) | 54,608 (27,304.0%) |
| 2.0x to 2.9x | 13 (13.3%) | 62 (31.0%) |
| 3.0x to 3.9x | 14 (14.3%) | 46 (23.0%) |
| 4.0x or more | 23 (23.5%) | 0 (0.0%) |
| Total | 98 (100.0%) | 200 (100.0%) |
Real Estate Taxes by Mortgage Status in Cluster Springs
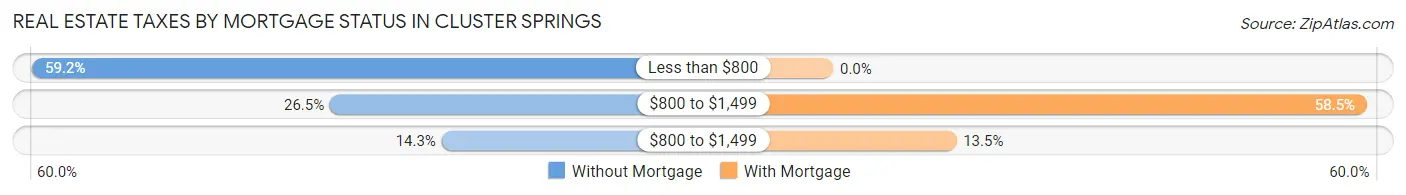
| Property Taxes | Without Mortgage | With Mortgage |
| Less than $800 | 58 (59.2%) | 0 (0.0%) |
| $800 to $1,499 | 26 (26.5%) | 117 (58.5%) |
| $800 to $1,499 | 14 (14.3%) | 27 (13.5%) |
| Total | 98 (100.0%) | 200 (100.0%) |
Health & Disability in Cluster Springs
Health Insurance Coverage by Age in Cluster Springs
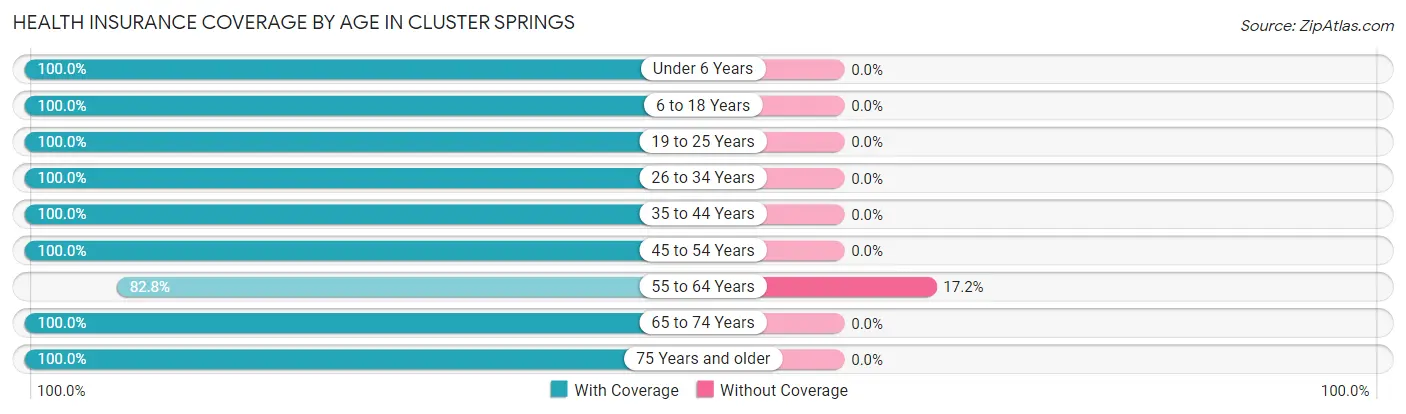
| Age Bracket | With Coverage | Without Coverage |
| Under 6 Years | 27 (100.0%) | 0 (0.0%) |
| 6 to 18 Years | 259 (100.0%) | 0 (0.0%) |
| 19 to 25 Years | 19 (100.0%) | 0 (0.0%) |
| 26 to 34 Years | 155 (100.0%) | 0 (0.0%) |
| 35 to 44 Years | 24 (100.0%) | 0 (0.0%) |
| 45 to 54 Years | 112 (100.0%) | 0 (0.0%) |
| 55 to 64 Years | 135 (82.8%) | 28 (17.2%) |
| 65 to 74 Years | 167 (100.0%) | 0 (0.0%) |
| 75 Years and older | 27 (100.0%) | 0 (0.0%) |
| Total | 925 (97.1%) | 28 (2.9%) |
Health Insurance Coverage by Citizenship Status in Cluster Springs
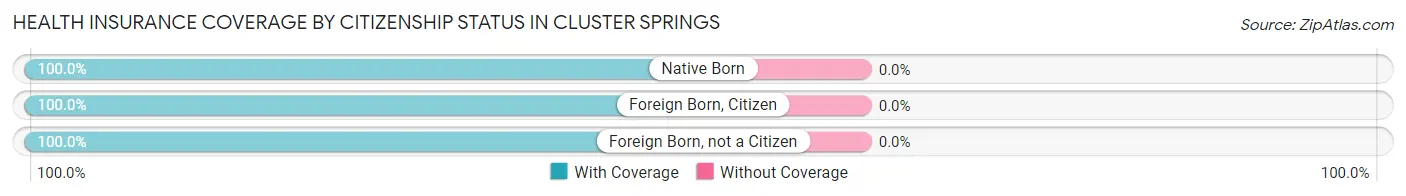
| Citizenship Status | With Coverage | Without Coverage |
| Native Born | 27 (100.0%) | 0 (0.0%) |
| Foreign Born, Citizen | 259 (100.0%) | 0 (0.0%) |
| Foreign Born, not a Citizen | 19 (100.0%) | 0 (0.0%) |
Health Insurance Coverage by Household Income in Cluster Springs
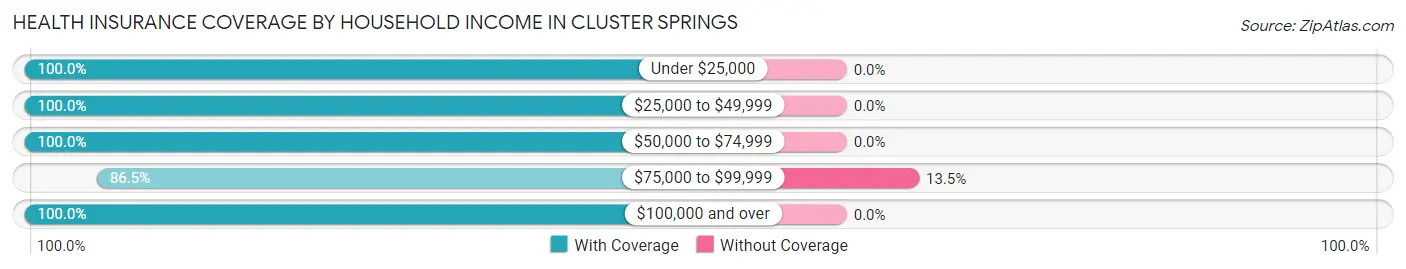
| Household Income | With Coverage | Without Coverage |
| Under $25,000 | 43 (100.0%) | 0 (0.0%) |
| $25,000 to $49,999 | 210 (100.0%) | 0 (0.0%) |
| $50,000 to $74,999 | 371 (100.0%) | 0 (0.0%) |
| $75,000 to $99,999 | 179 (86.5%) | 28 (13.5%) |
| $100,000 and over | 122 (100.0%) | 0 (0.0%) |
Public vs Private Health Insurance Coverage by Age in Cluster Springs
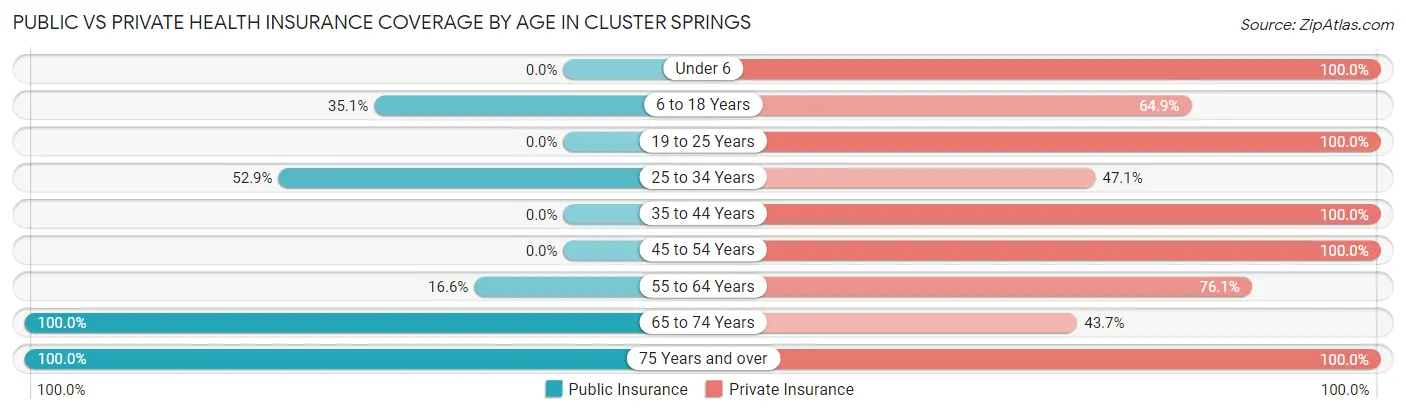
| Age Bracket | Public Insurance | Private Insurance |
| Under 6 | 0 (0.0%) | 27 (100.0%) |
| 6 to 18 Years | 91 (35.1%) | 168 (64.9%) |
| 19 to 25 Years | 0 (0.0%) | 19 (100.0%) |
| 25 to 34 Years | 82 (52.9%) | 73 (47.1%) |
| 35 to 44 Years | 0 (0.0%) | 24 (100.0%) |
| 45 to 54 Years | 0 (0.0%) | 112 (100.0%) |
| 55 to 64 Years | 27 (16.6%) | 124 (76.1%) |
| 65 to 74 Years | 167 (100.0%) | 73 (43.7%) |
| 75 Years and over | 27 (100.0%) | 27 (100.0%) |
| Total | 394 (41.3%) | 647 (67.9%) |
Disability Status by Sex by Age in Cluster Springs
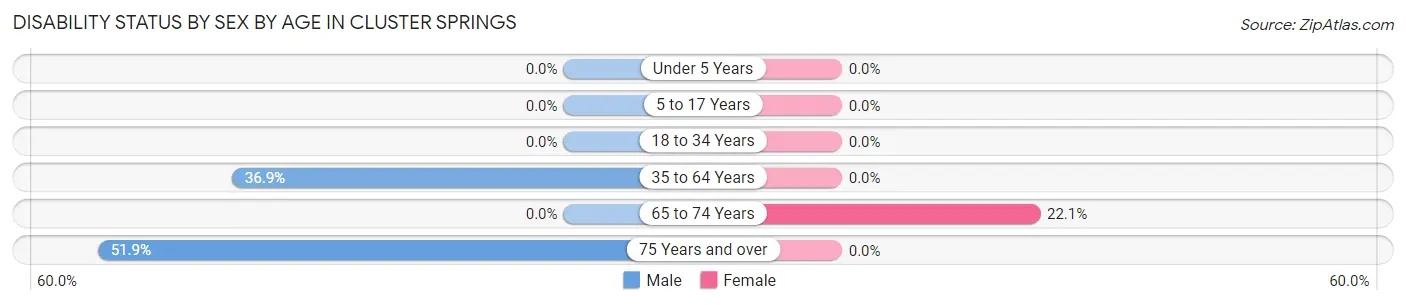
| Age Bracket | Male | Female |
| Under 5 Years | 0 (0.0%) | 0 (0.0%) |
| 5 to 17 Years | 0 (0.0%) | 0 (0.0%) |
| 18 to 34 Years | 0 (0.0%) | 0 (0.0%) |
| 35 to 64 Years | 55 (36.9%) | 0 (0.0%) |
| 65 to 74 Years | 0 (0.0%) | 17 (22.1%) |
| 75 Years and over | 14 (51.8%) | 0 (0.0%) |
Disability Class by Sex by Age in Cluster Springs
Disability Class: Hearing Difficulty
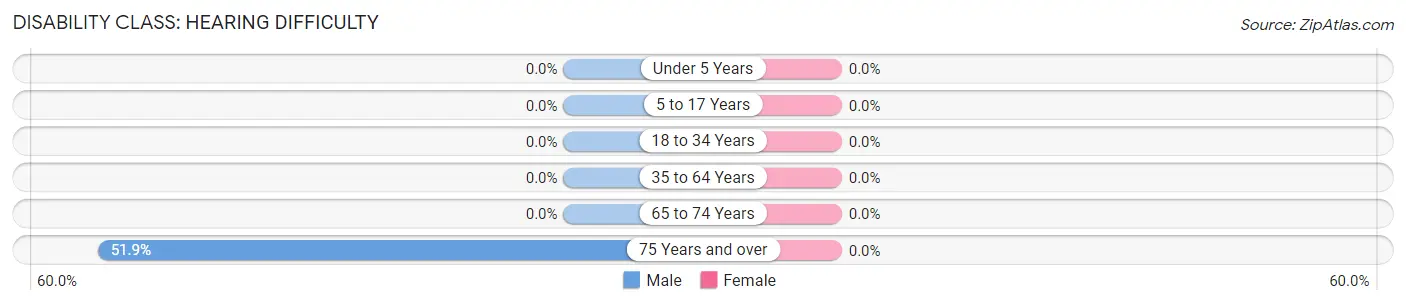
| Age Bracket | Male | Female |
| Under 5 Years | 0 (0.0%) | 0 (0.0%) |
| 5 to 17 Years | 0 (0.0%) | 0 (0.0%) |
| 18 to 34 Years | 0 (0.0%) | 0 (0.0%) |
| 35 to 64 Years | 0 (0.0%) | 0 (0.0%) |
| 65 to 74 Years | 0 (0.0%) | 0 (0.0%) |
| 75 Years and over | 14 (51.8%) | 0 (0.0%) |
Disability Class: Vision Difficulty
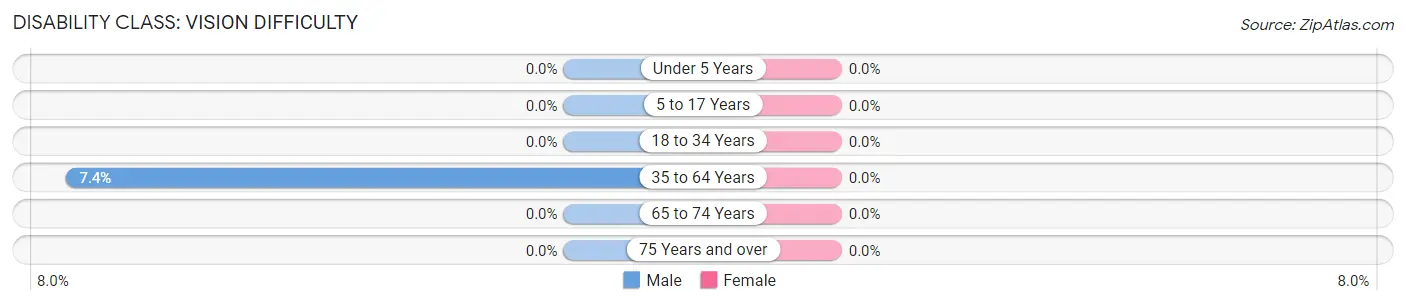
| Age Bracket | Male | Female |
| Under 5 Years | 0 (0.0%) | 0 (0.0%) |
| 5 to 17 Years | 0 (0.0%) | 0 (0.0%) |
| 18 to 34 Years | 0 (0.0%) | 0 (0.0%) |
| 35 to 64 Years | 11 (7.4%) | 0 (0.0%) |
| 65 to 74 Years | 0 (0.0%) | 0 (0.0%) |
| 75 Years and over | 0 (0.0%) | 0 (0.0%) |
Disability Class: Cognitive Difficulty
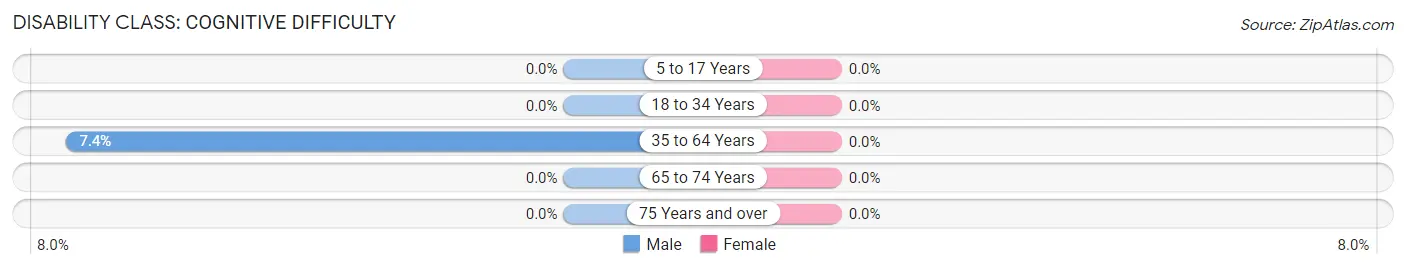
| Age Bracket | Male | Female |
| 5 to 17 Years | 0 (0.0%) | 0 (0.0%) |
| 18 to 34 Years | 0 (0.0%) | 0 (0.0%) |
| 35 to 64 Years | 11 (7.4%) | 0 (0.0%) |
| 65 to 74 Years | 0 (0.0%) | 0 (0.0%) |
| 75 Years and over | 0 (0.0%) | 0 (0.0%) |
Disability Class: Ambulatory Difficulty
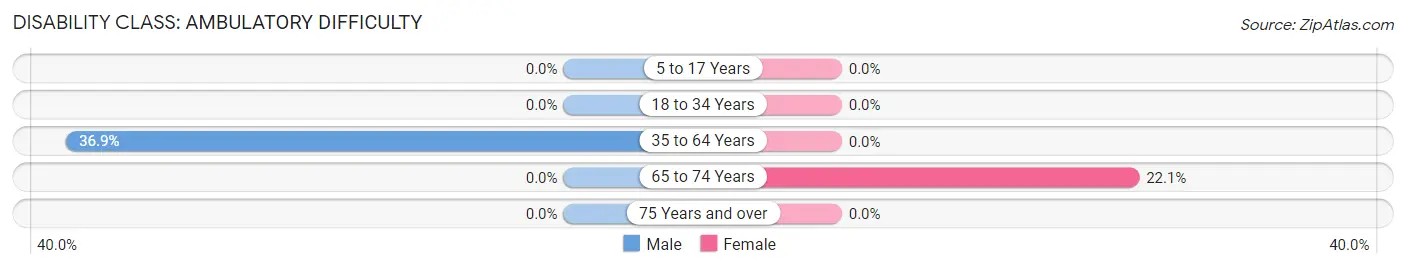
| Age Bracket | Male | Female |
| 5 to 17 Years | 0 (0.0%) | 0 (0.0%) |
| 18 to 34 Years | 0 (0.0%) | 0 (0.0%) |
| 35 to 64 Years | 55 (36.9%) | 0 (0.0%) |
| 65 to 74 Years | 0 (0.0%) | 17 (22.1%) |
| 75 Years and over | 0 (0.0%) | 0 (0.0%) |
Disability Class: Self-Care Difficulty
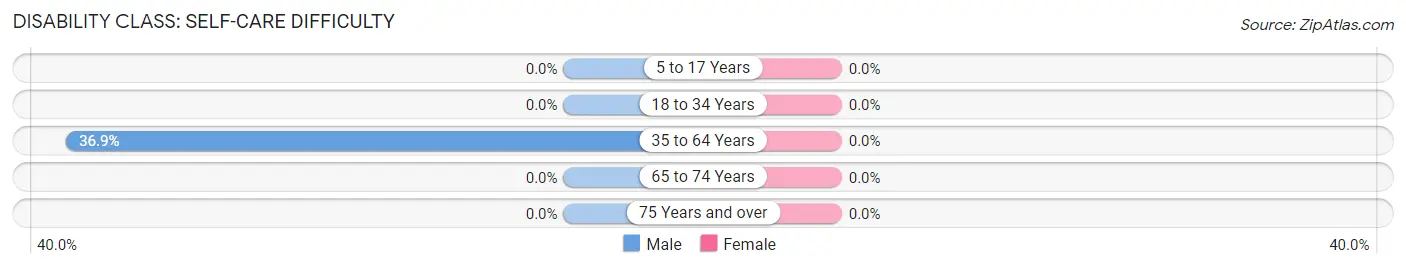
| Age Bracket | Male | Female |
| 5 to 17 Years | 0 (0.0%) | 0 (0.0%) |
| 18 to 34 Years | 0 (0.0%) | 0 (0.0%) |
| 35 to 64 Years | 55 (36.9%) | 0 (0.0%) |
| 65 to 74 Years | 0 (0.0%) | 0 (0.0%) |
| 75 Years and over | 0 (0.0%) | 0 (0.0%) |
Technology Access in Cluster Springs
Computing Device Access in Cluster Springs
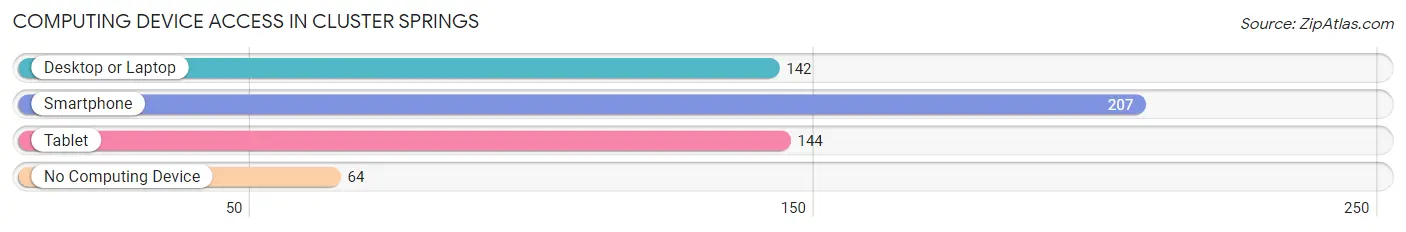
| Device Type | # Households | % Households |
| Desktop or Laptop | 142 | 47.6% |
| Smartphone | 207 | 69.5% |
| Tablet | 144 | 48.3% |
| No Computing Device | 64 | 21.5% |
| Total | 298 | 100.0% |
Internet Access in Cluster Springs
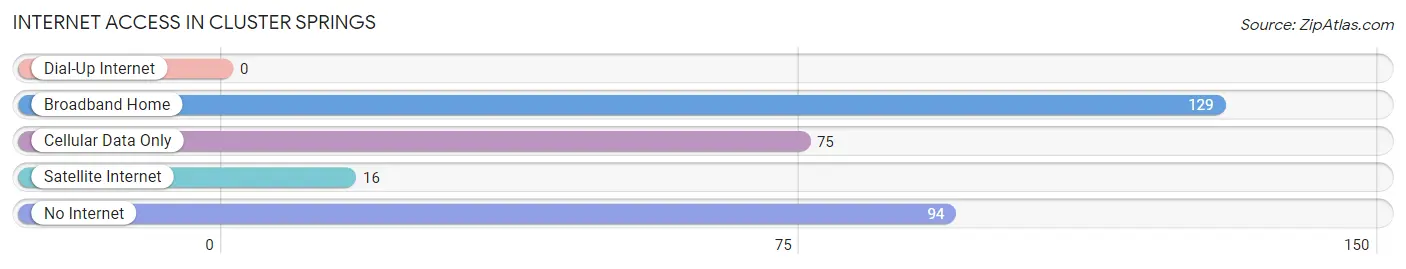
| Internet Type | # Households | % Households |
| Dial-Up Internet | 0 | 0.0% |
| Broadband Home | 129 | 43.3% |
| Cellular Data Only | 75 | 25.2% |
| Satellite Internet | 16 | 5.4% |
| No Internet | 94 | 31.5% |
| Total | 298 | 100.0% |
Cluster Springs Summary
Cluster Springs is an unincorporated community located in Halifax County, Virginia. It is situated in the southern part of the county, about 10 miles south of the county seat of Halifax. The community is located along the banks of the Roanoke River, and is surrounded by rolling hills and farmland.
History
Cluster Springs was first settled in the late 1700s by a group of settlers from the nearby town of Clover. The settlers were attracted to the area by the abundance of natural resources, including timber, water, and fertile soil. The community was named for the cluster of springs that were located in the area.
In the early 1800s, the community began to grow and prosper. A post office was established in 1820, and a school was built in 1825. The town also had a general store, a blacksmith shop, and a grist mill.
In the late 1800s, the town began to decline. The post office was closed in 1891, and the school was closed in 1895. The population of the town dwindled, and by the early 1900s, the town was nearly abandoned.
Geography
Cluster Springs is located in the southern part of Halifax County, Virginia. It is situated along the banks of the Roanoke River, and is surrounded by rolling hills and farmland. The town is located about 10 miles south of the county seat of Halifax.
The climate in Cluster Springs is humid subtropical, with hot, humid summers and mild winters. The average annual temperature is around 60 degrees Fahrenheit, and the average annual precipitation is around 45 inches.
Economy
The economy of Cluster Springs is largely based on agriculture. The town is home to several farms, which produce a variety of crops, including corn, soybeans, wheat, and hay. The town also has a few small businesses, including a general store, a gas station, and a restaurant.
Demographics
As of the 2010 census, the population of Cluster Springs was 545. The racial makeup of the town was 95.3% White, 2.7% African American, 0.2% Native American, 0.2% Asian, and 1.6% from other races. The median household income was $35,000, and the median home value was $90,000.
Conclusion
Cluster Springs is a small, rural community located in Halifax County, Virginia. The town has a long history, and was once a thriving community. Today, the town is largely agricultural, and is home to several farms. The population of the town is around 545, and the median household income is around $35,000.
Common Questions
What is the Total Population of Cluster Springs?
Total Population of Cluster Springs is 953.
What is the Total Male Population of Cluster Springs?
Total Male Population of Cluster Springs is 559.
What is the Total Female Population of Cluster Springs?
Total Female Population of Cluster Springs is 394.
What is the Ratio of Males per 100 Females in Cluster Springs?
There are 141.88 Males per 100 Females in Cluster Springs.
What is the Ratio of Females per 100 Males in Cluster Springs?
There are 70.48 Females per 100 Males in Cluster Springs.
What is the Median Population Age in Cluster Springs?
Median Population Age in Cluster Springs is 42.3 Years.
What is the Average Family Size in Cluster Springs
Average Family Size in Cluster Springs is 3.9 People.
What is the Average Household Size in Cluster Springs
Average Household Size in Cluster Springs is 3.2 People.
What is Per Capita Income in Cluster Springs?
Per Capita income in Cluster Springs is $27,777.
What is the Median Family Income in Cluster Springs?
Median Family Income in Cluster Springs is $54,510.
What is the Median Household income in Cluster Springs?
Median Household Income in Cluster Springs is $60,875.
What is Income or Wage Gap in Cluster Springs?
Income or Wage Gap in Cluster Springs is 49.1%.
Women in Cluster Springs earn 50.9 cents for every dollar earned by a man.
What is Inequality or Gini Index in Cluster Springs?
Inequality or Gini Index in Cluster Springs is 0.36.
How Large is the Labor Force in Cluster Springs?
There are 413 People in the Labor Forcein in Cluster Springs.
What is the Percentage of People in the Labor Force in Cluster Springs?
61.9% of People are in the Labor Force in Cluster Springs.