Chase Crossing, VA
Chase Crossing Map
Chase Crossing Overview
502
TOTAL POPULATION
39
MALE POPULATION
463
FEMALE POPULATION
8.42
MALES / 100 FEMALES
1,187.18
FEMALES / 100 MALES
18.3
MEDIAN AGE
4.9
AVG FAMILY SIZE
4.9
AVG HOUSEHOLD SIZE
$10,853
PER CAPITA INCOME
0.38
INEQUALITY / GINI INDEX
229
LABOR FORCE [ PEOPLE ]
79.8%
PERCENT IN LABOR FORCE
25.8%
UNEMPLOYMENT RATE
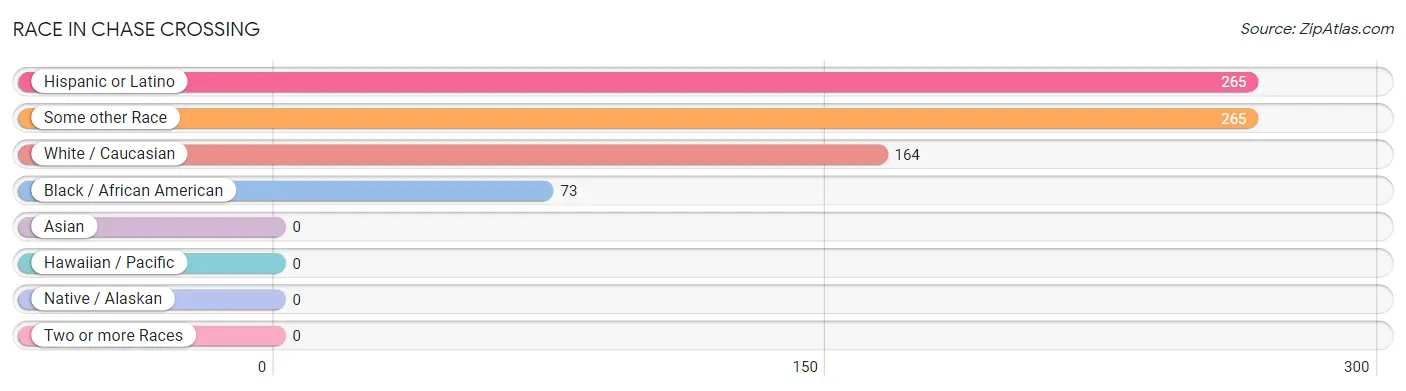
Race in Chase Crossing
The most populous races in Chase Crossing are Hispanic or Latino (265 | 52.8%), Some other Race (265 | 52.8%), and White / Caucasian (164 | 32.7%).
| Race | # Population | % Population |
| Asian | 0 | 0.0% |
| Black / African American | 73 | 14.5% |
| Hawaiian / Pacific | 0 | 0.0% |
| Hispanic or Latino | 265 | 52.8% |
| Native / Alaskan | 0 | 0.0% |
| White / Caucasian | 164 | 32.7% |
| Two or more Races | 0 | 0.0% |
| Some other Race | 265 | 52.8% |
| Total | 502 | 100.0% |
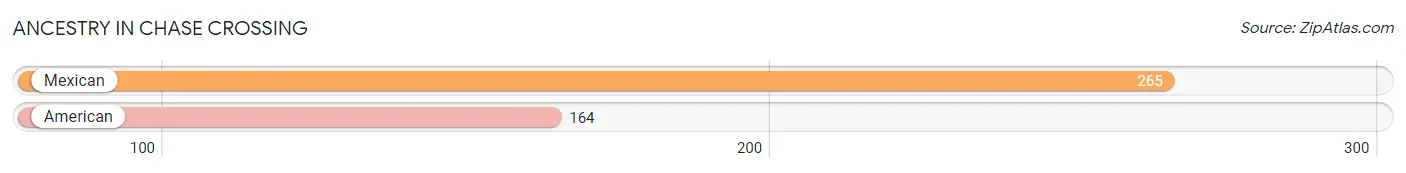
Ancestry in Chase Crossing
The most populous ancestries reported in Chase Crossing are Mexican (265 | 52.8%), and American (164 | 32.7%), together accounting for 85.5% of all Chase Crossing residents.
| Ancestry | # Population | % Population |
| American | 164 | 32.7% |
| Mexican | 265 | 52.8% | View All 2 Rows |
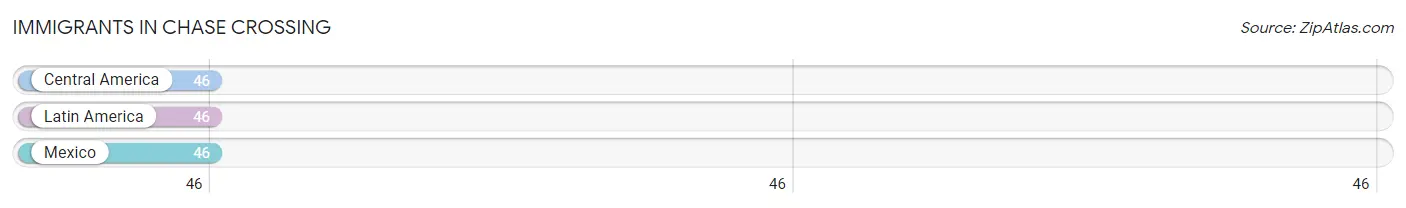
Immigrants in Chase Crossing
The most numerous immigrant groups reported in Chase Crossing came from Central America (46 | 9.2%), Latin America (46 | 9.2%), and Mexico (46 | 9.2%), together accounting for 27.5% of all Chase Crossing residents.
| Immigration Origin | # Population | % Population |
| Central America | 46 | 9.2% |
| Latin America | 46 | 9.2% |
| Mexico | 46 | 9.2% | View All 3 Rows |
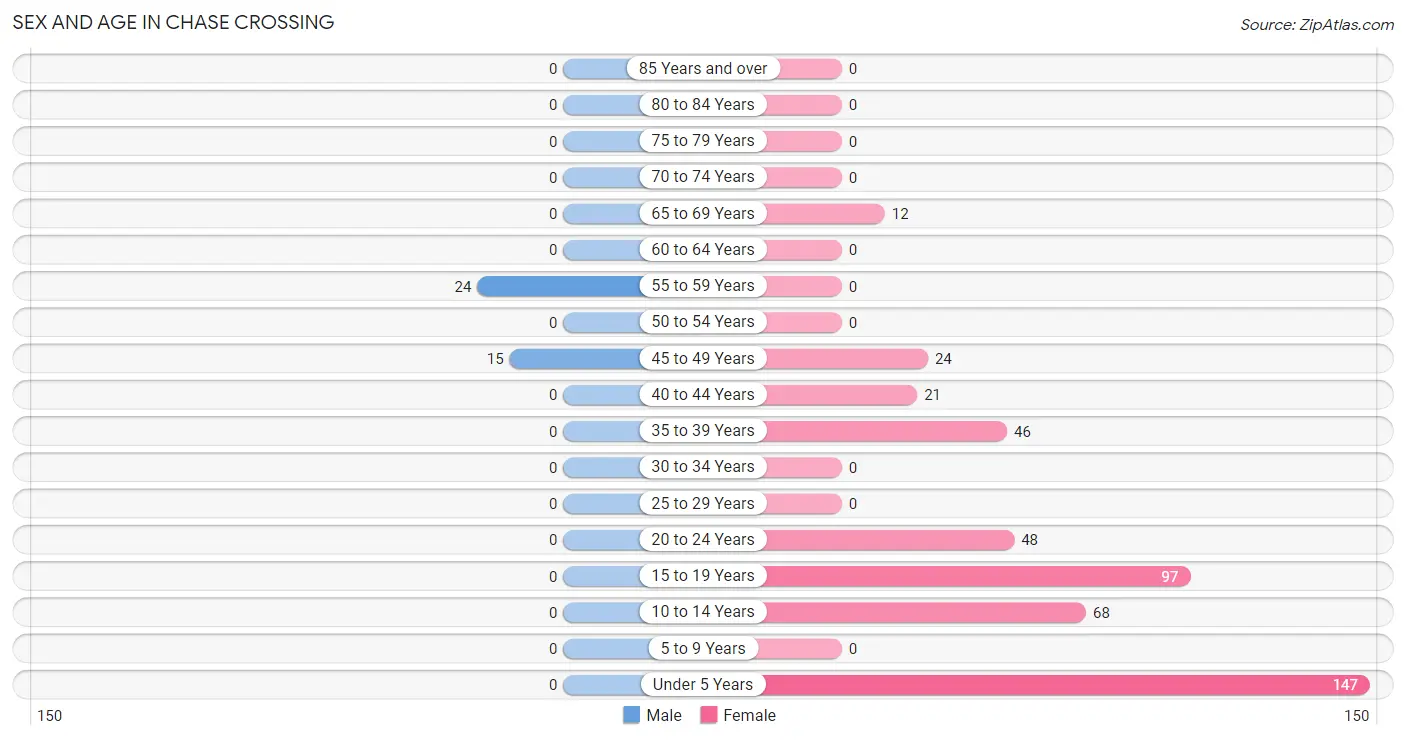
Sex and Age in Chase Crossing
Sex and Age in Chase Crossing
The most populous age groups in Chase Crossing are 55 to 59 Years (24 | 61.5%) for men and Under 5 Years (147 | 31.8%) for women.
| Age Bracket | Male | Female |
| Under 5 Years | 0 (0.0%) | 147 (31.8%) |
| 5 to 9 Years | 0 (0.0%) | 0 (0.0%) |
| 10 to 14 Years | 0 (0.0%) | 68 (14.7%) |
| 15 to 19 Years | 0 (0.0%) | 97 (20.9%) |
| 20 to 24 Years | 0 (0.0%) | 48 (10.4%) |
| 25 to 29 Years | 0 (0.0%) | 0 (0.0%) |
| 30 to 34 Years | 0 (0.0%) | 0 (0.0%) |
| 35 to 39 Years | 0 (0.0%) | 46 (9.9%) |
| 40 to 44 Years | 0 (0.0%) | 21 (4.5%) |
| 45 to 49 Years | 15 (38.5%) | 24 (5.2%) |
| 50 to 54 Years | 0 (0.0%) | 0 (0.0%) |
| 55 to 59 Years | 24 (61.5%) | 0 (0.0%) |
| 60 to 64 Years | 0 (0.0%) | 0 (0.0%) |
| 65 to 69 Years | 0 (0.0%) | 12 (2.6%) |
| 70 to 74 Years | 0 (0.0%) | 0 (0.0%) |
| 75 to 79 Years | 0 (0.0%) | 0 (0.0%) |
| 80 to 84 Years | 0 (0.0%) | 0 (0.0%) |
| 85 Years and over | 0 (0.0%) | 0 (0.0%) |
| Total | 39 (100.0%) | 463 (100.0%) |
Families and Households in Chase Crossing
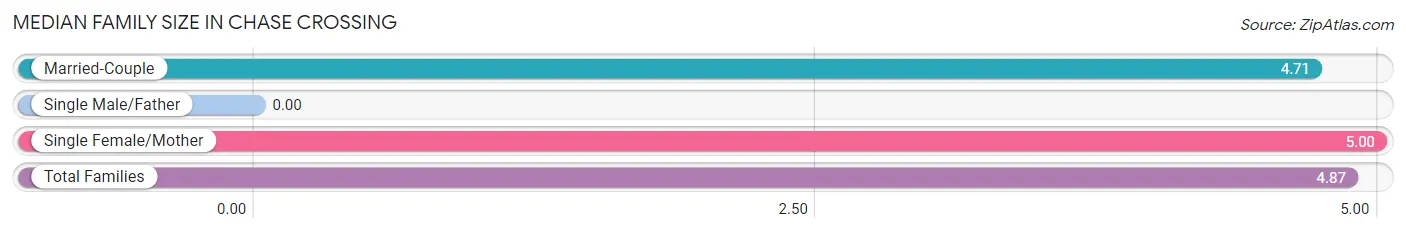
Median Family Size in Chase Crossing
| Family Type | # Families | Family Size |
| Married-Couple | 45 (43.7%) | 4.71 |
| Single Male/Father | 0 (0.0%) | - |
| Single Female/Mother | 58 (56.3%) | 5.00 |
| Total Families | 103 (100.0%) | 4.87 |
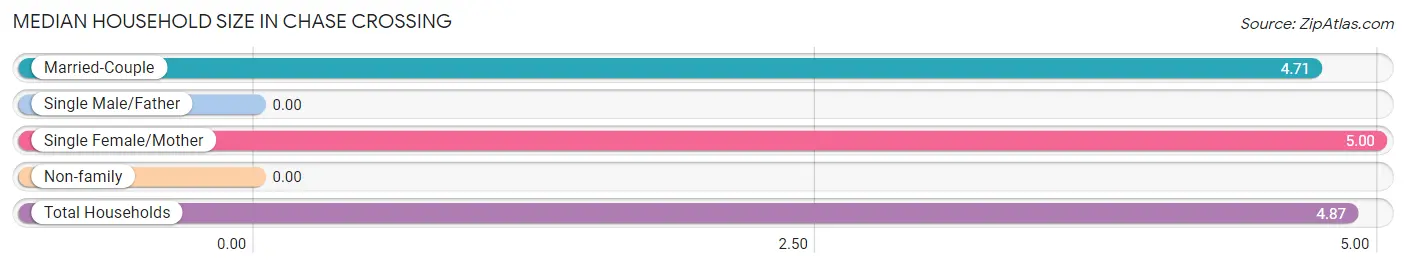
Median Household Size in Chase Crossing
| Household Type | # Households | Household Size |
| Married-Couple | 45 (43.7%) | 4.71 |
| Single Male/Father | 0 (0.0%) | - |
| Single Female/Mother | 58 (56.3%) | 5.00 |
| Non-family | 0 (0.0%) | - |
| Total Households | 103 (100.0%) | 4.87 |
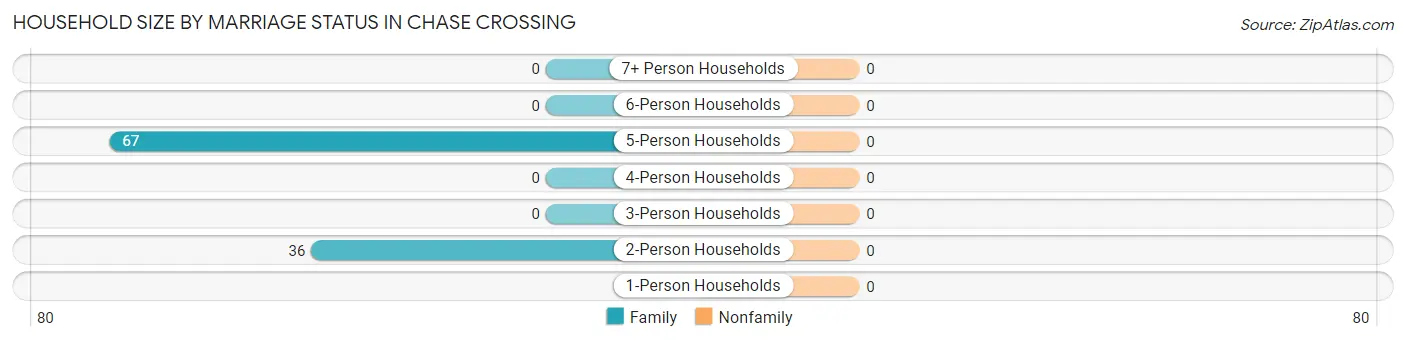
Household Size by Marriage Status in Chase Crossing
| Household Size | Family Households | Nonfamily Households |
| 1-Person Households | - | 0 (0.0%) |
| 2-Person Households | 36 (34.9%) | 0 (0.0%) |
| 3-Person Households | 0 (0.0%) | 0 (0.0%) |
| 4-Person Households | 0 (0.0%) | 0 (0.0%) |
| 5-Person Households | 67 (65.0%) | 0 (0.0%) |
| 6-Person Households | 0 (0.0%) | 0 (0.0%) |
| 7+ Person Households | 0 (0.0%) | 0 (0.0%) |
| Total | 103 (100.0%) | 0 (0.0%) |
Female Fertility in Chase Crossing
Fertility by Age in Chase Crossing
| Age Bracket | Women with Births | Births / 1,000 Women |
| 15 to 19 years | 0 (0.0%) | 0.0 |
| 20 to 34 years | 0 (0.0%) | 0.0 |
| 35 to 50 years | 0 (0.0%) | 0.0 |
| Total | 0 (0.0%) | 0.0 |
Fertility by Age by Marriage Status in Chase Crossing
| Age Bracket | Married | Unmarried |
| 15 to 19 years | 0 (0.0%) | 0 (0.0%) |
| 20 to 34 years | 0 (0.0%) | 0 (0.0%) |
| 35 to 50 years | 0 (0.0%) | 0 (0.0%) |
| Total | 0 (0.0%) | 0 (0.0%) |
Fertility by Education in Chase Crossing
| Educational Attainment | Women with Births | Births / 1,000 Women |
| Less than High School | 0 (0.0%) | 0.0 |
| High School Diploma | 0 (0.0%) | 0.0 |
| College or Associate's Degree | 0 (0.0%) | 0.0 |
| Bachelor's Degree | 0 (0.0%) | 0.0 |
| Graduate Degree | 0 (0.0%) | 0.0 |
| Total | 0 (0.0%) | 0.0 |
Fertility by Education by Marriage Status in Chase Crossing
| Educational Attainment | Married | Unmarried |
| Less than High School | 0 (0.0%) | 0 (0.0%) |
| High School Diploma | 0 (0.0%) | 0 (0.0%) |
| College or Associate's Degree | 0 (0.0%) | 0 (0.0%) |
| Bachelor's Degree | 0 (0.0%) | 0 (0.0%) |
| Graduate Degree | 0 (0.0%) | 0 (0.0%) |
| Total | 0 (0.0%) | 0 (0.0%) |
Income in Chase Crossing
Income Overview in Chase Crossing
| Characteristic | Number | Measure |
| Per Capita Income | 502 | $10,853 |
| Median Family Income | 103 | $0 |
| Mean Family Income | 103 | $51,412 |
| Median Household Income | 103 | $0 |
| Mean Household Income | 103 | $51,412 |
| Income Deficit | 103 | $0 |
| Wage / Income Gap (%) | 502 | 0.00% |
| Wage / Income Gap ($) | 502 | 100.00¢ per $1 |
| Gini / Inequality Index | 502 | 0.38 |
Earnings by Sex in Chase Crossing
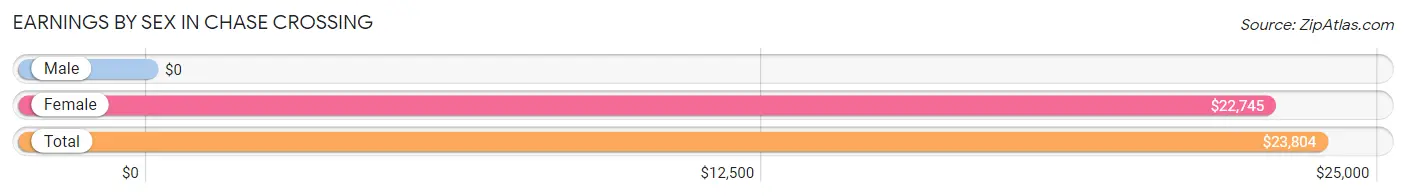
| Sex | Number | Average Earnings |
| Male | 39 (22.9%) | $0 |
| Female | 131 (77.1%) | $22,745 |
| Total | 170 (100.0%) | $23,804 |
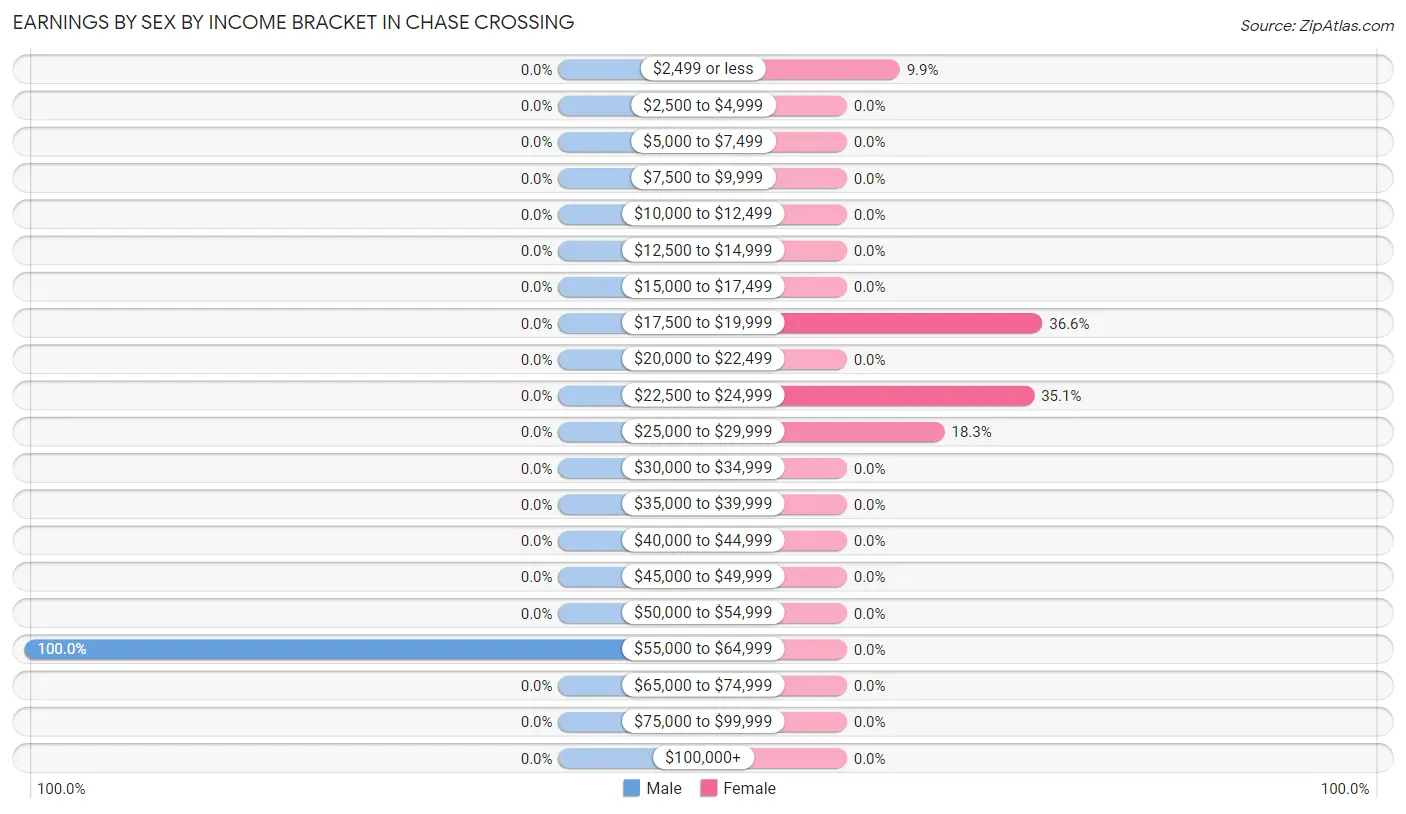
Earnings by Sex by Income Bracket in Chase Crossing
The most common earnings brackets in Chase Crossing are $55,000 to $64,999 for men (39 | 100.0%) and $17,500 to $19,999 for women (48 | 36.6%).
| Income | Male | Female |
| $2,499 or less | 0 (0.0%) | 13 (9.9%) |
| $2,500 to $4,999 | 0 (0.0%) | 0 (0.0%) |
| $5,000 to $7,499 | 0 (0.0%) | 0 (0.0%) |
| $7,500 to $9,999 | 0 (0.0%) | 0 (0.0%) |
| $10,000 to $12,499 | 0 (0.0%) | 0 (0.0%) |
| $12,500 to $14,999 | 0 (0.0%) | 0 (0.0%) |
| $15,000 to $17,499 | 0 (0.0%) | 0 (0.0%) |
| $17,500 to $19,999 | 0 (0.0%) | 48 (36.6%) |
| $20,000 to $22,499 | 0 (0.0%) | 0 (0.0%) |
| $22,500 to $24,999 | 0 (0.0%) | 46 (35.1%) |
| $25,000 to $29,999 | 0 (0.0%) | 24 (18.3%) |
| $30,000 to $34,999 | 0 (0.0%) | 0 (0.0%) |
| $35,000 to $39,999 | 0 (0.0%) | 0 (0.0%) |
| $40,000 to $44,999 | 0 (0.0%) | 0 (0.0%) |
| $45,000 to $49,999 | 0 (0.0%) | 0 (0.0%) |
| $50,000 to $54,999 | 0 (0.0%) | 0 (0.0%) |
| $55,000 to $64,999 | 39 (100.0%) | 0 (0.0%) |
| $65,000 to $74,999 | 0 (0.0%) | 0 (0.0%) |
| $75,000 to $99,999 | 0 (0.0%) | 0 (0.0%) |
| $100,000+ | 0 (0.0%) | 0 (0.0%) |
| Total | 39 (100.0%) | 131 (100.0%) |
Earnings by Sex by Educational Attainment in Chase Crossing
| Educational Attainment | Male Income | Female Income |
| Less than High School | - | - |
| High School Diploma | - | - |
| College or Associate's Degree | - | - |
| Bachelor's Degree | - | - |
| Graduate Degree | - | - |
| Total | - | - |
Family Income in Chase Crossing
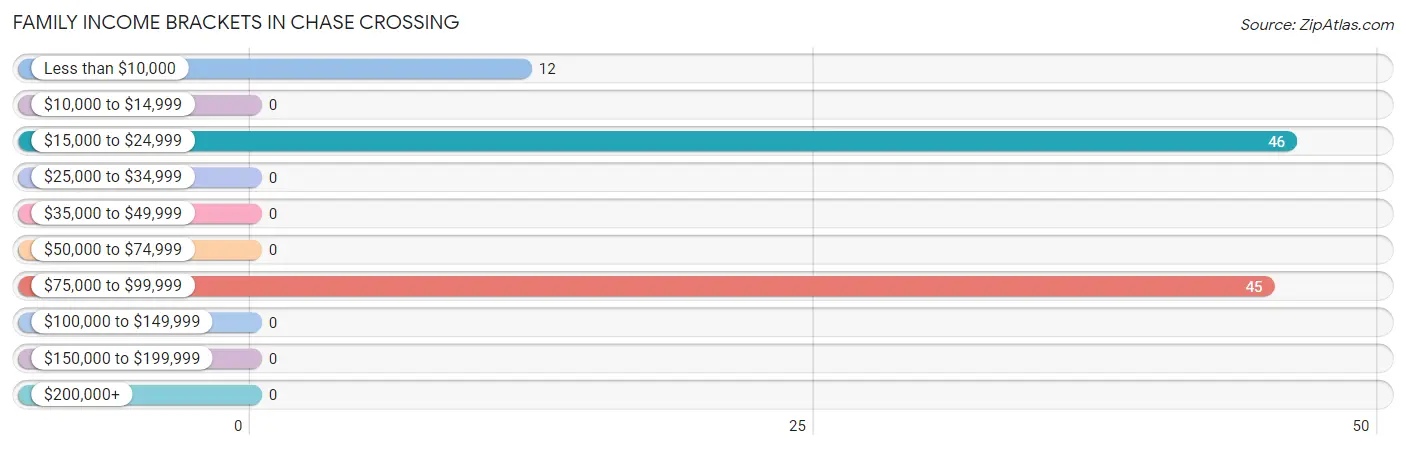
Family Income Brackets in Chase Crossing
According to the Chase Crossing family income data, there are 46 families falling into the $15,000 to $24,999 income range, which is the most common income bracket and makes up 44.7% of all families.
| Income Bracket | # Families | % Families |
| Less than $10,000 | 12 | 11.7% |
| $10,000 to $14,999 | 0 | 0.0% |
| $15,000 to $24,999 | 46 | 44.7% |
| $25,000 to $34,999 | 0 | 0.0% |
| $35,000 to $49,999 | 0 | 0.0% |
| $50,000 to $74,999 | 0 | 0.0% |
| $75,000 to $99,999 | 45 | 43.7% |
| $100,000 to $149,999 | 0 | 0.0% |
| $150,000 to $199,999 | 0 | 0.0% |
| $200,000+ | 0 | 0.0% |
Family Income by Famaliy Size in Chase Crossing
| Income Bracket | # Families | Median Income |
| 2-Person Families | 36 (34.9%) | $0 |
| 3-Person Families | 0 (0.0%) | $0 |
| 4-Person Families | 0 (0.0%) | $0 |
| 5-Person Families | 67 (65.0%) | $0 |
| 6-Person Families | 0 (0.0%) | $0 |
| 7+ Person Families | 0 (0.0%) | $0 |
| Total | 103 (100.0%) | $0 |
Family Income by Number of Earners in Chase Crossing
| Number of Earners | # Families | Median Income |
| No Earners | 0 (0.0%) | $0 |
| 1 Earner | 58 (56.3%) | $0 |
| 2 Earners | 45 (43.7%) | $0 |
| 3+ Earners | 0 (0.0%) | $0 |
| Total | 103 (100.0%) | $0 |
Household Income in Chase Crossing
Household Income Brackets in Chase Crossing
With 46 households falling in the category, the $15,000 to $24,999 income range is the most frequent in Chase Crossing, accounting for 44.7% of all households.
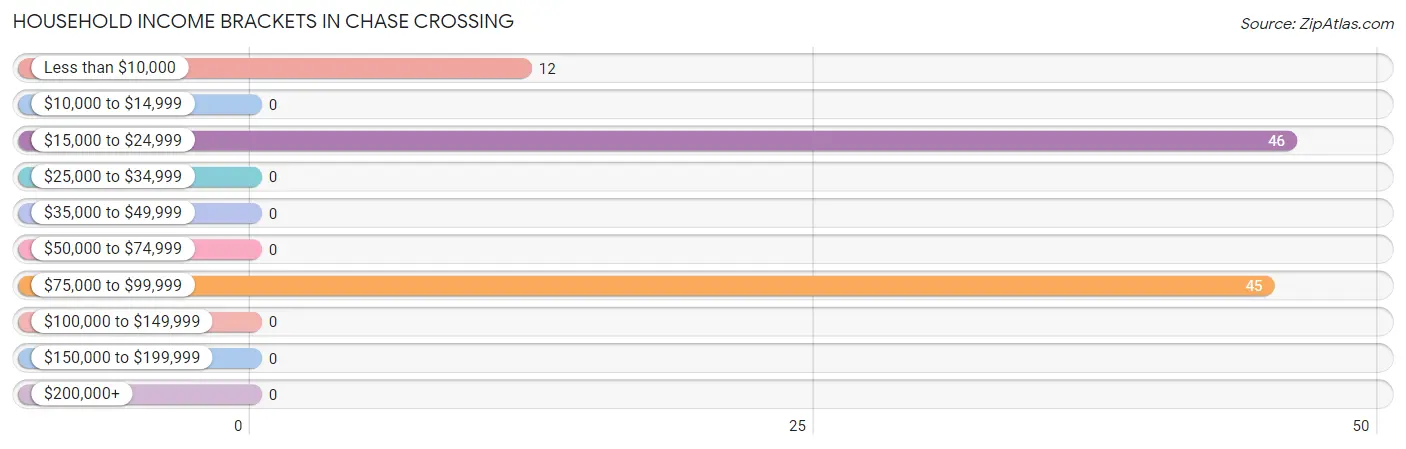
| Income Bracket | # Households | % Households |
| Less than $10,000 | 12 | 11.7% |
| $10,000 to $14,999 | 0 | 0.0% |
| $15,000 to $24,999 | 46 | 44.7% |
| $25,000 to $34,999 | 0 | 0.0% |
| $35,000 to $49,999 | 0 | 0.0% |
| $50,000 to $74,999 | 0 | 0.0% |
| $75,000 to $99,999 | 45 | 43.7% |
| $100,000 to $149,999 | 0 | 0.0% |
| $150,000 to $199,999 | 0 | 0.0% |
| $200,000+ | 0 | 0.0% |
Household Income by Householder Age in Chase Crossing
| Income Bracket | # Households | Median Income |
| 15 to 24 Years | 0 (0.0%) | $0 |
| 25 to 44 Years | 67 (65.0%) | $0 |
| 45 to 64 Years | 24 (23.3%) | $0 |
| 65+ Years | 12 (11.7%) | $0 |
| Total | 103 (100.0%) | $0 |
Poverty in Chase Crossing
Income Below Poverty by Sex and Age in Chase Crossing
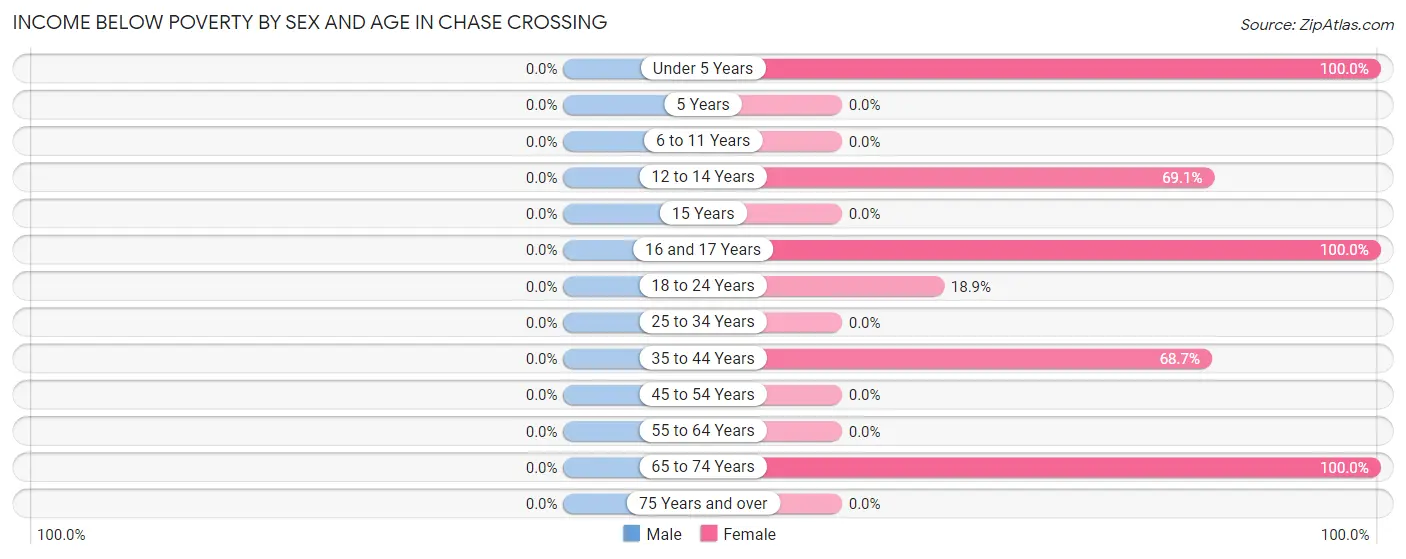
| Age Bracket | Male | Female |
| Under 5 Years | 0 (0.0%) | 147 (100.0%) |
| 5 Years | 0 (0.0%) | 0 (0.0%) |
| 6 to 11 Years | 0 (0.0%) | 0 (0.0%) |
| 12 to 14 Years | 0 (0.0%) | 47 (69.1%) |
| 15 Years | 0 (0.0%) | 0 (0.0%) |
| 16 and 17 Years | 0 (0.0%) | 13 (100.0%) |
| 18 to 24 Years | 0 (0.0%) | 25 (18.9%) |
| 25 to 34 Years | 0 (0.0%) | 0 (0.0%) |
| 35 to 44 Years | 0 (0.0%) | 46 (68.7%) |
| 45 to 54 Years | 0 (0.0%) | 0 (0.0%) |
| 55 to 64 Years | 0 (0.0%) | 0 (0.0%) |
| 65 to 74 Years | 0 (0.0%) | 12 (100.0%) |
| 75 Years and over | 0 (0.0%) | 0 (0.0%) |
| Total | 0 (0.0%) | 290 (62.6%) |
Income Above Poverty by Sex and Age in Chase Crossing
According to the poverty statistics in Chase Crossing, males aged 45 to 54 years and females aged 45 to 54 years are the age groups that are most secure financially, with 100.0% of males and 100.0% of females in these age groups living above the poverty line.
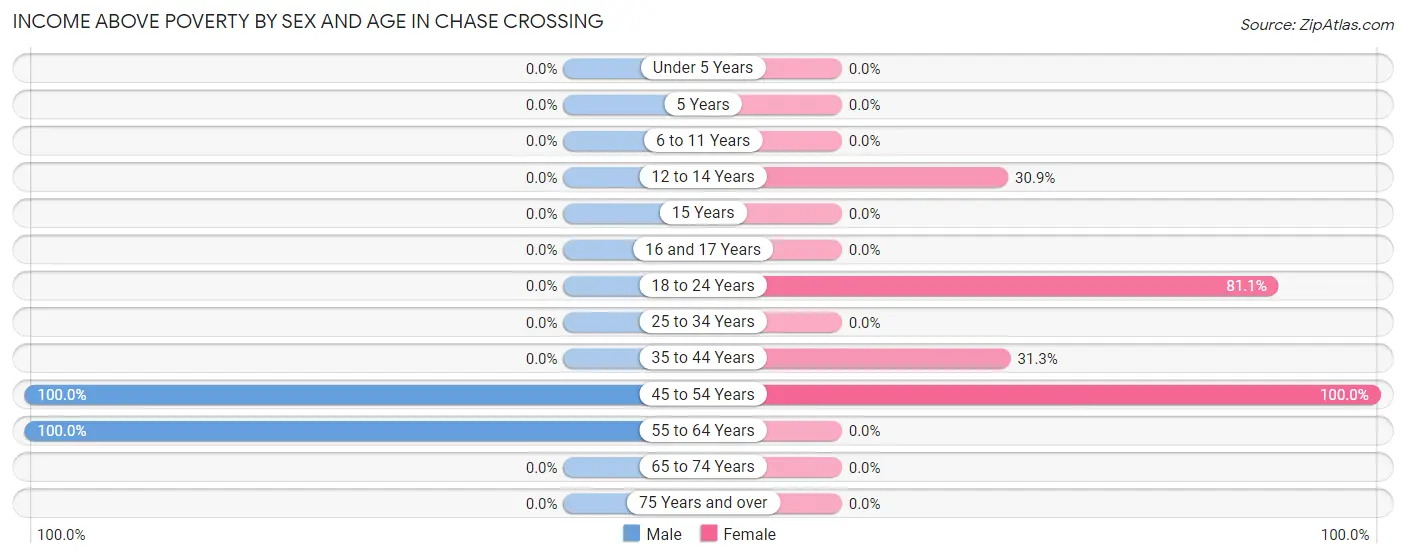
| Age Bracket | Male | Female |
| Under 5 Years | 0 (0.0%) | 0 (0.0%) |
| 5 Years | 0 (0.0%) | 0 (0.0%) |
| 6 to 11 Years | 0 (0.0%) | 0 (0.0%) |
| 12 to 14 Years | 0 (0.0%) | 21 (30.9%) |
| 15 Years | 0 (0.0%) | 0 (0.0%) |
| 16 and 17 Years | 0 (0.0%) | 0 (0.0%) |
| 18 to 24 Years | 0 (0.0%) | 107 (81.1%) |
| 25 to 34 Years | 0 (0.0%) | 0 (0.0%) |
| 35 to 44 Years | 0 (0.0%) | 21 (31.3%) |
| 45 to 54 Years | 15 (100.0%) | 24 (100.0%) |
| 55 to 64 Years | 24 (100.0%) | 0 (0.0%) |
| 65 to 74 Years | 0 (0.0%) | 0 (0.0%) |
| 75 Years and over | 0 (0.0%) | 0 (0.0%) |
| Total | 39 (100.0%) | 173 (37.4%) |
Income Below Poverty Among Married-Couple Families in Chase Crossing
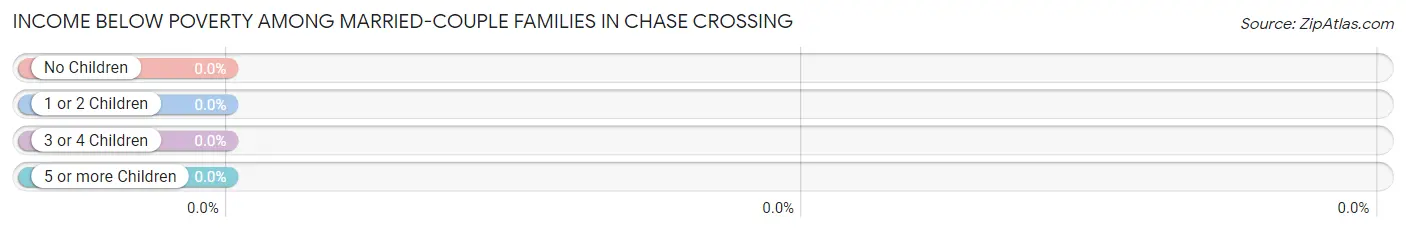
| Children | Above Poverty | Below Poverty |
| No Children | 24 (100.0%) | 0 (0.0%) |
| 1 or 2 Children | 21 (100.0%) | 0 (0.0%) |
| 3 or 4 Children | 0 (0.0%) | 0 (0.0%) |
| 5 or more Children | 0 (0.0%) | 0 (0.0%) |
| Total | 45 (100.0%) | 0 (0.0%) |
Income Below Poverty Among Single-Parent Households in Chase Crossing
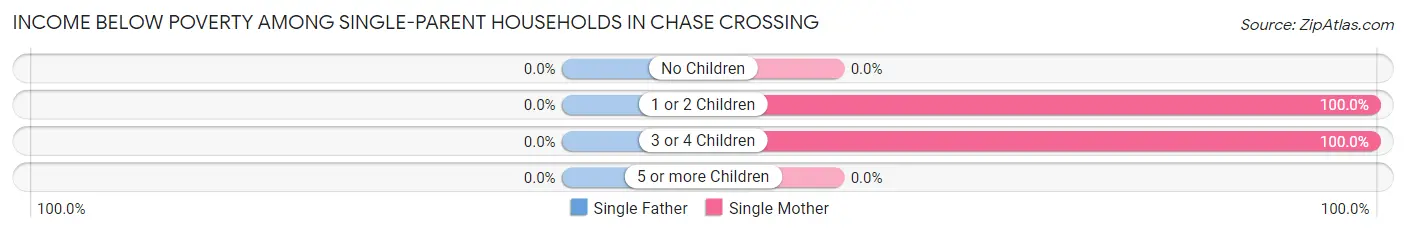
| Children | Single Father | Single Mother |
| No Children | 0 (0.0%) | 0 (0.0%) |
| 1 or 2 Children | 0 (0.0%) | 12 (100.0%) |
| 3 or 4 Children | 0 (0.0%) | 46 (100.0%) |
| 5 or more Children | 0 (0.0%) | 0 (0.0%) |
| Total | 0 (0.0%) | 58 (100.0%) |
Income Below Poverty Among Married-Couple vs Single-Parent Households in Chase Crossing
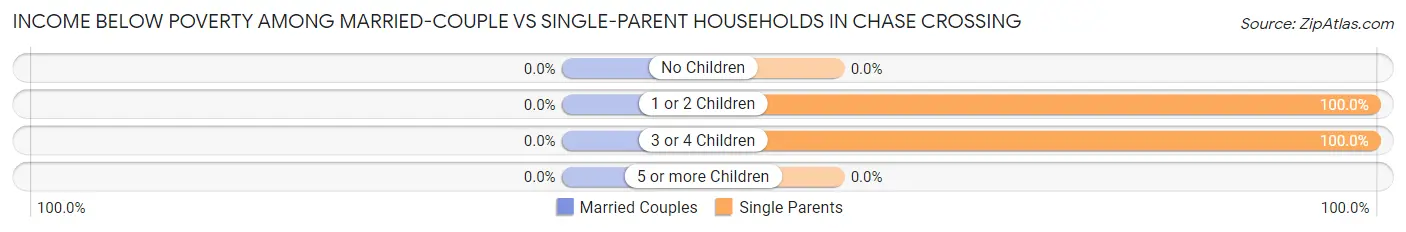
| Children | Married-Couple Families | Single-Parent Households |
| No Children | 0 (0.0%) | 0 (0.0%) |
| 1 or 2 Children | 0 (0.0%) | 12 (100.0%) |
| 3 or 4 Children | 0 (0.0%) | 46 (100.0%) |
| 5 or more Children | 0 (0.0%) | 0 (0.0%) |
| Total | 0 (0.0%) | 58 (100.0%) |
Employment Characteristics in Chase Crossing
Employment by Class of Employer in Chase Crossing
Among the 170 employed individuals in Chase Crossing, private company employees (146 | 85.9%), and local government employees (24 | 14.1%) make up the most common classes of employment.
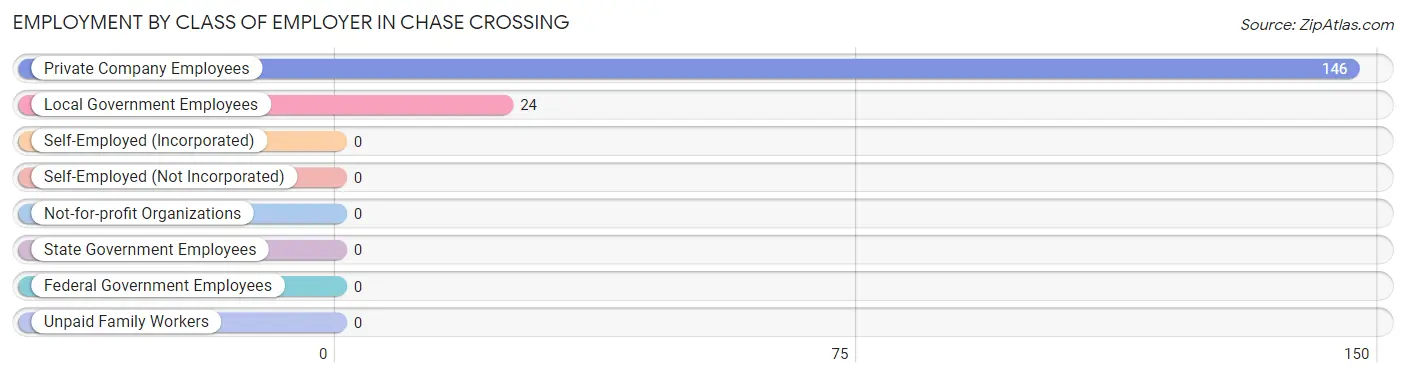
| Employer Class | # Employees | % Employees |
| Private Company Employees | 146 | 85.9% |
| Self-Employed (Incorporated) | 0 | 0.0% |
| Self-Employed (Not Incorporated) | 0 | 0.0% |
| Not-for-profit Organizations | 0 | 0.0% |
| Local Government Employees | 24 | 14.1% |
| State Government Employees | 0 | 0.0% |
| Federal Government Employees | 0 | 0.0% |
| Unpaid Family Workers | 0 | 0.0% |
| Total | 170 | 100.0% |
Employment Status by Age in Chase Crossing
According to the labor force statistics for Chase Crossing, out of the total population over 16 years of age (287), 79.8% or 229 individuals are in the labor force, with 25.8% or 59 of them unemployed. The age group with the highest labor force participation rate is 20 to 24 years, with 100.0% or 48 individuals in the labor force. Within the labor force, the 16 to 19 years age range has the highest percentage of unemployed individuals, with 81.9% or 59 of them being unemployed.
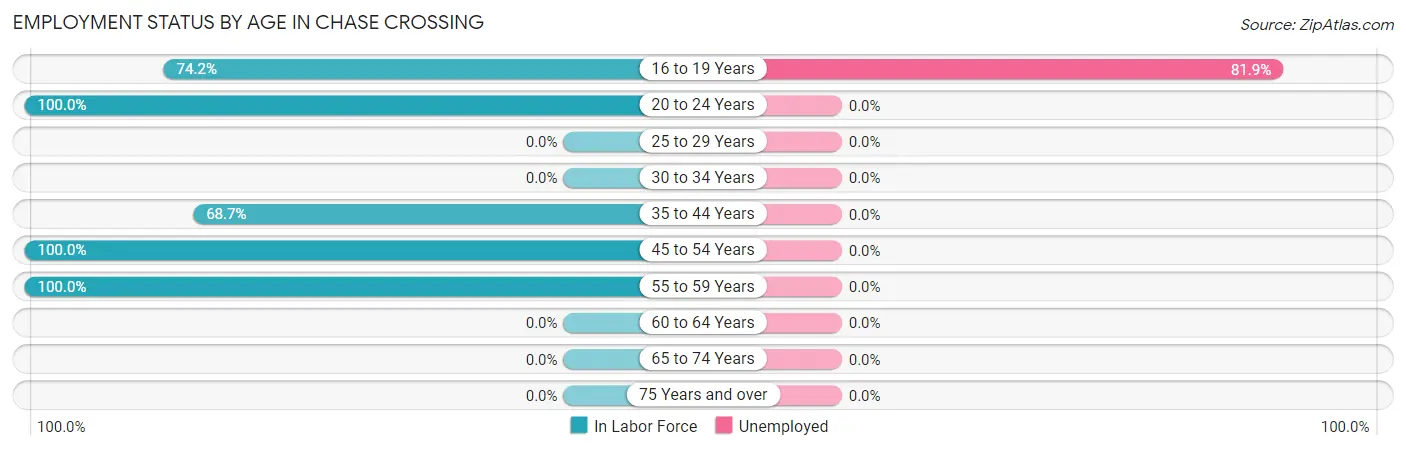
| Age Bracket | In Labor Force | Unemployed |
| 16 to 19 Years | 72 (74.2%) | 59 (81.9%) |
| 20 to 24 Years | 48 (100.0%) | 0 (0.0%) |
| 25 to 29 Years | 0 (0.0%) | 0 (0.0%) |
| 30 to 34 Years | 0 (0.0%) | 0 (0.0%) |
| 35 to 44 Years | 46 (68.7%) | 0 (0.0%) |
| 45 to 54 Years | 39 (100.0%) | 0 (0.0%) |
| 55 to 59 Years | 24 (100.0%) | 0 (0.0%) |
| 60 to 64 Years | 0 (0.0%) | 0 (0.0%) |
| 65 to 74 Years | 0 (0.0%) | 0 (0.0%) |
| 75 Years and over | 0 (0.0%) | 0 (0.0%) |
| Total | 229 (79.8%) | 59 (25.8%) |
Employment Status by Educational Attainment in Chase Crossing
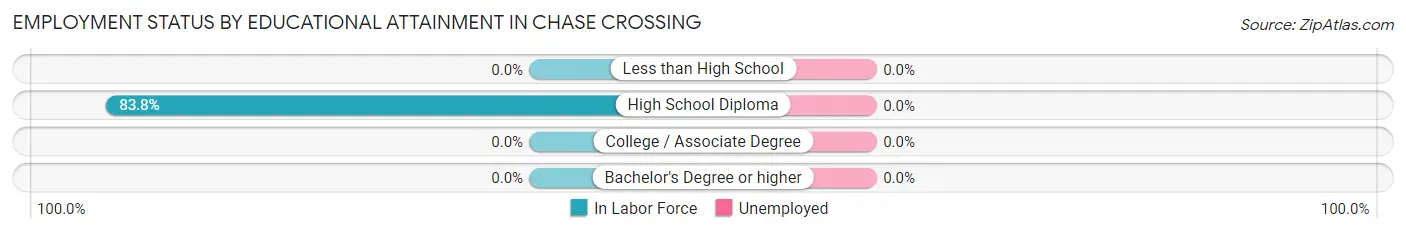
| Educational Attainment | In Labor Force | Unemployed |
| Less than High School | 0 (0.0%) | 0 (0.0%) |
| High School Diploma | 109 (83.8%) | 0 (0.0%) |
| College / Associate Degree | 0 (0.0%) | 0 (0.0%) |
| Bachelor's Degree or higher | 0 (0.0%) | 0 (0.0%) |
| Total | 109 (83.8%) | 0 (0.0%) |
Employment Occupations by Sex in Chase Crossing
Management, Business, Science and Arts Occupations
The most common Management, Business, Science and Arts occupations in Chase Crossing are Community & Social Service (24 | 14.1%), and Education Instruction & Library (24 | 14.1%).
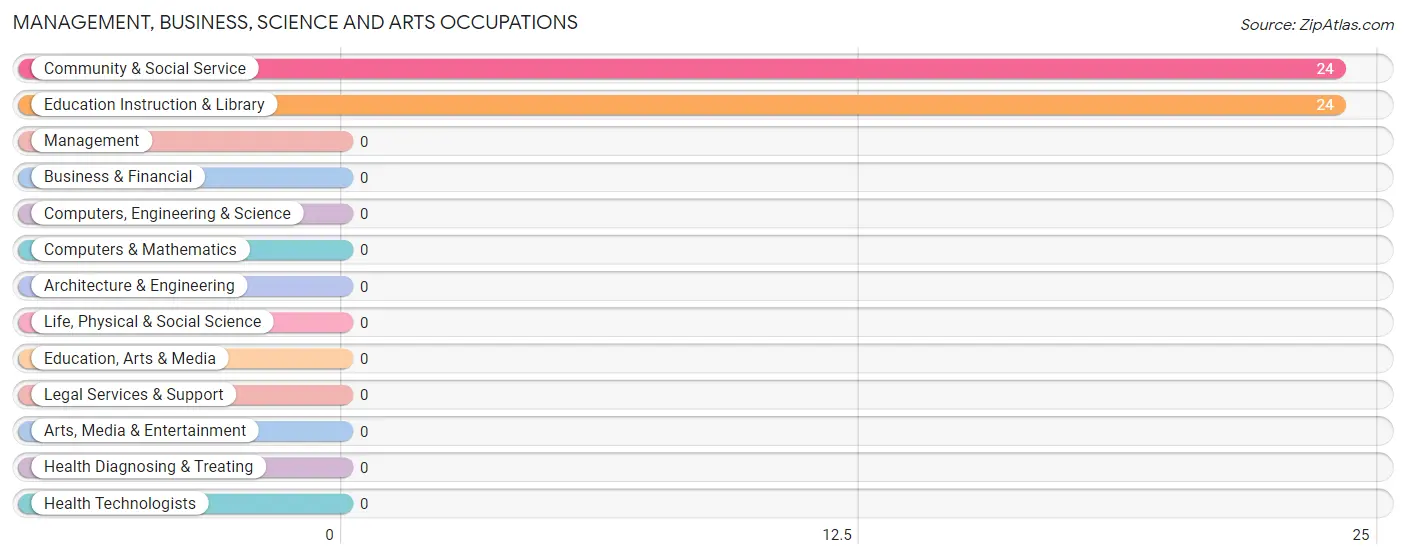
Management, Business, Science and Arts Occupations by Sex
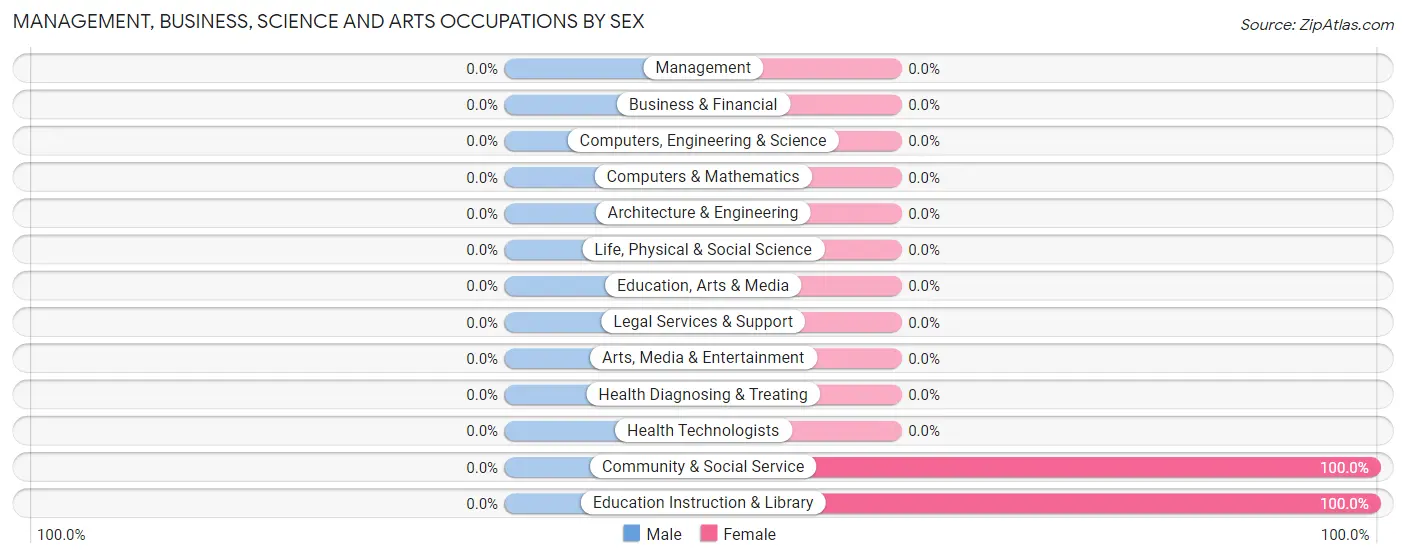
| Occupation | Male | Female |
| Management | 0 (0.0%) | 0 (0.0%) |
| Business & Financial | 0 (0.0%) | 0 (0.0%) |
| Computers, Engineering & Science | 0 (0.0%) | 0 (0.0%) |
| Computers & Mathematics | 0 (0.0%) | 0 (0.0%) |
| Architecture & Engineering | 0 (0.0%) | 0 (0.0%) |
| Life, Physical & Social Science | 0 (0.0%) | 0 (0.0%) |
| Community & Social Service | 0 (0.0%) | 24 (100.0%) |
| Education, Arts & Media | 0 (0.0%) | 0 (0.0%) |
| Legal Services & Support | 0 (0.0%) | 0 (0.0%) |
| Education Instruction & Library | 0 (0.0%) | 24 (100.0%) |
| Arts, Media & Entertainment | 0 (0.0%) | 0 (0.0%) |
| Health Diagnosing & Treating | 0 (0.0%) | 0 (0.0%) |
| Health Technologists | 0 (0.0%) | 0 (0.0%) |
| Total (Category) | 0 (0.0%) | 24 (100.0%) |
| Total (Overall) | 39 (22.9%) | 131 (77.1%) |
Services Occupations
The most common Services occupations in Chase Crossing are , and Food Preparation & Serving (46 | 27.1%).
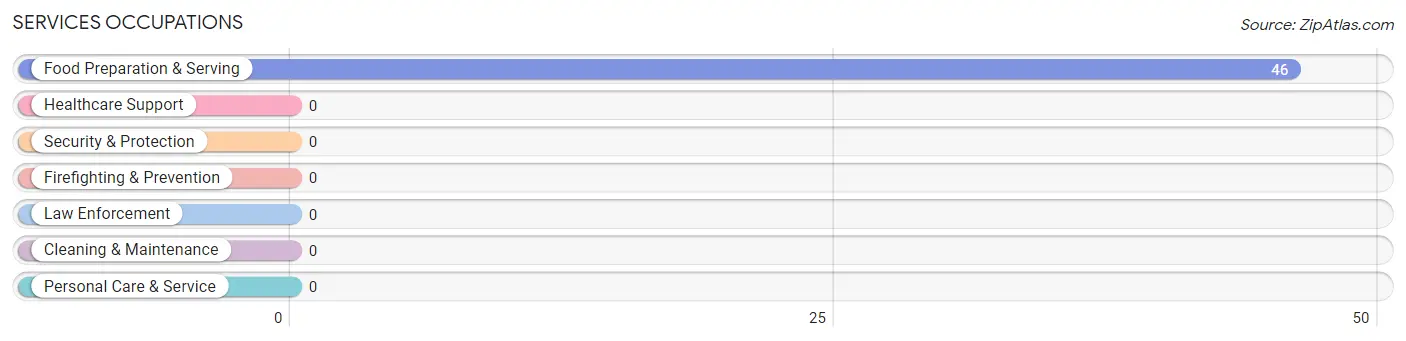
Services Occupations by Sex
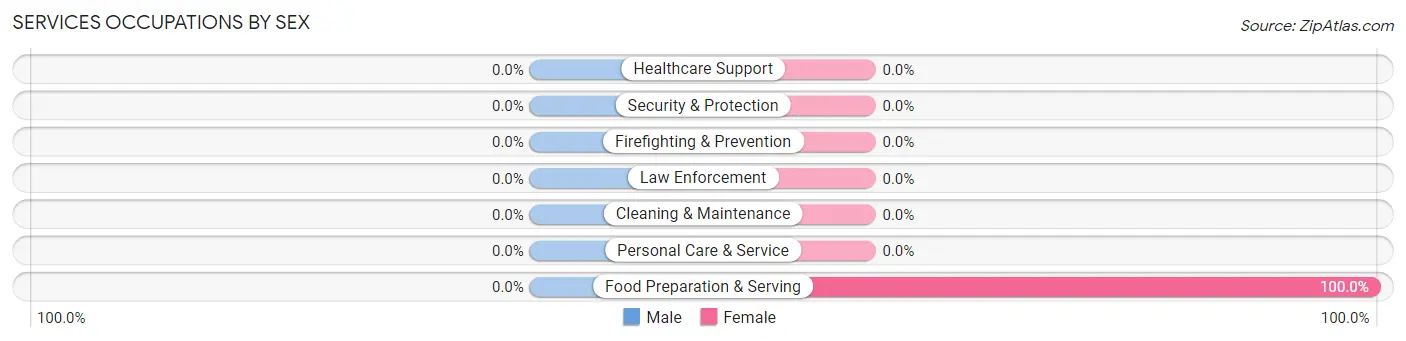
| Occupation | Male | Female |
| Healthcare Support | 0 (0.0%) | 0 (0.0%) |
| Security & Protection | 0 (0.0%) | 0 (0.0%) |
| Firefighting & Prevention | 0 (0.0%) | 0 (0.0%) |
| Law Enforcement | 0 (0.0%) | 0 (0.0%) |
| Food Preparation & Serving | 0 (0.0%) | 46 (100.0%) |
| Cleaning & Maintenance | 0 (0.0%) | 0 (0.0%) |
| Personal Care & Service | 0 (0.0%) | 0 (0.0%) |
| Total (Category) | 0 (0.0%) | 46 (100.0%) |
| Total (Overall) | 39 (22.9%) | 131 (77.1%) |
Sales and Office Occupations
The most common Sales and Office occupations in Chase Crossing are Sales & Related (48 | 28.2%), and Office & Administration (13 | 7.6%).
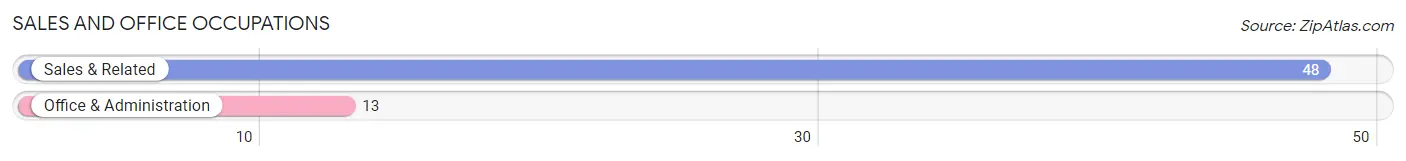
Sales and Office Occupations by Sex
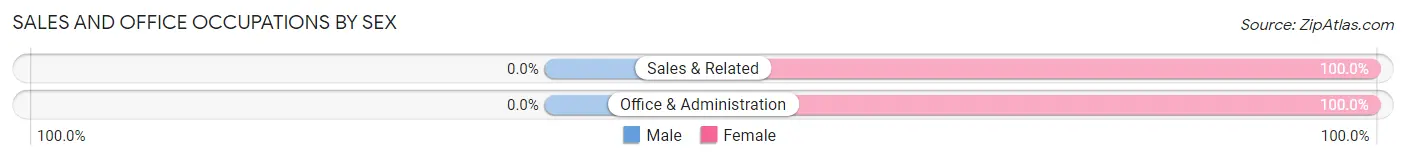
| Occupation | Male | Female |
| Sales & Related | 0 (0.0%) | 48 (100.0%) |
| Office & Administration | 0 (0.0%) | 13 (100.0%) |
| Total (Category) | 0 (0.0%) | 61 (100.0%) |
| Total (Overall) | 39 (22.9%) | 131 (77.1%) |
Natural Resources, Construction and Maintenance Occupations
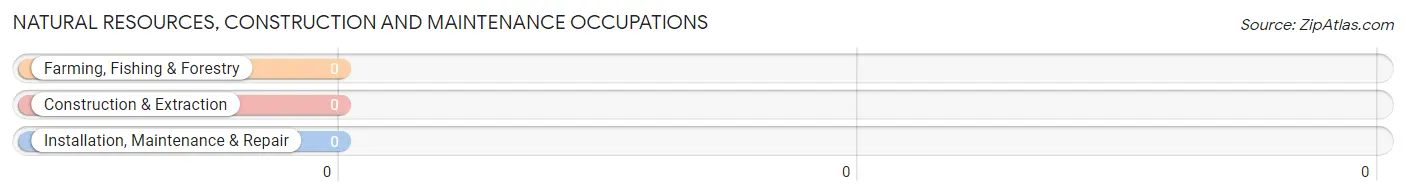
Natural Resources, Construction and Maintenance Occupations by Sex
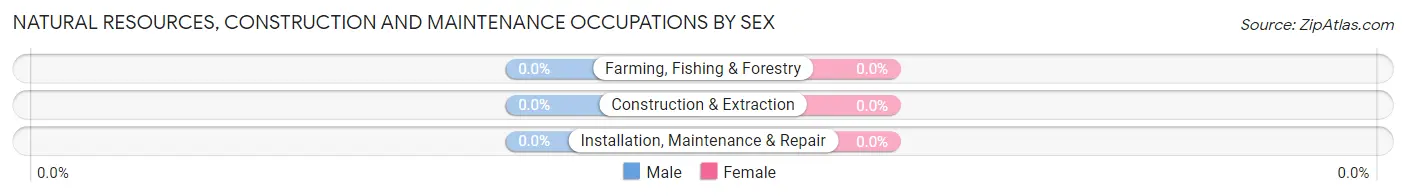
| Occupation | Male | Female |
| Farming, Fishing & Forestry | 0 (0.0%) | 0 (0.0%) |
| Construction & Extraction | 0 (0.0%) | 0 (0.0%) |
| Installation, Maintenance & Repair | 0 (0.0%) | 0 (0.0%) |
| Total (Category) | 0 (0.0%) | 0 (0.0%) |
| Total (Overall) | 39 (22.9%) | 131 (77.1%) |
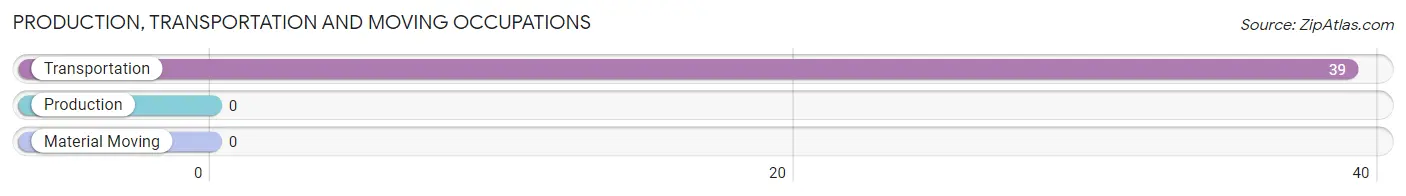
Production, Transportation and Moving Occupations
The most common Production, Transportation and Moving occupations in Chase Crossing are , and Transportation (39 | 22.9%).
Production, Transportation and Moving Occupations by Sex
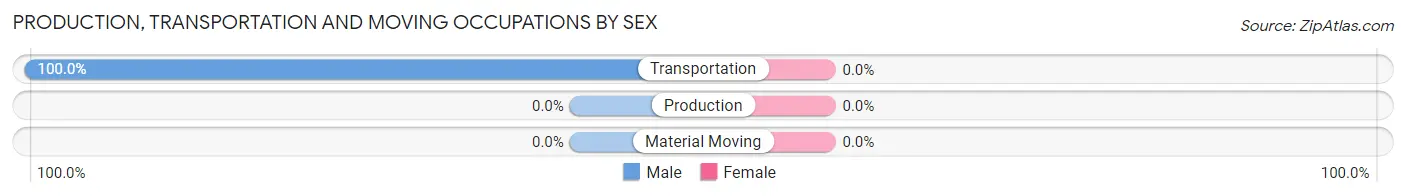
| Occupation | Male | Female |
| Production | 0 (0.0%) | 0 (0.0%) |
| Transportation | 39 (100.0%) | 0 (0.0%) |
| Material Moving | 0 (0.0%) | 0 (0.0%) |
| Total (Category) | 39 (100.0%) | 0 (0.0%) |
| Total (Overall) | 39 (22.9%) | 131 (77.1%) |
Employment Industries by Sex in Chase Crossing
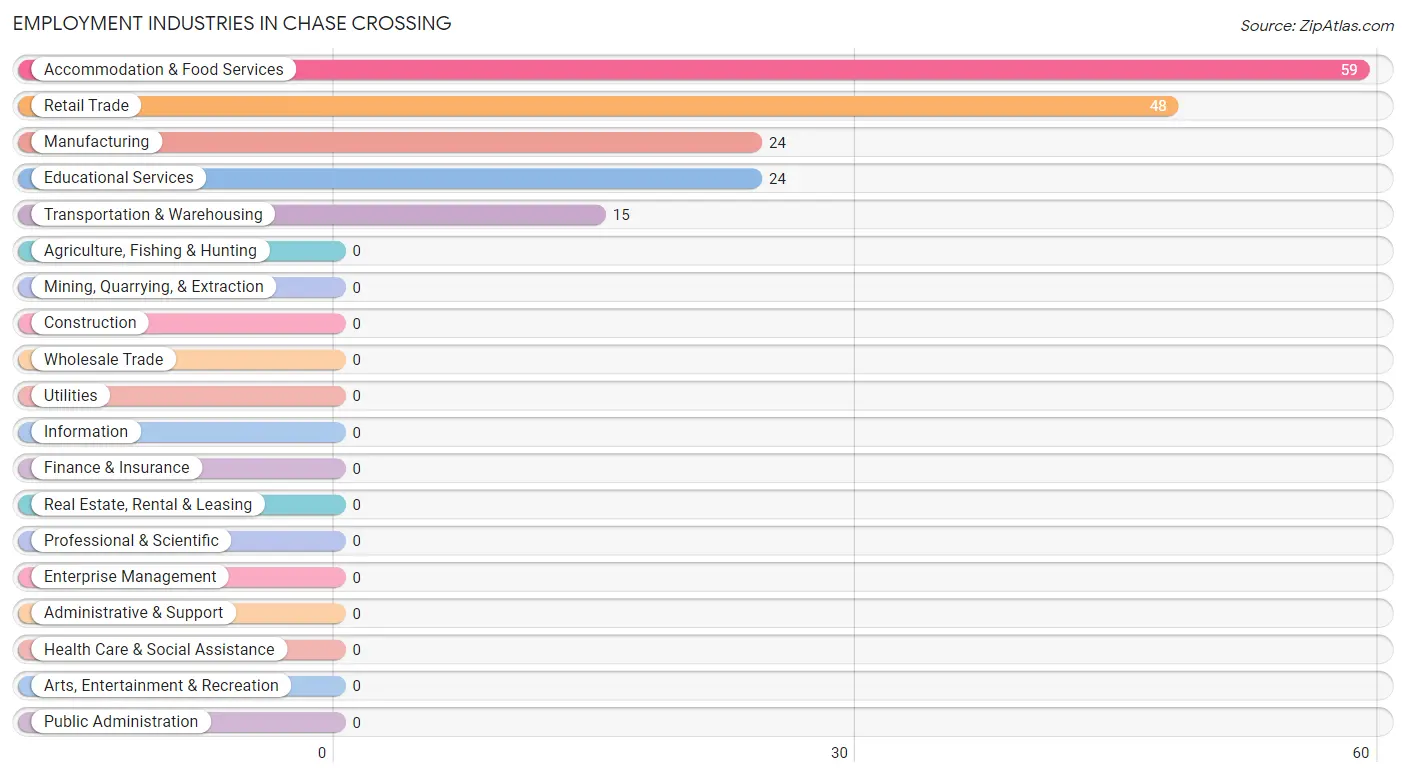
Employment Industries in Chase Crossing
The major employment industries in Chase Crossing include Accommodation & Food Services (59 | 34.7%), Retail Trade (48 | 28.2%), Manufacturing (24 | 14.1%), Educational Services (24 | 14.1%), and Transportation & Warehousing (15 | 8.8%).
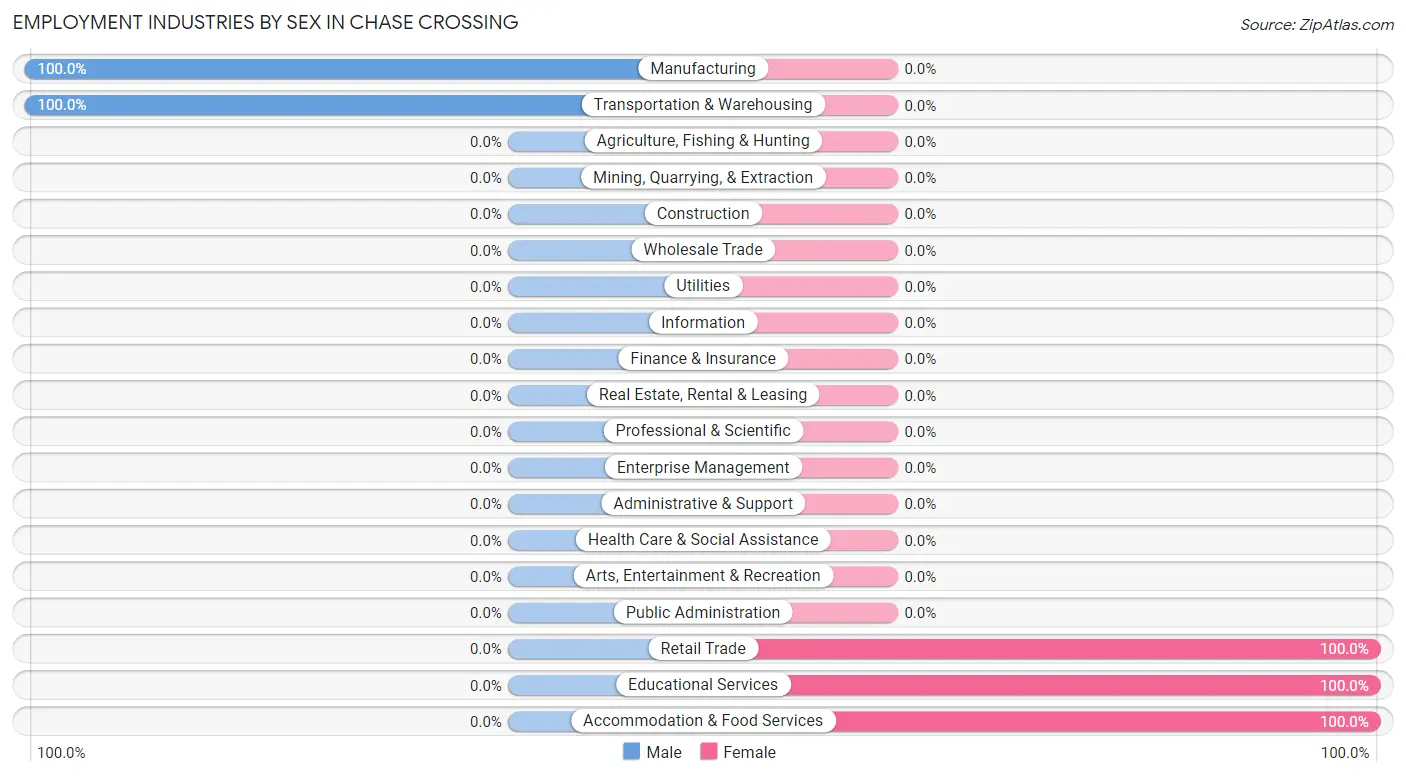
Employment Industries by Sex in Chase Crossing
The Chase Crossing industries that see more men than women are Manufacturing (100.0%), and Transportation & Warehousing (100.0%), whereas the industries that tend to have a higher number of women are Retail Trade (100.0%), Educational Services (100.0%), and Accommodation & Food Services (100.0%).
| Industry | Male | Female |
| Agriculture, Fishing & Hunting | 0 (0.0%) | 0 (0.0%) |
| Mining, Quarrying, & Extraction | 0 (0.0%) | 0 (0.0%) |
| Construction | 0 (0.0%) | 0 (0.0%) |
| Manufacturing | 24 (100.0%) | 0 (0.0%) |
| Wholesale Trade | 0 (0.0%) | 0 (0.0%) |
| Retail Trade | 0 (0.0%) | 48 (100.0%) |
| Transportation & Warehousing | 15 (100.0%) | 0 (0.0%) |
| Utilities | 0 (0.0%) | 0 (0.0%) |
| Information | 0 (0.0%) | 0 (0.0%) |
| Finance & Insurance | 0 (0.0%) | 0 (0.0%) |
| Real Estate, Rental & Leasing | 0 (0.0%) | 0 (0.0%) |
| Professional & Scientific | 0 (0.0%) | 0 (0.0%) |
| Enterprise Management | 0 (0.0%) | 0 (0.0%) |
| Administrative & Support | 0 (0.0%) | 0 (0.0%) |
| Educational Services | 0 (0.0%) | 24 (100.0%) |
| Health Care & Social Assistance | 0 (0.0%) | 0 (0.0%) |
| Arts, Entertainment & Recreation | 0 (0.0%) | 0 (0.0%) |
| Accommodation & Food Services | 0 (0.0%) | 59 (100.0%) |
| Public Administration | 0 (0.0%) | 0 (0.0%) |
| Total | 39 (22.9%) | 131 (77.1%) |
Education in Chase Crossing
School Enrollment in Chase Crossing
The most common levels of schooling among the 180 students in Chase Crossing are high school (85 | 47.2%), nursery / preschool (74 | 41.1%), and middle school (21 | 11.7%).
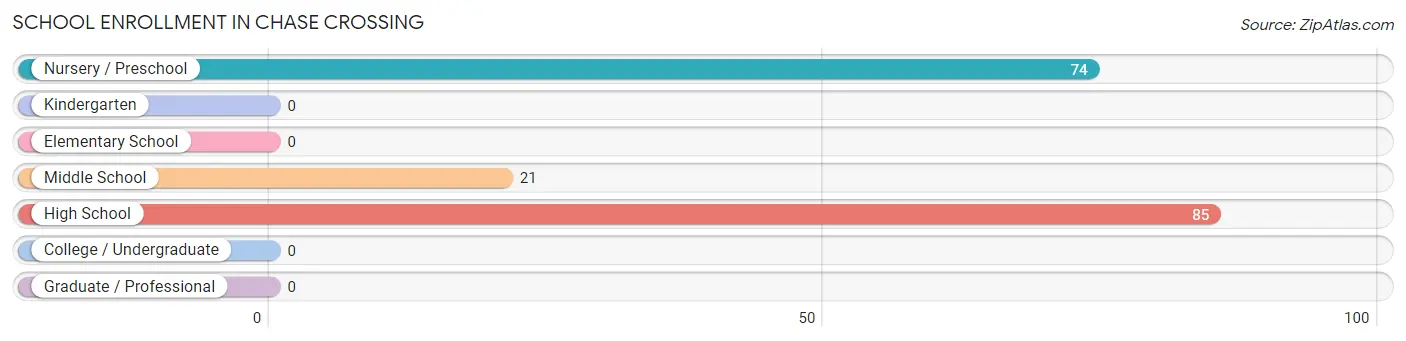
| School Level | # Students | % Students |
| Nursery / Preschool | 74 | 41.1% |
| Kindergarten | 0 | 0.0% |
| Elementary School | 0 | 0.0% |
| Middle School | 21 | 11.7% |
| High School | 85 | 47.2% |
| College / Undergraduate | 0 | 0.0% |
| Graduate / Professional | 0 | 0.0% |
| Total | 180 | 100.0% |
School Enrollment by Age by Funding Source in Chase Crossing
Out of a total of 180 students who are enrolled in schools in Chase Crossing, 25 (13.9%) attend a private institution, while the remaining 155 (86.1%) are enrolled in public schools. The age group of 18 to 19 year olds has the highest likelihood of being enrolled in private schools, with 25 (100.0% in the age bracket) enrolled. Conversely, the age group of 3 to 4 year olds has the lowest likelihood of being enrolled in a private school, with 74 (100.0% in the age bracket) attending a public institution.
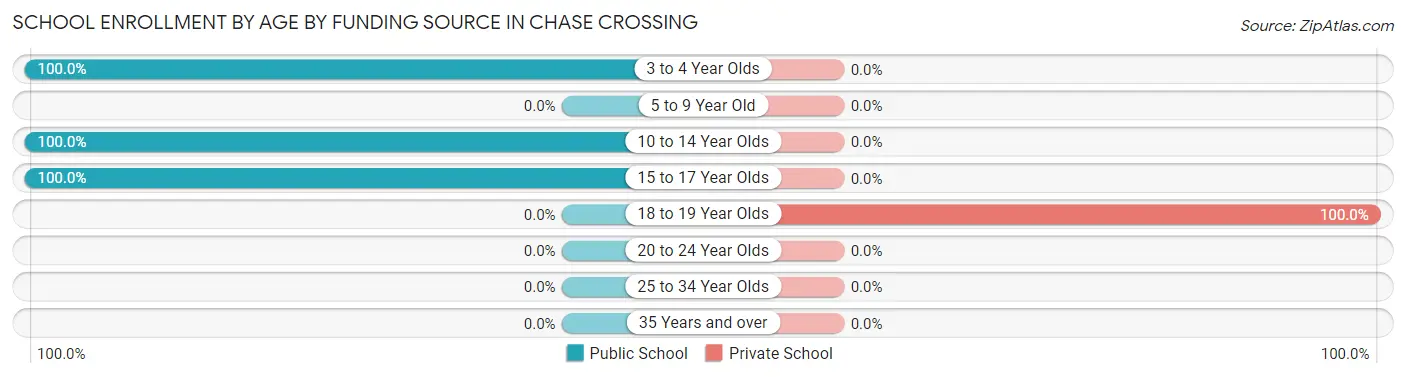
| Age Bracket | Public School | Private School |
| 3 to 4 Year Olds | 74 (100.0%) | 0 (0.0%) |
| 5 to 9 Year Old | 0 (0.0%) | 0 (0.0%) |
| 10 to 14 Year Olds | 68 (100.0%) | 0 (0.0%) |
| 15 to 17 Year Olds | 13 (100.0%) | 0 (0.0%) |
| 18 to 19 Year Olds | 0 (0.0%) | 25 (100.0%) |
| 20 to 24 Year Olds | 0 (0.0%) | 0 (0.0%) |
| 25 to 34 Year Olds | 0 (0.0%) | 0 (0.0%) |
| 35 Years and over | 0 (0.0%) | 0 (0.0%) |
| Total | 155 (86.1%) | 25 (13.9%) |
Educational Attainment by Field of Study in Chase Crossing
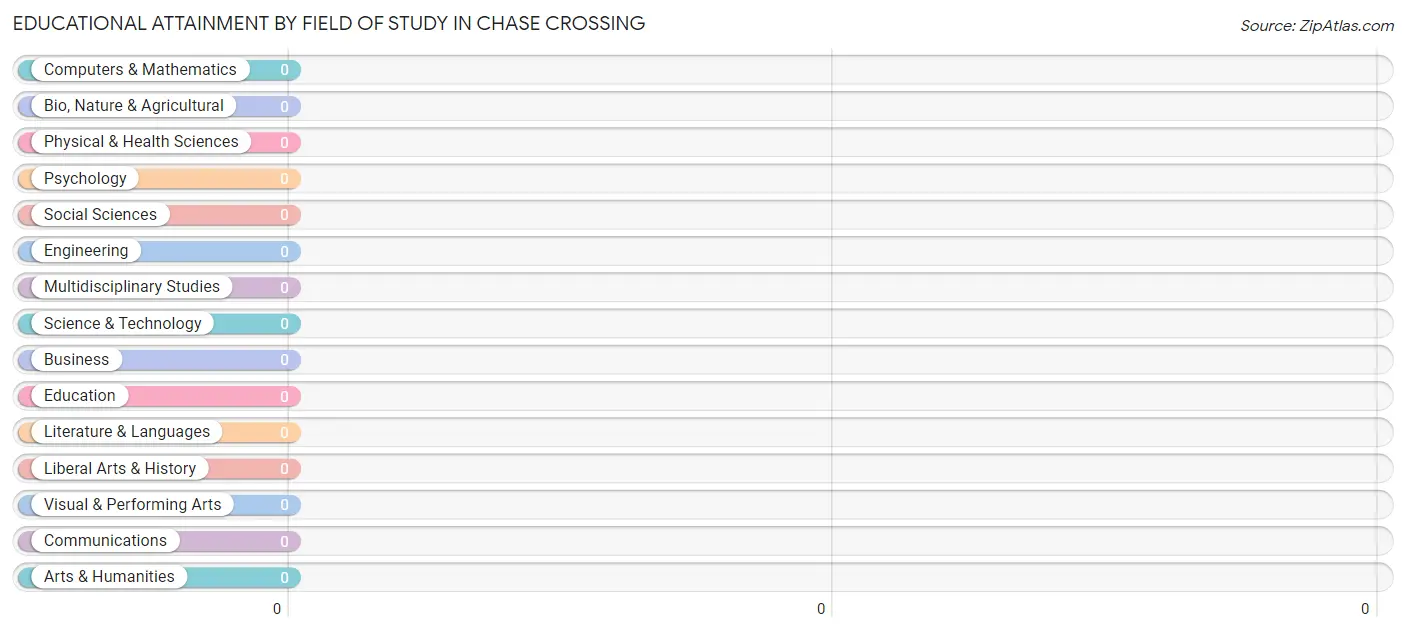
| Field of Study | # Graduates | % Graduates |
| Computers & Mathematics | 0 | 0.0% |
| Bio, Nature & Agricultural | 0 | 0.0% |
| Physical & Health Sciences | 0 | 0.0% |
| Psychology | 0 | 0.0% |
| Social Sciences | 0 | 0.0% |
| Engineering | 0 | 0.0% |
| Multidisciplinary Studies | 0 | 0.0% |
| Science & Technology | 0 | 0.0% |
| Business | 0 | 0.0% |
| Education | 0 | 0.0% |
| Literature & Languages | 0 | 0.0% |
| Liberal Arts & History | 0 | 0.0% |
| Visual & Performing Arts | 0 | 0.0% |
| Communications | 0 | 0.0% |
| Arts & Humanities | 0 | 0.0% |
| Total | 0 | 0.0% |
Transportation & Commute in Chase Crossing
Vehicle Availability by Sex in Chase Crossing
The most prevalent vehicle ownership categories in Chase Crossing are males with 2 vehicles (39, accounting for 100.0%) and females with 2 vehicles (85, making up 29.8%).
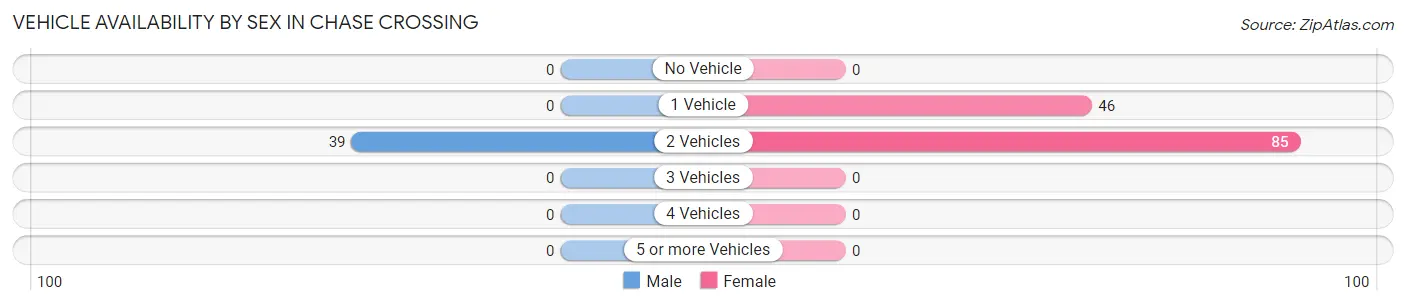
| Vehicles Available | Male | Female |
| No Vehicle | 0 (0.0%) | 0 (0.0%) |
| 1 Vehicle | 0 (0.0%) | 46 (35.1%) |
| 2 Vehicles | 39 (100.0%) | 85 (64.9%) |
| 3 Vehicles | 0 (0.0%) | 0 (0.0%) |
| 4 Vehicles | 0 (0.0%) | 0 (0.0%) |
| 5 or more Vehicles | 0 (0.0%) | 0 (0.0%) |
| Total | 39 (100.0%) | 131 (100.0%) |
Commute Time in Chase Crossing
The most frequently occuring commute durations in Chase Crossing are 20 to 24 minutes (85 commuters, 50.0%), 10 to 14 minutes (72 commuters, 42.3%), and 15 to 19 minutes (13 commuters, 7.6%).
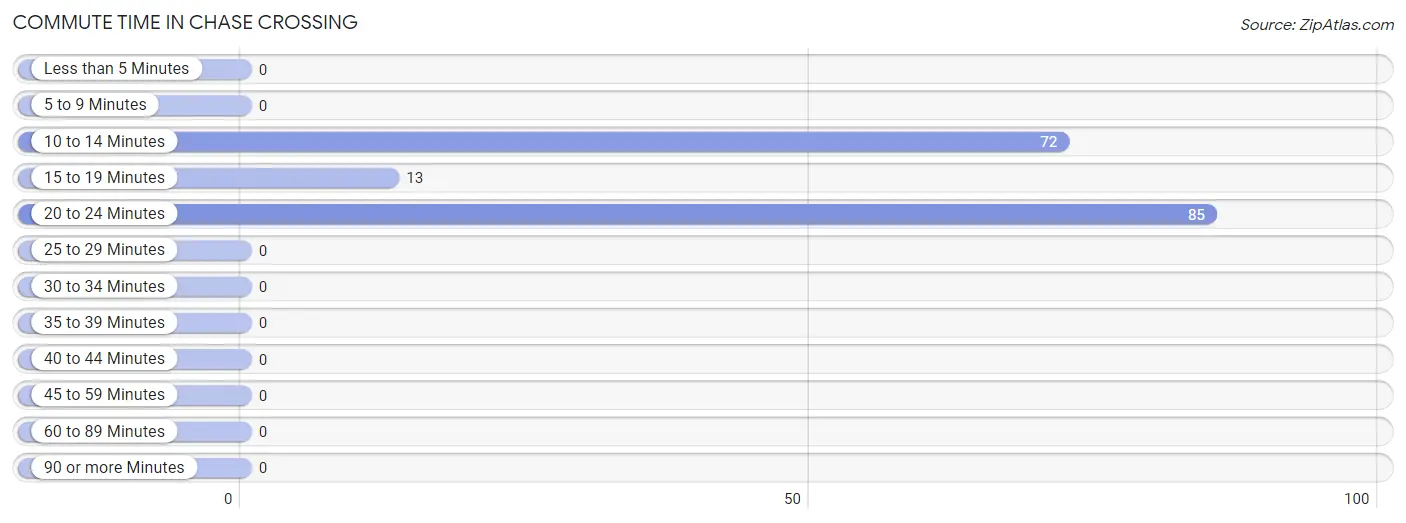
| Commute Time | # Commuters | % Commuters |
| Less than 5 Minutes | 0 | 0.0% |
| 5 to 9 Minutes | 0 | 0.0% |
| 10 to 14 Minutes | 72 | 42.3% |
| 15 to 19 Minutes | 13 | 7.6% |
| 20 to 24 Minutes | 85 | 50.0% |
| 25 to 29 Minutes | 0 | 0.0% |
| 30 to 34 Minutes | 0 | 0.0% |
| 35 to 39 Minutes | 0 | 0.0% |
| 40 to 44 Minutes | 0 | 0.0% |
| 45 to 59 Minutes | 0 | 0.0% |
| 60 to 89 Minutes | 0 | 0.0% |
| 90 or more Minutes | 0 | 0.0% |
Commute Time by Sex in Chase Crossing
The most common commute times in Chase Crossing are 10 to 14 minutes (24 commuters, 61.5%) for males and 20 to 24 minutes (70 commuters, 53.4%) for females.
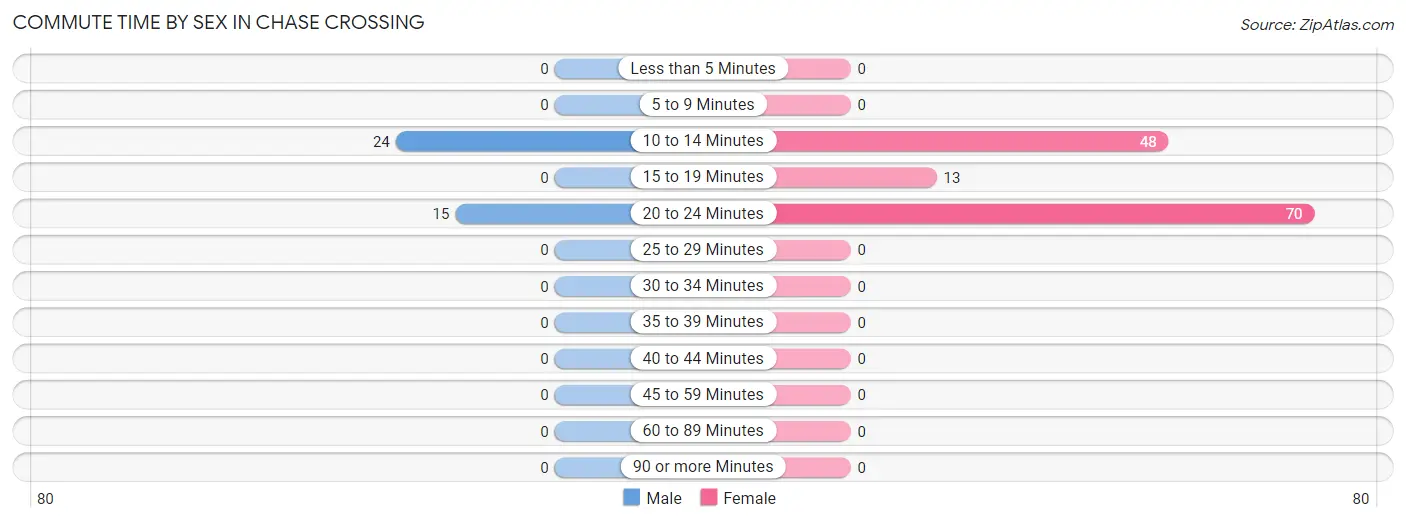
| Commute Time | Male | Female |
| Less than 5 Minutes | 0 (0.0%) | 0 (0.0%) |
| 5 to 9 Minutes | 0 (0.0%) | 0 (0.0%) |
| 10 to 14 Minutes | 24 (61.5%) | 48 (36.6%) |
| 15 to 19 Minutes | 0 (0.0%) | 13 (9.9%) |
| 20 to 24 Minutes | 15 (38.5%) | 70 (53.4%) |
| 25 to 29 Minutes | 0 (0.0%) | 0 (0.0%) |
| 30 to 34 Minutes | 0 (0.0%) | 0 (0.0%) |
| 35 to 39 Minutes | 0 (0.0%) | 0 (0.0%) |
| 40 to 44 Minutes | 0 (0.0%) | 0 (0.0%) |
| 45 to 59 Minutes | 0 (0.0%) | 0 (0.0%) |
| 60 to 89 Minutes | 0 (0.0%) | 0 (0.0%) |
| 90 or more Minutes | 0 (0.0%) | 0 (0.0%) |
Time of Departure to Work by Sex in Chase Crossing
The most frequent times of departure to work in Chase Crossing are 12:00 AM to 4:59 AM (24, 61.5%) for males and 9:00 AM to 9:59 AM (48, 36.6%) for females.
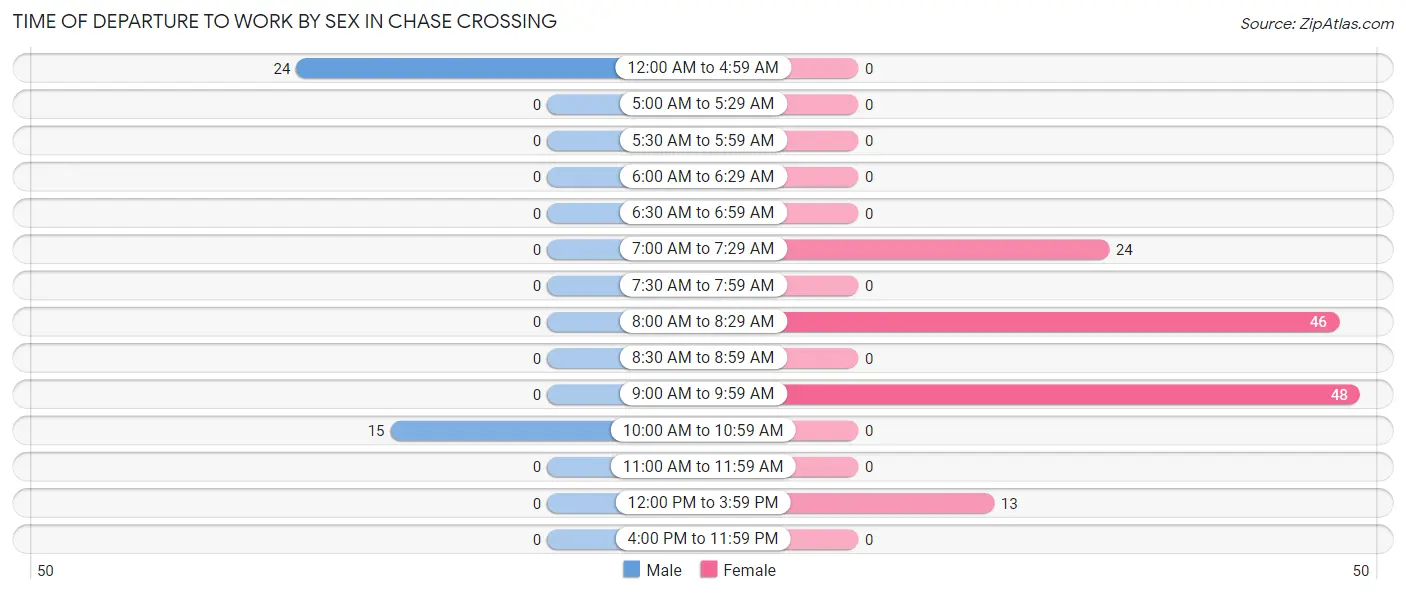
| Time of Departure | Male | Female |
| 12:00 AM to 4:59 AM | 24 (61.5%) | 0 (0.0%) |
| 5:00 AM to 5:29 AM | 0 (0.0%) | 0 (0.0%) |
| 5:30 AM to 5:59 AM | 0 (0.0%) | 0 (0.0%) |
| 6:00 AM to 6:29 AM | 0 (0.0%) | 0 (0.0%) |
| 6:30 AM to 6:59 AM | 0 (0.0%) | 0 (0.0%) |
| 7:00 AM to 7:29 AM | 0 (0.0%) | 24 (18.3%) |
| 7:30 AM to 7:59 AM | 0 (0.0%) | 0 (0.0%) |
| 8:00 AM to 8:29 AM | 0 (0.0%) | 46 (35.1%) |
| 8:30 AM to 8:59 AM | 0 (0.0%) | 0 (0.0%) |
| 9:00 AM to 9:59 AM | 0 (0.0%) | 48 (36.6%) |
| 10:00 AM to 10:59 AM | 15 (38.5%) | 0 (0.0%) |
| 11:00 AM to 11:59 AM | 0 (0.0%) | 0 (0.0%) |
| 12:00 PM to 3:59 PM | 0 (0.0%) | 13 (9.9%) |
| 4:00 PM to 11:59 PM | 0 (0.0%) | 0 (0.0%) |
| Total | 39 (100.0%) | 131 (100.0%) |
Housing Occupancy in Chase Crossing
Occupancy by Ownership in Chase Crossing
Of the total 103 dwellings in Chase Crossing, owner-occupied units account for 36 (34.9%), while renter-occupied units make up 67 (65.0%).
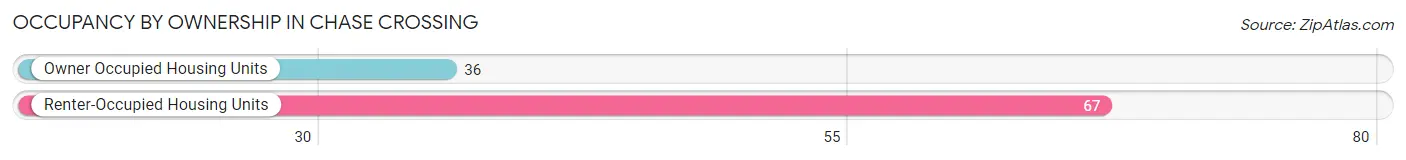
| Occupancy | # Housing Units | % Housing Units |
| Owner Occupied Housing Units | 36 | 34.9% |
| Renter-Occupied Housing Units | 67 | 65.0% |
| Total Occupied Housing Units | 103 | 100.0% |
Occupancy by Household Size in Chase Crossing
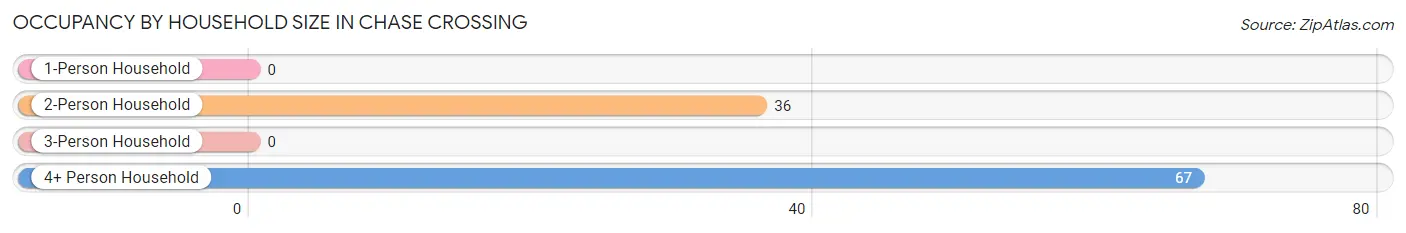
| Household Size | # Housing Units | % Housing Units |
| 1-Person Household | 0 | 0.0% |
| 2-Person Household | 36 | 34.9% |
| 3-Person Household | 0 | 0.0% |
| 4+ Person Household | 67 | 65.0% |
| Total Housing Units | 103 | 100.0% |
Occupancy by Ownership by Household Size in Chase Crossing
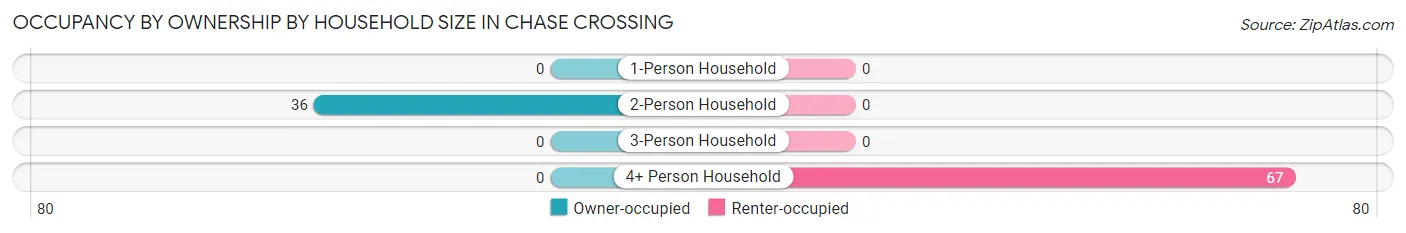
| Household Size | Owner-occupied | Renter-occupied |
| 1-Person Household | 0 (0.0%) | 0 (0.0%) |
| 2-Person Household | 36 (100.0%) | 0 (0.0%) |
| 3-Person Household | 0 (0.0%) | 0 (0.0%) |
| 4+ Person Household | 0 (0.0%) | 67 (100.0%) |
| Total Housing Units | 36 (34.9%) | 67 (65.0%) |
Occupancy by Educational Attainment in Chase Crossing
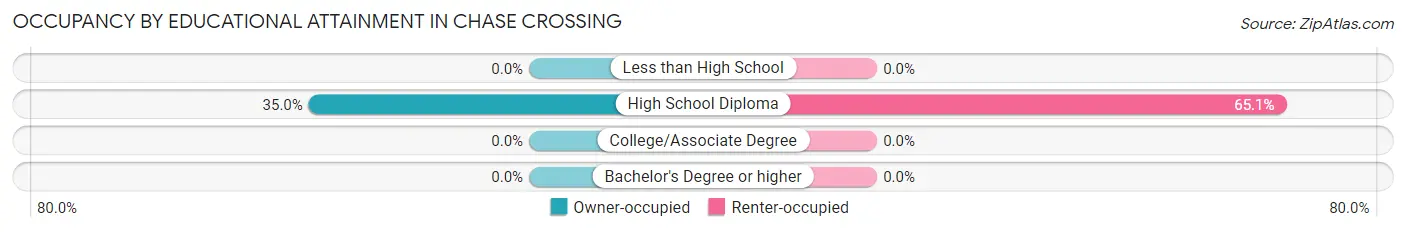
| Household Size | Owner-occupied | Renter-occupied |
| Less than High School | 0 (0.0%) | 0 (0.0%) |
| High School Diploma | 36 (34.9%) | 67 (65.0%) |
| College/Associate Degree | 0 (0.0%) | 0 (0.0%) |
| Bachelor's Degree or higher | 0 (0.0%) | 0 (0.0%) |
Occupancy by Age of Householder in Chase Crossing
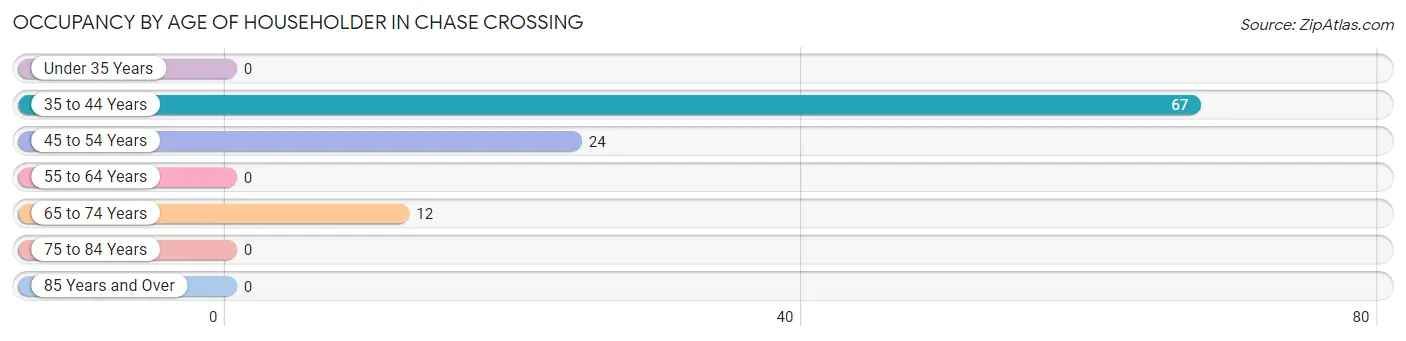
| Age Bracket | # Households | % Households |
| Under 35 Years | 0 | 0.0% |
| 35 to 44 Years | 67 | 65.0% |
| 45 to 54 Years | 24 | 23.3% |
| 55 to 64 Years | 0 | 0.0% |
| 65 to 74 Years | 12 | 11.7% |
| 75 to 84 Years | 0 | 0.0% |
| 85 Years and Over | 0 | 0.0% |
| Total | 103 | 100.0% |
Housing Finances in Chase Crossing
Median Income by Occupancy in Chase Crossing
| Occupancy Type | # Households | Median Income |
| Owner-Occupied | 36 (34.9%) | $0 |
| Renter-Occupied | 67 (65.0%) | $0 |
| Average | 103 (100.0%) | $0 |
Occupancy by Householder Income Bracket in Chase Crossing
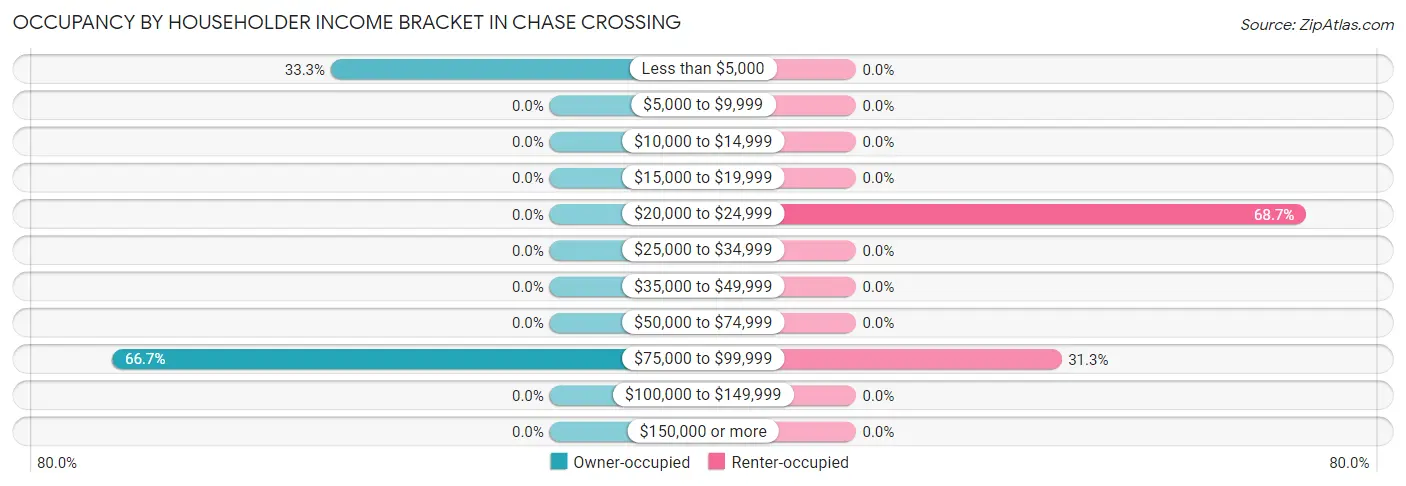
| Income Bracket | Owner-occupied | Renter-occupied |
| Less than $5,000 | 12 (33.3%) | 0 (0.0%) |
| $5,000 to $9,999 | 0 (0.0%) | 0 (0.0%) |
| $10,000 to $14,999 | 0 (0.0%) | 0 (0.0%) |
| $15,000 to $19,999 | 0 (0.0%) | 0 (0.0%) |
| $20,000 to $24,999 | 0 (0.0%) | 46 (68.7%) |
| $25,000 to $34,999 | 0 (0.0%) | 0 (0.0%) |
| $35,000 to $49,999 | 0 (0.0%) | 0 (0.0%) |
| $50,000 to $74,999 | 0 (0.0%) | 0 (0.0%) |
| $75,000 to $99,999 | 24 (66.7%) | 21 (31.3%) |
| $100,000 to $149,999 | 0 (0.0%) | 0 (0.0%) |
| $150,000 or more | 0 (0.0%) | 0 (0.0%) |
| Total | 36 (100.0%) | 67 (100.0%) |
Monthly Housing Cost Tiers in Chase Crossing
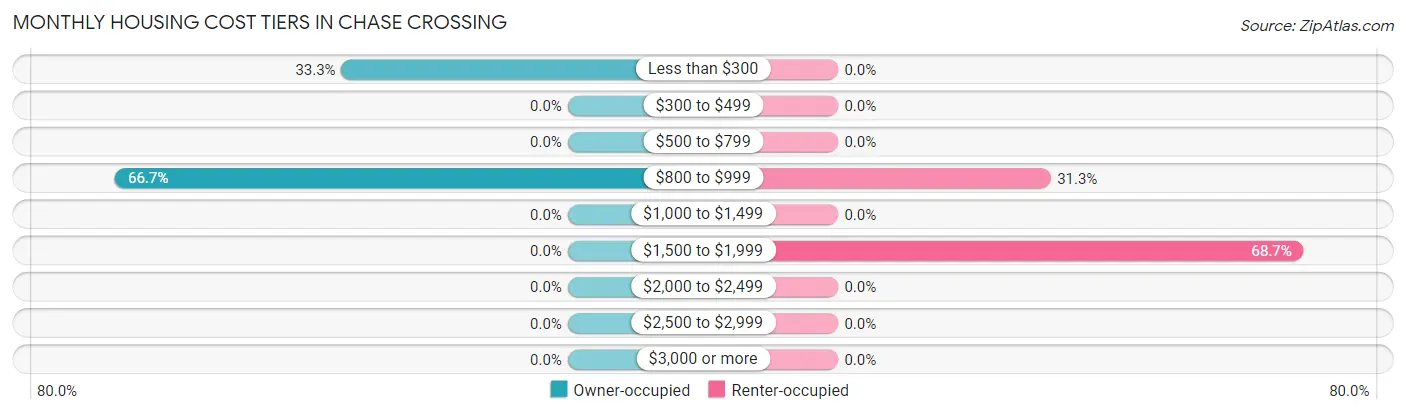
| Monthly Cost | Owner-occupied | Renter-occupied |
| Less than $300 | 12 (33.3%) | 0 (0.0%) |
| $300 to $499 | 0 (0.0%) | 0 (0.0%) |
| $500 to $799 | 0 (0.0%) | 0 (0.0%) |
| $800 to $999 | 24 (66.7%) | 21 (31.3%) |
| $1,000 to $1,499 | 0 (0.0%) | 0 (0.0%) |
| $1,500 to $1,999 | 0 (0.0%) | 46 (68.7%) |
| $2,000 to $2,499 | 0 (0.0%) | 0 (0.0%) |
| $2,500 to $2,999 | 0 (0.0%) | 0 (0.0%) |
| $3,000 or more | 0 (0.0%) | 0 (0.0%) |
| Total | 36 (100.0%) | 67 (100.0%) |
Physical Housing Characteristics in Chase Crossing
Housing Structures in Chase Crossing
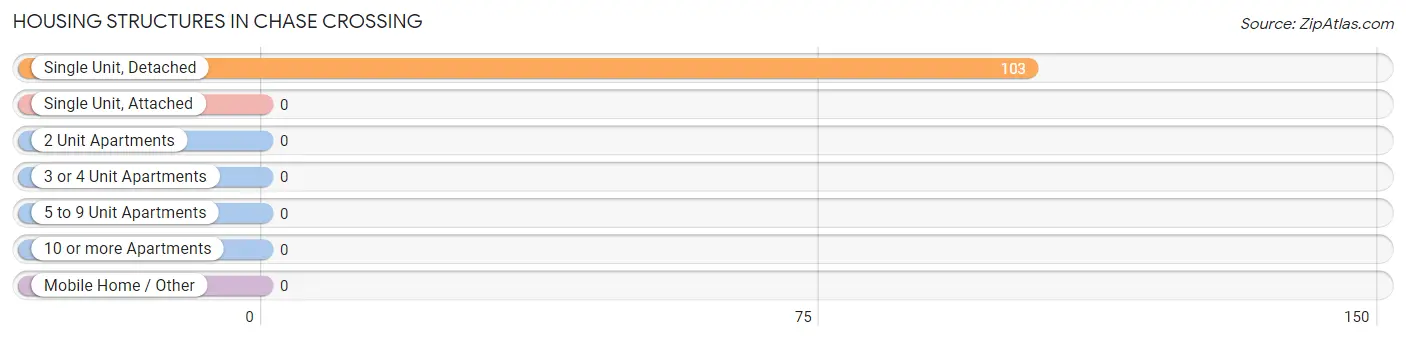
| Structure Type | # Housing Units | % Housing Units |
| Single Unit, Detached | 103 | 100.0% |
| Single Unit, Attached | 0 | 0.0% |
| 2 Unit Apartments | 0 | 0.0% |
| 3 or 4 Unit Apartments | 0 | 0.0% |
| 5 to 9 Unit Apartments | 0 | 0.0% |
| 10 or more Apartments | 0 | 0.0% |
| Mobile Home / Other | 0 | 0.0% |
| Total | 103 | 100.0% |
Housing Structures by Occupancy in Chase Crossing
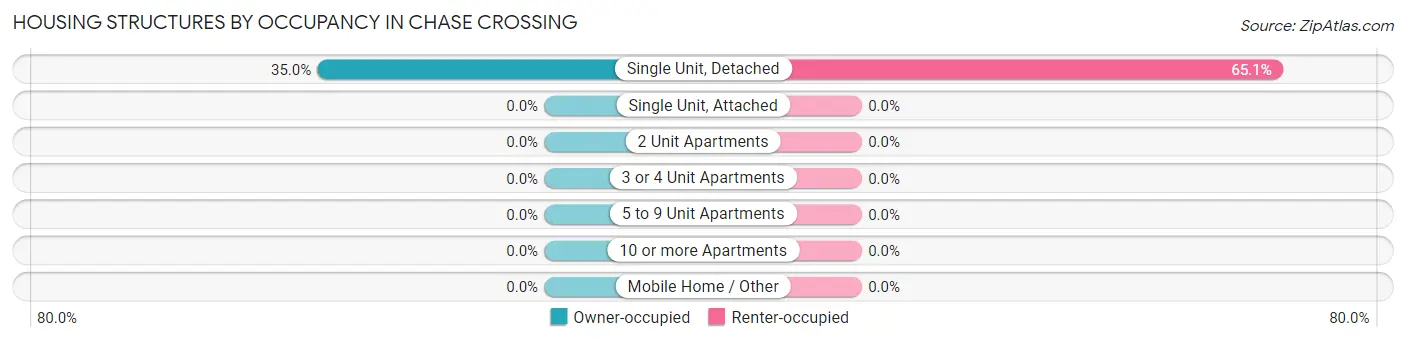
| Structure Type | Owner-occupied | Renter-occupied |
| Single Unit, Detached | 36 (34.9%) | 67 (65.0%) |
| Single Unit, Attached | 0 (0.0%) | 0 (0.0%) |
| 2 Unit Apartments | 0 (0.0%) | 0 (0.0%) |
| 3 or 4 Unit Apartments | 0 (0.0%) | 0 (0.0%) |
| 5 to 9 Unit Apartments | 0 (0.0%) | 0 (0.0%) |
| 10 or more Apartments | 0 (0.0%) | 0 (0.0%) |
| Mobile Home / Other | 0 (0.0%) | 0 (0.0%) |
| Total | 36 (34.9%) | 67 (65.0%) |
Housing Structures by Number of Rooms in Chase Crossing
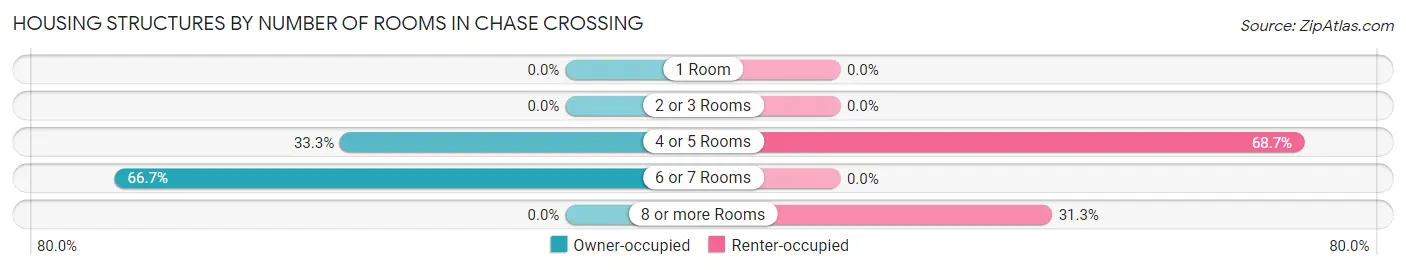
| Number of Rooms | Owner-occupied | Renter-occupied |
| 1 Room | 0 (0.0%) | 0 (0.0%) |
| 2 or 3 Rooms | 0 (0.0%) | 0 (0.0%) |
| 4 or 5 Rooms | 12 (33.3%) | 46 (68.7%) |
| 6 or 7 Rooms | 24 (66.7%) | 0 (0.0%) |
| 8 or more Rooms | 0 (0.0%) | 21 (31.3%) |
| Total | 36 (100.0%) | 67 (100.0%) |
Housing Structure by Heating Type in Chase Crossing
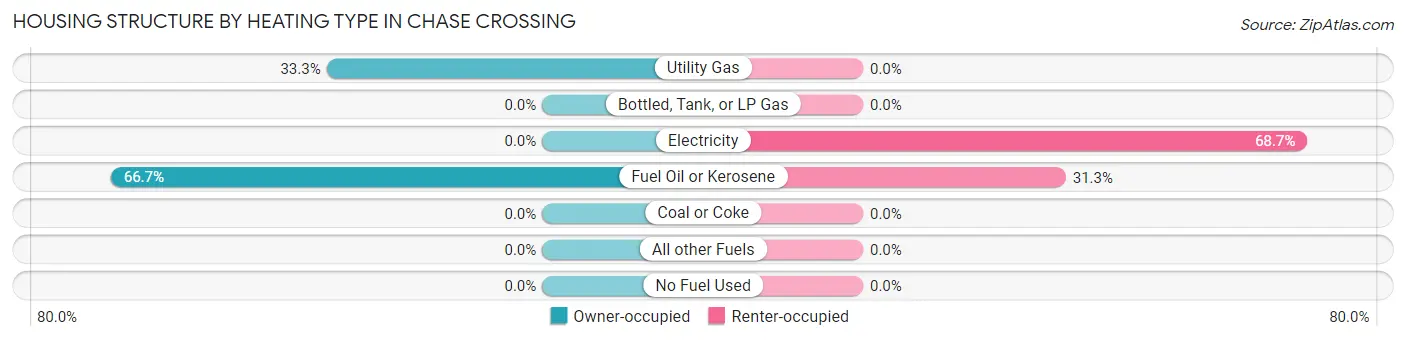
| Heating Type | Owner-occupied | Renter-occupied |
| Utility Gas | 12 (33.3%) | 0 (0.0%) |
| Bottled, Tank, or LP Gas | 0 (0.0%) | 0 (0.0%) |
| Electricity | 0 (0.0%) | 46 (68.7%) |
| Fuel Oil or Kerosene | 24 (66.7%) | 21 (31.3%) |
| Coal or Coke | 0 (0.0%) | 0 (0.0%) |
| All other Fuels | 0 (0.0%) | 0 (0.0%) |
| No Fuel Used | 0 (0.0%) | 0 (0.0%) |
| Total | 36 (100.0%) | 67 (100.0%) |
Household Vehicle Usage in Chase Crossing
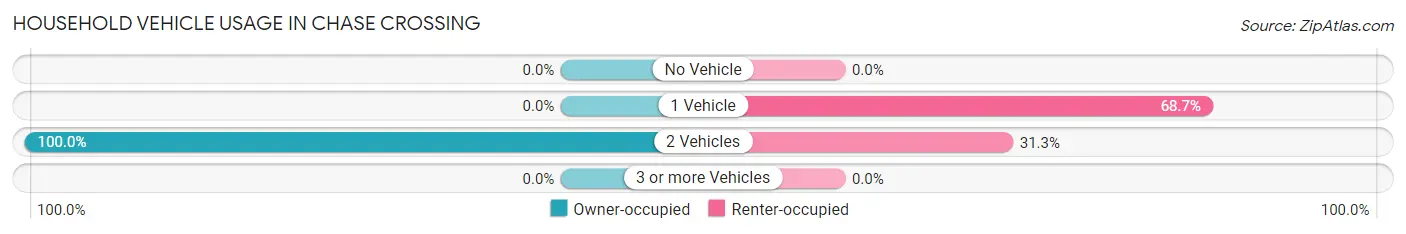
| Vehicles per Household | Owner-occupied | Renter-occupied |
| No Vehicle | 0 (0.0%) | 0 (0.0%) |
| 1 Vehicle | 0 (0.0%) | 46 (68.7%) |
| 2 Vehicles | 36 (100.0%) | 21 (31.3%) |
| 3 or more Vehicles | 0 (0.0%) | 0 (0.0%) |
| Total | 36 (100.0%) | 67 (100.0%) |
Real Estate & Mortgages in Chase Crossing
Real Estate and Mortgage Overview in Chase Crossing
| Characteristic | Without Mortgage | With Mortgage |
| Housing Units | 12 | 24 |
| Median Property Value | - | - |
| Median Household Income | - | - |
| Monthly Housing Costs | - | - |
| Real Estate Taxes | - | - |
Property Value by Mortgage Status in Chase Crossing
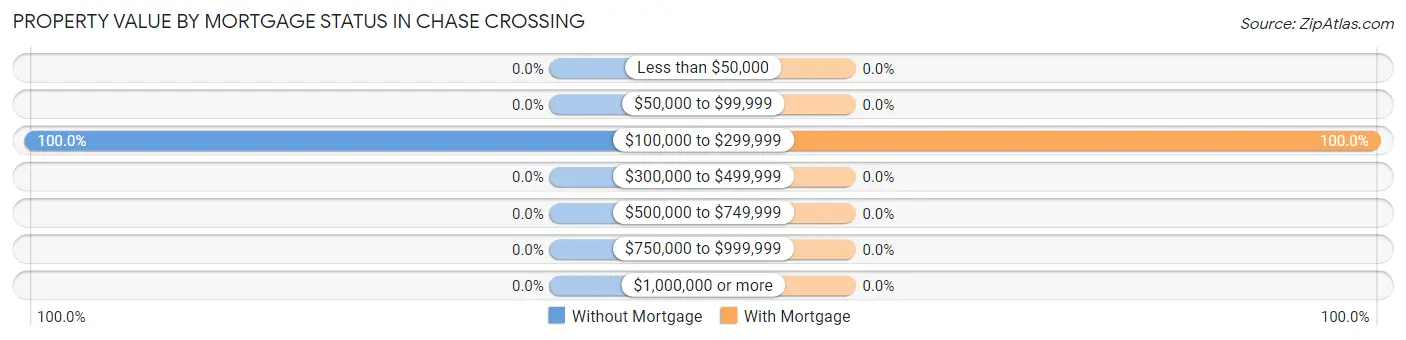
| Property Value | Without Mortgage | With Mortgage |
| Less than $50,000 | 0 (0.0%) | 0 (0.0%) |
| $50,000 to $99,999 | 0 (0.0%) | 0 (0.0%) |
| $100,000 to $299,999 | 12 (100.0%) | 24 (100.0%) |
| $300,000 to $499,999 | 0 (0.0%) | 0 (0.0%) |
| $500,000 to $749,999 | 0 (0.0%) | 0 (0.0%) |
| $750,000 to $999,999 | 0 (0.0%) | 0 (0.0%) |
| $1,000,000 or more | 0 (0.0%) | 0 (0.0%) |
| Total | 12 (100.0%) | 24 (100.0%) |
Household Income by Mortgage Status in Chase Crossing
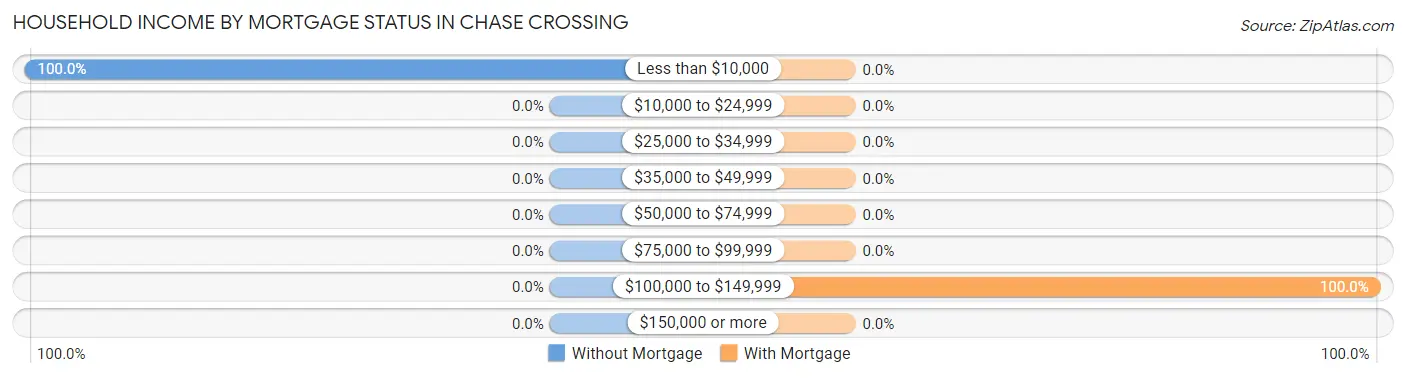
| Household Income | Without Mortgage | With Mortgage |
| Less than $10,000 | 12 (100.0%) | 0 (0.0%) |
| $10,000 to $24,999 | 0 (0.0%) | 0 (0.0%) |
| $25,000 to $34,999 | 0 (0.0%) | 0 (0.0%) |
| $35,000 to $49,999 | 0 (0.0%) | 0 (0.0%) |
| $50,000 to $74,999 | 0 (0.0%) | 0 (0.0%) |
| $75,000 to $99,999 | 0 (0.0%) | 0 (0.0%) |
| $100,000 to $149,999 | 0 (0.0%) | 24 (100.0%) |
| $150,000 or more | 0 (0.0%) | 0 (0.0%) |
| Total | 12 (100.0%) | 24 (100.0%) |
Property Value to Household Income Ratio in Chase Crossing
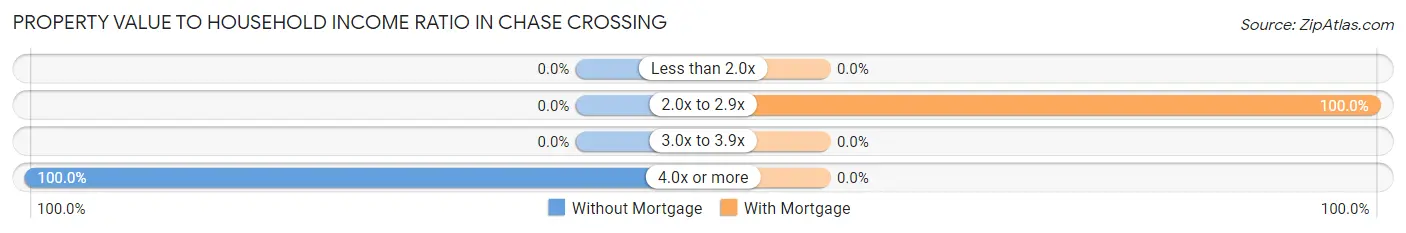
| Value-to-Income Ratio | Without Mortgage | With Mortgage |
| Less than 2.0x | 0 (0.0%) | 0 (0.0%) |
| 2.0x to 2.9x | 0 (0.0%) | 24 (100.0%) |
| 3.0x to 3.9x | 0 (0.0%) | 0 (0.0%) |
| 4.0x or more | 12 (100.0%) | 0 (0.0%) |
| Total | 12 (100.0%) | 24 (100.0%) |
Real Estate Taxes by Mortgage Status in Chase Crossing
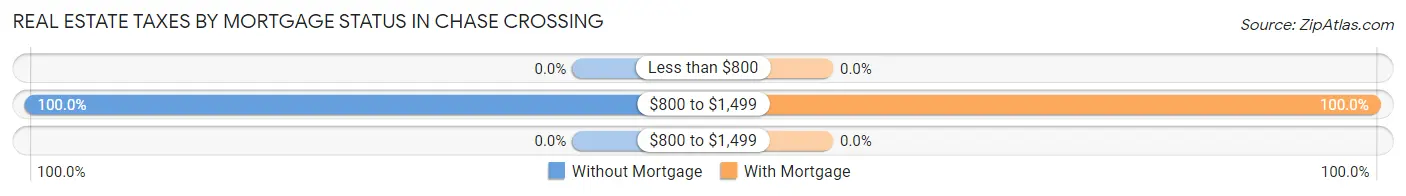
| Property Taxes | Without Mortgage | With Mortgage |
| Less than $800 | 0 (0.0%) | 0 (0.0%) |
| $800 to $1,499 | 12 (100.0%) | 24 (100.0%) |
| $800 to $1,499 | 0 (0.0%) | 0 (0.0%) |
| Total | 12 (100.0%) | 24 (100.0%) |
Health & Disability in Chase Crossing
Health Insurance Coverage by Age in Chase Crossing
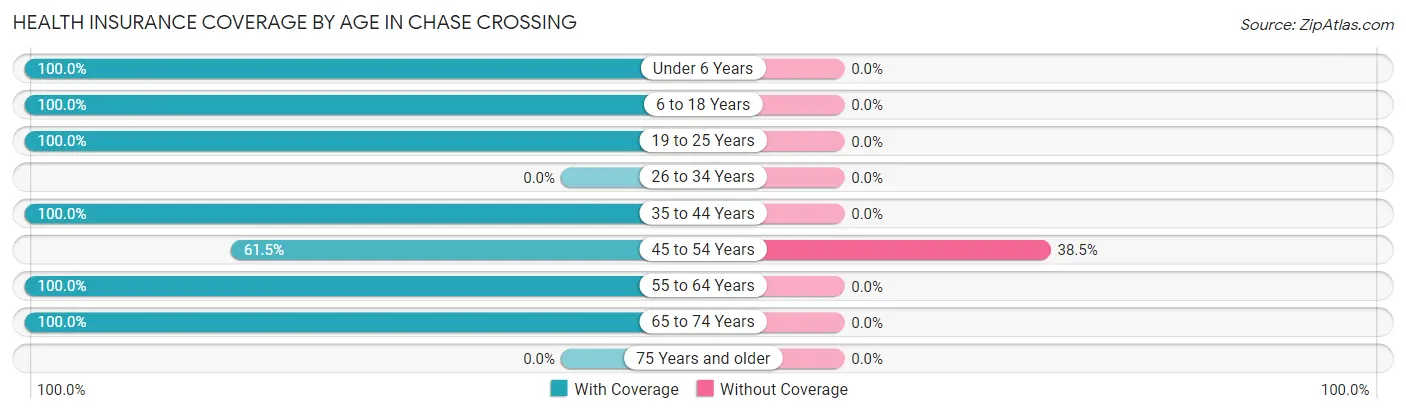
| Age Bracket | With Coverage | Without Coverage |
| Under 6 Years | 147 (100.0%) | 0 (0.0%) |
| 6 to 18 Years | 165 (100.0%) | 0 (0.0%) |
| 19 to 25 Years | 48 (100.0%) | 0 (0.0%) |
| 26 to 34 Years | 0 (0.0%) | 0 (0.0%) |
| 35 to 44 Years | 67 (100.0%) | 0 (0.0%) |
| 45 to 54 Years | 24 (61.5%) | 15 (38.5%) |
| 55 to 64 Years | 24 (100.0%) | 0 (0.0%) |
| 65 to 74 Years | 12 (100.0%) | 0 (0.0%) |
| 75 Years and older | 0 (0.0%) | 0 (0.0%) |
| Total | 487 (97.0%) | 15 (3.0%) |
Health Insurance Coverage by Citizenship Status in Chase Crossing
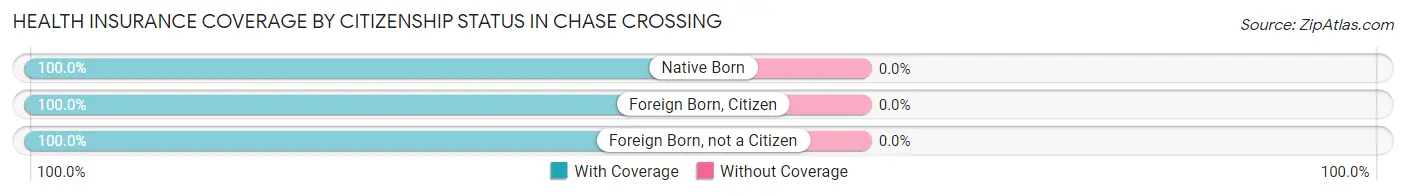
| Citizenship Status | With Coverage | Without Coverage |
| Native Born | 147 (100.0%) | 0 (0.0%) |
| Foreign Born, Citizen | 165 (100.0%) | 0 (0.0%) |
| Foreign Born, not a Citizen | 48 (100.0%) | 0 (0.0%) |
Health Insurance Coverage by Household Income in Chase Crossing
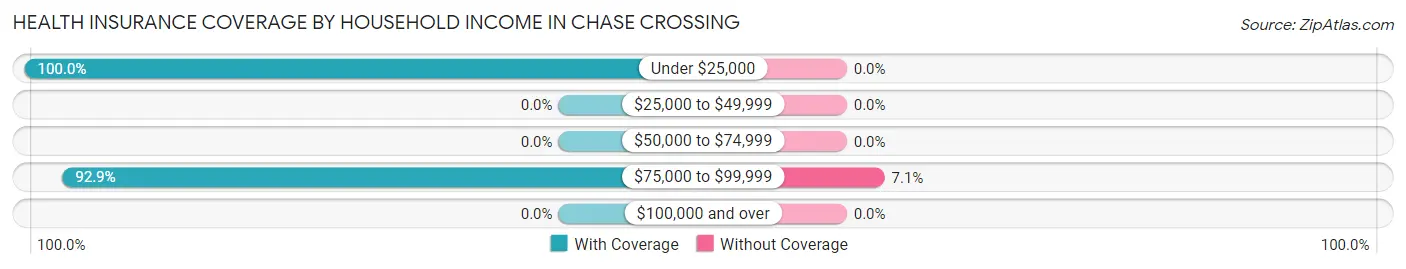
| Household Income | With Coverage | Without Coverage |
| Under $25,000 | 290 (100.0%) | 0 (0.0%) |
| $25,000 to $49,999 | 0 (0.0%) | 0 (0.0%) |
| $50,000 to $74,999 | 0 (0.0%) | 0 (0.0%) |
| $75,000 to $99,999 | 197 (92.9%) | 15 (7.1%) |
| $100,000 and over | 0 (0.0%) | 0 (0.0%) |
Public vs Private Health Insurance Coverage by Age in Chase Crossing
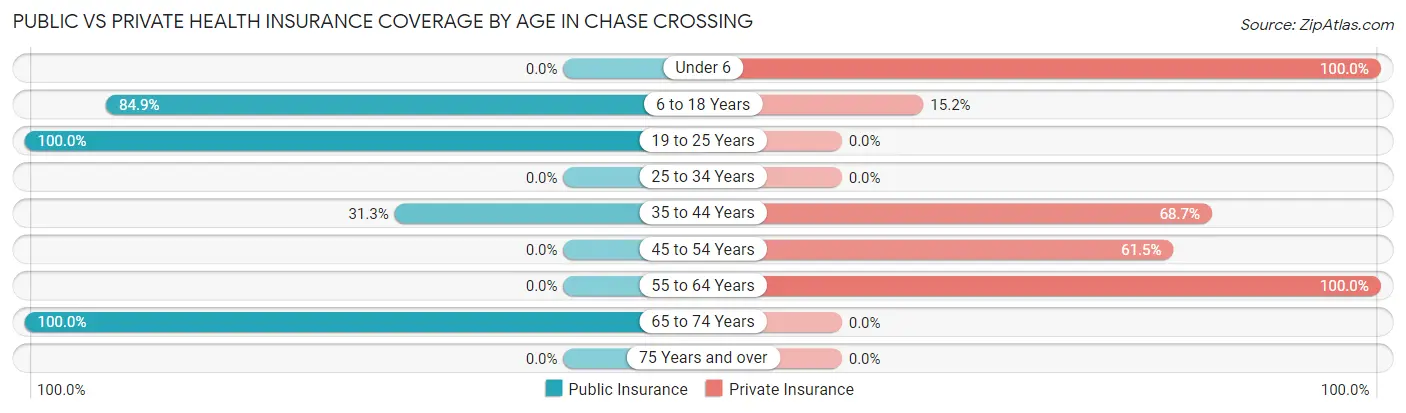
| Age Bracket | Public Insurance | Private Insurance |
| Under 6 | 0 (0.0%) | 147 (100.0%) |
| 6 to 18 Years | 140 (84.9%) | 25 (15.1%) |
| 19 to 25 Years | 48 (100.0%) | 0 (0.0%) |
| 25 to 34 Years | 0 (0.0%) | 0 (0.0%) |
| 35 to 44 Years | 21 (31.3%) | 46 (68.7%) |
| 45 to 54 Years | 0 (0.0%) | 24 (61.5%) |
| 55 to 64 Years | 0 (0.0%) | 24 (100.0%) |
| 65 to 74 Years | 12 (100.0%) | 0 (0.0%) |
| 75 Years and over | 0 (0.0%) | 0 (0.0%) |
| Total | 221 (44.0%) | 266 (53.0%) |
Disability Status by Sex by Age in Chase Crossing
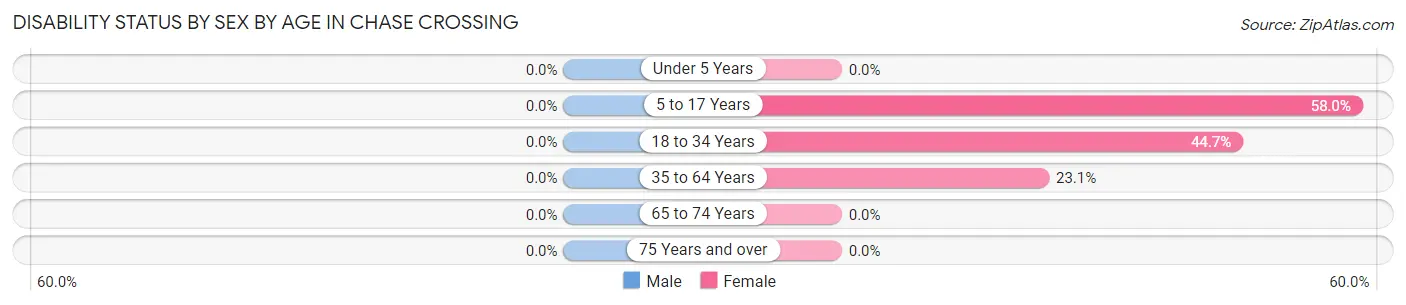
| Age Bracket | Male | Female |
| Under 5 Years | 0 (0.0%) | 0 (0.0%) |
| 5 to 17 Years | 0 (0.0%) | 47 (58.0%) |
| 18 to 34 Years | 0 (0.0%) | 59 (44.7%) |
| 35 to 64 Years | 0 (0.0%) | 21 (23.1%) |
| 65 to 74 Years | 0 (0.0%) | 0 (0.0%) |
| 75 Years and over | 0 (0.0%) | 0 (0.0%) |
Disability Class by Sex by Age in Chase Crossing
Disability Class: Hearing Difficulty
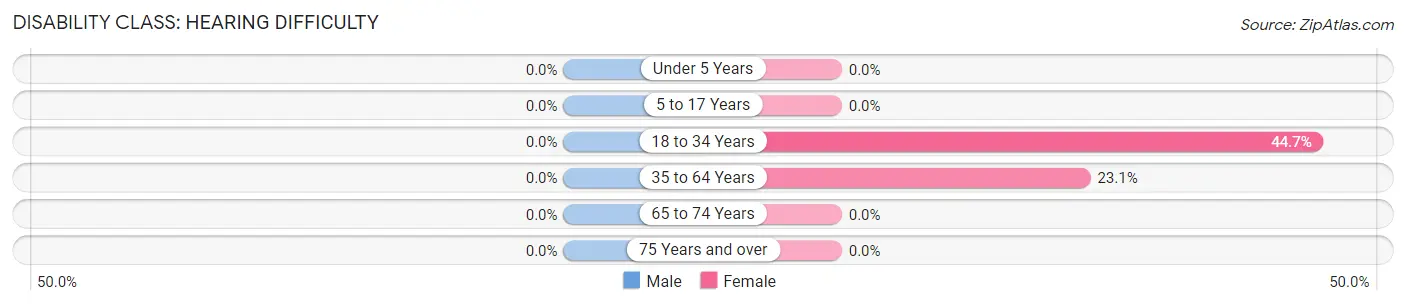
| Age Bracket | Male | Female |
| Under 5 Years | 0 (0.0%) | 0 (0.0%) |
| 5 to 17 Years | 0 (0.0%) | 0 (0.0%) |
| 18 to 34 Years | 0 (0.0%) | 59 (44.7%) |
| 35 to 64 Years | 0 (0.0%) | 21 (23.1%) |
| 65 to 74 Years | 0 (0.0%) | 0 (0.0%) |
| 75 Years and over | 0 (0.0%) | 0 (0.0%) |
Disability Class: Vision Difficulty
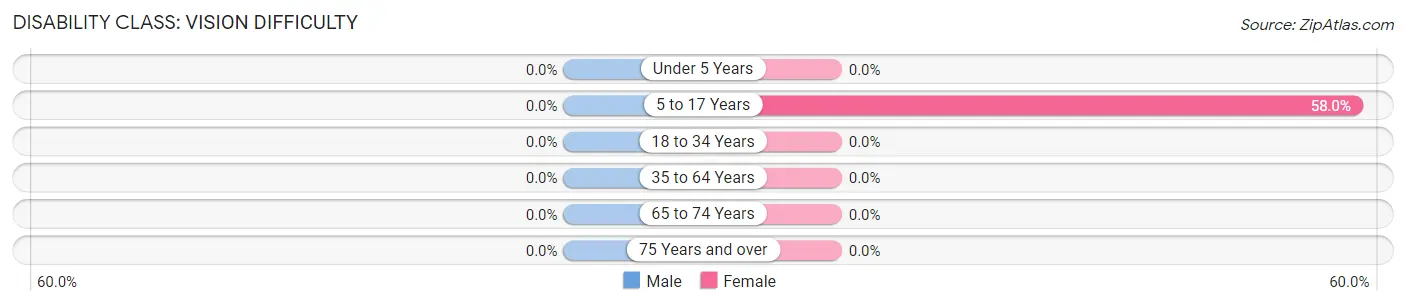
| Age Bracket | Male | Female |
| Under 5 Years | 0 (0.0%) | 0 (0.0%) |
| 5 to 17 Years | 0 (0.0%) | 47 (58.0%) |
| 18 to 34 Years | 0 (0.0%) | 0 (0.0%) |
| 35 to 64 Years | 0 (0.0%) | 0 (0.0%) |
| 65 to 74 Years | 0 (0.0%) | 0 (0.0%) |
| 75 Years and over | 0 (0.0%) | 0 (0.0%) |
Disability Class: Cognitive Difficulty
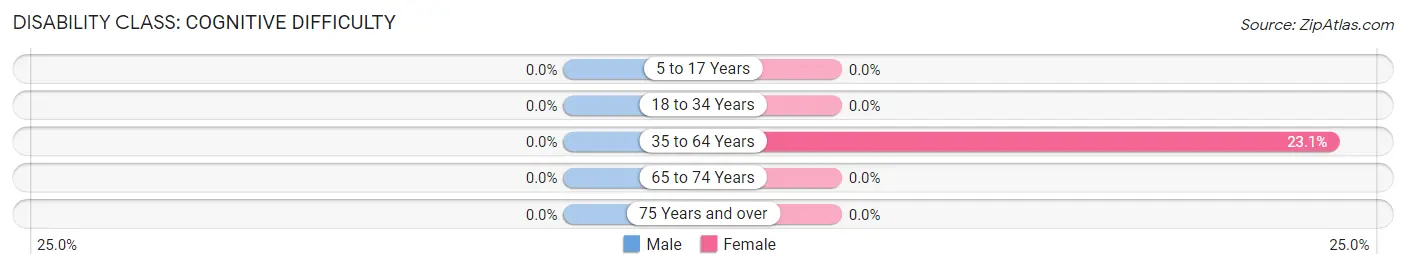
| Age Bracket | Male | Female |
| 5 to 17 Years | 0 (0.0%) | 0 (0.0%) |
| 18 to 34 Years | 0 (0.0%) | 0 (0.0%) |
| 35 to 64 Years | 0 (0.0%) | 21 (23.1%) |
| 65 to 74 Years | 0 (0.0%) | 0 (0.0%) |
| 75 Years and over | 0 (0.0%) | 0 (0.0%) |
Disability Class: Ambulatory Difficulty
| Age Bracket | Male | Female |
| 5 to 17 Years | 0 (0.0%) | 0 (0.0%) |
| 18 to 34 Years | 0 (0.0%) | 0 (0.0%) |
| 35 to 64 Years | 0 (0.0%) | 0 (0.0%) |
| 65 to 74 Years | 0 (0.0%) | 0 (0.0%) |
| 75 Years and over | 0 (0.0%) | 0 (0.0%) |
Disability Class: Self-Care Difficulty
| Age Bracket | Male | Female |
| 5 to 17 Years | 0 (0.0%) | 0 (0.0%) |
| 18 to 34 Years | 0 (0.0%) | 0 (0.0%) |
| 35 to 64 Years | 0 (0.0%) | 0 (0.0%) |
| 65 to 74 Years | 0 (0.0%) | 0 (0.0%) |
| 75 Years and over | 0 (0.0%) | 0 (0.0%) |
Technology Access in Chase Crossing
Computing Device Access in Chase Crossing
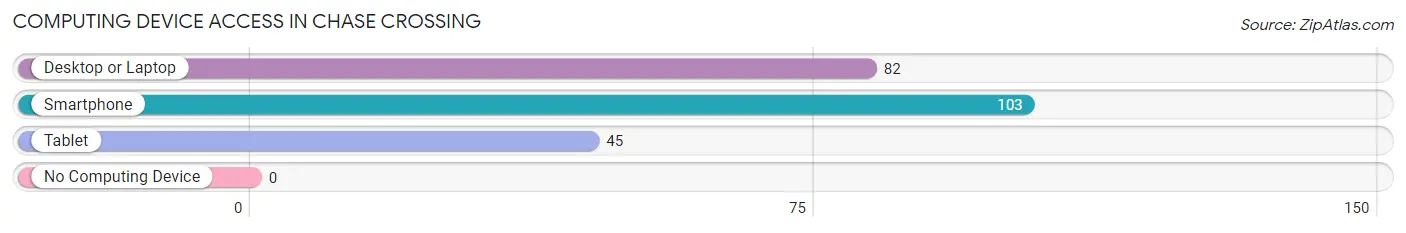
| Device Type | # Households | % Households |
| Desktop or Laptop | 82 | 79.6% |
| Smartphone | 103 | 100.0% |
| Tablet | 45 | 43.7% |
| No Computing Device | 0 | 0.0% |
| Total | 103 | 100.0% |
Internet Access in Chase Crossing
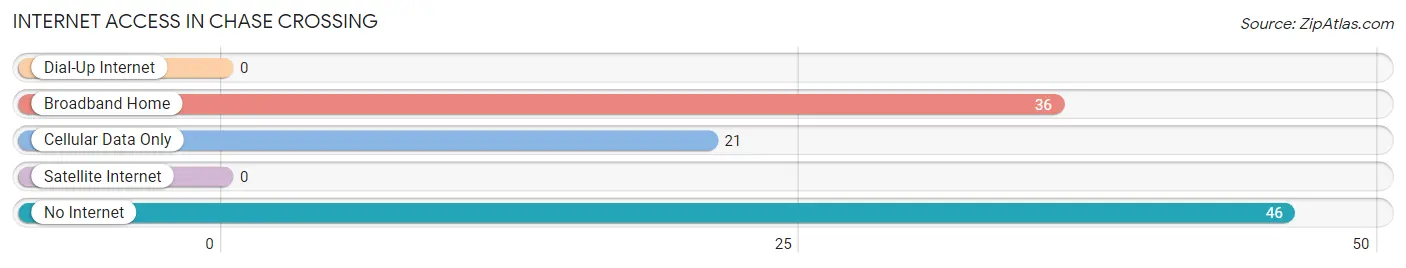
| Internet Type | # Households | % Households |
| Dial-Up Internet | 0 | 0.0% |
| Broadband Home | 36 | 34.9% |
| Cellular Data Only | 21 | 20.4% |
| Satellite Internet | 0 | 0.0% |
| No Internet | 46 | 44.7% |
| Total | 103 | 100.0% |
Chase Crossing Summary
Chase Crossing, Virginia is a small town located in the northern part of the state, near the border of West Virginia. It is situated in the Shenandoah Valley, and is part of the Winchester, Virginia metropolitan area. The town has a population of approximately 1,000 people, and is known for its rural charm and small-town atmosphere.
History
Chase Crossing was founded in 1820 by a group of settlers from Pennsylvania. The town was named after the Chase family, who were among the first settlers. The town was originally a farming community, and the main crops grown were wheat, corn, and tobacco. The town also had a few small businesses, such as a general store and a blacksmith shop.
In the late 19th century, the town began to grow and develop. The railroad came to town in 1883, and this allowed for the transportation of goods and people. This helped to spur the growth of the town, and it soon became a popular destination for tourists.
Geography
Chase Crossing is located in the northern part of Virginia, near the border of West Virginia. It is situated in the Shenandoah Valley, and is part of the Winchester, Virginia metropolitan area. The town is located in the foothills of the Blue Ridge Mountains, and is surrounded by rolling hills and lush forests. The town is located near the Shenandoah River, and is a popular destination for fishing and other outdoor activities.
Economy
The economy of Chase Crossing is largely based on agriculture and tourism. The town is home to several farms, which produce a variety of crops, including wheat, corn, and tobacco. The town is also home to several wineries, which produce a variety of wines. Tourism is also an important part of the economy, as the town is a popular destination for outdoor activities, such as fishing, hiking, and camping.
Demographics
As of the 2010 census, the population of Chase Crossing was 1,000 people. The racial makeup of the town was 95.2% White, 1.2% African American, 0.8% Native American, 0.4% Asian, and 2.4% from other races. The median household income was $41,250, and the median family income was $50,000. The town has a high rate of homeownership, with over 80% of the population owning their own homes.
Conclusion
Chase Crossing, Virginia is a small town located in the northern part of the state, near the border of West Virginia. It is situated in the Shenandoah Valley, and is part of the Winchester, Virginia metropolitan area. The town has a population of approximately 1,000 people, and is known for its rural charm and small-town atmosphere. The economy of Chase Crossing is largely based on agriculture and tourism, and the town is home to several farms and wineries. The town also has a high rate of homeownership, with over 80% of the population owning their own homes.
Common Questions
What is the Total Population of Chase Crossing?
Total Population of Chase Crossing is 502.
What is the Total Male Population of Chase Crossing?
Total Male Population of Chase Crossing is 39.
What is the Total Female Population of Chase Crossing?
Total Female Population of Chase Crossing is 463.
What is the Ratio of Males per 100 Females in Chase Crossing?
There are 8.42 Males per 100 Females in Chase Crossing.
What is the Ratio of Females per 100 Males in Chase Crossing?
There are 1,187.18 Females per 100 Males in Chase Crossing.
What is the Median Population Age in Chase Crossing?
Median Population Age in Chase Crossing is 18.3 Years.
What is the Average Family Size in Chase Crossing
Average Family Size in Chase Crossing is 4.9 People.
What is the Average Household Size in Chase Crossing
Average Household Size in Chase Crossing is 4.9 People.
What is Per Capita Income in Chase Crossing?
Per Capita income in Chase Crossing is $10,853.
What is Inequality or Gini Index in Chase Crossing?
Inequality or Gini Index in Chase Crossing is 0.38.
How Large is the Labor Force in Chase Crossing?
There are 229 People in the Labor Forcein in Chase Crossing.
What is the Percentage of People in the Labor Force in Chase Crossing?
79.8% of People are in the Labor Force in Chase Crossing.
What is the Unemployment Rate in Chase Crossing?
Unemployment Rate in Chase Crossing is 25.8%.