Henrico County, VA
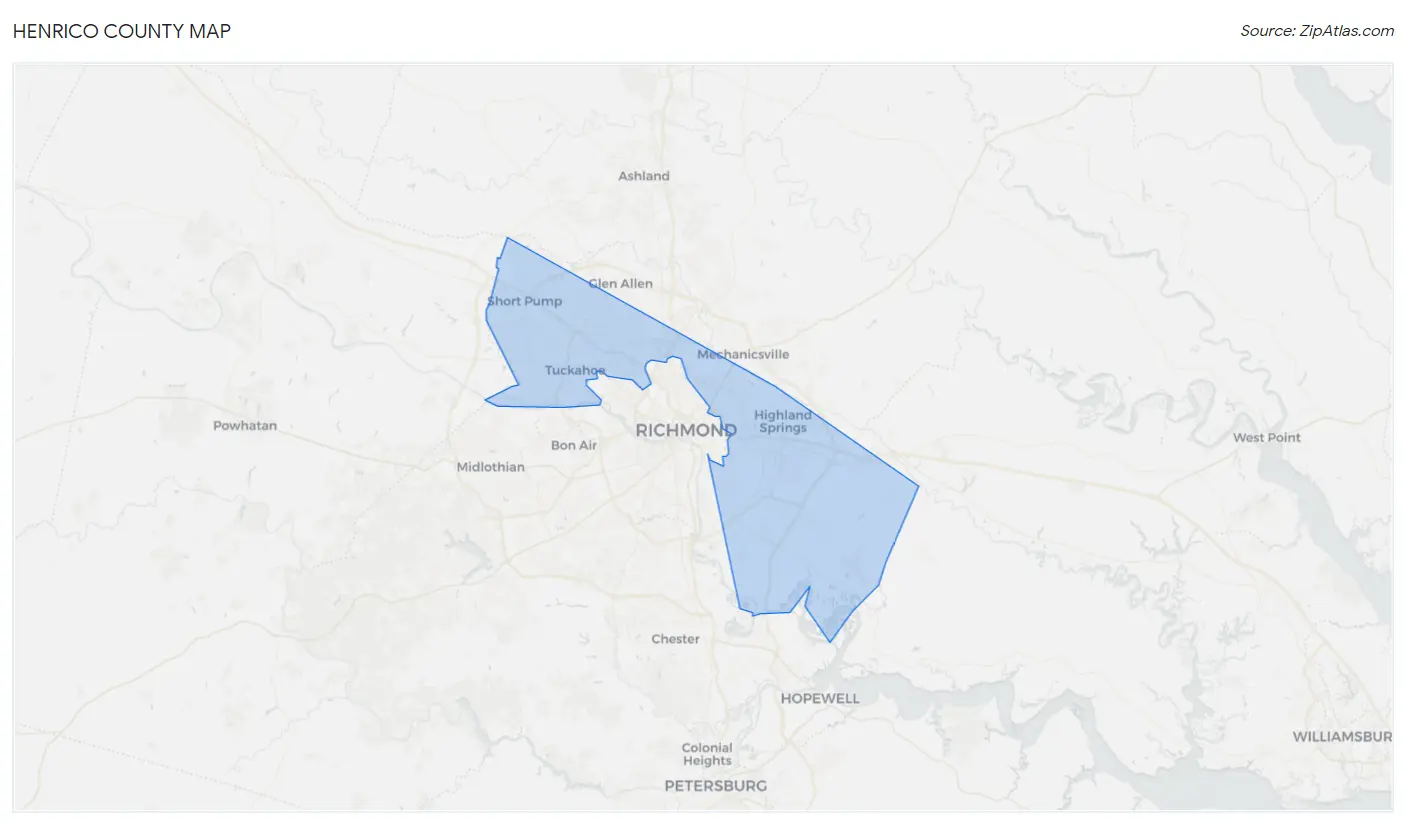
Henrico County Map
Henrico County Overview
333,120
TOTAL POPULATION
159,152
MALE POPULATION
173,968
FEMALE POPULATION
91.48
MALES / 100 FEMALES
109.31
FEMALES / 100 MALES
39.3
MEDIAN AGE
3.1
AVG FAMILY SIZE
2.5
AVG HOUSEHOLD SIZE
$47,865
PER CAPITA INCOME
$109,916
AVG FAMILY INCOME
$82,424
AVG HOUSEHOLD INCOME
22.0%
WAGE / INCOME GAP [ % ]
78.0¢/ $1
WAGE / INCOME GAP [ $ ]
$10,260
FAMILY INCOME DEFICIT
0.47
INEQUALITY / GINI INDEX
184,628
LABOR FORCE [ PEOPLE ]
69.1%
PERCENT IN LABOR FORCE
3.9%
UNEMPLOYMENT RATE
Henrico County Area Codes
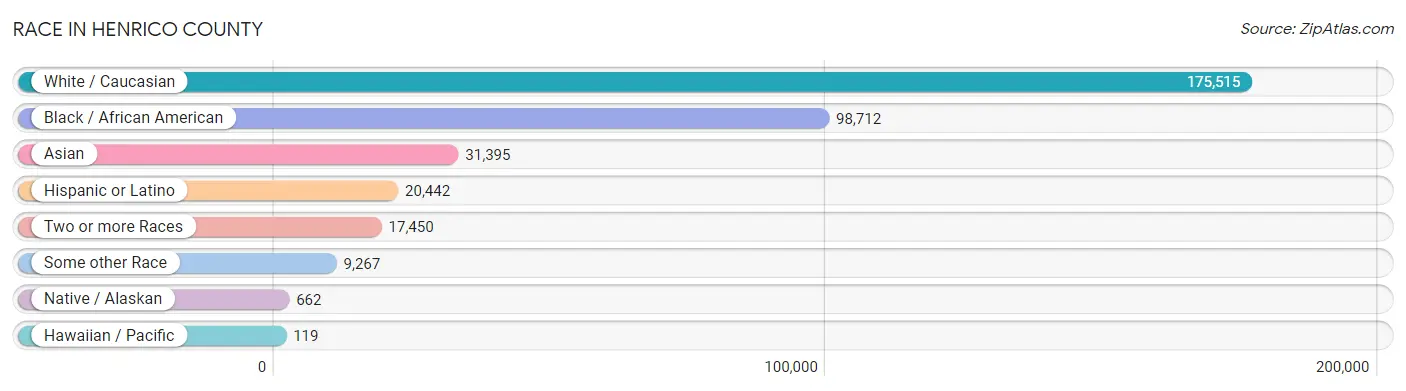
Race in Henrico County
The most populous races in Henrico County are White / Caucasian (175,515 | 52.7%), Black / African American (98,712 | 29.6%), and Asian (31,395 | 9.4%).
| Race | # Population | % Population |
| Asian | 31,395 | 9.4% |
| Black / African American | 98,712 | 29.6% |
| Hawaiian / Pacific | 119 | 0.0% |
| Hispanic or Latino | 20,442 | 6.1% |
| Native / Alaskan | 662 | 0.2% |
| White / Caucasian | 175,515 | 52.7% |
| Two or more Races | 17,450 | 5.2% |
| Some other Race | 9,267 | 2.8% |
| Total | 333,120 | 100.0% |
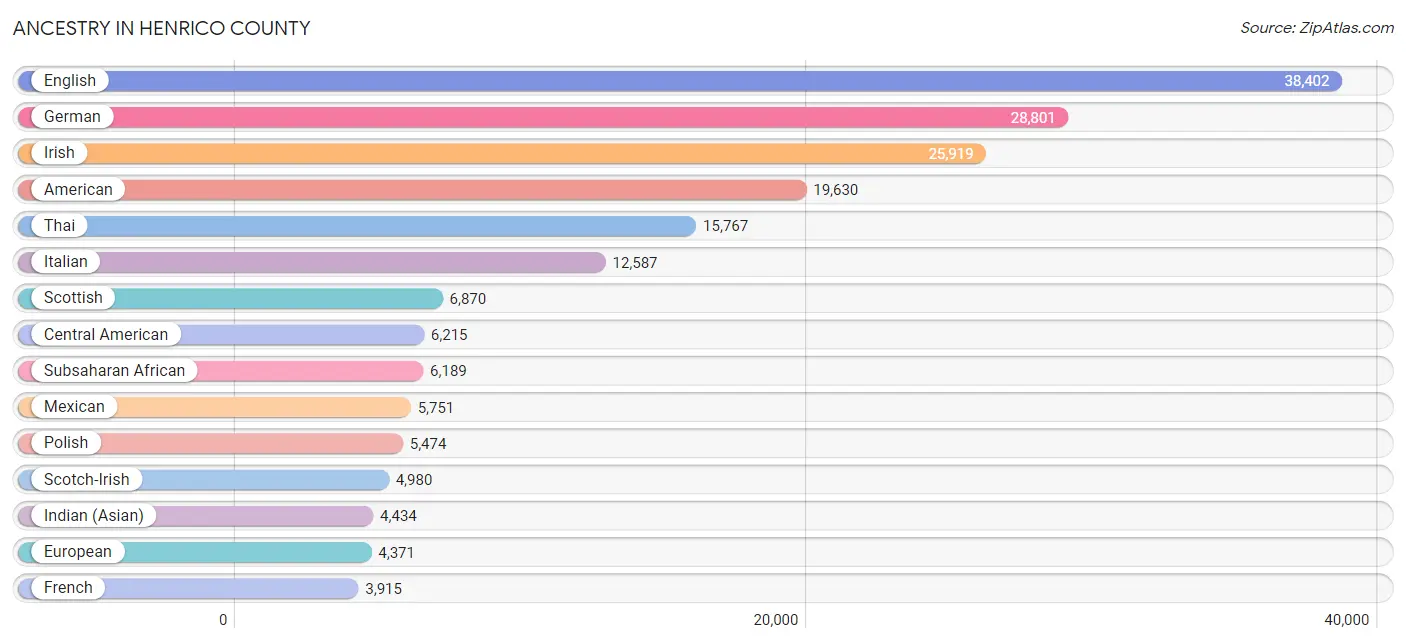
Ancestry in Henrico County
The most populous ancestries reported in Henrico County are English (38,402 | 11.5%), German (28,801 | 8.6%), Irish (25,919 | 7.8%), American (19,630 | 5.9%), and Thai (15,767 | 4.7%), together accounting for 38.6% of all Henrico County residents.
| Ancestry | # Population | % Population |
| Afghan | 742 | 0.2% |
| African | 2,896 | 0.9% |
| Albanian | 57 | 0.0% |
| American | 19,630 | 5.9% |
| Apache | 59 | 0.0% |
| Arab | 3,511 | 1.1% |
| Argentinean | 274 | 0.1% |
| Armenian | 282 | 0.1% |
| Australian | 55 | 0.0% |
| Austrian | 596 | 0.2% |
| Bahamian | 48 | 0.0% |
| Barbadian | 31 | 0.0% |
| Basque | 8 | 0.0% |
| Belgian | 187 | 0.1% |
| Belizean | 68 | 0.0% |
| Bhutanese | 1,092 | 0.3% |
| Blackfeet | 70 | 0.0% |
| Bolivian | 91 | 0.0% |
| Brazilian | 963 | 0.3% |
| British | 2,731 | 0.8% |
| British West Indian | 64 | 0.0% |
| Bulgarian | 101 | 0.0% |
| Burmese | 2,093 | 0.6% |
| Cajun | 98 | 0.0% |
| Canadian | 518 | 0.2% |
| Cape Verdean | 22 | 0.0% |
| Celtic | 24 | 0.0% |
| Central American | 6,215 | 1.9% |
| Central American Indian | 311 | 0.1% |
| Cherokee | 1,063 | 0.3% |
| Cheyenne | 6 | 0.0% |
| Chickasaw | 5 | 0.0% |
| Chilean | 218 | 0.1% |
| Choctaw | 130 | 0.0% |
| Colombian | 510 | 0.2% |
| Costa Rican | 40 | 0.0% |
| Creek | 78 | 0.0% |
| Croatian | 107 | 0.0% |
| Crow | 48 | 0.0% |
| Cuban | 884 | 0.3% |
| Czech | 576 | 0.2% |
| Czechoslovakian | 224 | 0.1% |
| Danish | 466 | 0.1% |
| Dominican | 612 | 0.2% |
| Dutch | 1,632 | 0.5% |
| Eastern European | 864 | 0.3% |
| Ecuadorian | 144 | 0.0% |
| Egyptian | 988 | 0.3% |
| English | 38,402 | 11.5% |
| Ethiopian | 871 | 0.3% |
| European | 4,371 | 1.3% |
| Filipino | 129 | 0.0% |
| Finnish | 131 | 0.0% |
| French | 3,915 | 1.2% |
| French American Indian | 31 | 0.0% |
| French Canadian | 967 | 0.3% |
| German | 28,801 | 8.6% |
| German Russian | 8 | 0.0% |
| Ghanaian | 267 | 0.1% |
| Greek | 1,639 | 0.5% |
| Guamanian / Chamorro | 68 | 0.0% |
| Guatemalan | 1,602 | 0.5% |
| Guyanese | 242 | 0.1% |
| Haitian | 417 | 0.1% |
| Honduran | 1,034 | 0.3% |
| Hungarian | 805 | 0.2% |
| Indian (Asian) | 4,434 | 1.3% |
| Indonesian | 336 | 0.1% |
| Iranian | 546 | 0.2% |
| Iraqi | 435 | 0.1% |
| Irish | 25,919 | 7.8% |
| Israeli | 102 | 0.0% |
| Italian | 12,587 | 3.8% |
| Jamaican | 1,106 | 0.3% |
| Japanese | 1,017 | 0.3% |
| Jordanian | 8 | 0.0% |
| Kenyan | 148 | 0.0% |
| Korean | 2,691 | 0.8% |
| Laotian | 11 | 0.0% |
| Latvian | 141 | 0.0% |
| Lebanese | 1,184 | 0.4% |
| Liberian | 266 | 0.1% |
| Lithuanian | 419 | 0.1% |
| Lumbee | 108 | 0.0% |
| Luxembourger | 9 | 0.0% |
| Macedonian | 21 | 0.0% |
| Malaysian | 122 | 0.0% |
| Maltese | 23 | 0.0% |
| Mexican | 5,751 | 1.7% |
| Mexican American Indian | 276 | 0.1% |
| Mongolian | 15 | 0.0% |
| Moroccan | 160 | 0.1% |
| Native Hawaiian | 55 | 0.0% |
| Navajo | 8 | 0.0% |
| Nicaraguan | 642 | 0.2% |
| Nigerian | 642 | 0.2% |
| Northern European | 564 | 0.2% |
| Norwegian | 1,034 | 0.3% |
| Pakistani | 96 | 0.0% |
| Palestinian | 141 | 0.0% |
| Panamanian | 260 | 0.1% |
| Paraguayan | 154 | 0.1% |
| Pennsylvania German | 60 | 0.0% |
| Peruvian | 154 | 0.1% |
| Polish | 5,474 | 1.6% |
| Portuguese | 704 | 0.2% |
| Potawatomi | 15 | 0.0% |
| Pueblo | 8 | 0.0% |
| Puerto Rican | 3,006 | 0.9% |
| Romanian | 468 | 0.1% |
| Russian | 2,062 | 0.6% |
| Salvadoran | 2,637 | 0.8% |
| Samoan | 30 | 0.0% |
| Scandinavian | 425 | 0.1% |
| Scotch-Irish | 4,980 | 1.5% |
| Scottish | 6,870 | 2.1% |
| Seminole | 121 | 0.0% |
| Serbian | 56 | 0.0% |
| Sierra Leonean | 97 | 0.0% |
| Sioux | 99 | 0.0% |
| Slavic | 124 | 0.0% |
| Slovak | 430 | 0.1% |
| Slovene | 49 | 0.0% |
| South African | 18 | 0.0% |
| South American | 2,409 | 0.7% |
| South American Indian | 4 | 0.0% |
| Soviet Union | 28 | 0.0% |
| Spaniard | 624 | 0.2% |
| Spanish | 349 | 0.1% |
| Spanish American Indian | 23 | 0.0% |
| Sri Lankan | 3,903 | 1.2% |
| Subsaharan African | 6,189 | 1.9% |
| Sudanese | 306 | 0.1% |
| Swedish | 1,697 | 0.5% |
| Swiss | 273 | 0.1% |
| Syrian | 91 | 0.0% |
| Thai | 15,767 | 4.7% |
| Tongan | 64 | 0.0% |
| Trinidadian and Tobagonian | 255 | 0.1% |
| Turkish | 347 | 0.1% |
| U.S. Virgin Islander | 26 | 0.0% |
| Ugandan | 1 | 0.0% |
| Ukrainian | 990 | 0.3% |
| Uruguayan | 25 | 0.0% |
| Venezuelan | 637 | 0.2% |
| Vietnamese | 394 | 0.1% |
| Welsh | 1,903 | 0.6% |
| West Indian | 470 | 0.1% |
| Yaqui | 24 | 0.0% |
| Yugoslavian | 551 | 0.2% | View All 150 Rows |
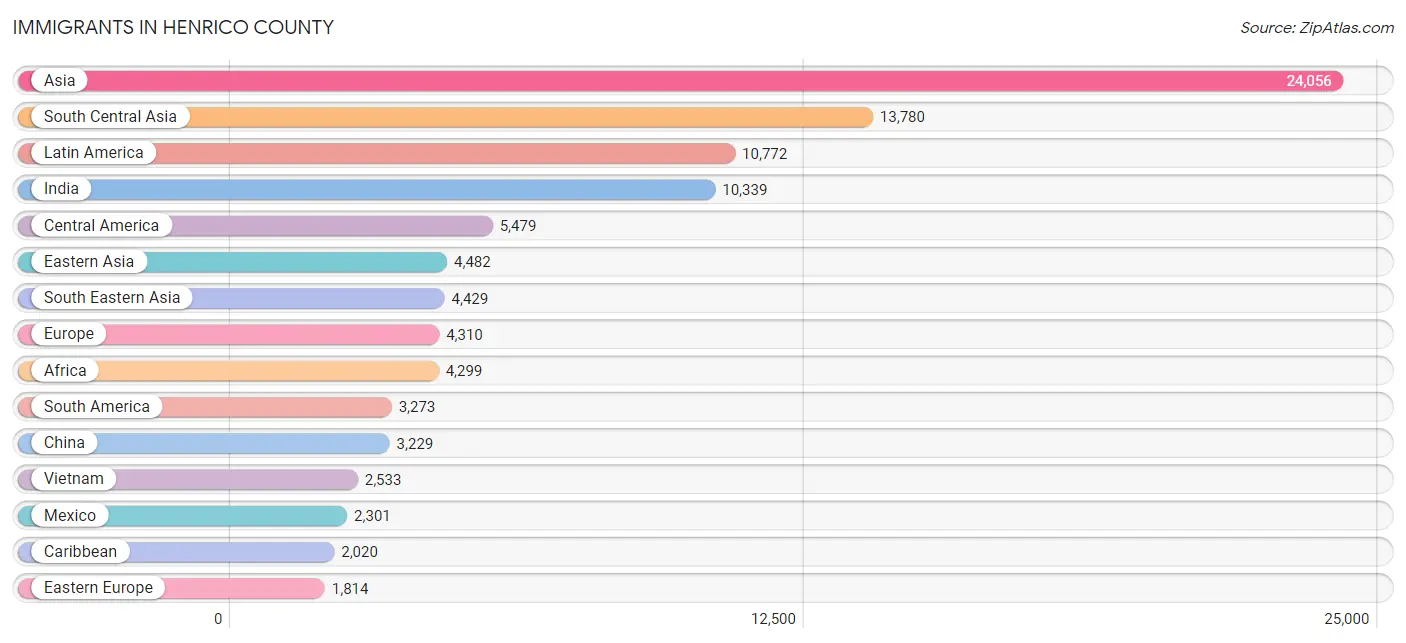
Immigrants in Henrico County
The most numerous immigrant groups reported in Henrico County came from Asia (24,056 | 7.2%), South Central Asia (13,780 | 4.1%), Latin America (10,772 | 3.2%), India (10,339 | 3.1%), and Central America (5,479 | 1.6%), together accounting for 19.3% of all Henrico County residents.
| Immigration Origin | # Population | % Population |
| Afghanistan | 784 | 0.2% |
| Africa | 4,299 | 1.3% |
| Argentina | 201 | 0.1% |
| Asia | 24,056 | 7.2% |
| Australia | 55 | 0.0% |
| Austria | 50 | 0.0% |
| Bahamas | 26 | 0.0% |
| Bangladesh | 408 | 0.1% |
| Barbados | 31 | 0.0% |
| Belarus | 23 | 0.0% |
| Belize | 31 | 0.0% |
| Bolivia | 59 | 0.0% |
| Bosnia and Herzegovina | 403 | 0.1% |
| Brazil | 968 | 0.3% |
| Bulgaria | 71 | 0.0% |
| Cambodia | 461 | 0.1% |
| Cameroon | 56 | 0.0% |
| Canada | 753 | 0.2% |
| Caribbean | 2,020 | 0.6% |
| Central America | 5,479 | 1.6% |
| Chile | 114 | 0.0% |
| China | 3,229 | 1.0% |
| Colombia | 424 | 0.1% |
| Congo | 43 | 0.0% |
| Costa Rica | 23 | 0.0% |
| Croatia | 16 | 0.0% |
| Cuba | 263 | 0.1% |
| Czechoslovakia | 148 | 0.0% |
| Dominican Republic | 319 | 0.1% |
| Eastern Africa | 1,124 | 0.3% |
| Eastern Asia | 4,482 | 1.3% |
| Eastern Europe | 1,814 | 0.5% |
| Ecuador | 163 | 0.1% |
| Egypt | 993 | 0.3% |
| El Salvador | 1,614 | 0.5% |
| England | 718 | 0.2% |
| Eritrea | 3 | 0.0% |
| Ethiopia | 771 | 0.2% |
| Europe | 4,310 | 1.3% |
| Fiji | 7 | 0.0% |
| France | 41 | 0.0% |
| Germany | 475 | 0.1% |
| Ghana | 233 | 0.1% |
| Greece | 204 | 0.1% |
| Grenada | 40 | 0.0% |
| Guatemala | 932 | 0.3% |
| Guyana | 316 | 0.1% |
| Haiti | 110 | 0.0% |
| Honduras | 461 | 0.1% |
| Hong Kong | 30 | 0.0% |
| Hungary | 30 | 0.0% |
| India | 10,339 | 3.1% |
| Indonesia | 11 | 0.0% |
| Iran | 490 | 0.2% |
| Iraq | 568 | 0.2% |
| Ireland | 156 | 0.1% |
| Israel | 51 | 0.0% |
| Italy | 329 | 0.1% |
| Jamaica | 640 | 0.2% |
| Japan | 172 | 0.1% |
| Jordan | 46 | 0.0% |
| Kazakhstan | 9 | 0.0% |
| Kenya | 159 | 0.1% |
| Korea | 1,081 | 0.3% |
| Kuwait | 22 | 0.0% |
| Laos | 33 | 0.0% |
| Latin America | 10,772 | 3.2% |
| Latvia | 24 | 0.0% |
| Lebanon | 380 | 0.1% |
| Liberia | 395 | 0.1% |
| Lithuania | 23 | 0.0% |
| Malaysia | 61 | 0.0% |
| Mexico | 2,301 | 0.7% |
| Middle Africa | 161 | 0.1% |
| Moldova | 24 | 0.0% |
| Morocco | 82 | 0.0% |
| Nepal | 473 | 0.1% |
| Netherlands | 29 | 0.0% |
| Nicaragua | 56 | 0.0% |
| Nigeria | 62 | 0.0% |
| Northern Africa | 1,495 | 0.4% |
| Northern Europe | 1,247 | 0.4% |
| Norway | 33 | 0.0% |
| Oceania | 123 | 0.0% |
| Pakistan | 602 | 0.2% |
| Panama | 61 | 0.0% |
| Peru | 117 | 0.0% |
| Philippines | 902 | 0.3% |
| Poland | 85 | 0.0% |
| Portugal | 121 | 0.0% |
| Romania | 64 | 0.0% |
| Russia | 614 | 0.2% |
| Saudi Arabia | 65 | 0.0% |
| Scotland | 19 | 0.0% |
| Sierra Leone | 220 | 0.1% |
| Singapore | 48 | 0.0% |
| South Africa | 160 | 0.1% |
| South America | 3,273 | 1.0% |
| South Central Asia | 13,780 | 4.1% |
| South Eastern Asia | 4,429 | 1.3% |
| Southern Europe | 654 | 0.2% |
| Sri Lanka | 178 | 0.1% |
| Sudan | 402 | 0.1% |
| Sweden | 40 | 0.0% |
| Taiwan | 391 | 0.1% |
| Thailand | 104 | 0.0% |
| Trinidad and Tobago | 255 | 0.1% |
| Turkey | 107 | 0.0% |
| Ukraine | 246 | 0.1% |
| Uruguay | 3 | 0.0% |
| Uzbekistan | 73 | 0.0% |
| Venezuela | 802 | 0.2% |
| Vietnam | 2,533 | 0.8% |
| West Indies | 243 | 0.1% |
| Western Africa | 1,092 | 0.3% |
| Western Asia | 1,360 | 0.4% |
| Western Europe | 595 | 0.2% |
| Zaire | 62 | 0.0% |
| Zimbabwe | 26 | 0.0% | View All 119 Rows |
Sex and Age in Henrico County
Sex and Age in Henrico County
The most populous age groups in Henrico County are 30 to 34 Years (11,690 | 7.3%) for men and 30 to 34 Years (12,494 | 7.2%) for women.
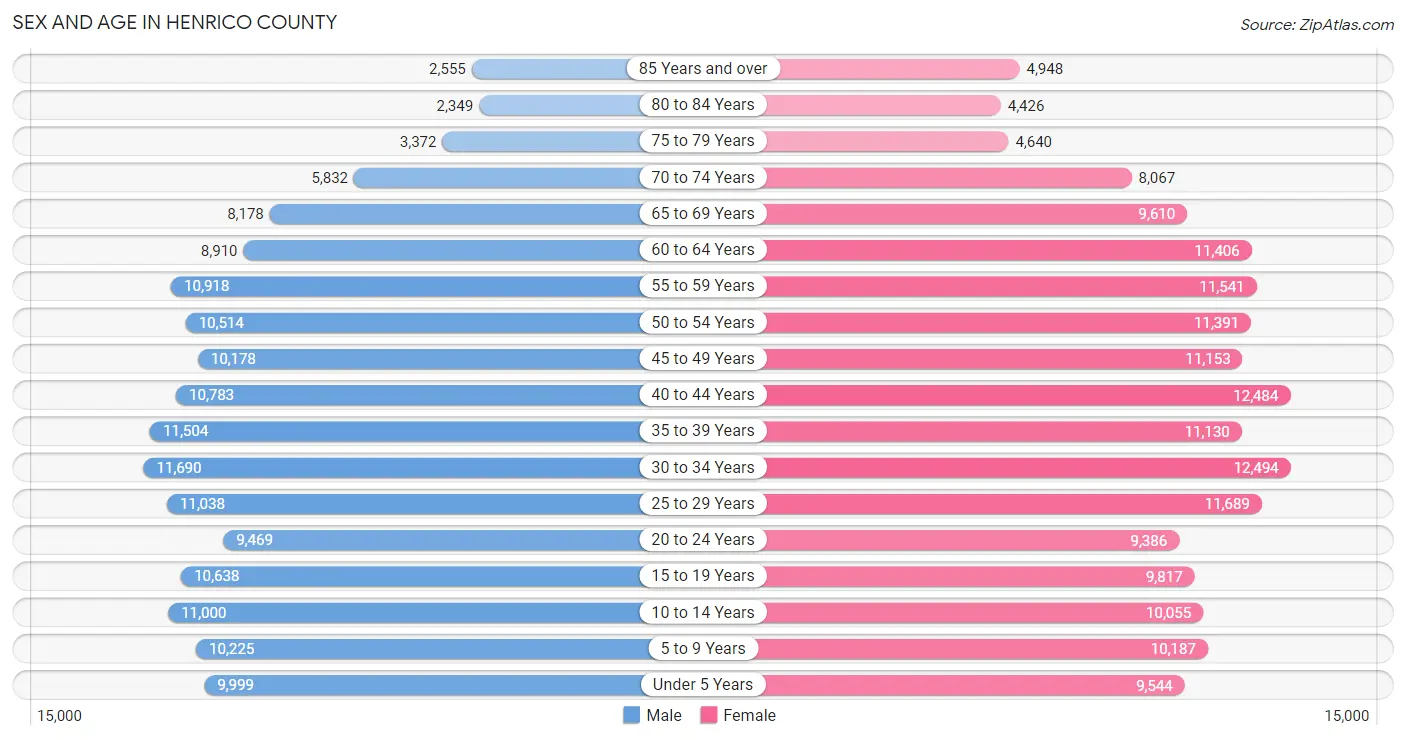
| Age Bracket | Male | Female |
| Under 5 Years | 9,999 (6.3%) | 9,544 (5.5%) |
| 5 to 9 Years | 10,225 (6.4%) | 10,187 (5.9%) |
| 10 to 14 Years | 11,000 (6.9%) | 10,055 (5.8%) |
| 15 to 19 Years | 10,638 (6.7%) | 9,817 (5.6%) |
| 20 to 24 Years | 9,469 (5.9%) | 9,386 (5.4%) |
| 25 to 29 Years | 11,038 (6.9%) | 11,689 (6.7%) |
| 30 to 34 Years | 11,690 (7.3%) | 12,494 (7.2%) |
| 35 to 39 Years | 11,504 (7.2%) | 11,130 (6.4%) |
| 40 to 44 Years | 10,783 (6.8%) | 12,484 (7.2%) |
| 45 to 49 Years | 10,178 (6.4%) | 11,153 (6.4%) |
| 50 to 54 Years | 10,514 (6.6%) | 11,391 (6.6%) |
| 55 to 59 Years | 10,918 (6.9%) | 11,541 (6.6%) |
| 60 to 64 Years | 8,910 (5.6%) | 11,406 (6.6%) |
| 65 to 69 Years | 8,178 (5.1%) | 9,610 (5.5%) |
| 70 to 74 Years | 5,832 (3.7%) | 8,067 (4.6%) |
| 75 to 79 Years | 3,372 (2.1%) | 4,640 (2.7%) |
| 80 to 84 Years | 2,349 (1.5%) | 4,426 (2.5%) |
| 85 Years and over | 2,555 (1.6%) | 4,948 (2.8%) |
| Total | 159,152 (100.0%) | 173,968 (100.0%) |
Families and Households in Henrico County
Median Family Size in Henrico County
The median family size in Henrico County is 3.13 persons per family, with married-couple families (59,847 | 71.4%) accounting for the largest median family size of 3.16 persons per family. On the other hand, single male/father families (5,419 | 6.5%) represent the smallest median family size with 2.72 persons per family.
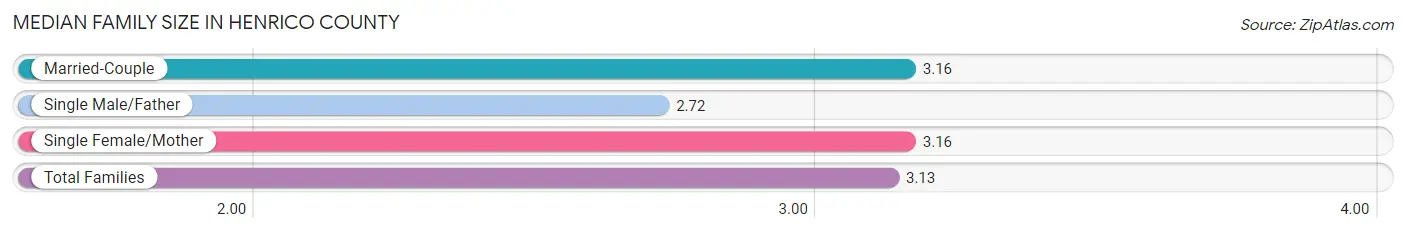
| Family Type | # Families | Family Size |
| Married-Couple | 59,847 (71.4%) | 3.16 |
| Single Male/Father | 5,419 (6.5%) | 2.72 |
| Single Female/Mother | 18,522 (22.1%) | 3.16 |
| Total Families | 83,788 (100.0%) | 3.13 |
Median Household Size in Henrico County
The median household size in Henrico County is 2.46 persons per household, with single female/mother households (18,522 | 13.8%) accounting for the largest median household size of 3.29 persons per household. non-family households (50,306 | 37.5%) represent the smallest median household size with 1.24 persons per household.
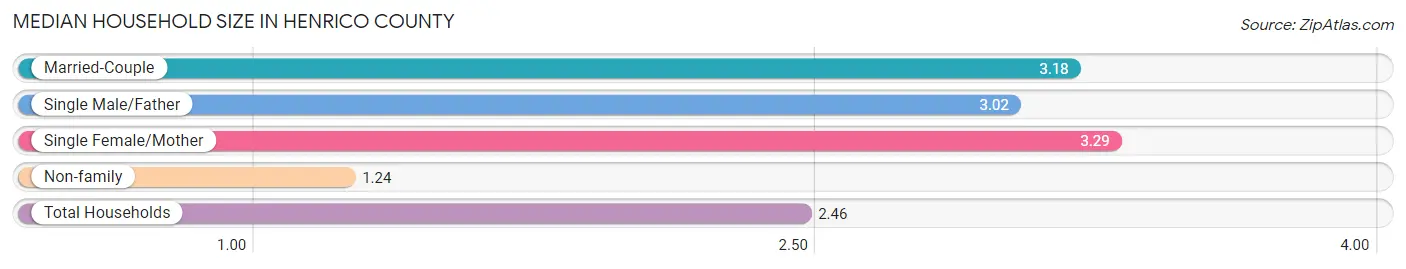
| Household Type | # Households | Household Size |
| Married-Couple | 59,847 (44.6%) | 3.18 |
| Single Male/Father | 5,419 (4.0%) | 3.02 |
| Single Female/Mother | 18,522 (13.8%) | 3.29 |
| Non-family | 50,306 (37.5%) | 1.24 |
| Total Households | 134,094 (100.0%) | 2.46 |
Household Size by Marriage Status in Henrico County
Out of a total of 134,094 households in Henrico County, 83,788 (62.5%) are family households, while 50,306 (37.5%) are nonfamily households. The most numerous type of family households are 2-person households, comprising 37,058, and the most common type of nonfamily households are 1-person households, comprising 41,759.
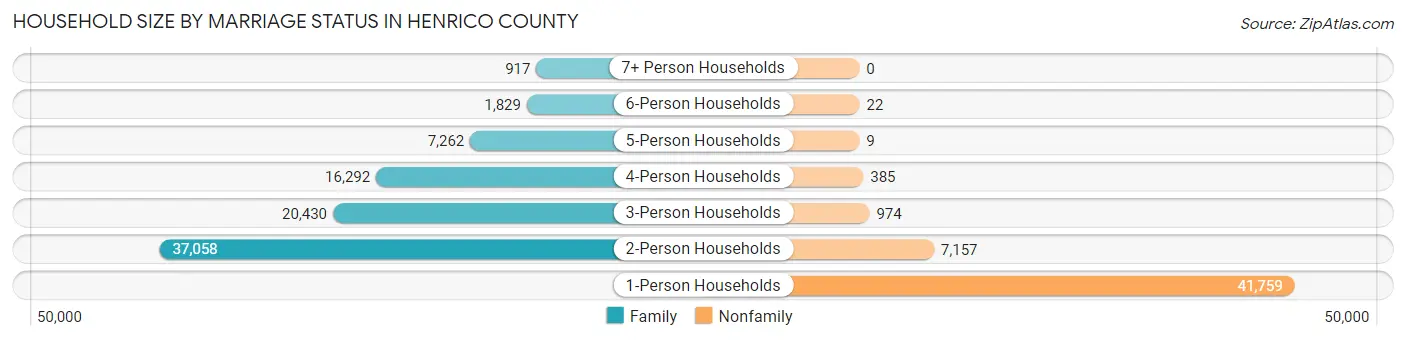
| Household Size | Family Households | Nonfamily Households |
| 1-Person Households | - | 41,759 (31.1%) |
| 2-Person Households | 37,058 (27.6%) | 7,157 (5.3%) |
| 3-Person Households | 20,430 (15.2%) | 974 (0.7%) |
| 4-Person Households | 16,292 (12.1%) | 385 (0.3%) |
| 5-Person Households | 7,262 (5.4%) | 9 (0.0%) |
| 6-Person Households | 1,829 (1.4%) | 22 (0.0%) |
| 7+ Person Households | 917 (0.7%) | 0 (0.0%) |
| Total | 83,788 (62.5%) | 50,306 (37.5%) |
Female Fertility in Henrico County
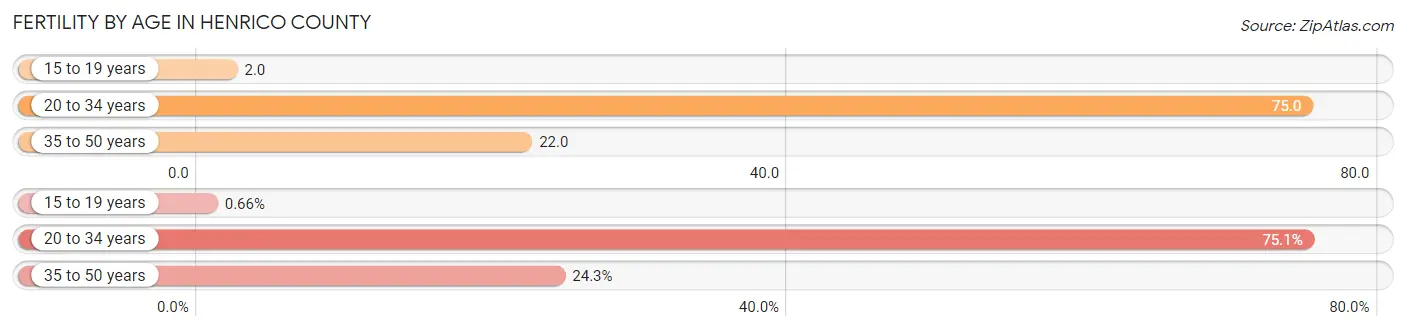
Fertility by Age in Henrico County
Average fertility rate in Henrico County is 41.0 births per 1,000 women. Women in the age bracket of 20 to 34 years have the highest fertility rate with 75.0 births per 1,000 women. Women in the age bracket of 20 to 34 years acount for 75.1% of all women with births.
| Age Bracket | Women with Births | Births / 1,000 Women |
| 15 to 19 years | 22 (0.7%) | 2.0 |
| 20 to 34 years | 2,502 (75.1%) | 75.0 |
| 35 to 50 years | 808 (24.2%) | 22.0 |
| Total | 3,332 (100.0%) | 41.0 |
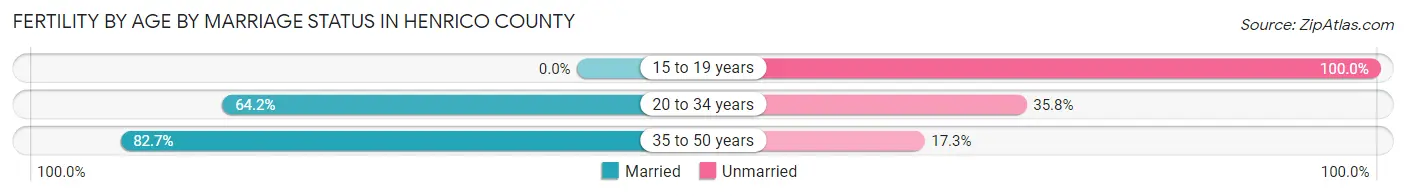
Fertility by Age by Marriage Status in Henrico County
68.2% of women with births (3,332) in Henrico County are married. The highest percentage of unmarried women with births falls into 15 to 19 years age bracket with 100.0% of them unmarried at the time of birth, while the lowest percentage of unmarried women with births belong to 35 to 50 years age bracket with 17.3% of them unmarried.
| Age Bracket | Married | Unmarried |
| 15 to 19 years | 0 (0.0%) | 22 (100.0%) |
| 20 to 34 years | 1,606 (64.2%) | 896 (35.8%) |
| 35 to 50 years | 668 (82.7%) | 140 (17.3%) |
| Total | 2,272 (68.2%) | 1,060 (31.8%) |
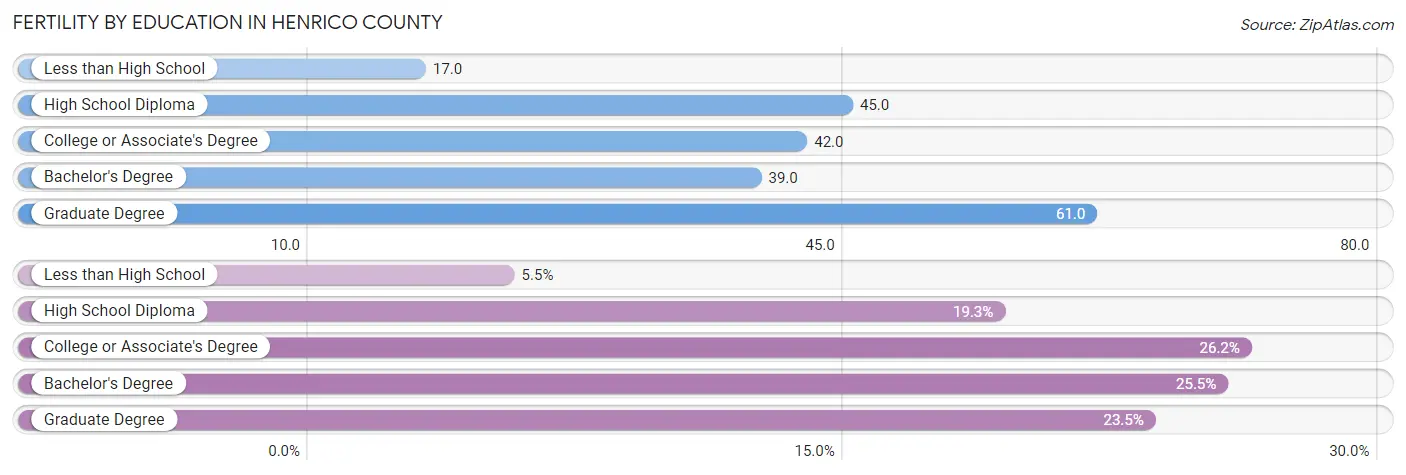
Fertility by Education in Henrico County
Average fertility rate in Henrico County is 41.0 births per 1,000 women. Women with the education attainment of graduate degree have the highest fertility rate of 61.0 births per 1,000 women, while women with the education attainment of less than high school have the lowest fertility at 17.0 births per 1,000 women. Women with the education attainment of college or associate's degree represent 26.2% of all women with births.
| Educational Attainment | Women with Births | Births / 1,000 Women |
| Less than High School | 183 (5.5%) | 17.0 |
| High School Diploma | 642 (19.3%) | 45.0 |
| College or Associate's Degree | 873 (26.2%) | 42.0 |
| Bachelor's Degree | 851 (25.5%) | 39.0 |
| Graduate Degree | 783 (23.5%) | 61.0 |
| Total | 3,332 (100.0%) | 41.0 |
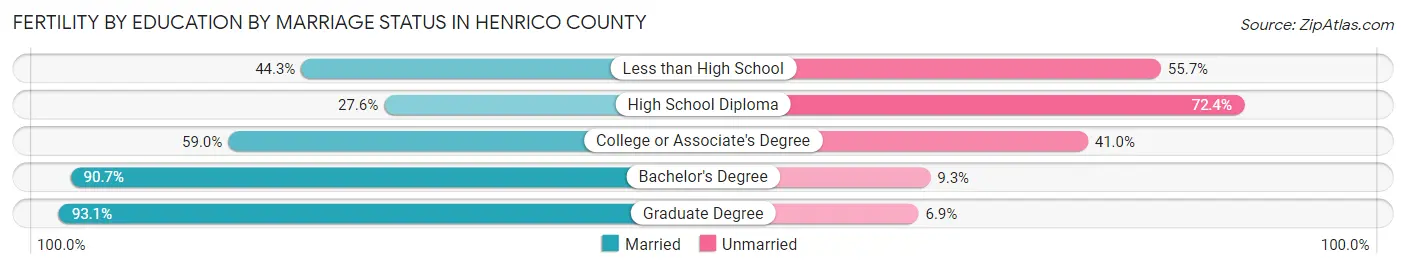
Fertility by Education by Marriage Status in Henrico County
31.8% of women with births in Henrico County are unmarried. Women with the educational attainment of graduate degree are most likely to be married with 93.1% of them married at childbirth, while women with the educational attainment of high school diploma are least likely to be married with 72.4% of them unmarried at childbirth.
| Educational Attainment | Married | Unmarried |
| Less than High School | 81 (44.3%) | 102 (55.7%) |
| High School Diploma | 177 (27.6%) | 465 (72.4%) |
| College or Associate's Degree | 515 (59.0%) | 358 (41.0%) |
| Bachelor's Degree | 772 (90.7%) | 79 (9.3%) |
| Graduate Degree | 729 (93.1%) | 54 (6.9%) |
| Total | 2,272 (68.2%) | 1,060 (31.8%) |
Income in Henrico County
Income Overview in Henrico County
Per Capita Income in Henrico County is $47,865, while median incomes of families and households are $109,916 and $82,424 respectively.
| Characteristic | Number | Measure |
| Per Capita Income | 333,120 | $47,865 |
| Median Family Income | 83,788 | $109,916 |
| Mean Family Income | 83,788 | $142,163 |
| Median Household Income | 134,094 | $82,424 |
| Mean Household Income | 134,094 | $115,885 |
| Income Deficit | 83,788 | $10,260 |
| Wage / Income Gap (%) | 333,120 | 22.05% |
| Wage / Income Gap ($) | 333,120 | 77.95¢ per $1 |
| Gini / Inequality Index | 333,120 | 0.47 |
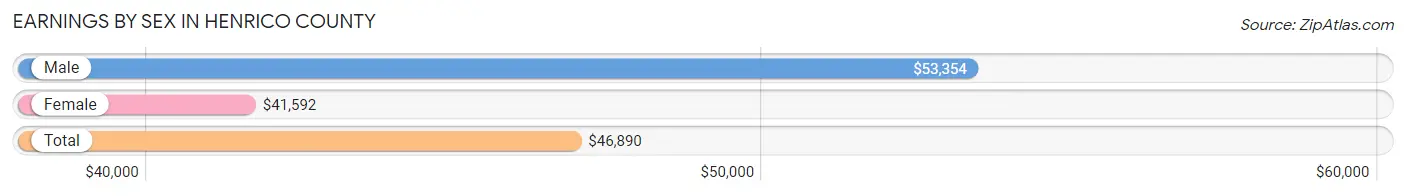
Earnings by Sex in Henrico County
Average Earnings in Henrico County are $46,890, $53,354 for men and $41,592 for women, a difference of 22.1%.
| Sex | Number | Average Earnings |
| Male | 97,589 (51.1%) | $53,354 |
| Female | 93,279 (48.9%) | $41,592 |
| Total | 190,868 (100.0%) | $46,890 |
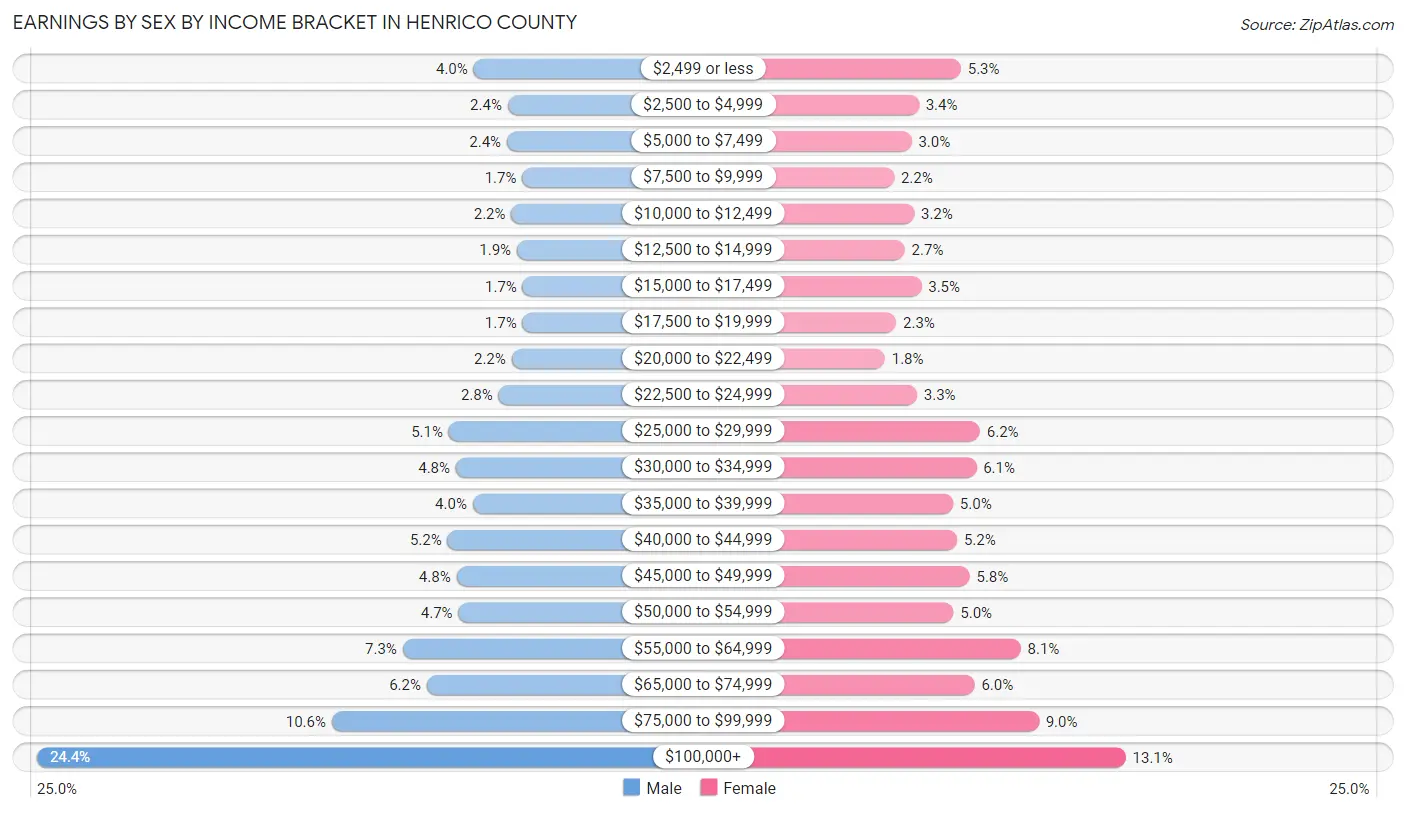
Earnings by Sex by Income Bracket in Henrico County
The most common earnings brackets in Henrico County are $100,000+ for men (23,832 | 24.4%) and $100,000+ for women (12,186 | 13.1%).
| Income | Male | Female |
| $2,499 or less | 3,878 (4.0%) | 4,984 (5.3%) |
| $2,500 to $4,999 | 2,316 (2.4%) | 3,143 (3.4%) |
| $5,000 to $7,499 | 2,353 (2.4%) | 2,826 (3.0%) |
| $7,500 to $9,999 | 1,653 (1.7%) | 2,064 (2.2%) |
| $10,000 to $12,499 | 2,146 (2.2%) | 2,935 (3.2%) |
| $12,500 to $14,999 | 1,893 (1.9%) | 2,524 (2.7%) |
| $15,000 to $17,499 | 1,626 (1.7%) | 3,259 (3.5%) |
| $17,500 to $19,999 | 1,640 (1.7%) | 2,153 (2.3%) |
| $20,000 to $22,499 | 2,133 (2.2%) | 1,663 (1.8%) |
| $22,500 to $24,999 | 2,735 (2.8%) | 3,063 (3.3%) |
| $25,000 to $29,999 | 5,004 (5.1%) | 5,809 (6.2%) |
| $30,000 to $34,999 | 4,684 (4.8%) | 5,656 (6.1%) |
| $35,000 to $39,999 | 3,918 (4.0%) | 4,632 (5.0%) |
| $40,000 to $44,999 | 5,060 (5.2%) | 4,809 (5.2%) |
| $45,000 to $49,999 | 4,659 (4.8%) | 5,368 (5.8%) |
| $50,000 to $54,999 | 4,569 (4.7%) | 4,655 (5.0%) |
| $55,000 to $64,999 | 7,119 (7.3%) | 7,589 (8.1%) |
| $65,000 to $74,999 | 6,013 (6.2%) | 5,575 (6.0%) |
| $75,000 to $99,999 | 10,358 (10.6%) | 8,386 (9.0%) |
| $100,000+ | 23,832 (24.4%) | 12,186 (13.1%) |
| Total | 97,589 (100.0%) | 93,279 (100.0%) |
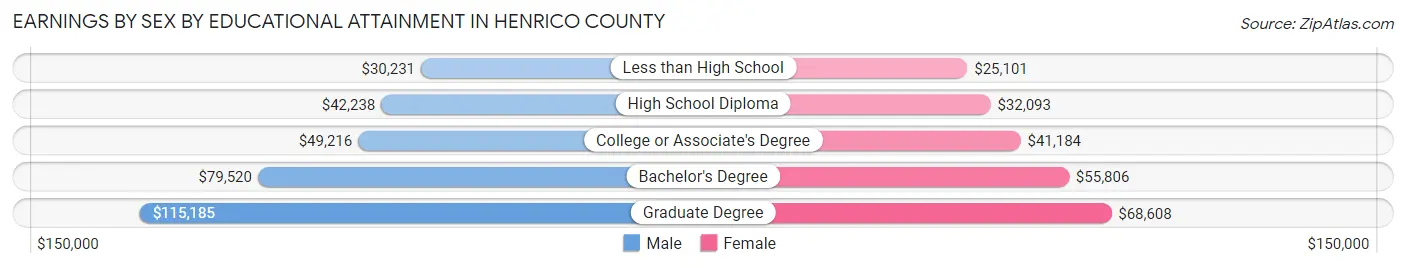
Earnings by Sex by Educational Attainment in Henrico County
Average earnings in Henrico County are $60,354 for men and $46,660 for women, a difference of 22.7%. Men with an educational attainment of graduate degree enjoy the highest average annual earnings of $115,185, while those with less than high school education earn the least with $30,231. Women with an educational attainment of graduate degree earn the most with the average annual earnings of $68,608, while those with less than high school education have the smallest earnings of $25,101.
| Educational Attainment | Male Income | Female Income |
| Less than High School | $30,231 | $25,101 |
| High School Diploma | $42,238 | $32,093 |
| College or Associate's Degree | $49,216 | $41,184 |
| Bachelor's Degree | $79,520 | $55,806 |
| Graduate Degree | $115,185 | $68,608 |
| Total | $60,354 | $46,660 |
Family Income in Henrico County
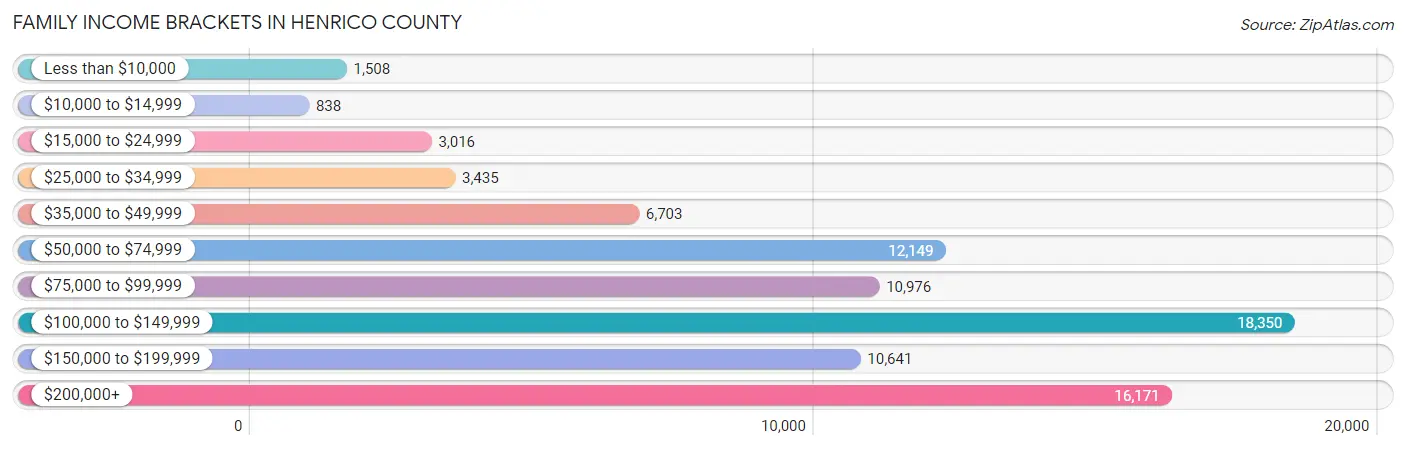
Family Income Brackets in Henrico County
According to the Henrico County family income data, there are 18,350 families falling into the $100,000 to $149,999 income range, which is the most common income bracket and makes up 21.9% of all families. Conversely, the $10,000 to $14,999 income bracket is the least frequent group with only 838 families (1.0%) belonging to this category.
| Income Bracket | # Families | % Families |
| Less than $10,000 | 1,508 | 1.8% |
| $10,000 to $14,999 | 838 | 1.0% |
| $15,000 to $24,999 | 3,016 | 3.6% |
| $25,000 to $34,999 | 3,435 | 4.1% |
| $35,000 to $49,999 | 6,703 | 8.0% |
| $50,000 to $74,999 | 12,149 | 14.5% |
| $75,000 to $99,999 | 10,976 | 13.1% |
| $100,000 to $149,999 | 18,350 | 21.9% |
| $150,000 to $199,999 | 10,641 | 12.7% |
| $200,000+ | 16,171 | 19.3% |
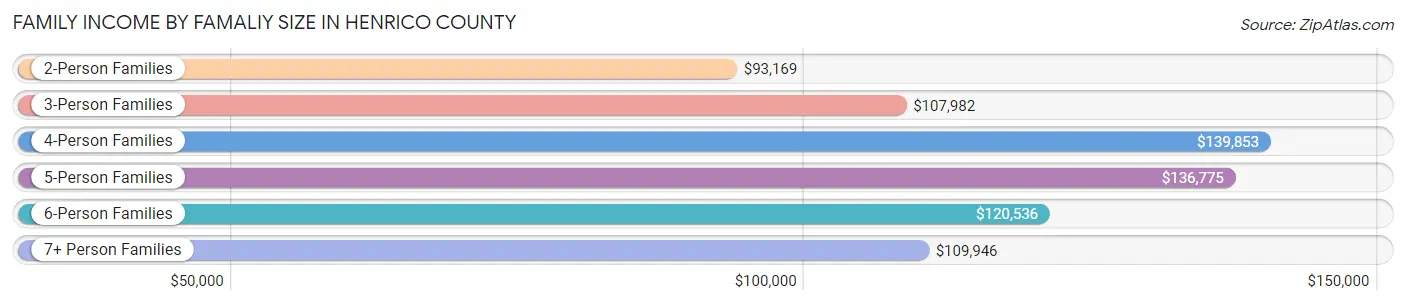
Family Income by Famaliy Size in Henrico County
4-person families (15,583 | 18.6%) account for the highest median family income in Henrico County with $139,853 per family, while 2-person families (38,915 | 46.4%) have the highest median income of $46,584 per family member.
| Income Bracket | # Families | Median Income |
| 2-Person Families | 38,915 (46.4%) | $93,169 |
| 3-Person Families | 20,075 (24.0%) | $107,982 |
| 4-Person Families | 15,583 (18.6%) | $139,853 |
| 5-Person Families | 6,637 (7.9%) | $136,775 |
| 6-Person Families | 1,779 (2.1%) | $120,536 |
| 7+ Person Families | 799 (0.9%) | $109,946 |
| Total | 83,788 (100.0%) | $109,916 |
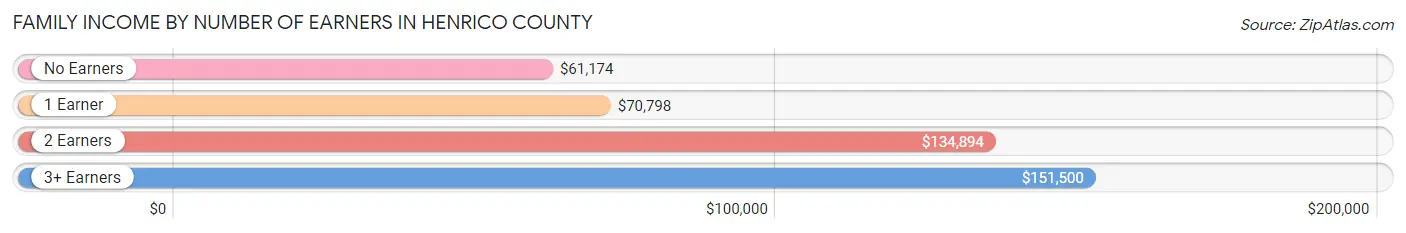
Family Income by Number of Earners in Henrico County
The median family income in Henrico County is $109,916, with families comprising 3+ earners (10,136) having the highest median family income of $151,500, while families with no earners (8,989) have the lowest median family income of $61,174, accounting for 12.1% and 10.7% of families, respectively.
| Number of Earners | # Families | Median Income |
| No Earners | 8,989 (10.7%) | $61,174 |
| 1 Earner | 25,795 (30.8%) | $70,798 |
| 2 Earners | 38,868 (46.4%) | $134,894 |
| 3+ Earners | 10,136 (12.1%) | $151,500 |
| Total | 83,788 (100.0%) | $109,916 |
Household Income in Henrico County
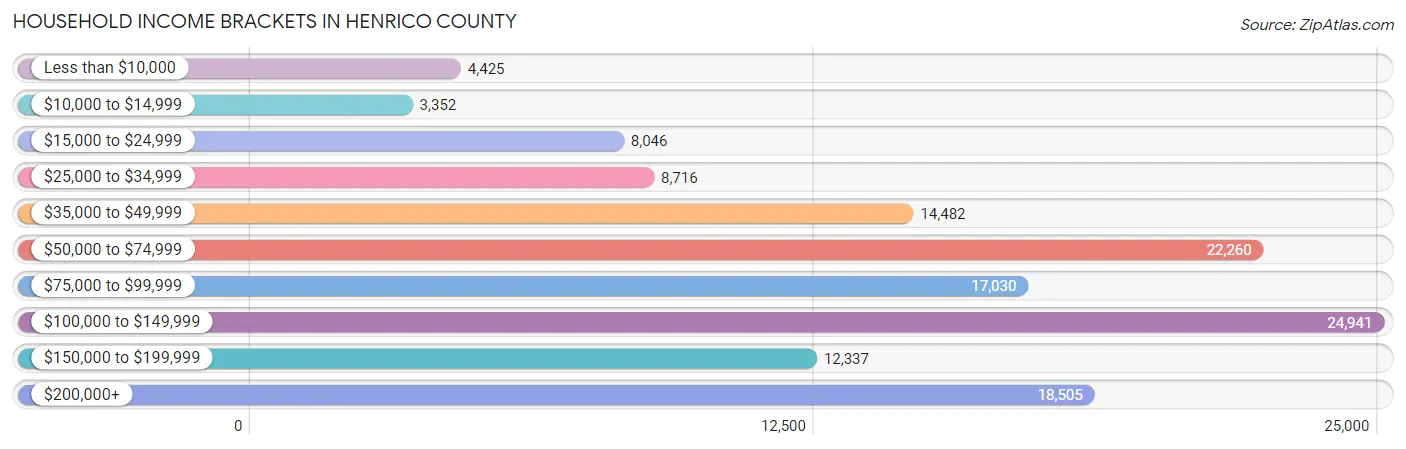
Household Income Brackets in Henrico County
With 24,941 households falling in the category, the $100,000 to $149,999 income range is the most frequent in Henrico County, accounting for 18.6% of all households. In contrast, only 3,352 households (2.5%) fall into the $10,000 to $14,999 income bracket, making it the least populous group.
| Income Bracket | # Households | % Households |
| Less than $10,000 | 4,425 | 3.3% |
| $10,000 to $14,999 | 3,352 | 2.5% |
| $15,000 to $24,999 | 8,046 | 6.0% |
| $25,000 to $34,999 | 8,716 | 6.5% |
| $35,000 to $49,999 | 14,482 | 10.8% |
| $50,000 to $74,999 | 22,260 | 16.6% |
| $75,000 to $99,999 | 17,030 | 12.7% |
| $100,000 to $149,999 | 24,941 | 18.6% |
| $150,000 to $199,999 | 12,337 | 9.2% |
| $200,000+ | 18,505 | 13.8% |
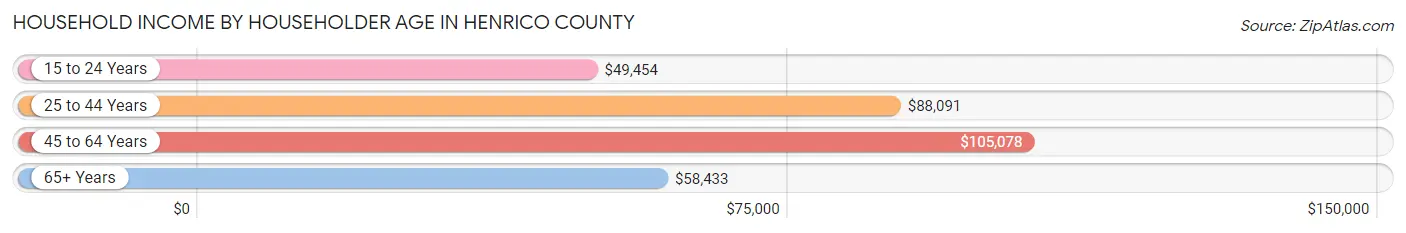
Household Income by Householder Age in Henrico County
The median household income in Henrico County is $82,424, with the highest median household income of $105,078 found in the 45 to 64 years age bracket for the primary householder. A total of 49,365 households (36.8%) fall into this category. Meanwhile, the 15 to 24 years age bracket for the primary householder has the lowest median household income of $49,454, with 3,411 households (2.5%) in this group.
| Income Bracket | # Households | Median Income |
| 15 to 24 Years | 3,411 (2.5%) | $49,454 |
| 25 to 44 Years | 46,656 (34.8%) | $88,091 |
| 45 to 64 Years | 49,365 (36.8%) | $105,078 |
| 65+ Years | 34,662 (25.9%) | $58,433 |
| Total | 134,094 (100.0%) | $82,424 |
Poverty in Henrico County
Income Below Poverty by Sex and Age in Henrico County
With 7.6% poverty level for males and 9.2% for females among the residents of Henrico County, 16 and 17 year old males and 15 year old females are the most vulnerable to poverty, with 584 males (13.3%) and 369 females (14.5%) in their respective age groups living below the poverty level.
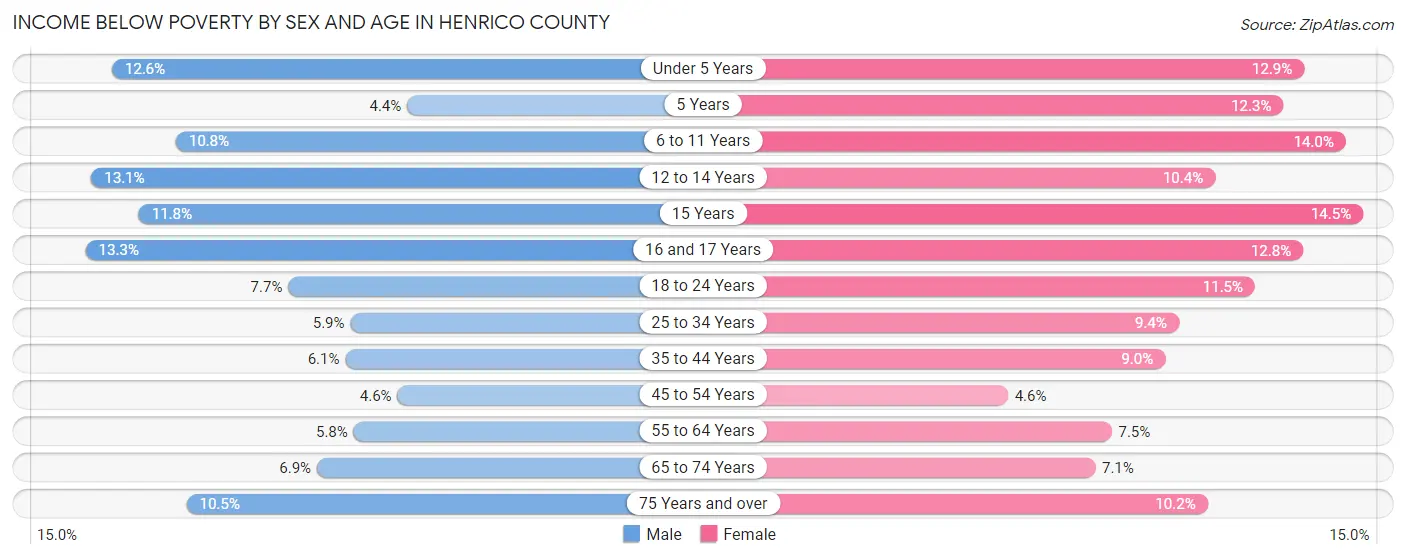
| Age Bracket | Male | Female |
| Under 5 Years | 1,246 (12.6%) | 1,224 (12.9%) |
| 5 Years | 88 (4.3%) | 247 (12.3%) |
| 6 to 11 Years | 1,329 (10.8%) | 1,591 (14.0%) |
| 12 to 14 Years | 878 (13.1%) | 688 (10.4%) |
| 15 Years | 280 (11.8%) | 369 (14.5%) |
| 16 and 17 Years | 584 (13.3%) | 493 (12.8%) |
| 18 to 24 Years | 1,014 (7.7%) | 1,464 (11.5%) |
| 25 to 34 Years | 1,335 (5.9%) | 2,260 (9.4%) |
| 35 to 44 Years | 1,343 (6.1%) | 2,122 (9.0%) |
| 45 to 54 Years | 952 (4.6%) | 1,039 (4.6%) |
| 55 to 64 Years | 1,145 (5.8%) | 1,720 (7.5%) |
| 65 to 74 Years | 952 (6.9%) | 1,234 (7.0%) |
| 75 Years and over | 842 (10.5%) | 1,331 (10.2%) |
| Total | 11,988 (7.6%) | 15,782 (9.2%) |
Income Above Poverty by Sex and Age in Henrico County
According to the poverty statistics in Henrico County, males aged 5 years and females aged 45 to 54 years are the age groups that are most secure financially, with 95.7% of males and 95.4% of females in these age groups living above the poverty line.
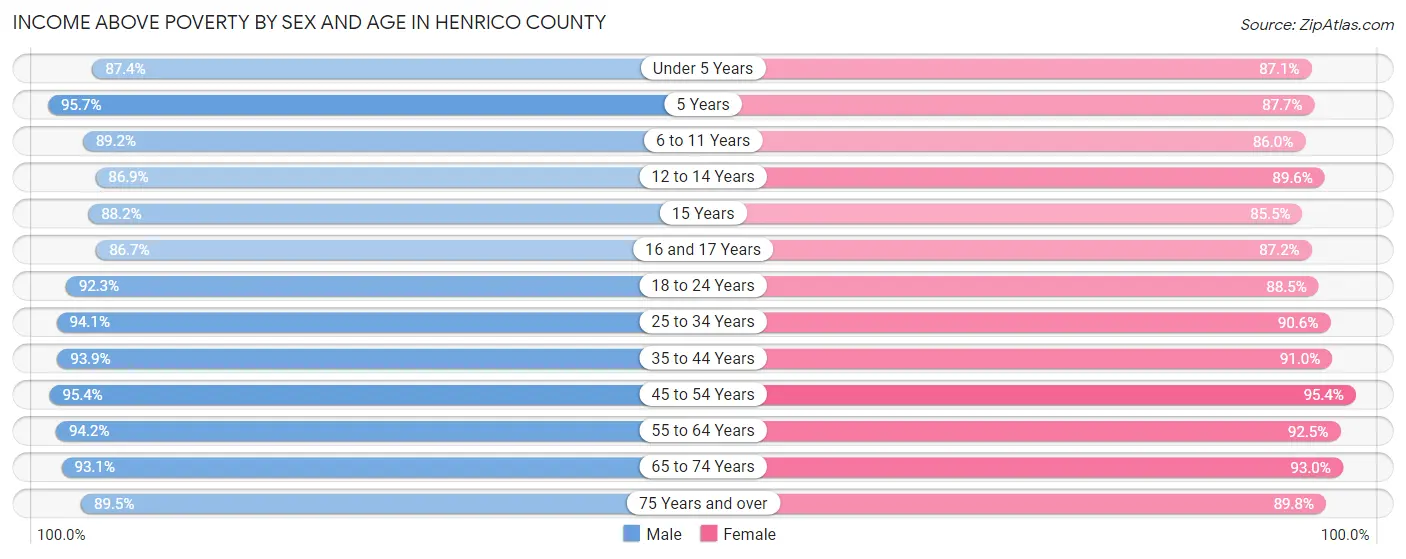
| Age Bracket | Male | Female |
| Under 5 Years | 8,666 (87.4%) | 8,288 (87.1%) |
| 5 Years | 1,933 (95.7%) | 1,763 (87.7%) |
| 6 to 11 Years | 10,986 (89.2%) | 9,745 (86.0%) |
| 12 to 14 Years | 5,804 (86.9%) | 5,934 (89.6%) |
| 15 Years | 2,088 (88.2%) | 2,174 (85.5%) |
| 16 and 17 Years | 3,808 (86.7%) | 3,347 (87.2%) |
| 18 to 24 Years | 12,217 (92.3%) | 11,264 (88.5%) |
| 25 to 34 Years | 21,185 (94.1%) | 21,822 (90.6%) |
| 35 to 44 Years | 20,772 (93.9%) | 21,461 (91.0%) |
| 45 to 54 Years | 19,635 (95.4%) | 21,468 (95.4%) |
| 55 to 64 Years | 18,459 (94.2%) | 21,186 (92.5%) |
| 65 to 74 Years | 12,919 (93.1%) | 16,261 (92.9%) |
| 75 Years and over | 7,184 (89.5%) | 11,745 (89.8%) |
| Total | 145,656 (92.4%) | 156,458 (90.8%) |
Income Below Poverty Among Married-Couple Families in Henrico County
The poverty statistics for married-couple families in Henrico County show that 2.6% or 1,544 of the total 59,847 families live below the poverty line. Families with 5 or more children have the highest poverty rate of 31.7%, comprising of 45 families. On the other hand, families with 1 or 2 children have the lowest poverty rate of 1.6%, which includes 356 families.
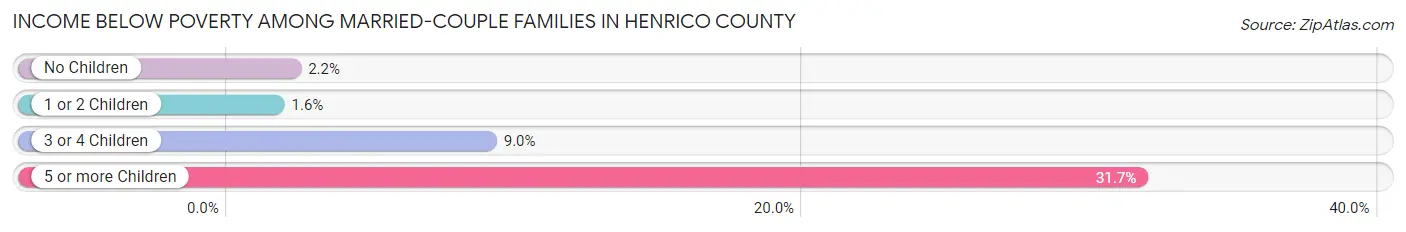
| Children | Above Poverty | Below Poverty |
| No Children | 32,469 (97.8%) | 732 (2.2%) |
| 1 or 2 Children | 21,584 (98.4%) | 356 (1.6%) |
| 3 or 4 Children | 4,153 (91.0%) | 411 (9.0%) |
| 5 or more Children | 97 (68.3%) | 45 (31.7%) |
| Total | 58,303 (97.4%) | 1,544 (2.6%) |
Income Below Poverty Among Single-Parent Households in Henrico County
According to the poverty data in Henrico County, 9.1% or 495 single-father households and 15.8% or 2,917 single-mother households are living below the poverty line. Among single-father households, those with 3 or 4 children have the highest poverty rate, with 39 households (21.3%) experiencing poverty. Likewise, among single-mother households, those with 5 or more children have the highest poverty rate, with 45 households (100.0%) falling below the poverty line.
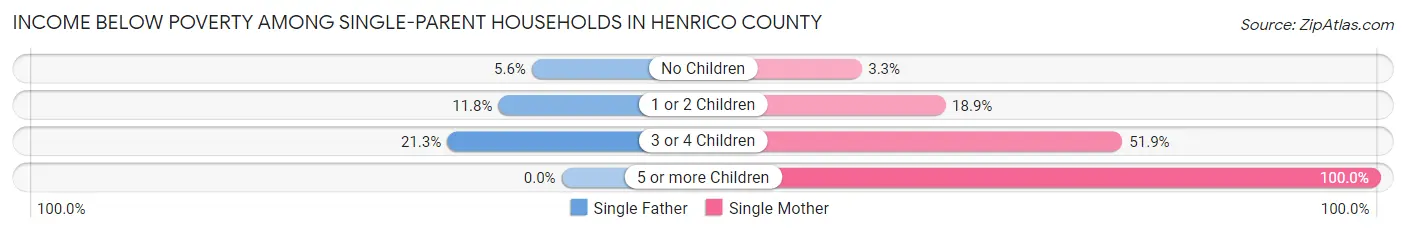
| Children | Single Father | Single Mother |
| No Children | 143 (5.6%) | 255 (3.3%) |
| 1 or 2 Children | 313 (11.8%) | 1,682 (18.9%) |
| 3 or 4 Children | 39 (21.3%) | 935 (51.9%) |
| 5 or more Children | 0 (0.0%) | 45 (100.0%) |
| Total | 495 (9.1%) | 2,917 (15.8%) |
Income Below Poverty Among Married-Couple vs Single-Parent Households in Henrico County
The poverty data for Henrico County shows that 1,544 of the married-couple family households (2.6%) and 3,412 of the single-parent households (14.2%) are living below the poverty level. Within the married-couple family households, those with 5 or more children have the highest poverty rate, with 45 households (31.7%) falling below the poverty line. Among the single-parent households, those with 5 or more children have the highest poverty rate, with 45 household (100.0%) living below poverty.
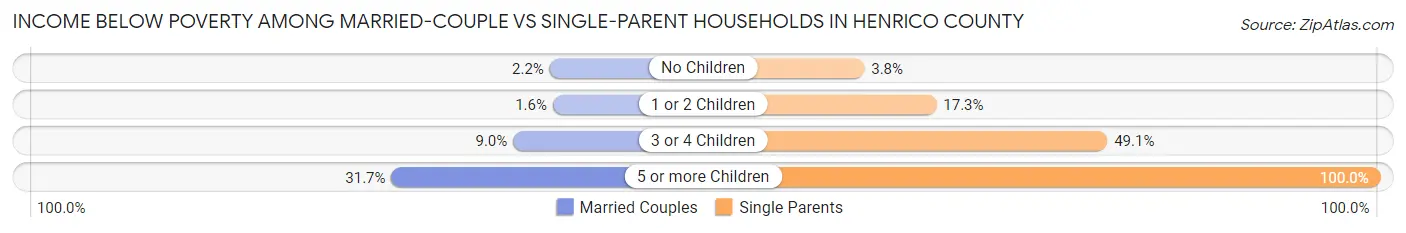
| Children | Married-Couple Families | Single-Parent Households |
| No Children | 732 (2.2%) | 398 (3.8%) |
| 1 or 2 Children | 356 (1.6%) | 1,995 (17.3%) |
| 3 or 4 Children | 411 (9.0%) | 974 (49.1%) |
| 5 or more Children | 45 (31.7%) | 45 (100.0%) |
| Total | 1,544 (2.6%) | 3,412 (14.2%) |
Employment Characteristics in Henrico County
Employment by Class of Employer in Henrico County
Among the 173,906 employed individuals in Henrico County, private company employees (116,877 | 67.2%), not-for-profit organizations (12,762 | 7.3%), and local government employees (12,695 | 7.3%) make up the most common classes of employment.
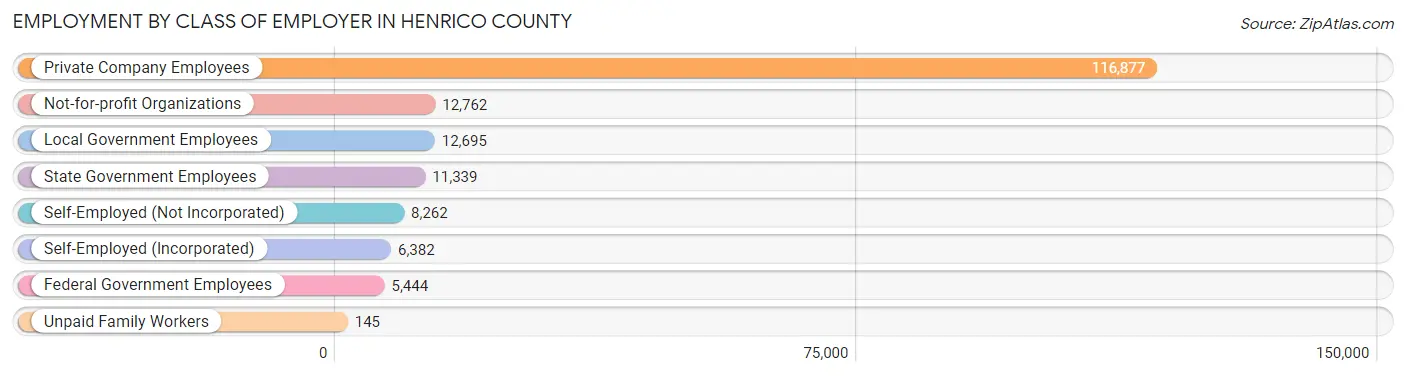
| Employer Class | # Employees | % Employees |
| Private Company Employees | 116,877 | 67.2% |
| Self-Employed (Incorporated) | 6,382 | 3.7% |
| Self-Employed (Not Incorporated) | 8,262 | 4.8% |
| Not-for-profit Organizations | 12,762 | 7.3% |
| Local Government Employees | 12,695 | 7.3% |
| State Government Employees | 11,339 | 6.5% |
| Federal Government Employees | 5,444 | 3.1% |
| Unpaid Family Workers | 145 | 0.1% |
| Total | 173,906 | 100.0% |
Employment Status by Age in Henrico County
According to the labor force statistics for Henrico County, out of the total population over 16 years of age (267,190), 69.1% or 184,628 individuals are in the labor force, with 3.9% or 7,200 of them unemployed. The age group with the highest labor force participation rate is 35 to 44 years, with 88.9% or 40,806 individuals in the labor force. Within the labor force, the 16 to 19 years age range has the highest percentage of unemployed individuals, with 11.3% or 697 of them being unemployed.
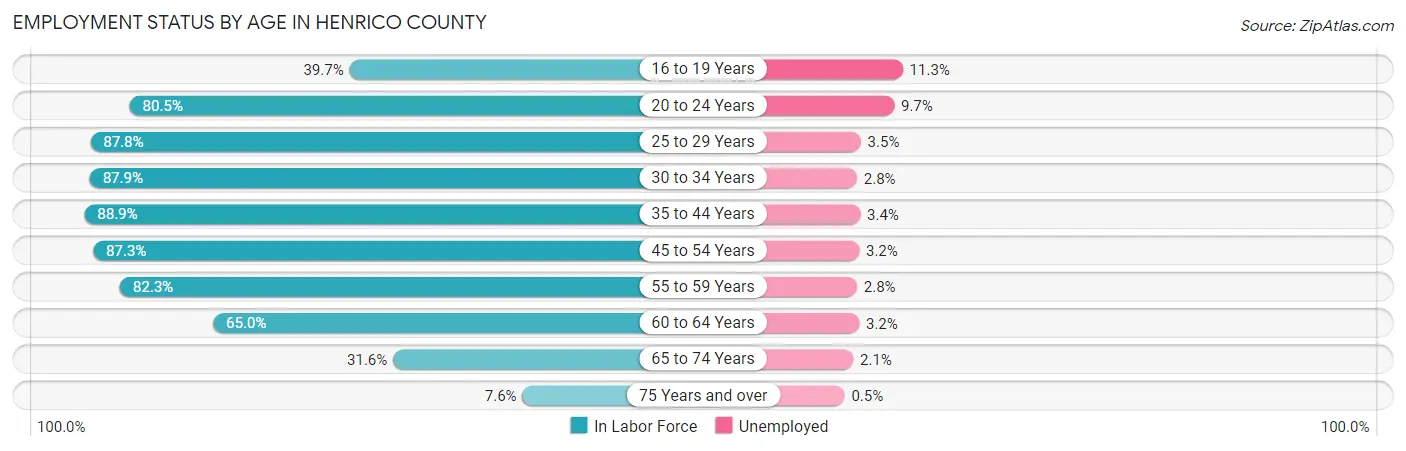
| Age Bracket | In Labor Force | Unemployed |
| 16 to 19 Years | 6,167 (39.7%) | 697 (11.3%) |
| 20 to 24 Years | 15,178 (80.5%) | 1,472 (9.7%) |
| 25 to 29 Years | 19,954 (87.8%) | 698 (3.5%) |
| 30 to 34 Years | 21,258 (87.9%) | 595 (2.8%) |
| 35 to 44 Years | 40,806 (88.9%) | 1,387 (3.4%) |
| 45 to 54 Years | 37,745 (87.3%) | 1,208 (3.2%) |
| 55 to 59 Years | 18,484 (82.3%) | 518 (2.8%) |
| 60 to 64 Years | 13,205 (65.0%) | 423 (3.2%) |
| 65 to 74 Years | 10,013 (31.6%) | 210 (2.1%) |
| 75 Years and over | 1,694 (7.6%) | 8 (0.5%) |
| Total | 184,628 (69.1%) | 7,200 (3.9%) |
Employment Status by Educational Attainment in Henrico County
According to labor force statistics for Henrico County, 84.7% of individuals (151,463) out of the total population between 25 and 64 years of age (178,823) are in the labor force, with 3.2% or 4,847 of them being unemployed. The group with the highest labor force participation rate are those with the educational attainment of bachelor's degree or higher, with 89.3% or 76,184 individuals in the labor force. Within the labor force, individuals with less than high school education have the highest percentage of unemployment, with 5.6% or 427 of them being unemployed.
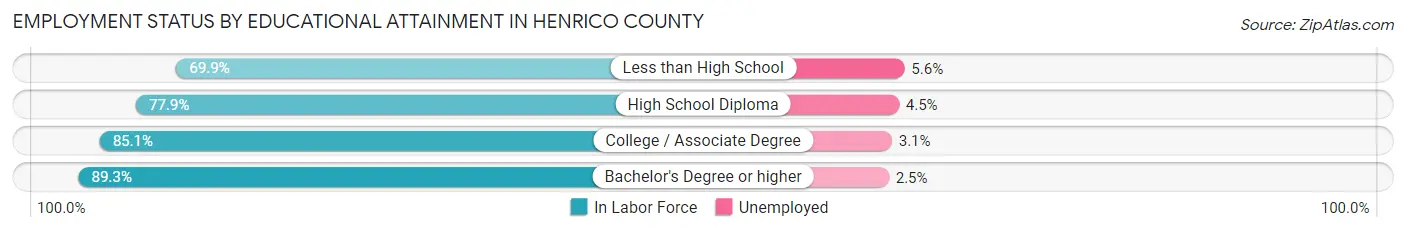
| Educational Attainment | In Labor Force | Unemployed |
| Less than High School | 7,625 (69.9%) | 611 (5.6%) |
| High School Diploma | 28,516 (77.9%) | 1,647 (4.5%) |
| College / Associate Degree | 39,143 (85.1%) | 1,426 (3.1%) |
| Bachelor's Degree or higher | 76,184 (89.3%) | 2,133 (2.5%) |
| Total | 151,463 (84.7%) | 5,722 (3.2%) |
Employment Occupations by Sex in Henrico County
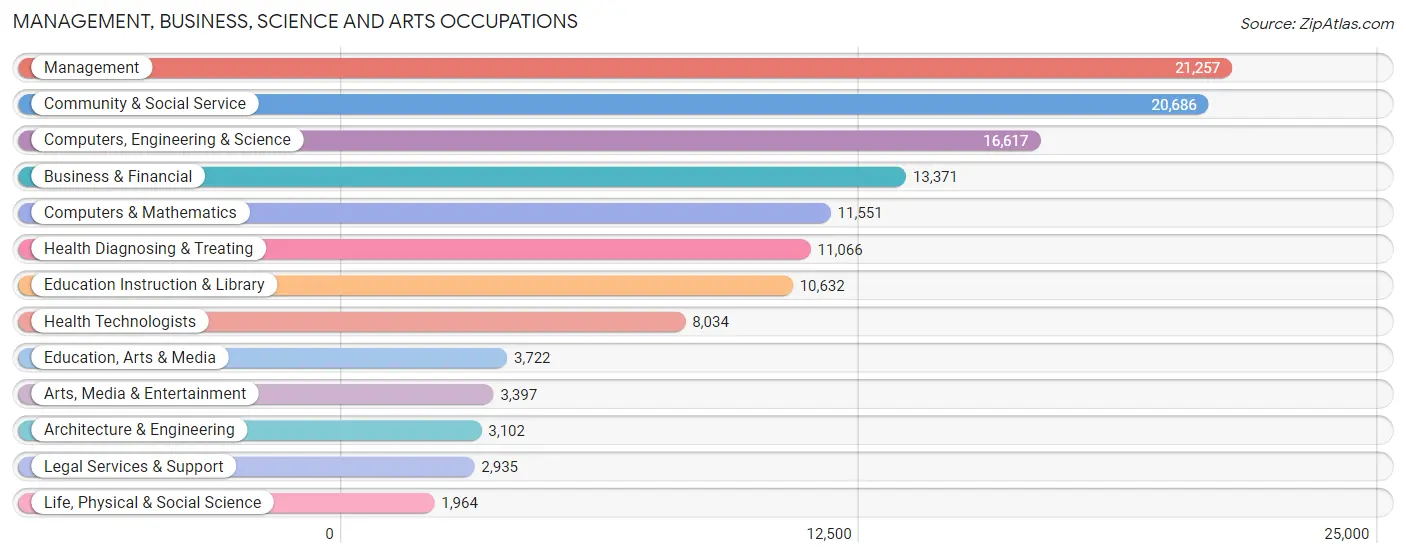
Management, Business, Science and Arts Occupations
The most common Management, Business, Science and Arts occupations in Henrico County are Management (21,257 | 12.0%), Community & Social Service (20,686 | 11.7%), Computers, Engineering & Science (16,617 | 9.4%), Business & Financial (13,371 | 7.6%), and Computers & Mathematics (11,551 | 6.5%).
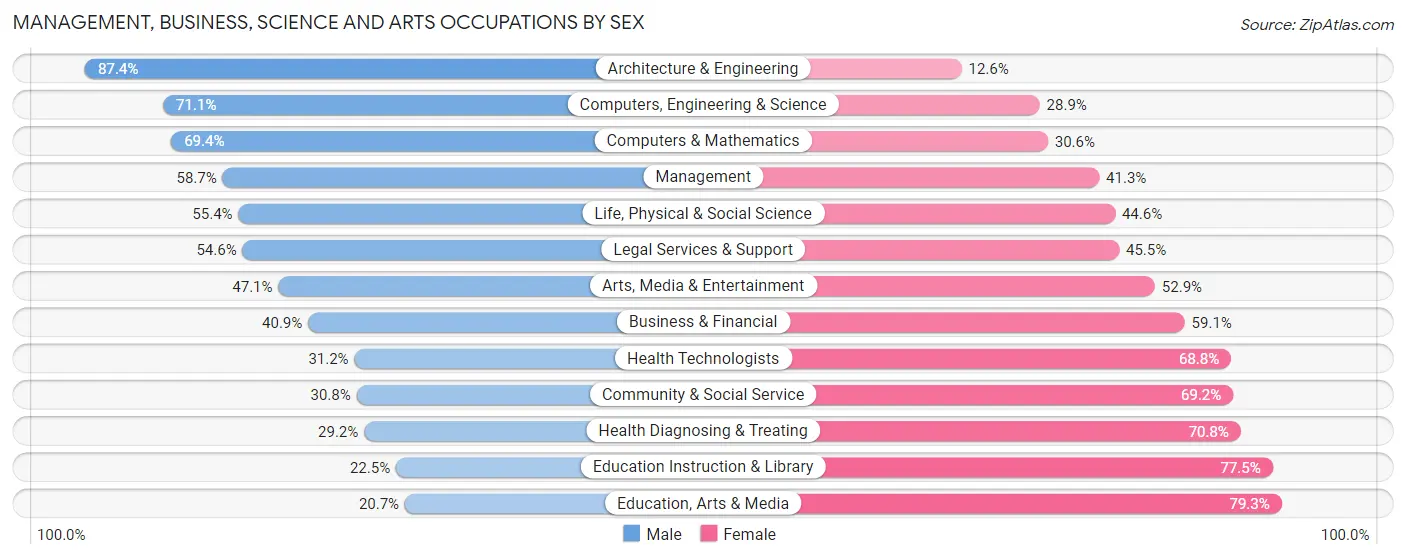
Management, Business, Science and Arts Occupations by Sex
Within the Management, Business, Science and Arts occupations in Henrico County, the most male-oriented occupations are Architecture & Engineering (87.4%), Computers, Engineering & Science (71.1%), and Computers & Mathematics (69.4%), while the most female-oriented occupations are Education, Arts & Media (79.3%), Education Instruction & Library (77.5%), and Health Diagnosing & Treating (70.8%).
| Occupation | Male | Female |
| Management | 12,478 (58.7%) | 8,779 (41.3%) |
| Business & Financial | 5,463 (40.9%) | 7,908 (59.1%) |
| Computers, Engineering & Science | 11,817 (71.1%) | 4,800 (28.9%) |
| Computers & Mathematics | 8,018 (69.4%) | 3,533 (30.6%) |
| Architecture & Engineering | 2,711 (87.4%) | 391 (12.6%) |
| Life, Physical & Social Science | 1,088 (55.4%) | 876 (44.6%) |
| Community & Social Service | 6,364 (30.8%) | 14,322 (69.2%) |
| Education, Arts & Media | 769 (20.7%) | 2,953 (79.3%) |
| Legal Services & Support | 1,601 (54.5%) | 1,334 (45.5%) |
| Education Instruction & Library | 2,395 (22.5%) | 8,237 (77.5%) |
| Arts, Media & Entertainment | 1,599 (47.1%) | 1,798 (52.9%) |
| Health Diagnosing & Treating | 3,229 (29.2%) | 7,837 (70.8%) |
| Health Technologists | 2,506 (31.2%) | 5,528 (68.8%) |
| Total (Category) | 39,351 (47.4%) | 43,646 (52.6%) |
| Total (Overall) | 90,284 (51.0%) | 86,638 (49.0%) |
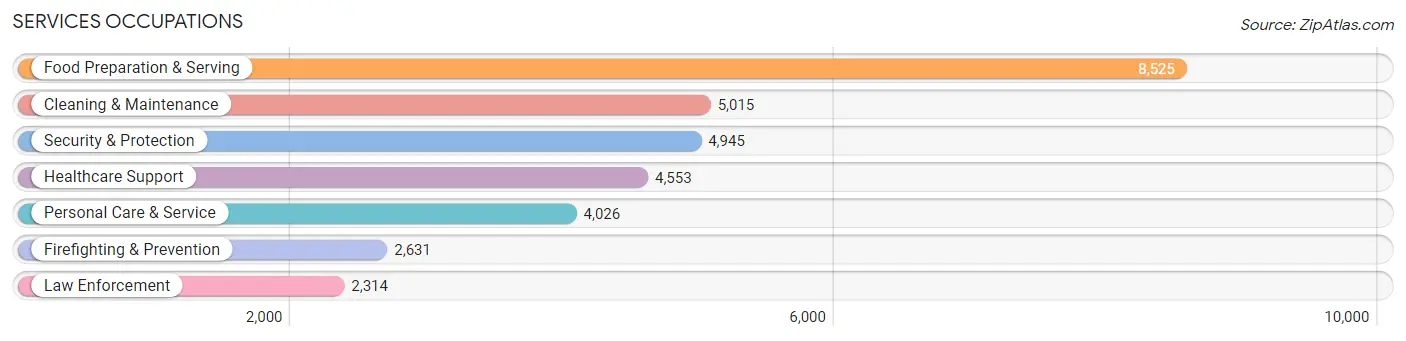
Services Occupations
The most common Services occupations in Henrico County are Food Preparation & Serving (8,525 | 4.8%), Cleaning & Maintenance (5,015 | 2.8%), Security & Protection (4,945 | 2.8%), Healthcare Support (4,553 | 2.6%), and Personal Care & Service (4,026 | 2.3%).
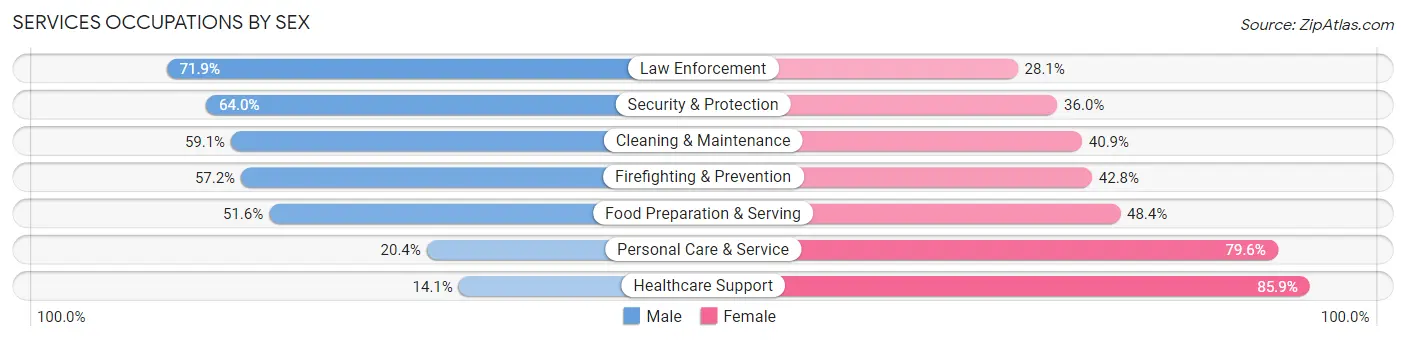
Services Occupations by Sex
Within the Services occupations in Henrico County, the most male-oriented occupations are Law Enforcement (71.9%), Security & Protection (64.0%), and Cleaning & Maintenance (59.1%), while the most female-oriented occupations are Healthcare Support (85.9%), Personal Care & Service (79.6%), and Food Preparation & Serving (48.4%).
| Occupation | Male | Female |
| Healthcare Support | 640 (14.1%) | 3,913 (85.9%) |
| Security & Protection | 3,167 (64.0%) | 1,778 (36.0%) |
| Firefighting & Prevention | 1,504 (57.2%) | 1,127 (42.8%) |
| Law Enforcement | 1,663 (71.9%) | 651 (28.1%) |
| Food Preparation & Serving | 4,398 (51.6%) | 4,127 (48.4%) |
| Cleaning & Maintenance | 2,966 (59.1%) | 2,049 (40.9%) |
| Personal Care & Service | 821 (20.4%) | 3,205 (79.6%) |
| Total (Category) | 11,992 (44.3%) | 15,072 (55.7%) |
| Total (Overall) | 90,284 (51.0%) | 86,638 (49.0%) |
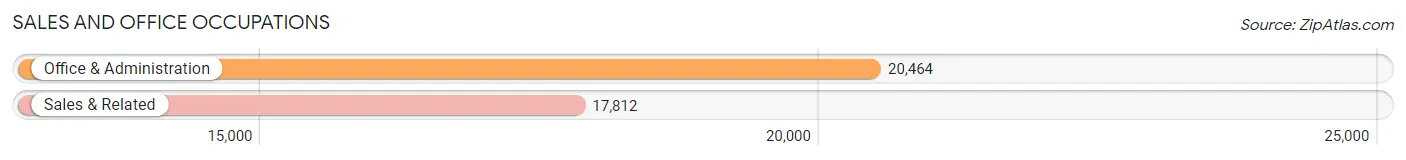
Sales and Office Occupations
The most common Sales and Office occupations in Henrico County are Office & Administration (20,464 | 11.6%), and Sales & Related (17,812 | 10.1%).
Sales and Office Occupations by Sex
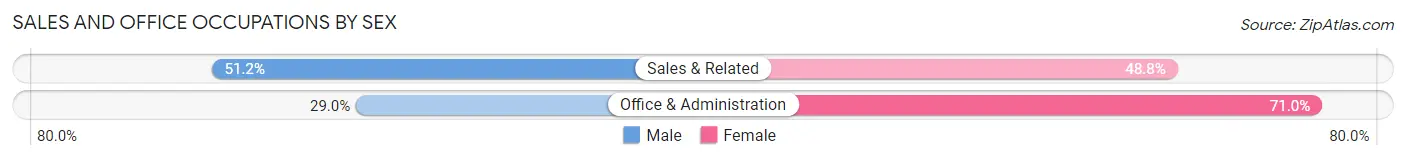
| Occupation | Male | Female |
| Sales & Related | 9,125 (51.2%) | 8,687 (48.8%) |
| Office & Administration | 5,936 (29.0%) | 14,528 (71.0%) |
| Total (Category) | 15,061 (39.4%) | 23,215 (60.7%) |
| Total (Overall) | 90,284 (51.0%) | 86,638 (49.0%) |
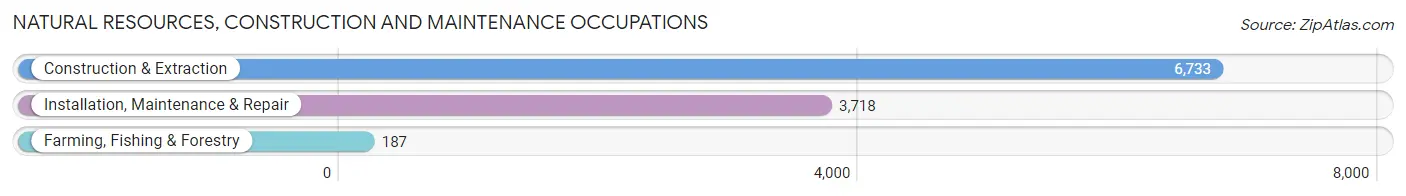
Natural Resources, Construction and Maintenance Occupations
The most common Natural Resources, Construction and Maintenance occupations in Henrico County are Construction & Extraction (6,733 | 3.8%), Installation, Maintenance & Repair (3,718 | 2.1%), and Farming, Fishing & Forestry (187 | 0.1%).
Natural Resources, Construction and Maintenance Occupations by Sex
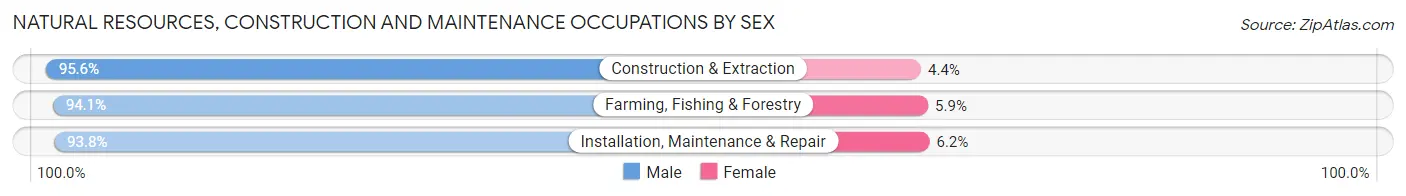
| Occupation | Male | Female |
| Farming, Fishing & Forestry | 176 (94.1%) | 11 (5.9%) |
| Construction & Extraction | 6,436 (95.6%) | 297 (4.4%) |
| Installation, Maintenance & Repair | 3,489 (93.8%) | 229 (6.2%) |
| Total (Category) | 10,101 (95.0%) | 537 (5.1%) |
| Total (Overall) | 90,284 (51.0%) | 86,638 (49.0%) |
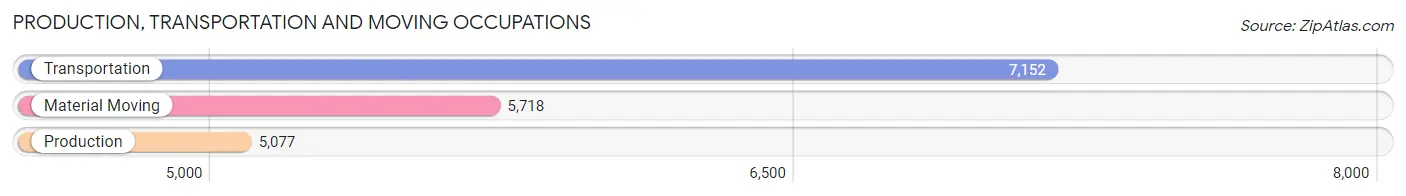
Production, Transportation and Moving Occupations
The most common Production, Transportation and Moving occupations in Henrico County are Transportation (7,152 | 4.0%), Material Moving (5,718 | 3.2%), and Production (5,077 | 2.9%).
Production, Transportation and Moving Occupations by Sex
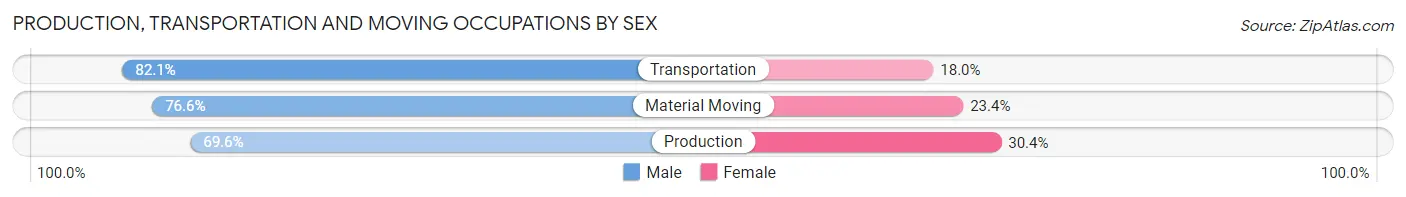
| Occupation | Male | Female |
| Production | 3,533 (69.6%) | 1,544 (30.4%) |
| Transportation | 5,868 (82.1%) | 1,284 (17.9%) |
| Material Moving | 4,378 (76.6%) | 1,340 (23.4%) |
| Total (Category) | 13,779 (76.8%) | 4,168 (23.2%) |
| Total (Overall) | 90,284 (51.0%) | 86,638 (49.0%) |
Employment Industries by Sex in Henrico County
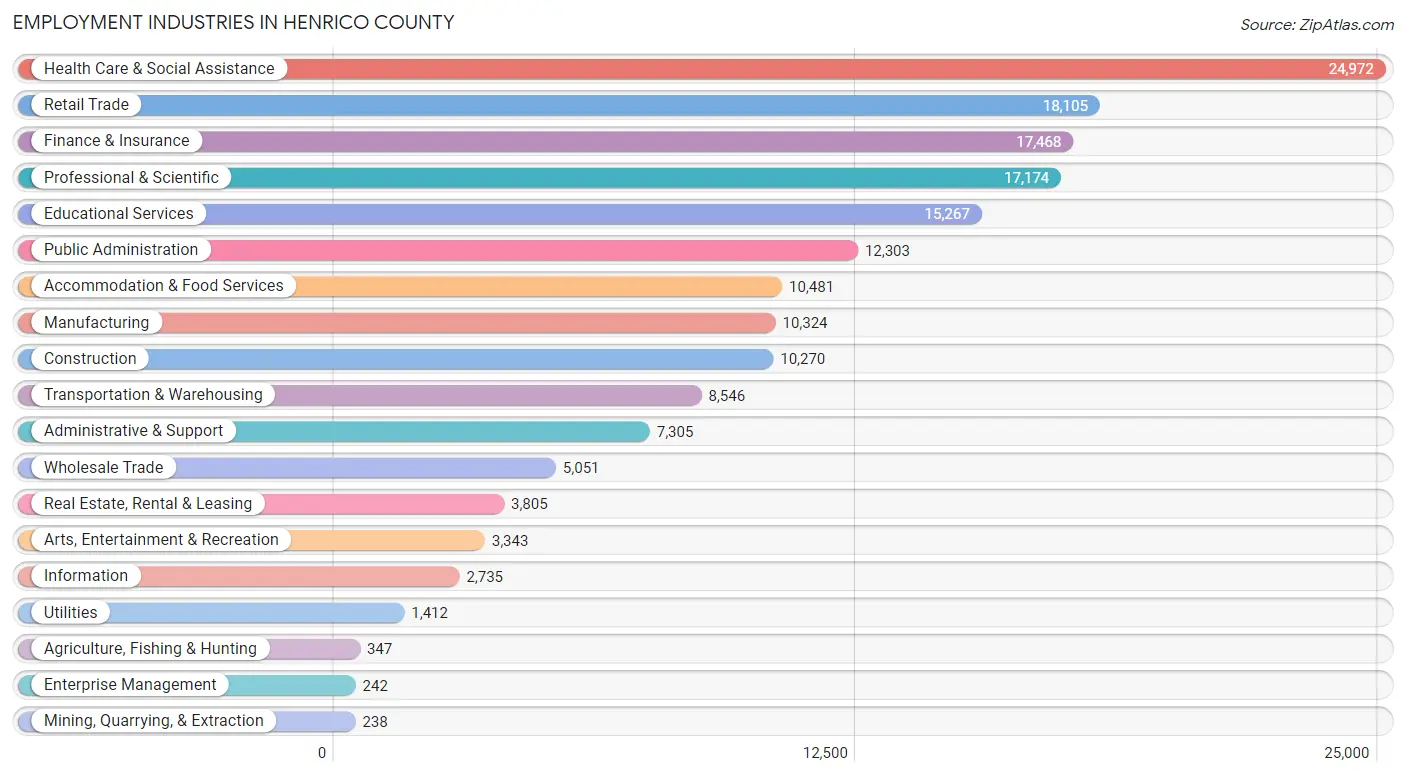
Employment Industries in Henrico County
The major employment industries in Henrico County include Health Care & Social Assistance (24,972 | 14.1%), Retail Trade (18,105 | 10.2%), Finance & Insurance (17,468 | 9.9%), Professional & Scientific (17,174 | 9.7%), and Educational Services (15,267 | 8.6%).
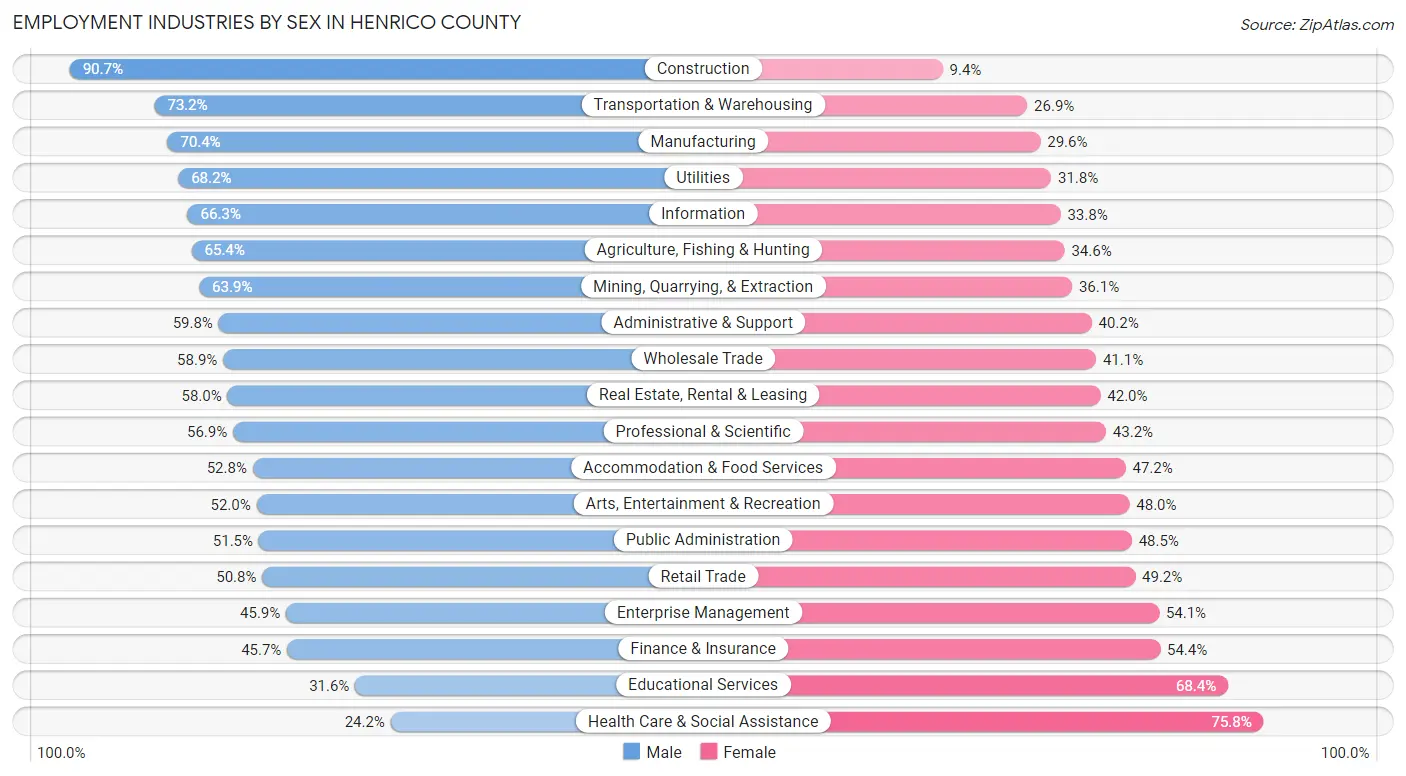
Employment Industries by Sex in Henrico County
The Henrico County industries that see more men than women are Construction (90.6%), Transportation & Warehousing (73.2%), and Manufacturing (70.4%), whereas the industries that tend to have a higher number of women are Health Care & Social Assistance (75.8%), Educational Services (68.4%), and Finance & Insurance (54.3%).
| Industry | Male | Female |
| Agriculture, Fishing & Hunting | 227 (65.4%) | 120 (34.6%) |
| Mining, Quarrying, & Extraction | 152 (63.9%) | 86 (36.1%) |
| Construction | 9,310 (90.6%) | 960 (9.3%) |
| Manufacturing | 7,271 (70.4%) | 3,053 (29.6%) |
| Wholesale Trade | 2,975 (58.9%) | 2,076 (41.1%) |
| Retail Trade | 9,198 (50.8%) | 8,907 (49.2%) |
| Transportation & Warehousing | 6,251 (73.2%) | 2,295 (26.9%) |
| Utilities | 963 (68.2%) | 449 (31.8%) |
| Information | 1,812 (66.2%) | 923 (33.8%) |
| Finance & Insurance | 7,974 (45.7%) | 9,494 (54.3%) |
| Real Estate, Rental & Leasing | 2,207 (58.0%) | 1,598 (42.0%) |
| Professional & Scientific | 9,763 (56.9%) | 7,411 (43.1%) |
| Enterprise Management | 111 (45.9%) | 131 (54.1%) |
| Administrative & Support | 4,370 (59.8%) | 2,935 (40.2%) |
| Educational Services | 4,820 (31.6%) | 10,447 (68.4%) |
| Health Care & Social Assistance | 6,047 (24.2%) | 18,925 (75.8%) |
| Arts, Entertainment & Recreation | 1,738 (52.0%) | 1,605 (48.0%) |
| Accommodation & Food Services | 5,532 (52.8%) | 4,949 (47.2%) |
| Public Administration | 6,337 (51.5%) | 5,966 (48.5%) |
| Total | 90,284 (51.0%) | 86,638 (49.0%) |
Education in Henrico County
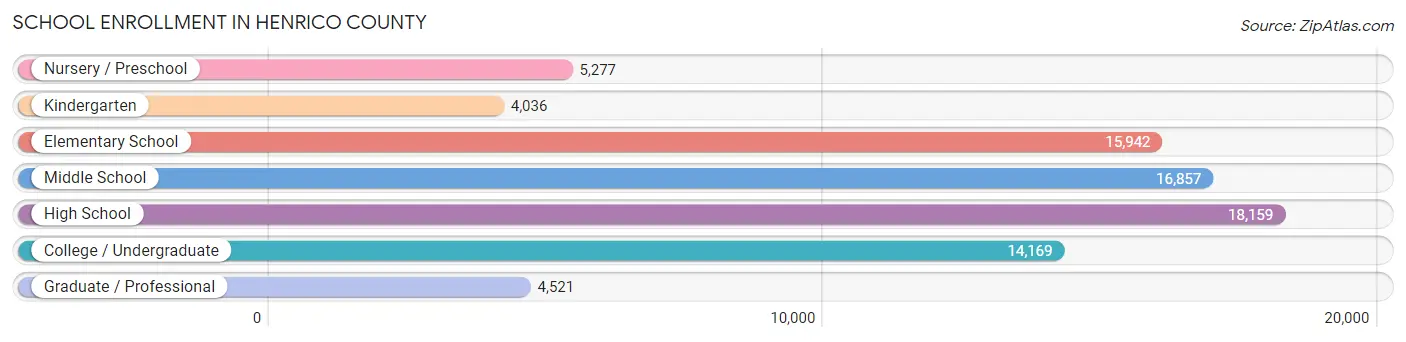
School Enrollment in Henrico County
The most common levels of schooling among the 78,961 students in Henrico County are high school (18,159 | 23.0%), middle school (16,857 | 21.3%), and elementary school (15,942 | 20.2%).
| School Level | # Students | % Students |
| Nursery / Preschool | 5,277 | 6.7% |
| Kindergarten | 4,036 | 5.1% |
| Elementary School | 15,942 | 20.2% |
| Middle School | 16,857 | 21.3% |
| High School | 18,159 | 23.0% |
| College / Undergraduate | 14,169 | 17.9% |
| Graduate / Professional | 4,521 | 5.7% |
| Total | 78,961 | 100.0% |
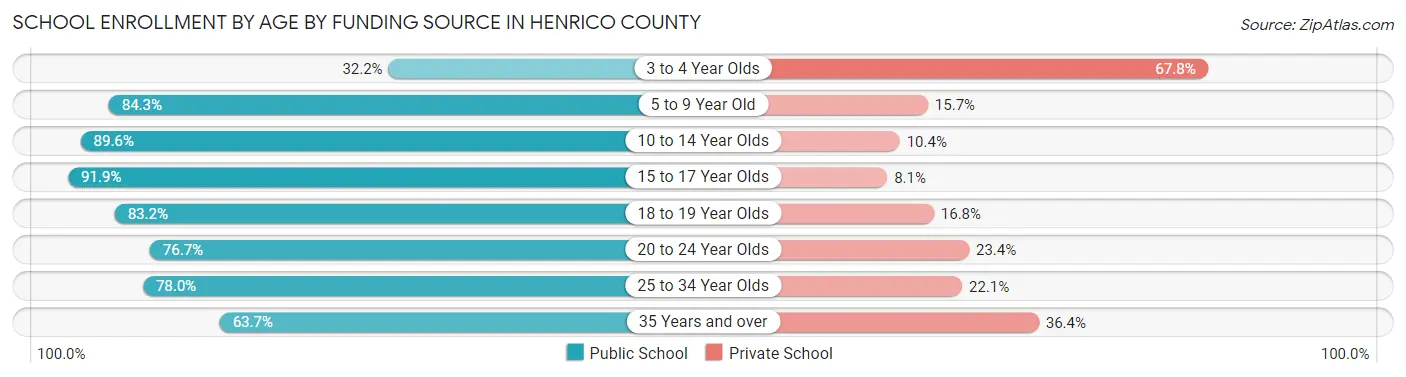
School Enrollment by Age by Funding Source in Henrico County
Out of a total of 78,961 students who are enrolled in schools in Henrico County, 14,213 (18.0%) attend a private institution, while the remaining 64,748 (82.0%) are enrolled in public schools. The age group of 3 to 4 year olds has the highest likelihood of being enrolled in private schools, with 2,630 (67.8% in the age bracket) enrolled. Conversely, the age group of 15 to 17 year olds has the lowest likelihood of being enrolled in a private school, with 11,952 (91.9% in the age bracket) attending a public institution.
| Age Bracket | Public School | Private School |
| 3 to 4 Year Olds | 1,251 (32.2%) | 2,630 (67.8%) |
| 5 to 9 Year Old | 16,477 (84.3%) | 3,067 (15.7%) |
| 10 to 14 Year Olds | 18,349 (89.6%) | 2,138 (10.4%) |
| 15 to 17 Year Olds | 11,952 (91.9%) | 1,055 (8.1%) |
| 18 to 19 Year Olds | 4,501 (83.2%) | 909 (16.8%) |
| 20 to 24 Year Olds | 5,296 (76.6%) | 1,613 (23.4%) |
| 25 to 34 Year Olds | 3,854 (77.9%) | 1,090 (22.1%) |
| 35 Years and over | 3,042 (63.6%) | 1,737 (36.3%) |
| Total | 64,748 (82.0%) | 14,213 (18.0%) |
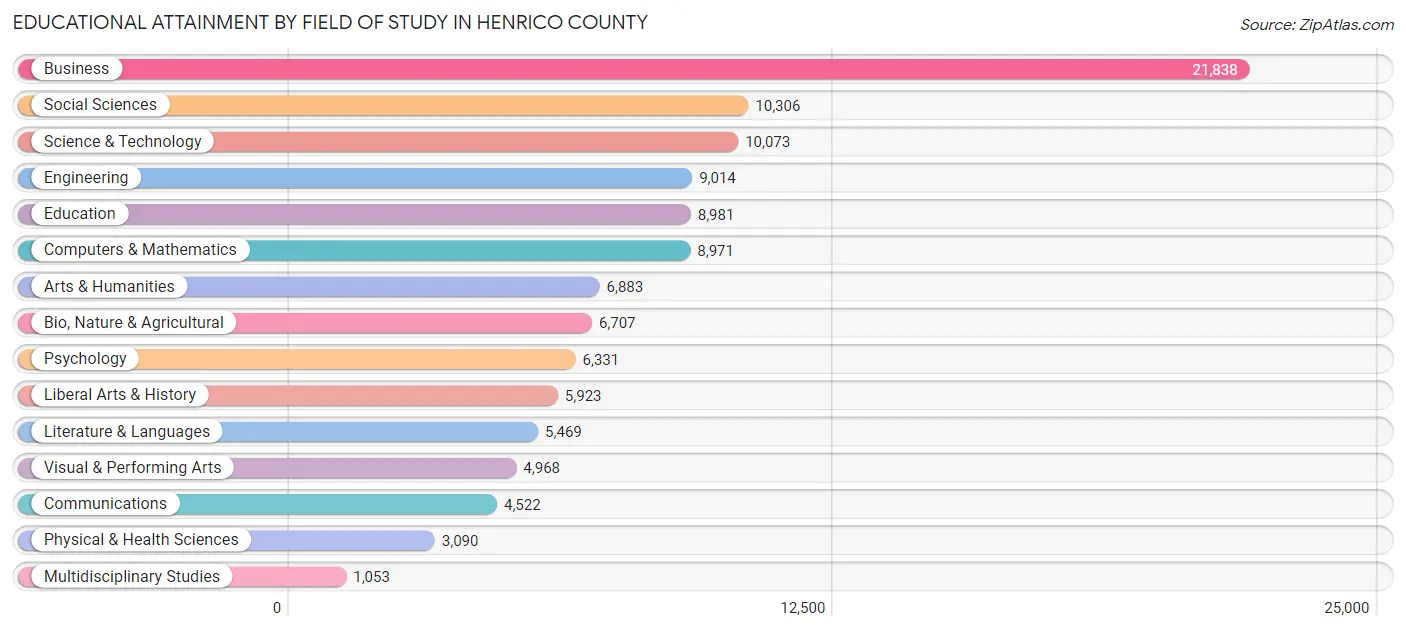
Educational Attainment by Field of Study in Henrico County
Business (21,838 | 19.1%), social sciences (10,306 | 9.0%), science & technology (10,073 | 8.8%), engineering (9,014 | 7.9%), and education (8,981 | 7.9%) are the most common fields of study among 114,129 individuals in Henrico County who have obtained a bachelor's degree or higher.
| Field of Study | # Graduates | % Graduates |
| Computers & Mathematics | 8,971 | 7.9% |
| Bio, Nature & Agricultural | 6,707 | 5.9% |
| Physical & Health Sciences | 3,090 | 2.7% |
| Psychology | 6,331 | 5.6% |
| Social Sciences | 10,306 | 9.0% |
| Engineering | 9,014 | 7.9% |
| Multidisciplinary Studies | 1,053 | 0.9% |
| Science & Technology | 10,073 | 8.8% |
| Business | 21,838 | 19.1% |
| Education | 8,981 | 7.9% |
| Literature & Languages | 5,469 | 4.8% |
| Liberal Arts & History | 5,923 | 5.2% |
| Visual & Performing Arts | 4,968 | 4.3% |
| Communications | 4,522 | 4.0% |
| Arts & Humanities | 6,883 | 6.0% |
| Total | 114,129 | 100.0% |
Transportation & Commute in Henrico County
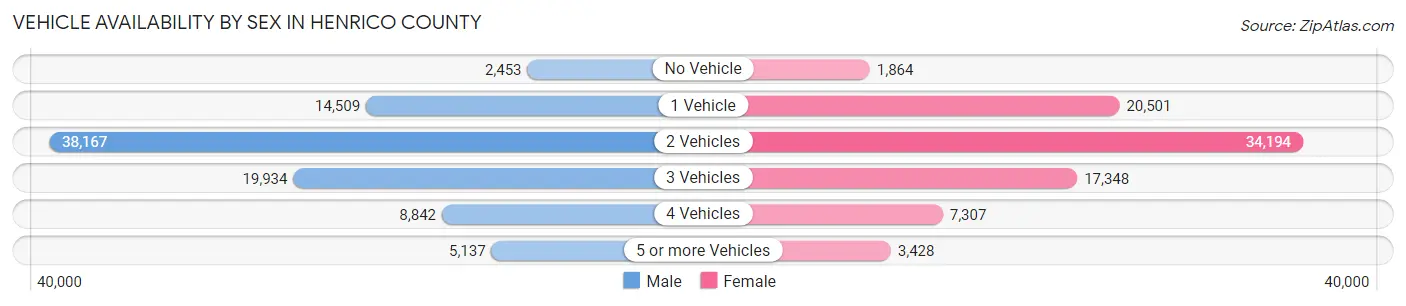
Vehicle Availability by Sex in Henrico County
The most prevalent vehicle ownership categories in Henrico County are males with 2 vehicles (38,167, accounting for 42.9%) and females with 2 vehicles (34,194, making up 45.1%).
| Vehicles Available | Male | Female |
| No Vehicle | 2,453 (2.8%) | 1,864 (2.2%) |
| 1 Vehicle | 14,509 (16.3%) | 20,501 (24.2%) |
| 2 Vehicles | 38,167 (42.9%) | 34,194 (40.4%) |
| 3 Vehicles | 19,934 (22.4%) | 17,348 (20.5%) |
| 4 Vehicles | 8,842 (9.9%) | 7,307 (8.6%) |
| 5 or more Vehicles | 5,137 (5.8%) | 3,428 (4.1%) |
| Total | 89,042 (100.0%) | 84,642 (100.0%) |
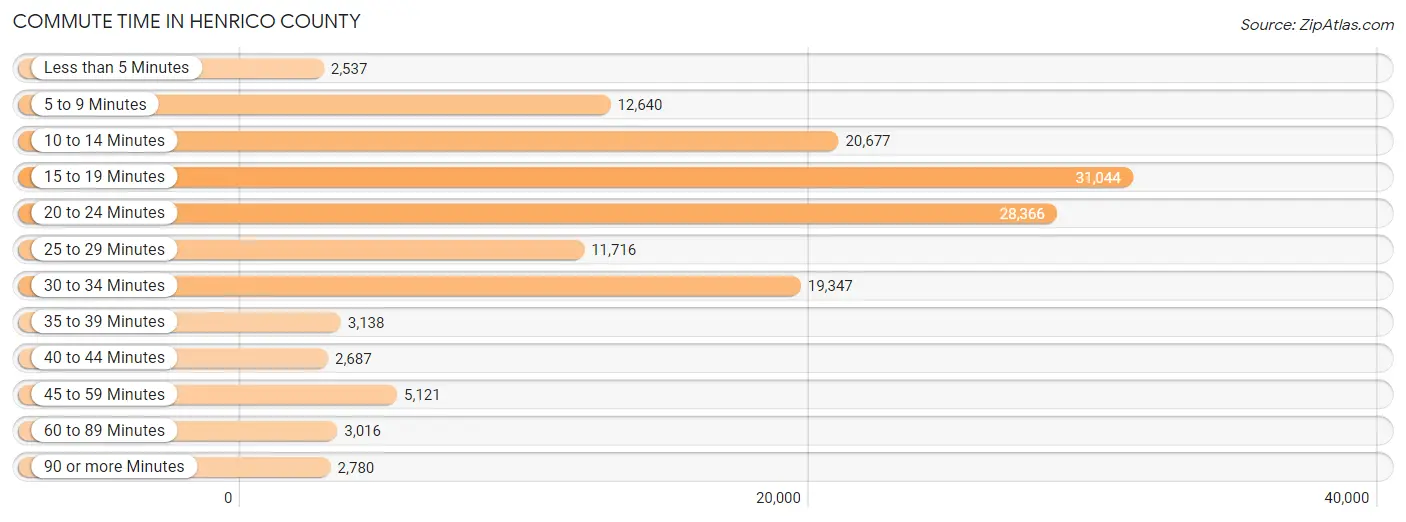
Commute Time in Henrico County
The most frequently occuring commute durations in Henrico County are 15 to 19 minutes (31,044 commuters, 21.7%), 20 to 24 minutes (28,366 commuters, 19.8%), and 10 to 14 minutes (20,677 commuters, 14.4%).
| Commute Time | # Commuters | % Commuters |
| Less than 5 Minutes | 2,537 | 1.8% |
| 5 to 9 Minutes | 12,640 | 8.8% |
| 10 to 14 Minutes | 20,677 | 14.4% |
| 15 to 19 Minutes | 31,044 | 21.7% |
| 20 to 24 Minutes | 28,366 | 19.8% |
| 25 to 29 Minutes | 11,716 | 8.2% |
| 30 to 34 Minutes | 19,347 | 13.5% |
| 35 to 39 Minutes | 3,138 | 2.2% |
| 40 to 44 Minutes | 2,687 | 1.9% |
| 45 to 59 Minutes | 5,121 | 3.6% |
| 60 to 89 Minutes | 3,016 | 2.1% |
| 90 or more Minutes | 2,780 | 1.9% |
Commute Time by Sex in Henrico County
The most common commute times in Henrico County are 15 to 19 minutes (15,704 commuters, 21.0%) for males and 15 to 19 minutes (15,340 commuters, 22.4%) for females.
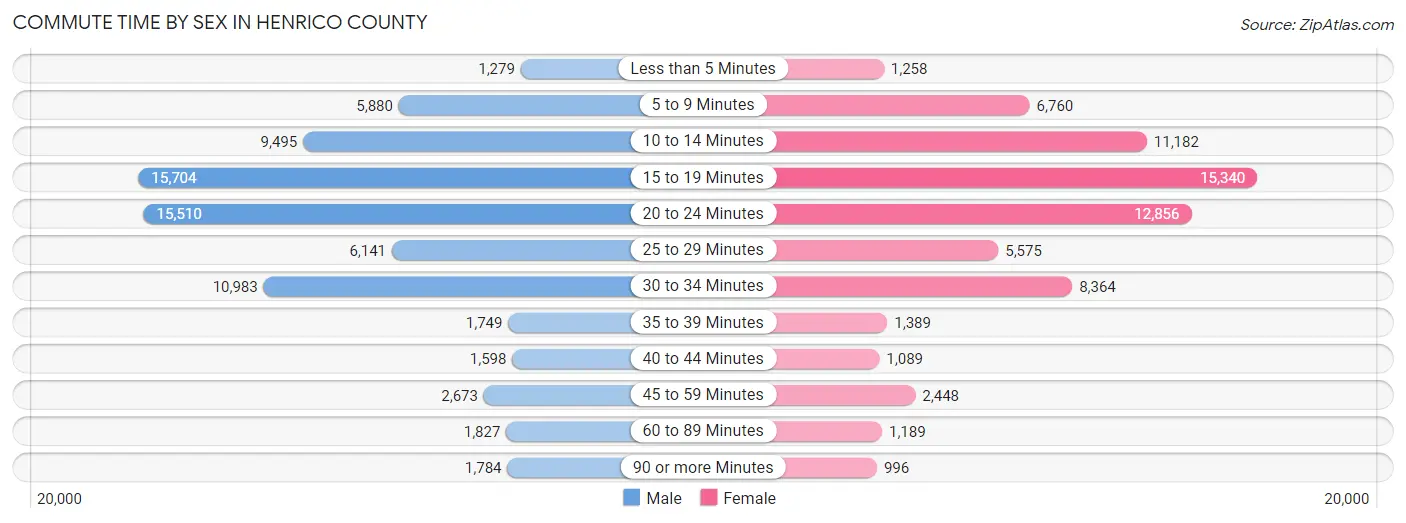
| Commute Time | Male | Female |
| Less than 5 Minutes | 1,279 (1.7%) | 1,258 (1.8%) |
| 5 to 9 Minutes | 5,880 (7.9%) | 6,760 (9.9%) |
| 10 to 14 Minutes | 9,495 (12.7%) | 11,182 (16.3%) |
| 15 to 19 Minutes | 15,704 (21.0%) | 15,340 (22.4%) |
| 20 to 24 Minutes | 15,510 (20.8%) | 12,856 (18.8%) |
| 25 to 29 Minutes | 6,141 (8.2%) | 5,575 (8.2%) |
| 30 to 34 Minutes | 10,983 (14.7%) | 8,364 (12.2%) |
| 35 to 39 Minutes | 1,749 (2.3%) | 1,389 (2.0%) |
| 40 to 44 Minutes | 1,598 (2.1%) | 1,089 (1.6%) |
| 45 to 59 Minutes | 2,673 (3.6%) | 2,448 (3.6%) |
| 60 to 89 Minutes | 1,827 (2.5%) | 1,189 (1.7%) |
| 90 or more Minutes | 1,784 (2.4%) | 996 (1.5%) |
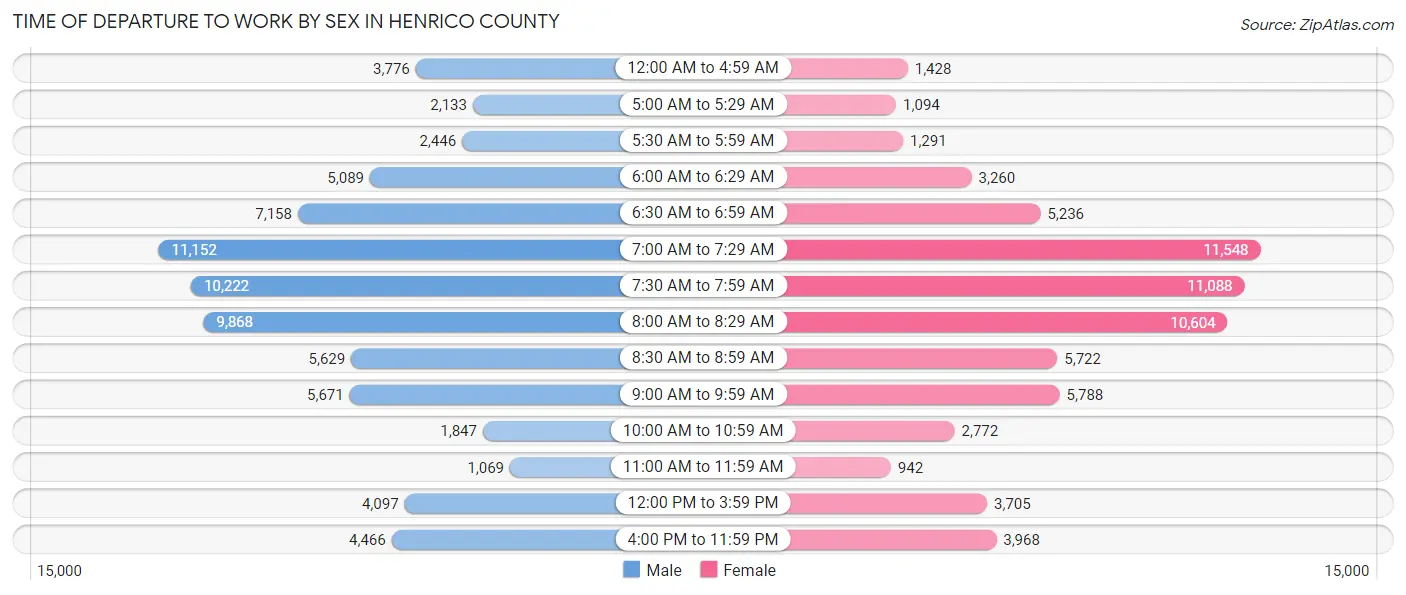
Time of Departure to Work by Sex in Henrico County
The most frequent times of departure to work in Henrico County are 7:00 AM to 7:29 AM (11,152, 14.9%) for males and 7:00 AM to 7:29 AM (11,548, 16.9%) for females.
| Time of Departure | Male | Female |
| 12:00 AM to 4:59 AM | 3,776 (5.1%) | 1,428 (2.1%) |
| 5:00 AM to 5:29 AM | 2,133 (2.9%) | 1,094 (1.6%) |
| 5:30 AM to 5:59 AM | 2,446 (3.3%) | 1,291 (1.9%) |
| 6:00 AM to 6:29 AM | 5,089 (6.8%) | 3,260 (4.8%) |
| 6:30 AM to 6:59 AM | 7,158 (9.6%) | 5,236 (7.6%) |
| 7:00 AM to 7:29 AM | 11,152 (14.9%) | 11,548 (16.9%) |
| 7:30 AM to 7:59 AM | 10,222 (13.7%) | 11,088 (16.2%) |
| 8:00 AM to 8:29 AM | 9,868 (13.2%) | 10,604 (15.5%) |
| 8:30 AM to 8:59 AM | 5,629 (7.5%) | 5,722 (8.4%) |
| 9:00 AM to 9:59 AM | 5,671 (7.6%) | 5,788 (8.5%) |
| 10:00 AM to 10:59 AM | 1,847 (2.5%) | 2,772 (4.1%) |
| 11:00 AM to 11:59 AM | 1,069 (1.4%) | 942 (1.4%) |
| 12:00 PM to 3:59 PM | 4,097 (5.5%) | 3,705 (5.4%) |
| 4:00 PM to 11:59 PM | 4,466 (6.0%) | 3,968 (5.8%) |
| Total | 74,623 (100.0%) | 68,446 (100.0%) |
Housing Occupancy in Henrico County
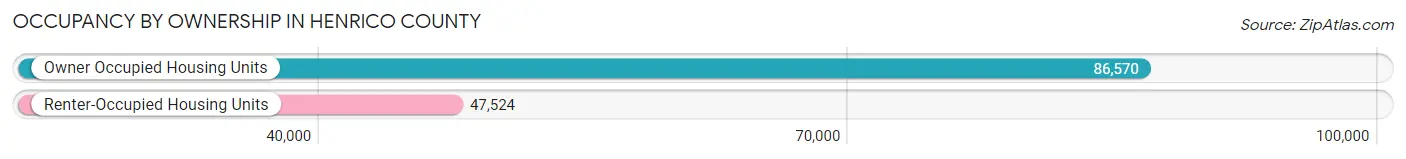
Occupancy by Ownership in Henrico County
Of the total 134,094 dwellings in Henrico County, owner-occupied units account for 86,570 (64.6%), while renter-occupied units make up 47,524 (35.4%).
| Occupancy | # Housing Units | % Housing Units |
| Owner Occupied Housing Units | 86,570 | 64.6% |
| Renter-Occupied Housing Units | 47,524 | 35.4% |
| Total Occupied Housing Units | 134,094 | 100.0% |
Occupancy by Household Size in Henrico County
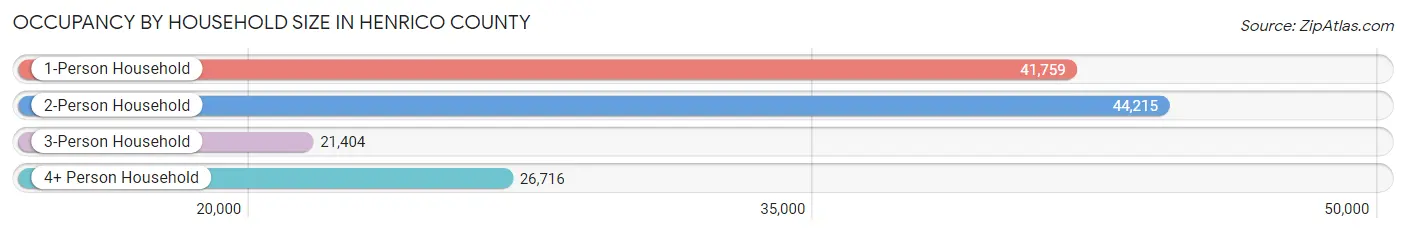
| Household Size | # Housing Units | % Housing Units |
| 1-Person Household | 41,759 | 31.1% |
| 2-Person Household | 44,215 | 33.0% |
| 3-Person Household | 21,404 | 16.0% |
| 4+ Person Household | 26,716 | 19.9% |
| Total Housing Units | 134,094 | 100.0% |
Occupancy by Ownership by Household Size in Henrico County
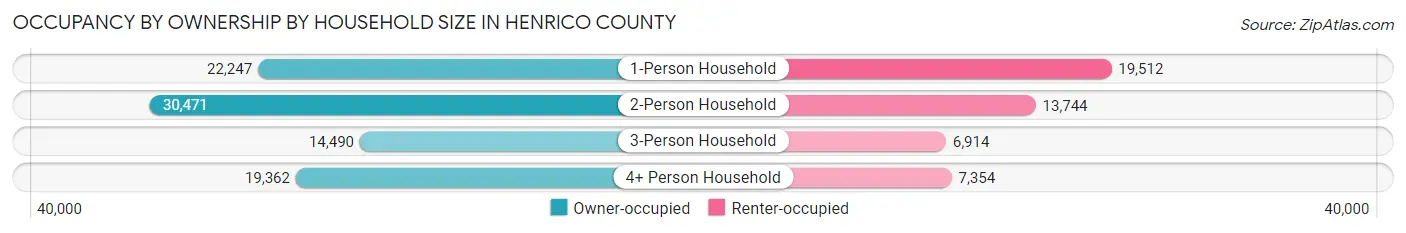
| Household Size | Owner-occupied | Renter-occupied |
| 1-Person Household | 22,247 (53.3%) | 19,512 (46.7%) |
| 2-Person Household | 30,471 (68.9%) | 13,744 (31.1%) |
| 3-Person Household | 14,490 (67.7%) | 6,914 (32.3%) |
| 4+ Person Household | 19,362 (72.5%) | 7,354 (27.5%) |
| Total Housing Units | 86,570 (64.6%) | 47,524 (35.4%) |
Occupancy by Educational Attainment in Henrico County
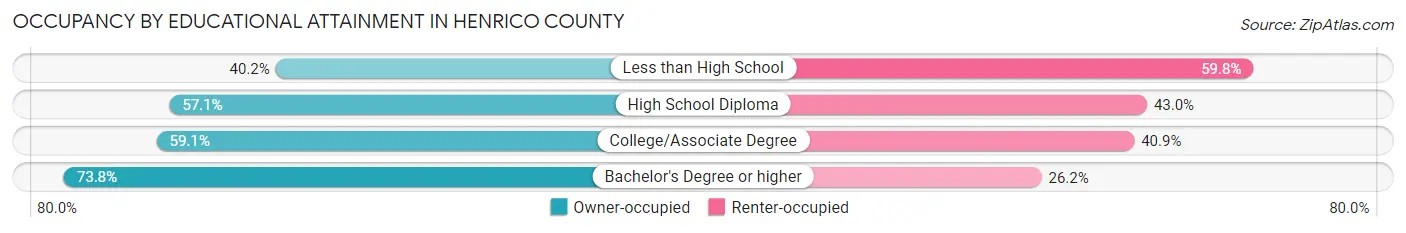
| Household Size | Owner-occupied | Renter-occupied |
| Less than High School | 3,293 (40.2%) | 4,898 (59.8%) |
| High School Diploma | 14,732 (57.1%) | 11,092 (42.9%) |
| College/Associate Degree | 21,237 (59.1%) | 14,714 (40.9%) |
| Bachelor's Degree or higher | 47,308 (73.8%) | 16,820 (26.2%) |
Occupancy by Age of Householder in Henrico County
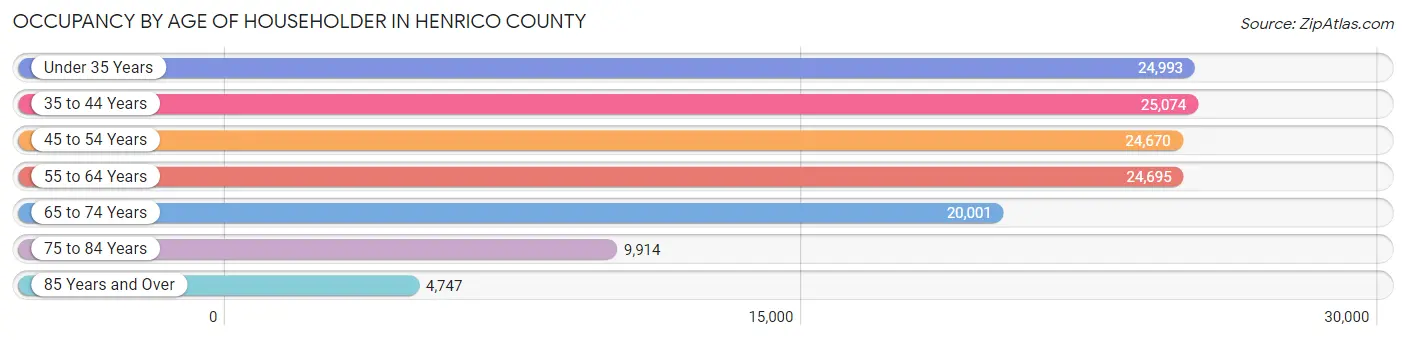
| Age Bracket | # Households | % Households |
| Under 35 Years | 24,993 | 18.6% |
| 35 to 44 Years | 25,074 | 18.7% |
| 45 to 54 Years | 24,670 | 18.4% |
| 55 to 64 Years | 24,695 | 18.4% |
| 65 to 74 Years | 20,001 | 14.9% |
| 75 to 84 Years | 9,914 | 7.4% |
| 85 Years and Over | 4,747 | 3.5% |
| Total | 134,094 | 100.0% |
Housing Finances in Henrico County
Median Income by Occupancy in Henrico County
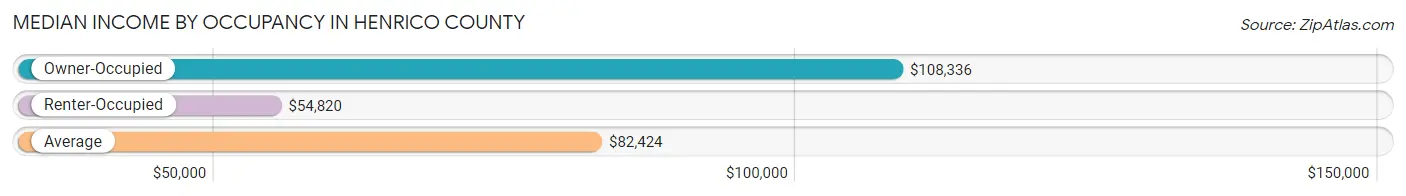
| Occupancy Type | # Households | Median Income |
| Owner-Occupied | 86,570 (64.6%) | $108,336 |
| Renter-Occupied | 47,524 (35.4%) | $54,820 |
| Average | 134,094 (100.0%) | $82,424 |
Occupancy by Householder Income Bracket in Henrico County
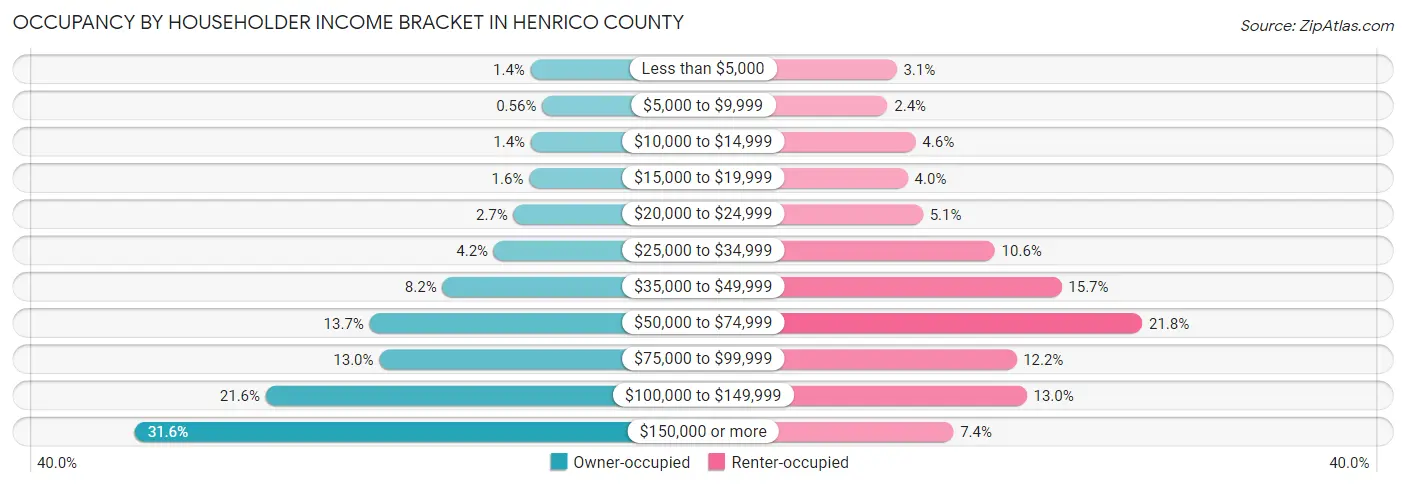
| Income Bracket | Owner-occupied | Renter-occupied |
| Less than $5,000 | 1,249 (1.4%) | 1,485 (3.1%) |
| $5,000 to $9,999 | 482 (0.6%) | 1,148 (2.4%) |
| $10,000 to $14,999 | 1,227 (1.4%) | 2,167 (4.6%) |
| $15,000 to $19,999 | 1,344 (1.5%) | 1,886 (4.0%) |
| $20,000 to $24,999 | 2,370 (2.7%) | 2,434 (5.1%) |
| $25,000 to $34,999 | 3,669 (4.2%) | 5,036 (10.6%) |
| $35,000 to $49,999 | 7,062 (8.2%) | 7,451 (15.7%) |
| $50,000 to $74,999 | 11,873 (13.7%) | 10,373 (21.8%) |
| $75,000 to $99,999 | 11,224 (13.0%) | 5,816 (12.2%) |
| $100,000 to $149,999 | 18,713 (21.6%) | 6,194 (13.0%) |
| $150,000 or more | 27,357 (31.6%) | 3,534 (7.4%) |
| Total | 86,570 (100.0%) | 47,524 (100.0%) |
Monthly Housing Cost Tiers in Henrico County

| Monthly Cost | Owner-occupied | Renter-occupied |
| Less than $300 | 2,017 (2.3%) | 705 (1.5%) |
| $300 to $499 | 8,940 (10.3%) | 749 (1.6%) |
| $500 to $799 | 10,571 (12.2%) | 1,350 (2.8%) |
| $800 to $999 | 5,993 (6.9%) | 4,162 (8.8%) |
| $1,000 to $1,499 | 17,884 (20.7%) | 21,201 (44.6%) |
| $1,500 to $1,999 | 17,413 (20.1%) | 12,827 (27.0%) |
| $2,000 to $2,499 | 10,080 (11.6%) | 3,640 (7.7%) |
| $2,500 to $2,999 | 5,408 (6.2%) | 699 (1.5%) |
| $3,000 or more | 8,264 (9.6%) | 868 (1.8%) |
| Total | 86,570 (100.0%) | 47,524 (100.0%) |
Physical Housing Characteristics in Henrico County
Housing Structures in Henrico County
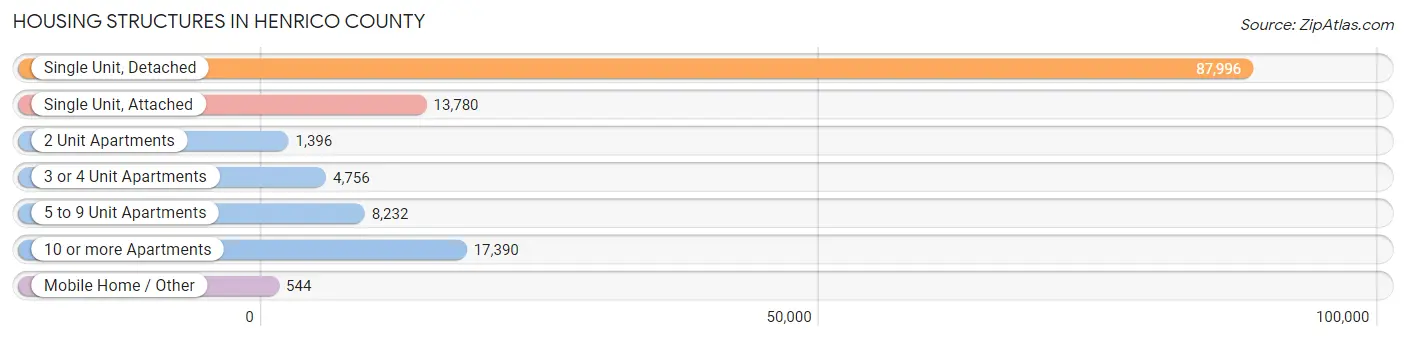
| Structure Type | # Housing Units | % Housing Units |
| Single Unit, Detached | 87,996 | 65.6% |
| Single Unit, Attached | 13,780 | 10.3% |
| 2 Unit Apartments | 1,396 | 1.0% |
| 3 or 4 Unit Apartments | 4,756 | 3.5% |
| 5 to 9 Unit Apartments | 8,232 | 6.1% |
| 10 or more Apartments | 17,390 | 13.0% |
| Mobile Home / Other | 544 | 0.4% |
| Total | 134,094 | 100.0% |
Housing Structures by Occupancy in Henrico County
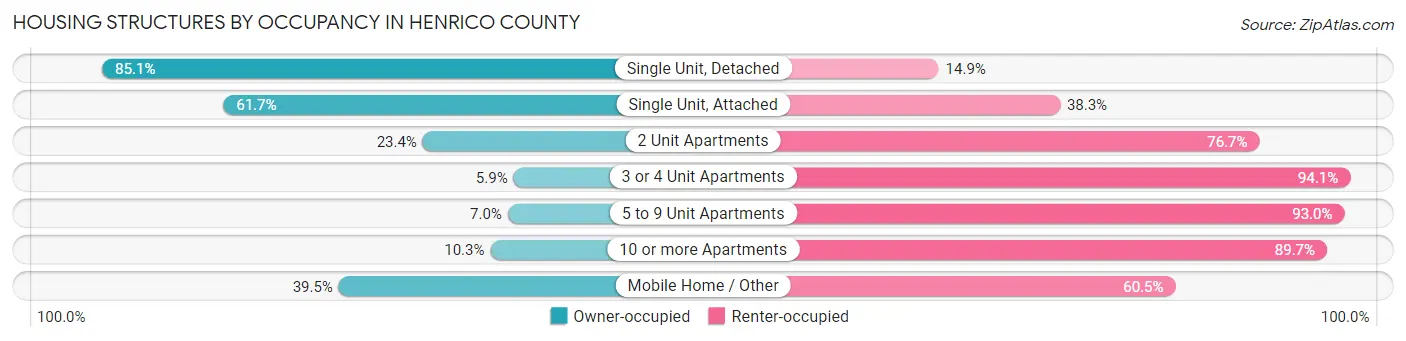
| Structure Type | Owner-occupied | Renter-occupied |
| Single Unit, Detached | 74,870 (85.1%) | 13,126 (14.9%) |
| Single Unit, Attached | 8,507 (61.7%) | 5,273 (38.3%) |
| 2 Unit Apartments | 326 (23.4%) | 1,070 (76.6%) |
| 3 or 4 Unit Apartments | 279 (5.9%) | 4,477 (94.1%) |
| 5 to 9 Unit Apartments | 575 (7.0%) | 7,657 (93.0%) |
| 10 or more Apartments | 1,798 (10.3%) | 15,592 (89.7%) |
| Mobile Home / Other | 215 (39.5%) | 329 (60.5%) |
| Total | 86,570 (64.6%) | 47,524 (35.4%) |
Housing Structures by Number of Rooms in Henrico County
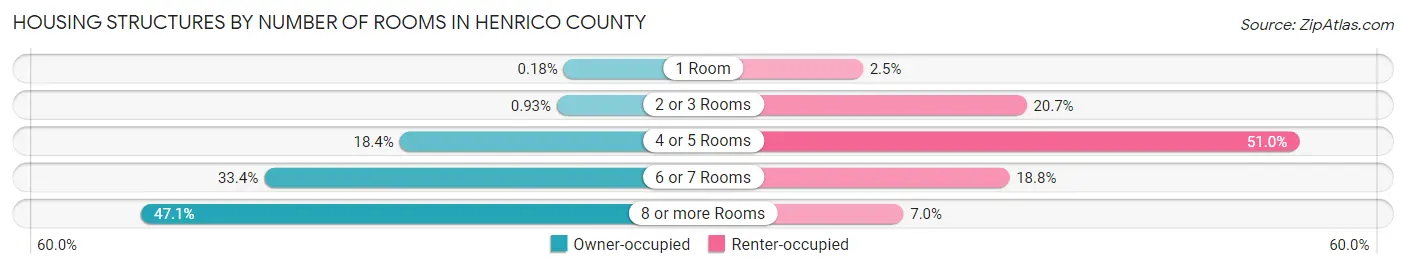
| Number of Rooms | Owner-occupied | Renter-occupied |
| 1 Room | 154 (0.2%) | 1,200 (2.5%) |
| 2 or 3 Rooms | 808 (0.9%) | 9,839 (20.7%) |
| 4 or 5 Rooms | 15,918 (18.4%) | 24,212 (50.9%) |
| 6 or 7 Rooms | 28,942 (33.4%) | 8,930 (18.8%) |
| 8 or more Rooms | 40,748 (47.1%) | 3,343 (7.0%) |
| Total | 86,570 (100.0%) | 47,524 (100.0%) |
Housing Structure by Heating Type in Henrico County
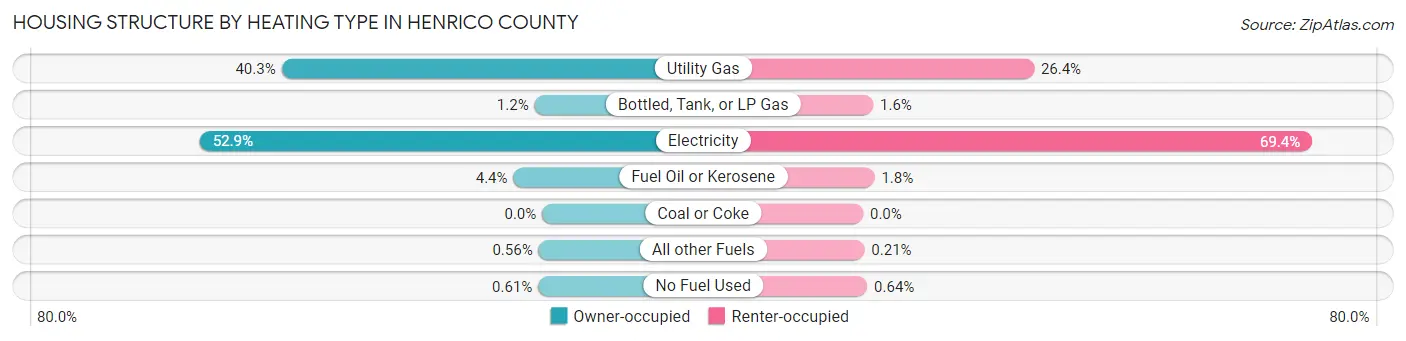
| Heating Type | Owner-occupied | Renter-occupied |
| Utility Gas | 34,879 (40.3%) | 12,556 (26.4%) |
| Bottled, Tank, or LP Gas | 1,025 (1.2%) | 741 (1.6%) |
| Electricity | 45,816 (52.9%) | 32,982 (69.4%) |
| Fuel Oil or Kerosene | 3,841 (4.4%) | 839 (1.8%) |
| Coal or Coke | 0 (0.0%) | 0 (0.0%) |
| All other Fuels | 481 (0.6%) | 100 (0.2%) |
| No Fuel Used | 528 (0.6%) | 306 (0.6%) |
| Total | 86,570 (100.0%) | 47,524 (100.0%) |
Household Vehicle Usage in Henrico County
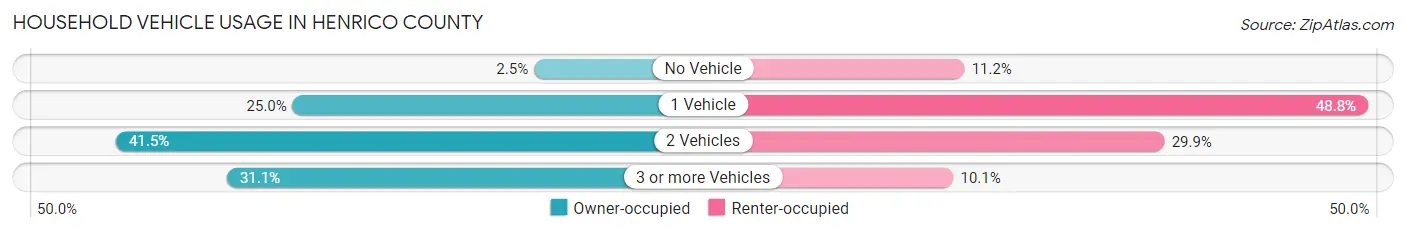
| Vehicles per Household | Owner-occupied | Renter-occupied |
| No Vehicle | 2,118 (2.5%) | 5,315 (11.2%) |
| 1 Vehicle | 21,623 (25.0%) | 23,203 (48.8%) |
| 2 Vehicles | 35,898 (41.5%) | 14,188 (29.8%) |
| 3 or more Vehicles | 26,931 (31.1%) | 4,818 (10.1%) |
| Total | 86,570 (100.0%) | 47,524 (100.0%) |
Real Estate & Mortgages in Henrico County
Real Estate and Mortgage Overview in Henrico County
| Characteristic | Without Mortgage | With Mortgage |
| Housing Units | 23,732 | 62,838 |
| Median Property Value | $292,200 | $316,400 |
| Median Household Income | $76,473 | $21,885 |
| Monthly Housing Costs | $547 | $8,171 |
| Real Estate Taxes | $2,323 | $2,333 |
Property Value by Mortgage Status in Henrico County
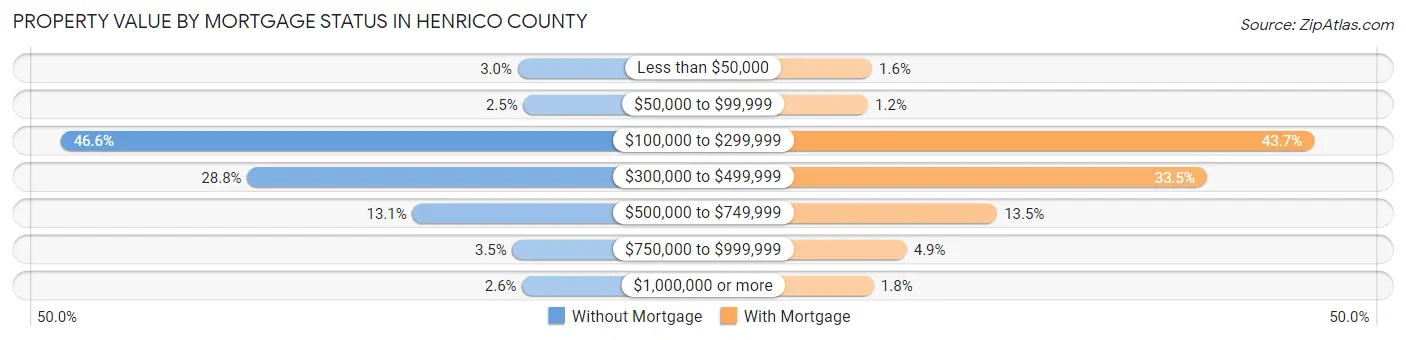
| Property Value | Without Mortgage | With Mortgage |
| Less than $50,000 | 720 (3.0%) | 990 (1.6%) |
| $50,000 to $99,999 | 588 (2.5%) | 755 (1.2%) |
| $100,000 to $299,999 | 11,049 (46.6%) | 27,435 (43.7%) |
| $300,000 to $499,999 | 6,830 (28.8%) | 21,018 (33.5%) |
| $500,000 to $749,999 | 3,096 (13.1%) | 8,475 (13.5%) |
| $750,000 to $999,999 | 835 (3.5%) | 3,068 (4.9%) |
| $1,000,000 or more | 614 (2.6%) | 1,097 (1.8%) |
| Total | 23,732 (100.0%) | 62,838 (100.0%) |
Household Income by Mortgage Status in Henrico County
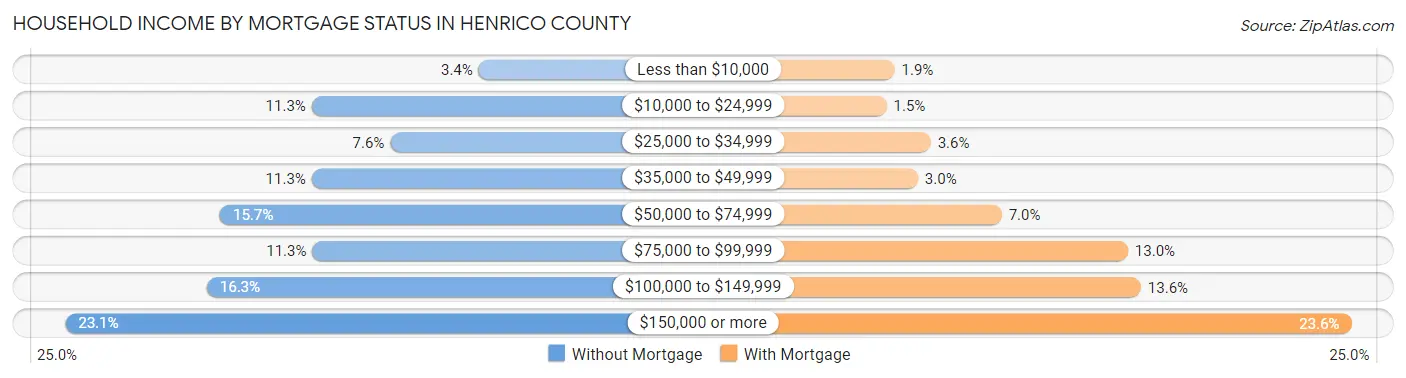
| Household Income | Without Mortgage | With Mortgage |
| Less than $10,000 | 801 (3.4%) | 1,168 (1.9%) |
| $10,000 to $24,999 | 2,690 (11.3%) | 930 (1.5%) |
| $25,000 to $34,999 | 1,801 (7.6%) | 2,251 (3.6%) |
| $35,000 to $49,999 | 2,688 (11.3%) | 1,868 (3.0%) |
| $50,000 to $74,999 | 3,724 (15.7%) | 4,374 (7.0%) |
| $75,000 to $99,999 | 2,682 (11.3%) | 8,149 (13.0%) |
| $100,000 to $149,999 | 3,874 (16.3%) | 8,542 (13.6%) |
| $150,000 or more | 5,472 (23.1%) | 14,839 (23.6%) |
| Total | 23,732 (100.0%) | 62,838 (100.0%) |
Property Value to Household Income Ratio in Henrico County
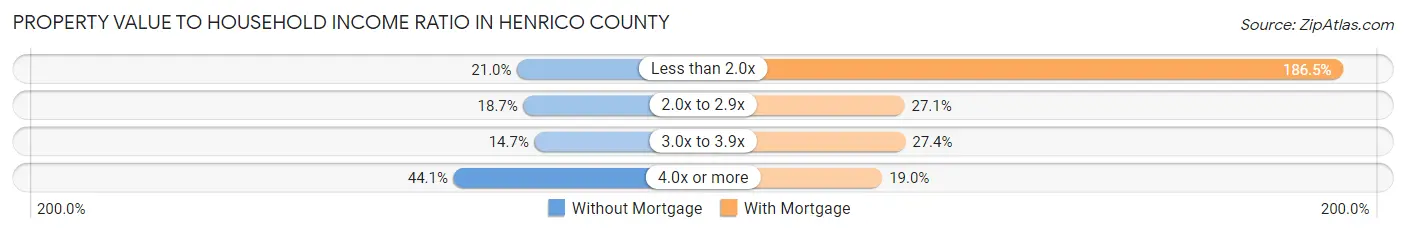
| Value-to-Income Ratio | Without Mortgage | With Mortgage |
| Less than 2.0x | 4,986 (21.0%) | 117,197 (186.5%) |
| 2.0x to 2.9x | 4,447 (18.7%) | 17,044 (27.1%) |
| 3.0x to 3.9x | 3,492 (14.7%) | 17,209 (27.4%) |
| 4.0x or more | 10,466 (44.1%) | 11,934 (19.0%) |
| Total | 23,732 (100.0%) | 62,838 (100.0%) |
Real Estate Taxes by Mortgage Status in Henrico County
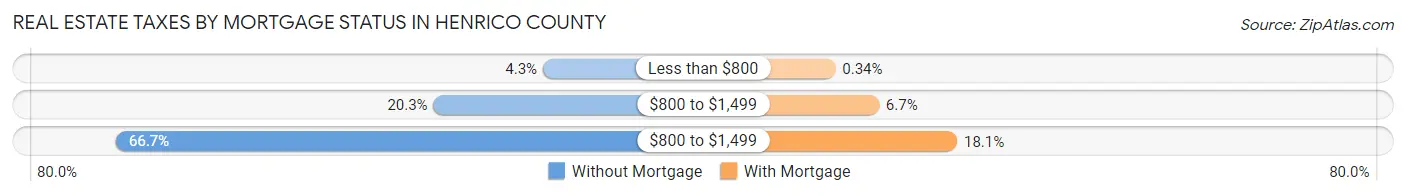
| Property Taxes | Without Mortgage | With Mortgage |
| Less than $800 | 1,010 (4.3%) | 214 (0.3%) |
| $800 to $1,499 | 4,809 (20.3%) | 4,212 (6.7%) |
| $800 to $1,499 | 15,819 (66.7%) | 11,389 (18.1%) |
| Total | 23,732 (100.0%) | 62,838 (100.0%) |
Health & Disability in Henrico County
Health Insurance Coverage by Age in Henrico County
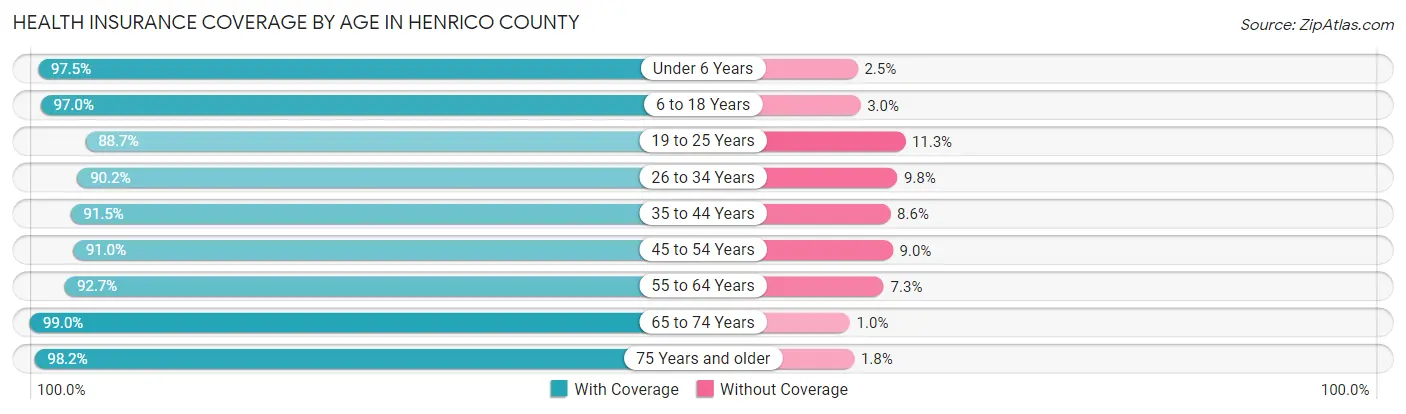
| Age Bracket | With Coverage | Without Coverage |
| Under 6 Years | 23,069 (97.5%) | 583 (2.5%) |
| 6 to 18 Years | 53,153 (97.0%) | 1,629 (3.0%) |
| 19 to 25 Years | 23,461 (88.7%) | 2,992 (11.3%) |
| 26 to 34 Years | 37,490 (90.2%) | 4,082 (9.8%) |
| 35 to 44 Years | 41,721 (91.4%) | 3,900 (8.6%) |
| 45 to 54 Years | 39,203 (91.0%) | 3,879 (9.0%) |
| 55 to 64 Years | 39,391 (92.7%) | 3,119 (7.3%) |
| 65 to 74 Years | 31,052 (99.0%) | 314 (1.0%) |
| 75 Years and older | 20,721 (98.2%) | 381 (1.8%) |
| Total | 309,261 (93.7%) | 20,879 (6.3%) |
Health Insurance Coverage by Citizenship Status in Henrico County
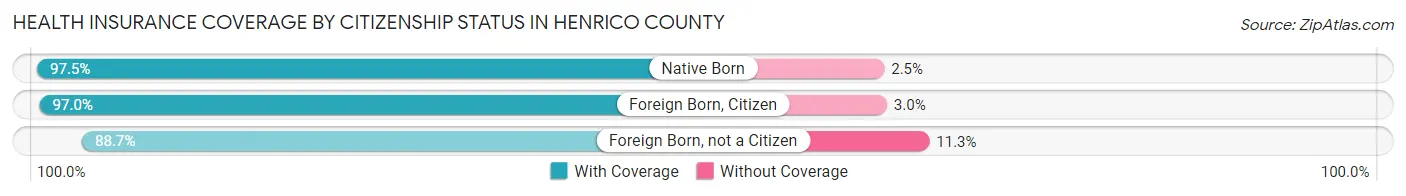
| Citizenship Status | With Coverage | Without Coverage |
| Native Born | 23,069 (97.5%) | 583 (2.5%) |
| Foreign Born, Citizen | 53,153 (97.0%) | 1,629 (3.0%) |
| Foreign Born, not a Citizen | 23,461 (88.7%) | 2,992 (11.3%) |
Health Insurance Coverage by Household Income in Henrico County
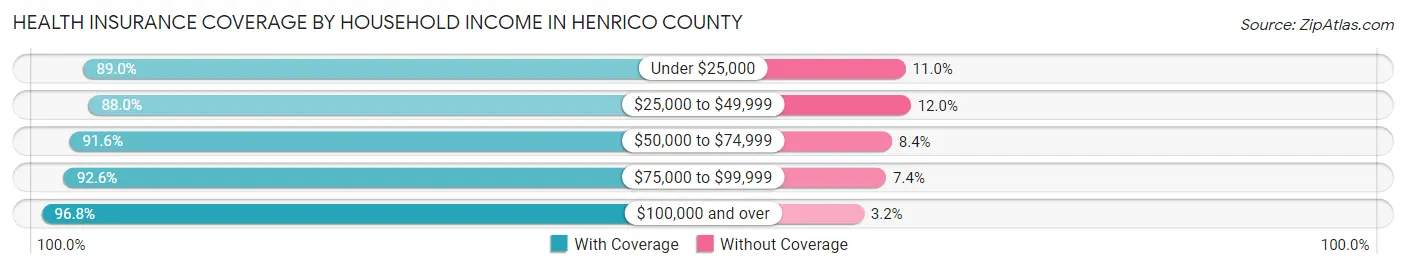
| Household Income | With Coverage | Without Coverage |
| Under $25,000 | 24,775 (89.0%) | 3,072 (11.0%) |
| $25,000 to $49,999 | 37,739 (88.0%) | 5,137 (12.0%) |
| $50,000 to $74,999 | 43,434 (91.6%) | 4,006 (8.4%) |
| $75,000 to $99,999 | 40,213 (92.6%) | 3,199 (7.4%) |
| $100,000 and over | 162,574 (96.8%) | 5,366 (3.2%) |
Public vs Private Health Insurance Coverage by Age in Henrico County
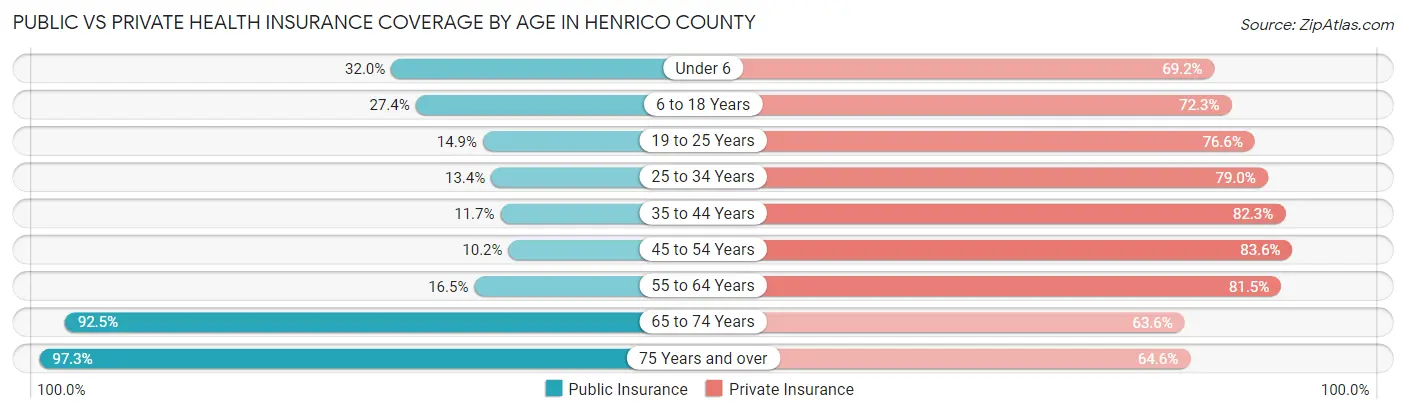
| Age Bracket | Public Insurance | Private Insurance |
| Under 6 | 7,561 (32.0%) | 16,357 (69.2%) |
| 6 to 18 Years | 15,027 (27.4%) | 39,606 (72.3%) |
| 19 to 25 Years | 3,952 (14.9%) | 20,274 (76.6%) |
| 25 to 34 Years | 5,578 (13.4%) | 32,860 (79.0%) |
| 35 to 44 Years | 5,339 (11.7%) | 37,534 (82.3%) |
| 45 to 54 Years | 4,398 (10.2%) | 36,031 (83.6%) |
| 55 to 64 Years | 7,033 (16.5%) | 34,664 (81.5%) |
| 65 to 74 Years | 29,023 (92.5%) | 19,956 (63.6%) |
| 75 Years and over | 20,525 (97.3%) | 13,641 (64.6%) |
| Total | 98,436 (29.8%) | 250,923 (76.0%) |
Disability Status by Sex by Age in Henrico County
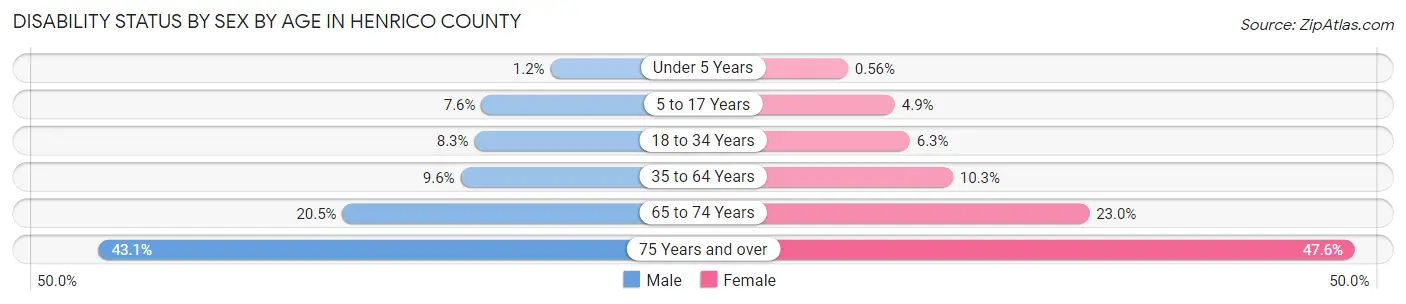
| Age Bracket | Male | Female |
| Under 5 Years | 120 (1.2%) | 53 (0.6%) |
| 5 to 17 Years | 2,129 (7.6%) | 1,310 (4.9%) |
| 18 to 34 Years | 2,932 (8.3%) | 2,323 (6.3%) |
| 35 to 64 Years | 5,941 (9.6%) | 7,111 (10.3%) |
| 65 to 74 Years | 2,844 (20.5%) | 4,016 (23.0%) |
| 75 Years and over | 3,461 (43.1%) | 6,227 (47.6%) |
Disability Class by Sex by Age in Henrico County
Disability Class: Hearing Difficulty
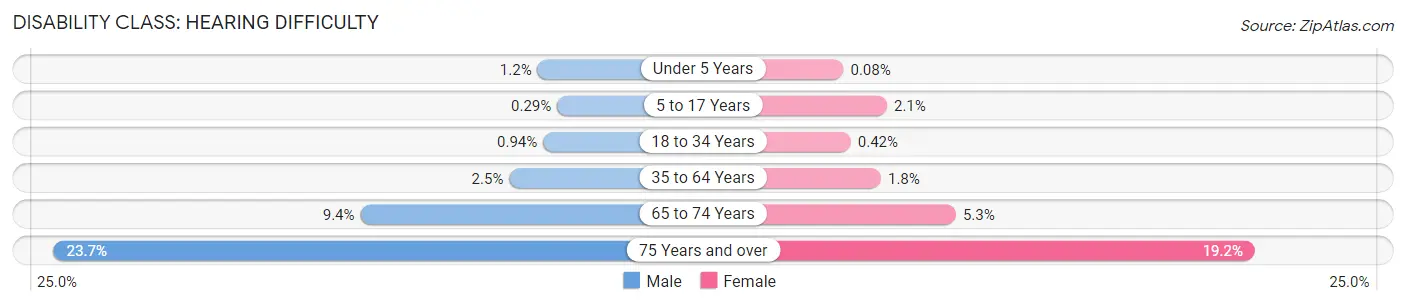
| Age Bracket | Male | Female |
| Under 5 Years | 120 (1.2%) | 8 (0.1%) |
| 5 to 17 Years | 81 (0.3%) | 558 (2.1%) |
| 18 to 34 Years | 334 (0.9%) | 155 (0.4%) |
| 35 to 64 Years | 1,559 (2.5%) | 1,256 (1.8%) |
| 65 to 74 Years | 1,307 (9.4%) | 927 (5.3%) |
| 75 Years and over | 1,898 (23.6%) | 2,506 (19.2%) |
Disability Class: Vision Difficulty
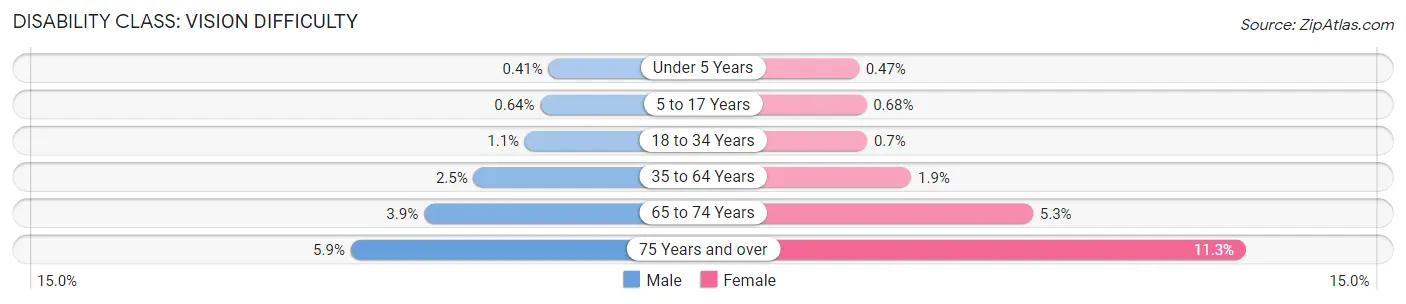
| Age Bracket | Male | Female |
| Under 5 Years | 41 (0.4%) | 45 (0.5%) |
| 5 to 17 Years | 179 (0.6%) | 182 (0.7%) |
| 18 to 34 Years | 379 (1.1%) | 257 (0.7%) |
| 35 to 64 Years | 1,554 (2.5%) | 1,330 (1.9%) |
| 65 to 74 Years | 538 (3.9%) | 930 (5.3%) |
| 75 Years and over | 475 (5.9%) | 1,471 (11.3%) |
Disability Class: Cognitive Difficulty
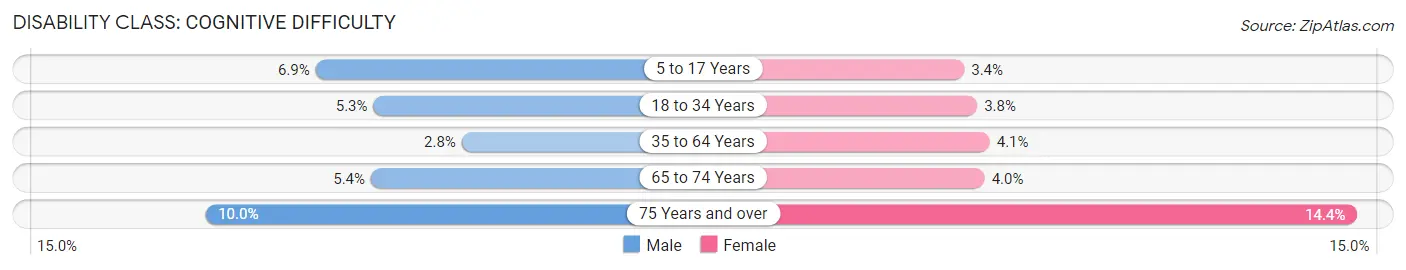
| Age Bracket | Male | Female |
| 5 to 17 Years | 1,931 (6.9%) | 908 (3.4%) |
| 18 to 34 Years | 1,878 (5.3%) | 1,387 (3.8%) |
| 35 to 64 Years | 1,761 (2.8%) | 2,842 (4.1%) |
| 65 to 74 Years | 744 (5.4%) | 697 (4.0%) |
| 75 Years and over | 800 (10.0%) | 1,877 (14.3%) |
Disability Class: Ambulatory Difficulty
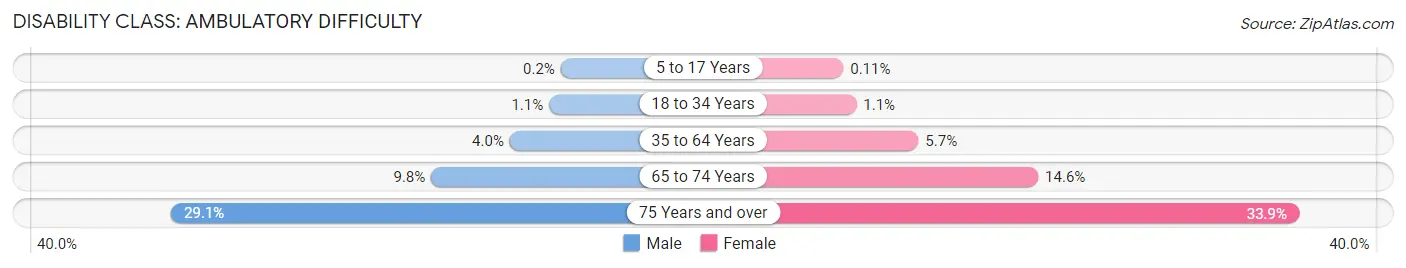
| Age Bracket | Male | Female |
| 5 to 17 Years | 55 (0.2%) | 29 (0.1%) |
| 18 to 34 Years | 377 (1.1%) | 399 (1.1%) |
| 35 to 64 Years | 2,476 (4.0%) | 3,928 (5.7%) |
| 65 to 74 Years | 1,362 (9.8%) | 2,551 (14.6%) |
| 75 Years and over | 2,338 (29.1%) | 4,437 (33.9%) |
Disability Class: Self-Care Difficulty
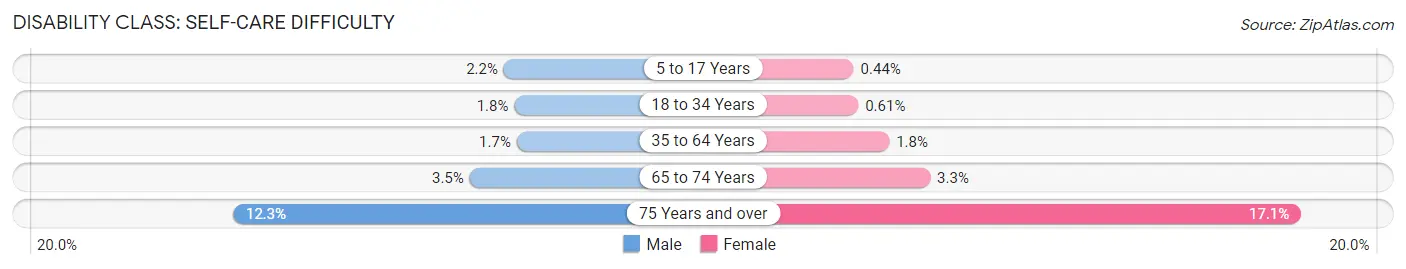
| Age Bracket | Male | Female |
| 5 to 17 Years | 617 (2.2%) | 116 (0.4%) |
| 18 to 34 Years | 646 (1.8%) | 226 (0.6%) |
| 35 to 64 Years | 1,079 (1.7%) | 1,212 (1.8%) |
| 65 to 74 Years | 483 (3.5%) | 573 (3.3%) |
| 75 Years and over | 985 (12.3%) | 2,229 (17.1%) |
Technology Access in Henrico County
Computing Device Access in Henrico County
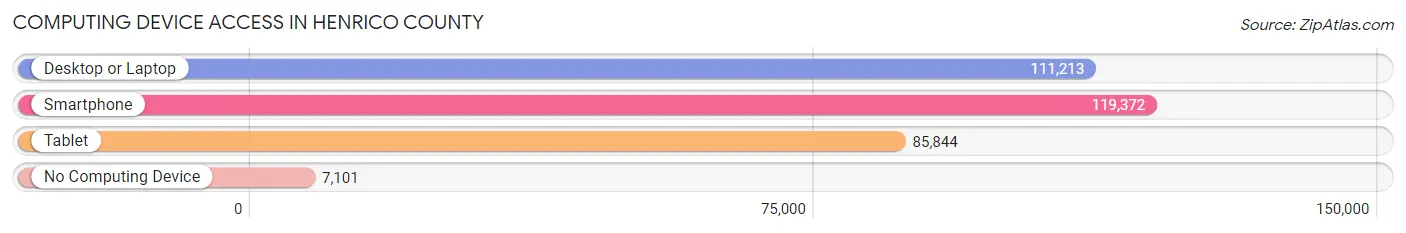
| Device Type | # Households | % Households |
| Desktop or Laptop | 111,213 | 82.9% |
| Smartphone | 119,372 | 89.0% |
| Tablet | 85,844 | 64.0% |
| No Computing Device | 7,101 | 5.3% |
| Total | 134,094 | 100.0% |
Internet Access in Henrico County
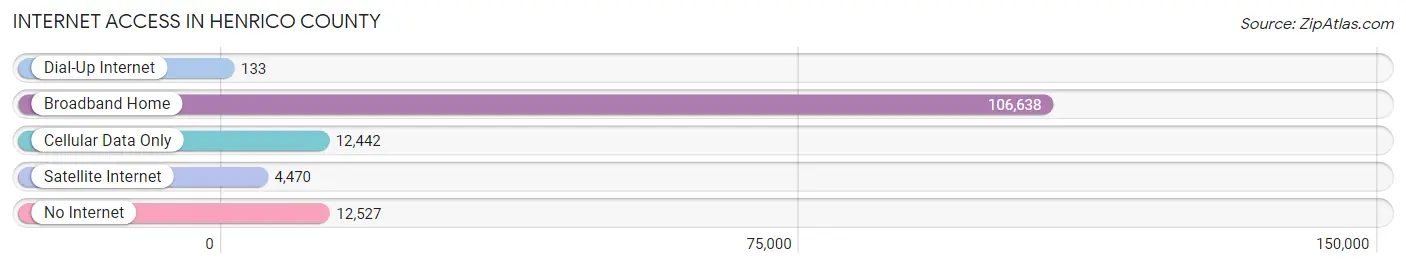
| Internet Type | # Households | % Households |
| Dial-Up Internet | 133 | 0.1% |
| Broadband Home | 106,638 | 79.5% |
| Cellular Data Only | 12,442 | 9.3% |
| Satellite Internet | 4,470 | 3.3% |
| No Internet | 12,527 | 9.3% |
| Total | 134,094 | 100.0% |
Henrico County Summary
Henrico County, Virginia is a county located in the Commonwealth of Virginia. It is part of the Greater Richmond Region and is located just east of the City of Richmond. The county is bordered by the James River to the south, the Chickahominy River to the east, and the Appomattox River to the north. The county seat is located in the town of Henrico.
Geography
Henrico County is located in the Piedmont region of Virginia, and is part of the Greater Richmond Region. The county is bordered by the James River to the south, the Chickahominy River to the east, and the Appomattox River to the north. The county is divided into two distinct regions: the western portion is mostly rural and agricultural, while the eastern portion is more urban and suburban. The county is home to several state parks, including Pocahontas State Park, Deep Run Park, and Dorey Park.
The county has a total area of 254 square miles, of which 249 square miles is land and 5 square miles is water. The highest point in the county is located at the intersection of the James and Appomattox Rivers, at an elevation of approximately 200 feet.
History
Henrico County was established in 1634, making it one of the oldest counties in the United States. The county was named after Henry, Prince of Wales, the eldest son of King James I of England. The county was originally part of Charles City County, but was later divided into its own county in 1637.
During the American Revolution, Henrico County was the site of several battles, including the Battle of Malvern Hill and the Battle of Glendale. The county was also the site of the Battle of Richmond, which was the last major battle of the Civil War.
Economy
Henrico County is home to a diverse economy, with a mix of manufacturing, retail, and service industries. The county is home to several major employers, including Capital One, Philip Morris USA, and the University of Richmond. The county is also home to several major shopping centers, including Short Pump Town Center and Regency Square Mall.
The county is also home to several major transportation hubs, including Richmond International Airport, Richmond Amtrak Station, and Richmond Greyhound Station. The county is served by several major highways, including Interstate 64, Interstate 295, and Interstate 95.
Demographics
As of the 2010 census, Henrico County had a population of 306,935. The racial makeup of the county was 68.3% White, 24.2% African American, 0.3% Native American, 3.2% Asian, 0.1% Pacific Islander, and 3.9% from two or more races. Hispanic or Latino of any race were 5.2% of the population.
The median income for a household in the county was $60,845, and the median income for a family was $71,845. The per capita income for the county was $30,845. About 8.2% of families and 10.7% of the population were below the poverty line, including 15.2% of those under age 18 and 6.2% of those age 65 or over.
Henrico County is home to a diverse population, with a mix of rural and urban areas. The county is home to several major employers, and is served by several major transportation hubs. The county is also home to several state parks, and is a popular destination for outdoor recreation.
Common Questions
What is the Total Population of Henrico County?
Total Population of Henrico County is 333,120.
What is the Total Male Population of Henrico County?
Total Male Population of Henrico County is 159,152.
What is the Total Female Population of Henrico County?
Total Female Population of Henrico County is 173,968.
What is the Ratio of Males per 100 Females in Henrico County?
There are 91.48 Males per 100 Females in Henrico County.
What is the Ratio of Females per 100 Males in Henrico County?
There are 109.31 Females per 100 Males in Henrico County.
What is the Median Population Age in Henrico County?
Median Population Age in Henrico County is 39.3 Years.
What is the Average Family Size in Henrico County
Average Family Size in Henrico County is 3.1 People.
What is the Average Household Size in Henrico County
Average Household Size in Henrico County is 2.5 People.
What is Per Capita Income in Henrico County?
Per Capita income in Henrico County is $47,865.
What is the Median Family Income in Henrico County?
Median Family Income in Henrico County is $109,916.
What is the Median Household income in Henrico County?
Median Household Income in Henrico County is $82,424.
What is Income or Wage Gap in Henrico County?
Income or Wage Gap in Henrico County is 22.0%.
Women in Henrico County earn 78.0 cents for every dollar earned by a man.
What is Family Income Deficit in Henrico County?
Family Income Deficit in Henrico County is $10,260.
Families that are below poverty line in Henrico County earn $10,260 less on average than the poverty threshold level.
What is Inequality or Gini Index in Henrico County?
Inequality or Gini Index in Henrico County is 0.47.
How Large is the Labor Force in Henrico County?
There are 184,628 People in the Labor Forcein in Henrico County.
What is the Percentage of People in the Labor Force in Henrico County?
69.1% of People are in the Labor Force in Henrico County.
What is the Unemployment Rate in Henrico County?
Unemployment Rate in Henrico County is 3.9%.