Greensville County, VA
Greensville County Map

Greensville County Overview
11,373
TOTAL POPULATION
6,951
MALE POPULATION
4,422
FEMALE POPULATION
157.19
MALES / 100 FEMALES
63.62
FEMALES / 100 MALES
40.8
MEDIAN AGE
3.2
AVG FAMILY SIZE
2.6
AVG HOUSEHOLD SIZE
$22,437
PER CAPITA INCOME
$70,573
AVG FAMILY INCOME
$51,823
AVG HOUSEHOLD INCOME
11.3%
WAGE / INCOME GAP [ % ]
88.7¢/ $1
WAGE / INCOME GAP [ $ ]
$13,337
FAMILY INCOME DEFICIT
0.46
INEQUALITY / GINI INDEX
4,195
LABOR FORCE [ PEOPLE ]
43.0%
PERCENT IN LABOR FORCE
6.3%
UNEMPLOYMENT RATE
Greensville County Area Codes
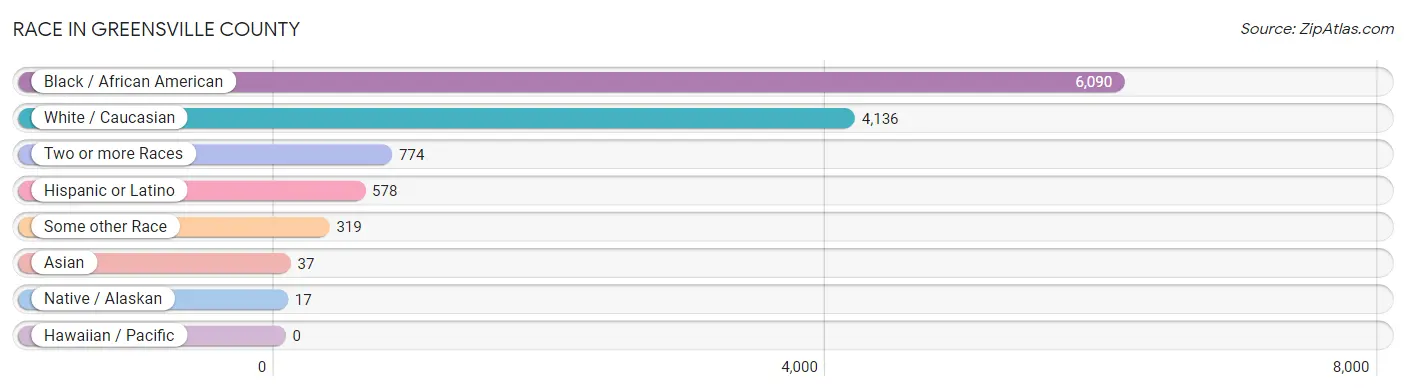
Race in Greensville County
The most populous races in Greensville County are Black / African American (6,090 | 53.5%), White / Caucasian (4,136 | 36.4%), and Two or more Races (774 | 6.8%).
| Race | # Population | % Population |
| Asian | 37 | 0.3% |
| Black / African American | 6,090 | 53.5% |
| Hawaiian / Pacific | 0 | 0.0% |
| Hispanic or Latino | 578 | 5.1% |
| Native / Alaskan | 17 | 0.2% |
| White / Caucasian | 4,136 | 36.4% |
| Two or more Races | 774 | 6.8% |
| Some other Race | 319 | 2.8% |
| Total | 11,373 | 100.0% |
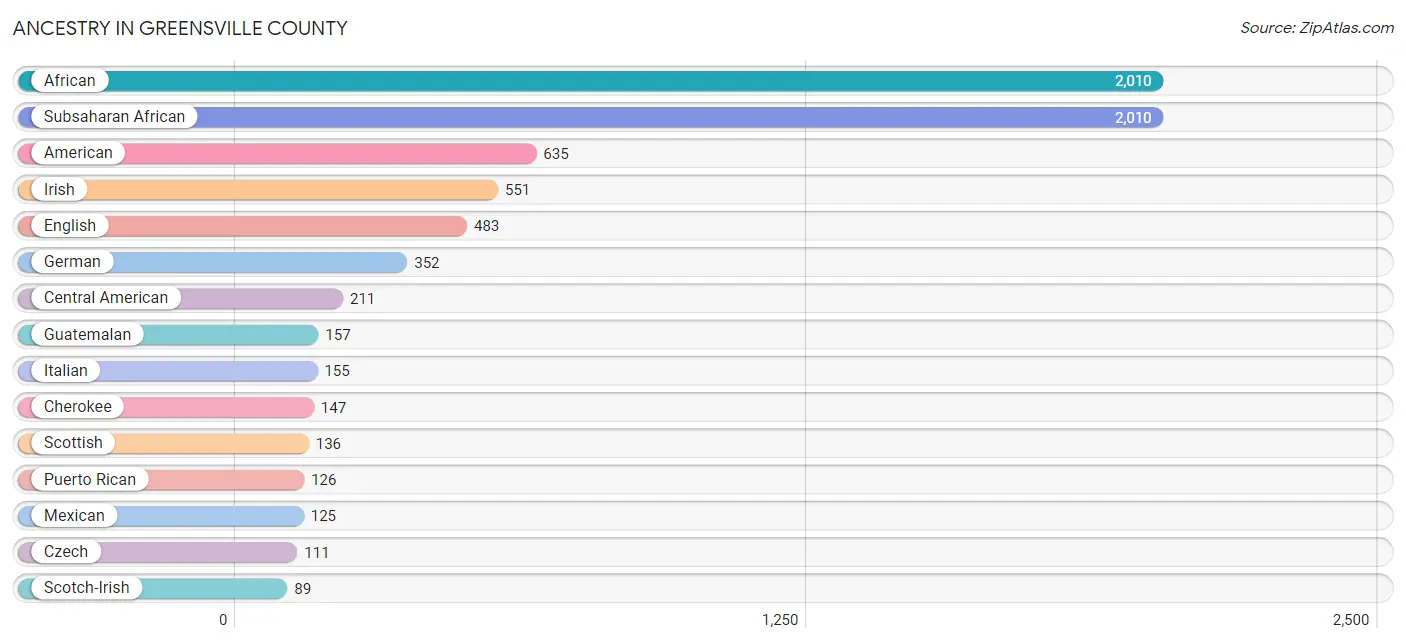
Ancestry in Greensville County
The most populous ancestries reported in Greensville County are African (2,010 | 17.7%), Subsaharan African (2,010 | 17.7%), American (635 | 5.6%), Irish (551 | 4.8%), and English (483 | 4.3%), together accounting for 50.0% of all Greensville County residents.
| Ancestry | # Population | % Population |
| African | 2,010 | 17.7% |
| American | 635 | 5.6% |
| Apache | 13 | 0.1% |
| Arab | 35 | 0.3% |
| Barbadian | 5 | 0.0% |
| Blackfeet | 8 | 0.1% |
| Bolivian | 51 | 0.4% |
| British | 54 | 0.5% |
| Burmese | 6 | 0.1% |
| Central American | 211 | 1.9% |
| Cherokee | 147 | 1.3% |
| Cuban | 12 | 0.1% |
| Czech | 111 | 1.0% |
| Czechoslovakian | 34 | 0.3% |
| Danish | 8 | 0.1% |
| Dominican | 25 | 0.2% |
| Dutch | 61 | 0.5% |
| English | 483 | 4.3% |
| European | 33 | 0.3% |
| French | 82 | 0.7% |
| French Canadian | 39 | 0.3% |
| German | 352 | 3.1% |
| Guatemalan | 157 | 1.4% |
| Haitian | 5 | 0.0% |
| Honduran | 20 | 0.2% |
| Hungarian | 40 | 0.4% |
| Indian (Asian) | 5 | 0.0% |
| Irish | 551 | 4.8% |
| Iroquois | 7 | 0.1% |
| Italian | 155 | 1.4% |
| Jamaican | 9 | 0.1% |
| Mexican | 125 | 1.1% |
| Moroccan | 35 | 0.3% |
| Norwegian | 7 | 0.1% |
| Osage | 11 | 0.1% |
| Panamanian | 5 | 0.0% |
| Polish | 28 | 0.3% |
| Portuguese | 24 | 0.2% |
| Puerto Rican | 126 | 1.1% |
| Romanian | 4 | 0.0% |
| Russian | 65 | 0.6% |
| Salvadoran | 29 | 0.3% |
| Scotch-Irish | 89 | 0.8% |
| Scottish | 136 | 1.2% |
| South American | 51 | 0.4% |
| Subsaharan African | 2,010 | 17.7% |
| Swedish | 3 | 0.0% |
| Thai | 37 | 0.3% |
| Ukrainian | 5 | 0.0% |
| Welsh | 78 | 0.7% |
| West Indian | 1 | 0.0% |
| Yaqui | 13 | 0.1% | View All 52 Rows |
Immigrants in Greensville County
The most numerous immigrant groups reported in Greensville County came from Latin America (247 | 2.2%), Asia (215 | 1.9%), Central America (179 | 1.6%), Western Asia (178 | 1.6%), and Yemen (178 | 1.6%), together accounting for 8.8% of all Greensville County residents.

| Immigration Origin | # Population | % Population |
| Africa | 9 | 0.1% |
| Asia | 215 | 1.9% |
| Bolivia | 51 | 0.4% |
| Caribbean | 17 | 0.2% |
| Central America | 179 | 1.6% |
| Cuba | 12 | 0.1% |
| Eastern Europe | 5 | 0.0% |
| El Salvador | 140 | 1.2% |
| Europe | 12 | 0.1% |
| Germany | 7 | 0.1% |
| Honduras | 20 | 0.2% |
| Latin America | 247 | 2.2% |
| Mexico | 19 | 0.2% |
| Northern Africa | 9 | 0.1% |
| Russia | 5 | 0.0% |
| South America | 51 | 0.4% |
| South Central Asia | 37 | 0.3% |
| Sudan | 9 | 0.1% |
| Western Asia | 178 | 1.6% |
| Western Europe | 7 | 0.1% |
| Yemen | 178 | 1.6% | View All 21 Rows |
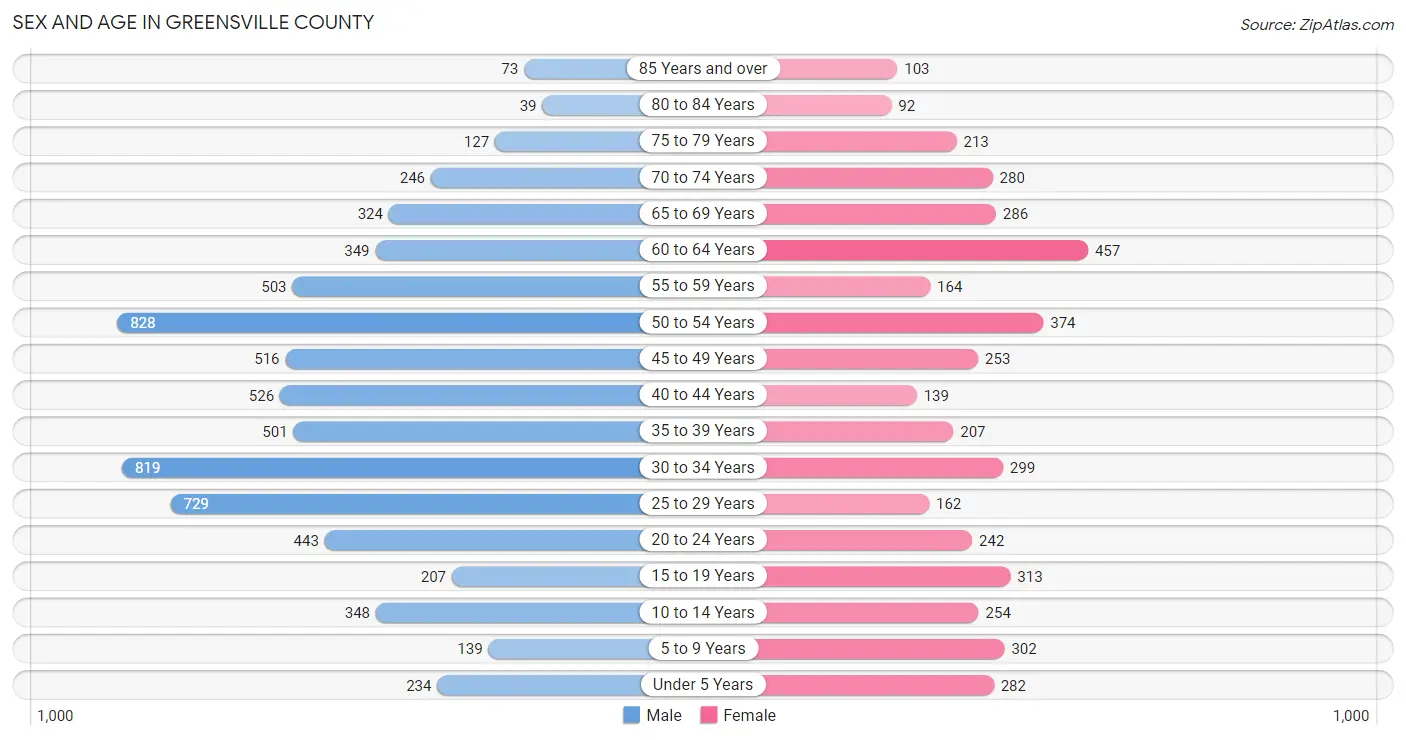
Sex and Age in Greensville County
Sex and Age in Greensville County
The most populous age groups in Greensville County are 50 to 54 Years (828 | 11.9%) for men and 60 to 64 Years (457 | 10.3%) for women.
| Age Bracket | Male | Female |
| Under 5 Years | 234 (3.4%) | 282 (6.4%) |
| 5 to 9 Years | 139 (2.0%) | 302 (6.8%) |
| 10 to 14 Years | 348 (5.0%) | 254 (5.7%) |
| 15 to 19 Years | 207 (3.0%) | 313 (7.1%) |
| 20 to 24 Years | 443 (6.4%) | 242 (5.5%) |
| 25 to 29 Years | 729 (10.5%) | 162 (3.7%) |
| 30 to 34 Years | 819 (11.8%) | 299 (6.8%) |
| 35 to 39 Years | 501 (7.2%) | 207 (4.7%) |
| 40 to 44 Years | 526 (7.6%) | 139 (3.1%) |
| 45 to 49 Years | 516 (7.4%) | 253 (5.7%) |
| 50 to 54 Years | 828 (11.9%) | 374 (8.5%) |
| 55 to 59 Years | 503 (7.2%) | 164 (3.7%) |
| 60 to 64 Years | 349 (5.0%) | 457 (10.3%) |
| 65 to 69 Years | 324 (4.7%) | 286 (6.5%) |
| 70 to 74 Years | 246 (3.5%) | 280 (6.3%) |
| 75 to 79 Years | 127 (1.8%) | 213 (4.8%) |
| 80 to 84 Years | 39 (0.6%) | 92 (2.1%) |
| 85 Years and over | 73 (1.1%) | 103 (2.3%) |
| Total | 6,951 (100.0%) | 4,422 (100.0%) |
Families and Households in Greensville County
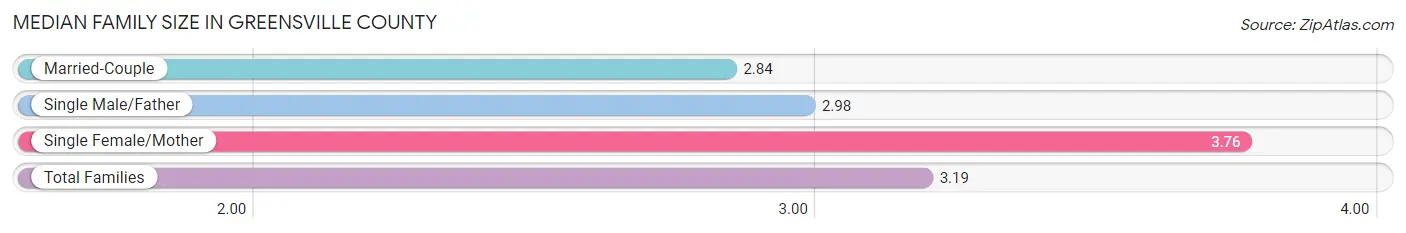
Median Family Size in Greensville County
The median family size in Greensville County is 3.19 persons per family, with single female/mother families (810 | 37.4%) accounting for the largest median family size of 3.76 persons per family. On the other hand, married-couple families (1,296 | 59.9%) represent the smallest median family size with 2.84 persons per family.
| Family Type | # Families | Family Size |
| Married-Couple | 1,296 (59.9%) | 2.84 |
| Single Male/Father | 57 (2.6%) | 2.98 |
| Single Female/Mother | 810 (37.4%) | 3.76 |
| Total Families | 2,163 (100.0%) | 3.19 |
Median Household Size in Greensville County
The median household size in Greensville County is 2.62 persons per household, with single female/mother households (810 | 25.1%) accounting for the largest median household size of 3.87 persons per household. non-family households (1,059 | 32.9%) represent the smallest median household size with 1.32 persons per household.
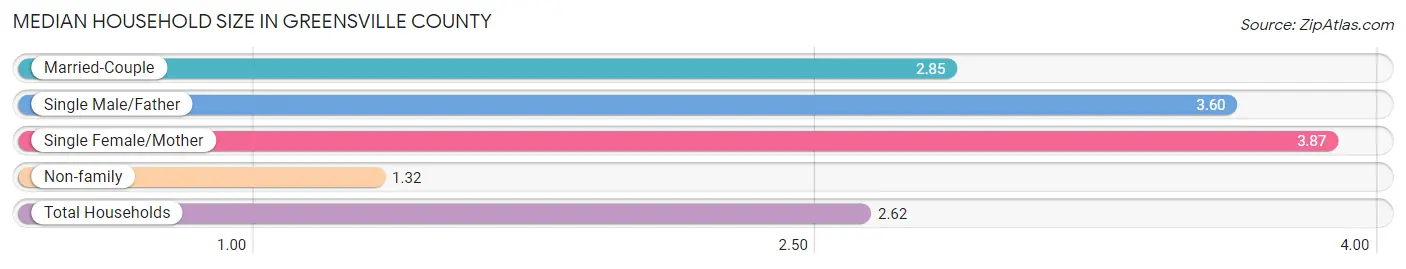
| Household Type | # Households | Household Size |
| Married-Couple | 1,296 (40.2%) | 2.85 |
| Single Male/Father | 57 (1.8%) | 3.60 |
| Single Female/Mother | 810 (25.1%) | 3.87 |
| Non-family | 1,059 (32.9%) | 1.32 |
| Total Households | 3,222 (100.0%) | 2.62 |
Household Size by Marriage Status in Greensville County
Out of a total of 3,222 households in Greensville County, 2,163 (67.1%) are family households, while 1,059 (32.9%) are nonfamily households. The most numerous type of family households are 2-person households, comprising 1,091, and the most common type of nonfamily households are 1-person households, comprising 885.
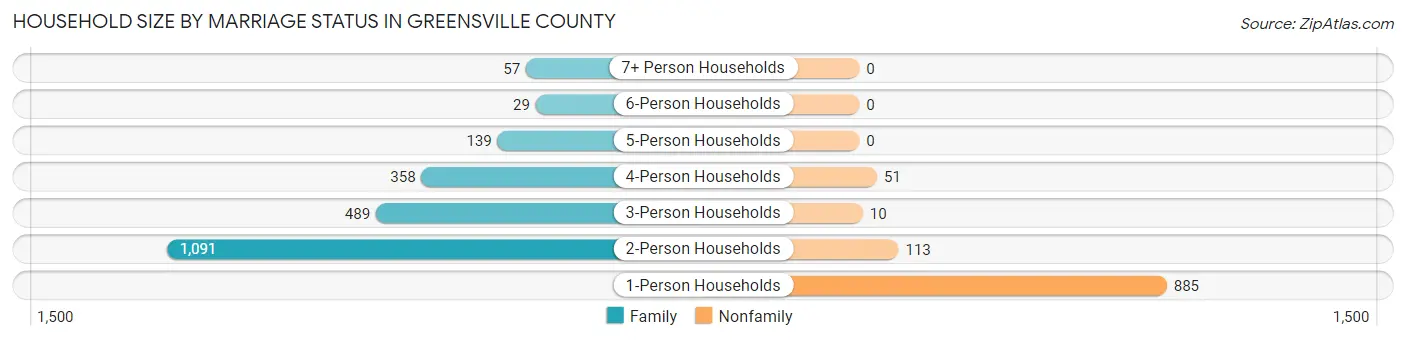
| Household Size | Family Households | Nonfamily Households |
| 1-Person Households | - | 885 (27.5%) |
| 2-Person Households | 1,091 (33.9%) | 113 (3.5%) |
| 3-Person Households | 489 (15.2%) | 10 (0.3%) |
| 4-Person Households | 358 (11.1%) | 51 (1.6%) |
| 5-Person Households | 139 (4.3%) | 0 (0.0%) |
| 6-Person Households | 29 (0.9%) | 0 (0.0%) |
| 7+ Person Households | 57 (1.8%) | 0 (0.0%) |
| Total | 2,163 (67.1%) | 1,059 (32.9%) |
Female Fertility in Greensville County
Fertility by Age in Greensville County
Average fertility rate in Greensville County is 93.0 births per 1,000 women. Women in the age bracket of 15 to 19 years have the highest fertility rate with 192.0 births per 1,000 women. Women in the age bracket of 20 to 34 years acount for 60.0% of all women with births.
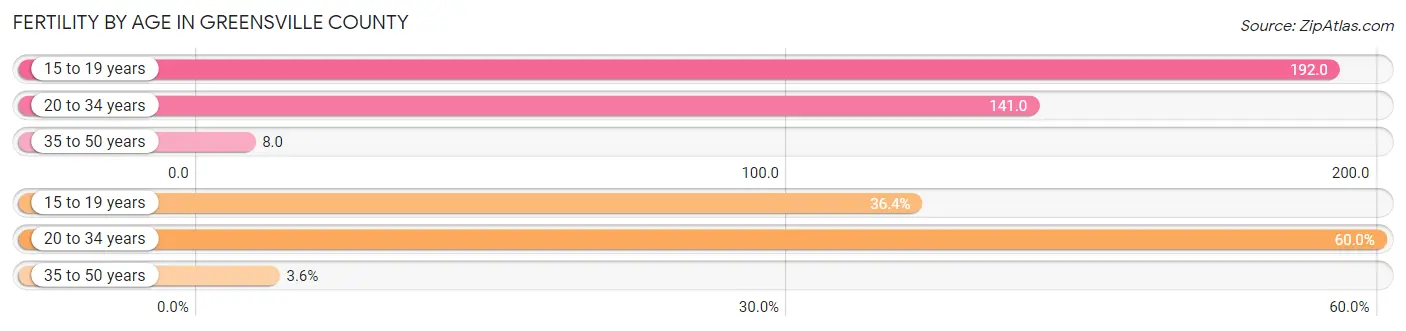
| Age Bracket | Women with Births | Births / 1,000 Women |
| 15 to 19 years | 60 (36.4%) | 192.0 |
| 20 to 34 years | 99 (60.0%) | 141.0 |
| 35 to 50 years | 6 (3.6%) | 8.0 |
| Total | 165 (100.0%) | 93.0 |
Fertility by Age by Marriage Status in Greensville County
20.0% of women with births (165) in Greensville County are married. The highest percentage of unmarried women with births falls into 15 to 19 years age bracket with 100.0% of them unmarried at the time of birth, while the lowest percentage of unmarried women with births belong to 20 to 34 years age bracket with 66.7% of them unmarried.

| Age Bracket | Married | Unmarried |
| 15 to 19 years | 0 (0.0%) | 60 (100.0%) |
| 20 to 34 years | 33 (33.3%) | 66 (66.7%) |
| 35 to 50 years | 0 (0.0%) | 6 (100.0%) |
| Total | 33 (20.0%) | 132 (80.0%) |
Fertility by Education in Greensville County
Average fertility rate in Greensville County is 93.0 births per 1,000 women. Women with the education attainment of less than high school have the highest fertility rate of 137.0 births per 1,000 women, while women with the education attainment of graduate degree have the lowest fertility at 6.0 births per 1,000 women. Women with the education attainment of less than high school represent 36.4% of all women with births.
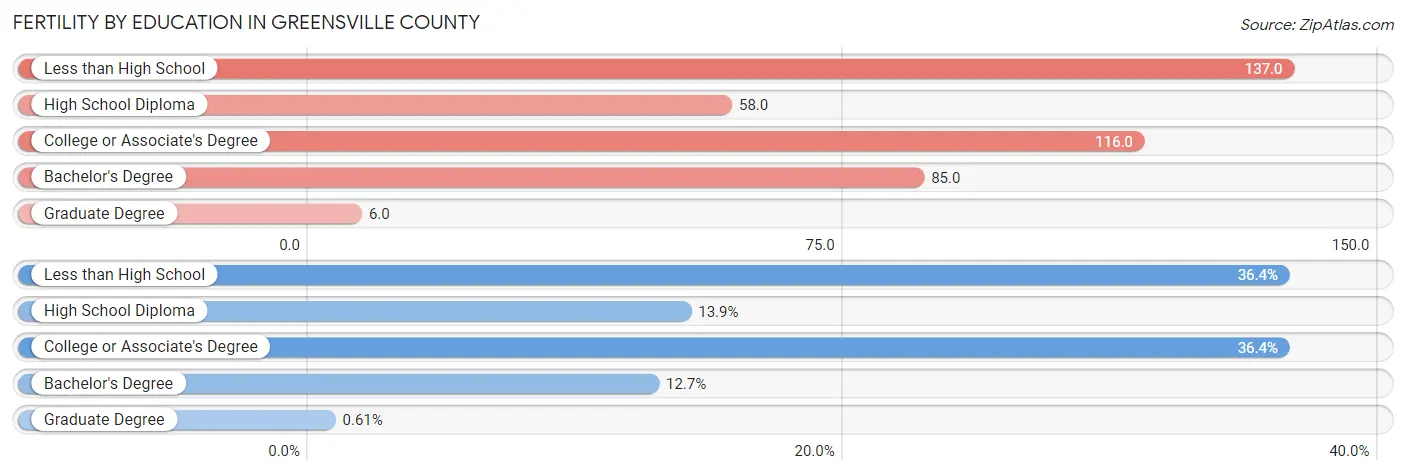
| Educational Attainment | Women with Births | Births / 1,000 Women |
| Less than High School | 60 (36.4%) | 137.0 |
| High School Diploma | 23 (13.9%) | 58.0 |
| College or Associate's Degree | 60 (36.4%) | 116.0 |
| Bachelor's Degree | 21 (12.7%) | 85.0 |
| Graduate Degree | 1 (0.6%) | 6.0 |
| Total | 165 (100.0%) | 93.0 |
Fertility by Education by Marriage Status in Greensville County
80.0% of women with births in Greensville County are unmarried. Women with the educational attainment of high school diploma are most likely to be married with 100.0% of them married at childbirth, while women with the educational attainment of less than high school are least likely to be married with 100.0% of them unmarried at childbirth.
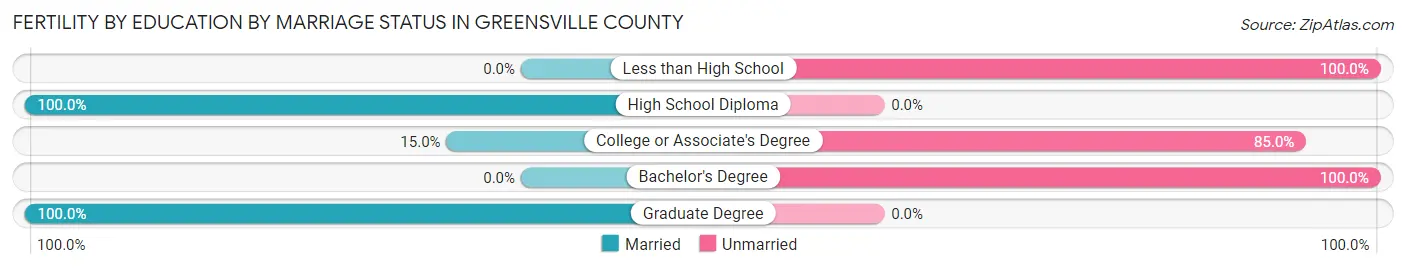
| Educational Attainment | Married | Unmarried |
| Less than High School | 0 (0.0%) | 60 (100.0%) |
| High School Diploma | 23 (100.0%) | 0 (0.0%) |
| College or Associate's Degree | 9 (15.0%) | 51 (85.0%) |
| Bachelor's Degree | 0 (0.0%) | 21 (100.0%) |
| Graduate Degree | 1 (100.0%) | 0 (0.0%) |
| Total | 33 (20.0%) | 132 (80.0%) |
Income in Greensville County
Income Overview in Greensville County
Per Capita Income in Greensville County is $22,437, while median incomes of families and households are $70,573 and $51,823 respectively.
| Characteristic | Number | Measure |
| Per Capita Income | 11,373 | $22,437 |
| Median Family Income | 2,163 | $70,573 |
| Mean Family Income | 2,163 | $92,548 |
| Median Household Income | 3,222 | $51,823 |
| Mean Household Income | 3,222 | $74,132 |
| Income Deficit | 2,163 | $13,337 |
| Wage / Income Gap (%) | 11,373 | 11.31% |
| Wage / Income Gap ($) | 11,373 | 88.69¢ per $1 |
| Gini / Inequality Index | 11,373 | 0.46 |
Earnings by Sex in Greensville County
Average Earnings in Greensville County are $30,196, $32,196 for men and $28,554 for women, a difference of 11.3%.
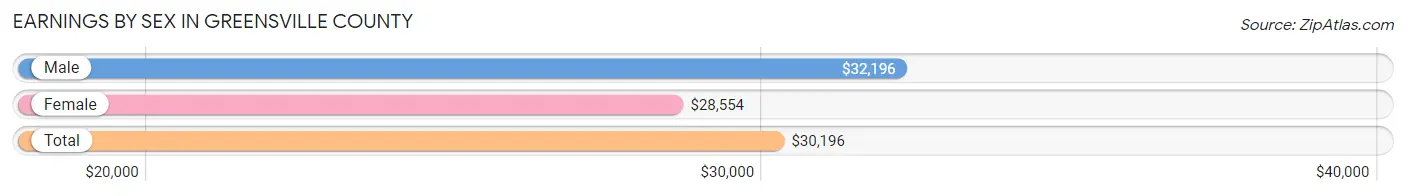
| Sex | Number | Average Earnings |
| Male | 2,408 (51.7%) | $32,196 |
| Female | 2,246 (48.3%) | $28,554 |
| Total | 4,654 (100.0%) | $30,196 |
Earnings by Sex by Income Bracket in Greensville County
The most common earnings brackets in Greensville County are $30,000 to $34,999 for men (314 | 13.0%) and $30,000 to $34,999 for women (280 | 12.5%).
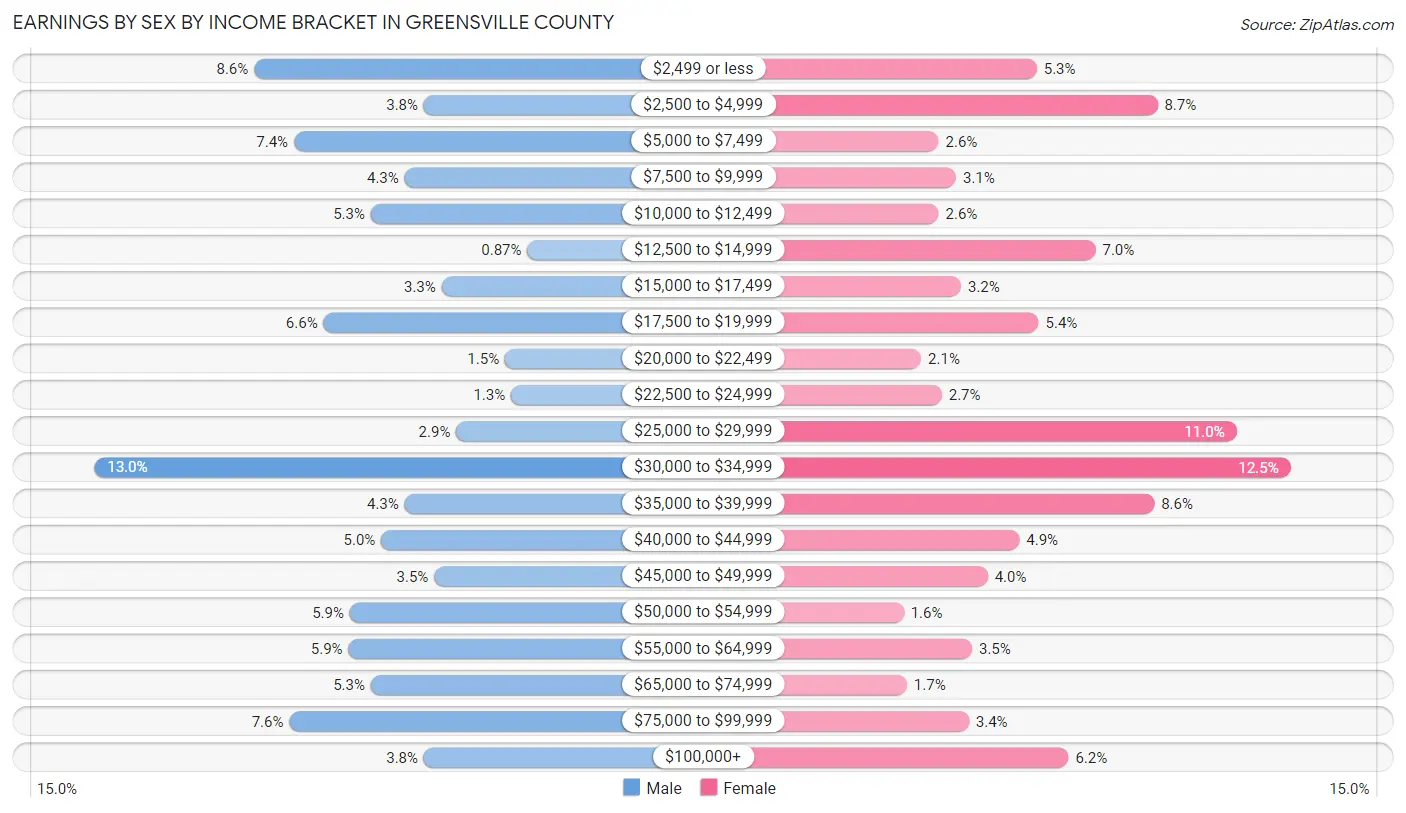
| Income | Male | Female |
| $2,499 or less | 206 (8.6%) | 120 (5.3%) |
| $2,500 to $4,999 | 91 (3.8%) | 196 (8.7%) |
| $5,000 to $7,499 | 179 (7.4%) | 58 (2.6%) |
| $7,500 to $9,999 | 104 (4.3%) | 69 (3.1%) |
| $10,000 to $12,499 | 127 (5.3%) | 58 (2.6%) |
| $12,500 to $14,999 | 21 (0.9%) | 157 (7.0%) |
| $15,000 to $17,499 | 79 (3.3%) | 72 (3.2%) |
| $17,500 to $19,999 | 159 (6.6%) | 121 (5.4%) |
| $20,000 to $22,499 | 36 (1.5%) | 47 (2.1%) |
| $22,500 to $24,999 | 32 (1.3%) | 60 (2.7%) |
| $25,000 to $29,999 | 69 (2.9%) | 246 (11.0%) |
| $30,000 to $34,999 | 314 (13.0%) | 280 (12.5%) |
| $35,000 to $39,999 | 104 (4.3%) | 194 (8.6%) |
| $40,000 to $44,999 | 120 (5.0%) | 109 (4.9%) |
| $45,000 to $49,999 | 84 (3.5%) | 89 (4.0%) |
| $50,000 to $54,999 | 141 (5.9%) | 36 (1.6%) |
| $55,000 to $64,999 | 142 (5.9%) | 79 (3.5%) |
| $65,000 to $74,999 | 127 (5.3%) | 38 (1.7%) |
| $75,000 to $99,999 | 182 (7.6%) | 77 (3.4%) |
| $100,000+ | 91 (3.8%) | 140 (6.2%) |
| Total | 2,408 (100.0%) | 2,246 (100.0%) |
Earnings by Sex by Educational Attainment in Greensville County
Average earnings in Greensville County are $35,786 for men and $32,352 for women, a difference of 9.6%. Men with an educational attainment of graduate degree enjoy the highest average annual earnings of $250,001, while those with high school diploma education earn the least with $30,625. Women with an educational attainment of bachelor's degree earn the most with the average annual earnings of $44,847, while those with less than high school education have the smallest earnings of $20,772.

| Educational Attainment | Male Income | Female Income |
| Less than High School | - | - |
| High School Diploma | $30,625 | $31,008 |
| College or Associate's Degree | $37,475 | $35,197 |
| Bachelor's Degree | $57,344 | $44,847 |
| Graduate Degree | $250,001 | $0 |
| Total | $35,786 | $32,352 |
Family Income in Greensville County
Family Income Brackets in Greensville County
According to the Greensville County family income data, there are 394 families falling into the $50,000 to $74,999 income range, which is the most common income bracket and makes up 18.2% of all families. Conversely, the $10,000 to $14,999 income bracket is the least frequent group with only 56 families (2.6%) belonging to this category.
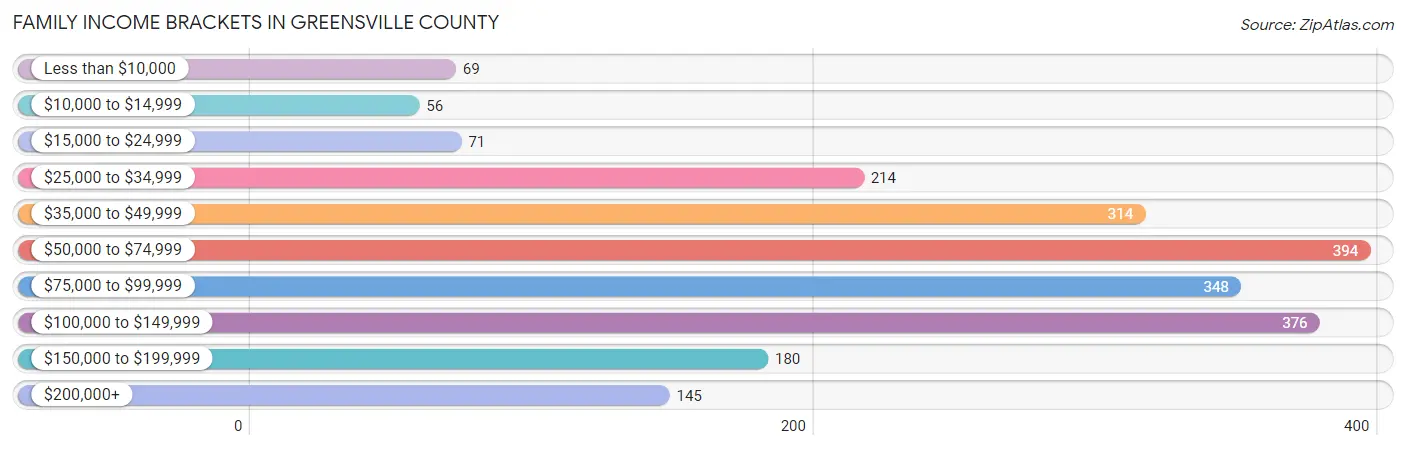
| Income Bracket | # Families | % Families |
| Less than $10,000 | 69 | 3.2% |
| $10,000 to $14,999 | 56 | 2.6% |
| $15,000 to $24,999 | 71 | 3.3% |
| $25,000 to $34,999 | 214 | 9.9% |
| $35,000 to $49,999 | 314 | 14.5% |
| $50,000 to $74,999 | 394 | 18.2% |
| $75,000 to $99,999 | 348 | 16.1% |
| $100,000 to $149,999 | 376 | 17.4% |
| $150,000 to $199,999 | 180 | 8.3% |
| $200,000+ | 145 | 6.7% |
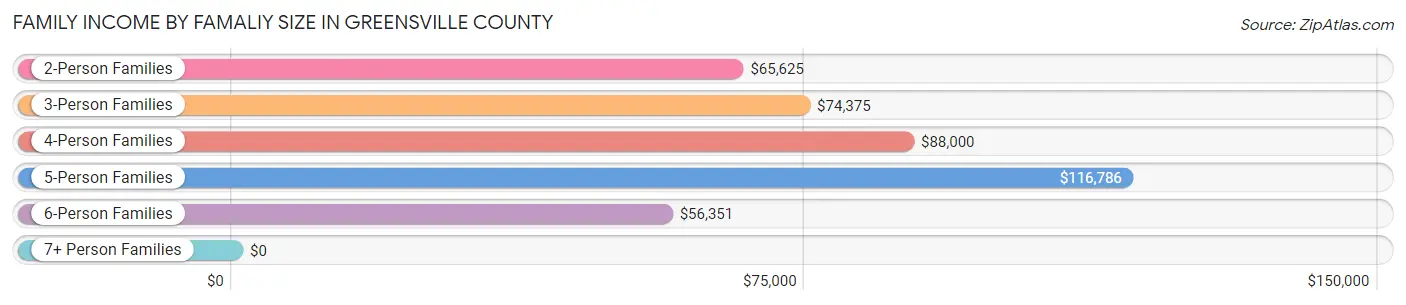
Family Income by Famaliy Size in Greensville County
5-person families (116 | 5.4%) account for the highest median family income in Greensville County with $116,786 per family, while 2-person families (1,103 | 51.0%) have the highest median income of $32,812 per family member.
| Income Bracket | # Families | Median Income |
| 2-Person Families | 1,103 (51.0%) | $65,625 |
| 3-Person Families | 518 (23.9%) | $74,375 |
| 4-Person Families | 342 (15.8%) | $88,000 |
| 5-Person Families | 116 (5.4%) | $116,786 |
| 6-Person Families | 64 (3.0%) | $56,351 |
| 7+ Person Families | 20 (0.9%) | $0 |
| Total | 2,163 (100.0%) | $70,573 |
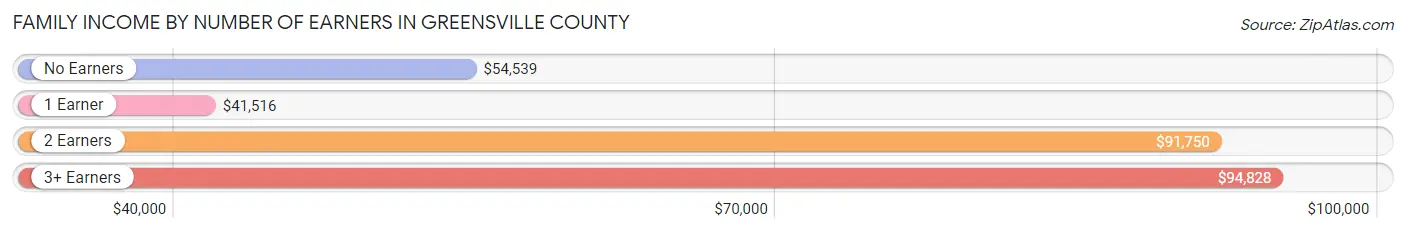
Family Income by Number of Earners in Greensville County
The median family income in Greensville County is $70,573, with families comprising 3+ earners (278) having the highest median family income of $94,828, while families with 1 earner (583) have the lowest median family income of $41,516, accounting for 12.9% and 27.0% of families, respectively.
| Number of Earners | # Families | Median Income |
| No Earners | 369 (17.1%) | $54,539 |
| 1 Earner | 583 (27.0%) | $41,516 |
| 2 Earners | 933 (43.1%) | $91,750 |
| 3+ Earners | 278 (12.9%) | $94,828 |
| Total | 2,163 (100.0%) | $70,573 |
Household Income in Greensville County
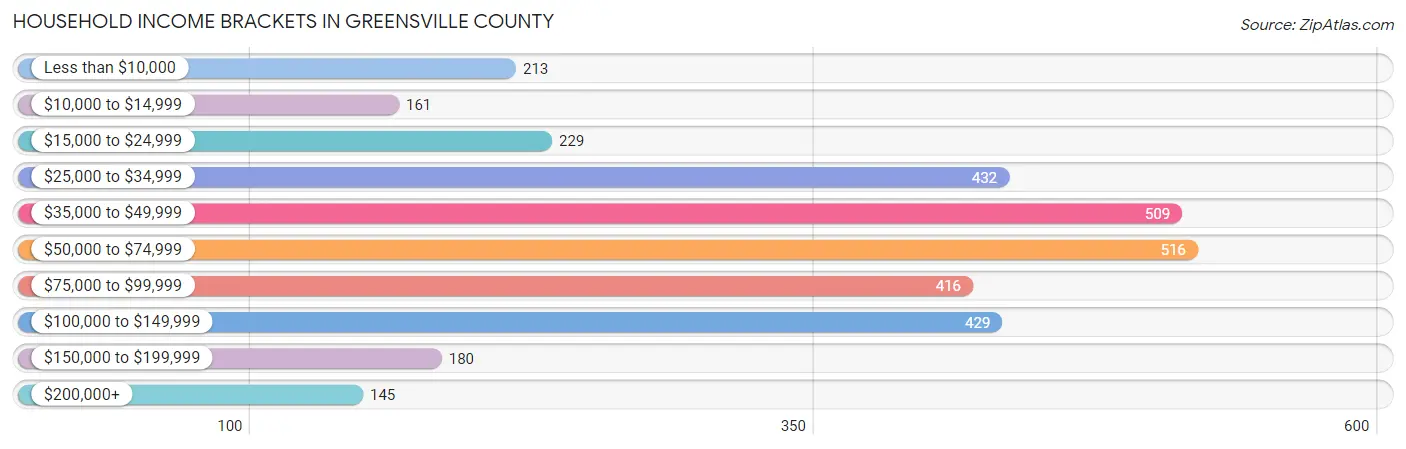
Household Income Brackets in Greensville County
With 516 households falling in the category, the $50,000 to $74,999 income range is the most frequent in Greensville County, accounting for 16.0% of all households. In contrast, only 145 households (4.5%) fall into the $200,000+ income bracket, making it the least populous group.
| Income Bracket | # Households | % Households |
| Less than $10,000 | 213 | 6.6% |
| $10,000 to $14,999 | 161 | 5.0% |
| $15,000 to $24,999 | 229 | 7.1% |
| $25,000 to $34,999 | 432 | 13.4% |
| $35,000 to $49,999 | 509 | 15.8% |
| $50,000 to $74,999 | 516 | 16.0% |
| $75,000 to $99,999 | 416 | 12.9% |
| $100,000 to $149,999 | 429 | 13.3% |
| $150,000 to $199,999 | 180 | 5.6% |
| $200,000+ | 145 | 4.5% |
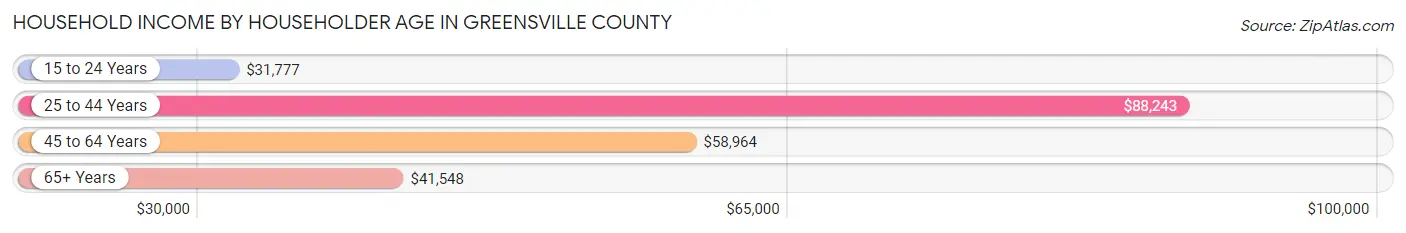
Household Income by Householder Age in Greensville County
The median household income in Greensville County is $51,823, with the highest median household income of $88,243 found in the 25 to 44 years age bracket for the primary householder. A total of 676 households (21.0%) fall into this category. Meanwhile, the 15 to 24 years age bracket for the primary householder has the lowest median household income of $31,777, with 129 households (4.0%) in this group.
| Income Bracket | # Households | Median Income |
| 15 to 24 Years | 129 (4.0%) | $31,777 |
| 25 to 44 Years | 676 (21.0%) | $88,243 |
| 45 to 64 Years | 1,361 (42.2%) | $58,964 |
| 65+ Years | 1,056 (32.8%) | $41,548 |
| Total | 3,222 (100.0%) | $51,823 |
Poverty in Greensville County
Income Below Poverty by Sex and Age in Greensville County
With 12.8% poverty level for males and 13.0% for females among the residents of Greensville County, 5 year old males and 6 to 11 year old females are the most vulnerable to poverty, with 1 males (100.0%) and 158 females (41.9%) in their respective age groups living below the poverty level.

| Age Bracket | Male | Female |
| Under 5 Years | 0 (0.0%) | 22 (7.8%) |
| 5 Years | 1 (100.0%) | 0 (0.0%) |
| 6 to 11 Years | 40 (12.8%) | 158 (41.9%) |
| 12 to 14 Years | 31 (17.8%) | 2 (1.5%) |
| 15 Years | 0 (0.0%) | 0 (0.0%) |
| 16 and 17 Years | 0 (0.0%) | 0 (0.0%) |
| 18 to 24 Years | 94 (19.5%) | 26 (8.0%) |
| 25 to 34 Years | 26 (3.8%) | 58 (12.7%) |
| 35 to 44 Years | 44 (21.0%) | 23 (6.7%) |
| 45 to 54 Years | 117 (16.0%) | 90 (14.3%) |
| 55 to 64 Years | 15 (3.8%) | 23 (3.7%) |
| 65 to 74 Years | 134 (25.4%) | 126 (22.3%) |
| 75 Years and over | 16 (6.7%) | 44 (10.8%) |
| Total | 518 (12.8%) | 572 (13.0%) |
Income Above Poverty by Sex and Age in Greensville County
According to the poverty statistics in Greensville County, males aged under 5 years and females aged 5 years are the age groups that are most secure financially, with 100.0% of males and 100.0% of females in these age groups living above the poverty line.

| Age Bracket | Male | Female |
| Under 5 Years | 234 (100.0%) | 260 (92.2%) |
| 5 Years | 0 (0.0%) | 40 (100.0%) |
| 6 to 11 Years | 272 (87.2%) | 219 (58.1%) |
| 12 to 14 Years | 143 (82.2%) | 133 (98.5%) |
| 15 Years | 11 (100.0%) | 42 (100.0%) |
| 16 and 17 Years | 52 (100.0%) | 163 (100.0%) |
| 18 to 24 Years | 389 (80.5%) | 301 (92.0%) |
| 25 to 34 Years | 649 (96.2%) | 398 (87.3%) |
| 35 to 44 Years | 165 (78.9%) | 318 (93.3%) |
| 45 to 54 Years | 614 (84.0%) | 537 (85.7%) |
| 55 to 64 Years | 378 (96.2%) | 598 (96.3%) |
| 65 to 74 Years | 394 (74.6%) | 440 (77.7%) |
| 75 Years and over | 223 (93.3%) | 364 (89.2%) |
| Total | 3,524 (87.2%) | 3,813 (87.0%) |
Income Below Poverty Among Married-Couple Families in Greensville County
The poverty statistics for married-couple families in Greensville County show that 4.4% or 57 of the total 1,296 families live below the poverty line. Families with no children have the highest poverty rate of 6.0%, comprising of 52 families. On the other hand, families with 3 or 4 children have the lowest poverty rate of 0.0%, which includes 0 families.
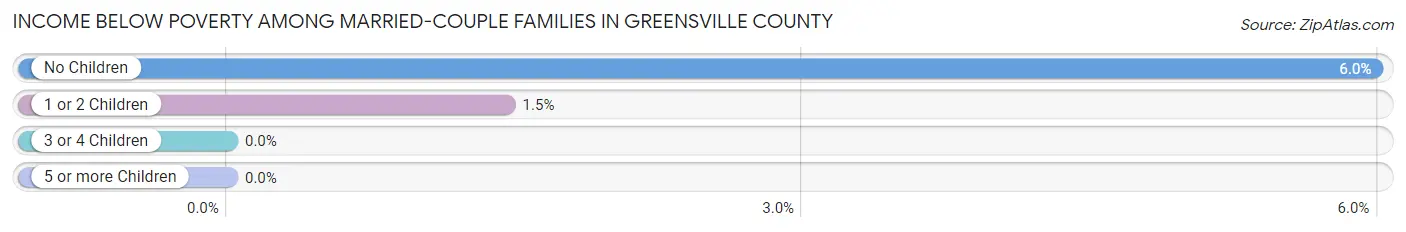
| Children | Above Poverty | Below Poverty |
| No Children | 818 (94.0%) | 52 (6.0%) |
| 1 or 2 Children | 340 (98.6%) | 5 (1.5%) |
| 3 or 4 Children | 61 (100.0%) | 0 (0.0%) |
| 5 or more Children | 20 (100.0%) | 0 (0.0%) |
| Total | 1,239 (95.6%) | 57 (4.4%) |
Income Below Poverty Among Single-Parent Households in Greensville County
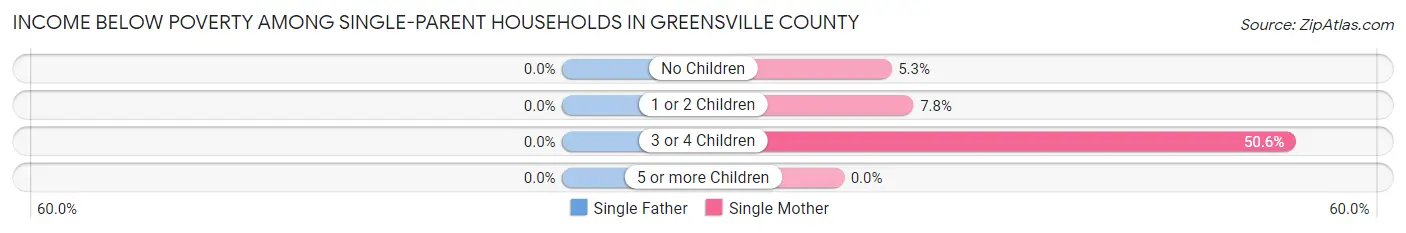
| Children | Single Father | Single Mother |
| No Children | 0 (0.0%) | 13 (5.3%) |
| 1 or 2 Children | 0 (0.0%) | 37 (7.8%) |
| 3 or 4 Children | 0 (0.0%) | 45 (50.6%) |
| 5 or more Children | 0 (0.0%) | 0 (0.0%) |
| Total | 0 (0.0%) | 95 (11.7%) |
Income Below Poverty Among Married-Couple vs Single-Parent Households in Greensville County
The poverty data for Greensville County shows that 57 of the married-couple family households (4.4%) and 95 of the single-parent households (11.0%) are living below the poverty level. Within the married-couple family households, those with no children have the highest poverty rate, with 52 households (6.0%) falling below the poverty line. Among the single-parent households, those with 3 or 4 children have the highest poverty rate, with 45 household (49.4%) living below poverty.
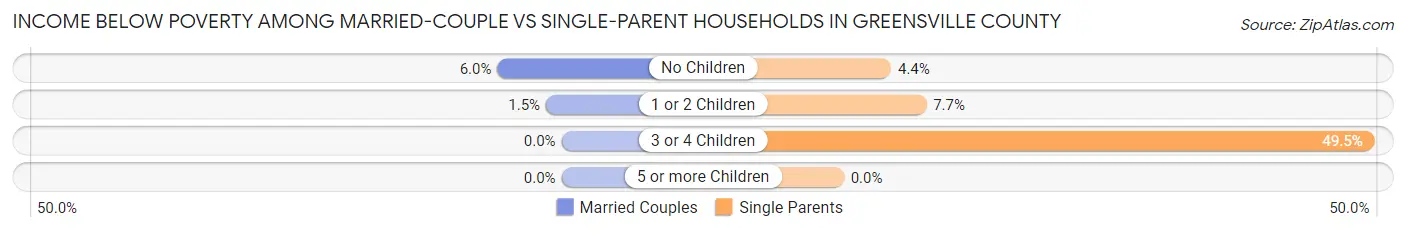
| Children | Married-Couple Families | Single-Parent Households |
| No Children | 52 (6.0%) | 13 (4.4%) |
| 1 or 2 Children | 5 (1.5%) | 37 (7.7%) |
| 3 or 4 Children | 0 (0.0%) | 45 (49.4%) |
| 5 or more Children | 0 (0.0%) | 0 (0.0%) |
| Total | 57 (4.4%) | 95 (11.0%) |
Employment Characteristics in Greensville County
Employment by Class of Employer in Greensville County
Among the 3,877 employed individuals in Greensville County, private company employees (2,434 | 62.8%), local government employees (641 | 16.5%), and state government employees (272 | 7.0%) make up the most common classes of employment.
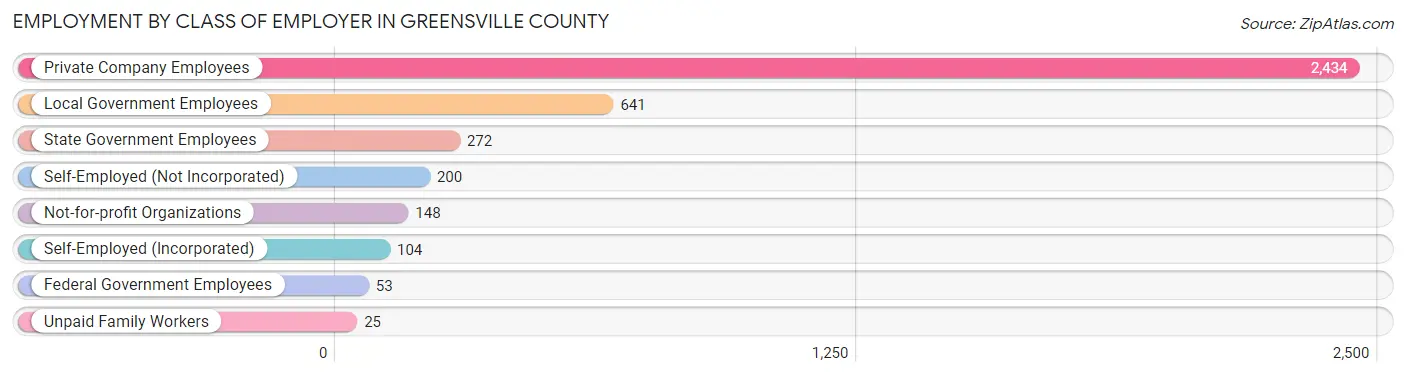
| Employer Class | # Employees | % Employees |
| Private Company Employees | 2,434 | 62.8% |
| Self-Employed (Incorporated) | 104 | 2.7% |
| Self-Employed (Not Incorporated) | 200 | 5.2% |
| Not-for-profit Organizations | 148 | 3.8% |
| Local Government Employees | 641 | 16.5% |
| State Government Employees | 272 | 7.0% |
| Federal Government Employees | 53 | 1.4% |
| Unpaid Family Workers | 25 | 0.6% |
| Total | 3,877 | 100.0% |
Employment Status by Age in Greensville County
According to the labor force statistics for Greensville County, out of the total population over 16 years of age (9,756), 43.0% or 4,195 individuals are in the labor force, with 6.3% or 264 of them unemployed. The age group with the highest labor force participation rate is 20 to 24 years, with 79.6% or 545 individuals in the labor force. Within the labor force, the 65 to 74 years age range has the highest percentage of unemployed individuals, with 19.6% or 60 of them being unemployed.
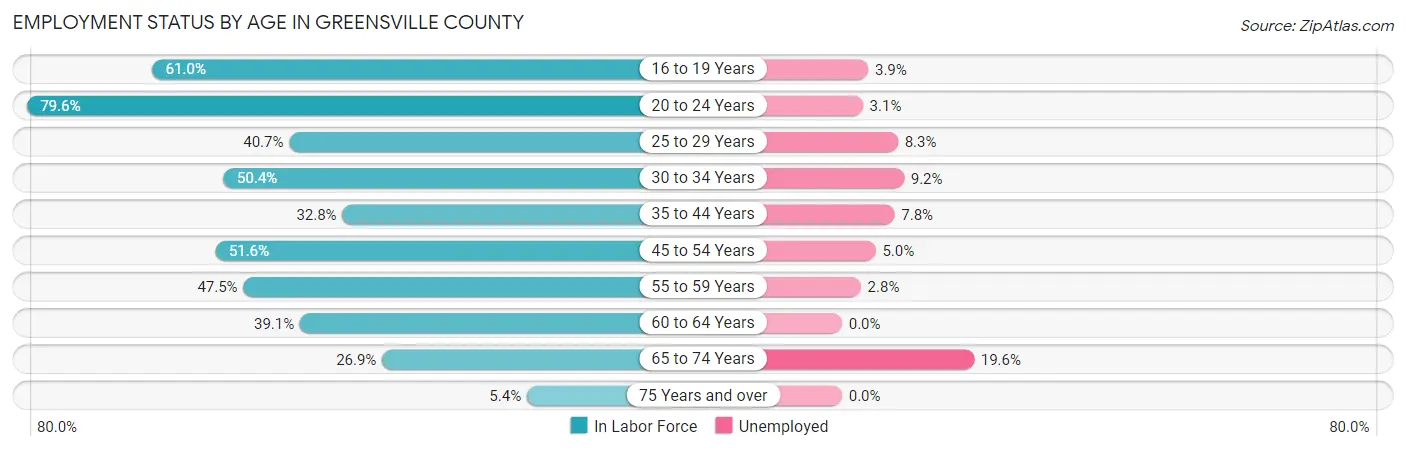
| Age Bracket | In Labor Force | Unemployed |
| 16 to 19 Years | 282 (61.0%) | 11 (3.9%) |
| 20 to 24 Years | 545 (79.6%) | 17 (3.1%) |
| 25 to 29 Years | 363 (40.7%) | 30 (8.3%) |
| 30 to 34 Years | 563 (50.4%) | 52 (9.2%) |
| 35 to 44 Years | 450 (32.8%) | 35 (7.8%) |
| 45 to 54 Years | 1,017 (51.6%) | 51 (5.0%) |
| 55 to 59 Years | 317 (47.5%) | 9 (2.8%) |
| 60 to 64 Years | 315 (39.1%) | 0 (0.0%) |
| 65 to 74 Years | 306 (26.9%) | 60 (19.6%) |
| 75 Years and over | 35 (5.4%) | 0 (0.0%) |
| Total | 4,195 (43.0%) | 264 (6.3%) |
Employment Status by Educational Attainment in Greensville County
According to labor force statistics for Greensville County, 44.3% of individuals (3,024) out of the total population between 25 and 64 years of age (6,826) are in the labor force, with 5.9% or 178 of them being unemployed. The group with the highest labor force participation rate are those with the educational attainment of bachelor's degree or higher, with 75.6% or 642 individuals in the labor force. Within the labor force, individuals with less than high school education have the highest percentage of unemployment, with 26.9% or 108 of them being unemployed.

| Educational Attainment | In Labor Force | Unemployed |
| Less than High School | 402 (32.6%) | 332 (26.9%) |
| High School Diploma | 877 (30.7%) | 123 (4.3%) |
| College / Associate Degree | 1,103 (58.5%) | 43 (2.3%) |
| Bachelor's Degree or higher | 642 (75.6%) | 8 (0.9%) |
| Total | 3,024 (44.3%) | 403 (5.9%) |
Employment Occupations by Sex in Greensville County
Management, Business, Science and Arts Occupations
The most common Management, Business, Science and Arts occupations in Greensville County are Community & Social Service (613 | 15.6%), Education Instruction & Library (440 | 11.2%), Health Diagnosing & Treating (282 | 7.2%), Management (191 | 4.9%), and Health Technologists (152 | 3.9%).

Management, Business, Science and Arts Occupations by Sex
Within the Management, Business, Science and Arts occupations in Greensville County, the most male-oriented occupations are Computers & Mathematics (100.0%), Architecture & Engineering (100.0%), and Arts, Media & Entertainment (94.9%), while the most female-oriented occupations are Health Diagnosing & Treating (77.3%), Education Instruction & Library (65.2%), and Health Technologists (57.9%).
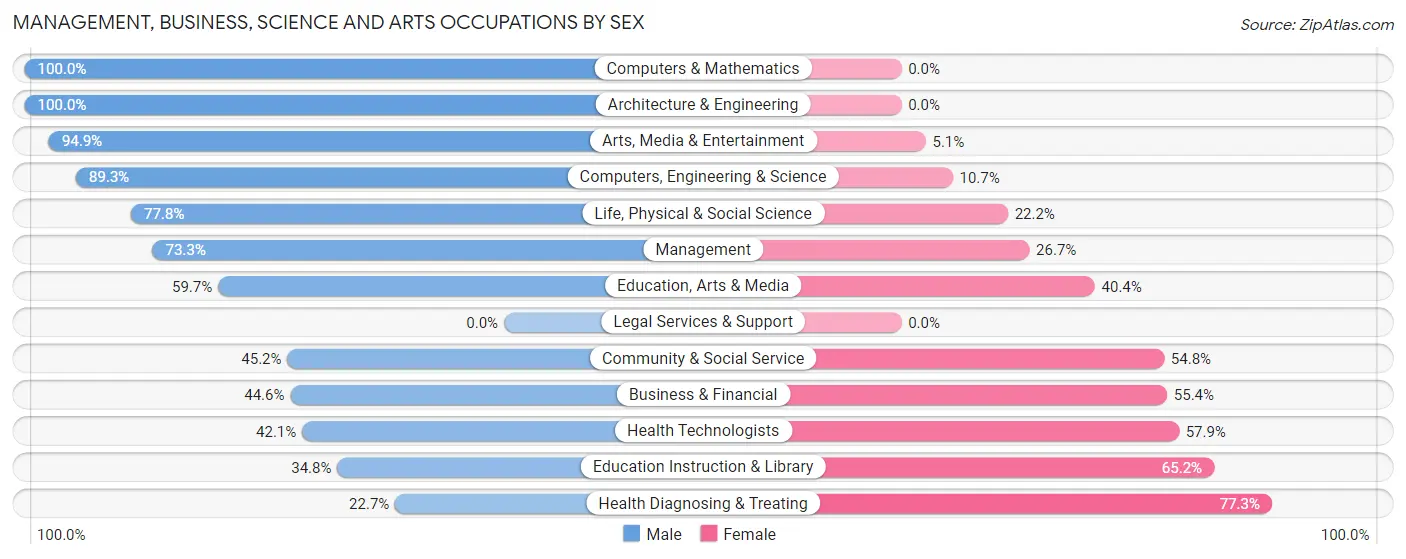
| Occupation | Male | Female |
| Management | 140 (73.3%) | 51 (26.7%) |
| Business & Financial | 37 (44.6%) | 46 (55.4%) |
| Computers, Engineering & Science | 50 (89.3%) | 6 (10.7%) |
| Computers & Mathematics | 10 (100.0%) | 0 (0.0%) |
| Architecture & Engineering | 19 (100.0%) | 0 (0.0%) |
| Life, Physical & Social Science | 21 (77.8%) | 6 (22.2%) |
| Community & Social Service | 277 (45.2%) | 336 (54.8%) |
| Education, Arts & Media | 68 (59.7%) | 46 (40.4%) |
| Legal Services & Support | 0 (0.0%) | 0 (0.0%) |
| Education Instruction & Library | 153 (34.8%) | 287 (65.2%) |
| Arts, Media & Entertainment | 56 (94.9%) | 3 (5.1%) |
| Health Diagnosing & Treating | 64 (22.7%) | 218 (77.3%) |
| Health Technologists | 64 (42.1%) | 88 (57.9%) |
| Total (Category) | 568 (46.4%) | 657 (53.6%) |
| Total (Overall) | 1,945 (49.5%) | 1,983 (50.5%) |
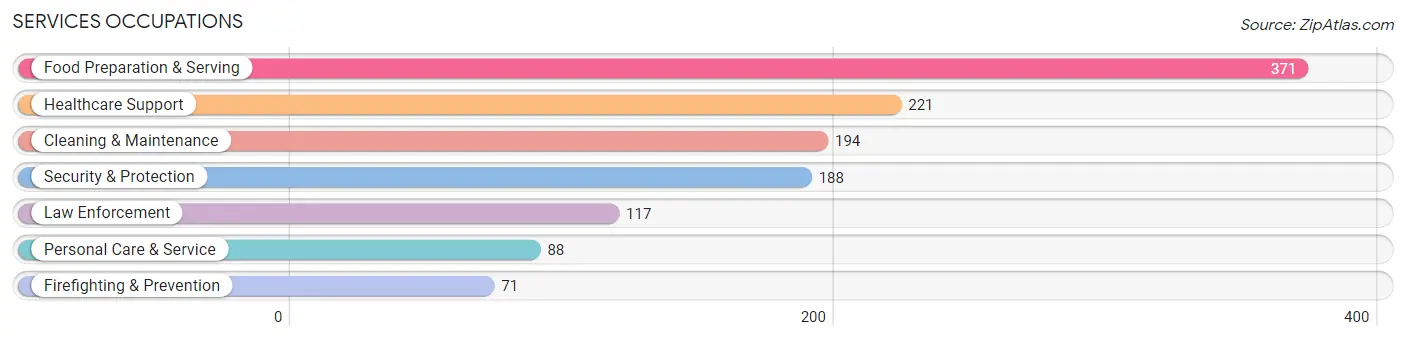
Services Occupations
The most common Services occupations in Greensville County are Food Preparation & Serving (371 | 9.5%), Healthcare Support (221 | 5.6%), Cleaning & Maintenance (194 | 4.9%), Security & Protection (188 | 4.8%), and Law Enforcement (117 | 3.0%).
Services Occupations by Sex
Within the Services occupations in Greensville County, the most male-oriented occupations are Cleaning & Maintenance (62.4%), Firefighting & Prevention (56.3%), and Security & Protection (47.9%), while the most female-oriented occupations are Healthcare Support (100.0%), Personal Care & Service (71.6%), and Food Preparation & Serving (59.3%).

| Occupation | Male | Female |
| Healthcare Support | 0 (0.0%) | 221 (100.0%) |
| Security & Protection | 90 (47.9%) | 98 (52.1%) |
| Firefighting & Prevention | 40 (56.3%) | 31 (43.7%) |
| Law Enforcement | 50 (42.7%) | 67 (57.3%) |
| Food Preparation & Serving | 151 (40.7%) | 220 (59.3%) |
| Cleaning & Maintenance | 121 (62.4%) | 73 (37.6%) |
| Personal Care & Service | 25 (28.4%) | 63 (71.6%) |
| Total (Category) | 387 (36.4%) | 675 (63.6%) |
| Total (Overall) | 1,945 (49.5%) | 1,983 (50.5%) |
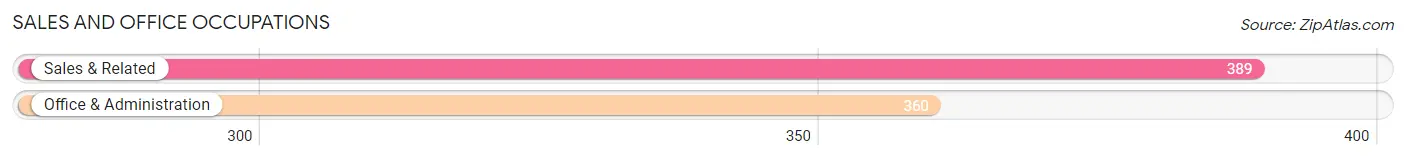
Sales and Office Occupations
The most common Sales and Office occupations in Greensville County are Sales & Related (389 | 9.9%), and Office & Administration (360 | 9.2%).
Sales and Office Occupations by Sex
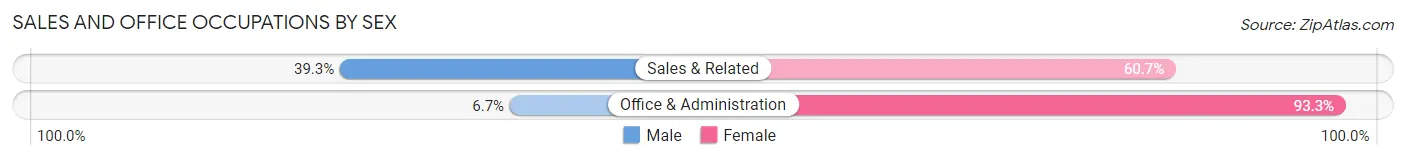
| Occupation | Male | Female |
| Sales & Related | 153 (39.3%) | 236 (60.7%) |
| Office & Administration | 24 (6.7%) | 336 (93.3%) |
| Total (Category) | 177 (23.6%) | 572 (76.4%) |
| Total (Overall) | 1,945 (49.5%) | 1,983 (50.5%) |
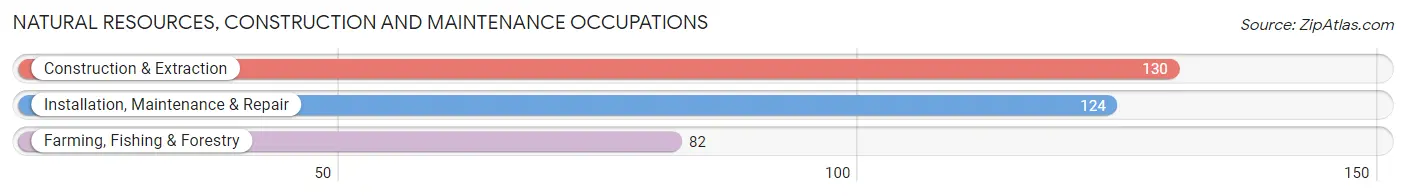
Natural Resources, Construction and Maintenance Occupations
The most common Natural Resources, Construction and Maintenance occupations in Greensville County are Construction & Extraction (130 | 3.3%), Installation, Maintenance & Repair (124 | 3.2%), and Farming, Fishing & Forestry (82 | 2.1%).
Natural Resources, Construction and Maintenance Occupations by Sex
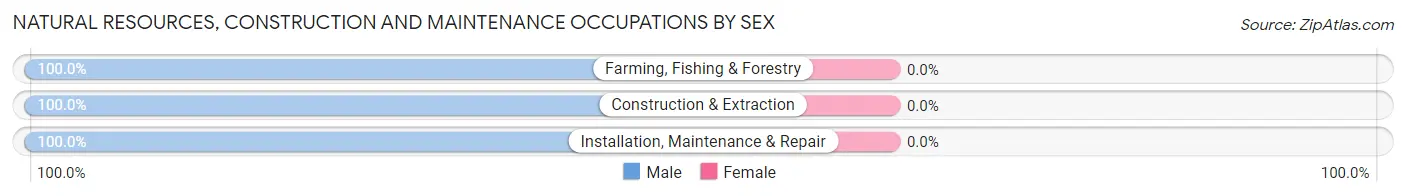
| Occupation | Male | Female |
| Farming, Fishing & Forestry | 82 (100.0%) | 0 (0.0%) |
| Construction & Extraction | 130 (100.0%) | 0 (0.0%) |
| Installation, Maintenance & Repair | 124 (100.0%) | 0 (0.0%) |
| Total (Category) | 336 (100.0%) | 0 (0.0%) |
| Total (Overall) | 1,945 (49.5%) | 1,983 (50.5%) |
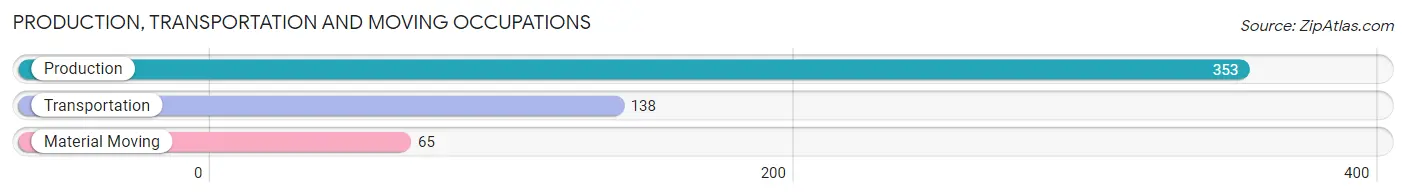
Production, Transportation and Moving Occupations
The most common Production, Transportation and Moving occupations in Greensville County are Production (353 | 9.0%), Transportation (138 | 3.5%), and Material Moving (65 | 1.7%).
Production, Transportation and Moving Occupations by Sex
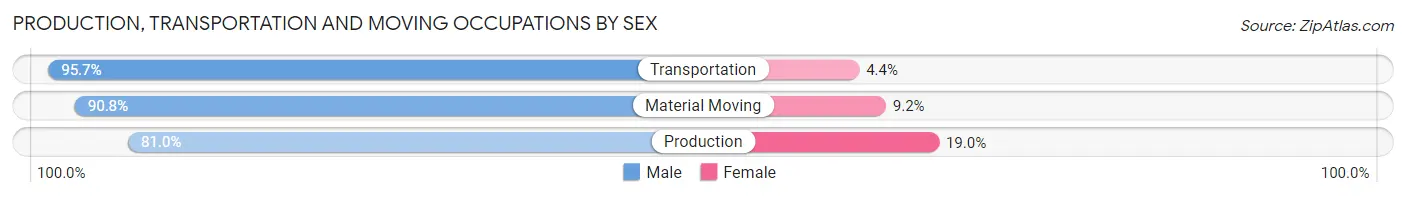
| Occupation | Male | Female |
| Production | 286 (81.0%) | 67 (19.0%) |
| Transportation | 132 (95.7%) | 6 (4.3%) |
| Material Moving | 59 (90.8%) | 6 (9.2%) |
| Total (Category) | 477 (85.8%) | 79 (14.2%) |
| Total (Overall) | 1,945 (49.5%) | 1,983 (50.5%) |
Employment Industries by Sex in Greensville County
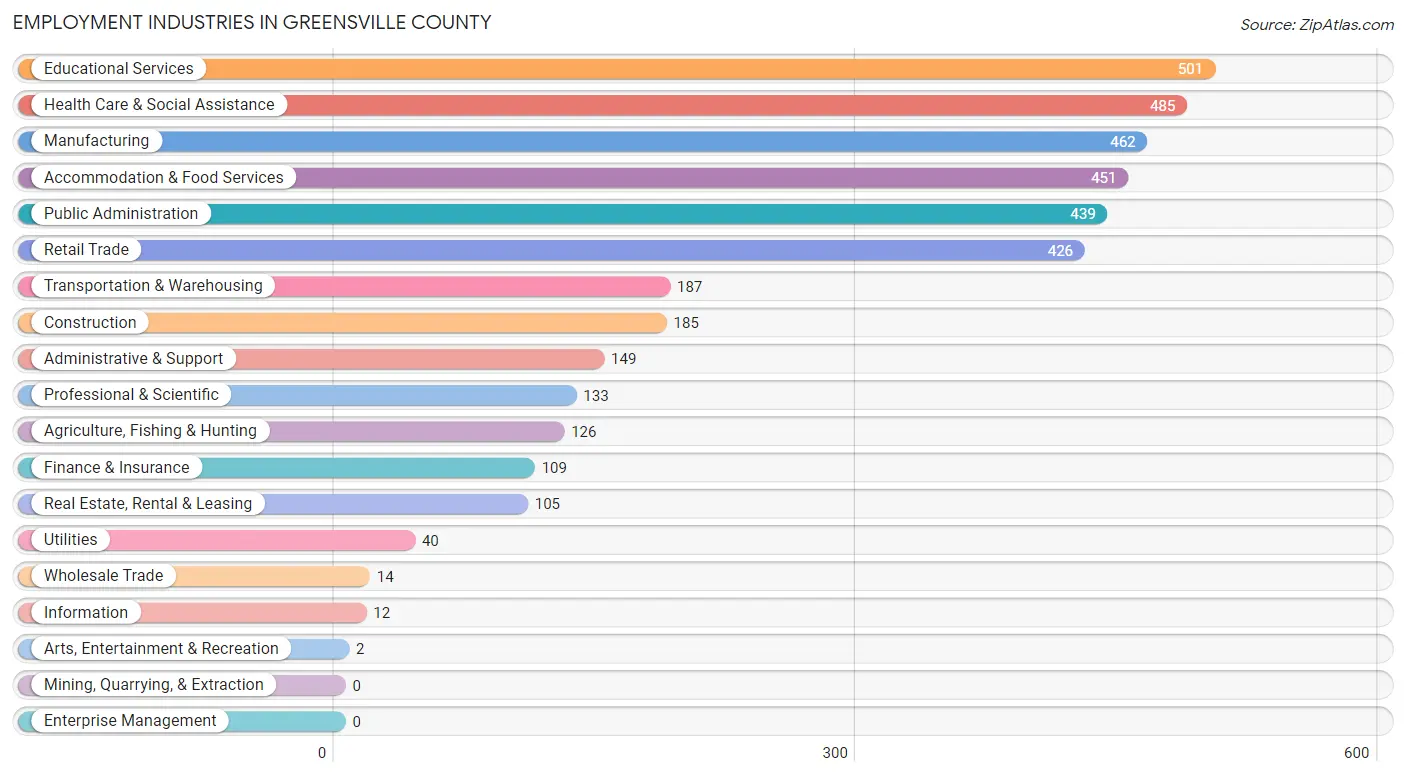
Employment Industries in Greensville County
The major employment industries in Greensville County include Educational Services (501 | 12.8%), Health Care & Social Assistance (485 | 12.3%), Manufacturing (462 | 11.8%), Accommodation & Food Services (451 | 11.5%), and Public Administration (439 | 11.2%).
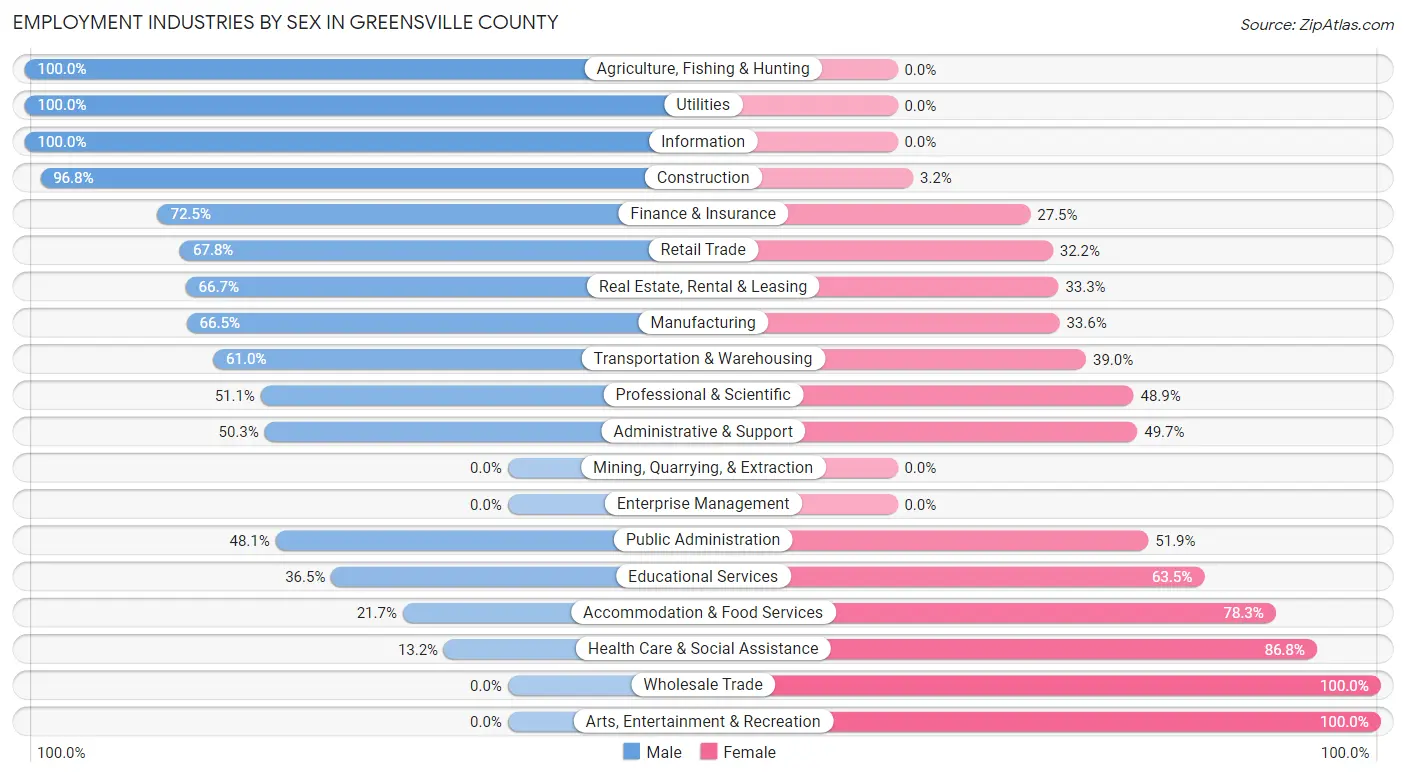
Employment Industries by Sex in Greensville County
The Greensville County industries that see more men than women are Agriculture, Fishing & Hunting (100.0%), Utilities (100.0%), and Information (100.0%), whereas the industries that tend to have a higher number of women are Wholesale Trade (100.0%), Arts, Entertainment & Recreation (100.0%), and Health Care & Social Assistance (86.8%).
| Industry | Male | Female |
| Agriculture, Fishing & Hunting | 126 (100.0%) | 0 (0.0%) |
| Mining, Quarrying, & Extraction | 0 (0.0%) | 0 (0.0%) |
| Construction | 179 (96.8%) | 6 (3.2%) |
| Manufacturing | 307 (66.4%) | 155 (33.6%) |
| Wholesale Trade | 0 (0.0%) | 14 (100.0%) |
| Retail Trade | 289 (67.8%) | 137 (32.2%) |
| Transportation & Warehousing | 114 (61.0%) | 73 (39.0%) |
| Utilities | 40 (100.0%) | 0 (0.0%) |
| Information | 12 (100.0%) | 0 (0.0%) |
| Finance & Insurance | 79 (72.5%) | 30 (27.5%) |
| Real Estate, Rental & Leasing | 70 (66.7%) | 35 (33.3%) |
| Professional & Scientific | 68 (51.1%) | 65 (48.9%) |
| Enterprise Management | 0 (0.0%) | 0 (0.0%) |
| Administrative & Support | 75 (50.3%) | 74 (49.7%) |
| Educational Services | 183 (36.5%) | 318 (63.5%) |
| Health Care & Social Assistance | 64 (13.2%) | 421 (86.8%) |
| Arts, Entertainment & Recreation | 0 (0.0%) | 2 (100.0%) |
| Accommodation & Food Services | 98 (21.7%) | 353 (78.3%) |
| Public Administration | 211 (48.1%) | 228 (51.9%) |
| Total | 1,945 (49.5%) | 1,983 (50.5%) |
Education in Greensville County
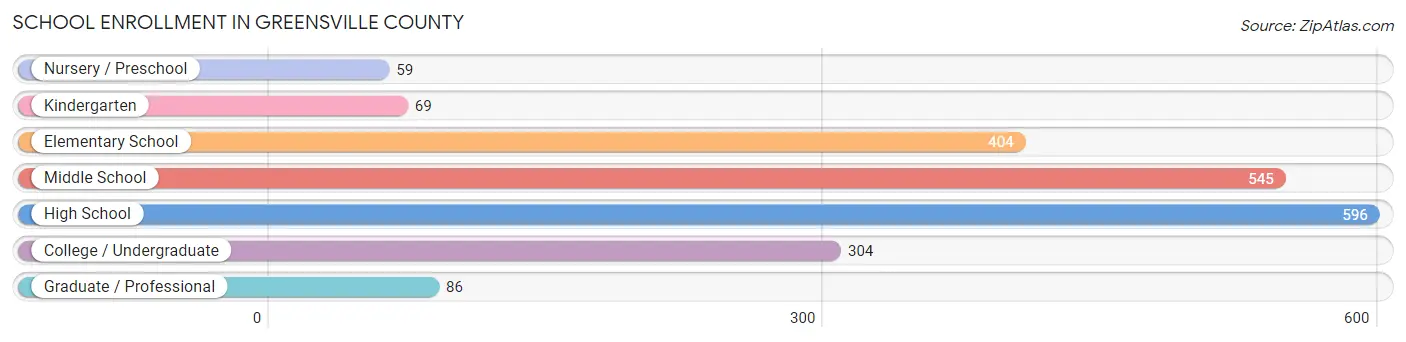
School Enrollment in Greensville County
The most common levels of schooling among the 2,063 students in Greensville County are high school (596 | 28.9%), middle school (545 | 26.4%), and elementary school (404 | 19.6%).
| School Level | # Students | % Students |
| Nursery / Preschool | 59 | 2.9% |
| Kindergarten | 69 | 3.3% |
| Elementary School | 404 | 19.6% |
| Middle School | 545 | 26.4% |
| High School | 596 | 28.9% |
| College / Undergraduate | 304 | 14.7% |
| Graduate / Professional | 86 | 4.2% |
| Total | 2,063 | 100.0% |
School Enrollment by Age by Funding Source in Greensville County
Out of a total of 2,063 students who are enrolled in schools in Greensville County, 227 (11.0%) attend a private institution, while the remaining 1,836 (89.0%) are enrolled in public schools. The age group of 3 to 4 year olds has the highest likelihood of being enrolled in private schools, with 30 (51.7% in the age bracket) enrolled. Conversely, the age group of 18 to 19 year olds has the lowest likelihood of being enrolled in a private school, with 188 (99.5% in the age bracket) attending a public institution.
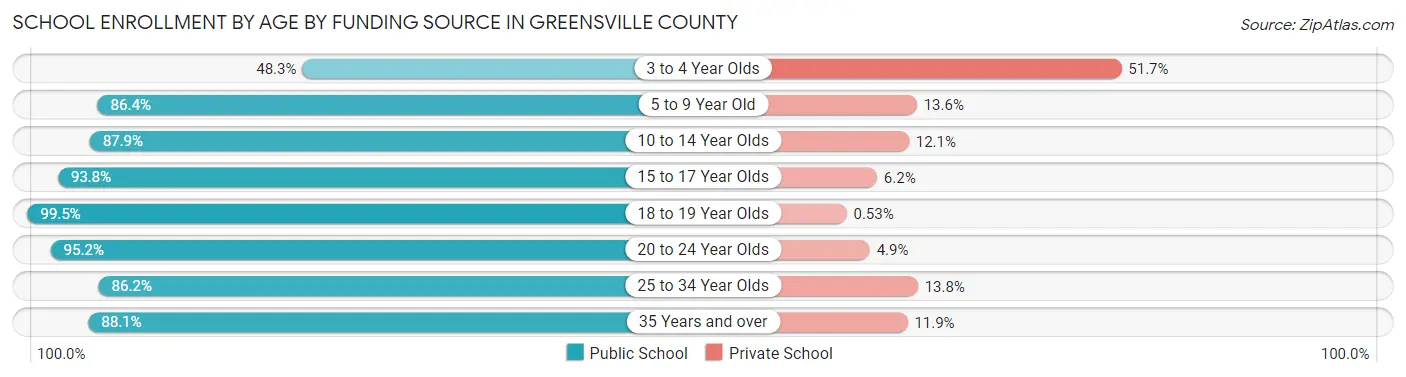
| Age Bracket | Public School | Private School |
| 3 to 4 Year Olds | 28 (48.3%) | 30 (51.7%) |
| 5 to 9 Year Old | 381 (86.4%) | 60 (13.6%) |
| 10 to 14 Year Olds | 529 (87.9%) | 73 (12.1%) |
| 15 to 17 Year Olds | 273 (93.8%) | 18 (6.2%) |
| 18 to 19 Year Olds | 188 (99.5%) | 1 (0.5%) |
| 20 to 24 Year Olds | 196 (95.2%) | 10 (4.9%) |
| 25 to 34 Year Olds | 100 (86.2%) | 16 (13.8%) |
| 35 Years and over | 141 (88.1%) | 19 (11.9%) |
| Total | 1,836 (89.0%) | 227 (11.0%) |
Educational Attainment by Field of Study in Greensville County
Business (272 | 21.8%), education (196 | 15.7%), liberal arts & history (169 | 13.6%), arts & humanities (137 | 11.0%), and social sciences (112 | 9.0%) are the most common fields of study among 1,247 individuals in Greensville County who have obtained a bachelor's degree or higher.
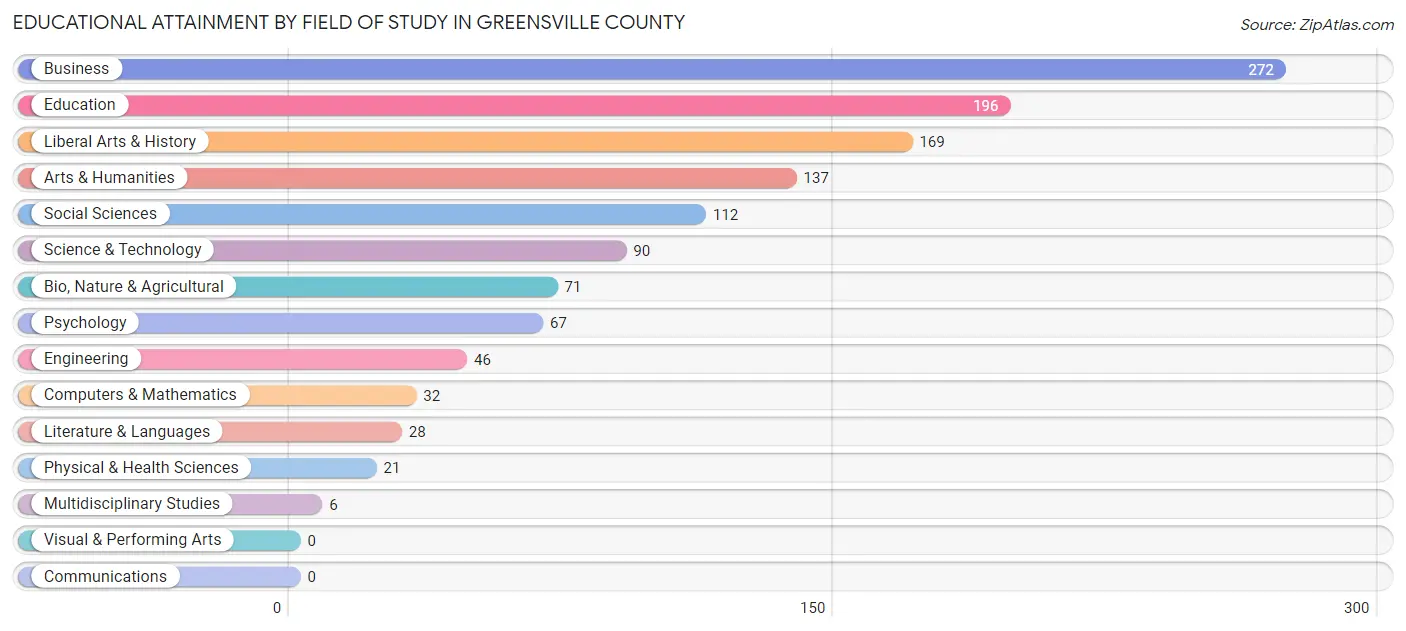
| Field of Study | # Graduates | % Graduates |
| Computers & Mathematics | 32 | 2.6% |
| Bio, Nature & Agricultural | 71 | 5.7% |
| Physical & Health Sciences | 21 | 1.7% |
| Psychology | 67 | 5.4% |
| Social Sciences | 112 | 9.0% |
| Engineering | 46 | 3.7% |
| Multidisciplinary Studies | 6 | 0.5% |
| Science & Technology | 90 | 7.2% |
| Business | 272 | 21.8% |
| Education | 196 | 15.7% |
| Literature & Languages | 28 | 2.2% |
| Liberal Arts & History | 169 | 13.6% |
| Visual & Performing Arts | 0 | 0.0% |
| Communications | 0 | 0.0% |
| Arts & Humanities | 137 | 11.0% |
| Total | 1,247 | 100.0% |
Transportation & Commute in Greensville County
Vehicle Availability by Sex in Greensville County
The most prevalent vehicle ownership categories in Greensville County are males with 2 vehicles (735, accounting for 38.2%) and females with 2 vehicles (593, making up 37.7%).
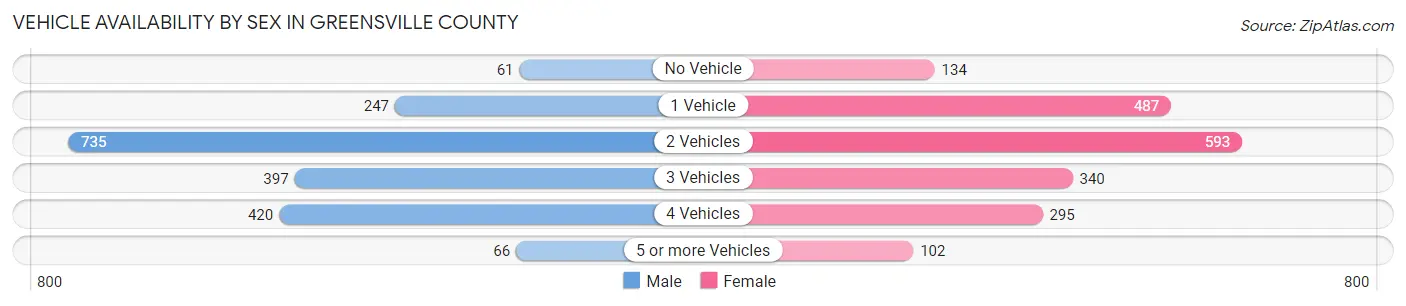
| Vehicles Available | Male | Female |
| No Vehicle | 61 (3.2%) | 134 (6.9%) |
| 1 Vehicle | 247 (12.8%) | 487 (25.0%) |
| 2 Vehicles | 735 (38.2%) | 593 (30.4%) |
| 3 Vehicles | 397 (20.6%) | 340 (17.4%) |
| 4 Vehicles | 420 (21.8%) | 295 (15.1%) |
| 5 or more Vehicles | 66 (3.4%) | 102 (5.2%) |
| Total | 1,926 (100.0%) | 1,951 (100.0%) |
Commute Time in Greensville County
The most frequently occuring commute durations in Greensville County are 10 to 14 minutes (843 commuters, 22.4%), 15 to 19 minutes (499 commuters, 13.2%), and 45 to 59 minutes (482 commuters, 12.8%).
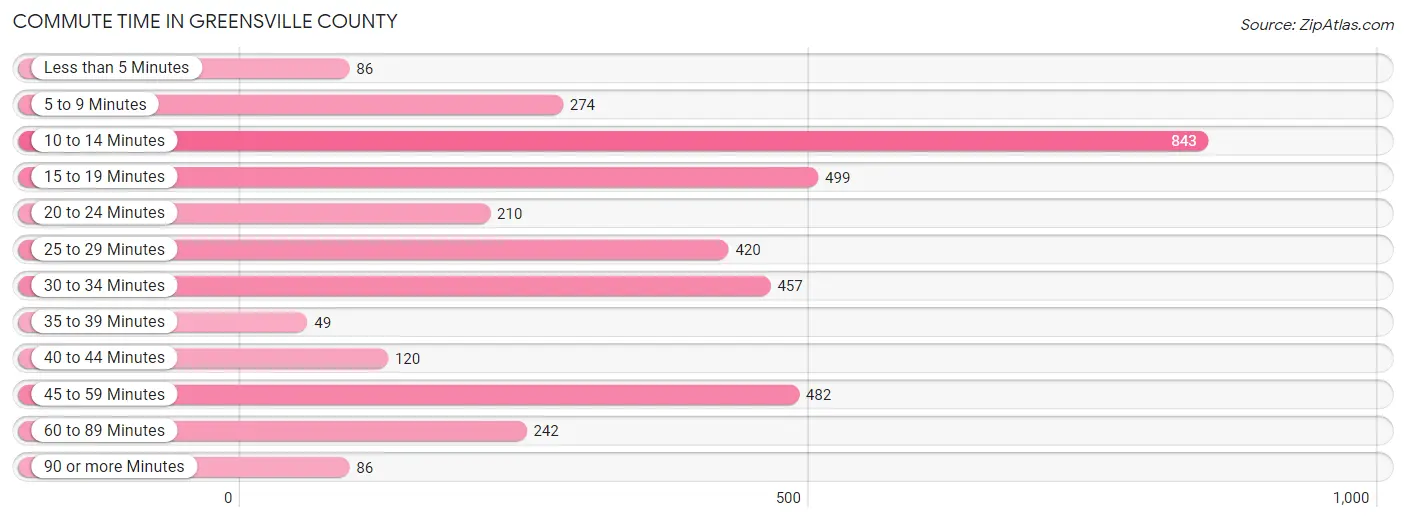
| Commute Time | # Commuters | % Commuters |
| Less than 5 Minutes | 86 | 2.3% |
| 5 to 9 Minutes | 274 | 7.3% |
| 10 to 14 Minutes | 843 | 22.4% |
| 15 to 19 Minutes | 499 | 13.2% |
| 20 to 24 Minutes | 210 | 5.6% |
| 25 to 29 Minutes | 420 | 11.2% |
| 30 to 34 Minutes | 457 | 12.1% |
| 35 to 39 Minutes | 49 | 1.3% |
| 40 to 44 Minutes | 120 | 3.2% |
| 45 to 59 Minutes | 482 | 12.8% |
| 60 to 89 Minutes | 242 | 6.4% |
| 90 or more Minutes | 86 | 2.3% |
Commute Time by Sex in Greensville County
The most common commute times in Greensville County are 10 to 14 minutes (444 commuters, 23.3%) for males and 10 to 14 minutes (399 commuters, 21.4%) for females.
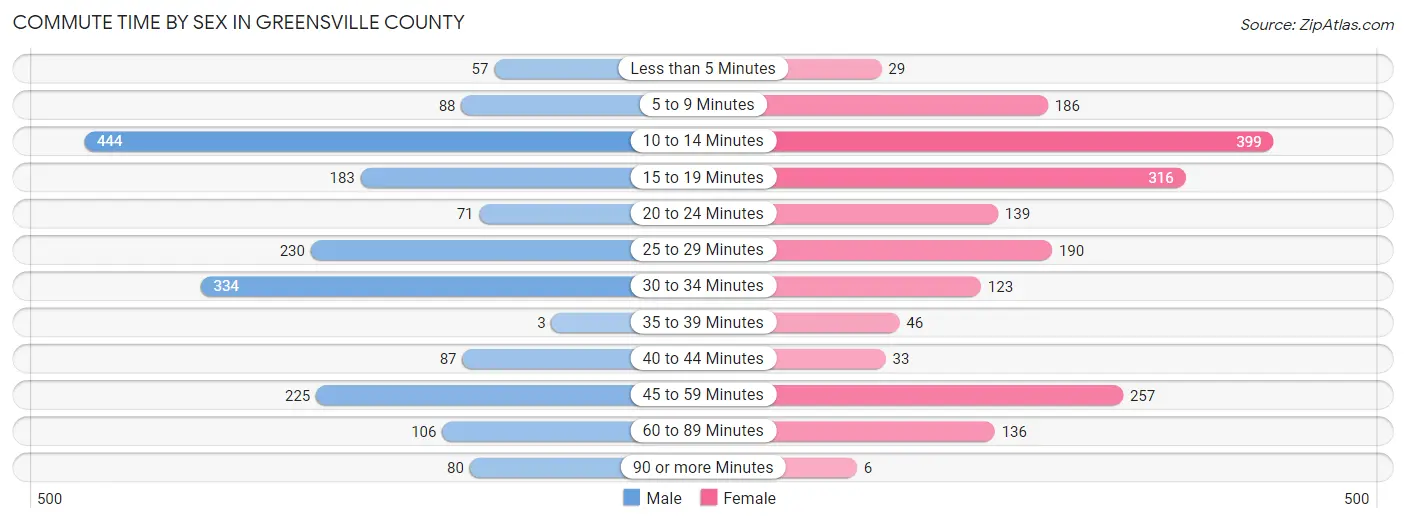
| Commute Time | Male | Female |
| Less than 5 Minutes | 57 (3.0%) | 29 (1.6%) |
| 5 to 9 Minutes | 88 (4.6%) | 186 (10.0%) |
| 10 to 14 Minutes | 444 (23.3%) | 399 (21.4%) |
| 15 to 19 Minutes | 183 (9.6%) | 316 (17.0%) |
| 20 to 24 Minutes | 71 (3.7%) | 139 (7.5%) |
| 25 to 29 Minutes | 230 (12.0%) | 190 (10.2%) |
| 30 to 34 Minutes | 334 (17.5%) | 123 (6.6%) |
| 35 to 39 Minutes | 3 (0.2%) | 46 (2.5%) |
| 40 to 44 Minutes | 87 (4.6%) | 33 (1.8%) |
| 45 to 59 Minutes | 225 (11.8%) | 257 (13.8%) |
| 60 to 89 Minutes | 106 (5.6%) | 136 (7.3%) |
| 90 or more Minutes | 80 (4.2%) | 6 (0.3%) |
Time of Departure to Work by Sex in Greensville County
The most frequent times of departure to work in Greensville County are 6:30 AM to 6:59 AM (467, 24.5%) for males and 6:30 AM to 6:59 AM (335, 18.0%) for females.
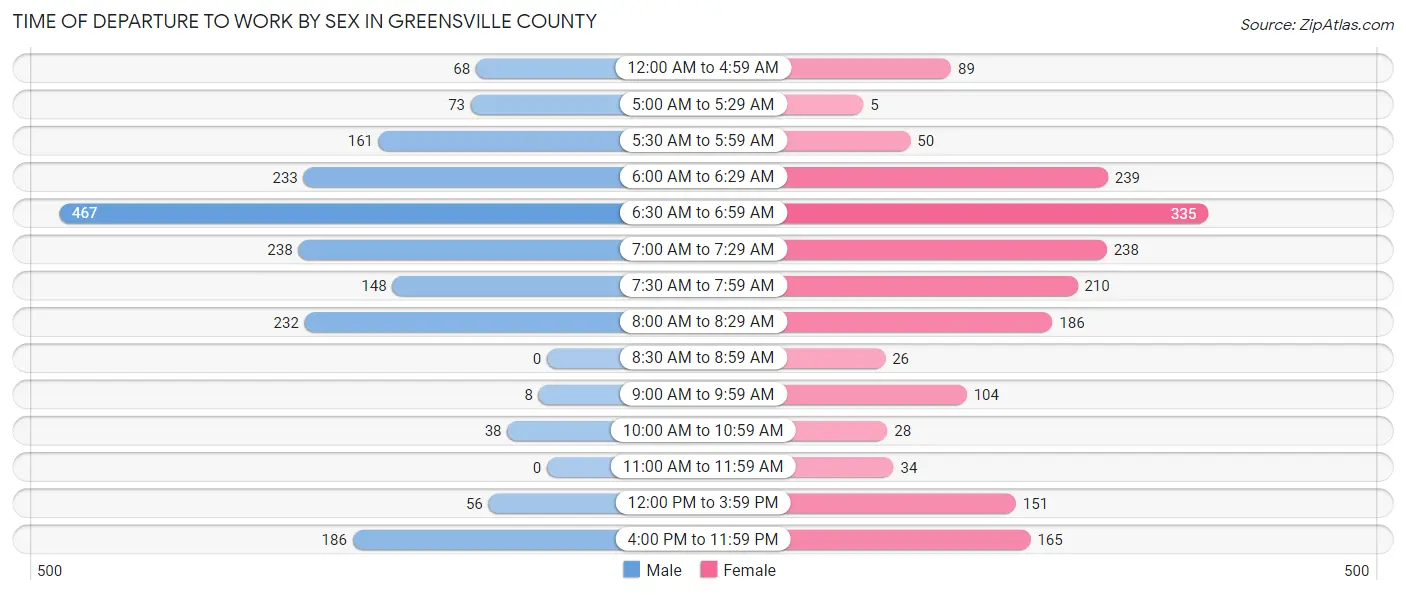
| Time of Departure | Male | Female |
| 12:00 AM to 4:59 AM | 68 (3.6%) | 89 (4.8%) |
| 5:00 AM to 5:29 AM | 73 (3.8%) | 5 (0.3%) |
| 5:30 AM to 5:59 AM | 161 (8.4%) | 50 (2.7%) |
| 6:00 AM to 6:29 AM | 233 (12.2%) | 239 (12.9%) |
| 6:30 AM to 6:59 AM | 467 (24.5%) | 335 (18.0%) |
| 7:00 AM to 7:29 AM | 238 (12.5%) | 238 (12.8%) |
| 7:30 AM to 7:59 AM | 148 (7.8%) | 210 (11.3%) |
| 8:00 AM to 8:29 AM | 232 (12.2%) | 186 (10.0%) |
| 8:30 AM to 8:59 AM | 0 (0.0%) | 26 (1.4%) |
| 9:00 AM to 9:59 AM | 8 (0.4%) | 104 (5.6%) |
| 10:00 AM to 10:59 AM | 38 (2.0%) | 28 (1.5%) |
| 11:00 AM to 11:59 AM | 0 (0.0%) | 34 (1.8%) |
| 12:00 PM to 3:59 PM | 56 (2.9%) | 151 (8.1%) |
| 4:00 PM to 11:59 PM | 186 (9.8%) | 165 (8.9%) |
| Total | 1,908 (100.0%) | 1,860 (100.0%) |
Housing Occupancy in Greensville County
Occupancy by Ownership in Greensville County
Of the total 3,222 dwellings in Greensville County, owner-occupied units account for 2,245 (69.7%), while renter-occupied units make up 977 (30.3%).
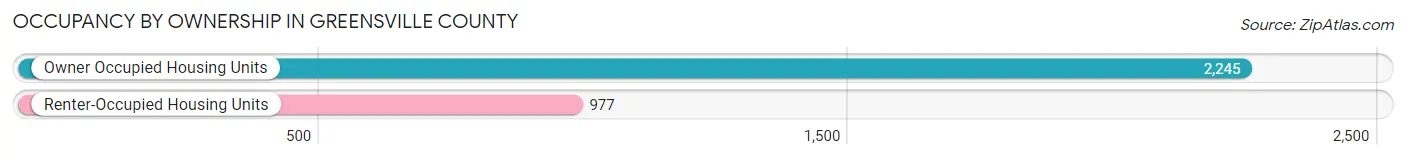
| Occupancy | # Housing Units | % Housing Units |
| Owner Occupied Housing Units | 2,245 | 69.7% |
| Renter-Occupied Housing Units | 977 | 30.3% |
| Total Occupied Housing Units | 3,222 | 100.0% |
Occupancy by Household Size in Greensville County

| Household Size | # Housing Units | % Housing Units |
| 1-Person Household | 885 | 27.5% |
| 2-Person Household | 1,204 | 37.4% |
| 3-Person Household | 499 | 15.5% |
| 4+ Person Household | 634 | 19.7% |
| Total Housing Units | 3,222 | 100.0% |
Occupancy by Ownership by Household Size in Greensville County

| Household Size | Owner-occupied | Renter-occupied |
| 1-Person Household | 662 (74.8%) | 223 (25.2%) |
| 2-Person Household | 924 (76.7%) | 280 (23.3%) |
| 3-Person Household | 321 (64.3%) | 178 (35.7%) |
| 4+ Person Household | 338 (53.3%) | 296 (46.7%) |
| Total Housing Units | 2,245 (69.7%) | 977 (30.3%) |
Occupancy by Educational Attainment in Greensville County

| Household Size | Owner-occupied | Renter-occupied |
| Less than High School | 375 (64.4%) | 207 (35.6%) |
| High School Diploma | 671 (67.0%) | 331 (33.0%) |
| College/Associate Degree | 740 (74.0%) | 260 (26.0%) |
| Bachelor's Degree or higher | 459 (71.9%) | 179 (28.1%) |
Occupancy by Age of Householder in Greensville County
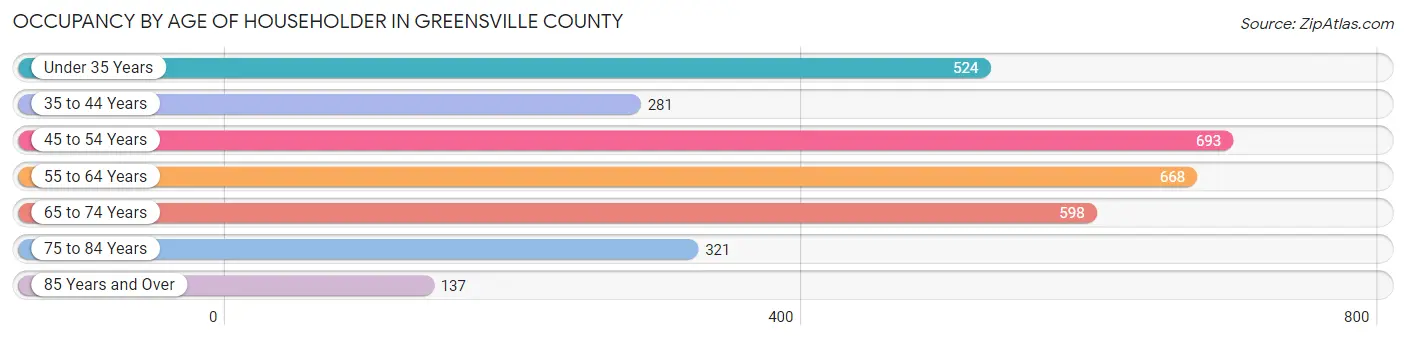
| Age Bracket | # Households | % Households |
| Under 35 Years | 524 | 16.3% |
| 35 to 44 Years | 281 | 8.7% |
| 45 to 54 Years | 693 | 21.5% |
| 55 to 64 Years | 668 | 20.7% |
| 65 to 74 Years | 598 | 18.6% |
| 75 to 84 Years | 321 | 10.0% |
| 85 Years and Over | 137 | 4.3% |
| Total | 3,222 | 100.0% |
Housing Finances in Greensville County
Median Income by Occupancy in Greensville County

| Occupancy Type | # Households | Median Income |
| Owner-Occupied | 2,245 (69.7%) | $60,815 |
| Renter-Occupied | 977 (30.3%) | $36,875 |
| Average | 3,222 (100.0%) | $51,823 |
Occupancy by Householder Income Bracket in Greensville County
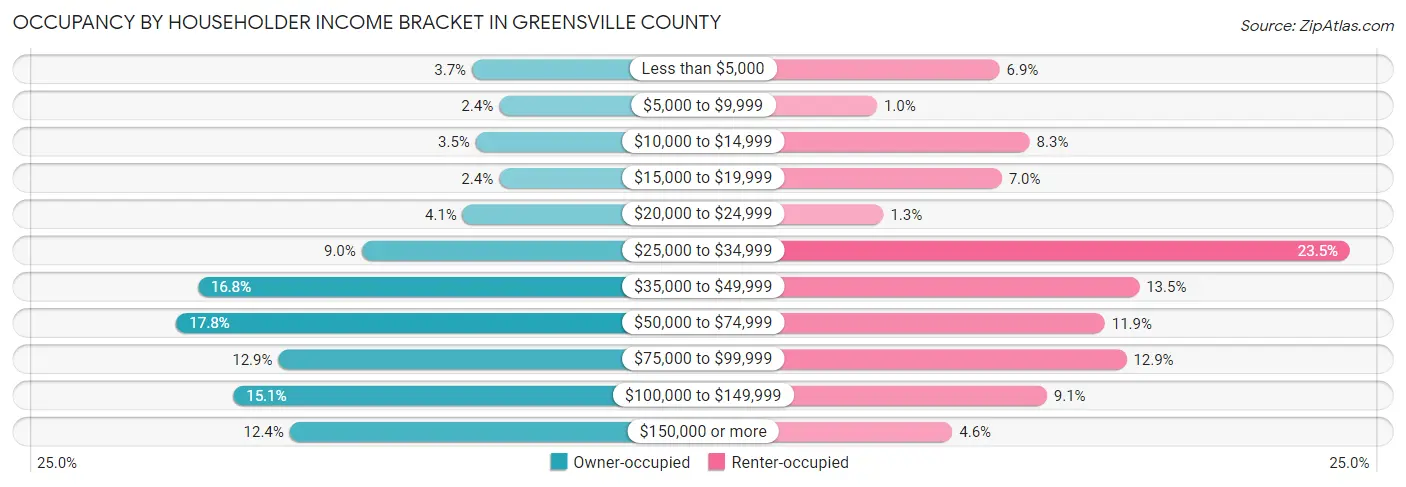
| Income Bracket | Owner-occupied | Renter-occupied |
| Less than $5,000 | 83 (3.7%) | 67 (6.9%) |
| $5,000 to $9,999 | 54 (2.4%) | 10 (1.0%) |
| $10,000 to $14,999 | 79 (3.5%) | 81 (8.3%) |
| $15,000 to $19,999 | 54 (2.4%) | 68 (7.0%) |
| $20,000 to $24,999 | 93 (4.1%) | 13 (1.3%) |
| $25,000 to $34,999 | 201 (8.9%) | 230 (23.5%) |
| $35,000 to $49,999 | 376 (16.8%) | 132 (13.5%) |
| $50,000 to $74,999 | 399 (17.8%) | 116 (11.9%) |
| $75,000 to $99,999 | 290 (12.9%) | 126 (12.9%) |
| $100,000 to $149,999 | 338 (15.1%) | 89 (9.1%) |
| $150,000 or more | 278 (12.4%) | 45 (4.6%) |
| Total | 2,245 (100.0%) | 977 (100.0%) |
Monthly Housing Cost Tiers in Greensville County
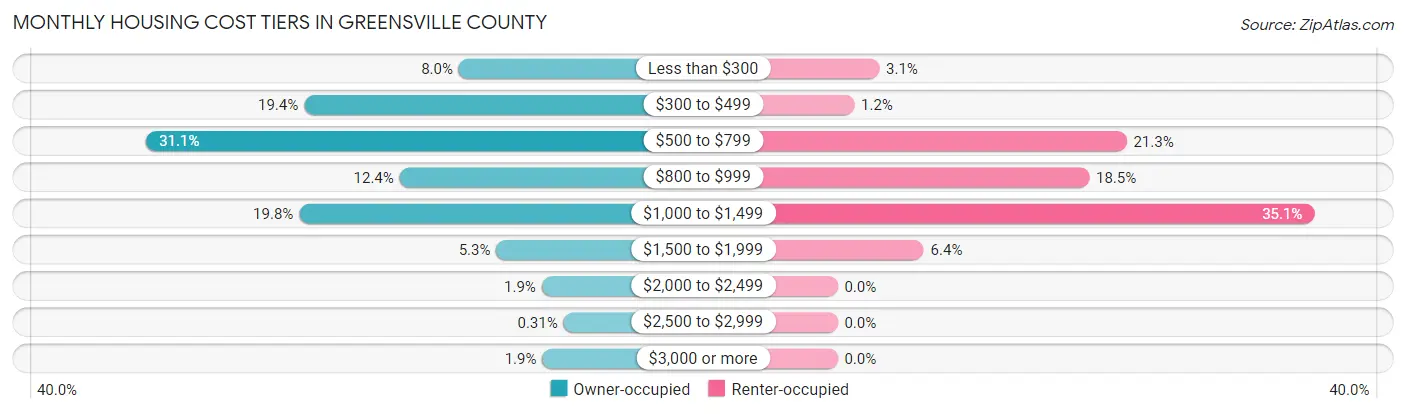
| Monthly Cost | Owner-occupied | Renter-occupied |
| Less than $300 | 180 (8.0%) | 30 (3.1%) |
| $300 to $499 | 436 (19.4%) | 12 (1.2%) |
| $500 to $799 | 697 (31.0%) | 208 (21.3%) |
| $800 to $999 | 278 (12.4%) | 181 (18.5%) |
| $1,000 to $1,499 | 444 (19.8%) | 343 (35.1%) |
| $1,500 to $1,999 | 118 (5.3%) | 62 (6.4%) |
| $2,000 to $2,499 | 43 (1.9%) | 0 (0.0%) |
| $2,500 to $2,999 | 7 (0.3%) | 0 (0.0%) |
| $3,000 or more | 42 (1.9%) | 0 (0.0%) |
| Total | 2,245 (100.0%) | 977 (100.0%) |
Physical Housing Characteristics in Greensville County
Housing Structures in Greensville County
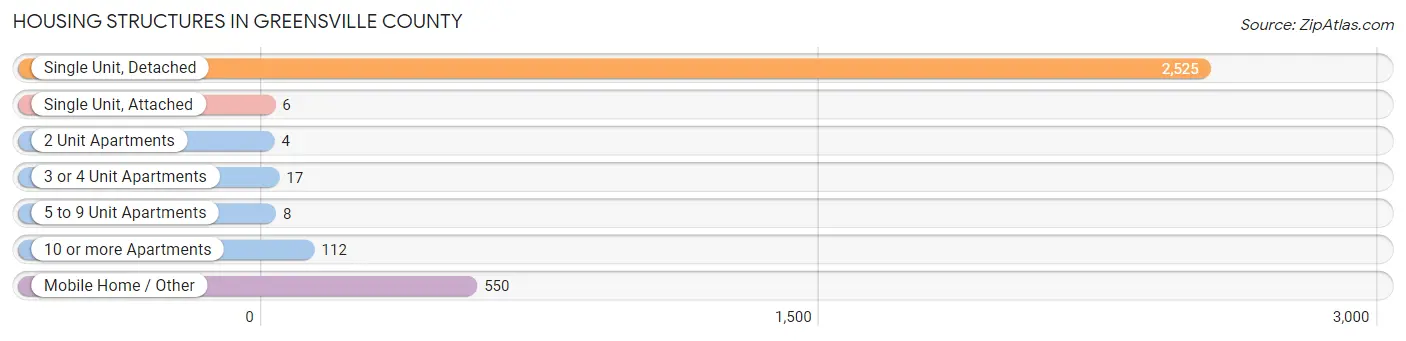
| Structure Type | # Housing Units | % Housing Units |
| Single Unit, Detached | 2,525 | 78.4% |
| Single Unit, Attached | 6 | 0.2% |
| 2 Unit Apartments | 4 | 0.1% |
| 3 or 4 Unit Apartments | 17 | 0.5% |
| 5 to 9 Unit Apartments | 8 | 0.3% |
| 10 or more Apartments | 112 | 3.5% |
| Mobile Home / Other | 550 | 17.1% |
| Total | 3,222 | 100.0% |
Housing Structures by Occupancy in Greensville County

| Structure Type | Owner-occupied | Renter-occupied |
| Single Unit, Detached | 1,896 (75.1%) | 629 (24.9%) |
| Single Unit, Attached | 2 (33.3%) | 4 (66.7%) |
| 2 Unit Apartments | 0 (0.0%) | 4 (100.0%) |
| 3 or 4 Unit Apartments | 0 (0.0%) | 17 (100.0%) |
| 5 to 9 Unit Apartments | 0 (0.0%) | 8 (100.0%) |
| 10 or more Apartments | 0 (0.0%) | 112 (100.0%) |
| Mobile Home / Other | 347 (63.1%) | 203 (36.9%) |
| Total | 2,245 (69.7%) | 977 (30.3%) |
Housing Structures by Number of Rooms in Greensville County
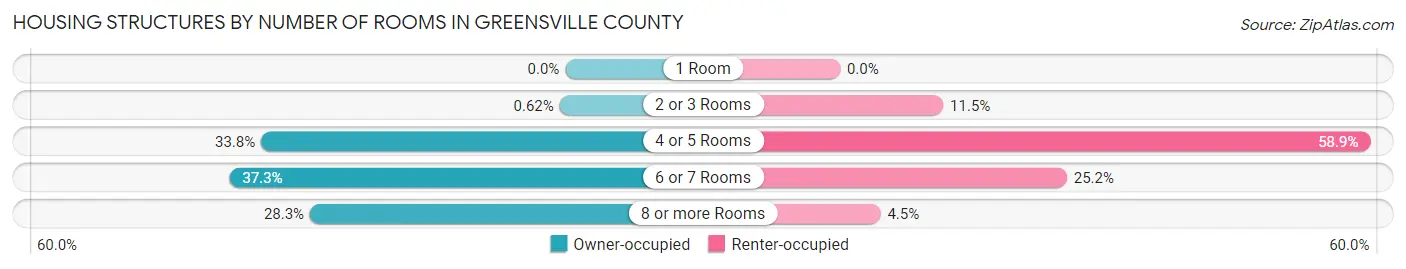
| Number of Rooms | Owner-occupied | Renter-occupied |
| 1 Room | 0 (0.0%) | 0 (0.0%) |
| 2 or 3 Rooms | 14 (0.6%) | 112 (11.5%) |
| 4 or 5 Rooms | 758 (33.8%) | 575 (58.9%) |
| 6 or 7 Rooms | 837 (37.3%) | 246 (25.2%) |
| 8 or more Rooms | 636 (28.3%) | 44 (4.5%) |
| Total | 2,245 (100.0%) | 977 (100.0%) |
Housing Structure by Heating Type in Greensville County
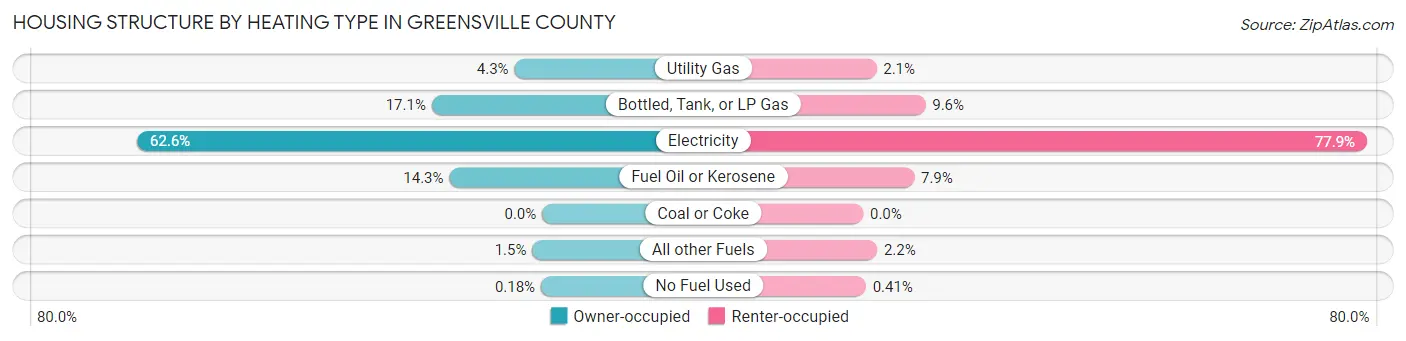
| Heating Type | Owner-occupied | Renter-occupied |
| Utility Gas | 96 (4.3%) | 20 (2.1%) |
| Bottled, Tank, or LP Gas | 383 (17.1%) | 94 (9.6%) |
| Electricity | 1,406 (62.6%) | 761 (77.9%) |
| Fuel Oil or Kerosene | 322 (14.3%) | 77 (7.9%) |
| Coal or Coke | 0 (0.0%) | 0 (0.0%) |
| All other Fuels | 34 (1.5%) | 21 (2.1%) |
| No Fuel Used | 4 (0.2%) | 4 (0.4%) |
| Total | 2,245 (100.0%) | 977 (100.0%) |
Household Vehicle Usage in Greensville County
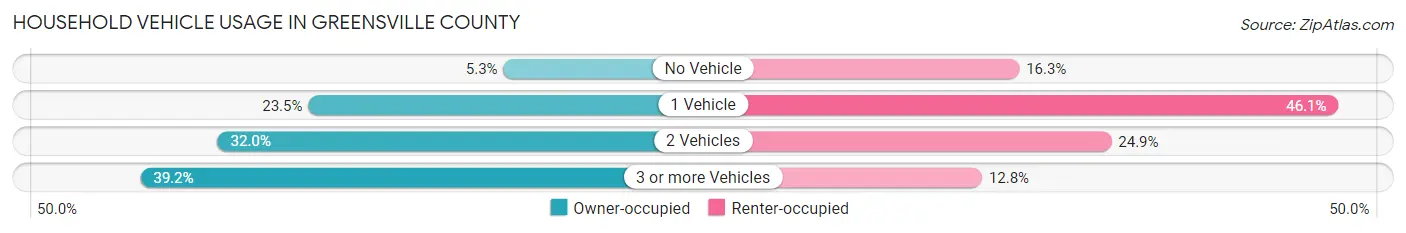
| Vehicles per Household | Owner-occupied | Renter-occupied |
| No Vehicle | 119 (5.3%) | 159 (16.3%) |
| 1 Vehicle | 528 (23.5%) | 450 (46.1%) |
| 2 Vehicles | 718 (32.0%) | 243 (24.9%) |
| 3 or more Vehicles | 880 (39.2%) | 125 (12.8%) |
| Total | 2,245 (100.0%) | 977 (100.0%) |
Real Estate & Mortgages in Greensville County
Real Estate and Mortgage Overview in Greensville County
| Characteristic | Without Mortgage | With Mortgage |
| Housing Units | 1,150 | 1,095 |
| Median Property Value | $120,200 | $159,300 |
| Median Household Income | $49,327 | $182 |
| Monthly Housing Costs | $489 | $42 |
| Real Estate Taxes | $777 | $7 |
Property Value by Mortgage Status in Greensville County
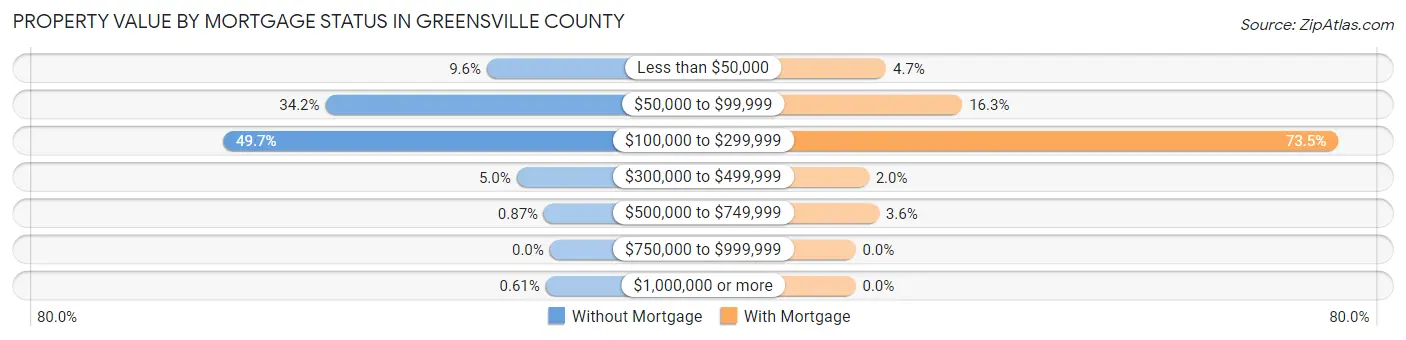
| Property Value | Without Mortgage | With Mortgage |
| Less than $50,000 | 110 (9.6%) | 51 (4.7%) |
| $50,000 to $99,999 | 393 (34.2%) | 178 (16.3%) |
| $100,000 to $299,999 | 572 (49.7%) | 805 (73.5%) |
| $300,000 to $499,999 | 58 (5.0%) | 22 (2.0%) |
| $500,000 to $749,999 | 10 (0.9%) | 39 (3.6%) |
| $750,000 to $999,999 | 0 (0.0%) | 0 (0.0%) |
| $1,000,000 or more | 7 (0.6%) | 0 (0.0%) |
| Total | 1,150 (100.0%) | 1,095 (100.0%) |
Household Income by Mortgage Status in Greensville County
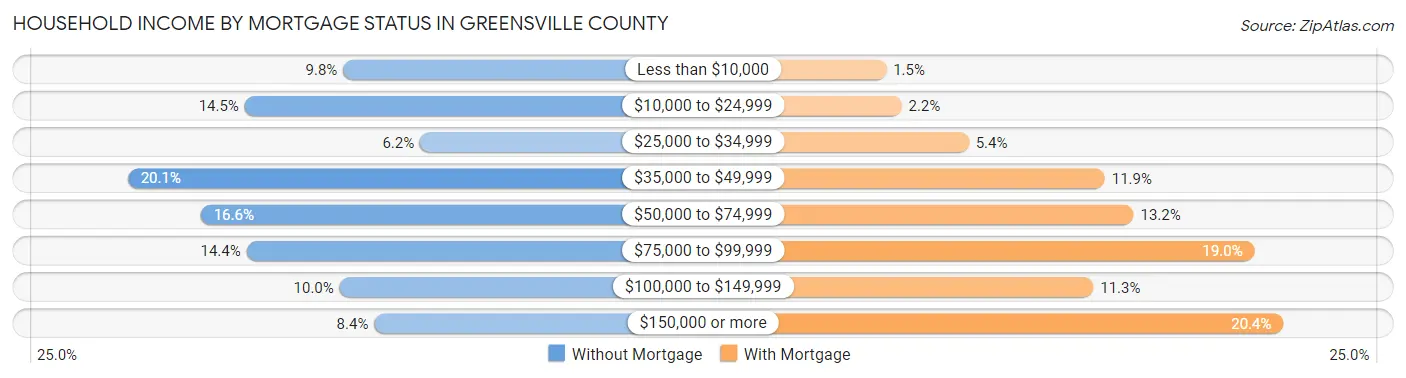
| Household Income | Without Mortgage | With Mortgage |
| Less than $10,000 | 113 (9.8%) | 16 (1.5%) |
| $10,000 to $24,999 | 167 (14.5%) | 24 (2.2%) |
| $25,000 to $34,999 | 71 (6.2%) | 59 (5.4%) |
| $35,000 to $49,999 | 231 (20.1%) | 130 (11.9%) |
| $50,000 to $74,999 | 191 (16.6%) | 145 (13.2%) |
| $75,000 to $99,999 | 166 (14.4%) | 208 (19.0%) |
| $100,000 to $149,999 | 115 (10.0%) | 124 (11.3%) |
| $150,000 or more | 96 (8.4%) | 223 (20.4%) |
| Total | 1,150 (100.0%) | 1,095 (100.0%) |
Property Value to Household Income Ratio in Greensville County

| Value-to-Income Ratio | Without Mortgage | With Mortgage |
| Less than 2.0x | 492 (42.8%) | 70,703 (6,456.9%) |
| 2.0x to 2.9x | 127 (11.0%) | 541 (49.4%) |
| 3.0x to 3.9x | 242 (21.0%) | 234 (21.4%) |
| 4.0x or more | 278 (24.2%) | 76 (6.9%) |
| Total | 1,150 (100.0%) | 1,095 (100.0%) |
Real Estate Taxes by Mortgage Status in Greensville County
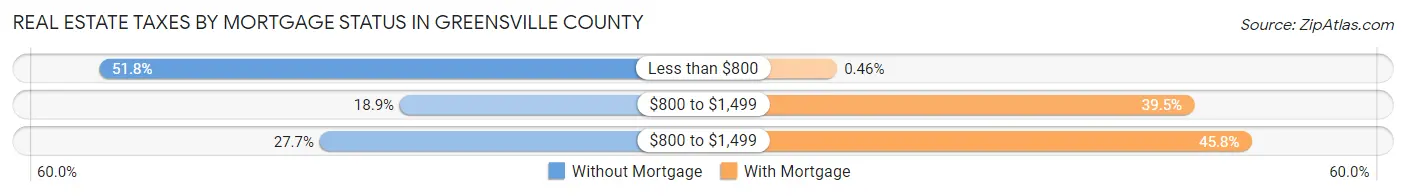
| Property Taxes | Without Mortgage | With Mortgage |
| Less than $800 | 596 (51.8%) | 5 (0.5%) |
| $800 to $1,499 | 217 (18.9%) | 433 (39.5%) |
| $800 to $1,499 | 318 (27.7%) | 502 (45.8%) |
| Total | 1,150 (100.0%) | 1,095 (100.0%) |
Health & Disability in Greensville County
Health Insurance Coverage by Age in Greensville County
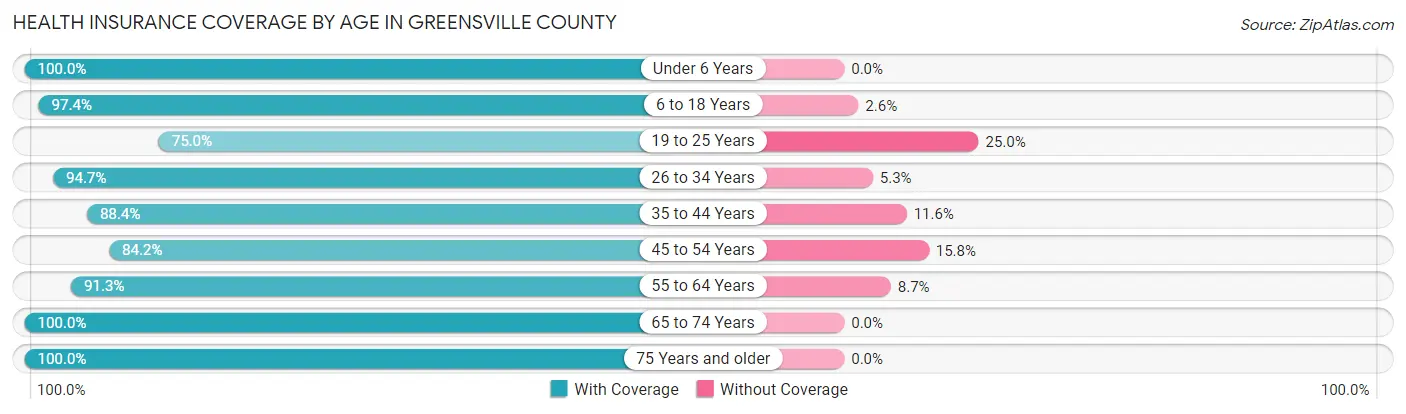
| Age Bracket | With Coverage | Without Coverage |
| Under 6 Years | 557 (100.0%) | 0 (0.0%) |
| 6 to 18 Years | 1,294 (97.4%) | 35 (2.6%) |
| 19 to 25 Years | 605 (75.0%) | 202 (25.0%) |
| 26 to 34 Years | 1,014 (94.7%) | 57 (5.3%) |
| 35 to 44 Years | 486 (88.4%) | 64 (11.6%) |
| 45 to 54 Years | 1,144 (84.2%) | 214 (15.8%) |
| 55 to 64 Years | 926 (91.3%) | 88 (8.7%) |
| 65 to 74 Years | 1,094 (100.0%) | 0 (0.0%) |
| 75 Years and older | 647 (100.0%) | 0 (0.0%) |
| Total | 7,767 (92.2%) | 660 (7.8%) |
Health Insurance Coverage by Citizenship Status in Greensville County
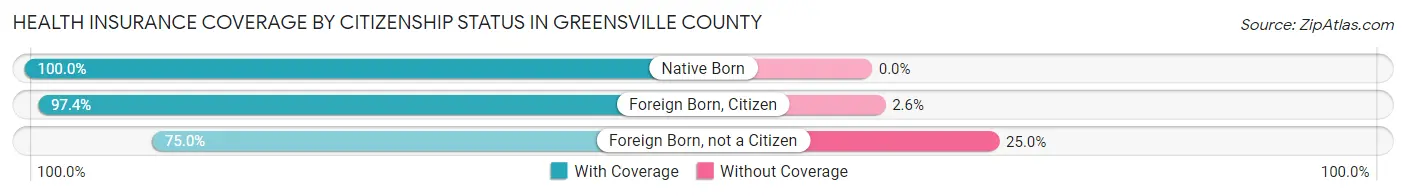
| Citizenship Status | With Coverage | Without Coverage |
| Native Born | 557 (100.0%) | 0 (0.0%) |
| Foreign Born, Citizen | 1,294 (97.4%) | 35 (2.6%) |
| Foreign Born, not a Citizen | 605 (75.0%) | 202 (25.0%) |
Health Insurance Coverage by Household Income in Greensville County
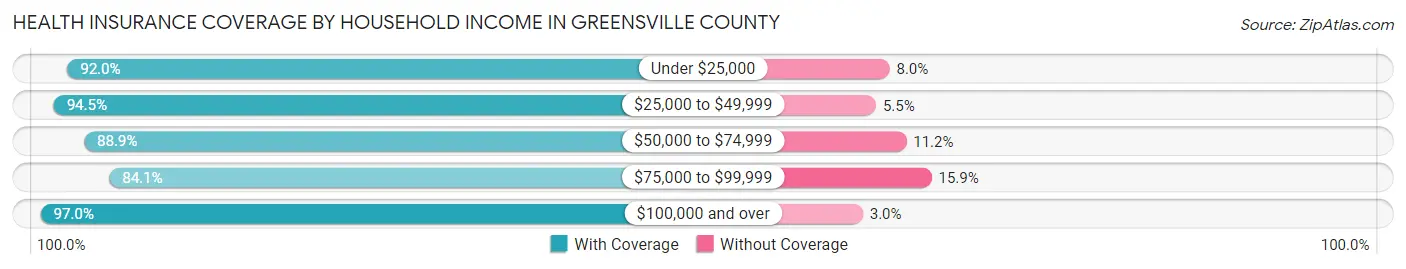
| Household Income | With Coverage | Without Coverage |
| Under $25,000 | 896 (92.0%) | 78 (8.0%) |
| $25,000 to $49,999 | 1,989 (94.5%) | 115 (5.5%) |
| $50,000 to $74,999 | 1,060 (88.8%) | 133 (11.2%) |
| $75,000 to $99,999 | 1,367 (84.1%) | 258 (15.9%) |
| $100,000 and over | 2,455 (97.0%) | 76 (3.0%) |
Public vs Private Health Insurance Coverage by Age in Greensville County
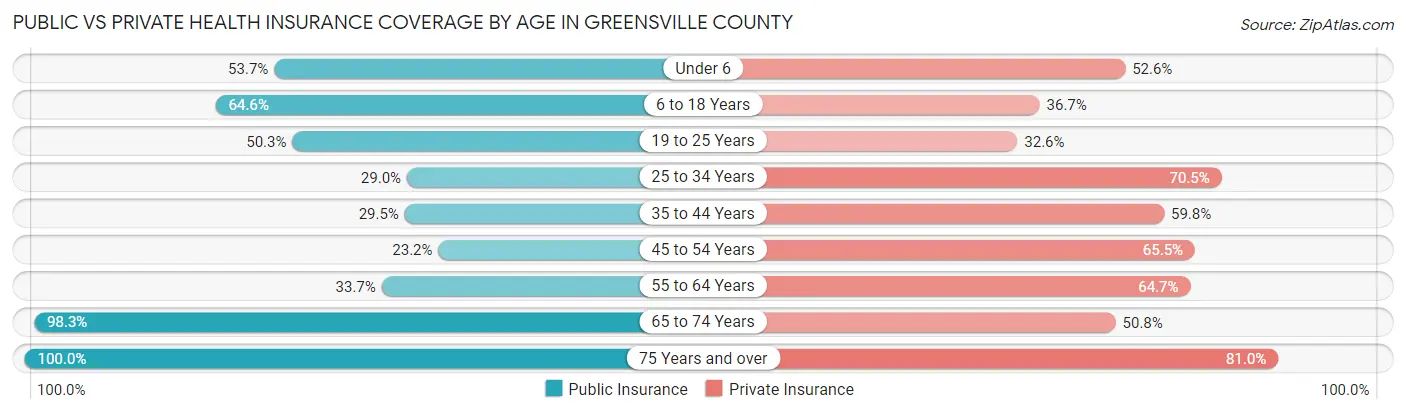
| Age Bracket | Public Insurance | Private Insurance |
| Under 6 | 299 (53.7%) | 293 (52.6%) |
| 6 to 18 Years | 858 (64.6%) | 488 (36.7%) |
| 19 to 25 Years | 406 (50.3%) | 263 (32.6%) |
| 25 to 34 Years | 311 (29.0%) | 755 (70.5%) |
| 35 to 44 Years | 162 (29.4%) | 329 (59.8%) |
| 45 to 54 Years | 315 (23.2%) | 890 (65.5%) |
| 55 to 64 Years | 342 (33.7%) | 656 (64.7%) |
| 65 to 74 Years | 1,075 (98.3%) | 556 (50.8%) |
| 75 Years and over | 647 (100.0%) | 524 (81.0%) |
| Total | 4,415 (52.4%) | 4,754 (56.4%) |
Disability Status by Sex by Age in Greensville County
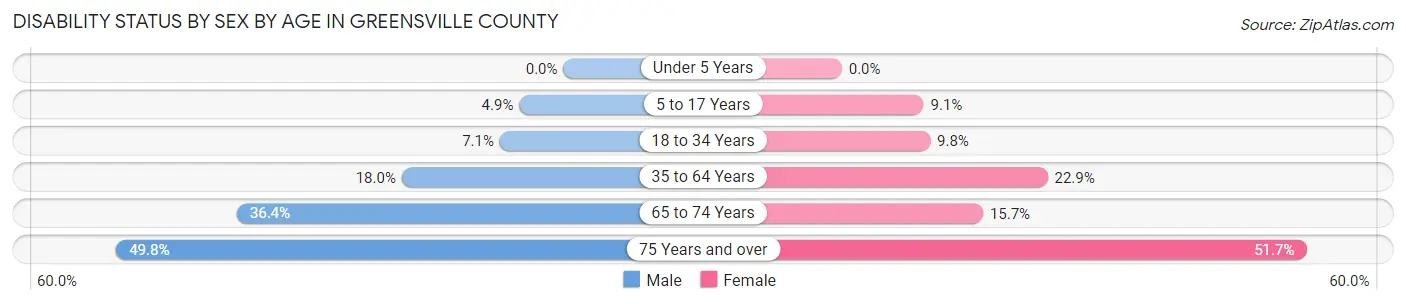
| Age Bracket | Male | Female |
| Under 5 Years | 0 (0.0%) | 0 (0.0%) |
| 5 to 17 Years | 27 (4.9%) | 69 (9.1%) |
| 18 to 34 Years | 82 (7.1%) | 77 (9.8%) |
| 35 to 64 Years | 240 (18.0%) | 364 (22.9%) |
| 65 to 74 Years | 192 (36.4%) | 89 (15.7%) |
| 75 Years and over | 119 (49.8%) | 211 (51.7%) |
Disability Class by Sex by Age in Greensville County
Disability Class: Hearing Difficulty

| Age Bracket | Male | Female |
| Under 5 Years | 0 (0.0%) | 0 (0.0%) |
| 5 to 17 Years | 0 (0.0%) | 0 (0.0%) |
| 18 to 34 Years | 0 (0.0%) | 0 (0.0%) |
| 35 to 64 Years | 129 (9.7%) | 37 (2.3%) |
| 65 to 74 Years | 49 (9.3%) | 23 (4.1%) |
| 75 Years and over | 93 (38.9%) | 87 (21.3%) |
Disability Class: Vision Difficulty
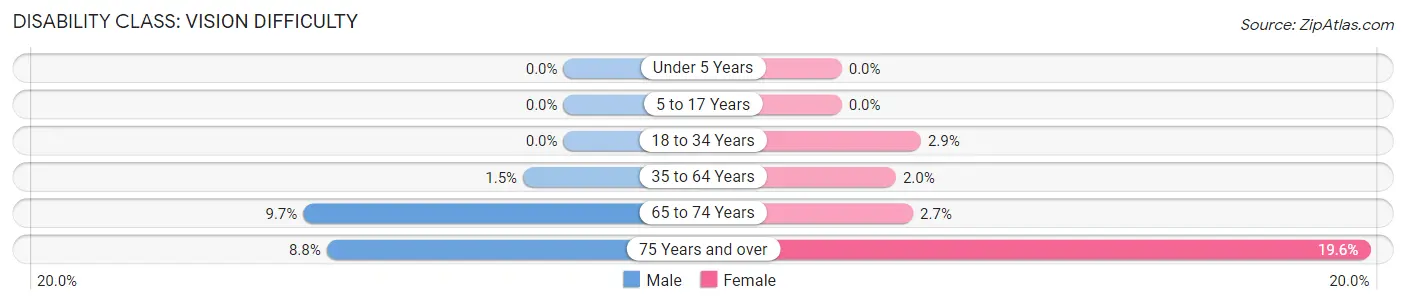
| Age Bracket | Male | Female |
| Under 5 Years | 0 (0.0%) | 0 (0.0%) |
| 5 to 17 Years | 0 (0.0%) | 0 (0.0%) |
| 18 to 34 Years | 0 (0.0%) | 23 (2.9%) |
| 35 to 64 Years | 20 (1.5%) | 32 (2.0%) |
| 65 to 74 Years | 51 (9.7%) | 15 (2.6%) |
| 75 Years and over | 21 (8.8%) | 80 (19.6%) |
Disability Class: Cognitive Difficulty
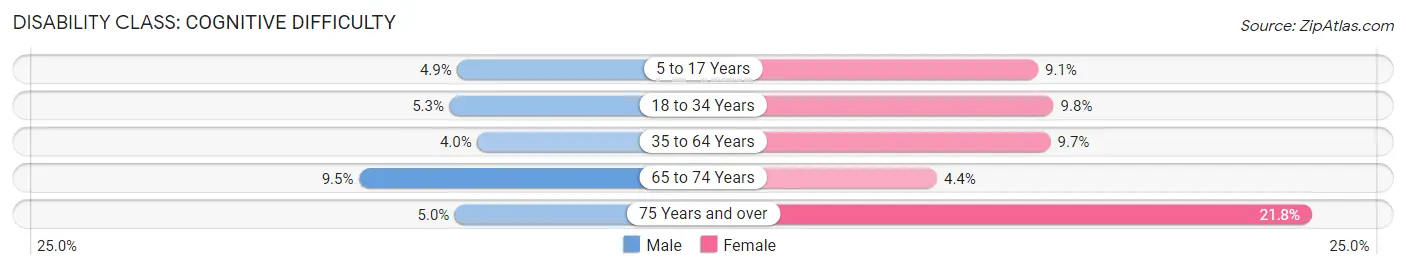
| Age Bracket | Male | Female |
| 5 to 17 Years | 27 (4.9%) | 69 (9.1%) |
| 18 to 34 Years | 61 (5.3%) | 77 (9.8%) |
| 35 to 64 Years | 53 (4.0%) | 154 (9.7%) |
| 65 to 74 Years | 50 (9.5%) | 25 (4.4%) |
| 75 Years and over | 12 (5.0%) | 89 (21.8%) |
Disability Class: Ambulatory Difficulty
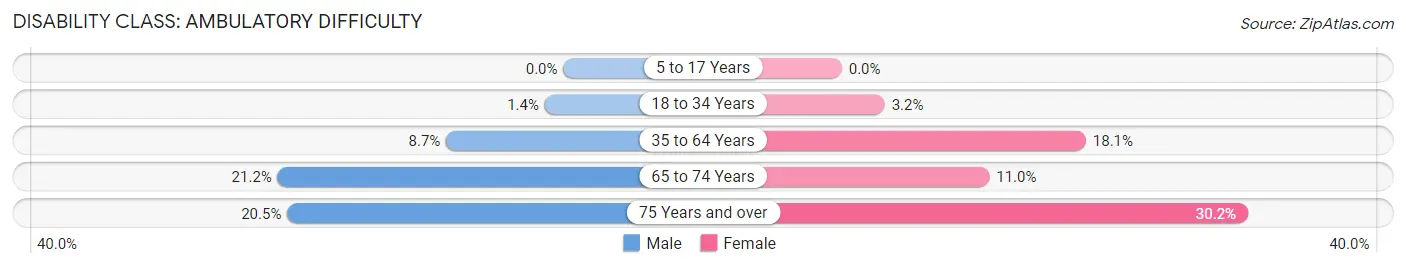
| Age Bracket | Male | Female |
| 5 to 17 Years | 0 (0.0%) | 0 (0.0%) |
| 18 to 34 Years | 16 (1.4%) | 25 (3.2%) |
| 35 to 64 Years | 116 (8.7%) | 288 (18.1%) |
| 65 to 74 Years | 112 (21.2%) | 62 (11.0%) |
| 75 Years and over | 49 (20.5%) | 123 (30.1%) |
Disability Class: Self-Care Difficulty
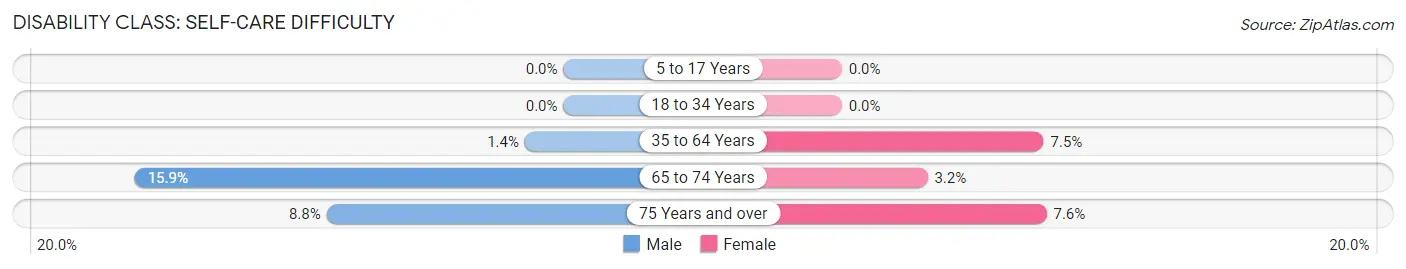
| Age Bracket | Male | Female |
| 5 to 17 Years | 0 (0.0%) | 0 (0.0%) |
| 18 to 34 Years | 0 (0.0%) | 0 (0.0%) |
| 35 to 64 Years | 19 (1.4%) | 119 (7.5%) |
| 65 to 74 Years | 84 (15.9%) | 18 (3.2%) |
| 75 Years and over | 21 (8.8%) | 31 (7.6%) |
Technology Access in Greensville County
Computing Device Access in Greensville County
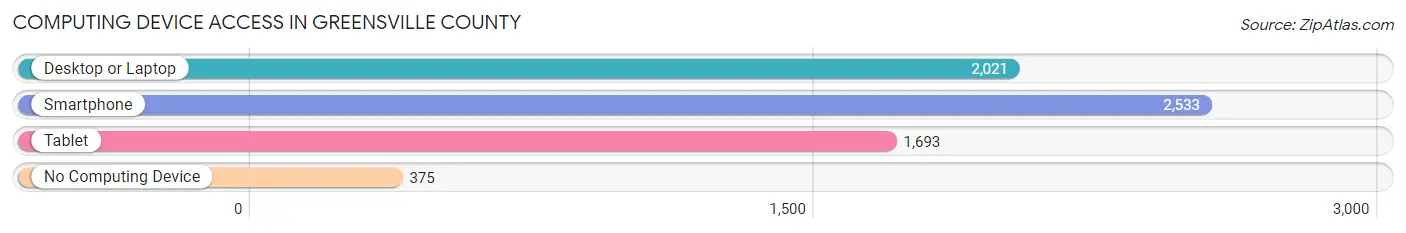
| Device Type | # Households | % Households |
| Desktop or Laptop | 2,021 | 62.7% |
| Smartphone | 2,533 | 78.6% |
| Tablet | 1,693 | 52.5% |
| No Computing Device | 375 | 11.6% |
| Total | 3,222 | 100.0% |
Internet Access in Greensville County
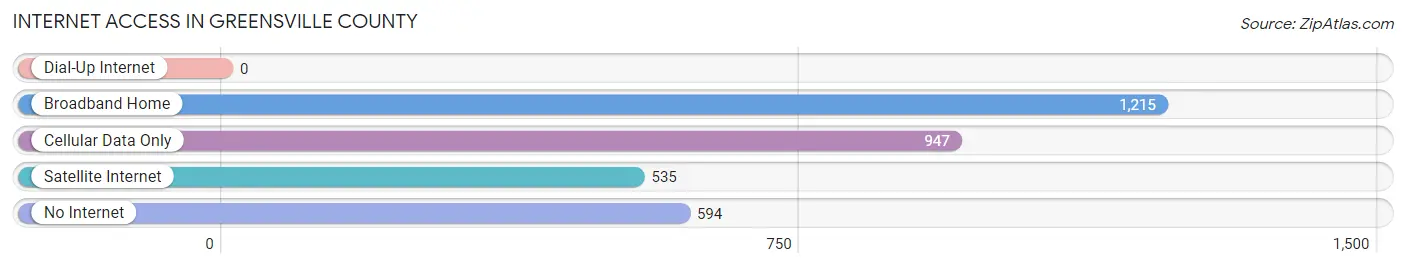
| Internet Type | # Households | % Households |
| Dial-Up Internet | 0 | 0.0% |
| Broadband Home | 1,215 | 37.7% |
| Cellular Data Only | 947 | 29.4% |
| Satellite Internet | 535 | 16.6% |
| No Internet | 594 | 18.4% |
| Total | 3,222 | 100.0% |
Greensville County Summary
Greensville County, Virginia is located in the southeastern corner of the state, bordered by North Carolina to the south and the Meherrin River to the east. It is part of the Southside Virginia region and is part of the larger Hampton Roads metropolitan area. The county seat is Emporia, and the county is home to a population of 12,541 people, according to the 2020 U.S. Census.
History
Greensville County was formed in 1781 from Brunswick County. It was named for General Nathanael Greene, a hero of the American Revolution. The county was home to several Native American tribes, including the Meherrin, Nottoway, and Tuscarora. The county was also home to several plantations, including the historic Belle Mont Plantation, which was built in 1790 and is now a museum.
Geography
Greensville County is located in the southeastern corner of Virginia, bordered by North Carolina to the south and the Meherrin River to the east. The county is part of the Southside Virginia region and is part of the larger Hampton Roads metropolitan area. The county is mostly rural, with the majority of the land being used for farming and forestry. The county is home to several rivers, including the Meherrin, Nottoway, and Blackwater.
Economy
Greensville County is largely rural, with the majority of the population living in small towns and rural areas. The county is home to several large employers, including the Greensville County Public Schools, the Greensville County Sheriff's Office, and the Greensville County Health Department. The county is also home to several manufacturing companies, including the Emporia-Greensville Regional Airport, which is the largest employer in the county.
Demographics
According to the 2020 U.S. Census, Greensville County has a population of 12,541 people. The population is 53.2% White, 41.2% Black or African American, 0.7% Native American, 0.7% Asian, 0.1% Pacific Islander, and 3.1% from other races. The median household income is $41,945, and the median age is 38.7 years. The county has a poverty rate of 17.3%.
Conclusion
Greensville County, Virginia is a rural county located in the southeastern corner of the state. It is part of the Southside Virginia region and is part of the larger Hampton Roads metropolitan area. The county is home to a population of 12,541 people, according to the 2020 U.S. Census. The county is largely rural, with the majority of the population living in small towns and rural areas. The county is home to several large employers, including the Greensville County Public Schools, the Greensville County Sheriff's Office, and the Greensville County Health Department. The median household income is $41,945, and the poverty rate is 17.3%.
Common Questions
What is the Total Population of Greensville County?
Total Population of Greensville County is 11,373.
What is the Total Male Population of Greensville County?
Total Male Population of Greensville County is 6,951.
What is the Total Female Population of Greensville County?
Total Female Population of Greensville County is 4,422.
What is the Ratio of Males per 100 Females in Greensville County?
There are 157.19 Males per 100 Females in Greensville County.
What is the Ratio of Females per 100 Males in Greensville County?
There are 63.62 Females per 100 Males in Greensville County.
What is the Median Population Age in Greensville County?
Median Population Age in Greensville County is 40.8 Years.
What is the Average Family Size in Greensville County
Average Family Size in Greensville County is 3.2 People.
What is the Average Household Size in Greensville County
Average Household Size in Greensville County is 2.6 People.
What is Per Capita Income in Greensville County?
Per Capita income in Greensville County is $22,437.
What is the Median Family Income in Greensville County?
Median Family Income in Greensville County is $70,573.
What is the Median Household income in Greensville County?
Median Household Income in Greensville County is $51,823.
What is Income or Wage Gap in Greensville County?
Income or Wage Gap in Greensville County is 11.3%.
Women in Greensville County earn 88.7 cents for every dollar earned by a man.
What is Family Income Deficit in Greensville County?
Family Income Deficit in Greensville County is $13,337.
Families that are below poverty line in Greensville County earn $13,337 less on average than the poverty threshold level.
What is Inequality or Gini Index in Greensville County?
Inequality or Gini Index in Greensville County is 0.46.
How Large is the Labor Force in Greensville County?
There are 4,195 People in the Labor Forcein in Greensville County.
What is the Percentage of People in the Labor Force in Greensville County?
43.0% of People are in the Labor Force in Greensville County.
What is the Unemployment Rate in Greensville County?
Unemployment Rate in Greensville County is 6.3%.