Caroline County, VA
Caroline County Overview
31,181
TOTAL POPULATION
15,457
MALE POPULATION
15,724
FEMALE POPULATION
98.30
MALES / 100 FEMALES
101.73
FEMALES / 100 MALES
39.2
MEDIAN AGE
3.0
AVG FAMILY SIZE
2.6
AVG HOUSEHOLD SIZE
$38,432
PER CAPITA INCOME
$96,803
AVG FAMILY INCOME
$83,562
AVG HOUSEHOLD INCOME
28.8%
WAGE / INCOME GAP [ % ]
71.2¢/ $1
WAGE / INCOME GAP [ $ ]
$10,676
FAMILY INCOME DEFICIT
0.41
INEQUALITY / GINI INDEX
16,854
LABOR FORCE [ PEOPLE ]
68.4%
PERCENT IN LABOR FORCE
4.6%
UNEMPLOYMENT RATE
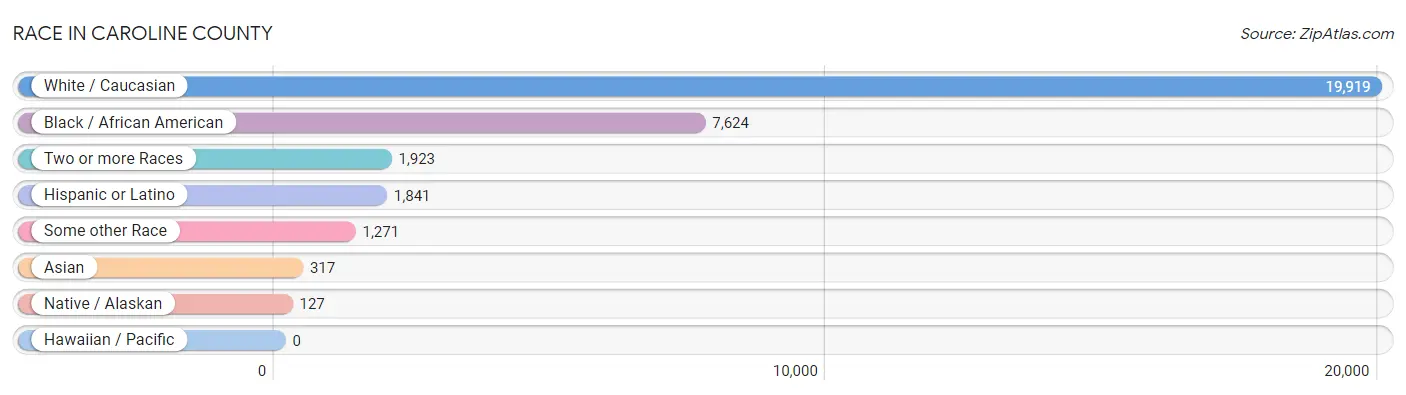
Race in Caroline County
The most populous races in Caroline County are White / Caucasian (19,919 | 63.9%), Black / African American (7,624 | 24.4%), and Two or more Races (1,923 | 6.2%).
| Race | # Population | % Population |
| Asian | 317 | 1.0% |
| Black / African American | 7,624 | 24.4% |
| Hawaiian / Pacific | 0 | 0.0% |
| Hispanic or Latino | 1,841 | 5.9% |
| Native / Alaskan | 127 | 0.4% |
| White / Caucasian | 19,919 | 63.9% |
| Two or more Races | 1,923 | 6.2% |
| Some other Race | 1,271 | 4.1% |
| Total | 31,181 | 100.0% |
Ancestry in Caroline County
The most populous ancestries reported in Caroline County are English (3,646 | 11.7%), German (3,402 | 10.9%), Irish (3,234 | 10.4%), American (2,051 | 6.6%), and Italian (1,136 | 3.6%), together accounting for 43.2% of all Caroline County residents.

| Ancestry | # Population | % Population |
| Afghan | 23 | 0.1% |
| African | 80 | 0.3% |
| Albanian | 20 | 0.1% |
| American | 2,051 | 6.6% |
| Arab | 29 | 0.1% |
| Australian | 16 | 0.1% |
| Austrian | 49 | 0.2% |
| Bhutanese | 29 | 0.1% |
| Blackfeet | 145 | 0.5% |
| British | 494 | 1.6% |
| British West Indian | 11 | 0.0% |
| Burmese | 48 | 0.2% |
| Canadian | 11 | 0.0% |
| Celtic | 177 | 0.6% |
| Central American | 459 | 1.5% |
| Cherokee | 85 | 0.3% |
| Colombian | 7 | 0.0% |
| Cree | 6 | 0.0% |
| Creek | 1 | 0.0% |
| Croatian | 16 | 0.1% |
| Cuban | 206 | 0.7% |
| Czech | 372 | 1.2% |
| Czechoslovakian | 20 | 0.1% |
| Danish | 186 | 0.6% |
| Dominican | 99 | 0.3% |
| Dutch | 231 | 0.7% |
| Eastern European | 29 | 0.1% |
| English | 3,646 | 11.7% |
| European | 376 | 1.2% |
| Finnish | 6 | 0.0% |
| French | 923 | 3.0% |
| French American Indian | 6 | 0.0% |
| French Canadian | 219 | 0.7% |
| German | 3,402 | 10.9% |
| Greek | 101 | 0.3% |
| Guatemalan | 135 | 0.4% |
| Honduran | 190 | 0.6% |
| Hungarian | 200 | 0.6% |
| Indian (Asian) | 4 | 0.0% |
| Irish | 3,234 | 10.4% |
| Iroquois | 29 | 0.1% |
| Italian | 1,136 | 3.6% |
| Jamaican | 9 | 0.0% |
| Korean | 207 | 0.7% |
| Lebanese | 29 | 0.1% |
| Liberian | 29 | 0.1% |
| Luxembourger | 6 | 0.0% |
| Mexican | 404 | 1.3% |
| Native Hawaiian | 6 | 0.0% |
| Nigerian | 27 | 0.1% |
| Northern European | 6 | 0.0% |
| Norwegian | 144 | 0.5% |
| Pakistani | 6 | 0.0% |
| Peruvian | 27 | 0.1% |
| Polish | 327 | 1.1% |
| Portuguese | 40 | 0.1% |
| Puerto Rican | 164 | 0.5% |
| Russian | 11 | 0.0% |
| Salvadoran | 134 | 0.4% |
| Scandinavian | 79 | 0.3% |
| Scotch-Irish | 220 | 0.7% |
| Scottish | 555 | 1.8% |
| Senegalese | 5 | 0.0% |
| Sierra Leonean | 6 | 0.0% |
| Slovak | 25 | 0.1% |
| South American | 65 | 0.2% |
| Spaniard | 109 | 0.4% |
| Spanish | 102 | 0.3% |
| Sri Lankan | 14 | 0.0% |
| Subsaharan African | 154 | 0.5% |
| Swedish | 104 | 0.3% |
| Swiss | 19 | 0.1% |
| Thai | 97 | 0.3% |
| Trinidadian and Tobagonian | 5 | 0.0% |
| Ukrainian | 16 | 0.1% |
| Venezuelan | 31 | 0.1% |
| Welsh | 63 | 0.2% |
| Yugoslavian | 38 | 0.1% | View All 78 Rows |
Immigrants in Caroline County
The most numerous immigrant groups reported in Caroline County came from Latin America (754 | 2.4%), Central America (547 | 1.8%), Mexico (261 | 0.8%), Asia (199 | 0.6%), and Europe (175 | 0.6%), together accounting for 6.2% of all Caroline County residents.

| Immigration Origin | # Population | % Population |
| Africa | 74 | 0.2% |
| Asia | 199 | 0.6% |
| Canada | 9 | 0.0% |
| Caribbean | 130 | 0.4% |
| Central America | 547 | 1.8% |
| Colombia | 7 | 0.0% |
| Cuba | 35 | 0.1% |
| Dominican Republic | 36 | 0.1% |
| Eastern Asia | 54 | 0.2% |
| Eastern Europe | 25 | 0.1% |
| El Salvador | 83 | 0.3% |
| England | 82 | 0.3% |
| Europe | 175 | 0.6% |
| France | 22 | 0.1% |
| Germany | 39 | 0.1% |
| Guatemala | 102 | 0.3% |
| Guyana | 12 | 0.0% |
| Honduras | 101 | 0.3% |
| India | 29 | 0.1% |
| Jamaica | 9 | 0.0% |
| Japan | 6 | 0.0% |
| Korea | 48 | 0.2% |
| Latin America | 754 | 2.4% |
| Liberia | 56 | 0.2% |
| Mexico | 261 | 0.8% |
| Nigeria | 7 | 0.0% |
| Northern Europe | 82 | 0.3% |
| Peru | 27 | 0.1% |
| Philippines | 100 | 0.3% |
| Poland | 5 | 0.0% |
| Portugal | 7 | 0.0% |
| Senegal | 5 | 0.0% |
| Sierra Leone | 6 | 0.0% |
| Singapore | 4 | 0.0% |
| South America | 77 | 0.3% |
| South Central Asia | 29 | 0.1% |
| South Eastern Asia | 116 | 0.4% |
| Southern Europe | 7 | 0.0% |
| Thailand | 6 | 0.0% |
| Trinidad and Tobago | 39 | 0.1% |
| Venezuela | 31 | 0.1% |
| Vietnam | 6 | 0.0% |
| Western Africa | 74 | 0.2% |
| Western Europe | 61 | 0.2% | View All 44 Rows |
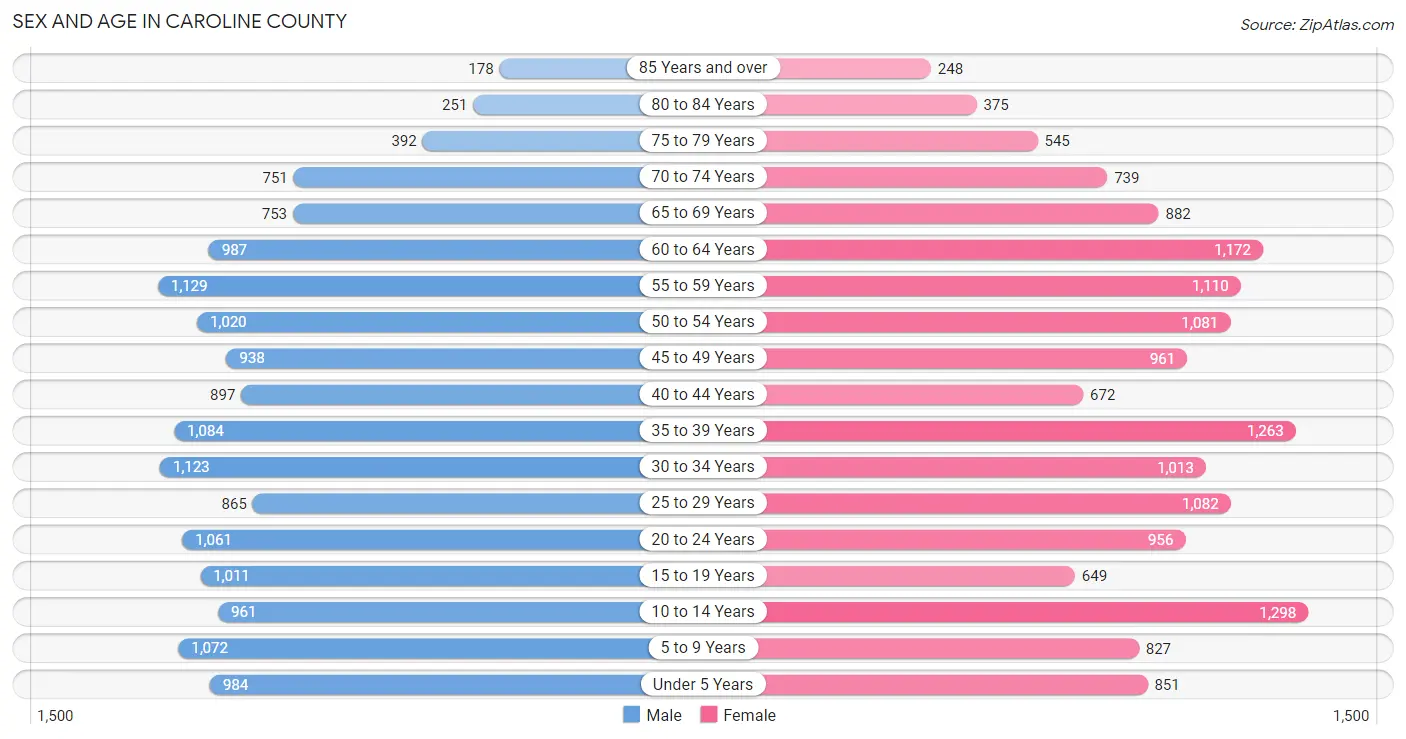
Sex and Age in Caroline County
Sex and Age in Caroline County
The most populous age groups in Caroline County are 55 to 59 Years (1,129 | 7.3%) for men and 10 to 14 Years (1,298 | 8.3%) for women.
| Age Bracket | Male | Female |
| Under 5 Years | 984 (6.4%) | 851 (5.4%) |
| 5 to 9 Years | 1,072 (6.9%) | 827 (5.3%) |
| 10 to 14 Years | 961 (6.2%) | 1,298 (8.3%) |
| 15 to 19 Years | 1,011 (6.5%) | 649 (4.1%) |
| 20 to 24 Years | 1,061 (6.9%) | 956 (6.1%) |
| 25 to 29 Years | 865 (5.6%) | 1,082 (6.9%) |
| 30 to 34 Years | 1,123 (7.3%) | 1,013 (6.4%) |
| 35 to 39 Years | 1,084 (7.0%) | 1,263 (8.0%) |
| 40 to 44 Years | 897 (5.8%) | 672 (4.3%) |
| 45 to 49 Years | 938 (6.1%) | 961 (6.1%) |
| 50 to 54 Years | 1,020 (6.6%) | 1,081 (6.9%) |
| 55 to 59 Years | 1,129 (7.3%) | 1,110 (7.1%) |
| 60 to 64 Years | 987 (6.4%) | 1,172 (7.4%) |
| 65 to 69 Years | 753 (4.9%) | 882 (5.6%) |
| 70 to 74 Years | 751 (4.9%) | 739 (4.7%) |
| 75 to 79 Years | 392 (2.5%) | 545 (3.5%) |
| 80 to 84 Years | 251 (1.6%) | 375 (2.4%) |
| 85 Years and over | 178 (1.1%) | 248 (1.6%) |
| Total | 15,457 (100.0%) | 15,724 (100.0%) |
Families and Households in Caroline County
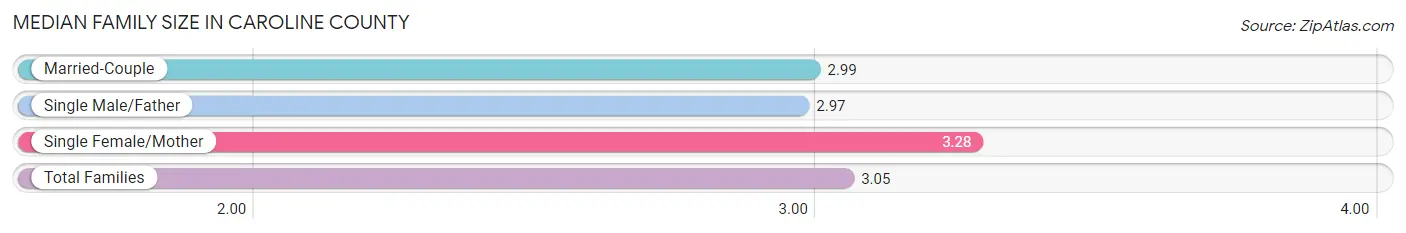
Median Family Size in Caroline County
The median family size in Caroline County is 3.05 persons per family, with single female/mother families (1,654 | 20.6%) accounting for the largest median family size of 3.28 persons per family. On the other hand, single male/father families (524 | 6.5%) represent the smallest median family size with 2.97 persons per family.
| Family Type | # Families | Family Size |
| Married-Couple | 5,860 (72.9%) | 2.99 |
| Single Male/Father | 524 (6.5%) | 2.97 |
| Single Female/Mother | 1,654 (20.6%) | 3.28 |
| Total Families | 8,038 (100.0%) | 3.05 |
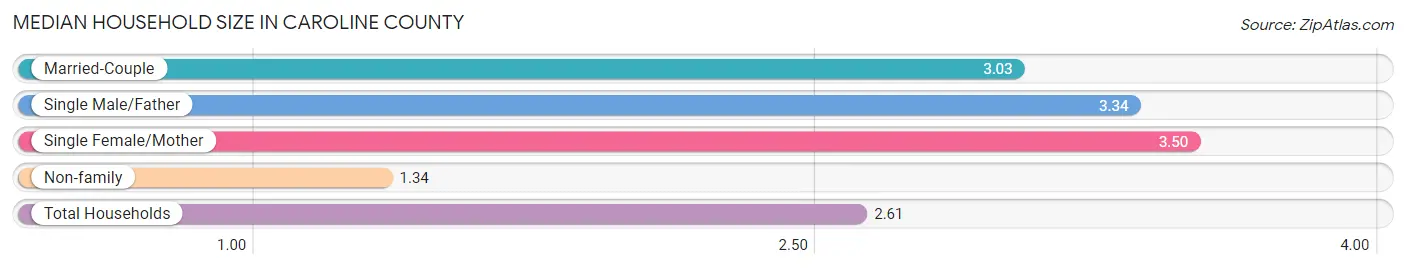
Median Household Size in Caroline County
The median household size in Caroline County is 2.61 persons per household, with single female/mother households (1,654 | 14.5%) accounting for the largest median household size of 3.5 persons per household. non-family households (3,349 | 29.4%) represent the smallest median household size with 1.34 persons per household.
| Household Type | # Households | Household Size |
| Married-Couple | 5,860 (51.5%) | 3.03 |
| Single Male/Father | 524 (4.6%) | 3.34 |
| Single Female/Mother | 1,654 (14.5%) | 3.50 |
| Non-family | 3,349 (29.4%) | 1.34 |
| Total Households | 11,387 (100.0%) | 2.61 |
Household Size by Marriage Status in Caroline County
Out of a total of 11,387 households in Caroline County, 8,038 (70.6%) are family households, while 3,349 (29.4%) are nonfamily households. The most numerous type of family households are 2-person households, comprising 3,524, and the most common type of nonfamily households are 1-person households, comprising 2,658.
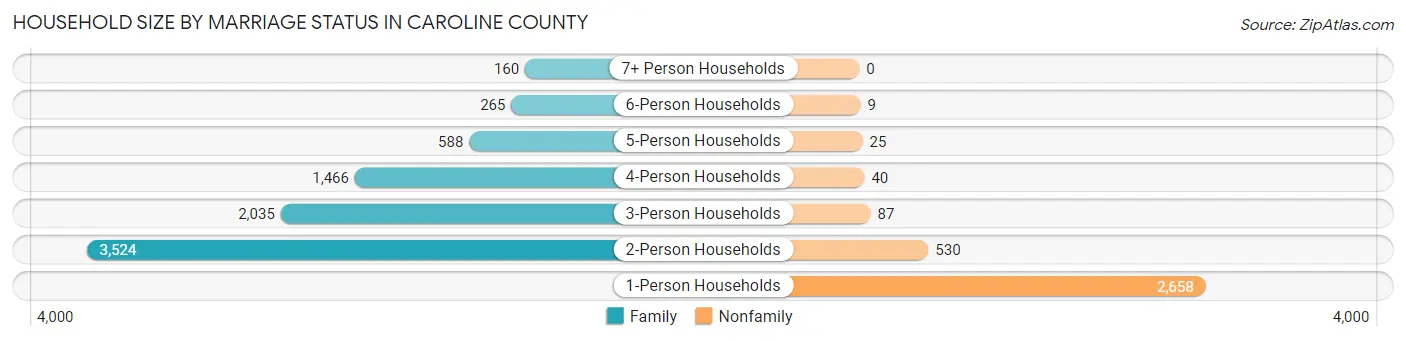
| Household Size | Family Households | Nonfamily Households |
| 1-Person Households | - | 2,658 (23.3%) |
| 2-Person Households | 3,524 (30.9%) | 530 (4.6%) |
| 3-Person Households | 2,035 (17.9%) | 87 (0.8%) |
| 4-Person Households | 1,466 (12.9%) | 40 (0.4%) |
| 5-Person Households | 588 (5.2%) | 25 (0.2%) |
| 6-Person Households | 265 (2.3%) | 9 (0.1%) |
| 7+ Person Households | 160 (1.4%) | 0 (0.0%) |
| Total | 8,038 (70.6%) | 3,349 (29.4%) |
Female Fertility in Caroline County
Fertility by Age in Caroline County
Average fertility rate in Caroline County is 58.0 births per 1,000 women. Women in the age bracket of 20 to 34 years have the highest fertility rate with 112.0 births per 1,000 women. Women in the age bracket of 20 to 34 years acount for 86.4% of all women with births.
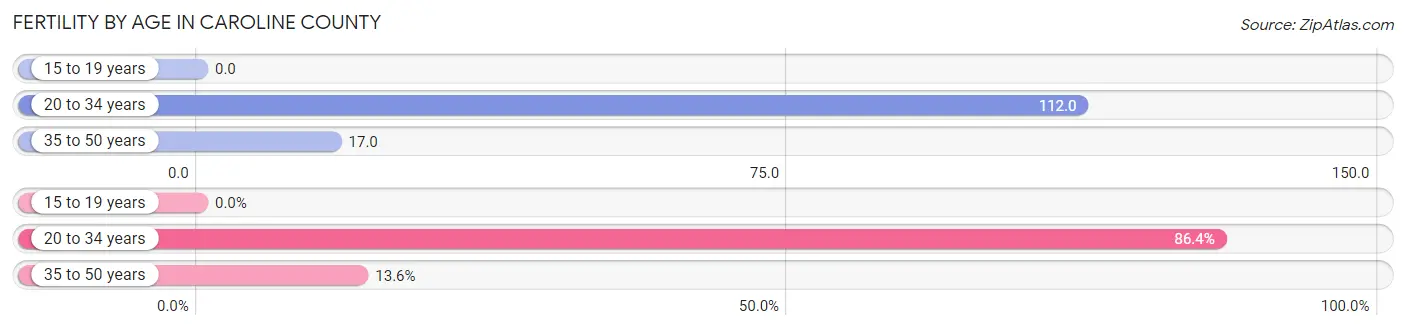
| Age Bracket | Women with Births | Births / 1,000 Women |
| 15 to 19 years | 0 (0.0%) | 0.0 |
| 20 to 34 years | 343 (86.4%) | 112.0 |
| 35 to 50 years | 54 (13.6%) | 17.0 |
| Total | 397 (100.0%) | 58.0 |
Fertility by Age by Marriage Status in Caroline County
75.1% of women with births (397) in Caroline County are married. The highest percentage of unmarried women with births falls into 20 to 34 years age bracket with 28.3% of them unmarried at the time of birth, while the lowest percentage of unmarried women with births belong to 35 to 50 years age bracket with 3.7% of them unmarried.

| Age Bracket | Married | Unmarried |
| 15 to 19 years | 0 (0.0%) | 0 (0.0%) |
| 20 to 34 years | 246 (71.7%) | 97 (28.3%) |
| 35 to 50 years | 52 (96.3%) | 2 (3.7%) |
| Total | 298 (75.1%) | 99 (24.9%) |
Fertility by Education in Caroline County

| Educational Attainment | Women with Births | Births / 1,000 Women |
| Less than High School | 85 (21.4%) | 72.0 |
| High School Diploma | 140 (35.3%) | 71.0 |
| College or Associate's Degree | 128 (32.2%) | 70.0 |
| Bachelor's Degree | 44 (11.1%) | 35.0 |
| Graduate Degree | 0 (0.0%) | 0.0 |
| Total | 397 (100.0%) | 58.0 |
Fertility by Education by Marriage Status in Caroline County
24.9% of women with births in Caroline County are unmarried. Women with the educational attainment of bachelor's degree are most likely to be married with 100.0% of them married at childbirth, while women with the educational attainment of less than high school are least likely to be married with 41.2% of them unmarried at childbirth.
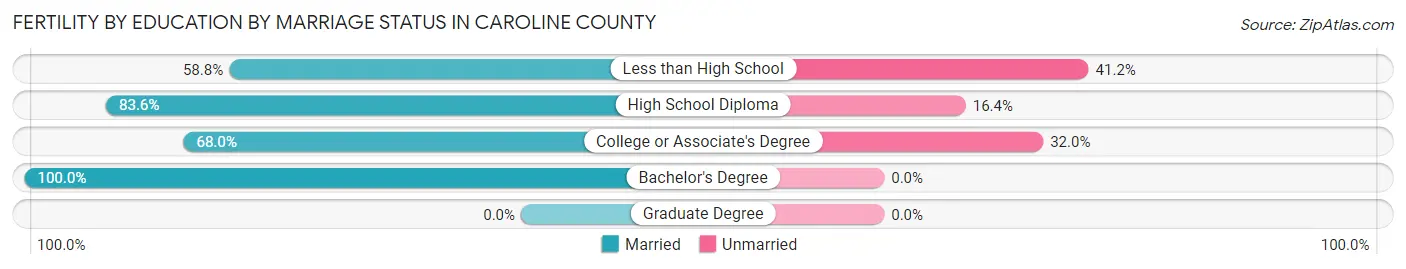
| Educational Attainment | Married | Unmarried |
| Less than High School | 50 (58.8%) | 35 (41.2%) |
| High School Diploma | 117 (83.6%) | 23 (16.4%) |
| College or Associate's Degree | 87 (68.0%) | 41 (32.0%) |
| Bachelor's Degree | 44 (100.0%) | 0 (0.0%) |
| Graduate Degree | 0 (0.0%) | 0 (0.0%) |
| Total | 298 (75.1%) | 99 (24.9%) |
Income in Caroline County
Income Overview in Caroline County
Per Capita Income in Caroline County is $38,432, while median incomes of families and households are $96,803 and $83,562 respectively.
| Characteristic | Number | Measure |
| Per Capita Income | 31,181 | $38,432 |
| Median Family Income | 8,038 | $96,803 |
| Mean Family Income | 8,038 | $111,586 |
| Median Household Income | 11,387 | $83,562 |
| Mean Household Income | 11,387 | $100,056 |
| Income Deficit | 8,038 | $10,676 |
| Wage / Income Gap (%) | 31,181 | 28.77% |
| Wage / Income Gap ($) | 31,181 | 71.23¢ per $1 |
| Gini / Inequality Index | 31,181 | 0.41 |
Earnings by Sex in Caroline County
Average Earnings in Caroline County are $43,315, $51,117 for men and $36,409 for women, a difference of 28.8%.
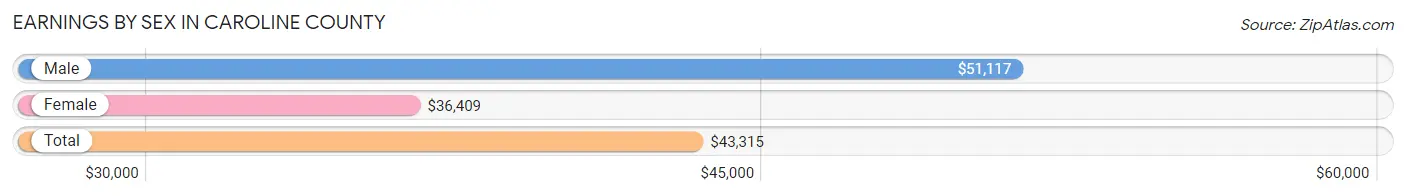
| Sex | Number | Average Earnings |
| Male | 8,973 (51.3%) | $51,117 |
| Female | 8,500 (48.6%) | $36,409 |
| Total | 17,473 (100.0%) | $43,315 |
Earnings by Sex by Income Bracket in Caroline County
The most common earnings brackets in Caroline County are $100,000+ for men (1,851 | 20.6%) and $25,000 to $29,999 for women (843 | 9.9%).
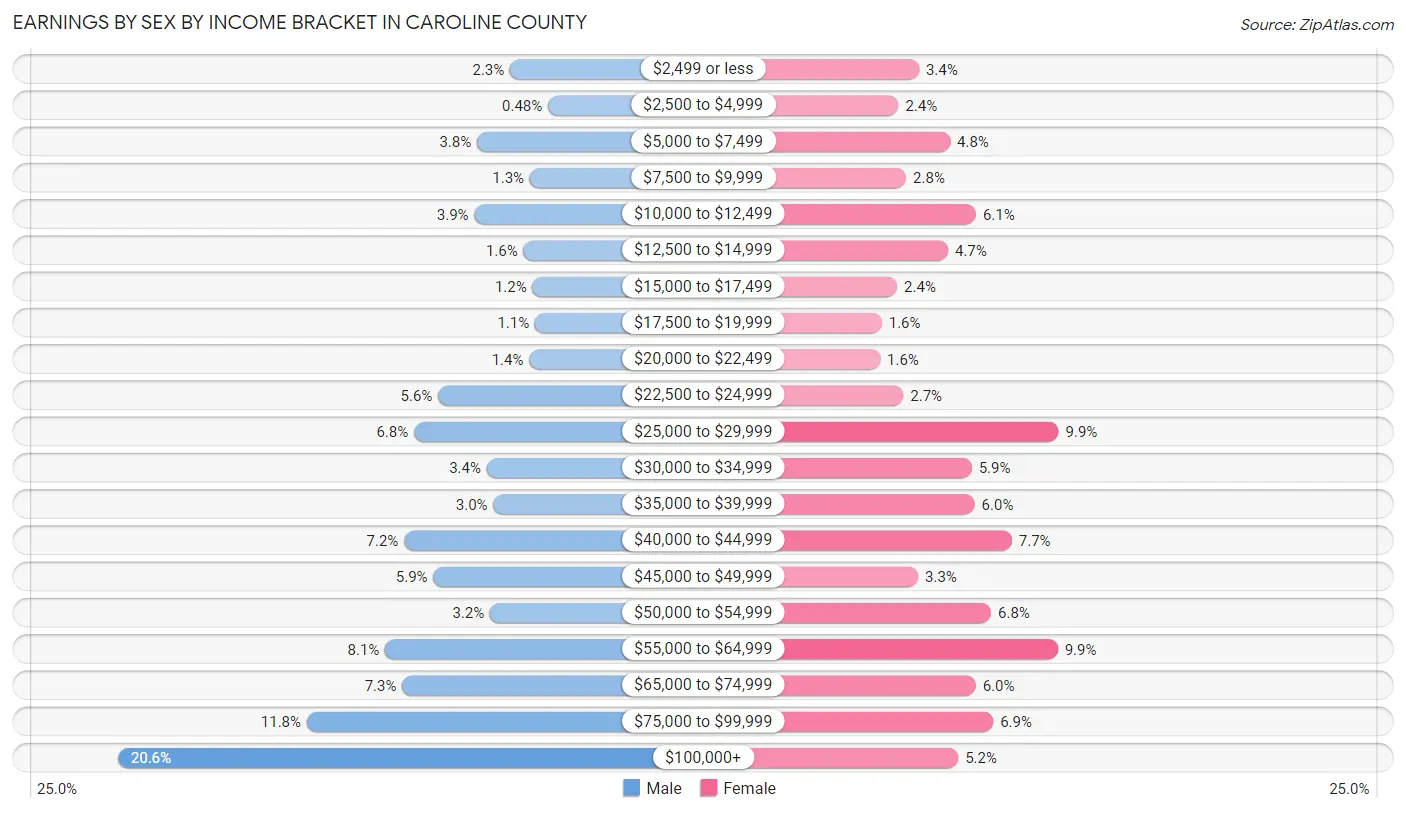
| Income | Male | Female |
| $2,499 or less | 203 (2.3%) | 287 (3.4%) |
| $2,500 to $4,999 | 43 (0.5%) | 206 (2.4%) |
| $5,000 to $7,499 | 342 (3.8%) | 411 (4.8%) |
| $7,500 to $9,999 | 119 (1.3%) | 236 (2.8%) |
| $10,000 to $12,499 | 353 (3.9%) | 514 (6.0%) |
| $12,500 to $14,999 | 146 (1.6%) | 403 (4.7%) |
| $15,000 to $17,499 | 109 (1.2%) | 201 (2.4%) |
| $17,500 to $19,999 | 98 (1.1%) | 139 (1.6%) |
| $20,000 to $22,499 | 122 (1.4%) | 133 (1.6%) |
| $22,500 to $24,999 | 505 (5.6%) | 225 (2.6%) |
| $25,000 to $29,999 | 607 (6.8%) | 843 (9.9%) |
| $30,000 to $34,999 | 301 (3.4%) | 497 (5.9%) |
| $35,000 to $39,999 | 273 (3.0%) | 509 (6.0%) |
| $40,000 to $44,999 | 648 (7.2%) | 657 (7.7%) |
| $45,000 to $49,999 | 525 (5.9%) | 284 (3.3%) |
| $50,000 to $54,999 | 287 (3.2%) | 575 (6.8%) |
| $55,000 to $64,999 | 728 (8.1%) | 840 (9.9%) |
| $65,000 to $74,999 | 656 (7.3%) | 513 (6.0%) |
| $75,000 to $99,999 | 1,057 (11.8%) | 583 (6.9%) |
| $100,000+ | 1,851 (20.6%) | 444 (5.2%) |
| Total | 8,973 (100.0%) | 8,500 (100.0%) |
Earnings by Sex by Educational Attainment in Caroline County
Average earnings in Caroline County are $60,759 for men and $40,484 for women, a difference of 33.4%. Men with an educational attainment of bachelor's degree enjoy the highest average annual earnings of $89,206, while those with less than high school education earn the least with $23,309. Women with an educational attainment of graduate degree earn the most with the average annual earnings of $60,625, while those with high school diploma education have the smallest earnings of $28,319.

| Educational Attainment | Male Income | Female Income |
| Less than High School | $23,309 | $33,750 |
| High School Diploma | $48,678 | $28,319 |
| College or Associate's Degree | $67,397 | $40,700 |
| Bachelor's Degree | $89,206 | $54,142 |
| Graduate Degree | $75,159 | $60,625 |
| Total | $60,759 | $40,484 |
Family Income in Caroline County
Family Income Brackets in Caroline County
According to the Caroline County family income data, there are 2,074 families falling into the $100,000 to $149,999 income range, which is the most common income bracket and makes up 25.8% of all families. Conversely, the $10,000 to $14,999 income bracket is the least frequent group with only 80 families (1.0%) belonging to this category.
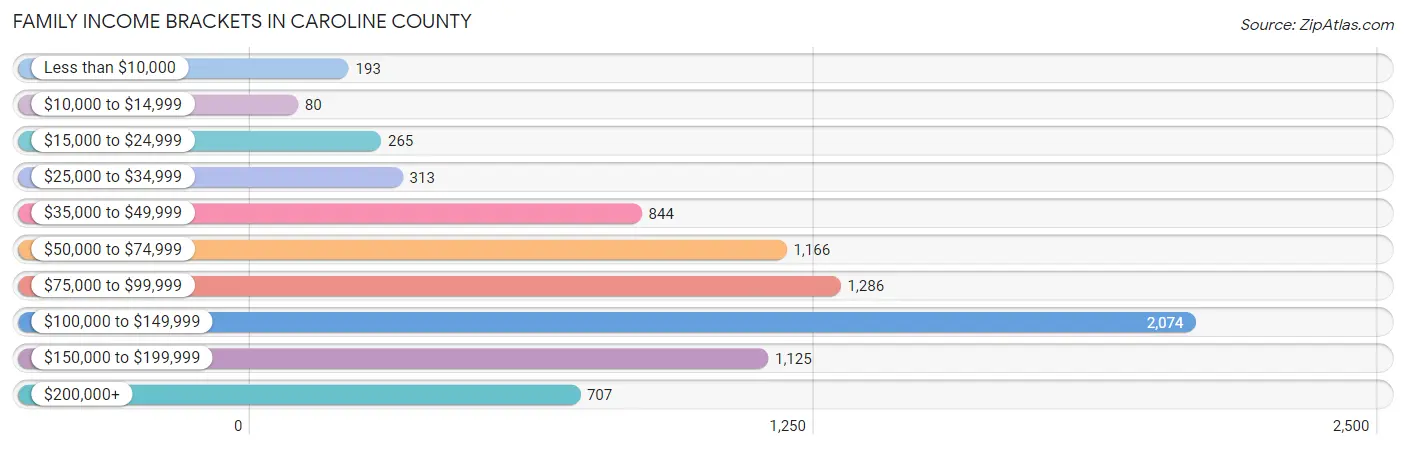
| Income Bracket | # Families | % Families |
| Less than $10,000 | 193 | 2.4% |
| $10,000 to $14,999 | 80 | 1.0% |
| $15,000 to $24,999 | 265 | 3.3% |
| $25,000 to $34,999 | 313 | 3.9% |
| $35,000 to $49,999 | 844 | 10.5% |
| $50,000 to $74,999 | 1,166 | 14.5% |
| $75,000 to $99,999 | 1,286 | 16.0% |
| $100,000 to $149,999 | 2,074 | 25.8% |
| $150,000 to $199,999 | 1,125 | 14.0% |
| $200,000+ | 707 | 8.8% |
Family Income by Famaliy Size in Caroline County
4-person families (1,417 | 17.6%) account for the highest median family income in Caroline County with $117,990 per family, while 2-person families (3,760 | 46.8%) have the highest median income of $41,856 per family member.
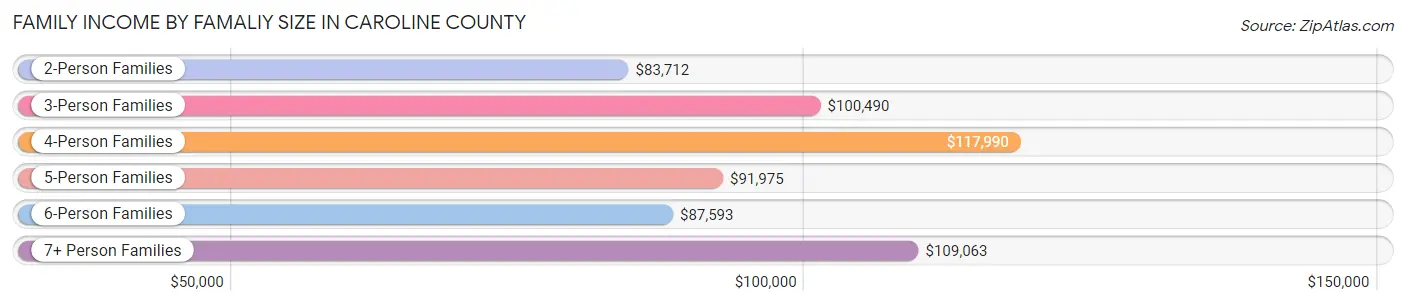
| Income Bracket | # Families | Median Income |
| 2-Person Families | 3,760 (46.8%) | $83,712 |
| 3-Person Families | 1,975 (24.6%) | $100,490 |
| 4-Person Families | 1,417 (17.6%) | $117,990 |
| 5-Person Families | 533 (6.6%) | $91,975 |
| 6-Person Families | 232 (2.9%) | $87,593 |
| 7+ Person Families | 121 (1.5%) | $109,063 |
| Total | 8,038 (100.0%) | $96,803 |
Family Income by Number of Earners in Caroline County
The median family income in Caroline County is $96,803, with families comprising 3+ earners (913) having the highest median family income of $166,326, while families with no earners (1,187) have the lowest median family income of $62,891, accounting for 11.4% and 14.8% of families, respectively.
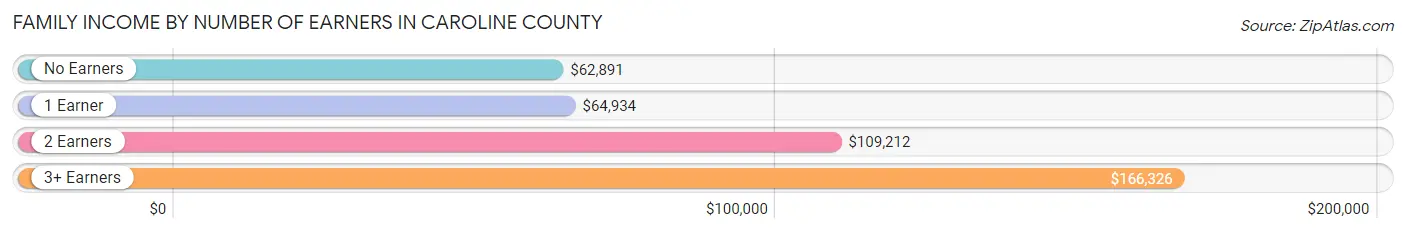
| Number of Earners | # Families | Median Income |
| No Earners | 1,187 (14.8%) | $62,891 |
| 1 Earner | 2,182 (27.2%) | $64,934 |
| 2 Earners | 3,756 (46.7%) | $109,212 |
| 3+ Earners | 913 (11.4%) | $166,326 |
| Total | 8,038 (100.0%) | $96,803 |
Household Income in Caroline County
Household Income Brackets in Caroline County
With 2,539 households falling in the category, the $100,000 to $149,999 income range is the most frequent in Caroline County, accounting for 22.3% of all households. In contrast, only 216 households (1.9%) fall into the $10,000 to $14,999 income bracket, making it the least populous group.
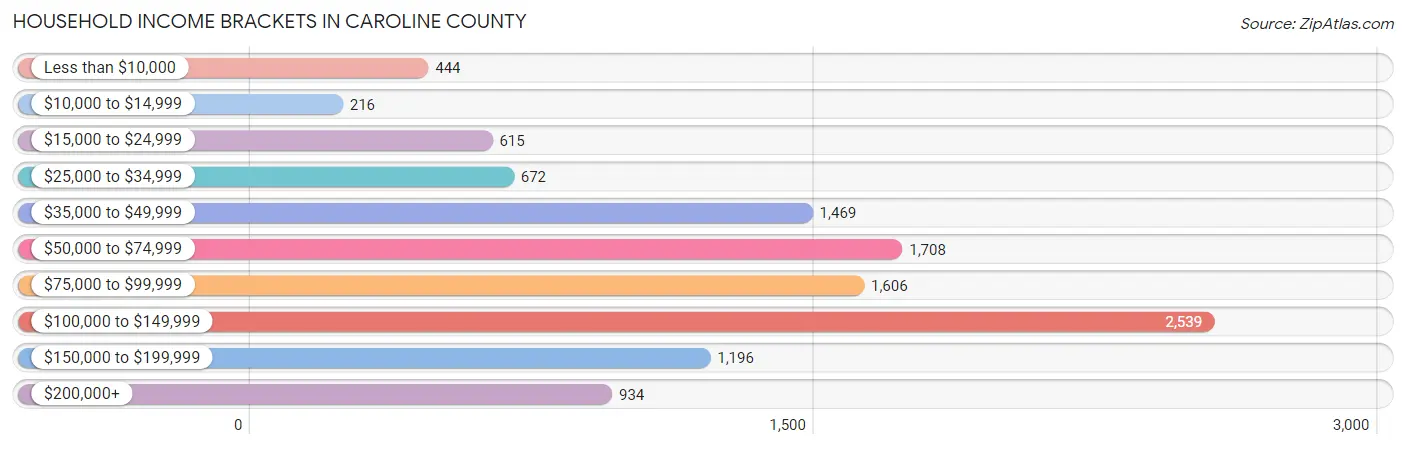
| Income Bracket | # Households | % Households |
| Less than $10,000 | 444 | 3.9% |
| $10,000 to $14,999 | 216 | 1.9% |
| $15,000 to $24,999 | 615 | 5.4% |
| $25,000 to $34,999 | 672 | 5.9% |
| $35,000 to $49,999 | 1,469 | 12.9% |
| $50,000 to $74,999 | 1,708 | 15.0% |
| $75,000 to $99,999 | 1,606 | 14.1% |
| $100,000 to $149,999 | 2,539 | 22.3% |
| $150,000 to $199,999 | 1,196 | 10.5% |
| $200,000+ | 934 | 8.2% |
Household Income by Householder Age in Caroline County
The median household income in Caroline County is $83,562, with the highest median household income of $102,413 found in the 45 to 64 years age bracket for the primary householder. A total of 4,841 households (42.5%) fall into this category. Meanwhile, the 65+ years age bracket for the primary householder has the lowest median household income of $60,128, with 3,045 households (26.7%) in this group.
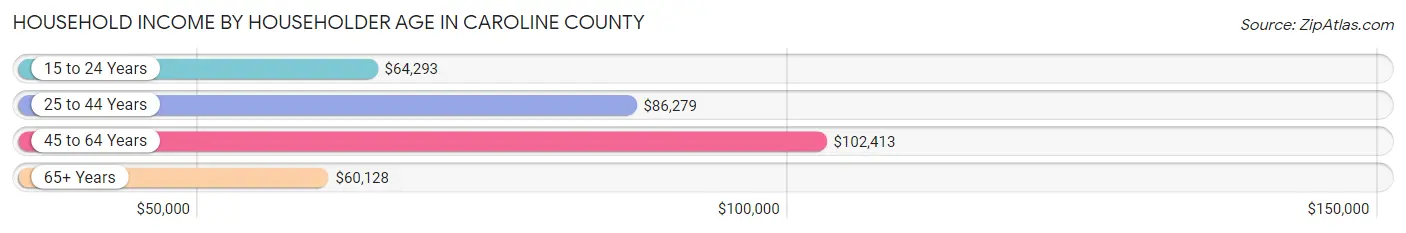
| Income Bracket | # Households | Median Income |
| 15 to 24 Years | 249 (2.2%) | $64,293 |
| 25 to 44 Years | 3,252 (28.6%) | $86,279 |
| 45 to 64 Years | 4,841 (42.5%) | $102,413 |
| 65+ Years | 3,045 (26.7%) | $60,128 |
| Total | 11,387 (100.0%) | $83,562 |
Poverty in Caroline County
Income Below Poverty by Sex and Age in Caroline County
With 10.9% poverty level for males and 12.2% for females among the residents of Caroline County, 15 year old males and under 5 year old females are the most vulnerable to poverty, with 64 males (18.8%) and 293 females (35.0%) in their respective age groups living below the poverty level.
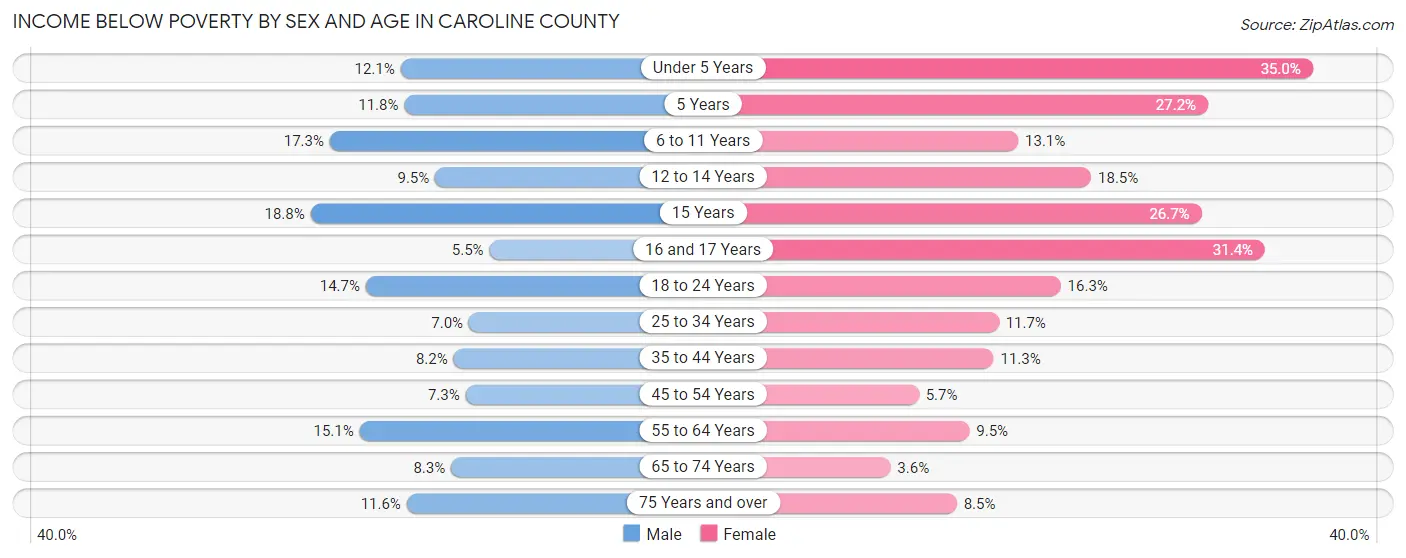
| Age Bracket | Male | Female |
| Under 5 Years | 119 (12.1%) | 293 (35.0%) |
| 5 Years | 15 (11.8%) | 28 (27.2%) |
| 6 to 11 Years | 215 (17.3%) | 160 (13.1%) |
| 12 to 14 Years | 56 (9.5%) | 147 (18.5%) |
| 15 Years | 64 (18.8%) | 55 (26.7%) |
| 16 and 17 Years | 10 (5.5%) | 109 (31.4%) |
| 18 to 24 Years | 114 (14.7%) | 151 (16.3%) |
| 25 to 34 Years | 129 (7.0%) | 244 (11.7%) |
| 35 to 44 Years | 153 (8.2%) | 218 (11.3%) |
| 45 to 54 Years | 139 (7.3%) | 113 (5.7%) |
| 55 to 64 Years | 319 (15.1%) | 216 (9.5%) |
| 65 to 74 Years | 123 (8.3%) | 58 (3.6%) |
| 75 Years and over | 92 (11.6%) | 95 (8.5%) |
| Total | 1,548 (10.9%) | 1,887 (12.2%) |
Income Above Poverty by Sex and Age in Caroline County
According to the poverty statistics in Caroline County, males aged 16 and 17 years and females aged 65 to 74 years are the age groups that are most secure financially, with 94.5% of males and 96.4% of females in these age groups living above the poverty line.

| Age Bracket | Male | Female |
| Under 5 Years | 865 (87.9%) | 545 (65.0%) |
| 5 Years | 112 (88.2%) | 75 (72.8%) |
| 6 to 11 Years | 1,025 (82.7%) | 1,062 (86.9%) |
| 12 to 14 Years | 532 (90.5%) | 647 (81.5%) |
| 15 Years | 277 (81.2%) | 151 (73.3%) |
| 16 and 17 Years | 172 (94.5%) | 238 (68.6%) |
| 18 to 24 Years | 663 (85.3%) | 778 (83.8%) |
| 25 to 34 Years | 1,712 (93.0%) | 1,851 (88.3%) |
| 35 to 44 Years | 1,725 (91.8%) | 1,717 (88.7%) |
| 45 to 54 Years | 1,776 (92.7%) | 1,866 (94.3%) |
| 55 to 64 Years | 1,789 (84.9%) | 2,066 (90.5%) |
| 65 to 74 Years | 1,352 (91.7%) | 1,548 (96.4%) |
| 75 Years and over | 699 (88.4%) | 1,019 (91.5%) |
| Total | 12,699 (89.1%) | 13,563 (87.8%) |
Income Below Poverty Among Married-Couple Families in Caroline County
The poverty statistics for married-couple families in Caroline County show that 2.9% or 172 of the total 5,860 families live below the poverty line. Families with 3 or 4 children have the highest poverty rate of 6.7%, comprising of 24 families. On the other hand, families with 5 or more children have the lowest poverty rate of 0.0%, which includes 0 families.

| Children | Above Poverty | Below Poverty |
| No Children | 3,416 (98.4%) | 56 (1.6%) |
| 1 or 2 Children | 1,908 (95.4%) | 92 (4.6%) |
| 3 or 4 Children | 336 (93.3%) | 24 (6.7%) |
| 5 or more Children | 28 (100.0%) | 0 (0.0%) |
| Total | 5,688 (97.1%) | 172 (2.9%) |
Income Below Poverty Among Single-Parent Households in Caroline County
According to the poverty data in Caroline County, 7.2% or 38 single-father households and 21.8% or 360 single-mother households are living below the poverty line. Among single-father households, those with no children have the highest poverty rate, with 32 households (9.5%) experiencing poverty. Likewise, among single-mother households, those with 5 or more children have the highest poverty rate, with 13 households (100.0%) falling below the poverty line.
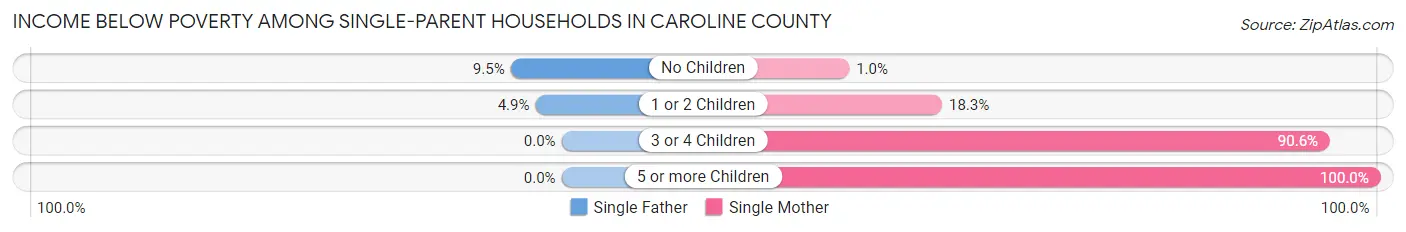
| Children | Single Father | Single Mother |
| No Children | 32 (9.5%) | 5 (1.0%) |
| 1 or 2 Children | 6 (4.9%) | 179 (18.3%) |
| 3 or 4 Children | 0 (0.0%) | 163 (90.6%) |
| 5 or more Children | 0 (0.0%) | 13 (100.0%) |
| Total | 38 (7.2%) | 360 (21.8%) |
Income Below Poverty Among Married-Couple vs Single-Parent Households in Caroline County
The poverty data for Caroline County shows that 172 of the married-couple family households (2.9%) and 398 of the single-parent households (18.3%) are living below the poverty level. Within the married-couple family households, those with 3 or 4 children have the highest poverty rate, with 24 households (6.7%) falling below the poverty line. Among the single-parent households, those with 5 or more children have the highest poverty rate, with 13 household (100.0%) living below poverty.
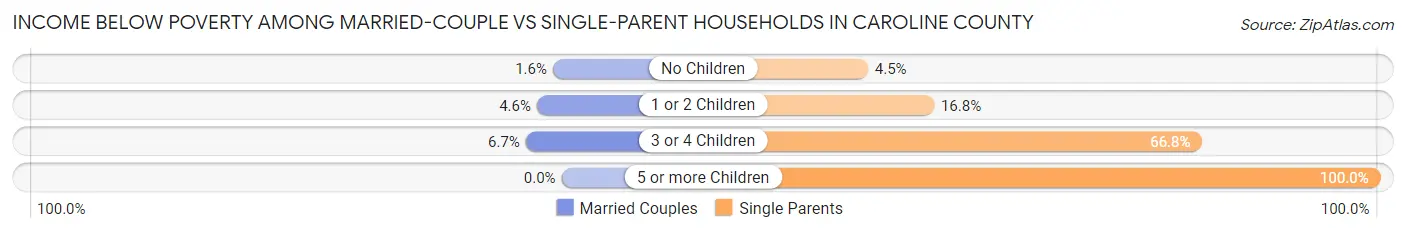
| Children | Married-Couple Families | Single-Parent Households |
| No Children | 56 (1.6%) | 37 (4.5%) |
| 1 or 2 Children | 92 (4.6%) | 185 (16.8%) |
| 3 or 4 Children | 24 (6.7%) | 163 (66.8%) |
| 5 or more Children | 0 (0.0%) | 13 (100.0%) |
| Total | 172 (2.9%) | 398 (18.3%) |
Employment Characteristics in Caroline County
Employment by Class of Employer in Caroline County
Among the 15,767 employed individuals in Caroline County, private company employees (9,457 | 60.0%), federal government employees (2,351 | 14.9%), and local government employees (1,452 | 9.2%) make up the most common classes of employment.
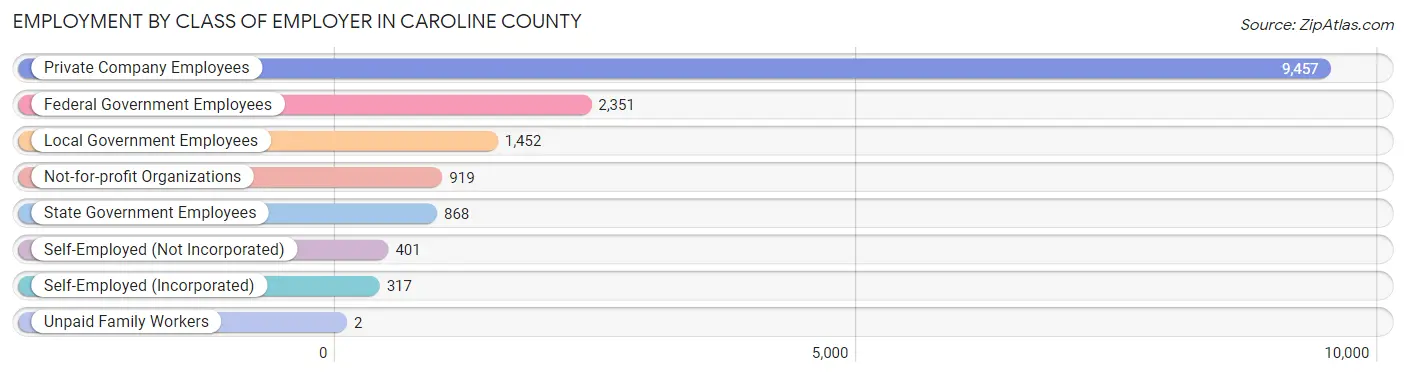
| Employer Class | # Employees | % Employees |
| Private Company Employees | 9,457 | 60.0% |
| Self-Employed (Incorporated) | 317 | 2.0% |
| Self-Employed (Not Incorporated) | 401 | 2.5% |
| Not-for-profit Organizations | 919 | 5.8% |
| Local Government Employees | 1,452 | 9.2% |
| State Government Employees | 868 | 5.5% |
| Federal Government Employees | 2,351 | 14.9% |
| Unpaid Family Workers | 2 | 0.0% |
| Total | 15,767 | 100.0% |
Employment Status by Age in Caroline County
According to the labor force statistics for Caroline County, out of the total population over 16 years of age (24,641), 68.4% or 16,854 individuals are in the labor force, with 4.6% or 775 of them unemployed. The age group with the highest labor force participation rate is 20 to 24 years, with 95.1% or 1,918 individuals in the labor force. Within the labor force, the 16 to 19 years age range has the highest percentage of unemployed individuals, with 24.1% or 116 of them being unemployed.
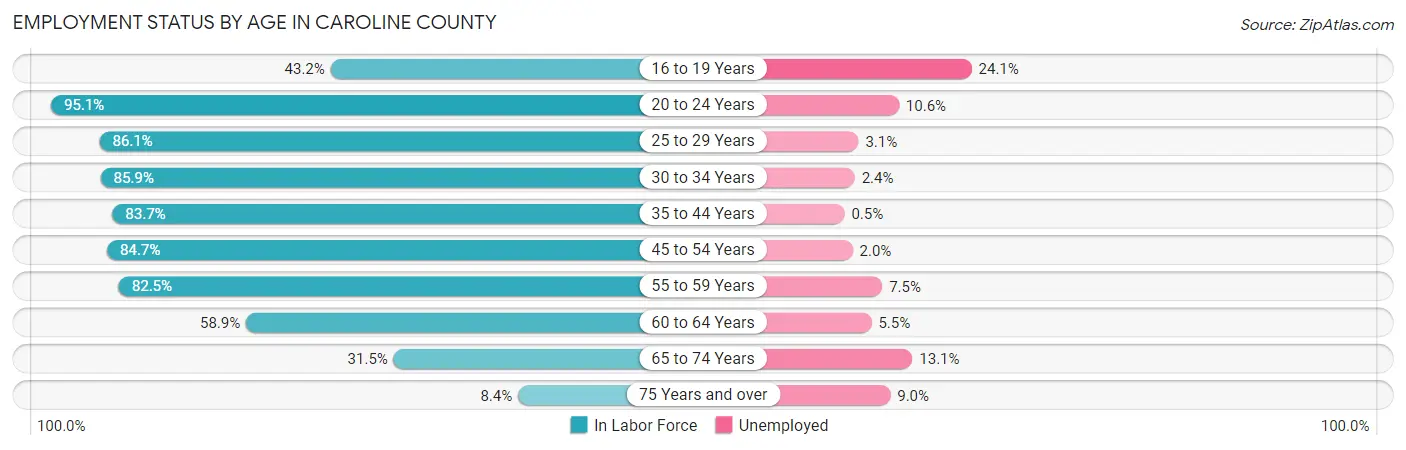
| Age Bracket | In Labor Force | Unemployed |
| 16 to 19 Years | 481 (43.2%) | 116 (24.1%) |
| 20 to 24 Years | 1,918 (95.1%) | 203 (10.6%) |
| 25 to 29 Years | 1,676 (86.1%) | 52 (3.1%) |
| 30 to 34 Years | 1,835 (85.9%) | 44 (2.4%) |
| 35 to 44 Years | 3,278 (83.7%) | 16 (0.5%) |
| 45 to 54 Years | 3,388 (84.7%) | 68 (2.0%) |
| 55 to 59 Years | 1,847 (82.5%) | 139 (7.5%) |
| 60 to 64 Years | 1,272 (58.9%) | 70 (5.5%) |
| 65 to 74 Years | 984 (31.5%) | 129 (13.1%) |
| 75 Years and over | 167 (8.4%) | 15 (9.0%) |
| Total | 16,854 (68.4%) | 775 (4.6%) |
Employment Status by Educational Attainment in Caroline County
According to labor force statistics for Caroline County, 81.1% of individuals (13,298) out of the total population between 25 and 64 years of age (16,397) are in the labor force, with 2.9% or 386 of them being unemployed. The group with the highest labor force participation rate are those with the educational attainment of bachelor's degree or higher, with 89.8% or 3,563 individuals in the labor force. Within the labor force, individuals with high school diploma education have the highest percentage of unemployment, with 5.3% or 278 of them being unemployed.

| Educational Attainment | In Labor Force | Unemployed |
| Less than High School | 767 (58.9%) | 0 (0.0%) |
| High School Diploma | 5,254 (81.3%) | 342 (5.3%) |
| College / Associate Degree | 3,713 (79.6%) | 89 (1.9%) |
| Bachelor's Degree or higher | 3,563 (89.8%) | 44 (1.1%) |
| Total | 13,298 (81.1%) | 476 (2.9%) |
Employment Occupations by Sex in Caroline County
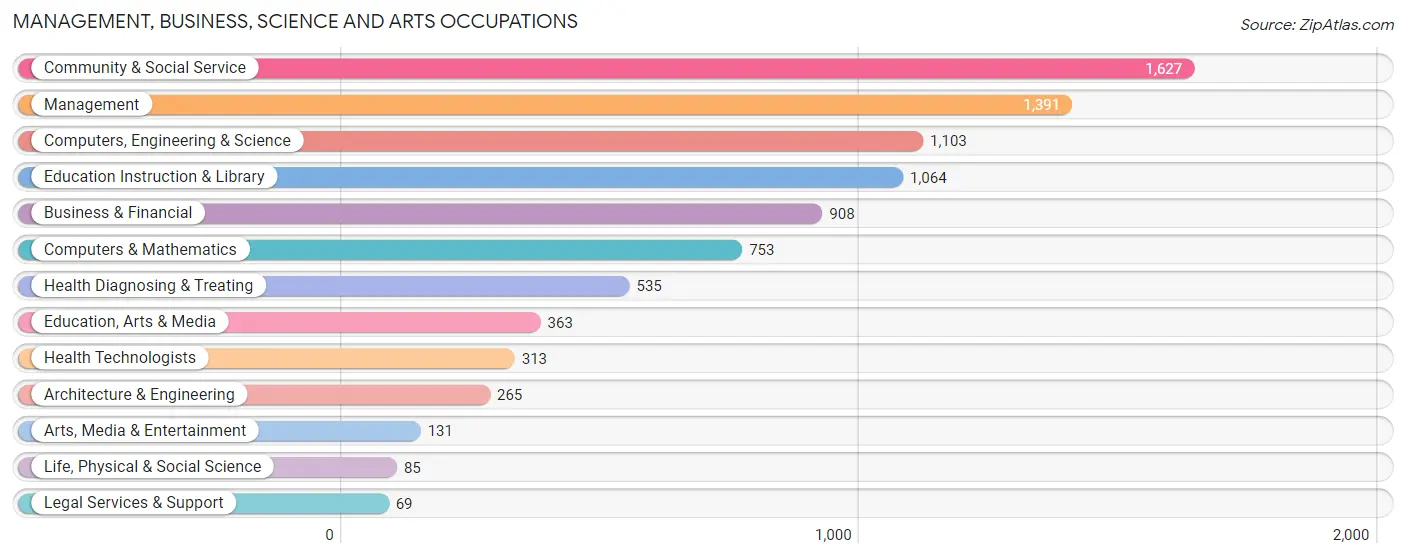
Management, Business, Science and Arts Occupations
The most common Management, Business, Science and Arts occupations in Caroline County are Community & Social Service (1,627 | 10.7%), Management (1,391 | 9.2%), Computers, Engineering & Science (1,103 | 7.3%), Education Instruction & Library (1,064 | 7.0%), and Business & Financial (908 | 6.0%).
Management, Business, Science and Arts Occupations by Sex
Within the Management, Business, Science and Arts occupations in Caroline County, the most male-oriented occupations are Architecture & Engineering (97.0%), Computers, Engineering & Science (88.4%), and Computers & Mathematics (85.9%), while the most female-oriented occupations are Health Diagnosing & Treating (89.3%), Health Technologists (88.2%), and Legal Services & Support (76.8%).

| Occupation | Male | Female |
| Management | 713 (51.3%) | 678 (48.7%) |
| Business & Financial | 274 (30.2%) | 634 (69.8%) |
| Computers, Engineering & Science | 975 (88.4%) | 128 (11.6%) |
| Computers & Mathematics | 647 (85.9%) | 106 (14.1%) |
| Architecture & Engineering | 257 (97.0%) | 8 (3.0%) |
| Life, Physical & Social Science | 71 (83.5%) | 14 (16.5%) |
| Community & Social Service | 498 (30.6%) | 1,129 (69.4%) |
| Education, Arts & Media | 103 (28.4%) | 260 (71.6%) |
| Legal Services & Support | 16 (23.2%) | 53 (76.8%) |
| Education Instruction & Library | 290 (27.3%) | 774 (72.7%) |
| Arts, Media & Entertainment | 89 (67.9%) | 42 (32.1%) |
| Health Diagnosing & Treating | 57 (10.6%) | 478 (89.3%) |
| Health Technologists | 37 (11.8%) | 276 (88.2%) |
| Total (Category) | 2,517 (45.2%) | 3,047 (54.8%) |
| Total (Overall) | 7,584 (50.0%) | 7,587 (50.0%) |
Services Occupations
The most common Services occupations in Caroline County are Food Preparation & Serving (741 | 4.9%), Cleaning & Maintenance (431 | 2.8%), Security & Protection (377 | 2.5%), Personal Care & Service (336 | 2.2%), and Healthcare Support (283 | 1.9%).

Services Occupations by Sex
Within the Services occupations in Caroline County, the most male-oriented occupations are Law Enforcement (74.1%), Cleaning & Maintenance (66.4%), and Security & Protection (54.9%), while the most female-oriented occupations are Personal Care & Service (95.2%), Healthcare Support (71.0%), and Food Preparation & Serving (70.7%).
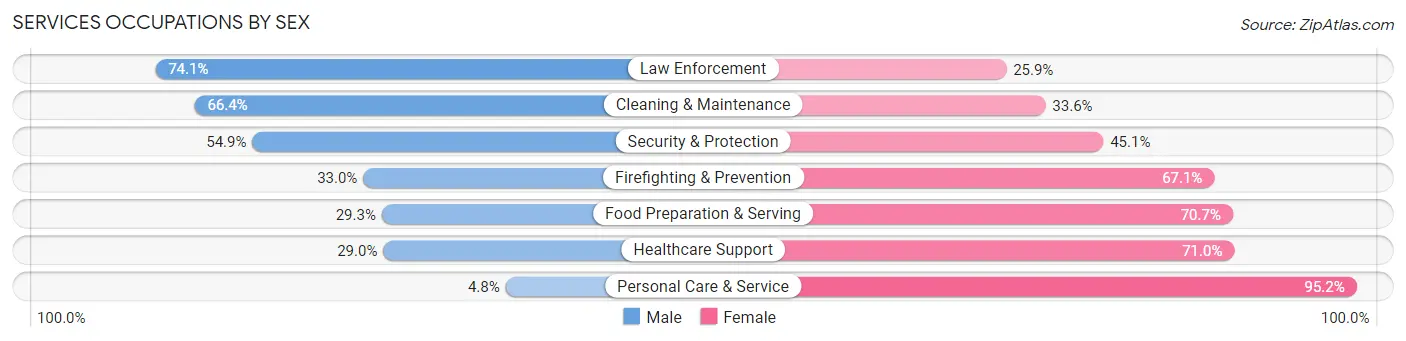
| Occupation | Male | Female |
| Healthcare Support | 82 (29.0%) | 201 (71.0%) |
| Security & Protection | 207 (54.9%) | 170 (45.1%) |
| Firefighting & Prevention | 58 (33.0%) | 118 (67.0%) |
| Law Enforcement | 149 (74.1%) | 52 (25.9%) |
| Food Preparation & Serving | 217 (29.3%) | 524 (70.7%) |
| Cleaning & Maintenance | 286 (66.4%) | 145 (33.6%) |
| Personal Care & Service | 16 (4.8%) | 320 (95.2%) |
| Total (Category) | 808 (37.3%) | 1,360 (62.7%) |
| Total (Overall) | 7,584 (50.0%) | 7,587 (50.0%) |
Sales and Office Occupations
The most common Sales and Office occupations in Caroline County are Office & Administration (2,078 | 13.7%), and Sales & Related (1,376 | 9.1%).

Sales and Office Occupations by Sex

| Occupation | Male | Female |
| Sales & Related | 404 (29.4%) | 972 (70.6%) |
| Office & Administration | 301 (14.5%) | 1,777 (85.5%) |
| Total (Category) | 705 (20.4%) | 2,749 (79.6%) |
| Total (Overall) | 7,584 (50.0%) | 7,587 (50.0%) |
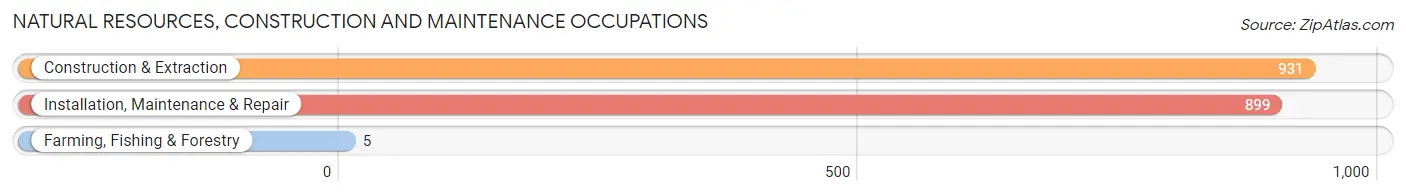
Natural Resources, Construction and Maintenance Occupations
The most common Natural Resources, Construction and Maintenance occupations in Caroline County are Construction & Extraction (931 | 6.1%), Installation, Maintenance & Repair (899 | 5.9%), and Farming, Fishing & Forestry (5 | 0.0%).
Natural Resources, Construction and Maintenance Occupations by Sex
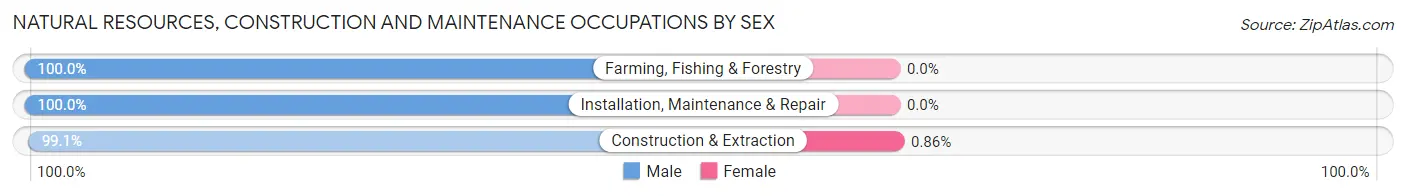
| Occupation | Male | Female |
| Farming, Fishing & Forestry | 5 (100.0%) | 0 (0.0%) |
| Construction & Extraction | 923 (99.1%) | 8 (0.9%) |
| Installation, Maintenance & Repair | 899 (100.0%) | 0 (0.0%) |
| Total (Category) | 1,827 (99.6%) | 8 (0.4%) |
| Total (Overall) | 7,584 (50.0%) | 7,587 (50.0%) |
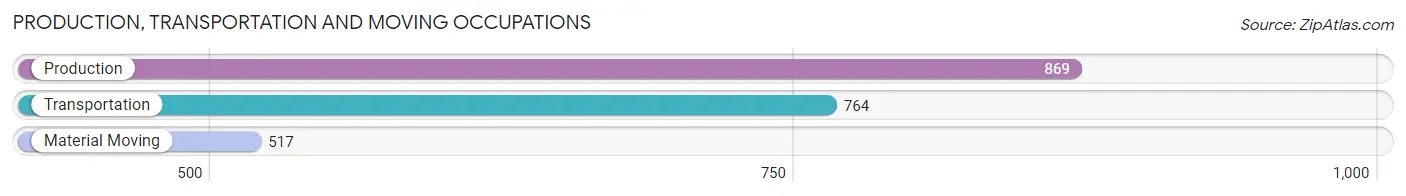
Production, Transportation and Moving Occupations
The most common Production, Transportation and Moving occupations in Caroline County are Production (869 | 5.7%), Transportation (764 | 5.0%), and Material Moving (517 | 3.4%).
Production, Transportation and Moving Occupations by Sex
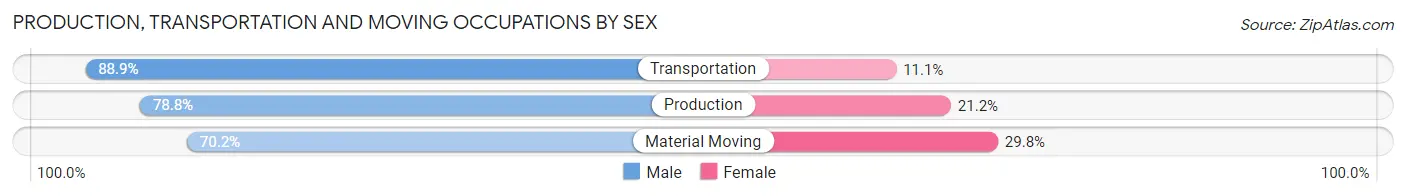
| Occupation | Male | Female |
| Production | 685 (78.8%) | 184 (21.2%) |
| Transportation | 679 (88.9%) | 85 (11.1%) |
| Material Moving | 363 (70.2%) | 154 (29.8%) |
| Total (Category) | 1,727 (80.3%) | 423 (19.7%) |
| Total (Overall) | 7,584 (50.0%) | 7,587 (50.0%) |
Employment Industries by Sex in Caroline County
Employment Industries in Caroline County
The major employment industries in Caroline County include Retail Trade (2,046 | 13.5%), Educational Services (1,597 | 10.5%), Health Care & Social Assistance (1,569 | 10.3%), Public Administration (1,468 | 9.7%), and Construction (1,116 | 7.4%).

Employment Industries by Sex in Caroline County
The Caroline County industries that see more men than women are Agriculture, Fishing & Hunting (100.0%), Mining, Quarrying, & Extraction (100.0%), and Utilities (97.0%), whereas the industries that tend to have a higher number of women are Enterprise Management (100.0%), Finance & Insurance (84.9%), and Health Care & Social Assistance (79.1%).

| Industry | Male | Female |
| Agriculture, Fishing & Hunting | 76 (100.0%) | 0 (0.0%) |
| Mining, Quarrying, & Extraction | 120 (100.0%) | 0 (0.0%) |
| Construction | 1,023 (91.7%) | 93 (8.3%) |
| Manufacturing | 493 (73.7%) | 176 (26.3%) |
| Wholesale Trade | 406 (82.0%) | 89 (18.0%) |
| Retail Trade | 900 (44.0%) | 1,146 (56.0%) |
| Transportation & Warehousing | 464 (66.5%) | 234 (33.5%) |
| Utilities | 491 (97.0%) | 15 (3.0%) |
| Information | 42 (59.2%) | 29 (40.8%) |
| Finance & Insurance | 138 (15.1%) | 776 (84.9%) |
| Real Estate, Rental & Leasing | 139 (68.5%) | 64 (31.5%) |
| Professional & Scientific | 588 (53.9%) | 502 (46.1%) |
| Enterprise Management | 0 (0.0%) | 4 (100.0%) |
| Administrative & Support | 272 (37.2%) | 459 (62.8%) |
| Educational Services | 455 (28.5%) | 1,142 (71.5%) |
| Health Care & Social Assistance | 328 (20.9%) | 1,241 (79.1%) |
| Arts, Entertainment & Recreation | 41 (27.0%) | 111 (73.0%) |
| Accommodation & Food Services | 359 (35.3%) | 657 (64.7%) |
| Public Administration | 945 (64.4%) | 523 (35.6%) |
| Total | 7,584 (50.0%) | 7,587 (50.0%) |
Education in Caroline County
School Enrollment in Caroline County
The most common levels of schooling among the 6,527 students in Caroline County are middle school (1,994 | 30.5%), elementary school (1,643 | 25.2%), and high school (1,401 | 21.5%).

| School Level | # Students | % Students |
| Nursery / Preschool | 221 | 3.4% |
| Kindergarten | 296 | 4.5% |
| Elementary School | 1,643 | 25.2% |
| Middle School | 1,994 | 30.5% |
| High School | 1,401 | 21.5% |
| College / Undergraduate | 643 | 9.9% |
| Graduate / Professional | 329 | 5.0% |
| Total | 6,527 | 100.0% |
School Enrollment by Age by Funding Source in Caroline County
Out of a total of 6,527 students who are enrolled in schools in Caroline County, 881 (13.5%) attend a private institution, while the remaining 5,646 (86.5%) are enrolled in public schools. The age group of 3 to 4 year olds has the highest likelihood of being enrolled in private schools, with 65 (42.8% in the age bracket) enrolled. Conversely, the age group of 18 to 19 year olds has the lowest likelihood of being enrolled in a private school, with 327 (96.8% in the age bracket) attending a public institution.

| Age Bracket | Public School | Private School |
| 3 to 4 Year Olds | 87 (57.2%) | 65 (42.8%) |
| 5 to 9 Year Old | 1,527 (85.6%) | 258 (14.4%) |
| 10 to 14 Year Olds | 2,079 (93.3%) | 150 (6.7%) |
| 15 to 17 Year Olds | 939 (89.5%) | 110 (10.5%) |
| 18 to 19 Year Olds | 327 (96.8%) | 11 (3.3%) |
| 20 to 24 Year Olds | 201 (72.0%) | 78 (28.0%) |
| 25 to 34 Year Olds | 177 (64.8%) | 96 (35.2%) |
| 35 Years and over | 311 (73.7%) | 111 (26.3%) |
| Total | 5,646 (86.5%) | 881 (13.5%) |
Educational Attainment by Field of Study in Caroline County
Education (1,073 | 21.0%), business (991 | 19.4%), arts & humanities (482 | 9.4%), social sciences (371 | 7.3%), and liberal arts & history (349 | 6.8%) are the most common fields of study among 5,105 individuals in Caroline County who have obtained a bachelor's degree or higher.

| Field of Study | # Graduates | % Graduates |
| Computers & Mathematics | 315 | 6.2% |
| Bio, Nature & Agricultural | 239 | 4.7% |
| Physical & Health Sciences | 191 | 3.7% |
| Psychology | 258 | 5.1% |
| Social Sciences | 371 | 7.3% |
| Engineering | 207 | 4.1% |
| Multidisciplinary Studies | 19 | 0.4% |
| Science & Technology | 312 | 6.1% |
| Business | 991 | 19.4% |
| Education | 1,073 | 21.0% |
| Literature & Languages | 127 | 2.5% |
| Liberal Arts & History | 349 | 6.8% |
| Visual & Performing Arts | 96 | 1.9% |
| Communications | 75 | 1.5% |
| Arts & Humanities | 482 | 9.4% |
| Total | 5,105 | 100.0% |
Transportation & Commute in Caroline County
Vehicle Availability by Sex in Caroline County
The most prevalent vehicle ownership categories in Caroline County are males with 3 vehicles (2,641, accounting for 35.4%) and females with 3 vehicles (2,275, making up 36.4%).
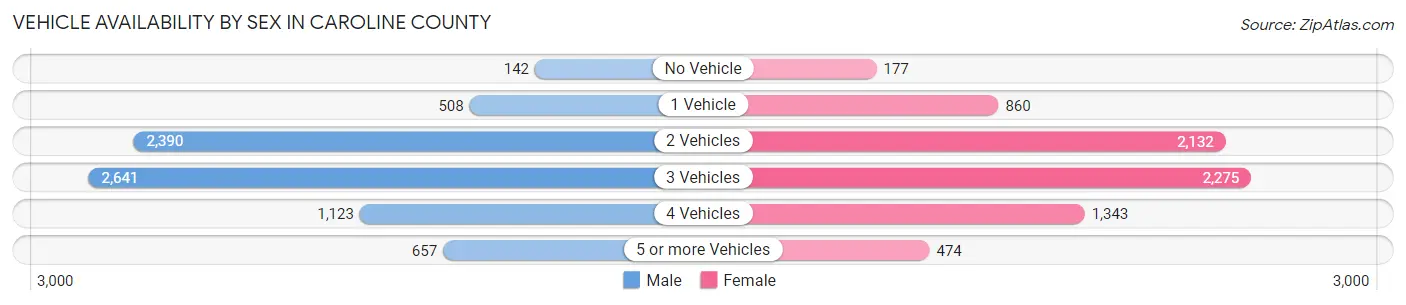
| Vehicles Available | Male | Female |
| No Vehicle | 142 (1.9%) | 177 (2.4%) |
| 1 Vehicle | 508 (6.8%) | 860 (11.8%) |
| 2 Vehicles | 2,390 (32.0%) | 2,132 (29.4%) |
| 3 Vehicles | 2,641 (35.4%) | 2,275 (31.3%) |
| 4 Vehicles | 1,123 (15.0%) | 1,343 (18.5%) |
| 5 or more Vehicles | 657 (8.8%) | 474 (6.5%) |
| Total | 7,461 (100.0%) | 7,261 (100.0%) |
Commute Time in Caroline County
The most frequently occuring commute durations in Caroline County are 30 to 34 minutes (2,473 commuters, 17.0%), 45 to 59 minutes (2,083 commuters, 14.3%), and 5 to 9 minutes (1,518 commuters, 10.4%).
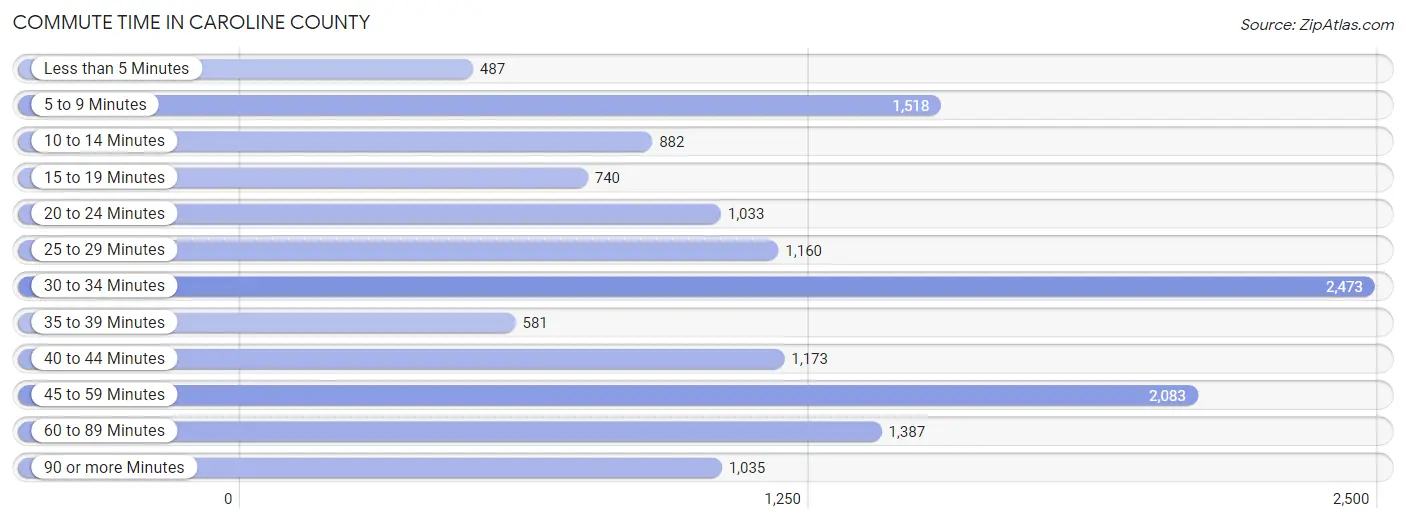
| Commute Time | # Commuters | % Commuters |
| Less than 5 Minutes | 487 | 3.4% |
| 5 to 9 Minutes | 1,518 | 10.4% |
| 10 to 14 Minutes | 882 | 6.1% |
| 15 to 19 Minutes | 740 | 5.1% |
| 20 to 24 Minutes | 1,033 | 7.1% |
| 25 to 29 Minutes | 1,160 | 8.0% |
| 30 to 34 Minutes | 2,473 | 17.0% |
| 35 to 39 Minutes | 581 | 4.0% |
| 40 to 44 Minutes | 1,173 | 8.1% |
| 45 to 59 Minutes | 2,083 | 14.3% |
| 60 to 89 Minutes | 1,387 | 9.5% |
| 90 or more Minutes | 1,035 | 7.1% |
Commute Time by Sex in Caroline County
The most common commute times in Caroline County are 30 to 34 minutes (1,185 commuters, 15.5%) for males and 45 to 59 minutes (1,337 commuters, 19.4%) for females.
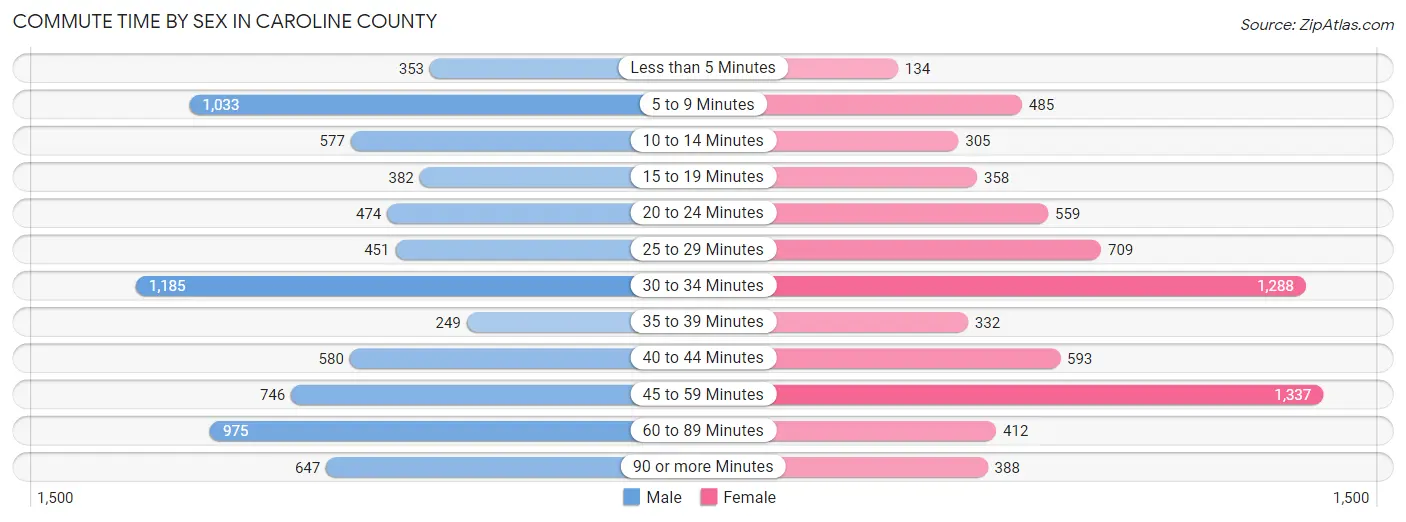
| Commute Time | Male | Female |
| Less than 5 Minutes | 353 (4.6%) | 134 (1.9%) |
| 5 to 9 Minutes | 1,033 (13.5%) | 485 (7.0%) |
| 10 to 14 Minutes | 577 (7.5%) | 305 (4.4%) |
| 15 to 19 Minutes | 382 (5.0%) | 358 (5.2%) |
| 20 to 24 Minutes | 474 (6.2%) | 559 (8.1%) |
| 25 to 29 Minutes | 451 (5.9%) | 709 (10.3%) |
| 30 to 34 Minutes | 1,185 (15.5%) | 1,288 (18.7%) |
| 35 to 39 Minutes | 249 (3.3%) | 332 (4.8%) |
| 40 to 44 Minutes | 580 (7.6%) | 593 (8.6%) |
| 45 to 59 Minutes | 746 (9.8%) | 1,337 (19.4%) |
| 60 to 89 Minutes | 975 (12.7%) | 412 (6.0%) |
| 90 or more Minutes | 647 (8.5%) | 388 (5.6%) |
Time of Departure to Work by Sex in Caroline County
The most frequent times of departure to work in Caroline County are 6:00 AM to 6:29 AM (1,312, 17.2%) for males and 7:00 AM to 7:29 AM (1,259, 18.2%) for females.
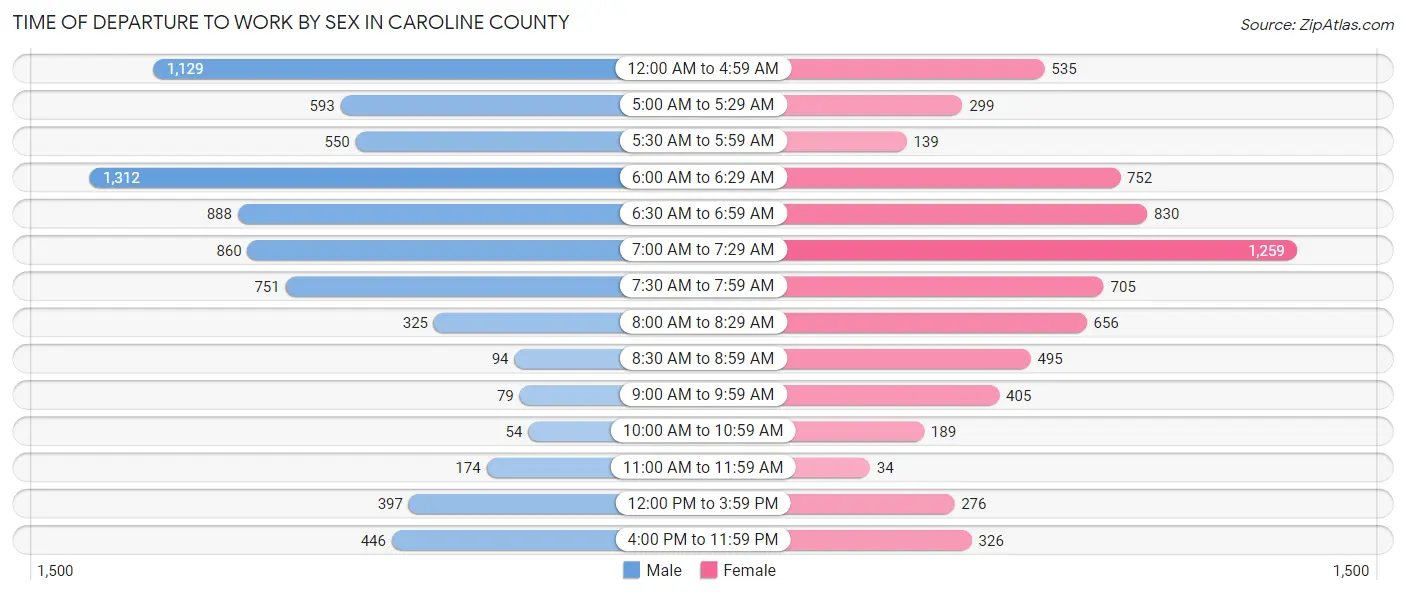
| Time of Departure | Male | Female |
| 12:00 AM to 4:59 AM | 1,129 (14.7%) | 535 (7.7%) |
| 5:00 AM to 5:29 AM | 593 (7.7%) | 299 (4.3%) |
| 5:30 AM to 5:59 AM | 550 (7.2%) | 139 (2.0%) |
| 6:00 AM to 6:29 AM | 1,312 (17.2%) | 752 (10.9%) |
| 6:30 AM to 6:59 AM | 888 (11.6%) | 830 (12.0%) |
| 7:00 AM to 7:29 AM | 860 (11.2%) | 1,259 (18.2%) |
| 7:30 AM to 7:59 AM | 751 (9.8%) | 705 (10.2%) |
| 8:00 AM to 8:29 AM | 325 (4.3%) | 656 (9.5%) |
| 8:30 AM to 8:59 AM | 94 (1.2%) | 495 (7.2%) |
| 9:00 AM to 9:59 AM | 79 (1.0%) | 405 (5.9%) |
| 10:00 AM to 10:59 AM | 54 (0.7%) | 189 (2.7%) |
| 11:00 AM to 11:59 AM | 174 (2.3%) | 34 (0.5%) |
| 12:00 PM to 3:59 PM | 397 (5.2%) | 276 (4.0%) |
| 4:00 PM to 11:59 PM | 446 (5.8%) | 326 (4.7%) |
| Total | 7,652 (100.0%) | 6,900 (100.0%) |
Housing Occupancy in Caroline County
Occupancy by Ownership in Caroline County
Of the total 11,387 dwellings in Caroline County, owner-occupied units account for 9,303 (81.7%), while renter-occupied units make up 2,084 (18.3%).
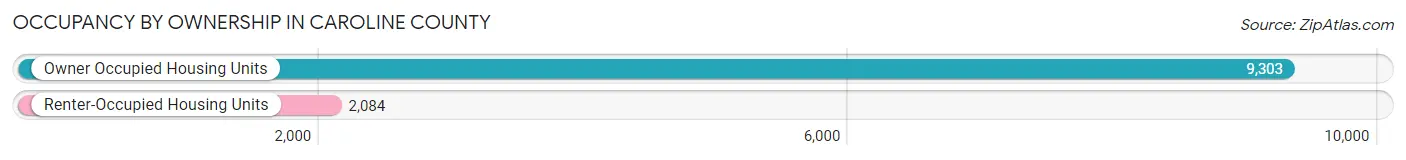
| Occupancy | # Housing Units | % Housing Units |
| Owner Occupied Housing Units | 9,303 | 81.7% |
| Renter-Occupied Housing Units | 2,084 | 18.3% |
| Total Occupied Housing Units | 11,387 | 100.0% |
Occupancy by Household Size in Caroline County
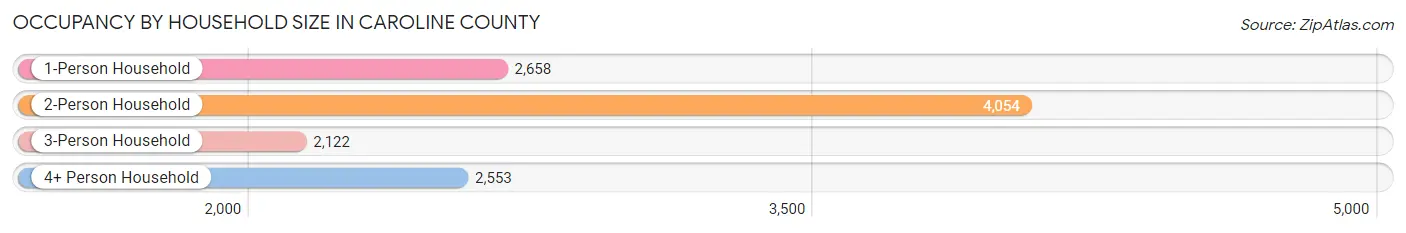
| Household Size | # Housing Units | % Housing Units |
| 1-Person Household | 2,658 | 23.3% |
| 2-Person Household | 4,054 | 35.6% |
| 3-Person Household | 2,122 | 18.6% |
| 4+ Person Household | 2,553 | 22.4% |
| Total Housing Units | 11,387 | 100.0% |
Occupancy by Ownership by Household Size in Caroline County
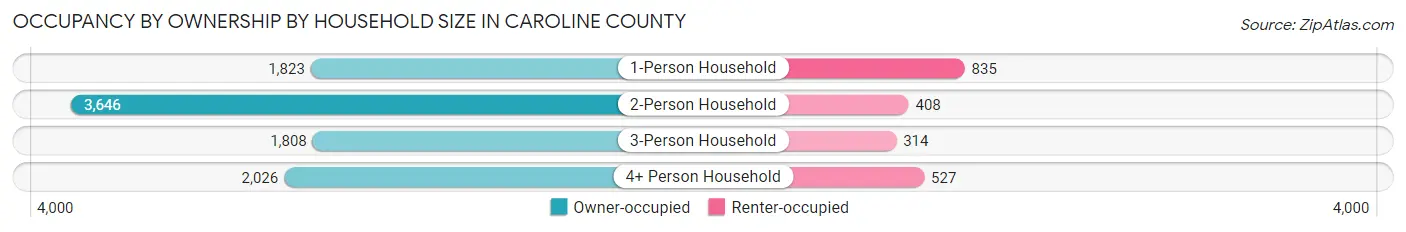
| Household Size | Owner-occupied | Renter-occupied |
| 1-Person Household | 1,823 (68.6%) | 835 (31.4%) |
| 2-Person Household | 3,646 (89.9%) | 408 (10.1%) |
| 3-Person Household | 1,808 (85.2%) | 314 (14.8%) |
| 4+ Person Household | 2,026 (79.4%) | 527 (20.6%) |
| Total Housing Units | 9,303 (81.7%) | 2,084 (18.3%) |
Occupancy by Educational Attainment in Caroline County
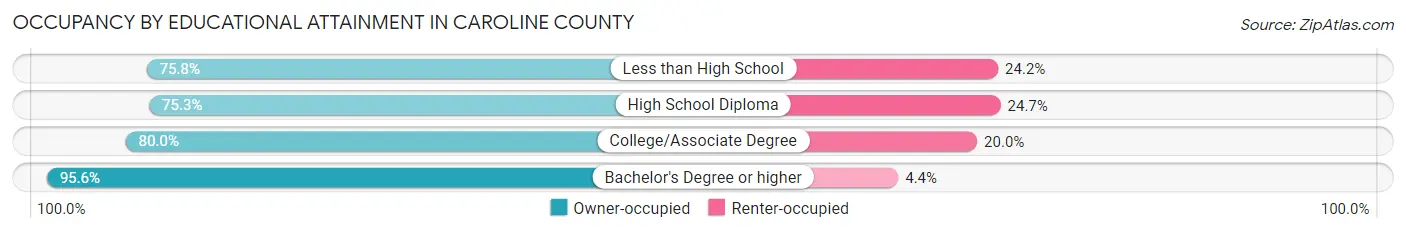
| Household Size | Owner-occupied | Renter-occupied |
| Less than High School | 893 (75.8%) | 285 (24.2%) |
| High School Diploma | 3,072 (75.3%) | 1,006 (24.7%) |
| College/Associate Degree | 2,681 (80.0%) | 671 (20.0%) |
| Bachelor's Degree or higher | 2,657 (95.6%) | 122 (4.4%) |
Occupancy by Age of Householder in Caroline County

| Age Bracket | # Households | % Households |
| Under 35 Years | 1,635 | 14.4% |
| 35 to 44 Years | 1,866 | 16.4% |
| 45 to 54 Years | 2,126 | 18.7% |
| 55 to 64 Years | 2,715 | 23.8% |
| 65 to 74 Years | 1,884 | 16.6% |
| 75 to 84 Years | 885 | 7.8% |
| 85 Years and Over | 276 | 2.4% |
| Total | 11,387 | 100.0% |
Housing Finances in Caroline County
Median Income by Occupancy in Caroline County
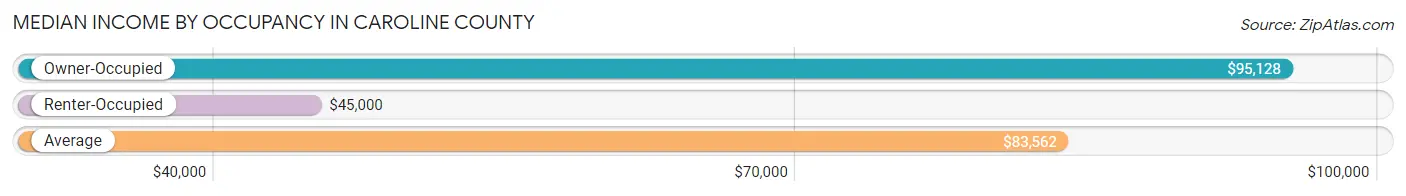
| Occupancy Type | # Households | Median Income |
| Owner-Occupied | 9,303 (81.7%) | $95,128 |
| Renter-Occupied | 2,084 (18.3%) | $45,000 |
| Average | 11,387 (100.0%) | $83,562 |
Occupancy by Householder Income Bracket in Caroline County
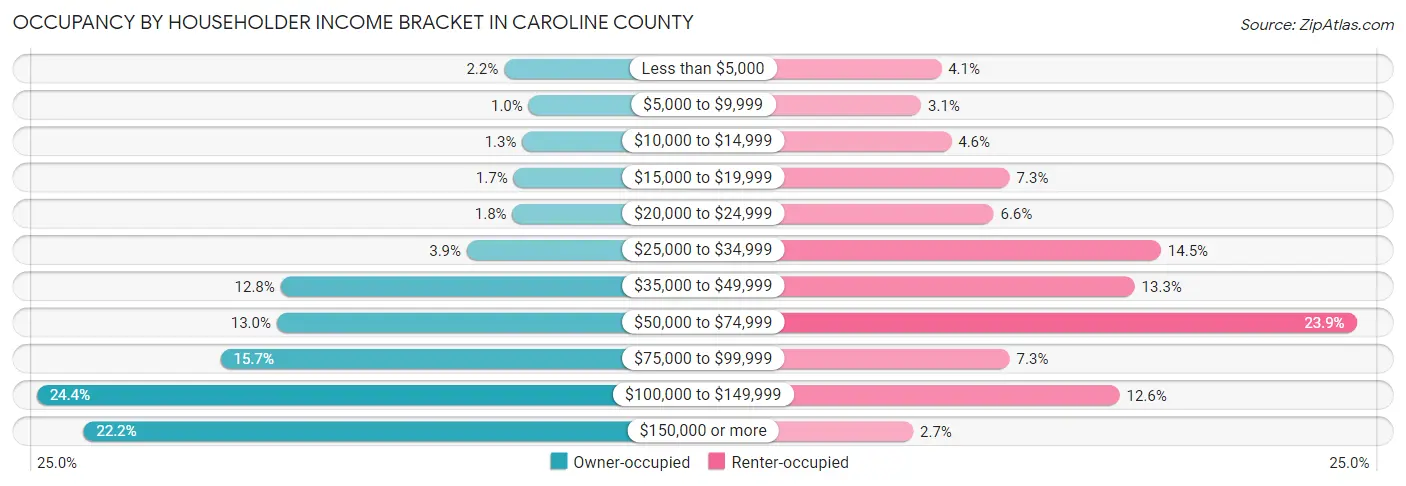
| Income Bracket | Owner-occupied | Renter-occupied |
| Less than $5,000 | 202 (2.2%) | 85 (4.1%) |
| $5,000 to $9,999 | 93 (1.0%) | 65 (3.1%) |
| $10,000 to $14,999 | 121 (1.3%) | 95 (4.6%) |
| $15,000 to $19,999 | 160 (1.7%) | 153 (7.3%) |
| $20,000 to $24,999 | 165 (1.8%) | 137 (6.6%) |
| $25,000 to $34,999 | 367 (3.9%) | 303 (14.5%) |
| $35,000 to $49,999 | 1,192 (12.8%) | 277 (13.3%) |
| $50,000 to $74,999 | 1,208 (13.0%) | 497 (23.8%) |
| $75,000 to $99,999 | 1,458 (15.7%) | 153 (7.3%) |
| $100,000 to $149,999 | 2,272 (24.4%) | 262 (12.6%) |
| $150,000 or more | 2,065 (22.2%) | 57 (2.7%) |
| Total | 9,303 (100.0%) | 2,084 (100.0%) |
Monthly Housing Cost Tiers in Caroline County
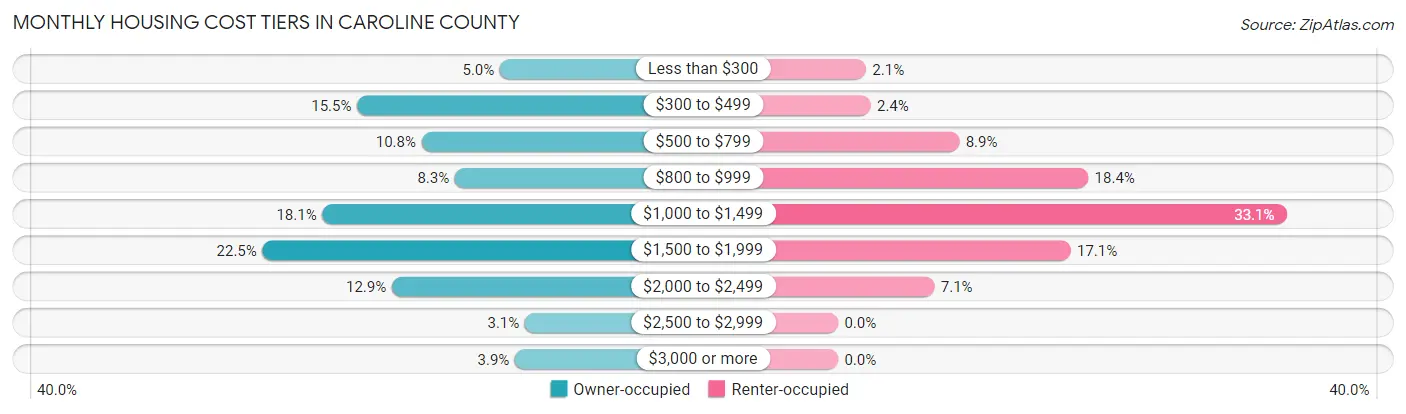
| Monthly Cost | Owner-occupied | Renter-occupied |
| Less than $300 | 463 (5.0%) | 43 (2.1%) |
| $300 to $499 | 1,442 (15.5%) | 50 (2.4%) |
| $500 to $799 | 1,000 (10.7%) | 186 (8.9%) |
| $800 to $999 | 772 (8.3%) | 384 (18.4%) |
| $1,000 to $1,499 | 1,680 (18.1%) | 689 (33.1%) |
| $1,500 to $1,999 | 2,090 (22.5%) | 357 (17.1%) |
| $2,000 to $2,499 | 1,204 (12.9%) | 148 (7.1%) |
| $2,500 to $2,999 | 292 (3.1%) | 0 (0.0%) |
| $3,000 or more | 360 (3.9%) | 0 (0.0%) |
| Total | 9,303 (100.0%) | 2,084 (100.0%) |
Physical Housing Characteristics in Caroline County
Housing Structures in Caroline County
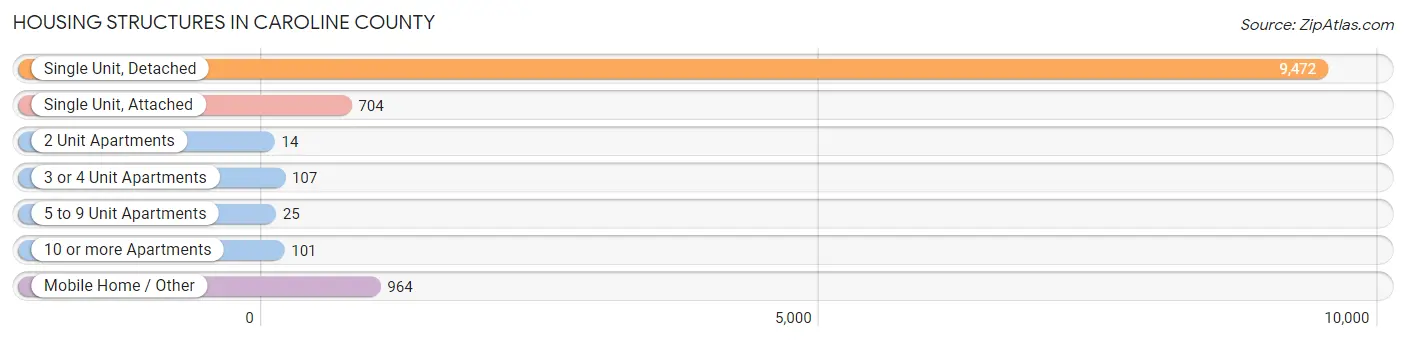
| Structure Type | # Housing Units | % Housing Units |
| Single Unit, Detached | 9,472 | 83.2% |
| Single Unit, Attached | 704 | 6.2% |
| 2 Unit Apartments | 14 | 0.1% |
| 3 or 4 Unit Apartments | 107 | 0.9% |
| 5 to 9 Unit Apartments | 25 | 0.2% |
| 10 or more Apartments | 101 | 0.9% |
| Mobile Home / Other | 964 | 8.5% |
| Total | 11,387 | 100.0% |
Housing Structures by Occupancy in Caroline County
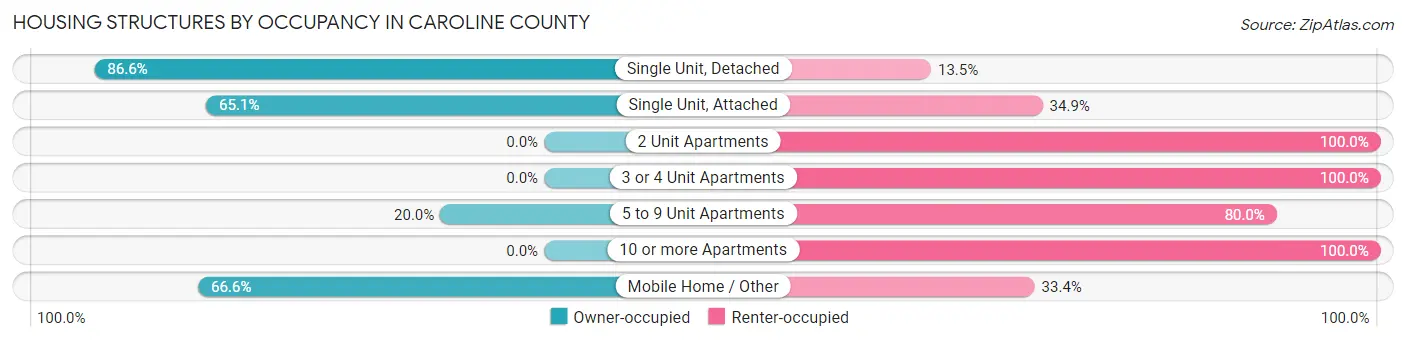
| Structure Type | Owner-occupied | Renter-occupied |
| Single Unit, Detached | 8,198 (86.6%) | 1,274 (13.5%) |
| Single Unit, Attached | 458 (65.1%) | 246 (34.9%) |
| 2 Unit Apartments | 0 (0.0%) | 14 (100.0%) |
| 3 or 4 Unit Apartments | 0 (0.0%) | 107 (100.0%) |
| 5 to 9 Unit Apartments | 5 (20.0%) | 20 (80.0%) |
| 10 or more Apartments | 0 (0.0%) | 101 (100.0%) |
| Mobile Home / Other | 642 (66.6%) | 322 (33.4%) |
| Total | 9,303 (81.7%) | 2,084 (18.3%) |
Housing Structures by Number of Rooms in Caroline County
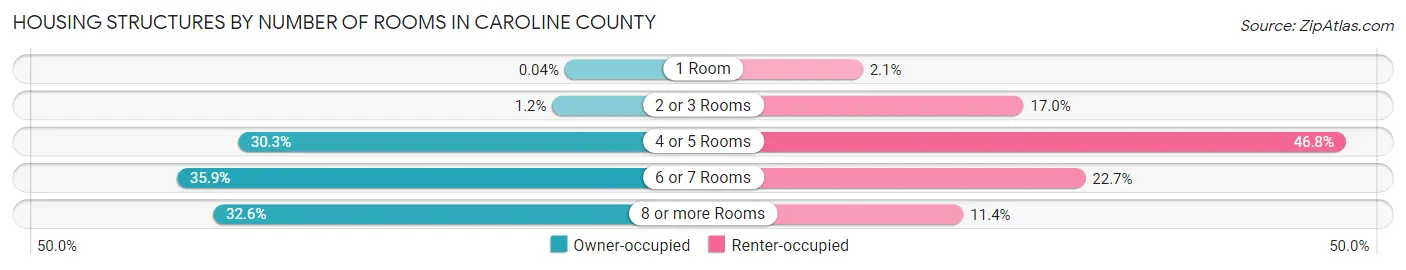
| Number of Rooms | Owner-occupied | Renter-occupied |
| 1 Room | 4 (0.0%) | 44 (2.1%) |
| 2 or 3 Rooms | 111 (1.2%) | 354 (17.0%) |
| 4 or 5 Rooms | 2,817 (30.3%) | 975 (46.8%) |
| 6 or 7 Rooms | 3,341 (35.9%) | 473 (22.7%) |
| 8 or more Rooms | 3,030 (32.6%) | 238 (11.4%) |
| Total | 9,303 (100.0%) | 2,084 (100.0%) |
Housing Structure by Heating Type in Caroline County
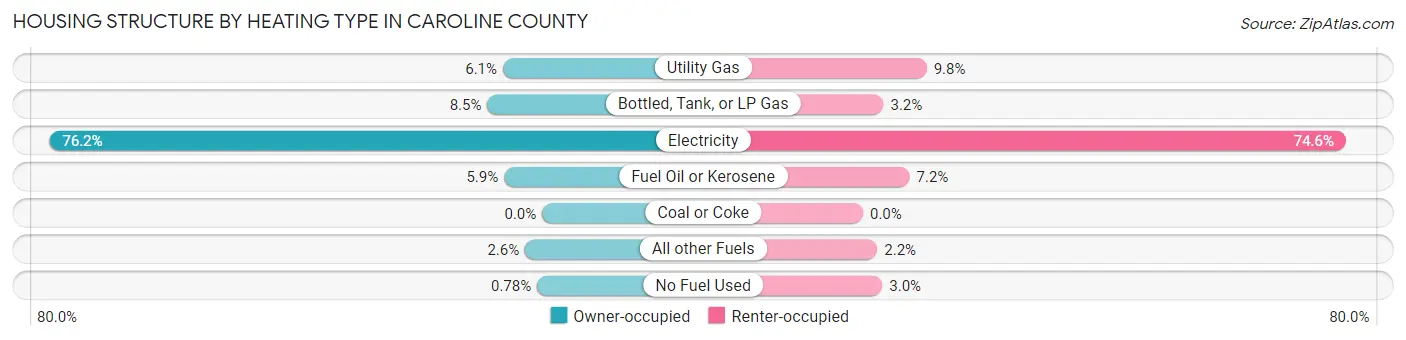
| Heating Type | Owner-occupied | Renter-occupied |
| Utility Gas | 564 (6.1%) | 205 (9.8%) |
| Bottled, Tank, or LP Gas | 788 (8.5%) | 66 (3.2%) |
| Electricity | 7,086 (76.2%) | 1,555 (74.6%) |
| Fuel Oil or Kerosene | 547 (5.9%) | 150 (7.2%) |
| Coal or Coke | 0 (0.0%) | 0 (0.0%) |
| All other Fuels | 245 (2.6%) | 46 (2.2%) |
| No Fuel Used | 73 (0.8%) | 62 (3.0%) |
| Total | 9,303 (100.0%) | 2,084 (100.0%) |
Household Vehicle Usage in Caroline County

| Vehicles per Household | Owner-occupied | Renter-occupied |
| No Vehicle | 364 (3.9%) | 207 (9.9%) |
| 1 Vehicle | 1,226 (13.2%) | 770 (36.9%) |
| 2 Vehicles | 2,983 (32.1%) | 845 (40.6%) |
| 3 or more Vehicles | 4,730 (50.8%) | 262 (12.6%) |
| Total | 9,303 (100.0%) | 2,084 (100.0%) |
Real Estate & Mortgages in Caroline County
Real Estate and Mortgage Overview in Caroline County
| Characteristic | Without Mortgage | With Mortgage |
| Housing Units | 2,753 | 6,550 |
| Median Property Value | $206,300 | $275,400 |
| Median Household Income | $56,648 | $1,788 |
| Monthly Housing Costs | $442 | $352 |
| Real Estate Taxes | $1,278 | $146 |
Property Value by Mortgage Status in Caroline County
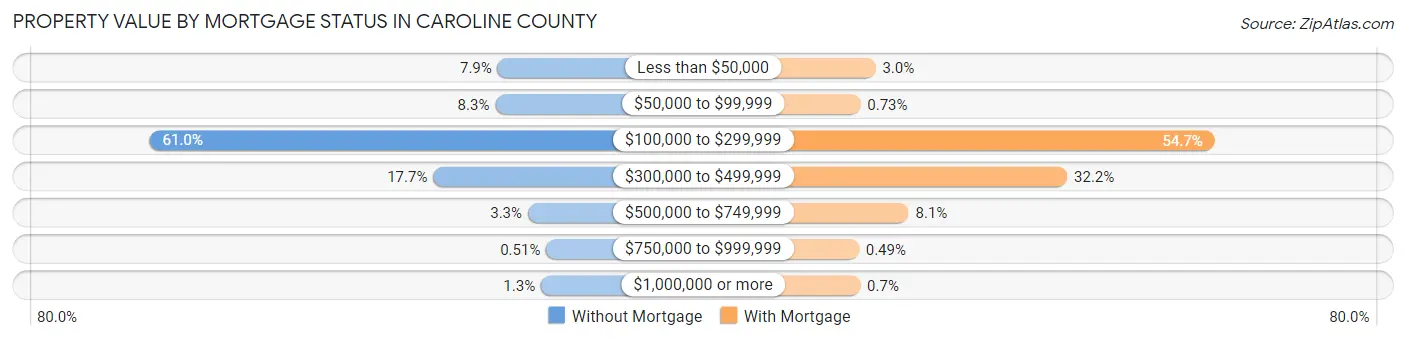
| Property Value | Without Mortgage | With Mortgage |
| Less than $50,000 | 218 (7.9%) | 199 (3.0%) |
| $50,000 to $99,999 | 228 (8.3%) | 48 (0.7%) |
| $100,000 to $299,999 | 1,678 (61.0%) | 3,584 (54.7%) |
| $300,000 to $499,999 | 488 (17.7%) | 2,112 (32.2%) |
| $500,000 to $749,999 | 91 (3.3%) | 529 (8.1%) |
| $750,000 to $999,999 | 14 (0.5%) | 32 (0.5%) |
| $1,000,000 or more | 36 (1.3%) | 46 (0.7%) |
| Total | 2,753 (100.0%) | 6,550 (100.0%) |
Household Income by Mortgage Status in Caroline County
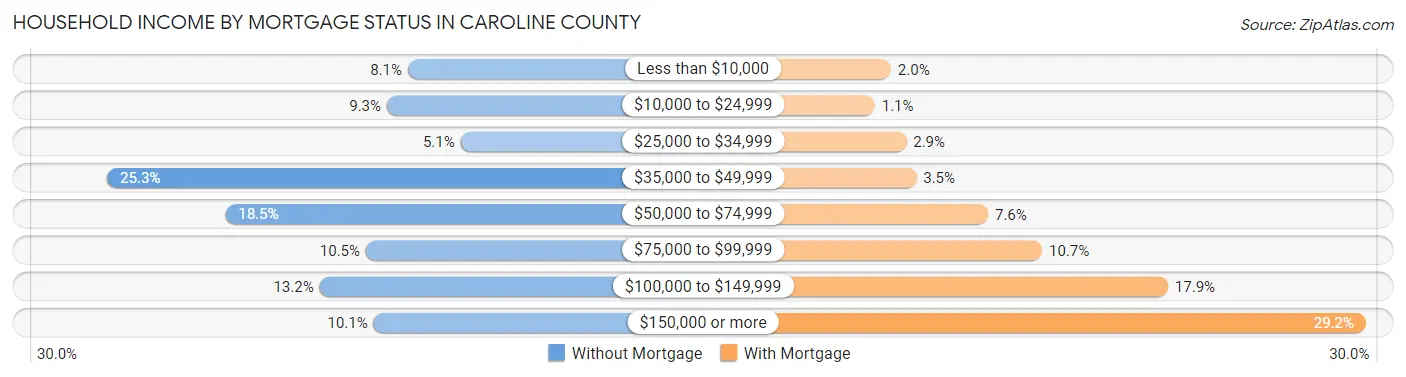
| Household Income | Without Mortgage | With Mortgage |
| Less than $10,000 | 223 (8.1%) | 132 (2.0%) |
| $10,000 to $24,999 | 256 (9.3%) | 72 (1.1%) |
| $25,000 to $34,999 | 140 (5.1%) | 190 (2.9%) |
| $35,000 to $49,999 | 696 (25.3%) | 227 (3.5%) |
| $50,000 to $74,999 | 510 (18.5%) | 496 (7.6%) |
| $75,000 to $99,999 | 289 (10.5%) | 698 (10.7%) |
| $100,000 to $149,999 | 362 (13.2%) | 1,169 (17.8%) |
| $150,000 or more | 277 (10.1%) | 1,910 (29.2%) |
| Total | 2,753 (100.0%) | 6,550 (100.0%) |
Property Value to Household Income Ratio in Caroline County

| Value-to-Income Ratio | Without Mortgage | With Mortgage |
| Less than 2.0x | 674 (24.5%) | 104,948 (1,602.3%) |
| 2.0x to 2.9x | 520 (18.9%) | 2,045 (31.2%) |
| 3.0x to 3.9x | 370 (13.4%) | 2,002 (30.6%) |
| 4.0x or more | 1,153 (41.9%) | 1,032 (15.8%) |
| Total | 2,753 (100.0%) | 6,550 (100.0%) |
Real Estate Taxes by Mortgage Status in Caroline County
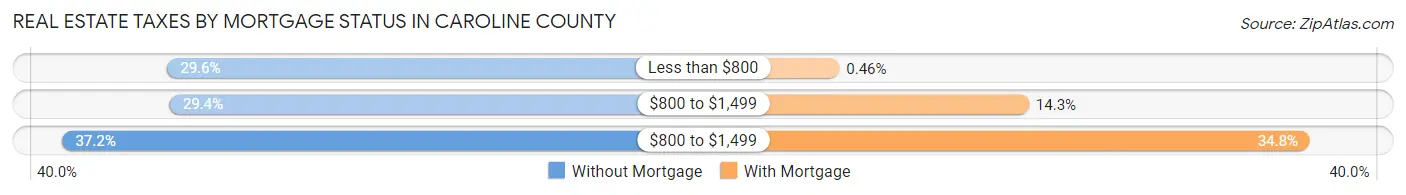
| Property Taxes | Without Mortgage | With Mortgage |
| Less than $800 | 814 (29.6%) | 30 (0.5%) |
| $800 to $1,499 | 809 (29.4%) | 937 (14.3%) |
| $800 to $1,499 | 1,025 (37.2%) | 2,282 (34.8%) |
| Total | 2,753 (100.0%) | 6,550 (100.0%) |
Health & Disability in Caroline County
Health Insurance Coverage by Age in Caroline County
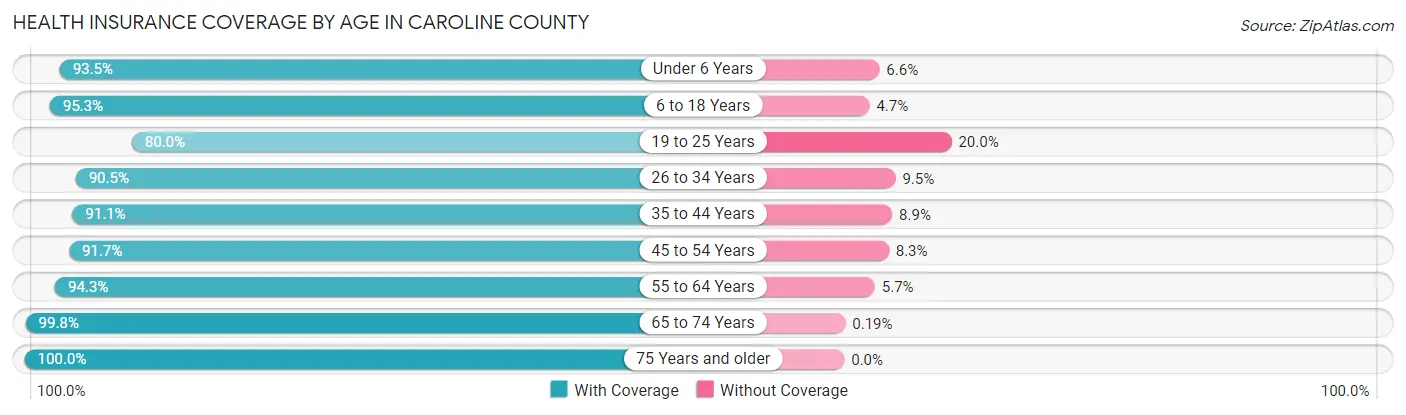
| Age Bracket | With Coverage | Without Coverage |
| Under 6 Years | 1,941 (93.4%) | 136 (6.6%) |
| 6 to 18 Years | 5,034 (95.3%) | 248 (4.7%) |
| 19 to 25 Years | 1,365 (80.0%) | 341 (20.0%) |
| 26 to 34 Years | 3,290 (90.5%) | 347 (9.5%) |
| 35 to 44 Years | 3,473 (91.1%) | 340 (8.9%) |
| 45 to 54 Years | 3,571 (91.7%) | 323 (8.3%) |
| 55 to 64 Years | 4,140 (94.3%) | 250 (5.7%) |
| 65 to 74 Years | 3,075 (99.8%) | 6 (0.2%) |
| 75 Years and older | 1,905 (100.0%) | 0 (0.0%) |
| Total | 27,794 (93.3%) | 1,991 (6.7%) |
Health Insurance Coverage by Citizenship Status in Caroline County
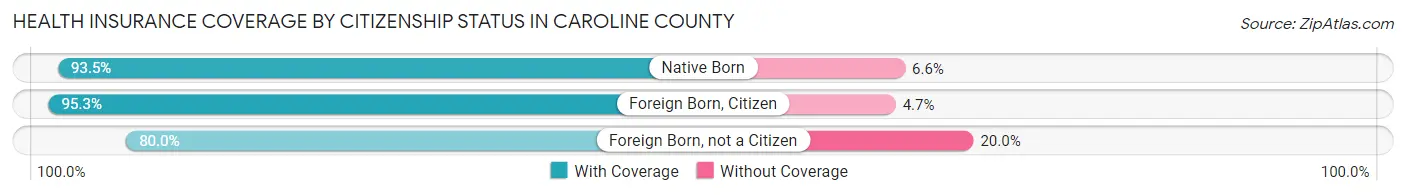
| Citizenship Status | With Coverage | Without Coverage |
| Native Born | 1,941 (93.4%) | 136 (6.6%) |
| Foreign Born, Citizen | 5,034 (95.3%) | 248 (4.7%) |
| Foreign Born, not a Citizen | 1,365 (80.0%) | 341 (20.0%) |
Health Insurance Coverage by Household Income in Caroline County
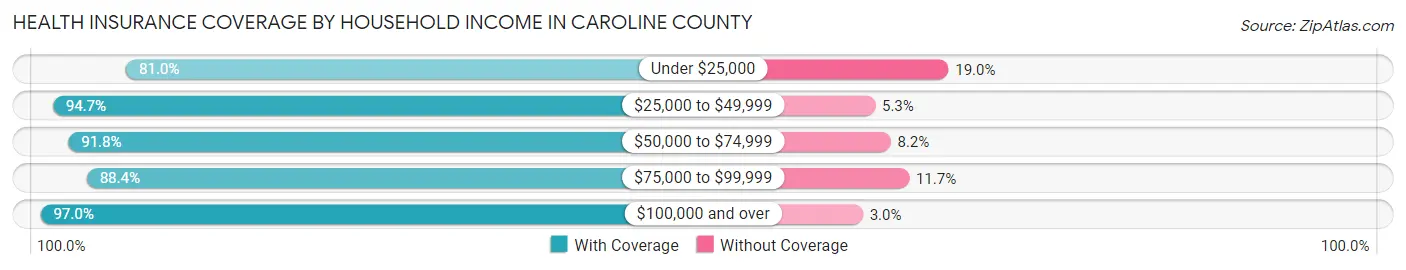
| Household Income | With Coverage | Without Coverage |
| Under $25,000 | 1,874 (81.0%) | 440 (19.0%) |
| $25,000 to $49,999 | 4,007 (94.7%) | 224 (5.3%) |
| $50,000 to $74,999 | 3,889 (91.8%) | 347 (8.2%) |
| $75,000 to $99,999 | 4,154 (88.3%) | 548 (11.7%) |
| $100,000 and over | 13,852 (97.0%) | 426 (3.0%) |
Public vs Private Health Insurance Coverage by Age in Caroline County
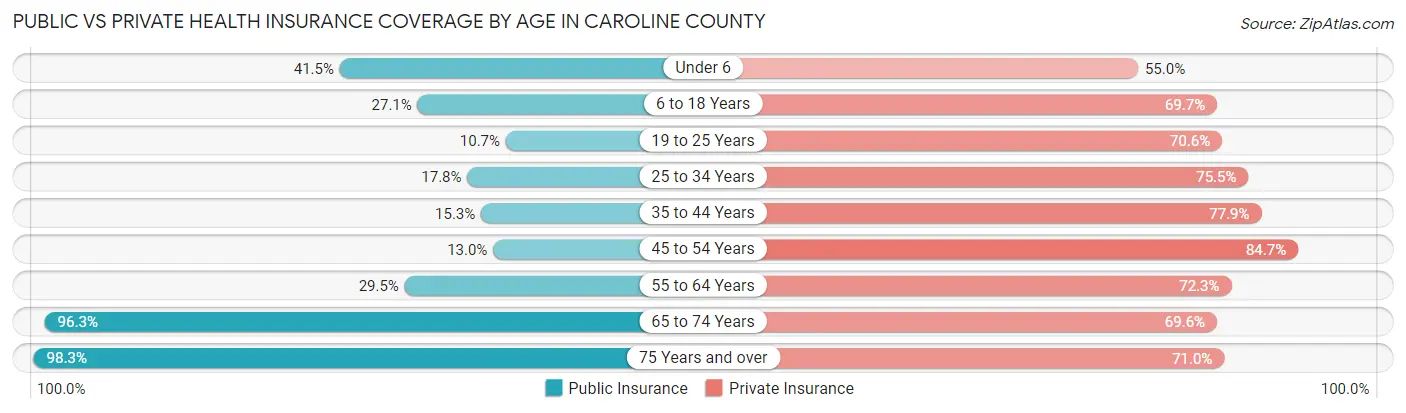
| Age Bracket | Public Insurance | Private Insurance |
| Under 6 | 862 (41.5%) | 1,142 (55.0%) |
| 6 to 18 Years | 1,429 (27.1%) | 3,679 (69.7%) |
| 19 to 25 Years | 182 (10.7%) | 1,204 (70.6%) |
| 25 to 34 Years | 648 (17.8%) | 2,744 (75.4%) |
| 35 to 44 Years | 582 (15.3%) | 2,969 (77.9%) |
| 45 to 54 Years | 507 (13.0%) | 3,297 (84.7%) |
| 55 to 64 Years | 1,293 (29.4%) | 3,174 (72.3%) |
| 65 to 74 Years | 2,966 (96.3%) | 2,145 (69.6%) |
| 75 Years and over | 1,873 (98.3%) | 1,352 (71.0%) |
| Total | 10,342 (34.7%) | 21,706 (72.9%) |
Disability Status by Sex by Age in Caroline County
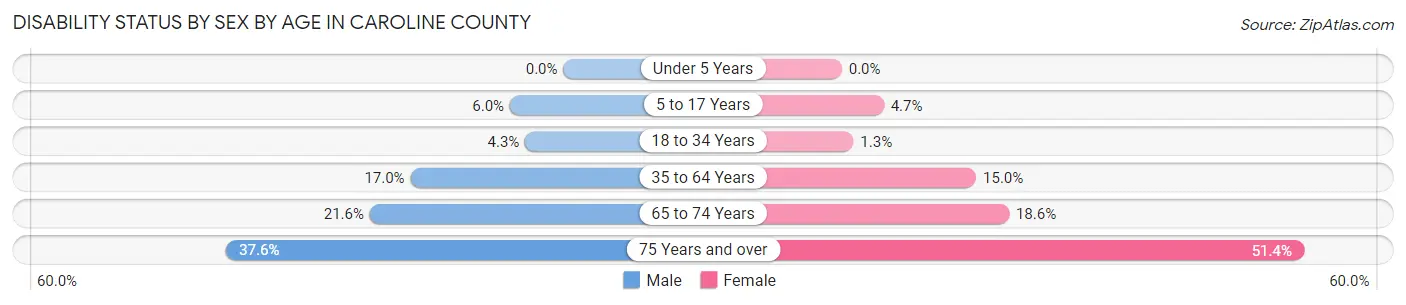
| Age Bracket | Male | Female |
| Under 5 Years | 0 (0.0%) | 0 (0.0%) |
| 5 to 17 Years | 152 (5.9%) | 125 (4.7%) |
| 18 to 34 Years | 111 (4.3%) | 39 (1.3%) |
| 35 to 64 Years | 1,005 (17.0%) | 927 (15.0%) |
| 65 to 74 Years | 318 (21.6%) | 299 (18.6%) |
| 75 Years and over | 297 (37.6%) | 573 (51.4%) |
Disability Class by Sex by Age in Caroline County
Disability Class: Hearing Difficulty
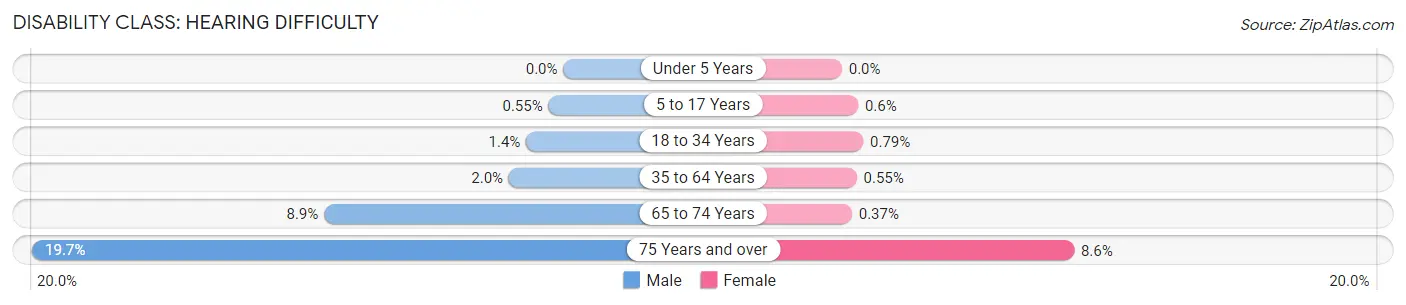
| Age Bracket | Male | Female |
| Under 5 Years | 0 (0.0%) | 0 (0.0%) |
| 5 to 17 Years | 14 (0.5%) | 16 (0.6%) |
| 18 to 34 Years | 36 (1.4%) | 24 (0.8%) |
| 35 to 64 Years | 119 (2.0%) | 34 (0.5%) |
| 65 to 74 Years | 131 (8.9%) | 6 (0.4%) |
| 75 Years and over | 156 (19.7%) | 96 (8.6%) |
Disability Class: Vision Difficulty
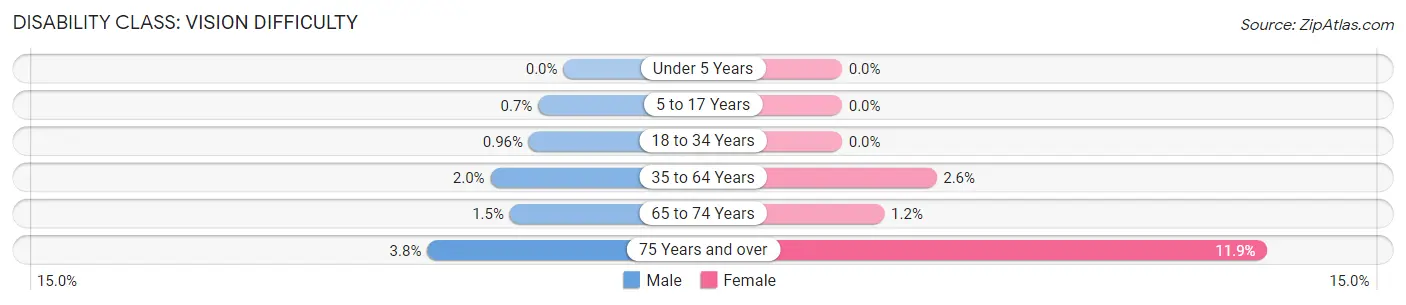
| Age Bracket | Male | Female |
| Under 5 Years | 0 (0.0%) | 0 (0.0%) |
| 5 to 17 Years | 18 (0.7%) | 0 (0.0%) |
| 18 to 34 Years | 25 (1.0%) | 0 (0.0%) |
| 35 to 64 Years | 120 (2.0%) | 163 (2.6%) |
| 65 to 74 Years | 22 (1.5%) | 19 (1.2%) |
| 75 Years and over | 30 (3.8%) | 132 (11.8%) |
Disability Class: Cognitive Difficulty
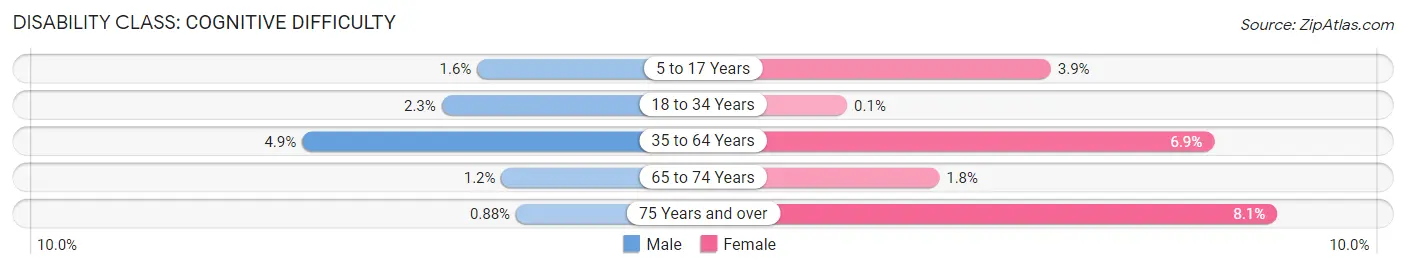
| Age Bracket | Male | Female |
| 5 to 17 Years | 41 (1.6%) | 104 (3.9%) |
| 18 to 34 Years | 59 (2.3%) | 3 (0.1%) |
| 35 to 64 Years | 286 (4.9%) | 428 (6.9%) |
| 65 to 74 Years | 17 (1.1%) | 29 (1.8%) |
| 75 Years and over | 7 (0.9%) | 90 (8.1%) |
Disability Class: Ambulatory Difficulty
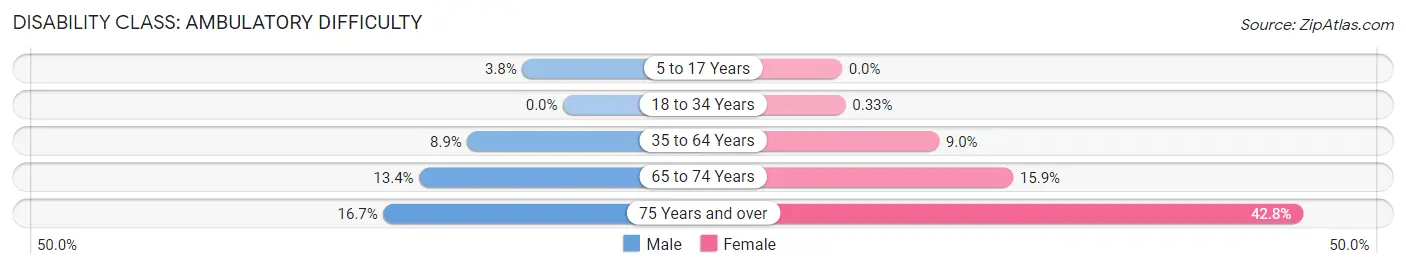
| Age Bracket | Male | Female |
| 5 to 17 Years | 97 (3.8%) | 0 (0.0%) |
| 18 to 34 Years | 0 (0.0%) | 10 (0.3%) |
| 35 to 64 Years | 524 (8.9%) | 558 (9.0%) |
| 65 to 74 Years | 197 (13.4%) | 255 (15.9%) |
| 75 Years and over | 132 (16.7%) | 477 (42.8%) |
Disability Class: Self-Care Difficulty
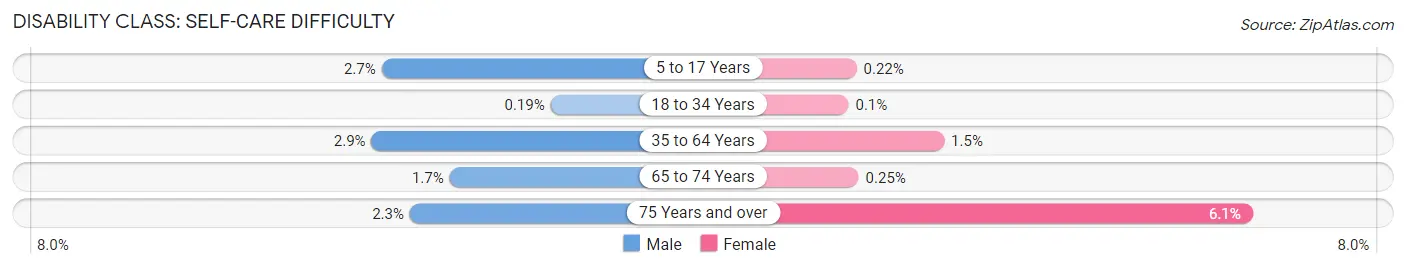
| Age Bracket | Male | Female |
| 5 to 17 Years | 69 (2.7%) | 6 (0.2%) |
| 18 to 34 Years | 5 (0.2%) | 3 (0.1%) |
| 35 to 64 Years | 168 (2.9%) | 94 (1.5%) |
| 65 to 74 Years | 25 (1.7%) | 4 (0.3%) |
| 75 Years and over | 18 (2.3%) | 68 (6.1%) |
Technology Access in Caroline County
Computing Device Access in Caroline County
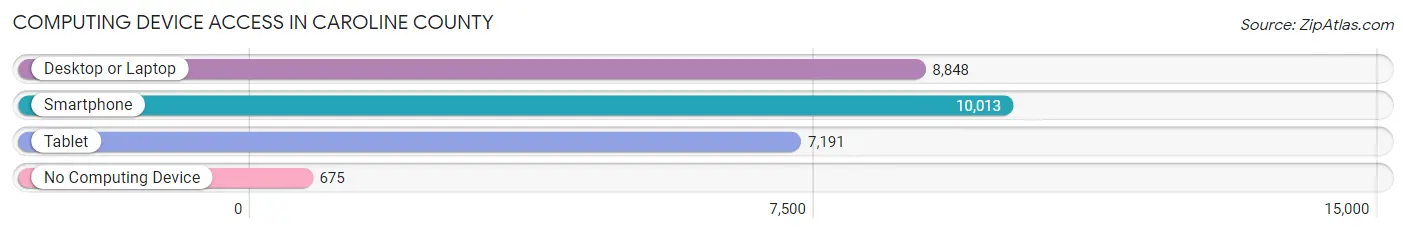
| Device Type | # Households | % Households |
| Desktop or Laptop | 8,848 | 77.7% |
| Smartphone | 10,013 | 87.9% |
| Tablet | 7,191 | 63.1% |
| No Computing Device | 675 | 5.9% |
| Total | 11,387 | 100.0% |
Internet Access in Caroline County

| Internet Type | # Households | % Households |
| Dial-Up Internet | 19 | 0.2% |
| Broadband Home | 5,977 | 52.5% |
| Cellular Data Only | 2,076 | 18.2% |
| Satellite Internet | 1,245 | 10.9% |
| No Internet | 1,826 | 16.0% |
| Total | 11,387 | 100.0% |
Caroline County Summary
Caroline County, Virginia is located in the east-central part of the state, and is part of the Richmond-Petersburg Metropolitan Statistical Area. It is bordered by Essex, King and Queen, King William, and Spotsylvania counties, and is approximately 50 miles south of the state capital of Richmond. The county seat is the town of Bowling Green.
History
Caroline County was formed in 1728 from parts of Essex, King and Queen, and King William counties. It was named for Caroline of Ansbach, the wife of King George II of England. The county was primarily agricultural in its early years, with tobacco being the main crop. During the American Revolution, the county was the site of several battles, including the Battle of Bowling Green in 1781.
In the 19th century, the county’s economy shifted to lumber and manufacturing. The county was home to several sawmills, gristmills, and other industries. The county also had a thriving riverboat trade, with goods being shipped up and down the Rappahannock River.
In the 20th century, the county’s economy shifted again, this time to tourism. The county is home to several historic sites, including the Bowling Green Historic District, the Caroline County Courthouse, and the Caroline County Jail. The county is also home to several state parks, including the Rappahannock River Valley National Wildlife Refuge and the Chippokes Plantation State Park.
Geography
Caroline County is located in the east-central part of Virginia, and is bordered by Essex, King and Queen, King William, and Spotsylvania counties. The county is approximately 50 miles south of the state capital of Richmond. The county has a total area of 441 square miles, of which 437 square miles is land and 4 square miles is water.
The county is mostly flat, with some rolling hills in the northern part of the county. The county is drained by the Rappahannock River, which forms the county’s northern border. The county is also home to several lakes, including Lake Caroline and Lake Land’or.
Economy
The economy of Caroline County is largely based on agriculture and tourism. The county is home to several farms, which produce a variety of crops, including corn, soybeans, wheat, and hay. The county is also home to several wineries, which produce a variety of wines.
Tourism is also an important part of the county’s economy. The county is home to several historic sites, including the Bowling Green Historic District, the Caroline County Courthouse, and the Caroline County Jail. The county is also home to several state parks, including the Rappahannock River Valley National Wildlife Refuge and the Chippokes Plantation State Park.
Demographics
As of the 2010 census, Caroline County had a population of 28,545. The population was 53.2% white, 40.2% African American, 0.7% Native American, 1.2% Asian, 0.1% Pacific Islander, 2.2% from other races, and 2.5% from two or more races. Hispanic or Latino of any race were 4.3% of the population.
The median household income in the county was $50,945, and the median family income was $60,945. The per capita income was $24,945. About 11.2% of the population was below the poverty line.
Common Questions
What is the Total Population of Caroline County?
Total Population of Caroline County is 31,181.
What is the Total Male Population of Caroline County?
Total Male Population of Caroline County is 15,457.
What is the Total Female Population of Caroline County?
Total Female Population of Caroline County is 15,724.
What is the Ratio of Males per 100 Females in Caroline County?
There are 98.30 Males per 100 Females in Caroline County.
What is the Ratio of Females per 100 Males in Caroline County?
There are 101.73 Females per 100 Males in Caroline County.
What is the Median Population Age in Caroline County?
Median Population Age in Caroline County is 39.2 Years.
What is the Average Family Size in Caroline County
Average Family Size in Caroline County is 3.0 People.
What is the Average Household Size in Caroline County
Average Household Size in Caroline County is 2.6 People.
What is Per Capita Income in Caroline County?
Per Capita income in Caroline County is $38,432.
What is the Median Family Income in Caroline County?
Median Family Income in Caroline County is $96,803.
What is the Median Household income in Caroline County?
Median Household Income in Caroline County is $83,562.
What is Income or Wage Gap in Caroline County?
Income or Wage Gap in Caroline County is 28.8%.
Women in Caroline County earn 71.2 cents for every dollar earned by a man.
What is Family Income Deficit in Caroline County?
Family Income Deficit in Caroline County is $10,676.
Families that are below poverty line in Caroline County earn $10,676 less on average than the poverty threshold level.
What is Inequality or Gini Index in Caroline County?
Inequality or Gini Index in Caroline County is 0.41.
How Large is the Labor Force in Caroline County?
There are 16,854 People in the Labor Forcein in Caroline County.
What is the Percentage of People in the Labor Force in Caroline County?
68.4% of People are in the Labor Force in Caroline County.
What is the Unemployment Rate in Caroline County?
Unemployment Rate in Caroline County is 4.6%.