Palmer Heights, PA
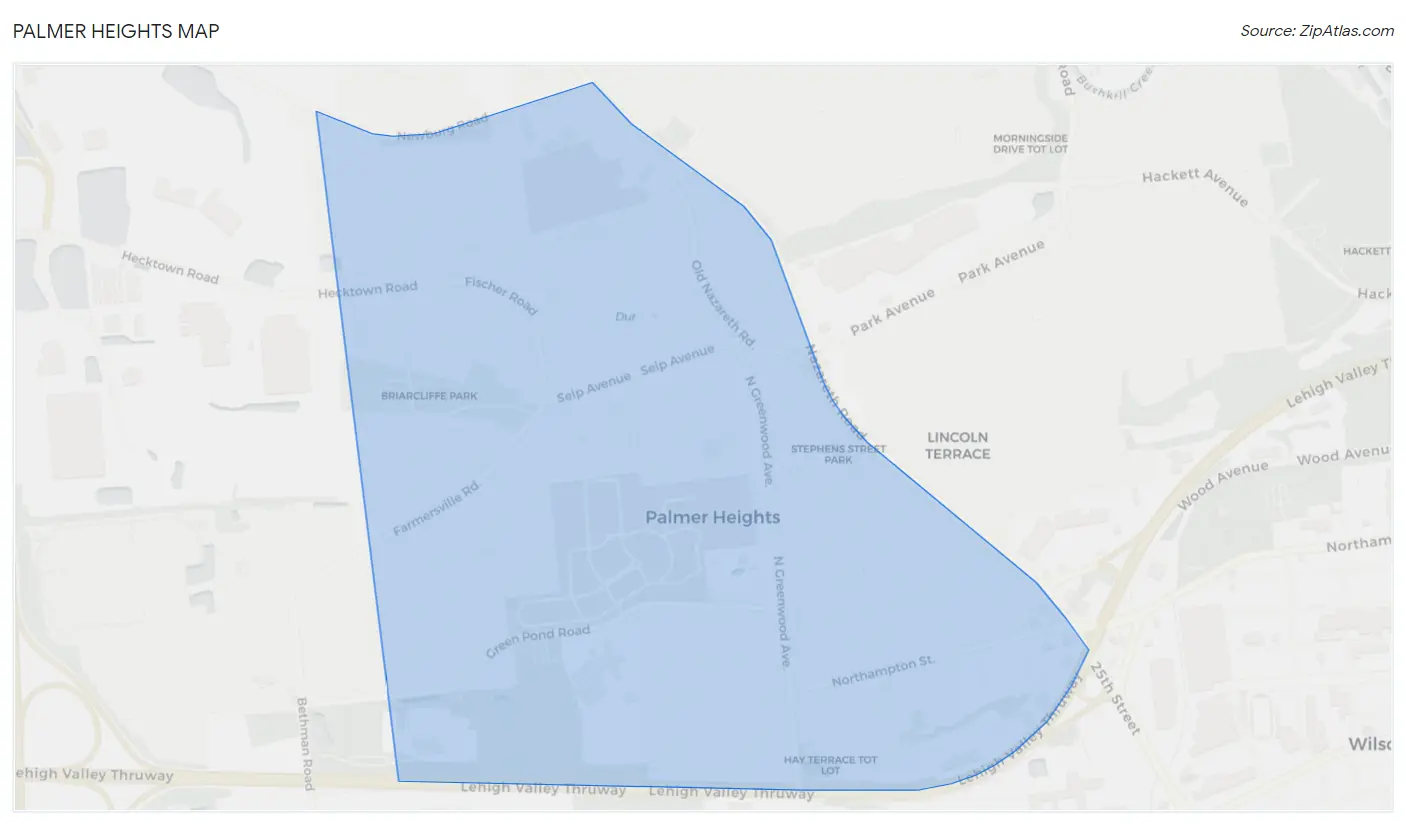
Palmer Heights Map
Palmer Heights Overview
3,894
TOTAL POPULATION
2,053
MALE POPULATION
1,841
FEMALE POPULATION
111.52
MALES / 100 FEMALES
89.67
FEMALES / 100 MALES
47.5
MEDIAN AGE
3.1
AVG FAMILY SIZE
2.7
AVG HOUSEHOLD SIZE
$39,646
PER CAPITA INCOME
$113,984
AVG FAMILY INCOME
$108,173
AVG HOUSEHOLD INCOME
35.4%
WAGE / INCOME GAP [ % ]
64.6¢/ $1
WAGE / INCOME GAP [ $ ]
0.30
INEQUALITY / GINI INDEX
1,974
LABOR FORCE [ PEOPLE ]
62.9%
PERCENT IN LABOR FORCE
6.8%
UNEMPLOYMENT RATE
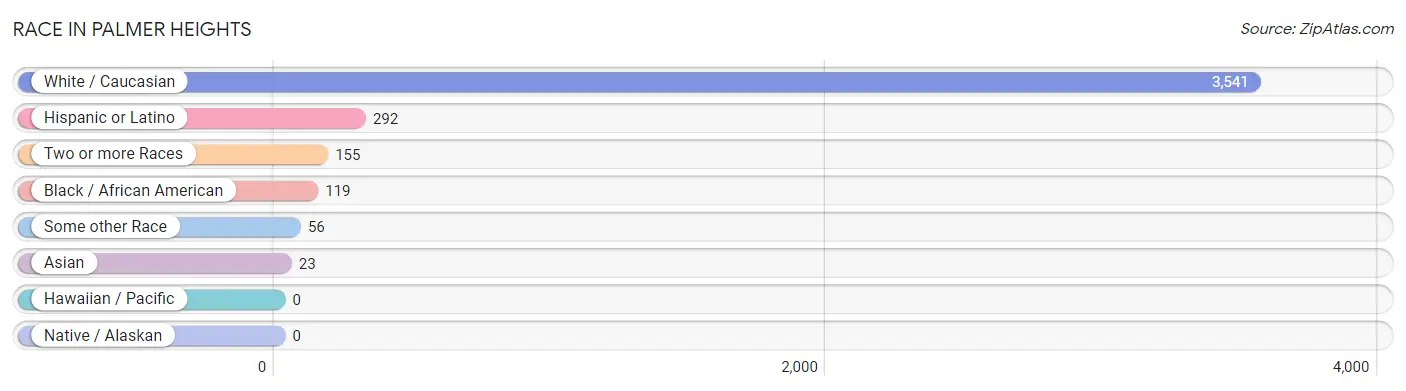
Race in Palmer Heights
The most populous races in Palmer Heights are White / Caucasian (3,541 | 90.9%), Hispanic or Latino (292 | 7.5%), and Two or more Races (155 | 4.0%).
| Race | # Population | % Population |
| Asian | 23 | 0.6% |
| Black / African American | 119 | 3.1% |
| Hawaiian / Pacific | 0 | 0.0% |
| Hispanic or Latino | 292 | 7.5% |
| Native / Alaskan | 0 | 0.0% |
| White / Caucasian | 3,541 | 90.9% |
| Two or more Races | 155 | 4.0% |
| Some other Race | 56 | 1.4% |
| Total | 3,894 | 100.0% |
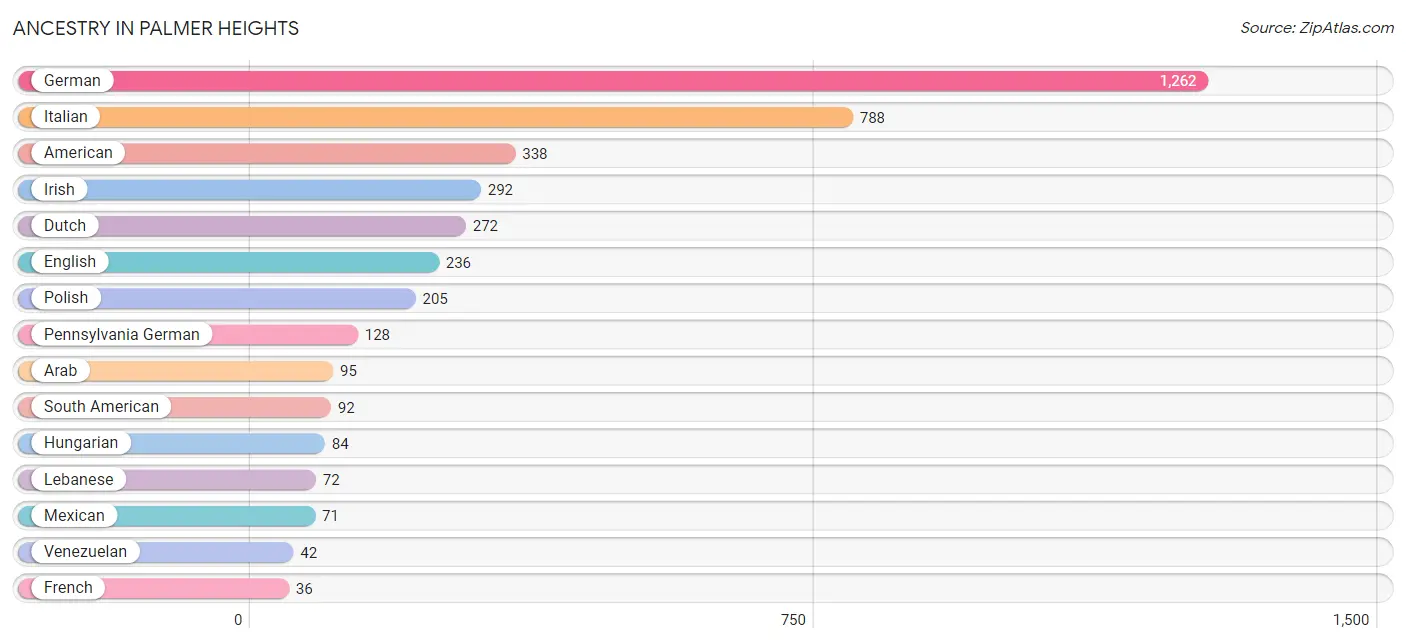
Ancestry in Palmer Heights
The most populous ancestries reported in Palmer Heights are German (1,262 | 32.4%), Italian (788 | 20.2%), American (338 | 8.7%), Irish (292 | 7.5%), and Dutch (272 | 7.0%), together accounting for 75.8% of all Palmer Heights residents.
| Ancestry | # Population | % Population |
| American | 338 | 8.7% |
| Arab | 95 | 2.4% |
| Austrian | 4 | 0.1% |
| Bhutanese | 34 | 0.9% |
| British | 32 | 0.8% |
| Canadian | 7 | 0.2% |
| Central American | 21 | 0.5% |
| Colombian | 25 | 0.6% |
| Costa Rican | 21 | 0.5% |
| Cuban | 33 | 0.9% |
| Czechoslovakian | 18 | 0.5% |
| Dominican | 6 | 0.2% |
| Dutch | 272 | 7.0% |
| Eastern European | 16 | 0.4% |
| Ecuadorian | 25 | 0.6% |
| English | 236 | 6.1% |
| French | 36 | 0.9% |
| French Canadian | 14 | 0.4% |
| German | 1,262 | 32.4% |
| Greek | 22 | 0.6% |
| Hungarian | 84 | 2.2% |
| Indian (Asian) | 9 | 0.2% |
| Irish | 292 | 7.5% |
| Italian | 788 | 20.2% |
| Korean | 11 | 0.3% |
| Lebanese | 72 | 1.8% |
| Lithuanian | 24 | 0.6% |
| Mexican | 71 | 1.8% |
| Moroccan | 16 | 0.4% |
| Pennsylvania German | 128 | 3.3% |
| Polish | 205 | 5.3% |
| Portuguese | 9 | 0.2% |
| Puerto Rican | 22 | 0.6% |
| Romanian | 13 | 0.3% |
| Russian | 8 | 0.2% |
| Scotch-Irish | 17 | 0.4% |
| Scottish | 29 | 0.7% |
| Slavic | 19 | 0.5% |
| Slovak | 33 | 0.9% |
| South American | 92 | 2.4% |
| Spaniard | 28 | 0.7% |
| Swedish | 13 | 0.3% |
| Swiss | 14 | 0.4% |
| Syrian | 7 | 0.2% |
| Ukrainian | 21 | 0.5% |
| Venezuelan | 42 | 1.1% |
| Welsh | 19 | 0.5% | View All 47 Rows |
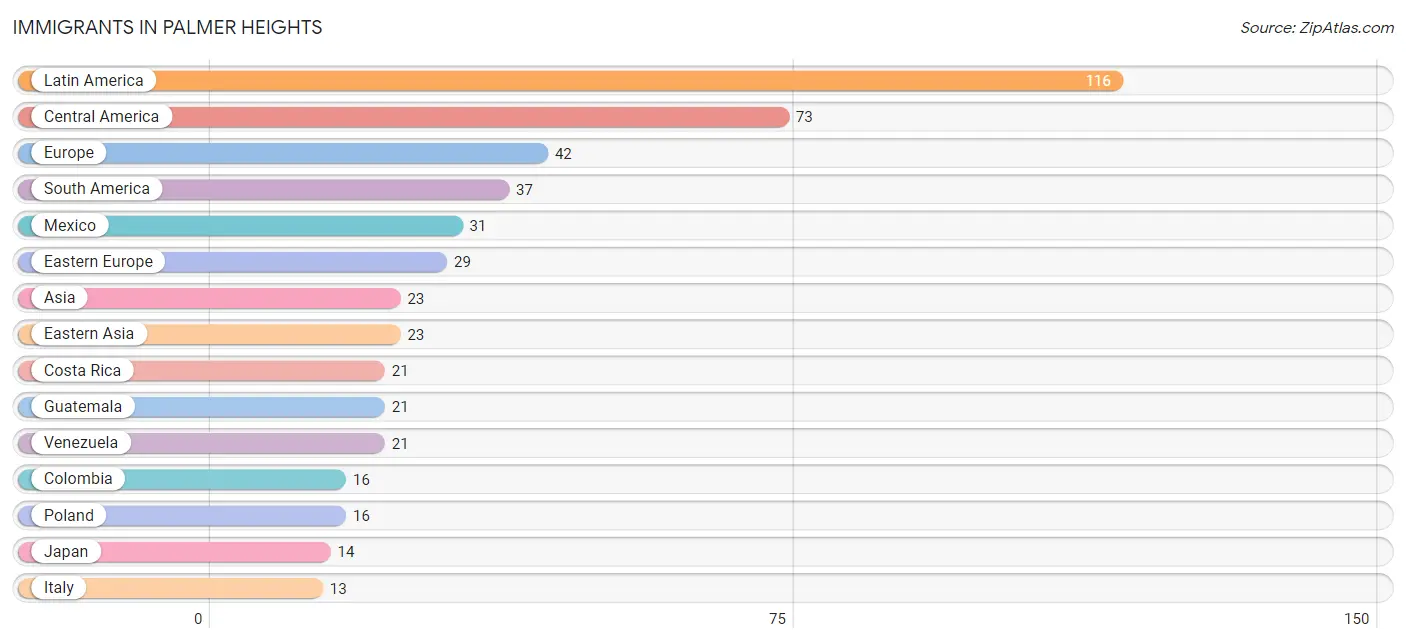
Immigrants in Palmer Heights
The most numerous immigrant groups reported in Palmer Heights came from Latin America (116 | 3.0%), Central America (73 | 1.9%), Europe (42 | 1.1%), South America (37 | 0.9%), and Mexico (31 | 0.8%), together accounting for 7.7% of all Palmer Heights residents.
| Immigration Origin | # Population | % Population |
| Asia | 23 | 0.6% |
| Canada | 7 | 0.2% |
| Caribbean | 6 | 0.2% |
| Central America | 73 | 1.9% |
| China | 9 | 0.2% |
| Colombia | 16 | 0.4% |
| Costa Rica | 21 | 0.5% |
| Dominican Republic | 6 | 0.2% |
| Eastern Asia | 23 | 0.6% |
| Eastern Europe | 29 | 0.7% |
| Europe | 42 | 1.1% |
| Guatemala | 21 | 0.5% |
| Italy | 13 | 0.3% |
| Japan | 14 | 0.4% |
| Latin America | 116 | 3.0% |
| Mexico | 31 | 0.8% |
| Poland | 16 | 0.4% |
| Romania | 13 | 0.3% |
| South America | 37 | 0.9% |
| Southern Europe | 13 | 0.3% |
| Taiwan | 9 | 0.2% |
| Venezuela | 21 | 0.5% | View All 22 Rows |
Sex and Age in Palmer Heights
Sex and Age in Palmer Heights
The most populous age groups in Palmer Heights are 10 to 14 Years (319 | 15.5%) for men and 65 to 69 Years (201 | 10.9%) for women.
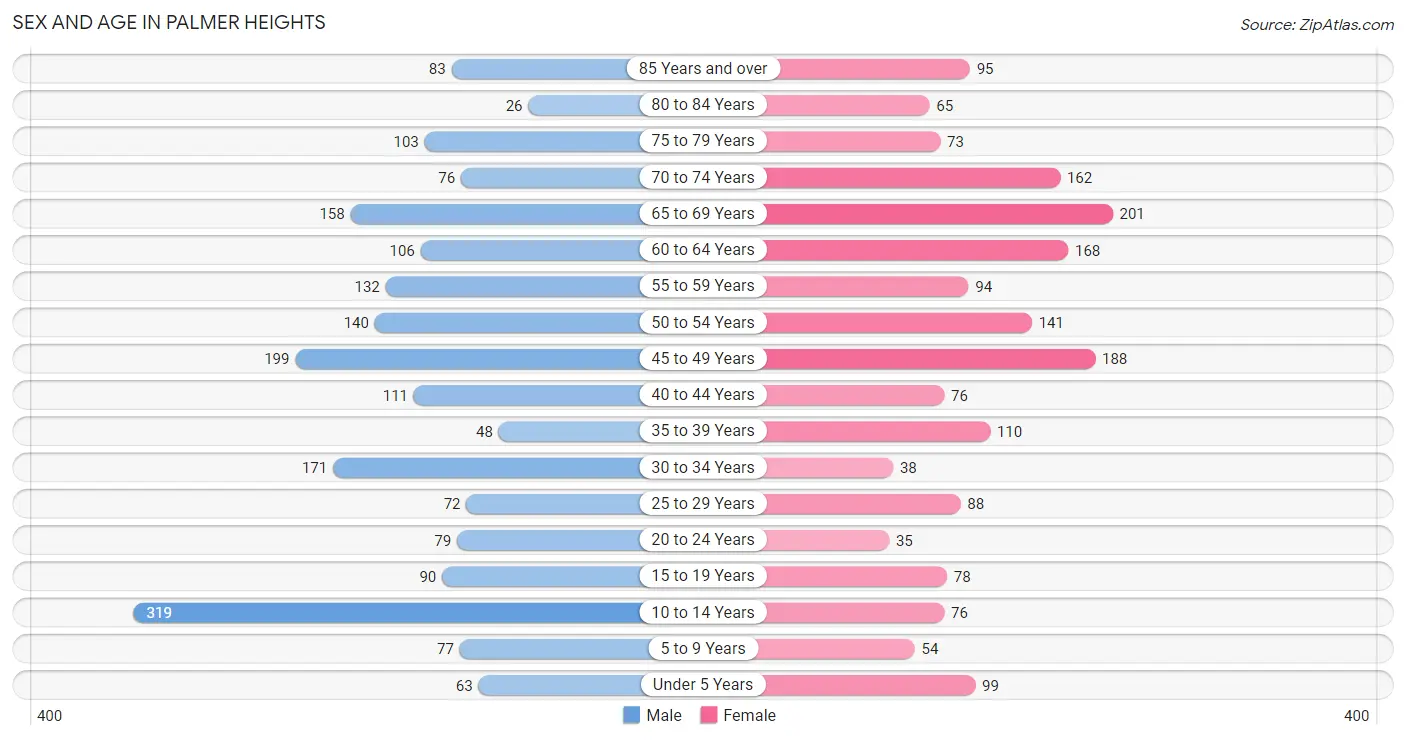
| Age Bracket | Male | Female |
| Under 5 Years | 63 (3.1%) | 99 (5.4%) |
| 5 to 9 Years | 77 (3.7%) | 54 (2.9%) |
| 10 to 14 Years | 319 (15.5%) | 76 (4.1%) |
| 15 to 19 Years | 90 (4.4%) | 78 (4.2%) |
| 20 to 24 Years | 79 (3.8%) | 35 (1.9%) |
| 25 to 29 Years | 72 (3.5%) | 88 (4.8%) |
| 30 to 34 Years | 171 (8.3%) | 38 (2.1%) |
| 35 to 39 Years | 48 (2.3%) | 110 (6.0%) |
| 40 to 44 Years | 111 (5.4%) | 76 (4.1%) |
| 45 to 49 Years | 199 (9.7%) | 188 (10.2%) |
| 50 to 54 Years | 140 (6.8%) | 141 (7.7%) |
| 55 to 59 Years | 132 (6.4%) | 94 (5.1%) |
| 60 to 64 Years | 106 (5.2%) | 168 (9.1%) |
| 65 to 69 Years | 158 (7.7%) | 201 (10.9%) |
| 70 to 74 Years | 76 (3.7%) | 162 (8.8%) |
| 75 to 79 Years | 103 (5.0%) | 73 (4.0%) |
| 80 to 84 Years | 26 (1.3%) | 65 (3.5%) |
| 85 Years and over | 83 (4.0%) | 95 (5.2%) |
| Total | 2,053 (100.0%) | 1,841 (100.0%) |
Families and Households in Palmer Heights
Median Family Size in Palmer Heights
The median family size in Palmer Heights is 3.13 persons per family, with married-couple families (926 | 89.0%) accounting for the largest median family size of 3.2 persons per family. On the other hand, single male/father families (23 | 2.2%) represent the smallest median family size with 2.00 persons per family.
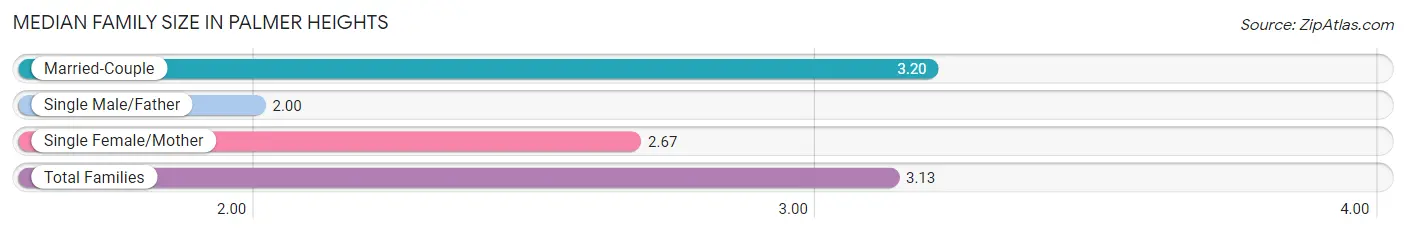
| Family Type | # Families | Family Size |
| Married-Couple | 926 (89.0%) | 3.20 |
| Single Male/Father | 23 (2.2%) | 2.00 |
| Single Female/Mother | 91 (8.7%) | 2.67 |
| Total Families | 1,040 (100.0%) | 3.13 |
Median Household Size in Palmer Heights
The median household size in Palmer Heights is 2.69 persons per household, with married-couple households (926 | 68.0%) accounting for the largest median household size of 3.26 persons per household. non-family households (321 | 23.6%) represent the smallest median household size with 1.11 persons per household.
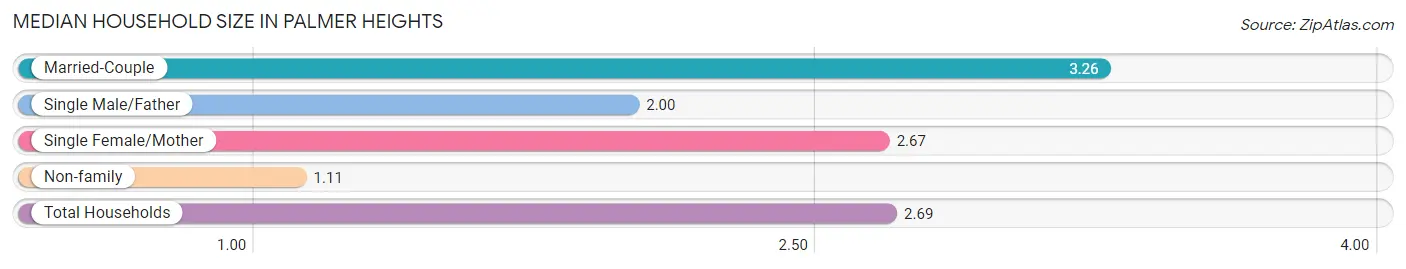
| Household Type | # Households | Household Size |
| Married-Couple | 926 (68.0%) | 3.26 |
| Single Male/Father | 23 (1.7%) | 2.00 |
| Single Female/Mother | 91 (6.7%) | 2.67 |
| Non-family | 321 (23.6%) | 1.11 |
| Total Households | 1,361 (100.0%) | 2.69 |
Household Size by Marriage Status in Palmer Heights
Out of a total of 1,361 households in Palmer Heights, 1,040 (76.4%) are family households, while 321 (23.6%) are nonfamily households. The most numerous type of family households are 2-person households, comprising 435, and the most common type of nonfamily households are 1-person households, comprising 300.
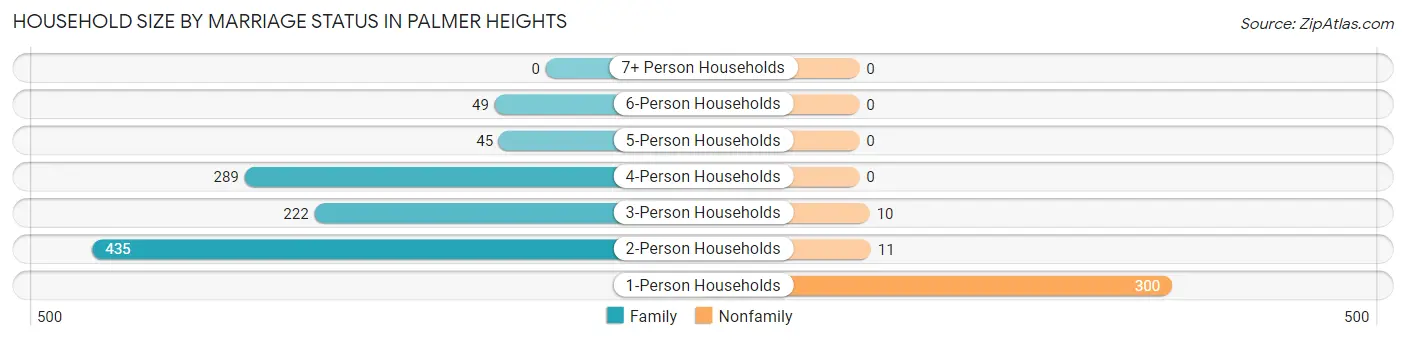
| Household Size | Family Households | Nonfamily Households |
| 1-Person Households | - | 300 (22.0%) |
| 2-Person Households | 435 (32.0%) | 11 (0.8%) |
| 3-Person Households | 222 (16.3%) | 10 (0.7%) |
| 4-Person Households | 289 (21.2%) | 0 (0.0%) |
| 5-Person Households | 45 (3.3%) | 0 (0.0%) |
| 6-Person Households | 49 (3.6%) | 0 (0.0%) |
| 7+ Person Households | 0 (0.0%) | 0 (0.0%) |
| Total | 1,040 (76.4%) | 321 (23.6%) |
Female Fertility in Palmer Heights
Fertility by Age in Palmer Heights
Average fertility rate in Palmer Heights is 130.0 births per 1,000 women. Women in the age bracket of 20 to 34 years have the highest fertility rate with 311.0 births per 1,000 women. Women in the age bracket of 20 to 34 years acount for 57.5% of all women with births.
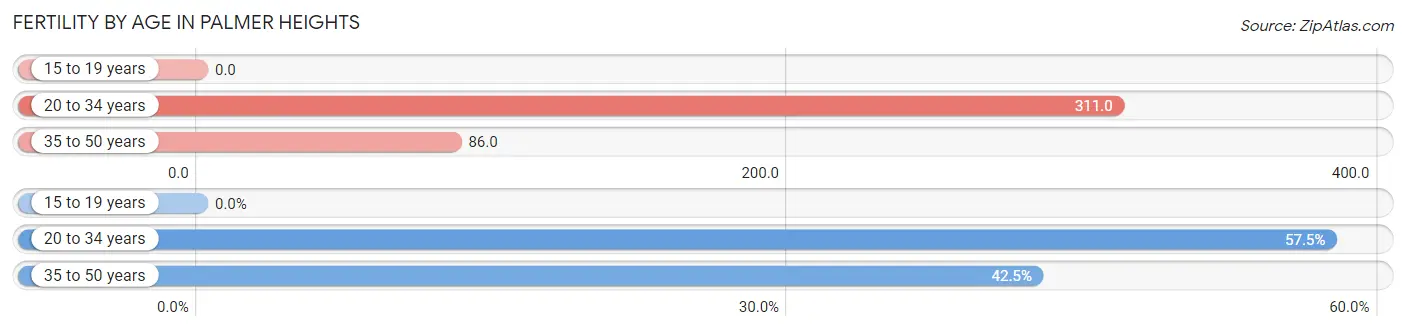
| Age Bracket | Women with Births | Births / 1,000 Women |
| 15 to 19 years | 0 (0.0%) | 0.0 |
| 20 to 34 years | 50 (57.5%) | 311.0 |
| 35 to 50 years | 37 (42.5%) | 86.0 |
| Total | 87 (100.0%) | 130.0 |
Fertility by Age by Marriage Status in Palmer Heights
58.6% of women with births (87) in Palmer Heights are married. The highest percentage of unmarried women with births falls into 20 to 34 years age bracket with 72.0% of them unmarried at the time of birth, while the lowest percentage of unmarried women with births belong to 35 to 50 years age bracket with 0.0% of them unmarried.
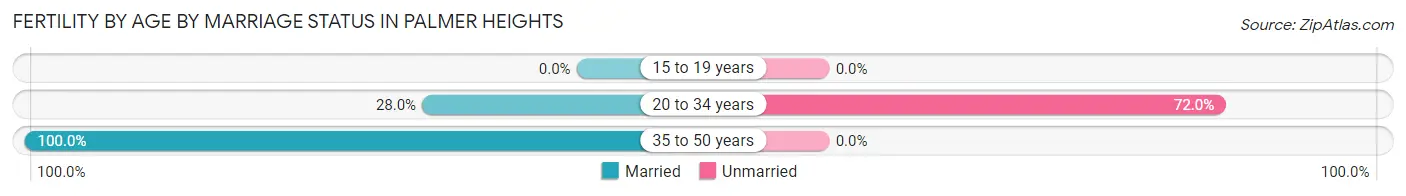
| Age Bracket | Married | Unmarried |
| 15 to 19 years | 0 (0.0%) | 0 (0.0%) |
| 20 to 34 years | 14 (28.0%) | 36 (72.0%) |
| 35 to 50 years | 37 (100.0%) | 0 (0.0%) |
| Total | 51 (58.6%) | 36 (41.4%) |
Fertility by Education in Palmer Heights
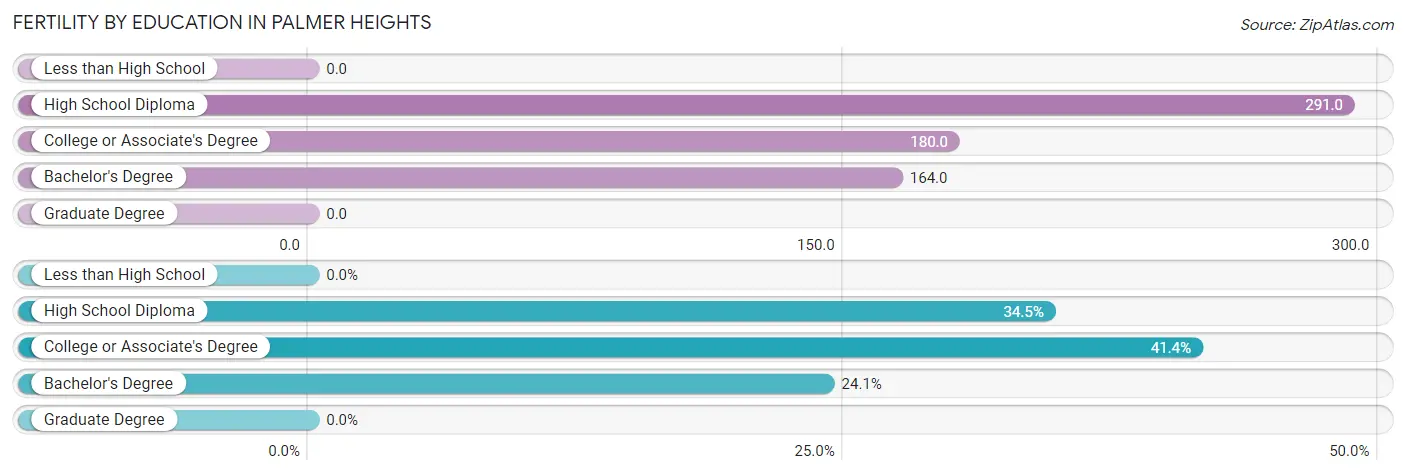
| Educational Attainment | Women with Births | Births / 1,000 Women |
| Less than High School | 0 (0.0%) | 0.0 |
| High School Diploma | 30 (34.5%) | 291.0 |
| College or Associate's Degree | 36 (41.4%) | 180.0 |
| Bachelor's Degree | 21 (24.1%) | 164.0 |
| Graduate Degree | 0 (0.0%) | 0.0 |
| Total | 87 (100.0%) | 130.0 |
Fertility by Education by Marriage Status in Palmer Heights
41.4% of women with births in Palmer Heights are unmarried. Women with the educational attainment of high school diploma are most likely to be married with 100.0% of them married at childbirth, while women with the educational attainment of college or associate's degree are least likely to be married with 100.0% of them unmarried at childbirth.
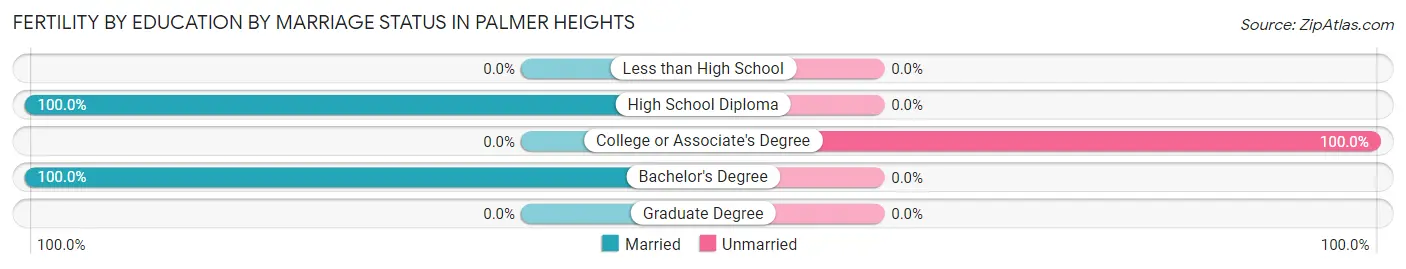
| Educational Attainment | Married | Unmarried |
| Less than High School | 0 (0.0%) | 0 (0.0%) |
| High School Diploma | 30 (100.0%) | 0 (0.0%) |
| College or Associate's Degree | 0 (0.0%) | 36 (100.0%) |
| Bachelor's Degree | 21 (100.0%) | 0 (0.0%) |
| Graduate Degree | 0 (0.0%) | 0 (0.0%) |
| Total | 51 (58.6%) | 36 (41.4%) |
Income in Palmer Heights
Income Overview in Palmer Heights
Per Capita Income in Palmer Heights is $39,646, while median incomes of families and households are $113,984 and $108,173 respectively.
| Characteristic | Number | Measure |
| Per Capita Income | 3,894 | $39,646 |
| Median Family Income | 1,040 | $113,984 |
| Mean Family Income | 1,040 | $122,967 |
| Median Household Income | 1,361 | $108,173 |
| Mean Household Income | 1,361 | $109,861 |
| Income Deficit | 1,040 | $0 |
| Wage / Income Gap (%) | 3,894 | 35.40% |
| Wage / Income Gap ($) | 3,894 | 64.60¢ per $1 |
| Gini / Inequality Index | 3,894 | 0.30 |
Earnings by Sex in Palmer Heights
Average Earnings in Palmer Heights are $53,191, $59,440 for men and $38,397 for women, a difference of 35.4%.
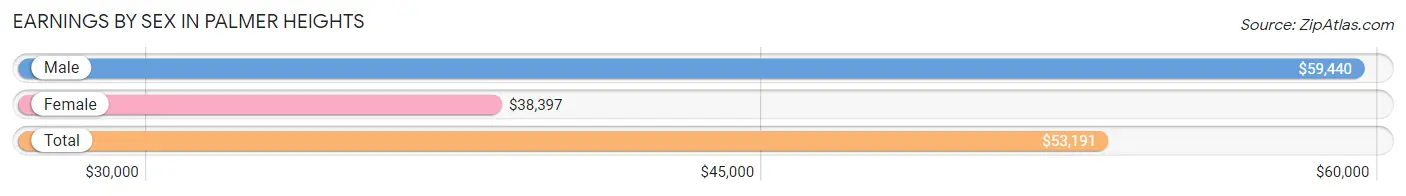
| Sex | Number | Average Earnings |
| Male | 1,092 (53.8%) | $59,440 |
| Female | 938 (46.2%) | $38,397 |
| Total | 2,030 (100.0%) | $53,191 |
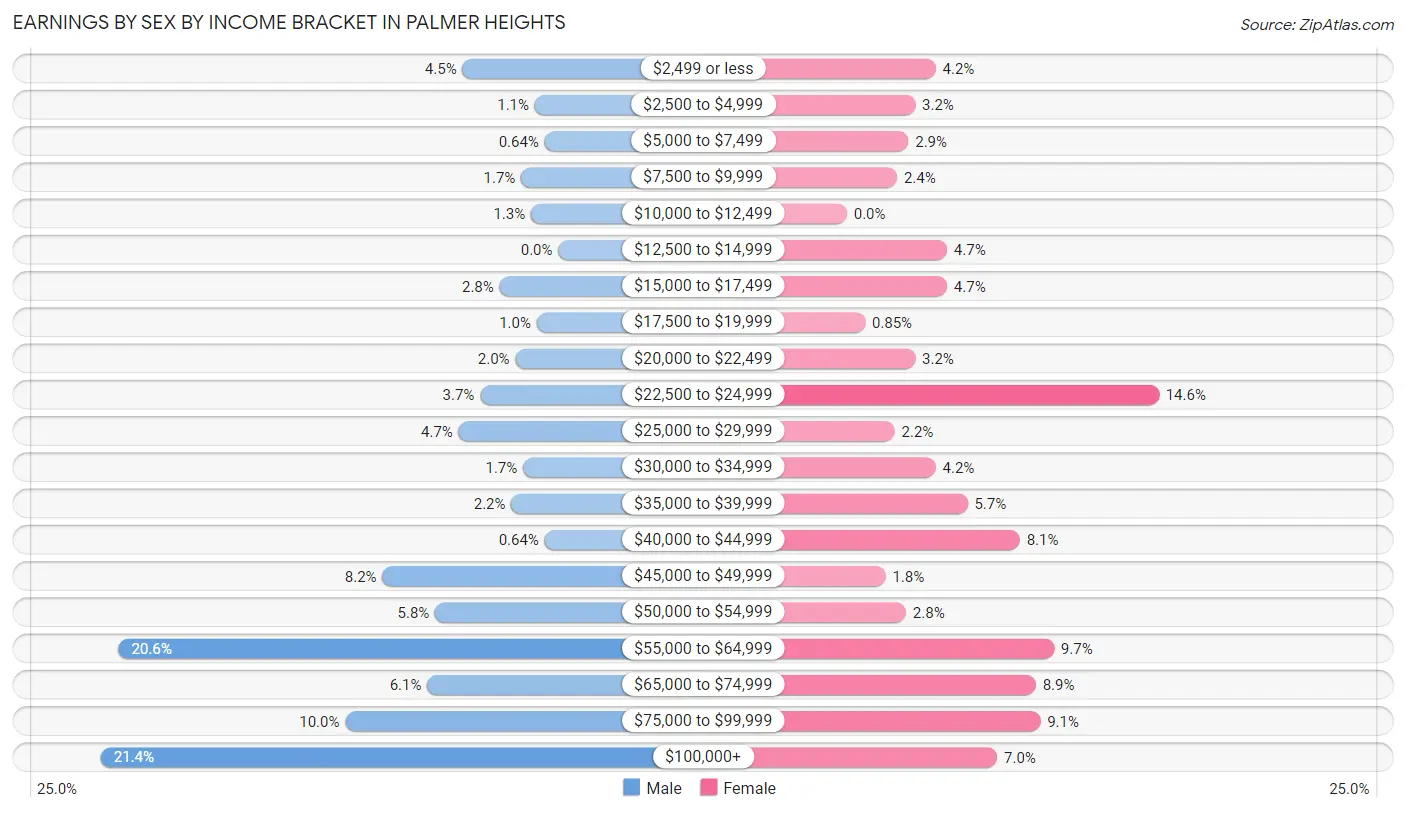
Earnings by Sex by Income Bracket in Palmer Heights
The most common earnings brackets in Palmer Heights are $100,000+ for men (234 | 21.4%) and $22,500 to $24,999 for women (137 | 14.6%).
| Income | Male | Female |
| $2,499 or less | 49 (4.5%) | 39 (4.2%) |
| $2,500 to $4,999 | 12 (1.1%) | 30 (3.2%) |
| $5,000 to $7,499 | 7 (0.6%) | 27 (2.9%) |
| $7,500 to $9,999 | 19 (1.7%) | 22 (2.4%) |
| $10,000 to $12,499 | 14 (1.3%) | 0 (0.0%) |
| $12,500 to $14,999 | 0 (0.0%) | 44 (4.7%) |
| $15,000 to $17,499 | 30 (2.8%) | 44 (4.7%) |
| $17,500 to $19,999 | 11 (1.0%) | 8 (0.9%) |
| $20,000 to $22,499 | 22 (2.0%) | 30 (3.2%) |
| $22,500 to $24,999 | 40 (3.7%) | 137 (14.6%) |
| $25,000 to $29,999 | 51 (4.7%) | 21 (2.2%) |
| $30,000 to $34,999 | 18 (1.7%) | 39 (4.2%) |
| $35,000 to $39,999 | 24 (2.2%) | 53 (5.7%) |
| $40,000 to $44,999 | 7 (0.6%) | 76 (8.1%) |
| $45,000 to $49,999 | 90 (8.2%) | 17 (1.8%) |
| $50,000 to $54,999 | 63 (5.8%) | 26 (2.8%) |
| $55,000 to $64,999 | 225 (20.6%) | 91 (9.7%) |
| $65,000 to $74,999 | 67 (6.1%) | 83 (8.8%) |
| $75,000 to $99,999 | 109 (10.0%) | 85 (9.1%) |
| $100,000+ | 234 (21.4%) | 66 (7.0%) |
| Total | 1,092 (100.0%) | 938 (100.0%) |
Earnings by Sex by Educational Attainment in Palmer Heights
Average earnings in Palmer Heights are $61,089 for men and $40,000 for women, a difference of 34.5%. Men with an educational attainment of bachelor's degree enjoy the highest average annual earnings of $109,844, while those with high school diploma education earn the least with $57,431. Women with an educational attainment of college or associate's degree earn the most with the average annual earnings of $63,393, while those with graduate degree education have the smallest earnings of $24,177.
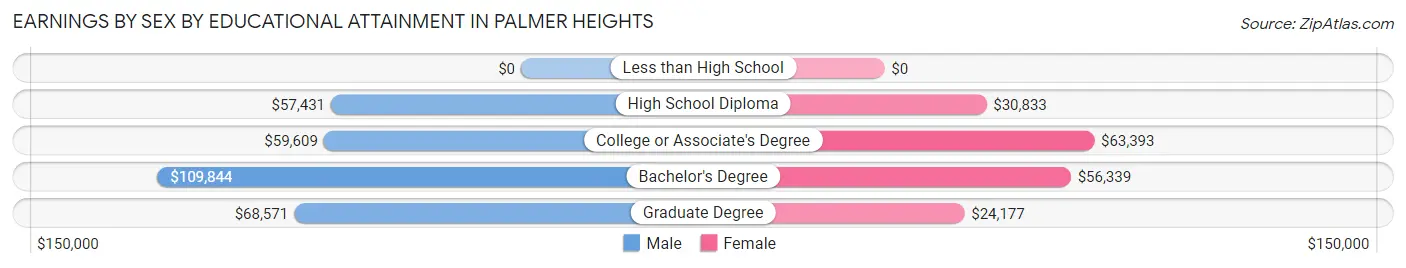
| Educational Attainment | Male Income | Female Income |
| Less than High School | - | - |
| High School Diploma | $57,431 | $30,833 |
| College or Associate's Degree | $59,609 | $63,393 |
| Bachelor's Degree | $109,844 | $56,339 |
| Graduate Degree | $68,571 | $24,177 |
| Total | $61,089 | $40,000 |
Family Income in Palmer Heights
Family Income Brackets in Palmer Heights
According to the Palmer Heights family income data, there are 374 families falling into the $100,000 to $149,999 income range, which is the most common income bracket and makes up 36.0% of all families.
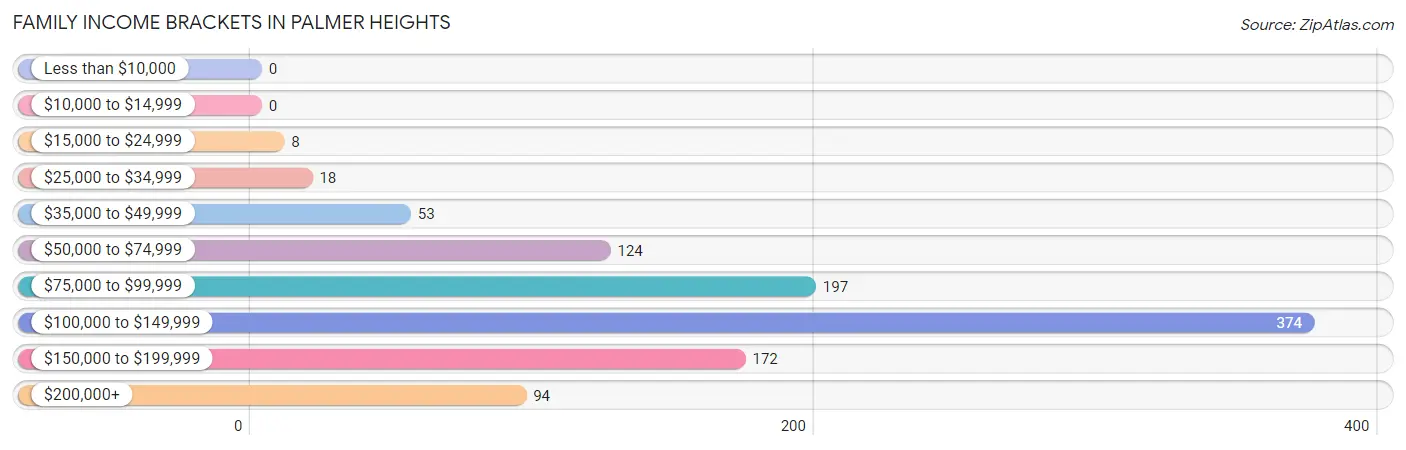
| Income Bracket | # Families | % Families |
| Less than $10,000 | 0 | 0.0% |
| $10,000 to $14,999 | 0 | 0.0% |
| $15,000 to $24,999 | 8 | 0.8% |
| $25,000 to $34,999 | 18 | 1.7% |
| $35,000 to $49,999 | 53 | 5.1% |
| $50,000 to $74,999 | 124 | 11.9% |
| $75,000 to $99,999 | 197 | 18.9% |
| $100,000 to $149,999 | 374 | 36.0% |
| $150,000 to $199,999 | 172 | 16.5% |
| $200,000+ | 94 | 9.0% |
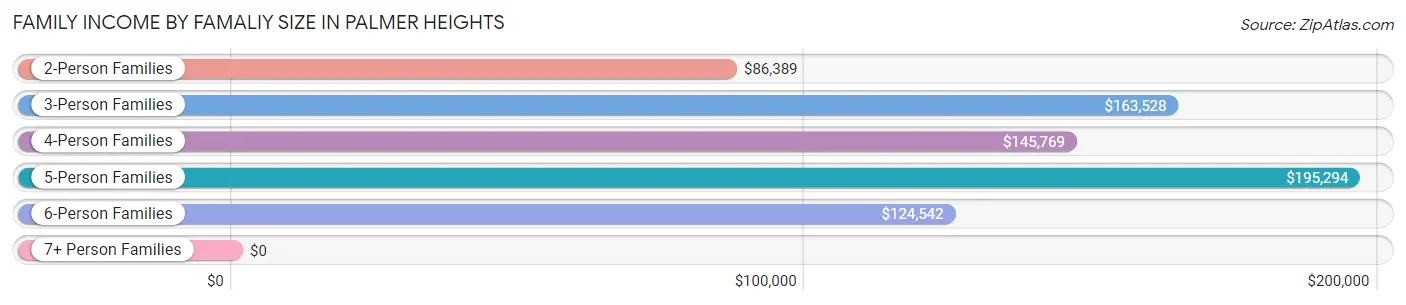
Family Income by Famaliy Size in Palmer Heights
5-person families (30 | 2.9%) account for the highest median family income in Palmer Heights with $195,294 per family, while 3-person families (193 | 18.6%) have the highest median income of $54,509 per family member.
| Income Bracket | # Families | Median Income |
| 2-Person Families | 472 (45.4%) | $86,389 |
| 3-Person Families | 193 (18.6%) | $163,528 |
| 4-Person Families | 296 (28.5%) | $145,769 |
| 5-Person Families | 30 (2.9%) | $195,294 |
| 6-Person Families | 49 (4.7%) | $124,542 |
| 7+ Person Families | 0 (0.0%) | $0 |
| Total | 1,040 (100.0%) | $113,984 |
Family Income by Number of Earners in Palmer Heights
The median family income in Palmer Heights is $113,984, with families comprising 3+ earners (118) having the highest median family income of $171,667, while families with no earners (157) have the lowest median family income of $75,781, accounting for 11.4% and 15.1% of families, respectively.

| Number of Earners | # Families | Median Income |
| No Earners | 157 (15.1%) | $75,781 |
| 1 Earner | 205 (19.7%) | $115,375 |
| 2 Earners | 560 (53.8%) | $121,786 |
| 3+ Earners | 118 (11.4%) | $171,667 |
| Total | 1,040 (100.0%) | $113,984 |
Household Income in Palmer Heights
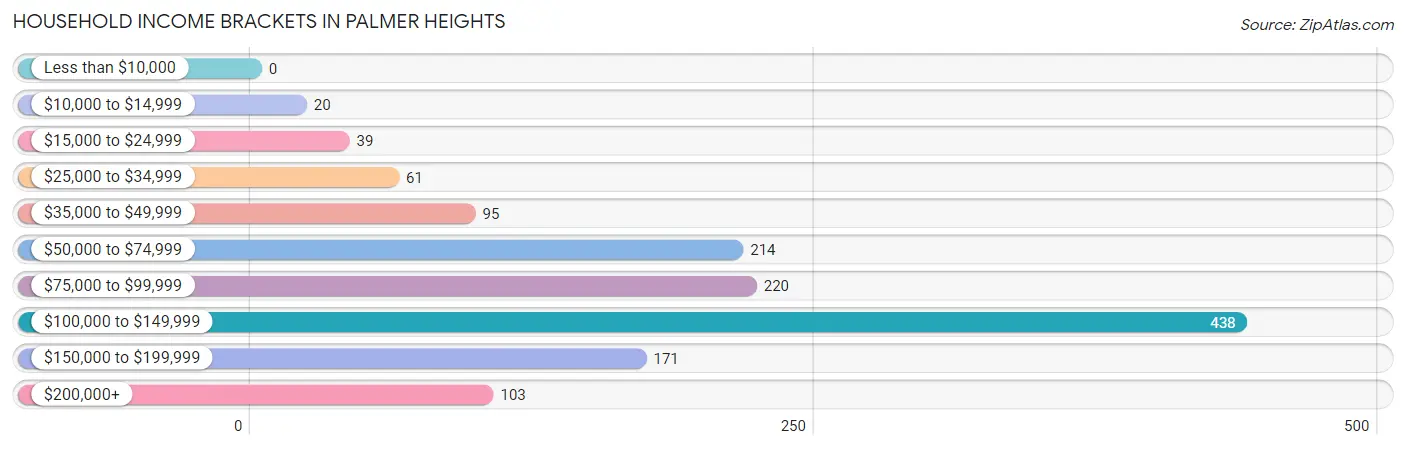
Household Income Brackets in Palmer Heights
With 438 households falling in the category, the $100,000 to $149,999 income range is the most frequent in Palmer Heights, accounting for 32.2% of all households.
| Income Bracket | # Households | % Households |
| Less than $10,000 | 0 | 0.0% |
| $10,000 to $14,999 | 20 | 1.5% |
| $15,000 to $24,999 | 39 | 2.9% |
| $25,000 to $34,999 | 61 | 4.5% |
| $35,000 to $49,999 | 95 | 7.0% |
| $50,000 to $74,999 | 214 | 15.7% |
| $75,000 to $99,999 | 220 | 16.2% |
| $100,000 to $149,999 | 438 | 32.2% |
| $150,000 to $199,999 | 171 | 12.6% |
| $200,000+ | 103 | 7.6% |
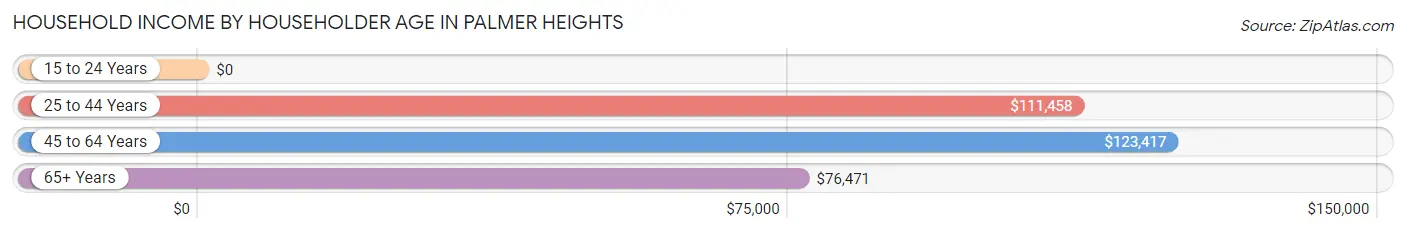
Household Income by Householder Age in Palmer Heights
The median household income in Palmer Heights is $108,173, with the highest median household income of $123,417 found in the 45 to 64 years age bracket for the primary householder. A total of 592 households (43.5%) fall into this category.
| Income Bracket | # Households | Median Income |
| 15 to 24 Years | 0 (0.0%) | $0 |
| 25 to 44 Years | 243 (17.8%) | $111,458 |
| 45 to 64 Years | 592 (43.5%) | $123,417 |
| 65+ Years | 526 (38.7%) | $76,471 |
| Total | 1,361 (100.0%) | $108,173 |
Poverty in Palmer Heights
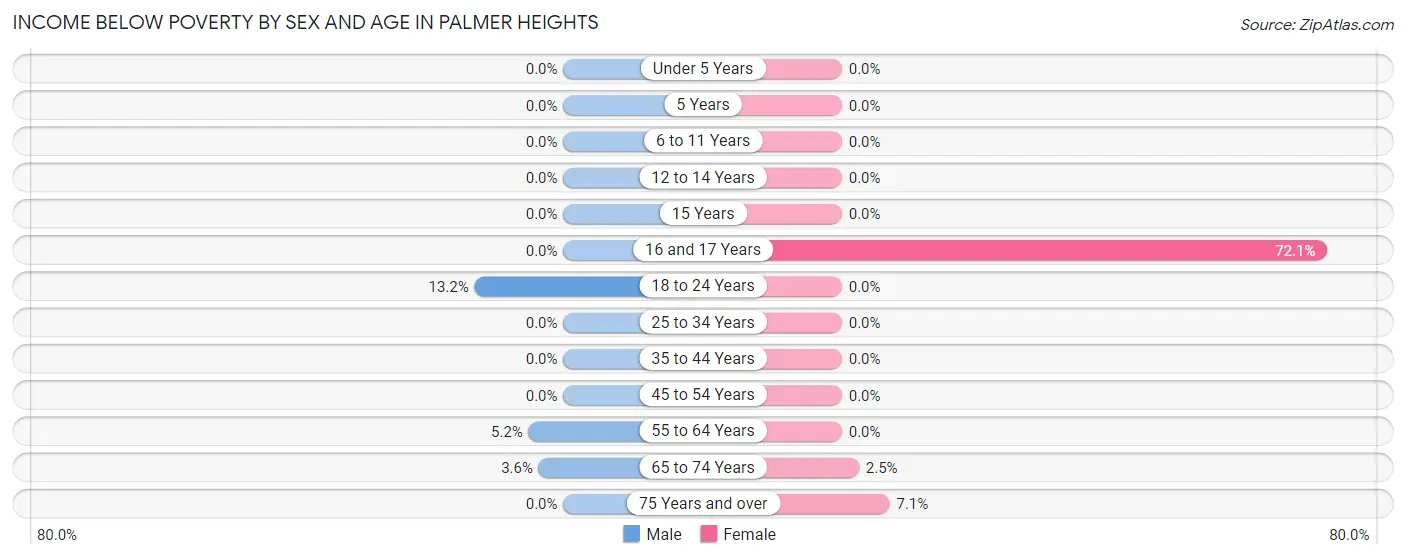
Income Below Poverty by Sex and Age in Palmer Heights
With 1.6% poverty level for males and 2.9% for females among the residents of Palmer Heights, 18 to 24 year old males and 16 and 17 year old females are the most vulnerable to poverty, with 12 males (13.2%) and 31 females (72.1%) in their respective age groups living below the poverty level.
| Age Bracket | Male | Female |
| Under 5 Years | 0 (0.0%) | 0 (0.0%) |
| 5 Years | 0 (0.0%) | 0 (0.0%) |
| 6 to 11 Years | 0 (0.0%) | 0 (0.0%) |
| 12 to 14 Years | 0 (0.0%) | 0 (0.0%) |
| 15 Years | 0 (0.0%) | 0 (0.0%) |
| 16 and 17 Years | 0 (0.0%) | 31 (72.1%) |
| 18 to 24 Years | 12 (13.2%) | 0 (0.0%) |
| 25 to 34 Years | 0 (0.0%) | 0 (0.0%) |
| 35 to 44 Years | 0 (0.0%) | 0 (0.0%) |
| 45 to 54 Years | 0 (0.0%) | 0 (0.0%) |
| 55 to 64 Years | 12 (5.1%) | 0 (0.0%) |
| 65 to 74 Years | 8 (3.6%) | 8 (2.5%) |
| 75 Years and over | 0 (0.0%) | 9 (7.1%) |
| Total | 32 (1.6%) | 48 (2.9%) |
Income Above Poverty by Sex and Age in Palmer Heights
According to the poverty statistics in Palmer Heights, males aged under 5 years and females aged under 5 years are the age groups that are most secure financially, with 100.0% of males and 100.0% of females in these age groups living above the poverty line.
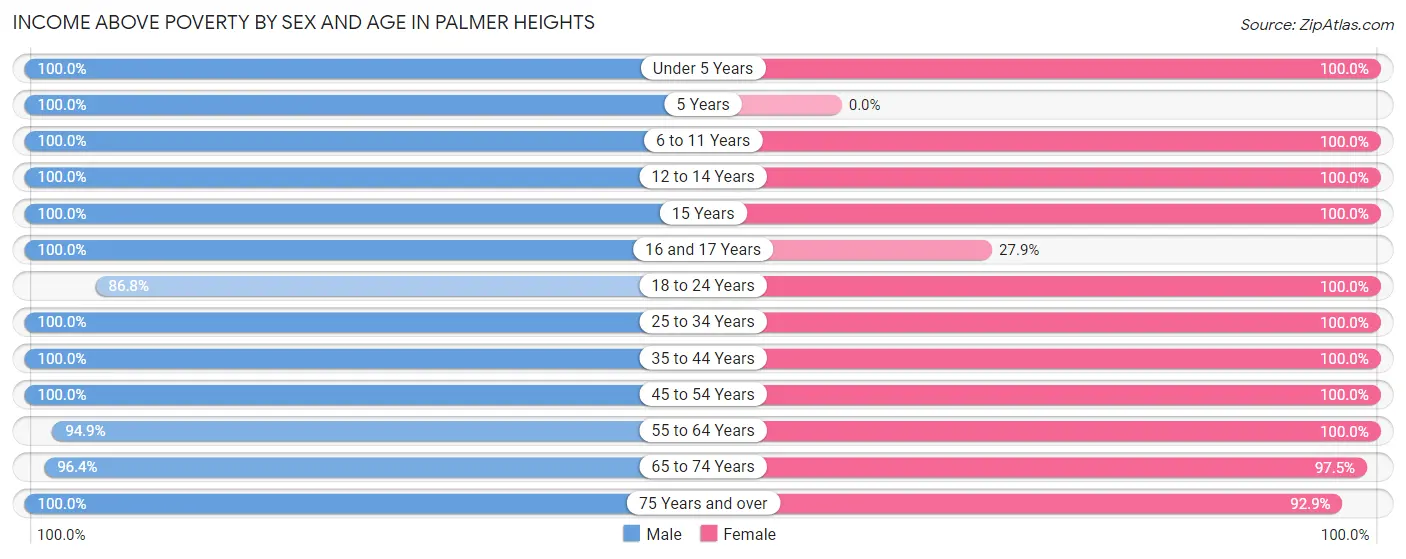
| Age Bracket | Male | Female |
| Under 5 Years | 63 (100.0%) | 99 (100.0%) |
| 5 Years | 20 (100.0%) | 0 (0.0%) |
| 6 to 11 Years | 102 (100.0%) | 70 (100.0%) |
| 12 to 14 Years | 274 (100.0%) | 60 (100.0%) |
| 15 Years | 47 (100.0%) | 20 (100.0%) |
| 16 and 17 Years | 31 (100.0%) | 12 (27.9%) |
| 18 to 24 Years | 79 (86.8%) | 50 (100.0%) |
| 25 to 34 Years | 243 (100.0%) | 126 (100.0%) |
| 35 to 44 Years | 159 (100.0%) | 186 (100.0%) |
| 45 to 54 Years | 327 (100.0%) | 329 (100.0%) |
| 55 to 64 Years | 221 (94.9%) | 231 (100.0%) |
| 65 to 74 Years | 212 (96.4%) | 308 (97.5%) |
| 75 Years and over | 200 (100.0%) | 118 (92.9%) |
| Total | 1,978 (98.4%) | 1,609 (97.1%) |
Income Below Poverty Among Married-Couple Families in Palmer Heights
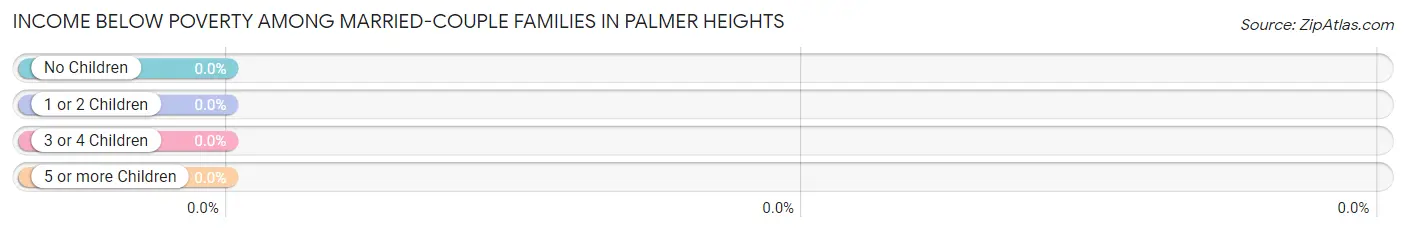
| Children | Above Poverty | Below Poverty |
| No Children | 501 (100.0%) | 0 (0.0%) |
| 1 or 2 Children | 425 (100.0%) | 0 (0.0%) |
| 3 or 4 Children | 0 (0.0%) | 0 (0.0%) |
| 5 or more Children | 0 (0.0%) | 0 (0.0%) |
| Total | 926 (100.0%) | 0 (0.0%) |
Income Below Poverty Among Single-Parent Households in Palmer Heights
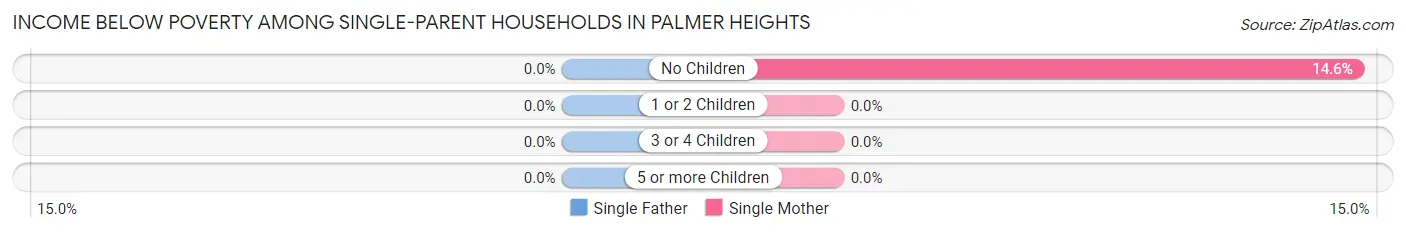
| Children | Single Father | Single Mother |
| No Children | 0 (0.0%) | 8 (14.5%) |
| 1 or 2 Children | 0 (0.0%) | 0 (0.0%) |
| 3 or 4 Children | 0 (0.0%) | 0 (0.0%) |
| 5 or more Children | 0 (0.0%) | 0 (0.0%) |
| Total | 0 (0.0%) | 8 (8.8%) |
Income Below Poverty Among Married-Couple vs Single-Parent Households in Palmer Heights
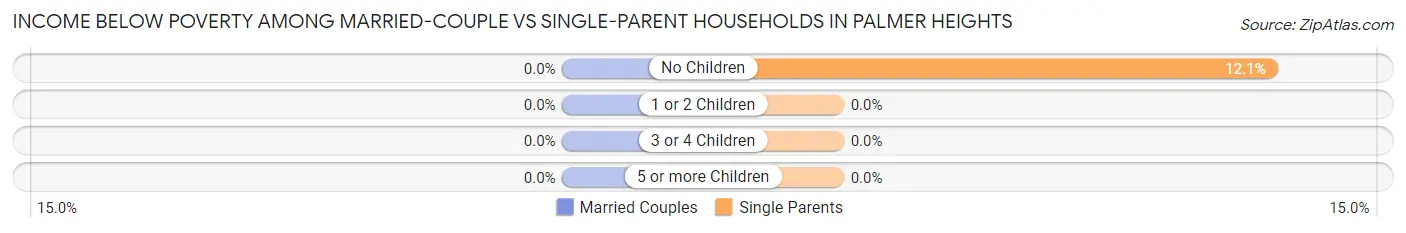
| Children | Married-Couple Families | Single-Parent Households |
| No Children | 0 (0.0%) | 8 (12.1%) |
| 1 or 2 Children | 0 (0.0%) | 0 (0.0%) |
| 3 or 4 Children | 0 (0.0%) | 0 (0.0%) |
| 5 or more Children | 0 (0.0%) | 0 (0.0%) |
| Total | 0 (0.0%) | 8 (7.0%) |
Employment Characteristics in Palmer Heights
Employment by Class of Employer in Palmer Heights
Among the 1,805 employed individuals in Palmer Heights, private company employees (1,046 | 58.0%), not-for-profit organizations (252 | 14.0%), and local government employees (188 | 10.4%) make up the most common classes of employment.
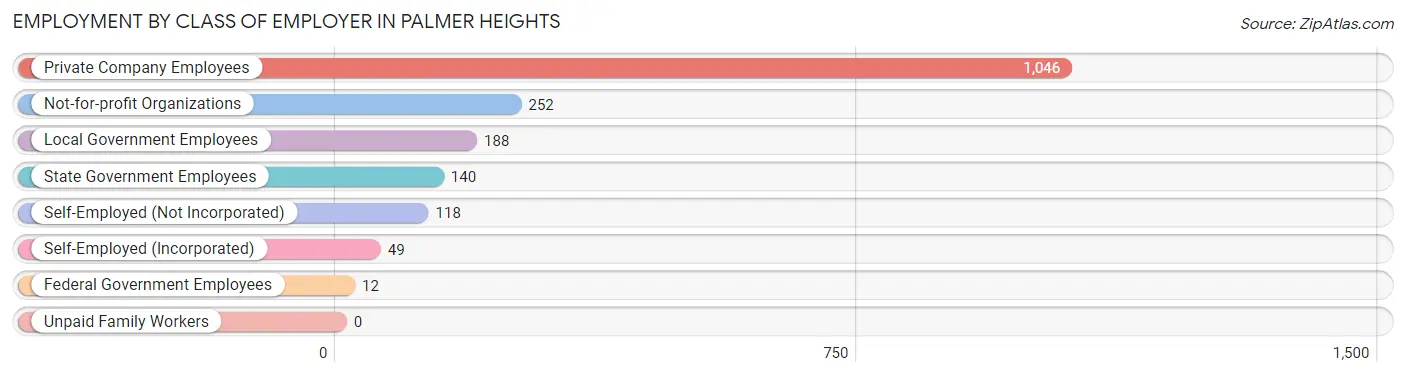
| Employer Class | # Employees | % Employees |
| Private Company Employees | 1,046 | 58.0% |
| Self-Employed (Incorporated) | 49 | 2.7% |
| Self-Employed (Not Incorporated) | 118 | 6.5% |
| Not-for-profit Organizations | 252 | 14.0% |
| Local Government Employees | 188 | 10.4% |
| State Government Employees | 140 | 7.8% |
| Federal Government Employees | 12 | 0.7% |
| Unpaid Family Workers | 0 | 0.0% |
| Total | 1,805 | 100.0% |
Employment Status by Age in Palmer Heights
According to the labor force statistics for Palmer Heights, out of the total population over 16 years of age (3,139), 62.9% or 1,974 individuals are in the labor force, with 6.8% or 134 of them unemployed. The age group with the highest labor force participation rate is 30 to 34 years, with 100.0% or 209 individuals in the labor force. Within the labor force, the 25 to 29 years age range has the highest percentage of unemployed individuals, with 23.4% or 36 of them being unemployed.
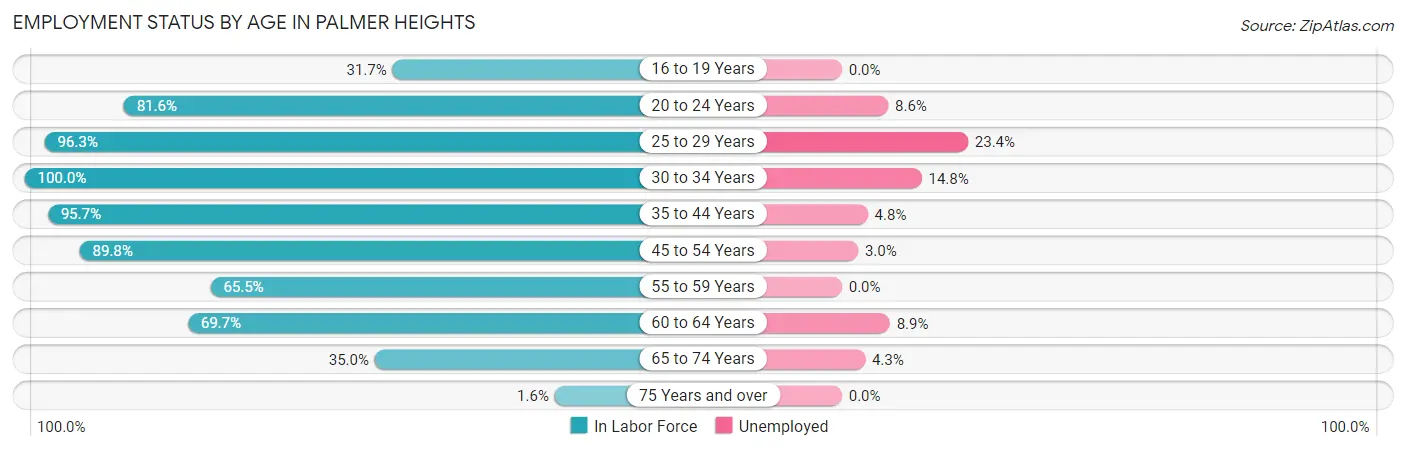
| Age Bracket | In Labor Force | Unemployed |
| 16 to 19 Years | 32 (31.7%) | 0 (0.0%) |
| 20 to 24 Years | 93 (81.6%) | 8 (8.6%) |
| 25 to 29 Years | 154 (96.3%) | 36 (23.4%) |
| 30 to 34 Years | 209 (100.0%) | 31 (14.8%) |
| 35 to 44 Years | 330 (95.7%) | 16 (4.8%) |
| 45 to 54 Years | 600 (89.8%) | 18 (3.0%) |
| 55 to 59 Years | 148 (65.5%) | 0 (0.0%) |
| 60 to 64 Years | 191 (69.7%) | 17 (8.9%) |
| 65 to 74 Years | 209 (35.0%) | 9 (4.3%) |
| 75 Years and over | 7 (1.6%) | 0 (0.0%) |
| Total | 1,974 (62.9%) | 134 (6.8%) |
Employment Status by Educational Attainment in Palmer Heights
According to labor force statistics for Palmer Heights, 86.7% of individuals (1,632) out of the total population between 25 and 64 years of age (1,882) are in the labor force, with 7.2% or 118 of them being unemployed. The group with the highest labor force participation rate are those with the educational attainment of bachelor's degree or higher, with 95.9% or 608 individuals in the labor force. Within the labor force, individuals with less than high school education have the highest percentage of unemployment, with 23.1% or 9 of them being unemployed.
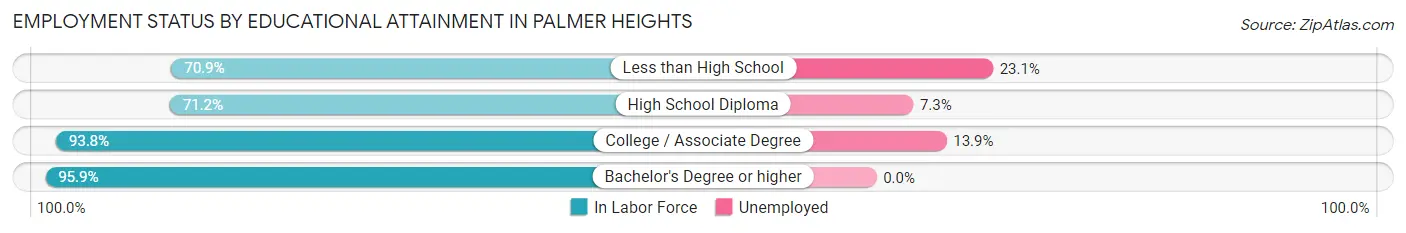
| Educational Attainment | In Labor Force | Unemployed |
| Less than High School | 39 (70.9%) | 13 (23.1%) |
| High School Diploma | 423 (71.2%) | 43 (7.3%) |
| College / Associate Degree | 562 (93.8%) | 83 (13.9%) |
| Bachelor's Degree or higher | 608 (95.9%) | 0 (0.0%) |
| Total | 1,632 (86.7%) | 136 (7.2%) |
Employment Occupations by Sex in Palmer Heights
Management, Business, Science and Arts Occupations
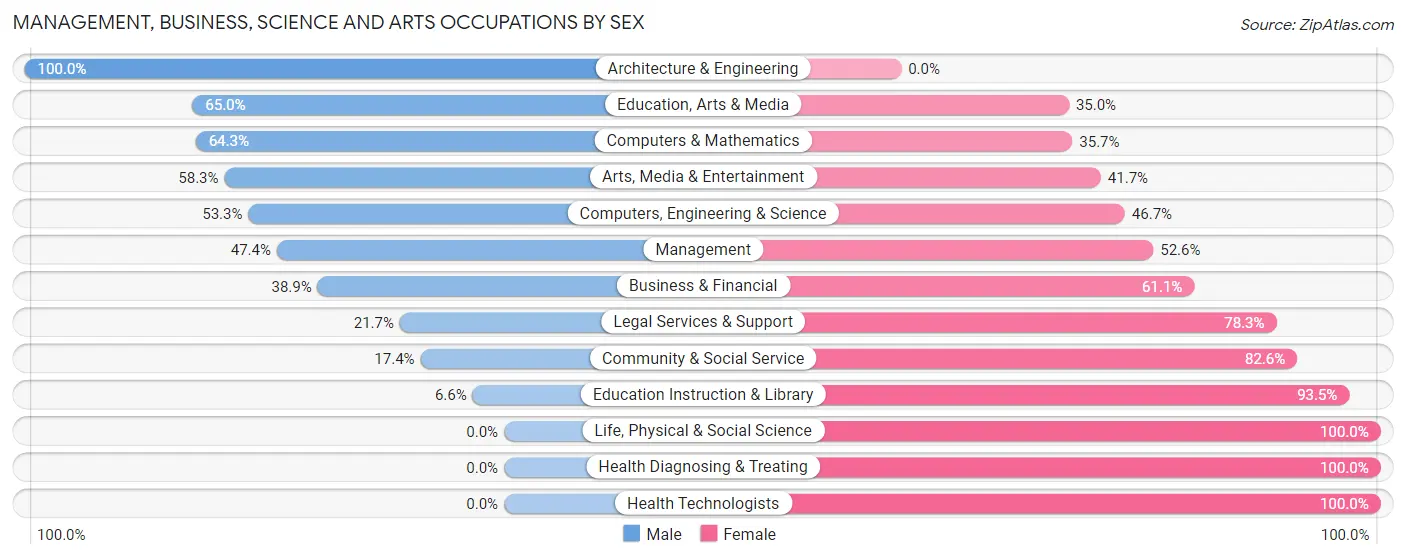
The most common Management, Business, Science and Arts occupations in Palmer Heights are Community & Social Service (304 | 16.5%), Education Instruction & Library (229 | 12.5%), Management (154 | 8.4%), Business & Financial (90 | 4.9%), and Health Diagnosing & Treating (64 | 3.5%).
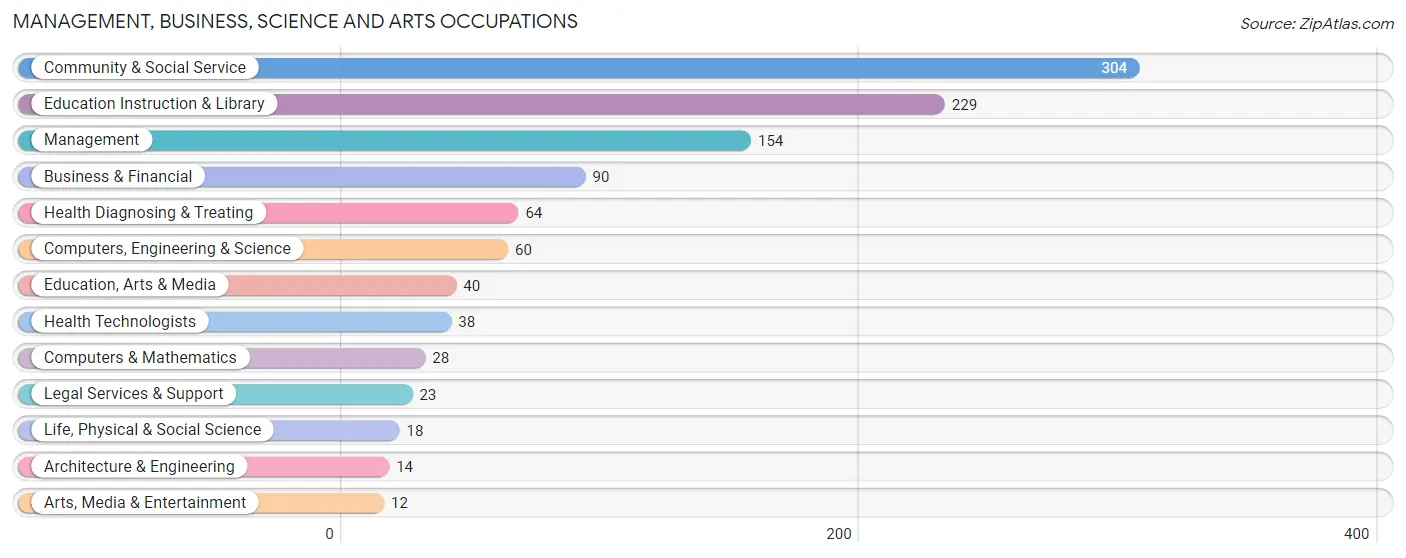
Management, Business, Science and Arts Occupations by Sex
Within the Management, Business, Science and Arts occupations in Palmer Heights, the most male-oriented occupations are Architecture & Engineering (100.0%), Education, Arts & Media (65.0%), and Computers & Mathematics (64.3%), while the most female-oriented occupations are Life, Physical & Social Science (100.0%), Health Diagnosing & Treating (100.0%), and Health Technologists (100.0%).
| Occupation | Male | Female |
| Management | 73 (47.4%) | 81 (52.6%) |
| Business & Financial | 35 (38.9%) | 55 (61.1%) |
| Computers, Engineering & Science | 32 (53.3%) | 28 (46.7%) |
| Computers & Mathematics | 18 (64.3%) | 10 (35.7%) |
| Architecture & Engineering | 14 (100.0%) | 0 (0.0%) |
| Life, Physical & Social Science | 0 (0.0%) | 18 (100.0%) |
| Community & Social Service | 53 (17.4%) | 251 (82.6%) |
| Education, Arts & Media | 26 (65.0%) | 14 (35.0%) |
| Legal Services & Support | 5 (21.7%) | 18 (78.3%) |
| Education Instruction & Library | 15 (6.6%) | 214 (93.4%) |
| Arts, Media & Entertainment | 7 (58.3%) | 5 (41.7%) |
| Health Diagnosing & Treating | 0 (0.0%) | 64 (100.0%) |
| Health Technologists | 0 (0.0%) | 38 (100.0%) |
| Total (Category) | 193 (28.7%) | 479 (71.3%) |
| Total (Overall) | 959 (52.2%) | 879 (47.8%) |
Services Occupations
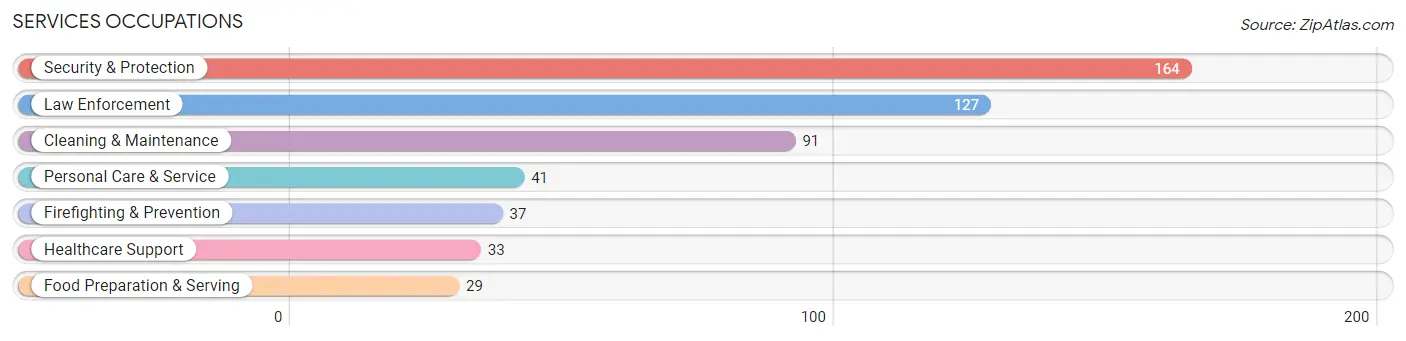
The most common Services occupations in Palmer Heights are Security & Protection (164 | 8.9%), Law Enforcement (127 | 6.9%), Cleaning & Maintenance (91 | 5.0%), Personal Care & Service (41 | 2.2%), and Firefighting & Prevention (37 | 2.0%).
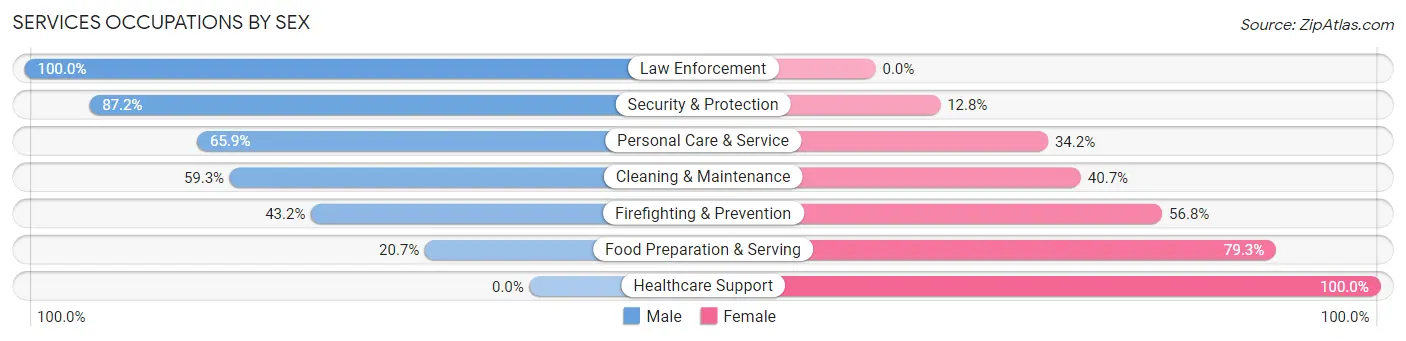
Services Occupations by Sex
Within the Services occupations in Palmer Heights, the most male-oriented occupations are Law Enforcement (100.0%), Security & Protection (87.2%), and Personal Care & Service (65.8%), while the most female-oriented occupations are Healthcare Support (100.0%), Food Preparation & Serving (79.3%), and Firefighting & Prevention (56.8%).
| Occupation | Male | Female |
| Healthcare Support | 0 (0.0%) | 33 (100.0%) |
| Security & Protection | 143 (87.2%) | 21 (12.8%) |
| Firefighting & Prevention | 16 (43.2%) | 21 (56.8%) |
| Law Enforcement | 127 (100.0%) | 0 (0.0%) |
| Food Preparation & Serving | 6 (20.7%) | 23 (79.3%) |
| Cleaning & Maintenance | 54 (59.3%) | 37 (40.7%) |
| Personal Care & Service | 27 (65.8%) | 14 (34.2%) |
| Total (Category) | 230 (64.2%) | 128 (35.7%) |
| Total (Overall) | 959 (52.2%) | 879 (47.8%) |
Sales and Office Occupations
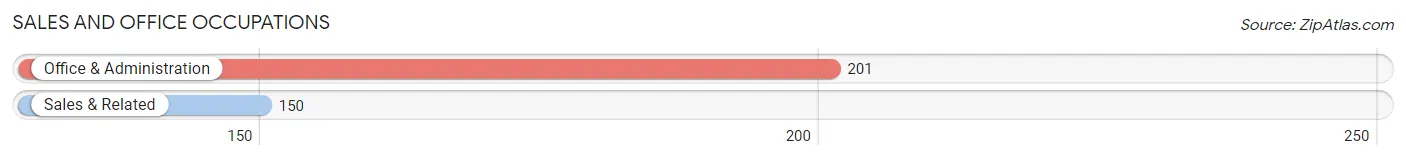
The most common Sales and Office occupations in Palmer Heights are Office & Administration (201 | 10.9%), and Sales & Related (150 | 8.2%).
Sales and Office Occupations by Sex
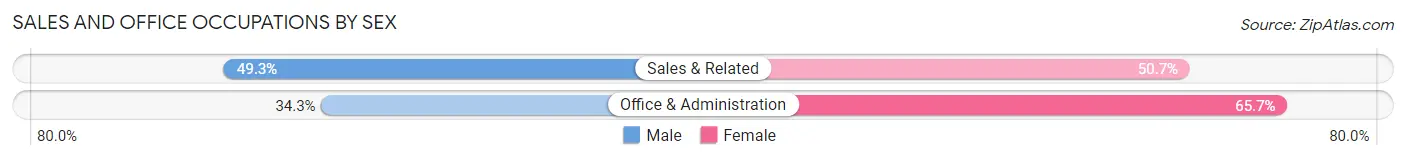
| Occupation | Male | Female |
| Sales & Related | 74 (49.3%) | 76 (50.7%) |
| Office & Administration | 69 (34.3%) | 132 (65.7%) |
| Total (Category) | 143 (40.7%) | 208 (59.3%) |
| Total (Overall) | 959 (52.2%) | 879 (47.8%) |
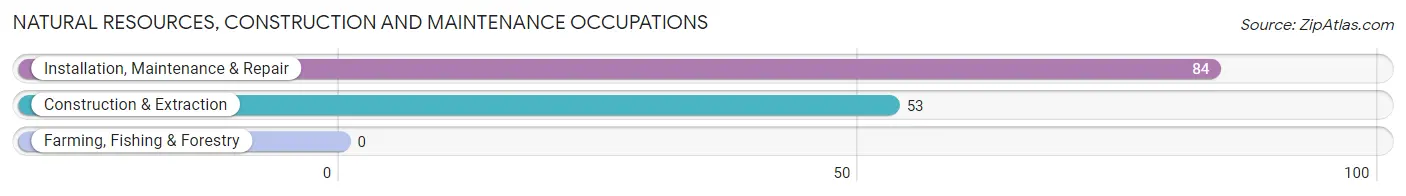
Natural Resources, Construction and Maintenance Occupations
The most common Natural Resources, Construction and Maintenance occupations in Palmer Heights are Installation, Maintenance & Repair (84 | 4.6%), and Construction & Extraction (53 | 2.9%).
Natural Resources, Construction and Maintenance Occupations by Sex
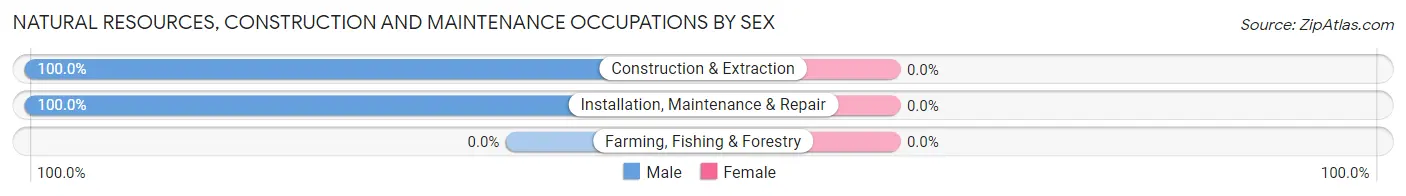
| Occupation | Male | Female |
| Farming, Fishing & Forestry | 0 (0.0%) | 0 (0.0%) |
| Construction & Extraction | 53 (100.0%) | 0 (0.0%) |
| Installation, Maintenance & Repair | 84 (100.0%) | 0 (0.0%) |
| Total (Category) | 137 (100.0%) | 0 (0.0%) |
| Total (Overall) | 959 (52.2%) | 879 (47.8%) |
Production, Transportation and Moving Occupations
The most common Production, Transportation and Moving occupations in Palmer Heights are Production (176 | 9.6%), Material Moving (86 | 4.7%), and Transportation (58 | 3.2%).

Production, Transportation and Moving Occupations by Sex
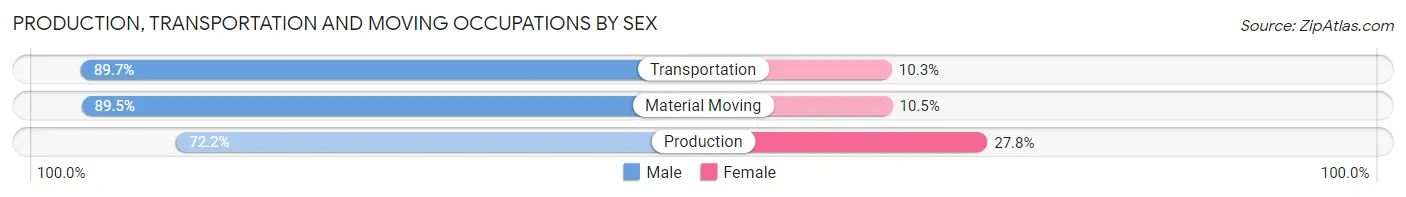
| Occupation | Male | Female |
| Production | 127 (72.2%) | 49 (27.8%) |
| Transportation | 52 (89.7%) | 6 (10.3%) |
| Material Moving | 77 (89.5%) | 9 (10.5%) |
| Total (Category) | 256 (80.0%) | 64 (20.0%) |
| Total (Overall) | 959 (52.2%) | 879 (47.8%) |
Employment Industries by Sex in Palmer Heights
Employment Industries in Palmer Heights
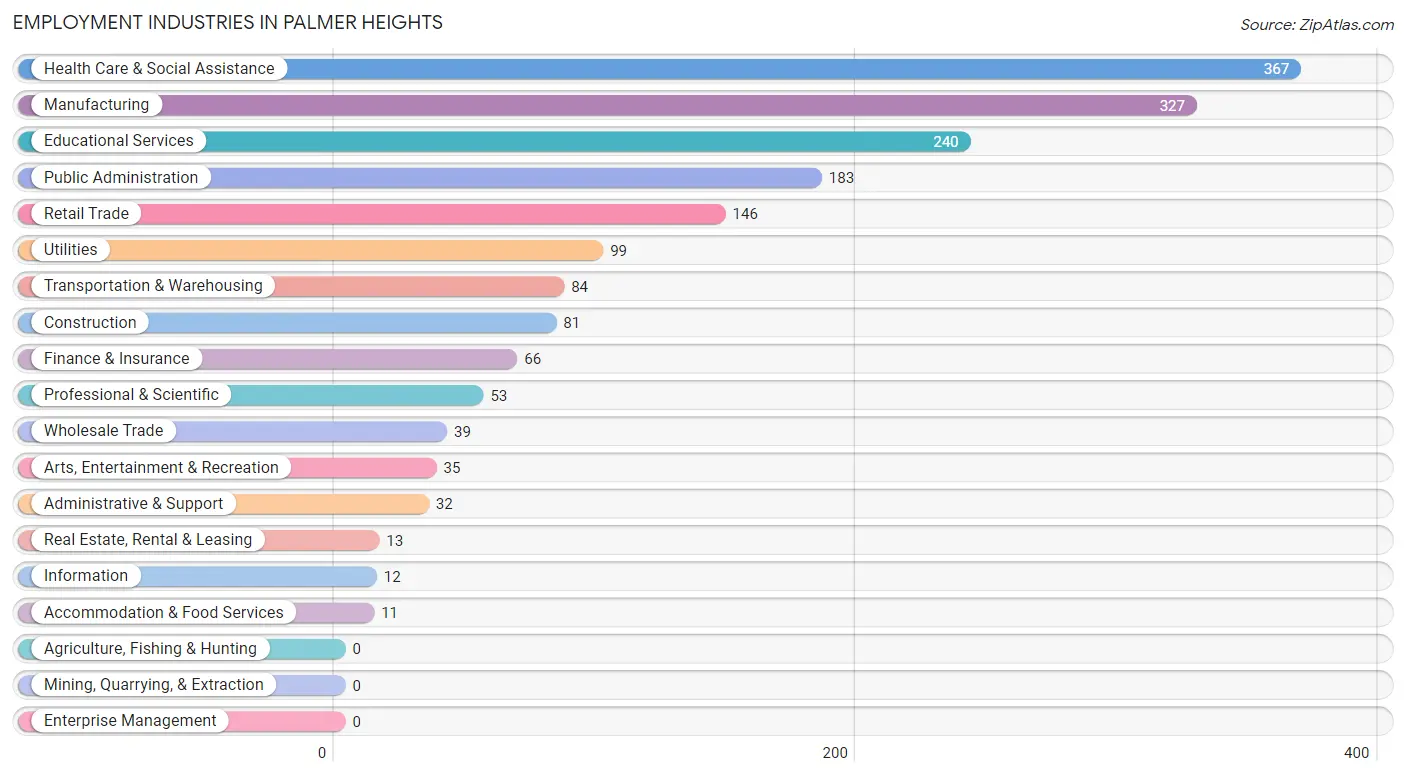
The major employment industries in Palmer Heights include Health Care & Social Assistance (367 | 20.0%), Manufacturing (327 | 17.8%), Educational Services (240 | 13.1%), Public Administration (183 | 10.0%), and Retail Trade (146 | 7.9%).
Employment Industries by Sex in Palmer Heights
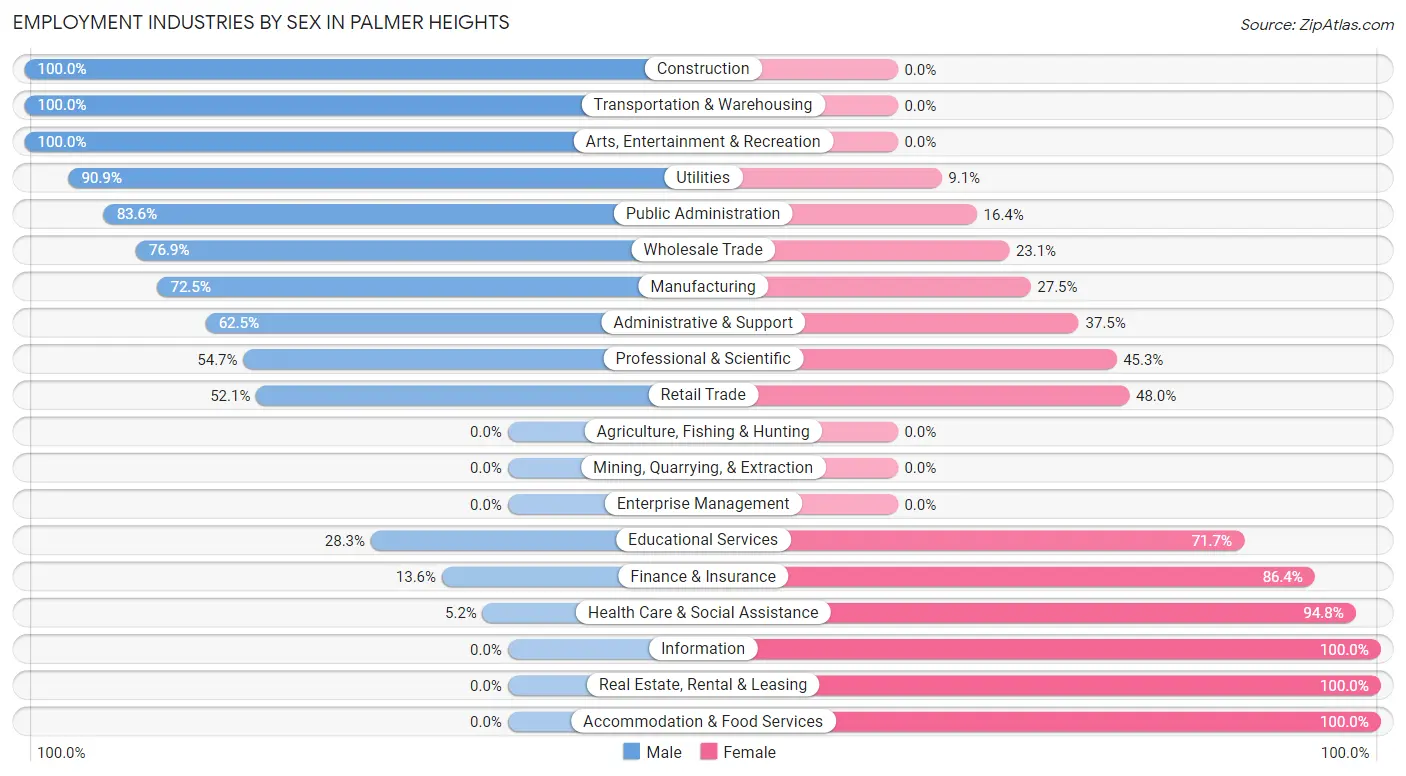
The Palmer Heights industries that see more men than women are Construction (100.0%), Transportation & Warehousing (100.0%), and Arts, Entertainment & Recreation (100.0%), whereas the industries that tend to have a higher number of women are Information (100.0%), Real Estate, Rental & Leasing (100.0%), and Accommodation & Food Services (100.0%).
| Industry | Male | Female |
| Agriculture, Fishing & Hunting | 0 (0.0%) | 0 (0.0%) |
| Mining, Quarrying, & Extraction | 0 (0.0%) | 0 (0.0%) |
| Construction | 81 (100.0%) | 0 (0.0%) |
| Manufacturing | 237 (72.5%) | 90 (27.5%) |
| Wholesale Trade | 30 (76.9%) | 9 (23.1%) |
| Retail Trade | 76 (52.0%) | 70 (47.9%) |
| Transportation & Warehousing | 84 (100.0%) | 0 (0.0%) |
| Utilities | 90 (90.9%) | 9 (9.1%) |
| Information | 0 (0.0%) | 12 (100.0%) |
| Finance & Insurance | 9 (13.6%) | 57 (86.4%) |
| Real Estate, Rental & Leasing | 0 (0.0%) | 13 (100.0%) |
| Professional & Scientific | 29 (54.7%) | 24 (45.3%) |
| Enterprise Management | 0 (0.0%) | 0 (0.0%) |
| Administrative & Support | 20 (62.5%) | 12 (37.5%) |
| Educational Services | 68 (28.3%) | 172 (71.7%) |
| Health Care & Social Assistance | 19 (5.2%) | 348 (94.8%) |
| Arts, Entertainment & Recreation | 35 (100.0%) | 0 (0.0%) |
| Accommodation & Food Services | 0 (0.0%) | 11 (100.0%) |
| Public Administration | 153 (83.6%) | 30 (16.4%) |
| Total | 959 (52.2%) | 879 (47.8%) |
Education in Palmer Heights
School Enrollment in Palmer Heights
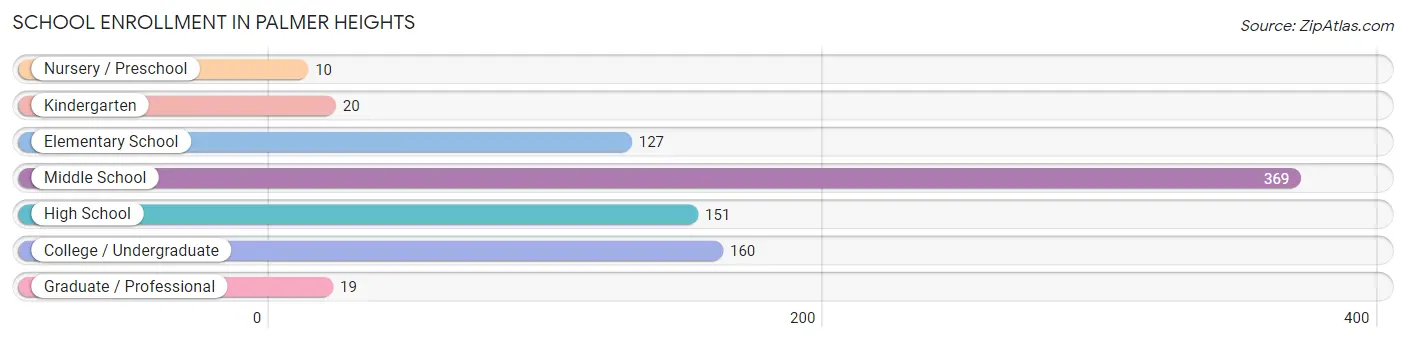
The most common levels of schooling among the 856 students in Palmer Heights are middle school (369 | 43.1%), college / undergraduate (160 | 18.7%), and high school (151 | 17.6%).
| School Level | # Students | % Students |
| Nursery / Preschool | 10 | 1.2% |
| Kindergarten | 20 | 2.3% |
| Elementary School | 127 | 14.8% |
| Middle School | 369 | 43.1% |
| High School | 151 | 17.6% |
| College / Undergraduate | 160 | 18.7% |
| Graduate / Professional | 19 | 2.2% |
| Total | 856 | 100.0% |
School Enrollment by Age by Funding Source in Palmer Heights
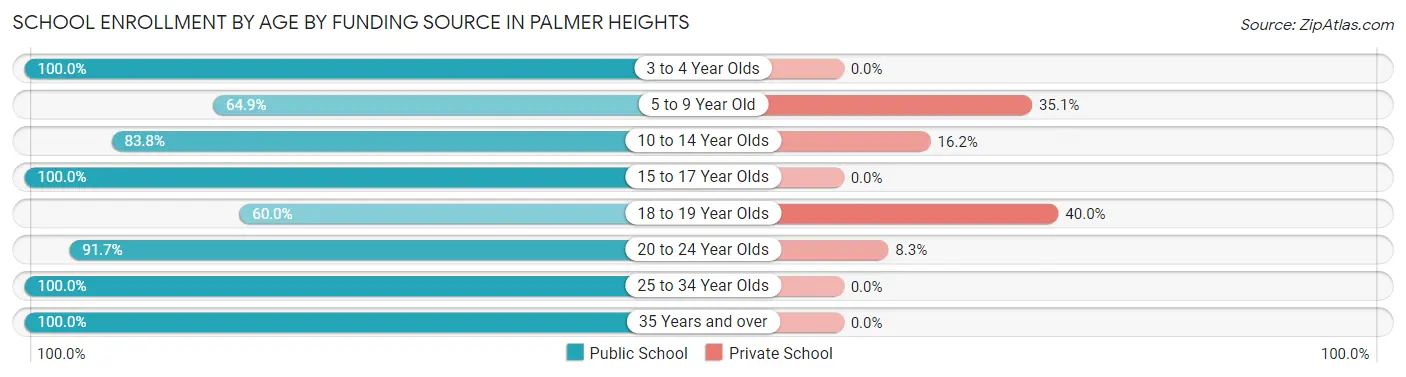
Out of a total of 856 students who are enrolled in schools in Palmer Heights, 122 (14.3%) attend a private institution, while the remaining 734 (85.7%) are enrolled in public schools. The age group of 18 to 19 year olds has the highest likelihood of being enrolled in private schools, with 6 (40.0% in the age bracket) enrolled. Conversely, the age group of 3 to 4 year olds has the lowest likelihood of being enrolled in a private school, with 10 (100.0% in the age bracket) attending a public institution.
| Age Bracket | Public School | Private School |
| 3 to 4 Year Olds | 10 (100.0%) | 0 (0.0%) |
| 5 to 9 Year Old | 85 (64.9%) | 46 (35.1%) |
| 10 to 14 Year Olds | 331 (83.8%) | 64 (16.2%) |
| 15 to 17 Year Olds | 141 (100.0%) | 0 (0.0%) |
| 18 to 19 Year Olds | 9 (60.0%) | 6 (40.0%) |
| 20 to 24 Year Olds | 66 (91.7%) | 6 (8.3%) |
| 25 to 34 Year Olds | 62 (100.0%) | 0 (0.0%) |
| 35 Years and over | 30 (100.0%) | 0 (0.0%) |
| Total | 734 (85.7%) | 122 (14.3%) |
Educational Attainment by Field of Study in Palmer Heights
Education (287 | 29.5%), business (172 | 17.7%), arts & humanities (159 | 16.4%), engineering (101 | 10.4%), and psychology (65 | 6.7%) are the most common fields of study among 972 individuals in Palmer Heights who have obtained a bachelor's degree or higher.
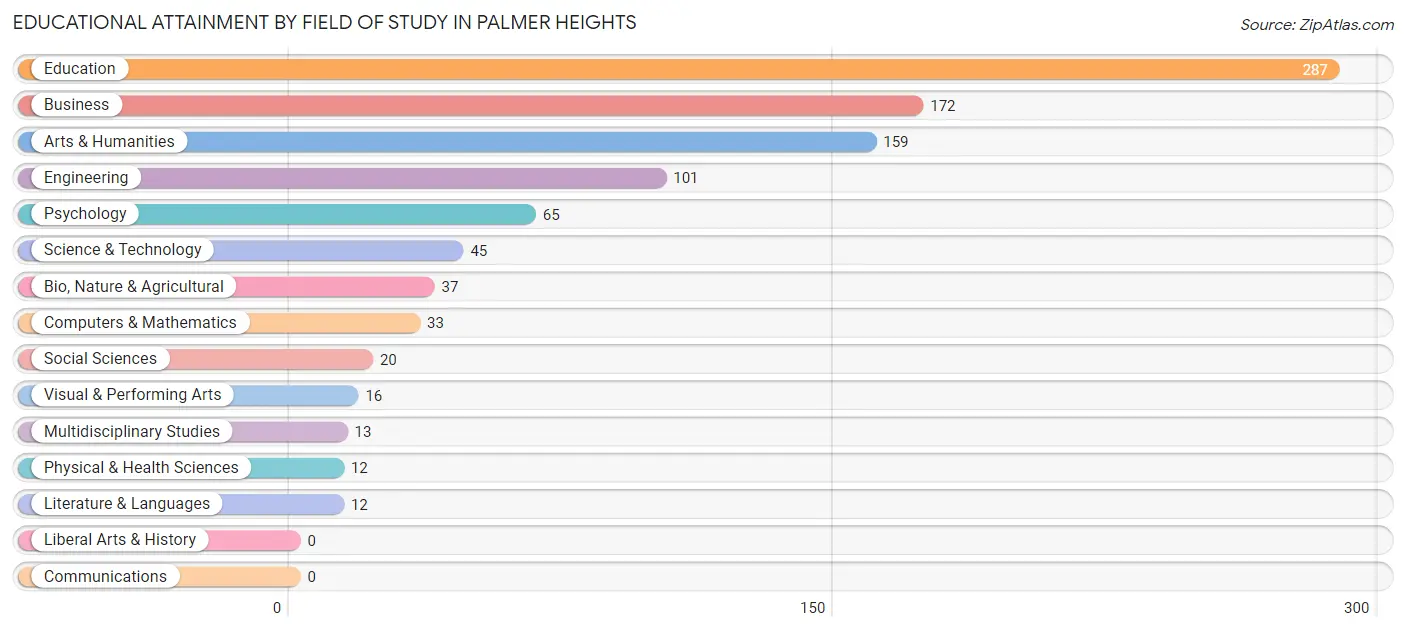
| Field of Study | # Graduates | % Graduates |
| Computers & Mathematics | 33 | 3.4% |
| Bio, Nature & Agricultural | 37 | 3.8% |
| Physical & Health Sciences | 12 | 1.2% |
| Psychology | 65 | 6.7% |
| Social Sciences | 20 | 2.1% |
| Engineering | 101 | 10.4% |
| Multidisciplinary Studies | 13 | 1.3% |
| Science & Technology | 45 | 4.6% |
| Business | 172 | 17.7% |
| Education | 287 | 29.5% |
| Literature & Languages | 12 | 1.2% |
| Liberal Arts & History | 0 | 0.0% |
| Visual & Performing Arts | 16 | 1.7% |
| Communications | 0 | 0.0% |
| Arts & Humanities | 159 | 16.4% |
| Total | 972 | 100.0% |
Transportation & Commute in Palmer Heights
Vehicle Availability by Sex in Palmer Heights
The most prevalent vehicle ownership categories in Palmer Heights are males with 2 vehicles (456, accounting for 48.9%) and females with 2 vehicles (453, making up 52.3%).
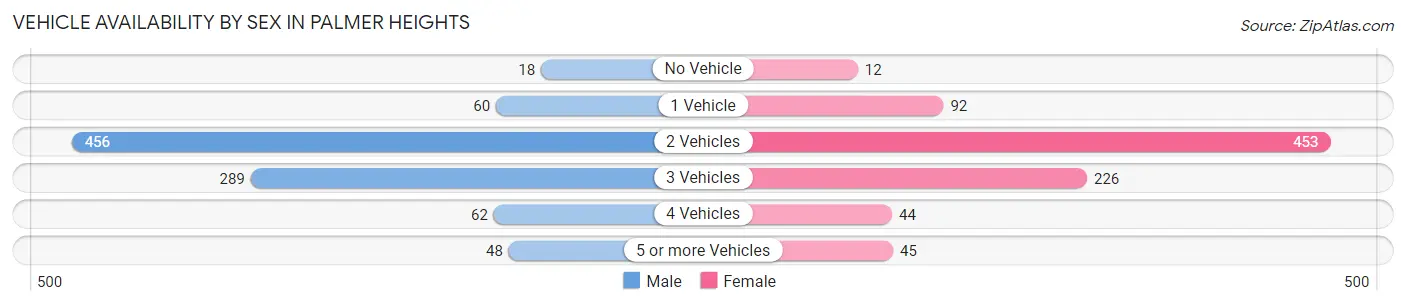
| Vehicles Available | Male | Female |
| No Vehicle | 18 (1.9%) | 12 (1.4%) |
| 1 Vehicle | 60 (6.4%) | 92 (10.5%) |
| 2 Vehicles | 456 (48.9%) | 453 (51.9%) |
| 3 Vehicles | 289 (31.0%) | 226 (25.9%) |
| 4 Vehicles | 62 (6.7%) | 44 (5.1%) |
| 5 or more Vehicles | 48 (5.1%) | 45 (5.2%) |
| Total | 933 (100.0%) | 872 (100.0%) |
Commute Time in Palmer Heights
The most frequently occuring commute durations in Palmer Heights are 10 to 14 minutes (466 commuters, 27.8%), 5 to 9 minutes (252 commuters, 15.0%), and 15 to 19 minutes (205 commuters, 12.2%).
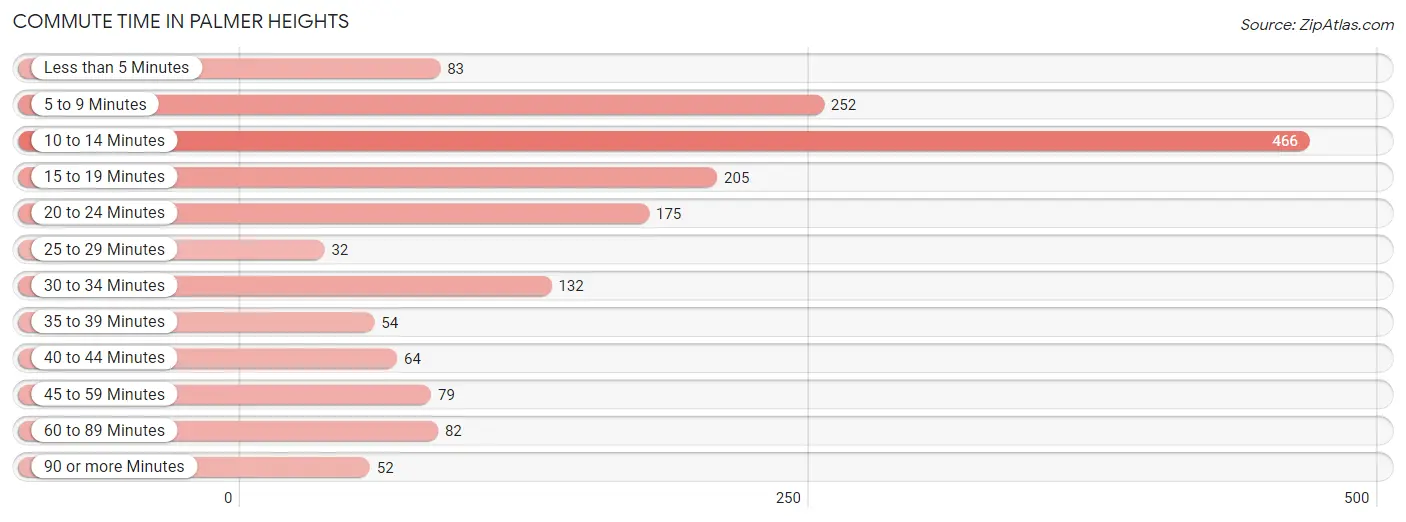
| Commute Time | # Commuters | % Commuters |
| Less than 5 Minutes | 83 | 5.0% |
| 5 to 9 Minutes | 252 | 15.0% |
| 10 to 14 Minutes | 466 | 27.8% |
| 15 to 19 Minutes | 205 | 12.2% |
| 20 to 24 Minutes | 175 | 10.4% |
| 25 to 29 Minutes | 32 | 1.9% |
| 30 to 34 Minutes | 132 | 7.9% |
| 35 to 39 Minutes | 54 | 3.2% |
| 40 to 44 Minutes | 64 | 3.8% |
| 45 to 59 Minutes | 79 | 4.7% |
| 60 to 89 Minutes | 82 | 4.9% |
| 90 or more Minutes | 52 | 3.1% |
Commute Time by Sex in Palmer Heights
The most common commute times in Palmer Heights are 10 to 14 minutes (279 commuters, 32.0%) for males and 10 to 14 minutes (187 commuters, 23.3%) for females.
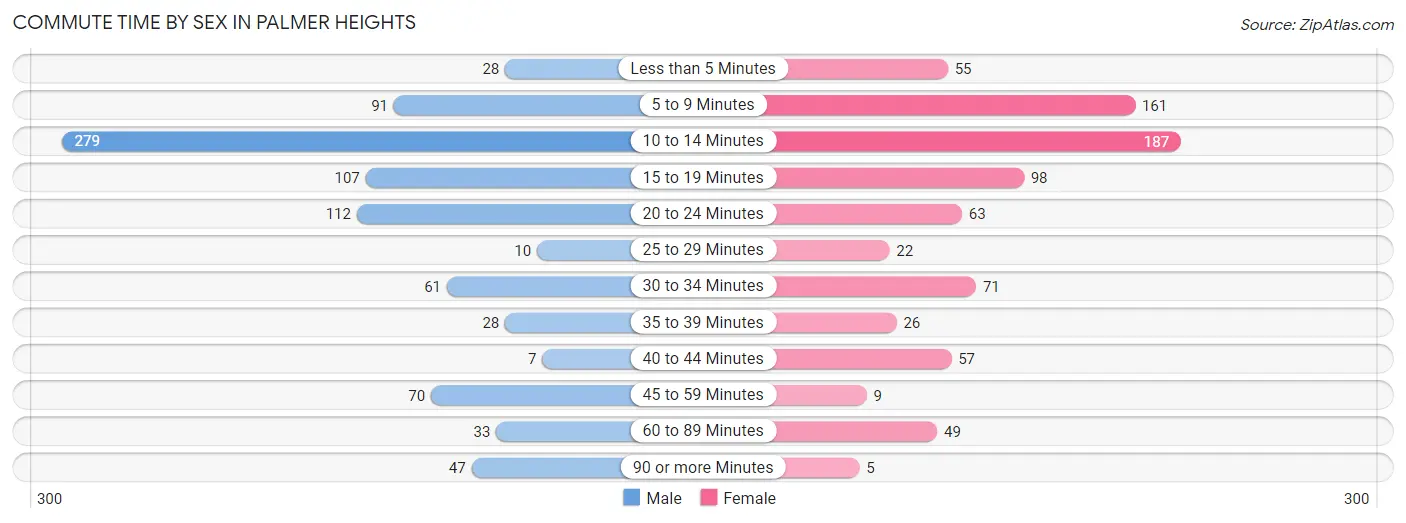
| Commute Time | Male | Female |
| Less than 5 Minutes | 28 (3.2%) | 55 (6.9%) |
| 5 to 9 Minutes | 91 (10.4%) | 161 (20.1%) |
| 10 to 14 Minutes | 279 (32.0%) | 187 (23.3%) |
| 15 to 19 Minutes | 107 (12.3%) | 98 (12.2%) |
| 20 to 24 Minutes | 112 (12.8%) | 63 (7.9%) |
| 25 to 29 Minutes | 10 (1.1%) | 22 (2.7%) |
| 30 to 34 Minutes | 61 (7.0%) | 71 (8.8%) |
| 35 to 39 Minutes | 28 (3.2%) | 26 (3.2%) |
| 40 to 44 Minutes | 7 (0.8%) | 57 (7.1%) |
| 45 to 59 Minutes | 70 (8.0%) | 9 (1.1%) |
| 60 to 89 Minutes | 33 (3.8%) | 49 (6.1%) |
| 90 or more Minutes | 47 (5.4%) | 5 (0.6%) |
Time of Departure to Work by Sex in Palmer Heights
The most frequent times of departure to work in Palmer Heights are 6:30 AM to 6:59 AM (228, 26.1%) for males and 8:00 AM to 8:29 AM (164, 20.4%) for females.
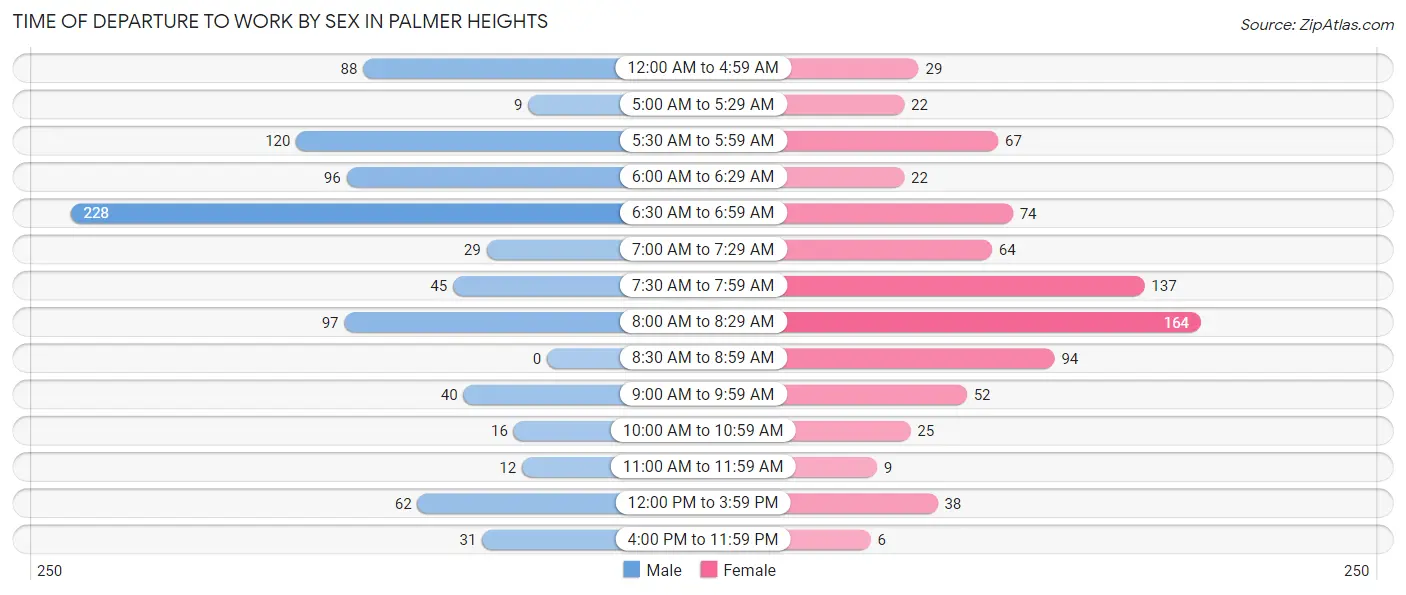
| Time of Departure | Male | Female |
| 12:00 AM to 4:59 AM | 88 (10.1%) | 29 (3.6%) |
| 5:00 AM to 5:29 AM | 9 (1.0%) | 22 (2.7%) |
| 5:30 AM to 5:59 AM | 120 (13.8%) | 67 (8.3%) |
| 6:00 AM to 6:29 AM | 96 (11.0%) | 22 (2.7%) |
| 6:30 AM to 6:59 AM | 228 (26.1%) | 74 (9.2%) |
| 7:00 AM to 7:29 AM | 29 (3.3%) | 64 (8.0%) |
| 7:30 AM to 7:59 AM | 45 (5.1%) | 137 (17.1%) |
| 8:00 AM to 8:29 AM | 97 (11.1%) | 164 (20.4%) |
| 8:30 AM to 8:59 AM | 0 (0.0%) | 94 (11.7%) |
| 9:00 AM to 9:59 AM | 40 (4.6%) | 52 (6.5%) |
| 10:00 AM to 10:59 AM | 16 (1.8%) | 25 (3.1%) |
| 11:00 AM to 11:59 AM | 12 (1.4%) | 9 (1.1%) |
| 12:00 PM to 3:59 PM | 62 (7.1%) | 38 (4.7%) |
| 4:00 PM to 11:59 PM | 31 (3.5%) | 6 (0.7%) |
| Total | 873 (100.0%) | 803 (100.0%) |
Housing Occupancy in Palmer Heights
Occupancy by Ownership in Palmer Heights
Of the total 1,361 dwellings in Palmer Heights, owner-occupied units account for 1,307 (96.0%), while renter-occupied units make up 54 (4.0%).
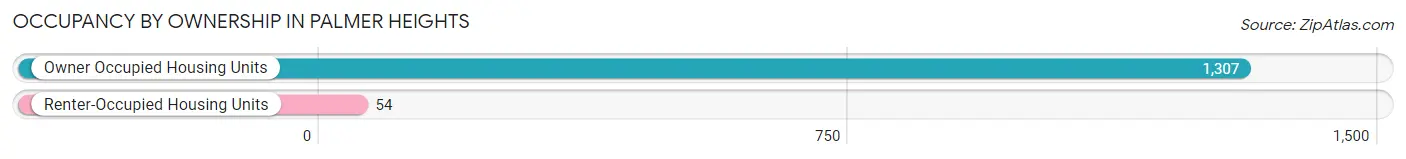
| Occupancy | # Housing Units | % Housing Units |
| Owner Occupied Housing Units | 1,307 | 96.0% |
| Renter-Occupied Housing Units | 54 | 4.0% |
| Total Occupied Housing Units | 1,361 | 100.0% |
Occupancy by Household Size in Palmer Heights
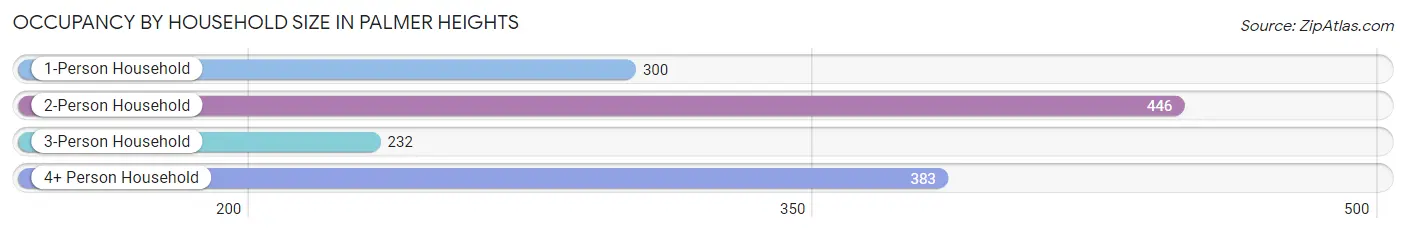
| Household Size | # Housing Units | % Housing Units |
| 1-Person Household | 300 | 22.0% |
| 2-Person Household | 446 | 32.8% |
| 3-Person Household | 232 | 17.1% |
| 4+ Person Household | 383 | 28.1% |
| Total Housing Units | 1,361 | 100.0% |
Occupancy by Ownership by Household Size in Palmer Heights
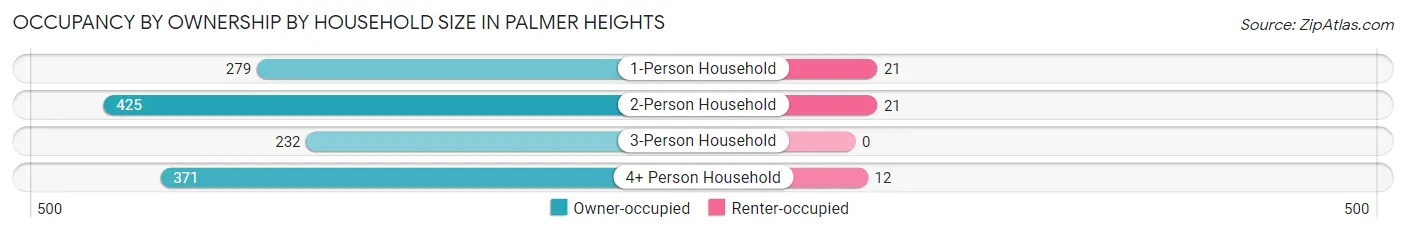
| Household Size | Owner-occupied | Renter-occupied |
| 1-Person Household | 279 (93.0%) | 21 (7.0%) |
| 2-Person Household | 425 (95.3%) | 21 (4.7%) |
| 3-Person Household | 232 (100.0%) | 0 (0.0%) |
| 4+ Person Household | 371 (96.9%) | 12 (3.1%) |
| Total Housing Units | 1,307 (96.0%) | 54 (4.0%) |
Occupancy by Educational Attainment in Palmer Heights
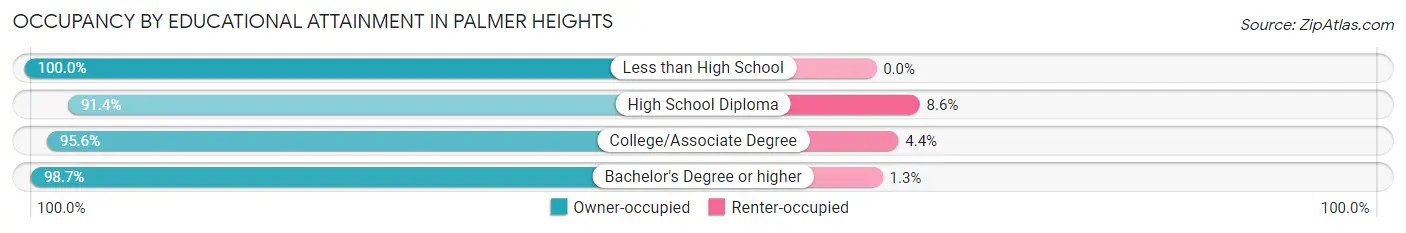
| Household Size | Owner-occupied | Renter-occupied |
| Less than High School | 65 (100.0%) | 0 (0.0%) |
| High School Diploma | 308 (91.4%) | 29 (8.6%) |
| College/Associate Degree | 391 (95.6%) | 18 (4.4%) |
| Bachelor's Degree or higher | 543 (98.7%) | 7 (1.3%) |
Occupancy by Age of Householder in Palmer Heights
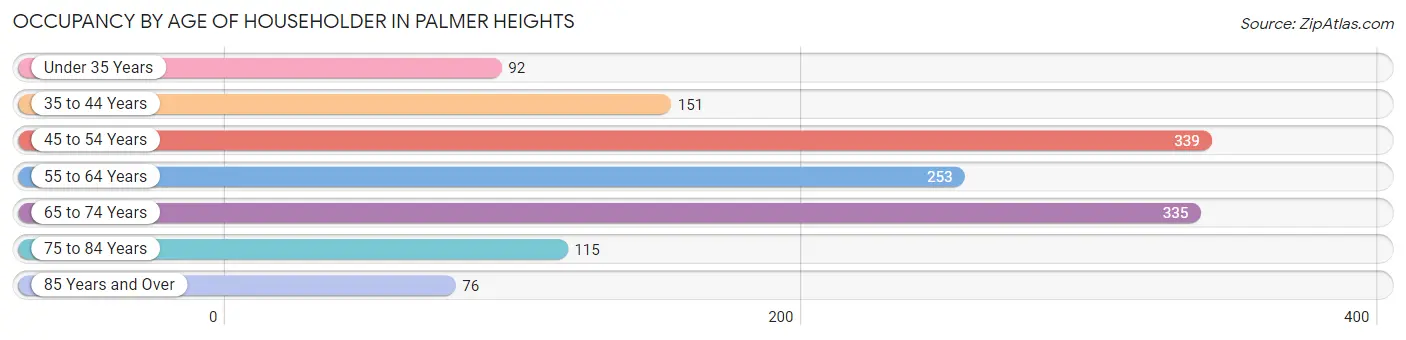
| Age Bracket | # Households | % Households |
| Under 35 Years | 92 | 6.8% |
| 35 to 44 Years | 151 | 11.1% |
| 45 to 54 Years | 339 | 24.9% |
| 55 to 64 Years | 253 | 18.6% |
| 65 to 74 Years | 335 | 24.6% |
| 75 to 84 Years | 115 | 8.5% |
| 85 Years and Over | 76 | 5.6% |
| Total | 1,361 | 100.0% |
Housing Finances in Palmer Heights
Median Income by Occupancy in Palmer Heights
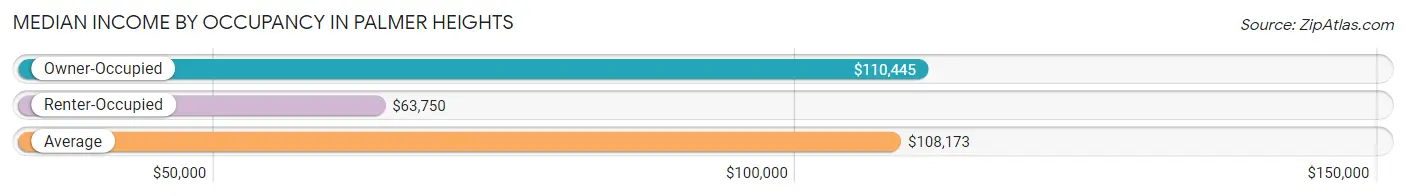
| Occupancy Type | # Households | Median Income |
| Owner-Occupied | 1,307 (96.0%) | $110,445 |
| Renter-Occupied | 54 (4.0%) | $63,750 |
| Average | 1,361 (100.0%) | $108,173 |
Occupancy by Householder Income Bracket in Palmer Heights
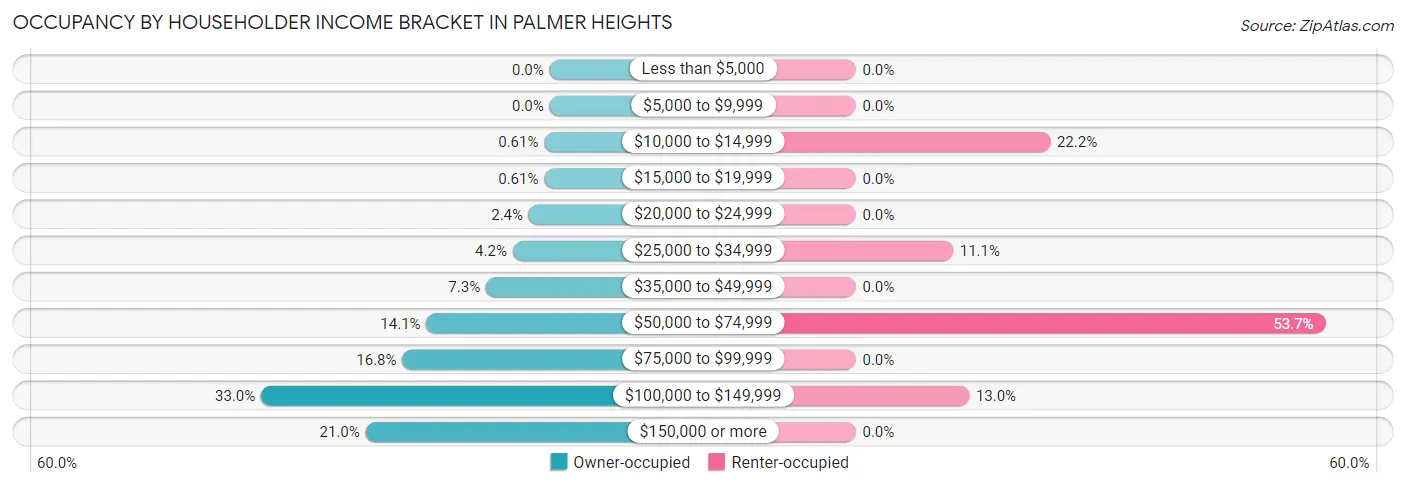
| Income Bracket | Owner-occupied | Renter-occupied |
| Less than $5,000 | 0 (0.0%) | 0 (0.0%) |
| $5,000 to $9,999 | 0 (0.0%) | 0 (0.0%) |
| $10,000 to $14,999 | 8 (0.6%) | 12 (22.2%) |
| $15,000 to $19,999 | 8 (0.6%) | 0 (0.0%) |
| $20,000 to $24,999 | 31 (2.4%) | 0 (0.0%) |
| $25,000 to $34,999 | 55 (4.2%) | 6 (11.1%) |
| $35,000 to $49,999 | 95 (7.3%) | 0 (0.0%) |
| $50,000 to $74,999 | 184 (14.1%) | 29 (53.7%) |
| $75,000 to $99,999 | 220 (16.8%) | 0 (0.0%) |
| $100,000 to $149,999 | 431 (33.0%) | 7 (13.0%) |
| $150,000 or more | 275 (21.0%) | 0 (0.0%) |
| Total | 1,307 (100.0%) | 54 (100.0%) |
Monthly Housing Cost Tiers in Palmer Heights
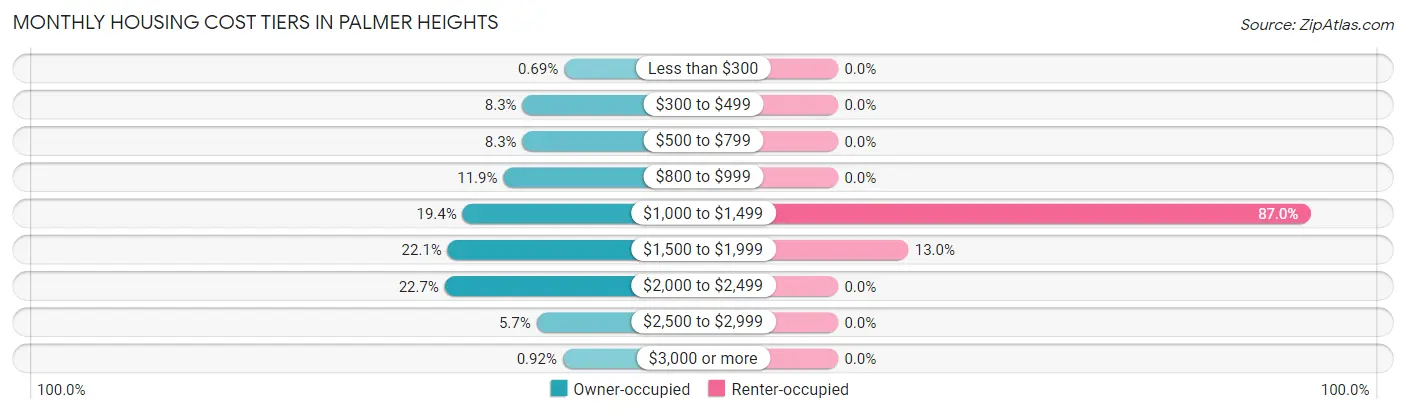
| Monthly Cost | Owner-occupied | Renter-occupied |
| Less than $300 | 9 (0.7%) | 0 (0.0%) |
| $300 to $499 | 109 (8.3%) | 0 (0.0%) |
| $500 to $799 | 109 (8.3%) | 0 (0.0%) |
| $800 to $999 | 155 (11.9%) | 0 (0.0%) |
| $1,000 to $1,499 | 253 (19.4%) | 47 (87.0%) |
| $1,500 to $1,999 | 289 (22.1%) | 7 (13.0%) |
| $2,000 to $2,499 | 296 (22.7%) | 0 (0.0%) |
| $2,500 to $2,999 | 75 (5.7%) | 0 (0.0%) |
| $3,000 or more | 12 (0.9%) | 0 (0.0%) |
| Total | 1,307 (100.0%) | 54 (100.0%) |
Physical Housing Characteristics in Palmer Heights
Housing Structures in Palmer Heights
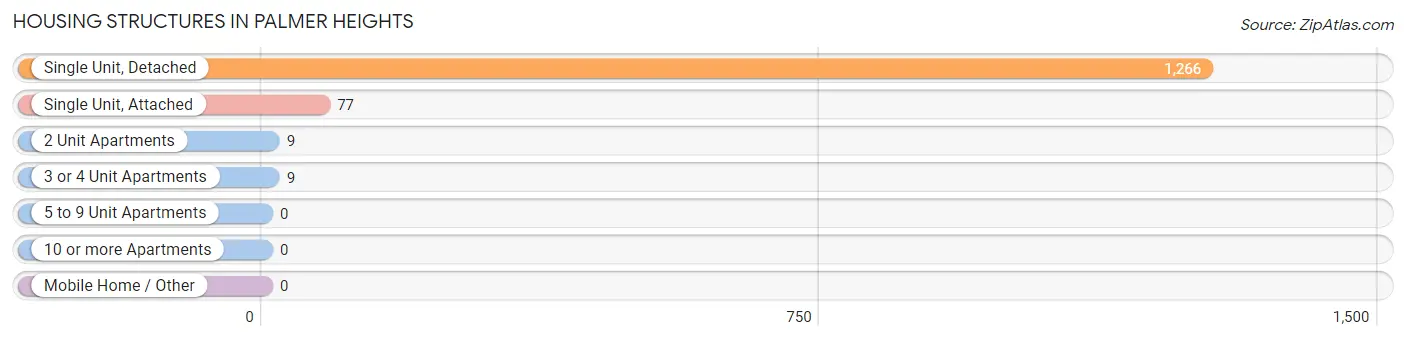
| Structure Type | # Housing Units | % Housing Units |
| Single Unit, Detached | 1,266 | 93.0% |
| Single Unit, Attached | 77 | 5.7% |
| 2 Unit Apartments | 9 | 0.7% |
| 3 or 4 Unit Apartments | 9 | 0.7% |
| 5 to 9 Unit Apartments | 0 | 0.0% |
| 10 or more Apartments | 0 | 0.0% |
| Mobile Home / Other | 0 | 0.0% |
| Total | 1,361 | 100.0% |
Housing Structures by Occupancy in Palmer Heights
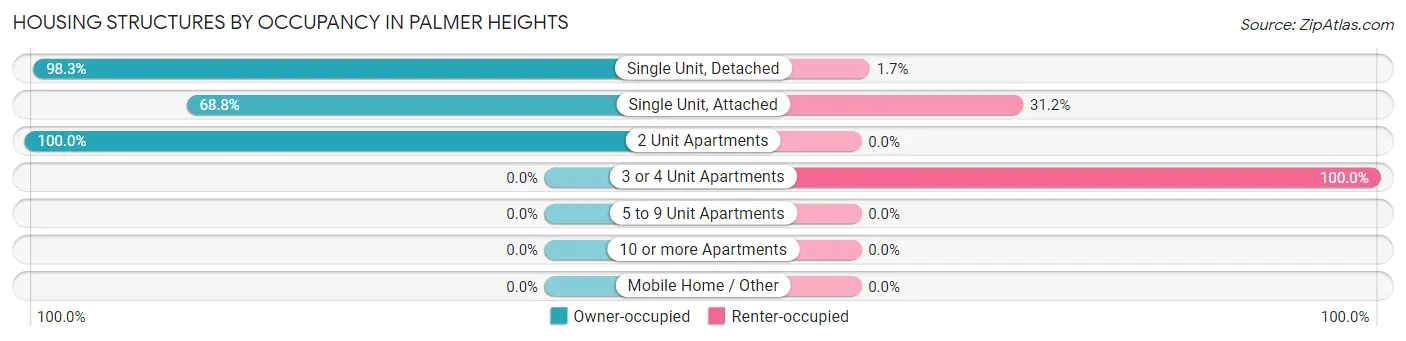
| Structure Type | Owner-occupied | Renter-occupied |
| Single Unit, Detached | 1,245 (98.3%) | 21 (1.7%) |
| Single Unit, Attached | 53 (68.8%) | 24 (31.2%) |
| 2 Unit Apartments | 9 (100.0%) | 0 (0.0%) |
| 3 or 4 Unit Apartments | 0 (0.0%) | 9 (100.0%) |
| 5 to 9 Unit Apartments | 0 (0.0%) | 0 (0.0%) |
| 10 or more Apartments | 0 (0.0%) | 0 (0.0%) |
| Mobile Home / Other | 0 (0.0%) | 0 (0.0%) |
| Total | 1,307 (96.0%) | 54 (4.0%) |
Housing Structures by Number of Rooms in Palmer Heights
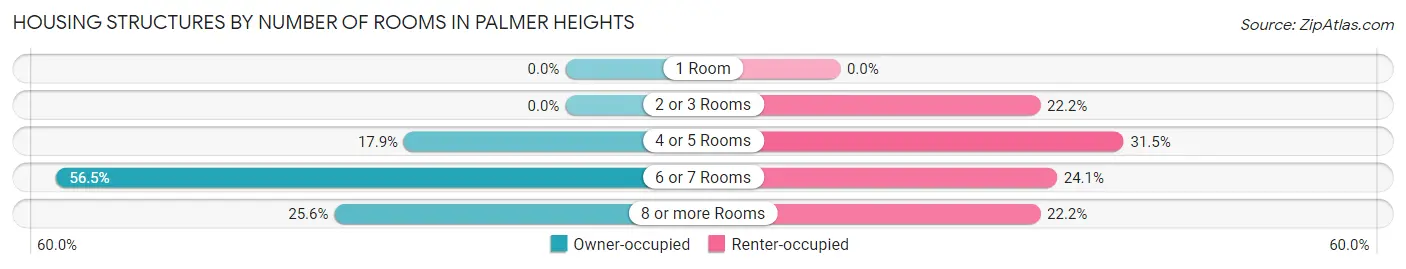
| Number of Rooms | Owner-occupied | Renter-occupied |
| 1 Room | 0 (0.0%) | 0 (0.0%) |
| 2 or 3 Rooms | 0 (0.0%) | 12 (22.2%) |
| 4 or 5 Rooms | 234 (17.9%) | 17 (31.5%) |
| 6 or 7 Rooms | 738 (56.5%) | 13 (24.1%) |
| 8 or more Rooms | 335 (25.6%) | 12 (22.2%) |
| Total | 1,307 (100.0%) | 54 (100.0%) |
Housing Structure by Heating Type in Palmer Heights
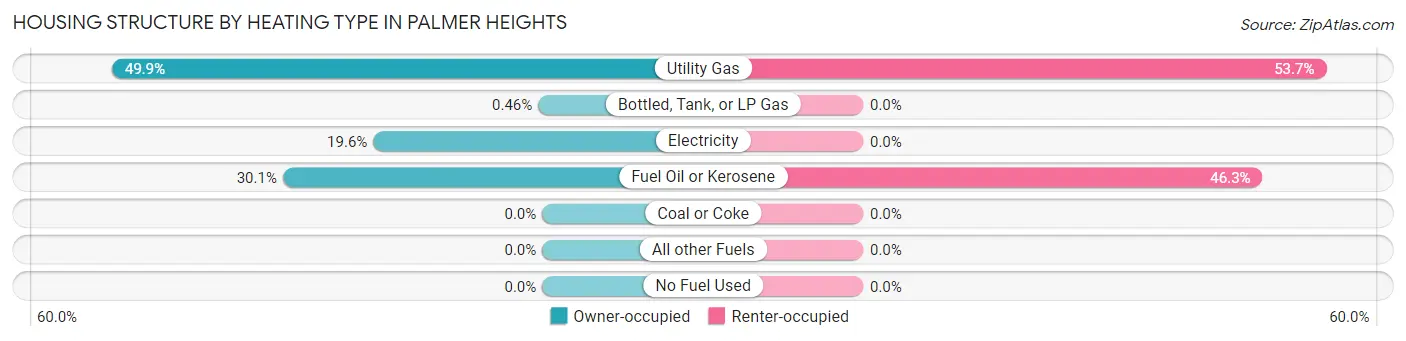
| Heating Type | Owner-occupied | Renter-occupied |
| Utility Gas | 652 (49.9%) | 29 (53.7%) |
| Bottled, Tank, or LP Gas | 6 (0.5%) | 0 (0.0%) |
| Electricity | 256 (19.6%) | 0 (0.0%) |
| Fuel Oil or Kerosene | 393 (30.1%) | 25 (46.3%) |
| Coal or Coke | 0 (0.0%) | 0 (0.0%) |
| All other Fuels | 0 (0.0%) | 0 (0.0%) |
| No Fuel Used | 0 (0.0%) | 0 (0.0%) |
| Total | 1,307 (100.0%) | 54 (100.0%) |
Household Vehicle Usage in Palmer Heights
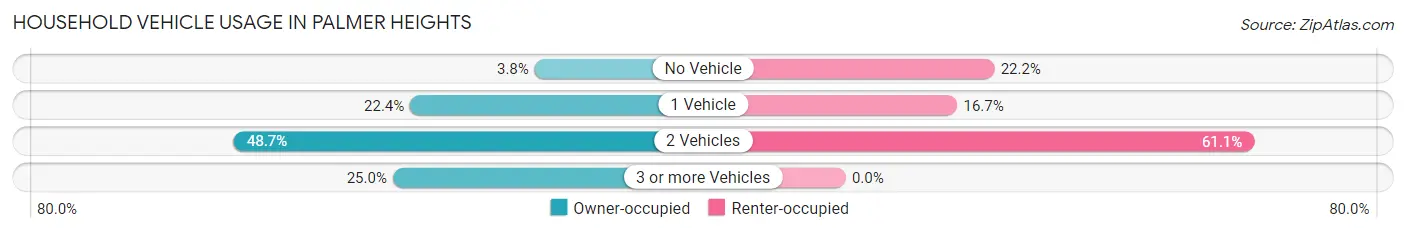
| Vehicles per Household | Owner-occupied | Renter-occupied |
| No Vehicle | 50 (3.8%) | 12 (22.2%) |
| 1 Vehicle | 293 (22.4%) | 9 (16.7%) |
| 2 Vehicles | 637 (48.7%) | 33 (61.1%) |
| 3 or more Vehicles | 327 (25.0%) | 0 (0.0%) |
| Total | 1,307 (100.0%) | 54 (100.0%) |
Real Estate & Mortgages in Palmer Heights
Real Estate and Mortgage Overview in Palmer Heights
| Characteristic | Without Mortgage | With Mortgage |
| Housing Units | 435 | 872 |
| Median Property Value | $258,800 | $256,700 |
| Median Household Income | $78,207 | $219 |
| Monthly Housing Costs | $785 | $12 |
| Real Estate Taxes | $4,474 | $19 |
Property Value by Mortgage Status in Palmer Heights
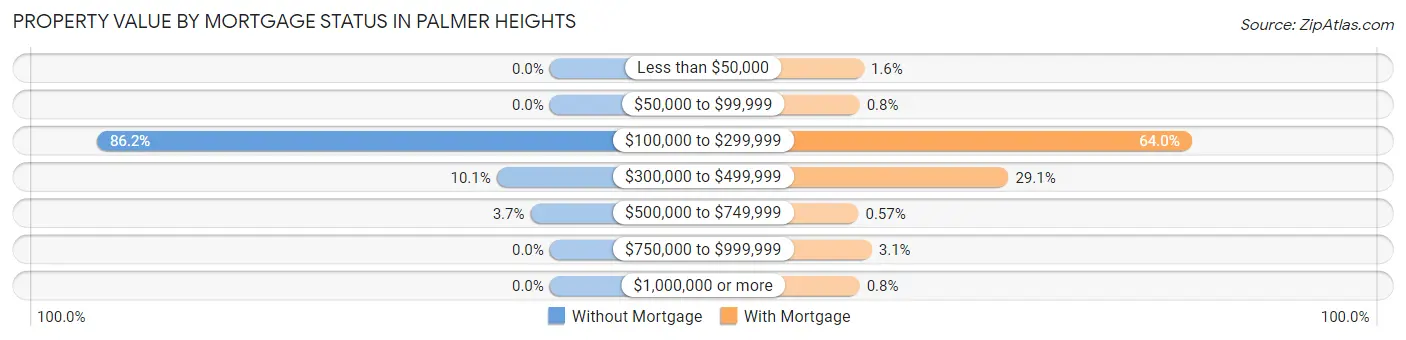
| Property Value | Without Mortgage | With Mortgage |
| Less than $50,000 | 0 (0.0%) | 14 (1.6%) |
| $50,000 to $99,999 | 0 (0.0%) | 7 (0.8%) |
| $100,000 to $299,999 | 375 (86.2%) | 558 (64.0%) |
| $300,000 to $499,999 | 44 (10.1%) | 254 (29.1%) |
| $500,000 to $749,999 | 16 (3.7%) | 5 (0.6%) |
| $750,000 to $999,999 | 0 (0.0%) | 27 (3.1%) |
| $1,000,000 or more | 0 (0.0%) | 7 (0.8%) |
| Total | 435 (100.0%) | 872 (100.0%) |
Household Income by Mortgage Status in Palmer Heights
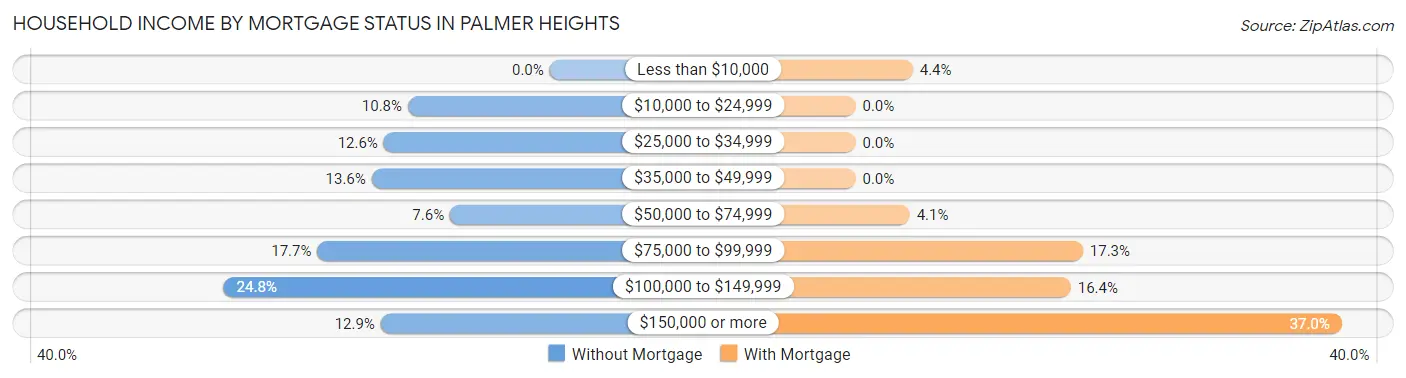
| Household Income | Without Mortgage | With Mortgage |
| Less than $10,000 | 0 (0.0%) | 38 (4.4%) |
| $10,000 to $24,999 | 47 (10.8%) | 0 (0.0%) |
| $25,000 to $34,999 | 55 (12.6%) | 0 (0.0%) |
| $35,000 to $49,999 | 59 (13.6%) | 0 (0.0%) |
| $50,000 to $74,999 | 33 (7.6%) | 36 (4.1%) |
| $75,000 to $99,999 | 77 (17.7%) | 151 (17.3%) |
| $100,000 to $149,999 | 108 (24.8%) | 143 (16.4%) |
| $150,000 or more | 56 (12.9%) | 323 (37.0%) |
| Total | 435 (100.0%) | 872 (100.0%) |
Property Value to Household Income Ratio in Palmer Heights
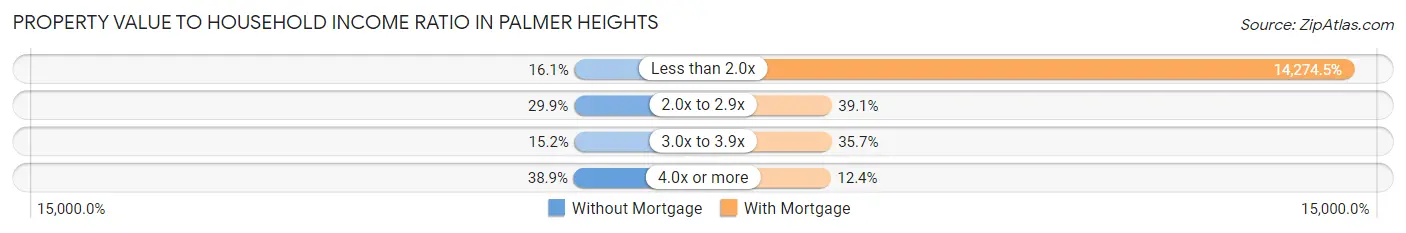
| Value-to-Income Ratio | Without Mortgage | With Mortgage |
| Less than 2.0x | 70 (16.1%) | 124,474 (14,274.5%) |
| 2.0x to 2.9x | 130 (29.9%) | 341 (39.1%) |
| 3.0x to 3.9x | 66 (15.2%) | 311 (35.7%) |
| 4.0x or more | 169 (38.9%) | 108 (12.4%) |
| Total | 435 (100.0%) | 872 (100.0%) |
Real Estate Taxes by Mortgage Status in Palmer Heights
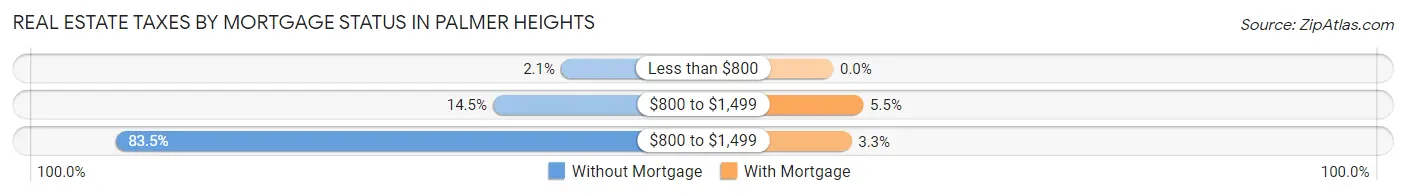
| Property Taxes | Without Mortgage | With Mortgage |
| Less than $800 | 9 (2.1%) | 0 (0.0%) |
| $800 to $1,499 | 63 (14.5%) | 48 (5.5%) |
| $800 to $1,499 | 363 (83.5%) | 29 (3.3%) |
| Total | 435 (100.0%) | 872 (100.0%) |
Health & Disability in Palmer Heights
Health Insurance Coverage by Age in Palmer Heights
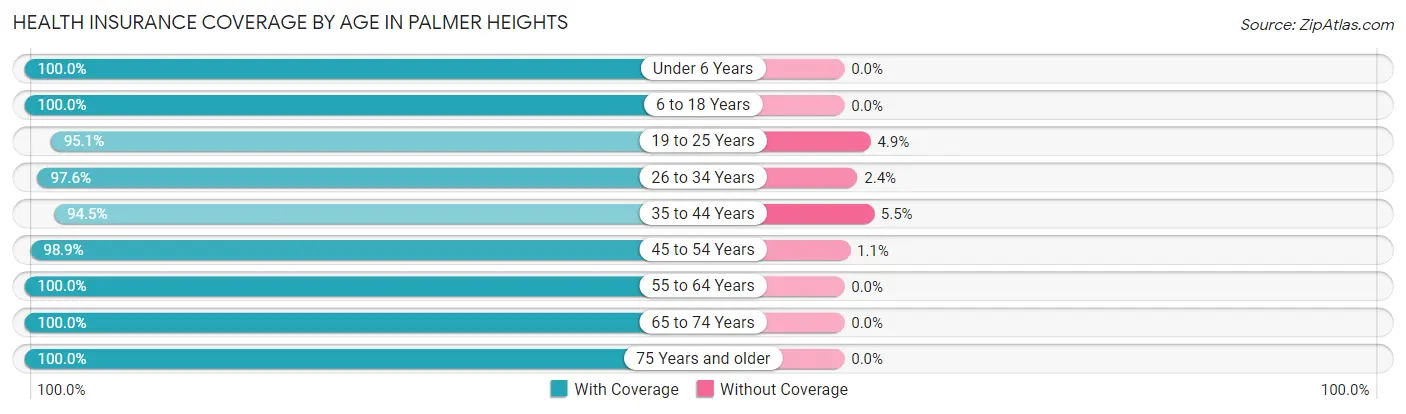
| Age Bracket | With Coverage | Without Coverage |
| Under 6 Years | 182 (100.0%) | 0 (0.0%) |
| 6 to 18 Years | 665 (100.0%) | 0 (0.0%) |
| 19 to 25 Years | 156 (95.1%) | 8 (4.9%) |
| 26 to 34 Years | 320 (97.6%) | 8 (2.4%) |
| 35 to 44 Years | 326 (94.5%) | 19 (5.5%) |
| 45 to 54 Years | 649 (98.9%) | 7 (1.1%) |
| 55 to 64 Years | 464 (100.0%) | 0 (0.0%) |
| 65 to 74 Years | 536 (100.0%) | 0 (0.0%) |
| 75 Years and older | 327 (100.0%) | 0 (0.0%) |
| Total | 3,625 (98.9%) | 42 (1.1%) |
Health Insurance Coverage by Citizenship Status in Palmer Heights
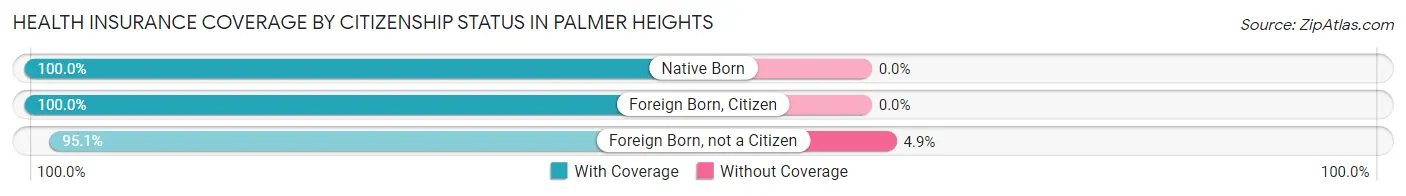
| Citizenship Status | With Coverage | Without Coverage |
| Native Born | 182 (100.0%) | 0 (0.0%) |
| Foreign Born, Citizen | 665 (100.0%) | 0 (0.0%) |
| Foreign Born, not a Citizen | 156 (95.1%) | 8 (4.9%) |
Health Insurance Coverage by Household Income in Palmer Heights
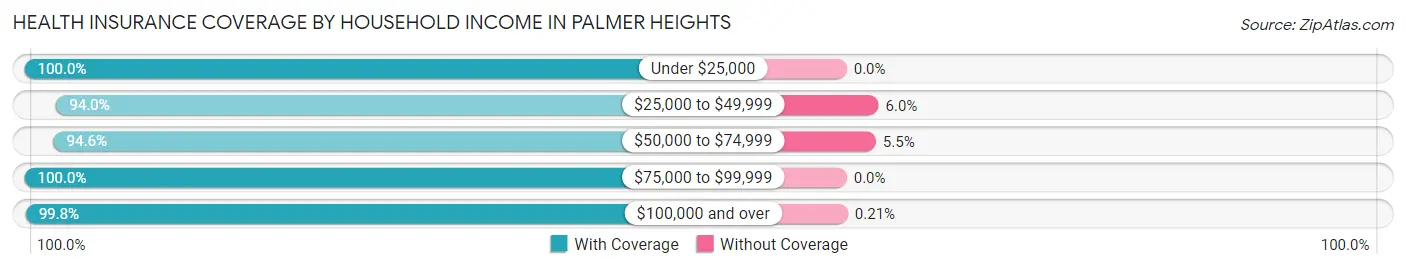
| Household Income | With Coverage | Without Coverage |
| Under $25,000 | 68 (100.0%) | 0 (0.0%) |
| $25,000 to $49,999 | 221 (94.0%) | 14 (6.0%) |
| $50,000 to $74,999 | 399 (94.6%) | 23 (5.4%) |
| $75,000 to $99,999 | 542 (100.0%) | 0 (0.0%) |
| $100,000 and over | 2,395 (99.8%) | 5 (0.2%) |
Public vs Private Health Insurance Coverage by Age in Palmer Heights
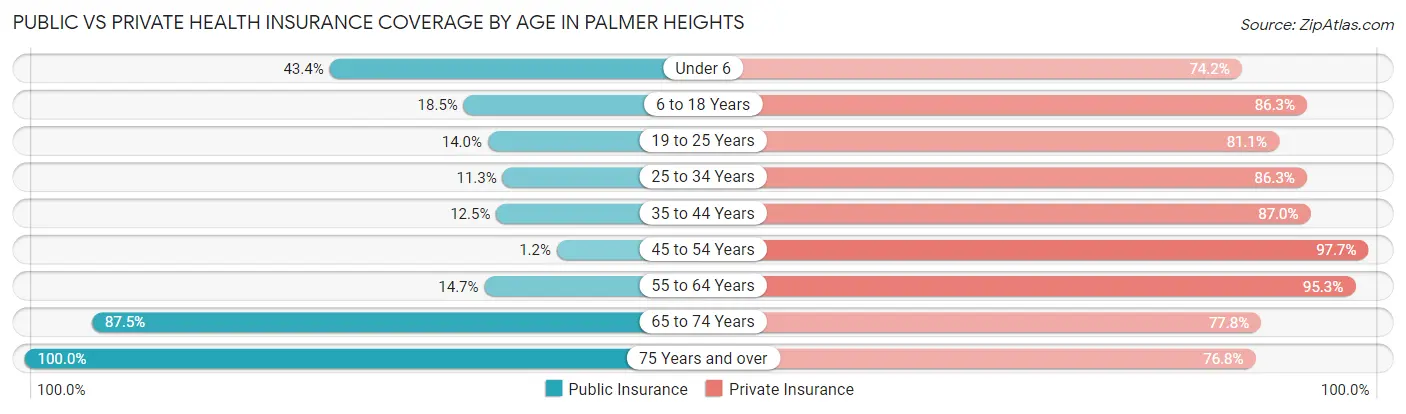
| Age Bracket | Public Insurance | Private Insurance |
| Under 6 | 79 (43.4%) | 135 (74.2%) |
| 6 to 18 Years | 123 (18.5%) | 574 (86.3%) |
| 19 to 25 Years | 23 (14.0%) | 133 (81.1%) |
| 25 to 34 Years | 37 (11.3%) | 283 (86.3%) |
| 35 to 44 Years | 43 (12.5%) | 300 (87.0%) |
| 45 to 54 Years | 8 (1.2%) | 641 (97.7%) |
| 55 to 64 Years | 68 (14.7%) | 442 (95.3%) |
| 65 to 74 Years | 469 (87.5%) | 417 (77.8%) |
| 75 Years and over | 327 (100.0%) | 251 (76.8%) |
| Total | 1,177 (32.1%) | 3,176 (86.6%) |
Disability Status by Sex by Age in Palmer Heights
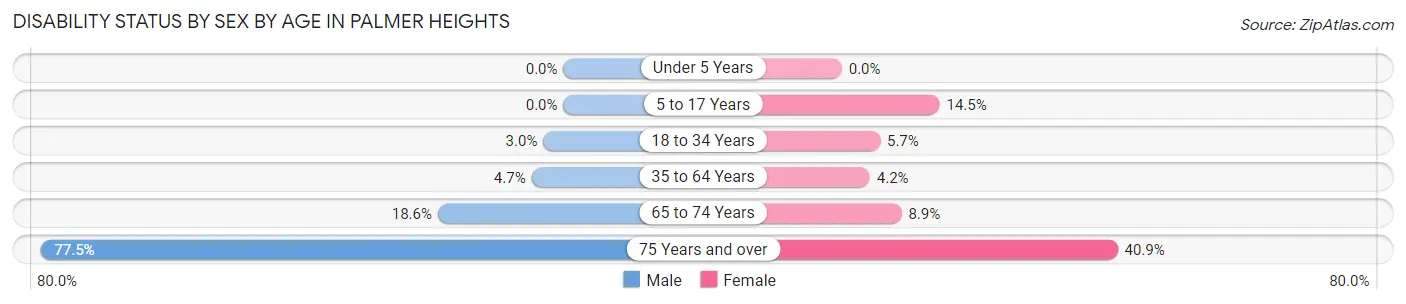
| Age Bracket | Male | Female |
| Under 5 Years | 0 (0.0%) | 0 (0.0%) |
| 5 to 17 Years | 0 (0.0%) | 28 (14.5%) |
| 18 to 34 Years | 10 (3.0%) | 10 (5.7%) |
| 35 to 64 Years | 34 (4.7%) | 31 (4.2%) |
| 65 to 74 Years | 41 (18.6%) | 28 (8.9%) |
| 75 Years and over | 155 (77.5%) | 52 (40.9%) |
Disability Class by Sex by Age in Palmer Heights
Disability Class: Hearing Difficulty
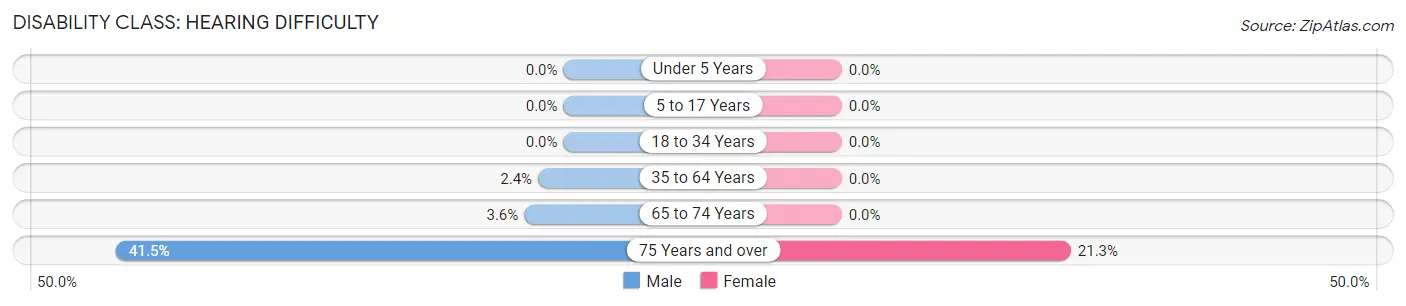
| Age Bracket | Male | Female |
| Under 5 Years | 0 (0.0%) | 0 (0.0%) |
| 5 to 17 Years | 0 (0.0%) | 0 (0.0%) |
| 18 to 34 Years | 0 (0.0%) | 0 (0.0%) |
| 35 to 64 Years | 17 (2.4%) | 0 (0.0%) |
| 65 to 74 Years | 8 (3.6%) | 0 (0.0%) |
| 75 Years and over | 83 (41.5%) | 27 (21.3%) |
Disability Class: Vision Difficulty
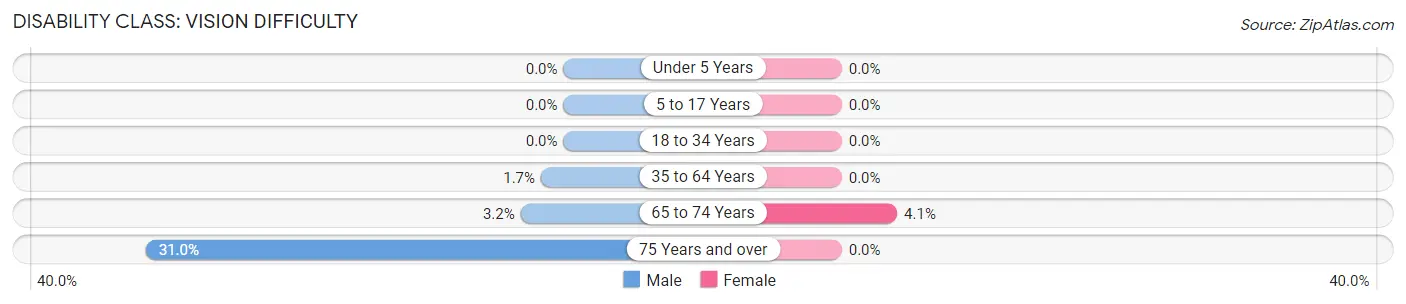
| Age Bracket | Male | Female |
| Under 5 Years | 0 (0.0%) | 0 (0.0%) |
| 5 to 17 Years | 0 (0.0%) | 0 (0.0%) |
| 18 to 34 Years | 0 (0.0%) | 0 (0.0%) |
| 35 to 64 Years | 12 (1.7%) | 0 (0.0%) |
| 65 to 74 Years | 7 (3.2%) | 13 (4.1%) |
| 75 Years and over | 62 (31.0%) | 0 (0.0%) |
Disability Class: Cognitive Difficulty
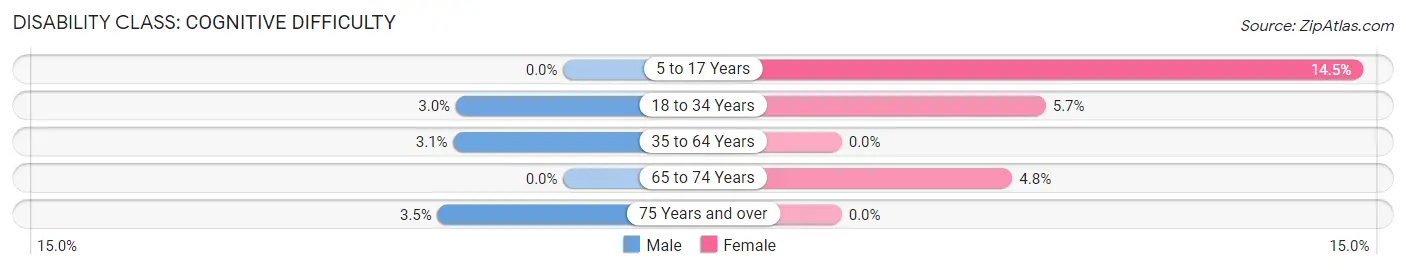
| Age Bracket | Male | Female |
| 5 to 17 Years | 0 (0.0%) | 28 (14.5%) |
| 18 to 34 Years | 10 (3.0%) | 10 (5.7%) |
| 35 to 64 Years | 22 (3.1%) | 0 (0.0%) |
| 65 to 74 Years | 0 (0.0%) | 15 (4.8%) |
| 75 Years and over | 7 (3.5%) | 0 (0.0%) |
Disability Class: Ambulatory Difficulty
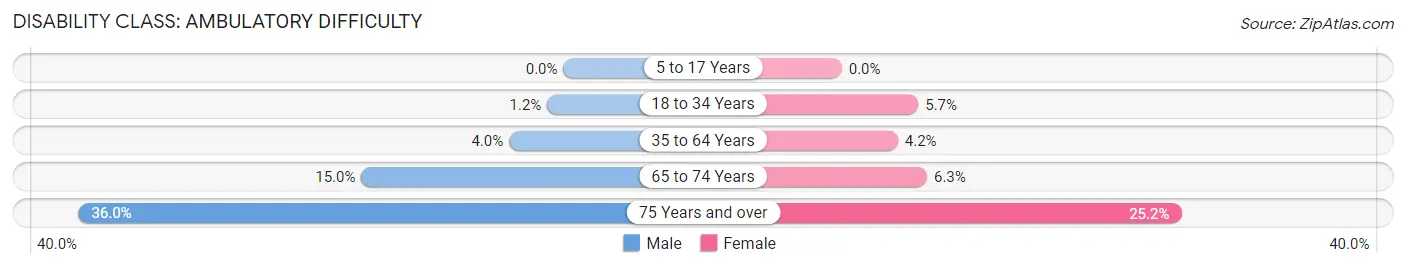
| Age Bracket | Male | Female |
| 5 to 17 Years | 0 (0.0%) | 0 (0.0%) |
| 18 to 34 Years | 4 (1.2%) | 10 (5.7%) |
| 35 to 64 Years | 29 (4.0%) | 31 (4.2%) |
| 65 to 74 Years | 33 (15.0%) | 20 (6.3%) |
| 75 Years and over | 72 (36.0%) | 32 (25.2%) |
Disability Class: Self-Care Difficulty
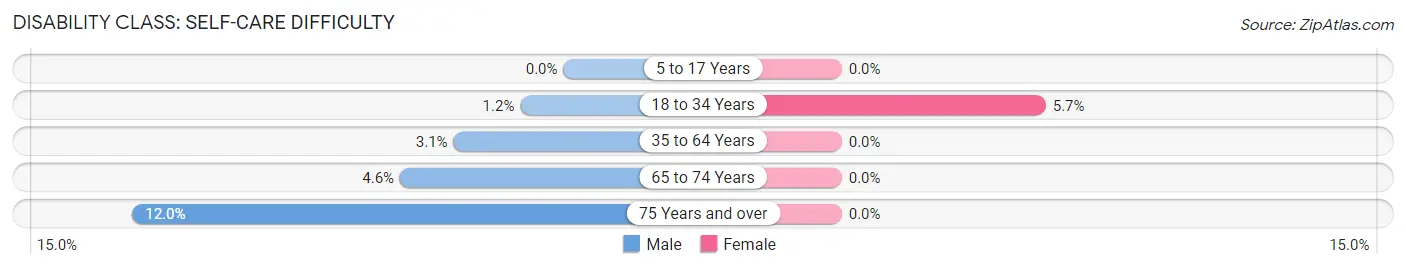
| Age Bracket | Male | Female |
| 5 to 17 Years | 0 (0.0%) | 0 (0.0%) |
| 18 to 34 Years | 4 (1.2%) | 10 (5.7%) |
| 35 to 64 Years | 22 (3.1%) | 0 (0.0%) |
| 65 to 74 Years | 10 (4.5%) | 0 (0.0%) |
| 75 Years and over | 24 (12.0%) | 0 (0.0%) |
Technology Access in Palmer Heights
Computing Device Access in Palmer Heights
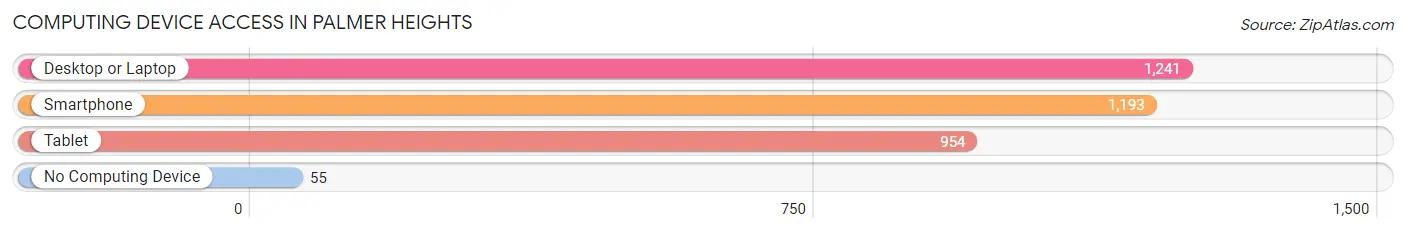
| Device Type | # Households | % Households |
| Desktop or Laptop | 1,241 | 91.2% |
| Smartphone | 1,193 | 87.7% |
| Tablet | 954 | 70.1% |
| No Computing Device | 55 | 4.0% |
| Total | 1,361 | 100.0% |
Internet Access in Palmer Heights
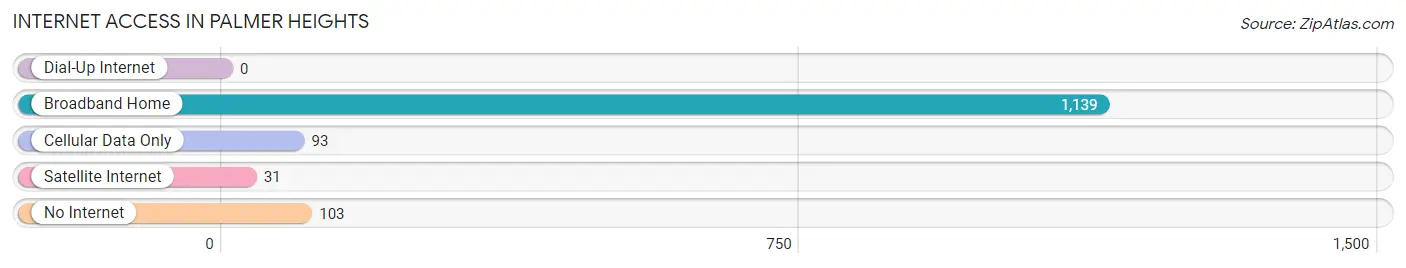
| Internet Type | # Households | % Households |
| Dial-Up Internet | 0 | 0.0% |
| Broadband Home | 1,139 | 83.7% |
| Cellular Data Only | 93 | 6.8% |
| Satellite Internet | 31 | 2.3% |
| No Internet | 103 | 7.6% |
| Total | 1,361 | 100.0% |
Palmer Heights Summary
Palmer Heights is a small borough located in Lehigh County, Pennsylvania. It is situated in the Lehigh Valley region of the state, approximately 8 miles north of Allentown and about 60 miles northwest of Philadelphia. The borough is bordered by the townships of Whitehall, South Whitehall, and Salisbury. As of the 2010 census, the population of Palmer Heights was 2,845.
History
The area that is now Palmer Heights was originally inhabited by the Lenape Native Americans. The first European settlers arrived in the area in the late 1700s. The area was known as “Palmer’s Heights” after the first settler, John Palmer, who purchased the land in 1790. The area was officially incorporated as a borough in 1891.
Geography
Palmer Heights is located at 40°37'17" North, 75°30'45" West (40.6214, -75.5125). It has a total area of 0.7 square miles, all of which is land. The borough is situated in the Lehigh Valley region of Pennsylvania, approximately 8 miles north of Allentown and about 60 miles northwest of Philadelphia. The borough is bordered by the townships of Whitehall, South Whitehall, and Salisbury.
Economy
The economy of Palmer Heights is largely based on the service industry. The borough is home to a variety of restaurants, retail stores, and other businesses. The largest employer in the borough is the Lehigh Valley Health Network, which operates a hospital and several medical offices in the area. Other major employers include the Palmer Heights School District, the Palmer Heights Fire Department, and the Palmer Heights Police Department.
Demographics
As of the 2010 census, there were 2,845 people, 1,093 households, and 790 families residing in the borough. The population density was 4,093.3 people per square mile. The racial makeup of the borough was 94.2% White, 1.3% African American, 0.2% Native American, 1.7% Asian, 0.7% from other races, and 1.9% from two or more races. Hispanic or Latino of any race were 3.2% of the population.
The median income for a household in the borough was $50,938, and the median income for a family was $60,938. About 4.2% of families and 5.3% of the population were below the poverty line, including 6.2% of those under age 18 and 4.2% of those age 65 or over.
Common Questions
What is the Total Population of Palmer Heights?
Total Population of Palmer Heights is 3,894.
What is the Total Male Population of Palmer Heights?
Total Male Population of Palmer Heights is 2,053.
What is the Total Female Population of Palmer Heights?
Total Female Population of Palmer Heights is 1,841.
What is the Ratio of Males per 100 Females in Palmer Heights?
There are 111.52 Males per 100 Females in Palmer Heights.
What is the Ratio of Females per 100 Males in Palmer Heights?
There are 89.67 Females per 100 Males in Palmer Heights.
What is the Median Population Age in Palmer Heights?
Median Population Age in Palmer Heights is 47.5 Years.
What is the Average Family Size in Palmer Heights
Average Family Size in Palmer Heights is 3.1 People.
What is the Average Household Size in Palmer Heights
Average Household Size in Palmer Heights is 2.7 People.
What is Per Capita Income in Palmer Heights?
Per Capita income in Palmer Heights is $39,646.
What is the Median Family Income in Palmer Heights?
Median Family Income in Palmer Heights is $113,984.
What is the Median Household income in Palmer Heights?
Median Household Income in Palmer Heights is $108,173.
What is Income or Wage Gap in Palmer Heights?
Income or Wage Gap in Palmer Heights is 35.4%.
Women in Palmer Heights earn 64.6 cents for every dollar earned by a man.
What is Inequality or Gini Index in Palmer Heights?
Inequality or Gini Index in Palmer Heights is 0.30.
How Large is the Labor Force in Palmer Heights?
There are 1,974 People in the Labor Forcein in Palmer Heights.
What is the Percentage of People in the Labor Force in Palmer Heights?
62.9% of People are in the Labor Force in Palmer Heights.
What is the Unemployment Rate in Palmer Heights?
Unemployment Rate in Palmer Heights is 6.8%.