Ranshaw, PA
Ranshaw Map
Ranshaw Overview
328
TOTAL POPULATION
175
MALE POPULATION
153
FEMALE POPULATION
114.38
MALES / 100 FEMALES
87.43
FEMALES / 100 MALES
38.6
MEDIAN AGE
2.5
AVG FAMILY SIZE
2.2
AVG HOUSEHOLD SIZE
$22,886
PER CAPITA INCOME
$65,791
AVG FAMILY INCOME
$47,321
AVG HOUSEHOLD INCOME
68.0%
WAGE / INCOME GAP [ % ]
32.0¢/ $1
WAGE / INCOME GAP [ $ ]
0.29
INEQUALITY / GINI INDEX
180
LABOR FORCE [ PEOPLE ]
67.7%
PERCENT IN LABOR FORCE
4.4%
UNEMPLOYMENT RATE
Ranshaw Area Codes
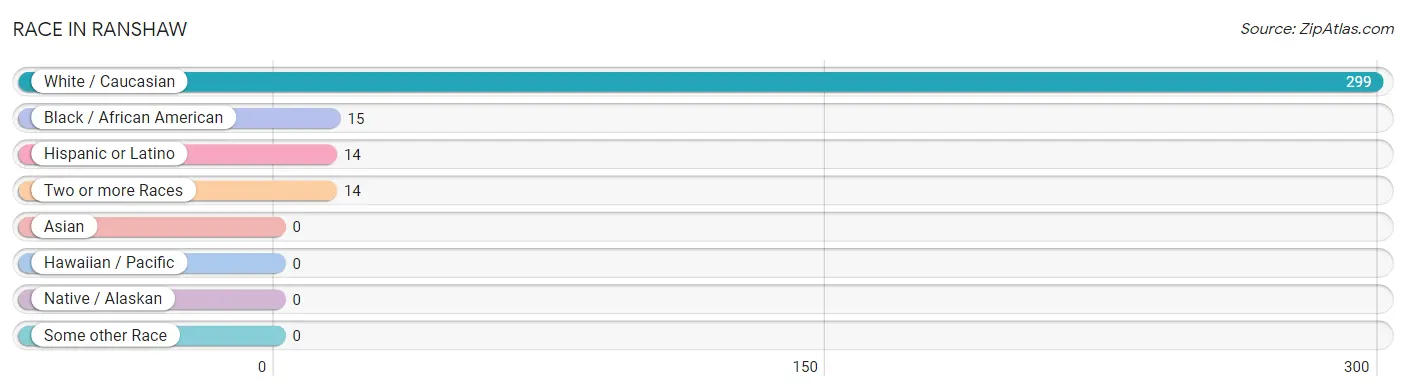
Race in Ranshaw
The most populous races in Ranshaw are White / Caucasian (299 | 91.2%), Black / African American (15 | 4.6%), and Hispanic or Latino (14 | 4.3%).
| Race | # Population | % Population |
| Asian | 0 | 0.0% |
| Black / African American | 15 | 4.6% |
| Hawaiian / Pacific | 0 | 0.0% |
| Hispanic or Latino | 14 | 4.3% |
| Native / Alaskan | 0 | 0.0% |
| White / Caucasian | 299 | 91.2% |
| Two or more Races | 14 | 4.3% |
| Some other Race | 0 | 0.0% |
| Total | 328 | 100.0% |
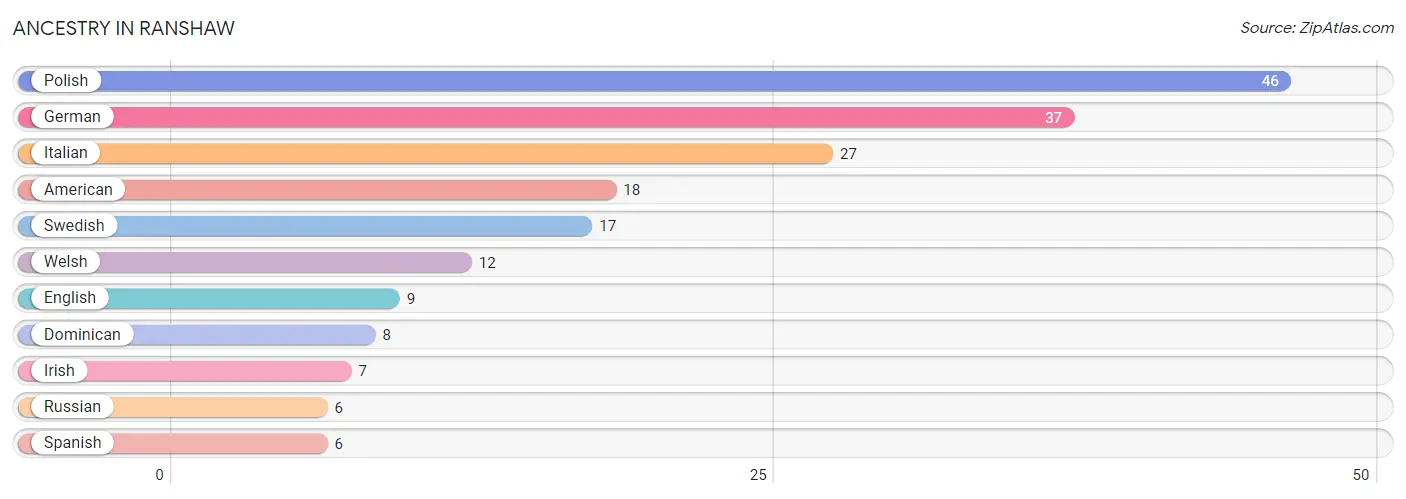
Ancestry in Ranshaw
The most populous ancestries reported in Ranshaw are Polish (46 | 14.0%), German (37 | 11.3%), Italian (27 | 8.2%), American (18 | 5.5%), and Swedish (17 | 5.2%), together accounting for 44.2% of all Ranshaw residents.
| Ancestry | # Population | % Population |
| American | 18 | 5.5% |
| Dominican | 8 | 2.4% |
| English | 9 | 2.7% |
| German | 37 | 11.3% |
| Irish | 7 | 2.1% |
| Italian | 27 | 8.2% |
| Polish | 46 | 14.0% |
| Russian | 6 | 1.8% |
| Spanish | 6 | 1.8% |
| Swedish | 17 | 5.2% |
| Welsh | 12 | 3.7% | View All 11 Rows |
Immigrants in Ranshaw

| Immigration Origin | # Population | % Population | View All 0 Rows |
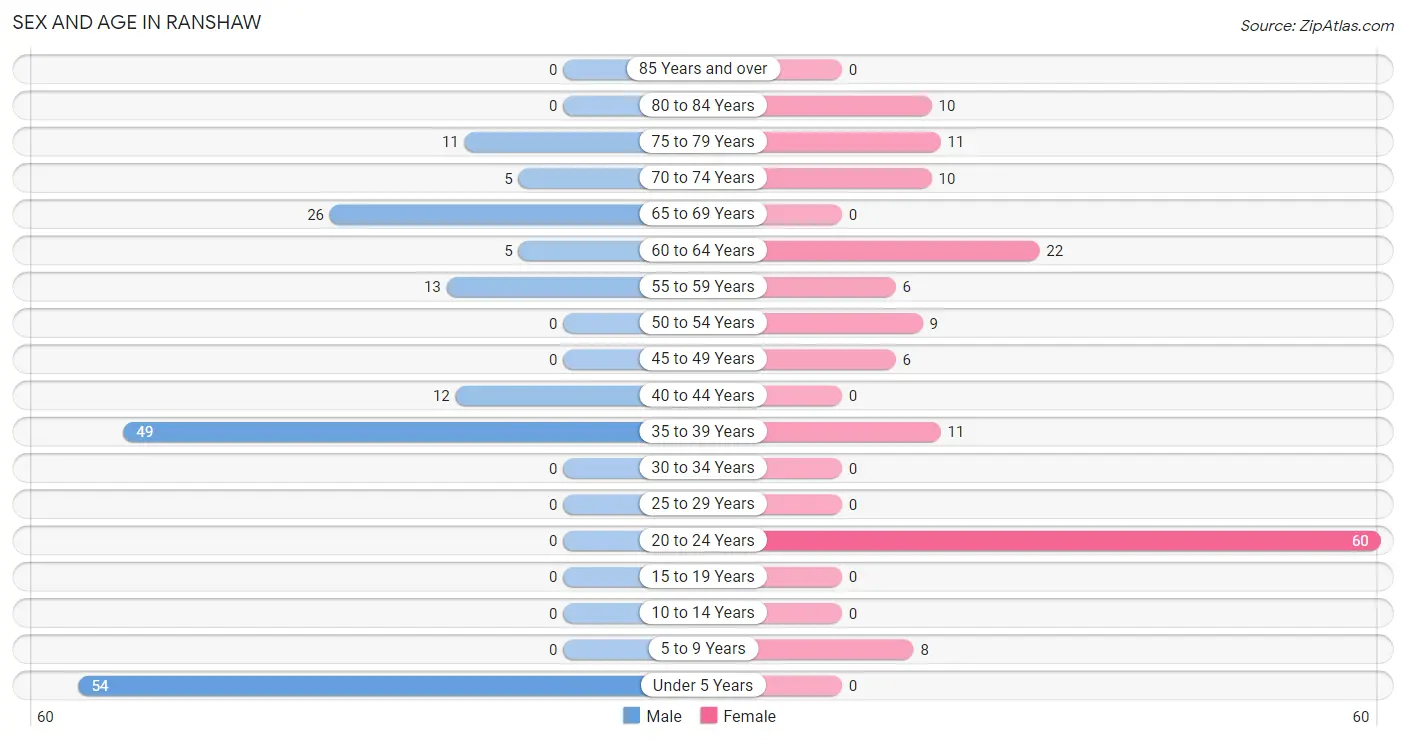
Sex and Age in Ranshaw
Sex and Age in Ranshaw
The most populous age groups in Ranshaw are Under 5 Years (54 | 30.9%) for men and 20 to 24 Years (60 | 39.2%) for women.
| Age Bracket | Male | Female |
| Under 5 Years | 54 (30.9%) | 0 (0.0%) |
| 5 to 9 Years | 0 (0.0%) | 8 (5.2%) |
| 10 to 14 Years | 0 (0.0%) | 0 (0.0%) |
| 15 to 19 Years | 0 (0.0%) | 0 (0.0%) |
| 20 to 24 Years | 0 (0.0%) | 60 (39.2%) |
| 25 to 29 Years | 0 (0.0%) | 0 (0.0%) |
| 30 to 34 Years | 0 (0.0%) | 0 (0.0%) |
| 35 to 39 Years | 49 (28.0%) | 11 (7.2%) |
| 40 to 44 Years | 12 (6.9%) | 0 (0.0%) |
| 45 to 49 Years | 0 (0.0%) | 6 (3.9%) |
| 50 to 54 Years | 0 (0.0%) | 9 (5.9%) |
| 55 to 59 Years | 13 (7.4%) | 6 (3.9%) |
| 60 to 64 Years | 5 (2.9%) | 22 (14.4%) |
| 65 to 69 Years | 26 (14.9%) | 0 (0.0%) |
| 70 to 74 Years | 5 (2.9%) | 10 (6.5%) |
| 75 to 79 Years | 11 (6.3%) | 11 (7.2%) |
| 80 to 84 Years | 0 (0.0%) | 10 (6.5%) |
| 85 Years and over | 0 (0.0%) | 0 (0.0%) |
| Total | 175 (100.0%) | 153 (100.0%) |
Families and Households in Ranshaw
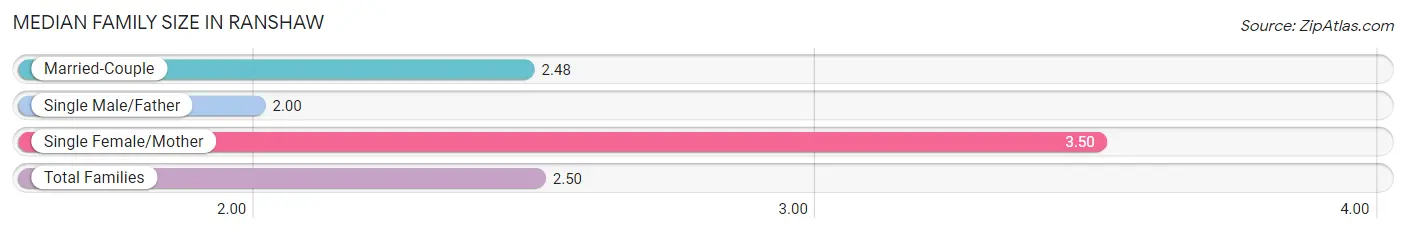
Median Family Size in Ranshaw
The median family size in Ranshaw is 2.50 persons per family, with single female/mother families (6 | 5.2%) accounting for the largest median family size of 3.5 persons per family. On the other hand, single male/father families (9 | 7.8%) represent the smallest median family size with 2.00 persons per family.
| Family Type | # Families | Family Size |
| Married-Couple | 100 (87.0%) | 2.48 |
| Single Male/Father | 9 (7.8%) | 2.00 |
| Single Female/Mother | 6 (5.2%) | 3.50 |
| Total Families | 115 (100.0%) | 2.50 |
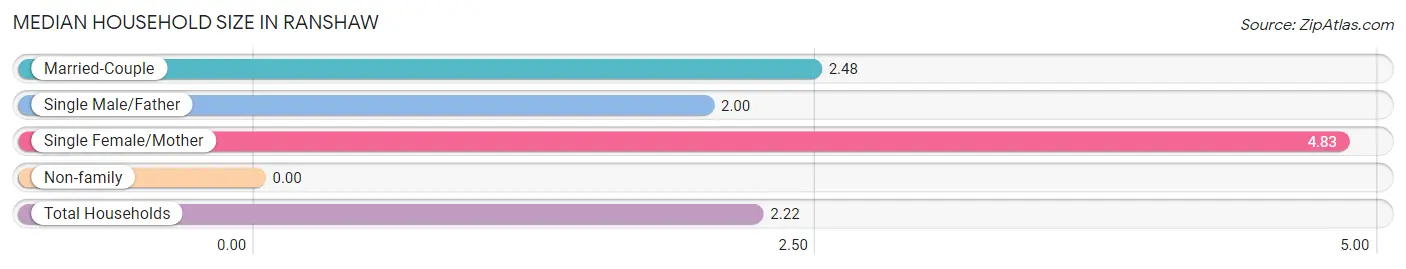
Median Household Size in Ranshaw
| Household Type | # Households | Household Size |
| Married-Couple | 100 (67.6%) | 2.48 |
| Single Male/Father | 9 (6.1%) | 2.00 |
| Single Female/Mother | 6 (4.1%) | 4.83 |
| Non-family | 33 (22.3%) | - |
| Total Households | 148 (100.0%) | 2.22 |
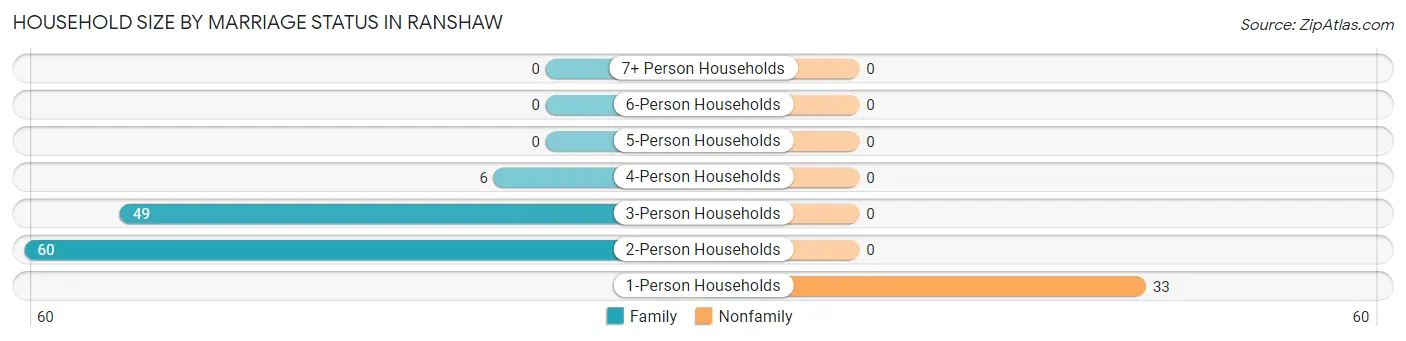
Household Size by Marriage Status in Ranshaw
Out of a total of 148 households in Ranshaw, 115 (77.7%) are family households, while 33 (22.3%) are nonfamily households. The most numerous type of family households are 2-person households, comprising 60, and the most common type of nonfamily households are 1-person households, comprising 33.
| Household Size | Family Households | Nonfamily Households |
| 1-Person Households | - | 33 (22.3%) |
| 2-Person Households | 60 (40.5%) | 0 (0.0%) |
| 3-Person Households | 49 (33.1%) | 0 (0.0%) |
| 4-Person Households | 6 (4.1%) | 0 (0.0%) |
| 5-Person Households | 0 (0.0%) | 0 (0.0%) |
| 6-Person Households | 0 (0.0%) | 0 (0.0%) |
| 7+ Person Households | 0 (0.0%) | 0 (0.0%) |
| Total | 115 (77.7%) | 33 (22.3%) |
Female Fertility in Ranshaw
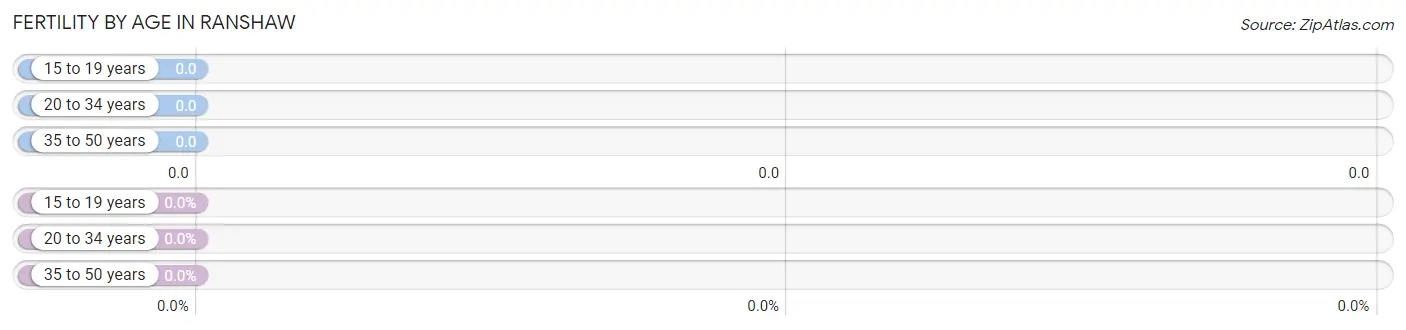
Fertility by Age in Ranshaw
| Age Bracket | Women with Births | Births / 1,000 Women |
| 15 to 19 years | 0 (0.0%) | 0.0 |
| 20 to 34 years | 0 (0.0%) | 0.0 |
| 35 to 50 years | 0 (0.0%) | 0.0 |
| Total | 0 (0.0%) | 0.0 |
Fertility by Age by Marriage Status in Ranshaw
| Age Bracket | Married | Unmarried |
| 15 to 19 years | 0 (0.0%) | 0 (0.0%) |
| 20 to 34 years | 0 (0.0%) | 0 (0.0%) |
| 35 to 50 years | 0 (0.0%) | 0 (0.0%) |
| Total | 0 (0.0%) | 0 (0.0%) |
Fertility by Education in Ranshaw
| Educational Attainment | Women with Births | Births / 1,000 Women |
| Less than High School | 0 (0.0%) | 0.0 |
| High School Diploma | 0 (0.0%) | 0.0 |
| College or Associate's Degree | 0 (0.0%) | 0.0 |
| Bachelor's Degree | 0 (0.0%) | 0.0 |
| Graduate Degree | 0 (0.0%) | 0.0 |
| Total | 0 (0.0%) | 0.0 |
Fertility by Education by Marriage Status in Ranshaw
| Educational Attainment | Married | Unmarried |
| Less than High School | 0 (0.0%) | 0 (0.0%) |
| High School Diploma | 0 (0.0%) | 0 (0.0%) |
| College or Associate's Degree | 0 (0.0%) | 0 (0.0%) |
| Bachelor's Degree | 0 (0.0%) | 0 (0.0%) |
| Graduate Degree | 0 (0.0%) | 0 (0.0%) |
| Total | 0 (0.0%) | 0 (0.0%) |
Income in Ranshaw
Income Overview in Ranshaw
Per Capita Income in Ranshaw is $22,886, while median incomes of families and households are $65,791 and $47,321 respectively.
| Characteristic | Number | Measure |
| Per Capita Income | 328 | $22,886 |
| Median Family Income | 115 | $65,791 |
| Mean Family Income | 115 | $58,532 |
| Median Household Income | 148 | $47,321 |
| Mean Household Income | 148 | $50,741 |
| Income Deficit | 115 | $0 |
| Wage / Income Gap (%) | 328 | 68.02% |
| Wage / Income Gap ($) | 328 | 31.98¢ per $1 |
| Gini / Inequality Index | 328 | 0.29 |
Earnings by Sex in Ranshaw
Average Earnings in Ranshaw are $26,818, $50,969 for men and $16,298 for women, a difference of 68.0%.
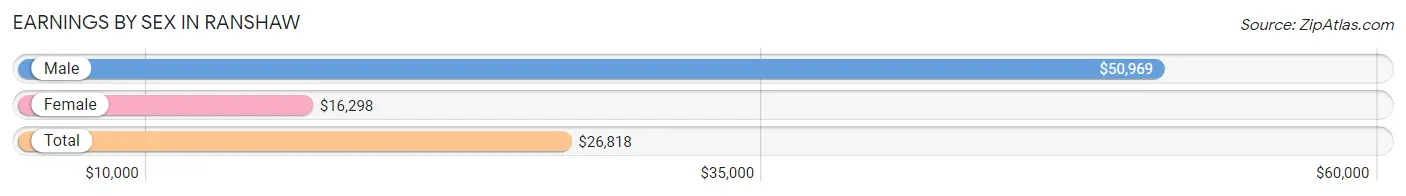
| Sex | Number | Average Earnings |
| Male | 84 (46.7%) | $50,969 |
| Female | 96 (53.3%) | $16,298 |
| Total | 180 (100.0%) | $26,818 |
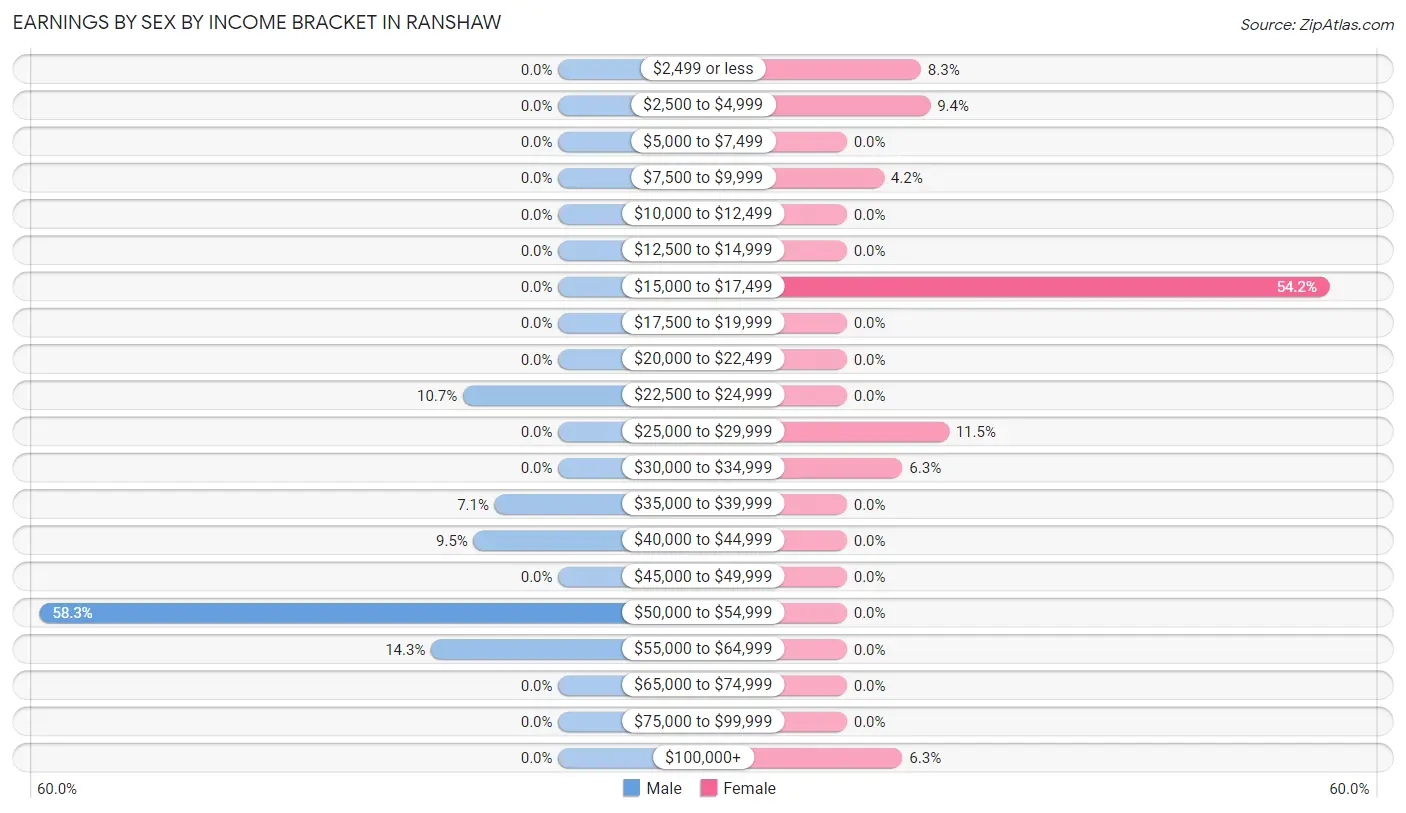
Earnings by Sex by Income Bracket in Ranshaw
The most common earnings brackets in Ranshaw are $50,000 to $54,999 for men (49 | 58.3%) and $15,000 to $17,499 for women (52 | 54.2%).
| Income | Male | Female |
| $2,499 or less | 0 (0.0%) | 8 (8.3%) |
| $2,500 to $4,999 | 0 (0.0%) | 9 (9.4%) |
| $5,000 to $7,499 | 0 (0.0%) | 0 (0.0%) |
| $7,500 to $9,999 | 0 (0.0%) | 4 (4.2%) |
| $10,000 to $12,499 | 0 (0.0%) | 0 (0.0%) |
| $12,500 to $14,999 | 0 (0.0%) | 0 (0.0%) |
| $15,000 to $17,499 | 0 (0.0%) | 52 (54.2%) |
| $17,500 to $19,999 | 0 (0.0%) | 0 (0.0%) |
| $20,000 to $22,499 | 0 (0.0%) | 0 (0.0%) |
| $22,500 to $24,999 | 9 (10.7%) | 0 (0.0%) |
| $25,000 to $29,999 | 0 (0.0%) | 11 (11.5%) |
| $30,000 to $34,999 | 0 (0.0%) | 6 (6.2%) |
| $35,000 to $39,999 | 6 (7.1%) | 0 (0.0%) |
| $40,000 to $44,999 | 8 (9.5%) | 0 (0.0%) |
| $45,000 to $49,999 | 0 (0.0%) | 0 (0.0%) |
| $50,000 to $54,999 | 49 (58.3%) | 0 (0.0%) |
| $55,000 to $64,999 | 12 (14.3%) | 0 (0.0%) |
| $65,000 to $74,999 | 0 (0.0%) | 0 (0.0%) |
| $75,000 to $99,999 | 0 (0.0%) | 0 (0.0%) |
| $100,000+ | 0 (0.0%) | 6 (6.2%) |
| Total | 84 (100.0%) | 96 (100.0%) |
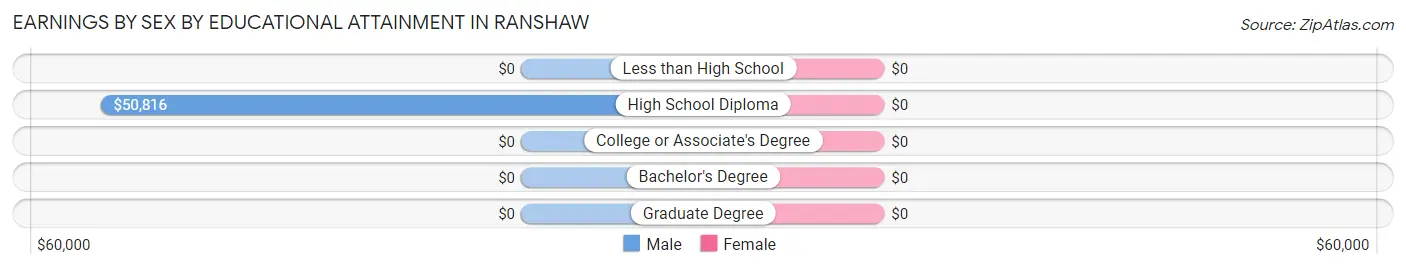
Earnings by Sex by Educational Attainment in Ranshaw
| Educational Attainment | Male Income | Female Income |
| Less than High School | - | - |
| High School Diploma | $50,816 | $0 |
| College or Associate's Degree | - | - |
| Bachelor's Degree | - | - |
| Graduate Degree | - | - |
| Total | $50,969 | $26,136 |
Family Income in Ranshaw
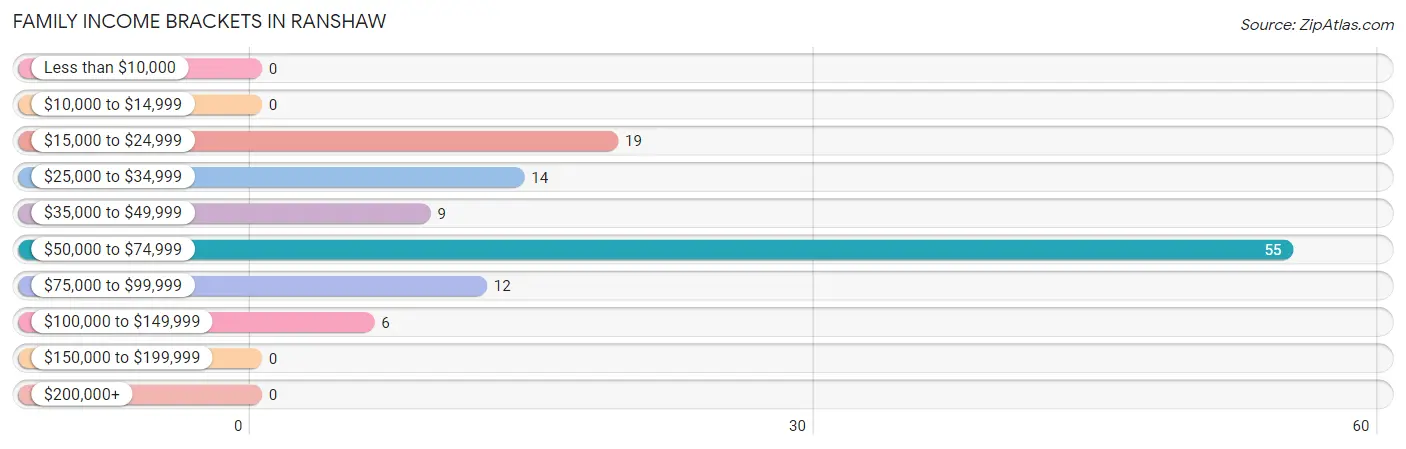
Family Income Brackets in Ranshaw
According to the Ranshaw family income data, there are 55 families falling into the $50,000 to $74,999 income range, which is the most common income bracket and makes up 47.8% of all families.
| Income Bracket | # Families | % Families |
| Less than $10,000 | 0 | 0.0% |
| $10,000 to $14,999 | 0 | 0.0% |
| $15,000 to $24,999 | 19 | 16.5% |
| $25,000 to $34,999 | 14 | 12.2% |
| $35,000 to $49,999 | 9 | 7.8% |
| $50,000 to $74,999 | 55 | 47.8% |
| $75,000 to $99,999 | 12 | 10.4% |
| $100,000 to $149,999 | 6 | 5.2% |
| $150,000 to $199,999 | 0 | 0.0% |
| $200,000+ | 0 | 0.0% |
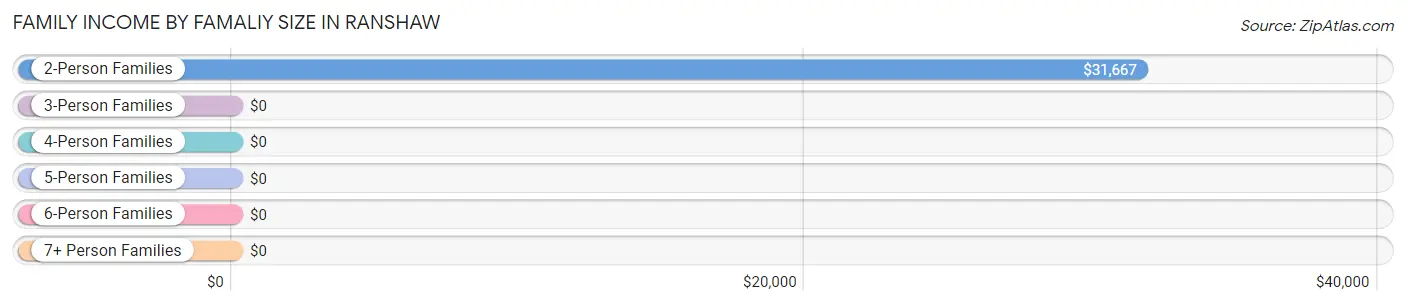
Family Income by Famaliy Size in Ranshaw
2-person families (60 | 52.2%) account for the highest median family income in Ranshaw with $31,667 per family, while 2-person families (60 | 52.2%) have the highest median income of $15,834 per family member.
| Income Bracket | # Families | Median Income |
| 2-Person Families | 60 (52.2%) | $31,667 |
| 3-Person Families | 55 (47.8%) | $0 |
| 4-Person Families | 0 (0.0%) | $0 |
| 5-Person Families | 0 (0.0%) | $0 |
| 6-Person Families | 0 (0.0%) | $0 |
| 7+ Person Families | 0 (0.0%) | $0 |
| Total | 115 (100.0%) | $65,791 |
Family Income by Number of Earners in Ranshaw
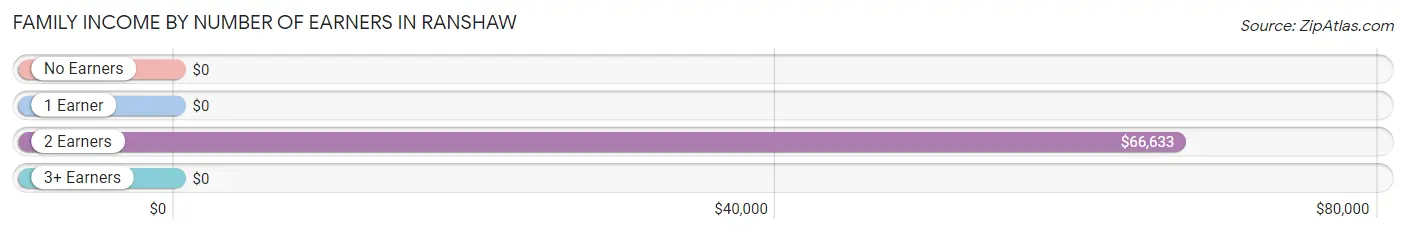
| Number of Earners | # Families | Median Income |
| No Earners | 19 (16.5%) | $0 |
| 1 Earner | 14 (12.2%) | $0 |
| 2 Earners | 82 (71.3%) | $66,633 |
| 3+ Earners | 0 (0.0%) | $0 |
| Total | 115 (100.0%) | $65,791 |
Household Income in Ranshaw
Household Income Brackets in Ranshaw
With 55 households falling in the category, the $50,000 to $74,999 income range is the most frequent in Ranshaw, accounting for 37.2% of all households.
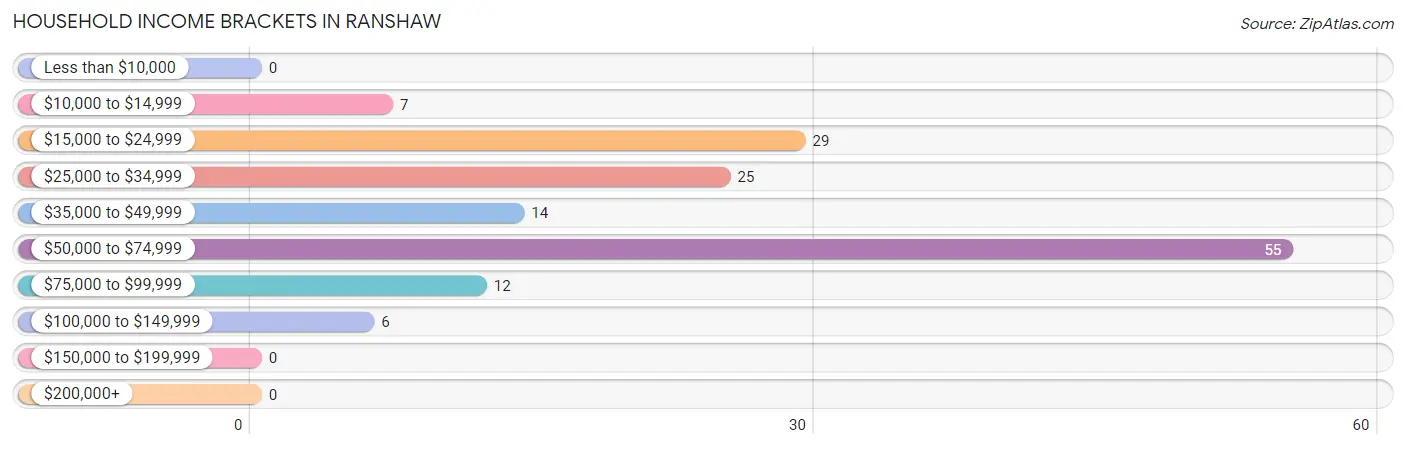
| Income Bracket | # Households | % Households |
| Less than $10,000 | 0 | 0.0% |
| $10,000 to $14,999 | 7 | 4.7% |
| $15,000 to $24,999 | 29 | 19.6% |
| $25,000 to $34,999 | 25 | 16.9% |
| $35,000 to $49,999 | 14 | 9.5% |
| $50,000 to $74,999 | 55 | 37.2% |
| $75,000 to $99,999 | 12 | 8.1% |
| $100,000 to $149,999 | 6 | 4.1% |
| $150,000 to $199,999 | 0 | 0.0% |
| $200,000+ | 0 | 0.0% |
Household Income by Householder Age in Ranshaw
The median household income in Ranshaw is $47,321, with the highest median household income of $46,250 found in the 45 to 64 years age bracket for the primary householder. A total of 33 households (22.3%) fall into this category.
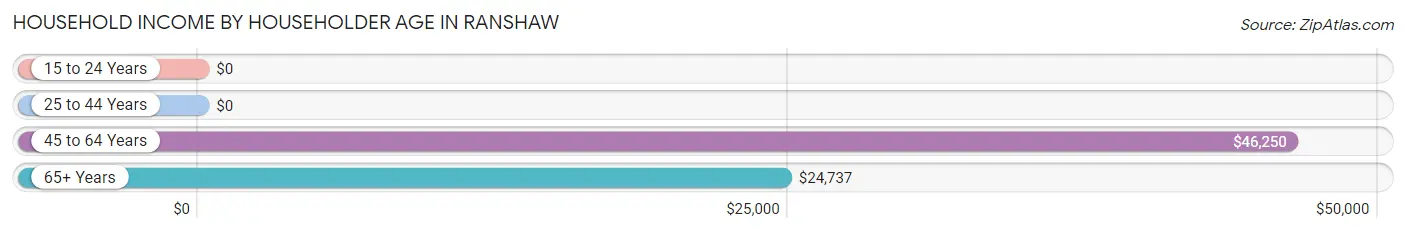
| Income Bracket | # Households | Median Income |
| 15 to 24 Years | 0 (0.0%) | $0 |
| 25 to 44 Years | 61 (41.2%) | $0 |
| 45 to 64 Years | 33 (22.3%) | $46,250 |
| 65+ Years | 54 (36.5%) | $24,737 |
| Total | 148 (100.0%) | $47,321 |
Poverty in Ranshaw
Income Below Poverty by Sex and Age in Ranshaw
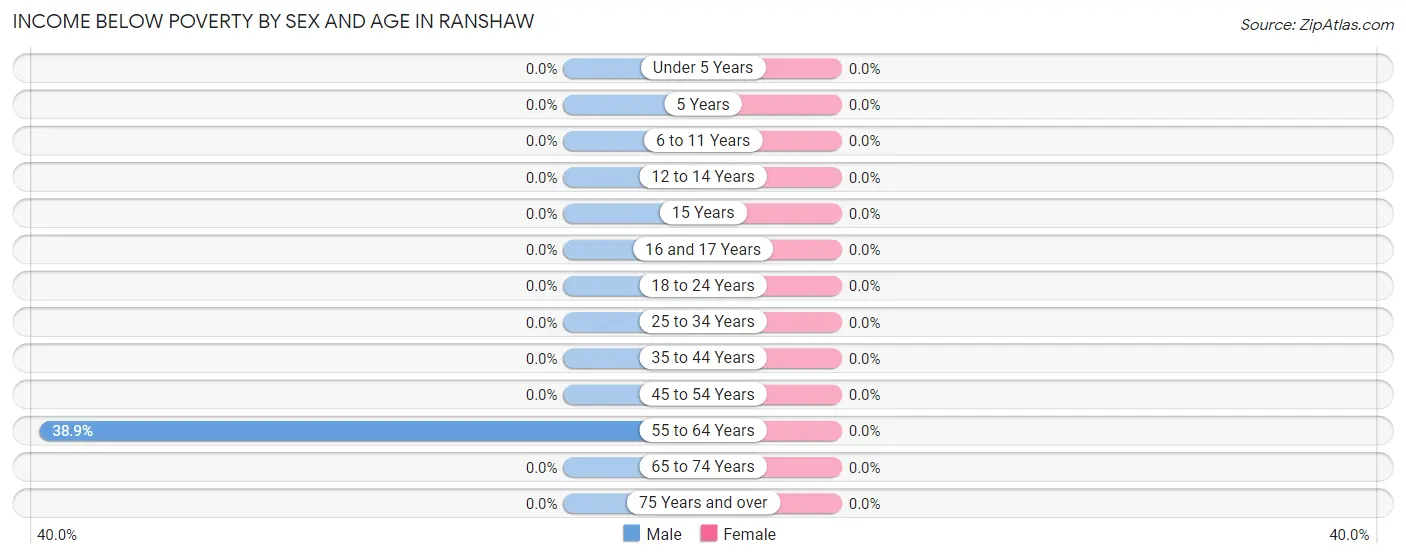
| Age Bracket | Male | Female |
| Under 5 Years | 0 (0.0%) | 0 (0.0%) |
| 5 Years | 0 (0.0%) | 0 (0.0%) |
| 6 to 11 Years | 0 (0.0%) | 0 (0.0%) |
| 12 to 14 Years | 0 (0.0%) | 0 (0.0%) |
| 15 Years | 0 (0.0%) | 0 (0.0%) |
| 16 and 17 Years | 0 (0.0%) | 0 (0.0%) |
| 18 to 24 Years | 0 (0.0%) | 0 (0.0%) |
| 25 to 34 Years | 0 (0.0%) | 0 (0.0%) |
| 35 to 44 Years | 0 (0.0%) | 0 (0.0%) |
| 45 to 54 Years | 0 (0.0%) | 0 (0.0%) |
| 55 to 64 Years | 7 (38.9%) | 0 (0.0%) |
| 65 to 74 Years | 0 (0.0%) | 0 (0.0%) |
| 75 Years and over | 0 (0.0%) | 0 (0.0%) |
| Total | 7 (4.0%) | 0 (0.0%) |
Income Above Poverty by Sex and Age in Ranshaw
According to the poverty statistics in Ranshaw, males aged under 5 years and females aged 18 to 24 years are the age groups that are most secure financially, with 100.0% of males and 100.0% of females in these age groups living above the poverty line.
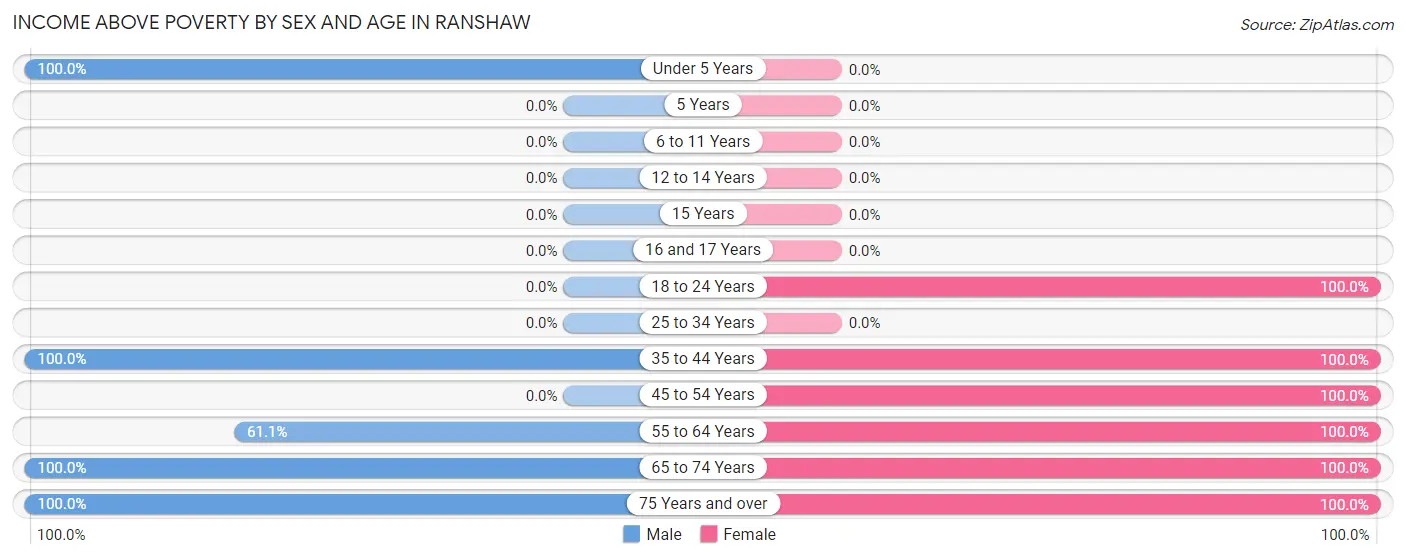
| Age Bracket | Male | Female |
| Under 5 Years | 54 (100.0%) | 0 (0.0%) |
| 5 Years | 0 (0.0%) | 0 (0.0%) |
| 6 to 11 Years | 0 (0.0%) | 0 (0.0%) |
| 12 to 14 Years | 0 (0.0%) | 0 (0.0%) |
| 15 Years | 0 (0.0%) | 0 (0.0%) |
| 16 and 17 Years | 0 (0.0%) | 0 (0.0%) |
| 18 to 24 Years | 0 (0.0%) | 60 (100.0%) |
| 25 to 34 Years | 0 (0.0%) | 0 (0.0%) |
| 35 to 44 Years | 61 (100.0%) | 11 (100.0%) |
| 45 to 54 Years | 0 (0.0%) | 15 (100.0%) |
| 55 to 64 Years | 11 (61.1%) | 28 (100.0%) |
| 65 to 74 Years | 31 (100.0%) | 10 (100.0%) |
| 75 Years and over | 11 (100.0%) | 21 (100.0%) |
| Total | 168 (96.0%) | 145 (100.0%) |
Income Below Poverty Among Married-Couple Families in Ranshaw
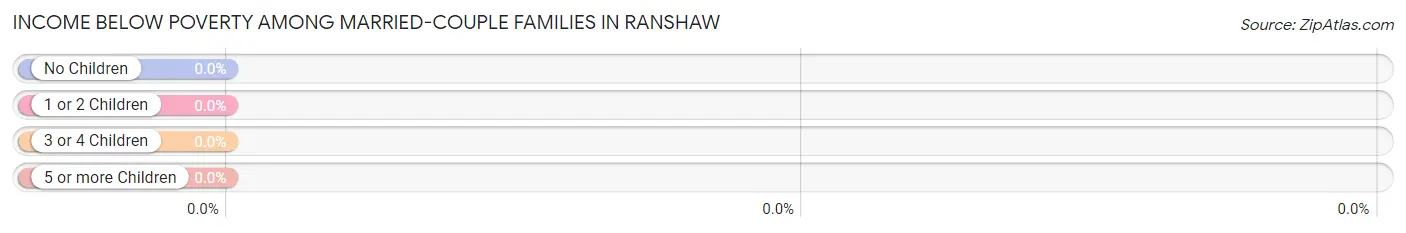
| Children | Above Poverty | Below Poverty |
| No Children | 51 (100.0%) | 0 (0.0%) |
| 1 or 2 Children | 49 (100.0%) | 0 (0.0%) |
| 3 or 4 Children | 0 (0.0%) | 0 (0.0%) |
| 5 or more Children | 0 (0.0%) | 0 (0.0%) |
| Total | 100 (100.0%) | 0 (0.0%) |
Income Below Poverty Among Single-Parent Households in Ranshaw
| Children | Single Father | Single Mother |
| No Children | 0 (0.0%) | 0 (0.0%) |
| 1 or 2 Children | 0 (0.0%) | 0 (0.0%) |
| 3 or 4 Children | 0 (0.0%) | 0 (0.0%) |
| 5 or more Children | 0 (0.0%) | 0 (0.0%) |
| Total | 0 (0.0%) | 0 (0.0%) |
Income Below Poverty Among Married-Couple vs Single-Parent Households in Ranshaw
| Children | Married-Couple Families | Single-Parent Households |
| No Children | 0 (0.0%) | 0 (0.0%) |
| 1 or 2 Children | 0 (0.0%) | 0 (0.0%) |
| 3 or 4 Children | 0 (0.0%) | 0 (0.0%) |
| 5 or more Children | 0 (0.0%) | 0 (0.0%) |
| Total | 0 (0.0%) | 0 (0.0%) |
Employment Characteristics in Ranshaw
Employment by Class of Employer in Ranshaw
Among the 163 employed individuals in Ranshaw, private company employees (151 | 92.6%), and state government employees (12 | 7.4%) make up the most common classes of employment.
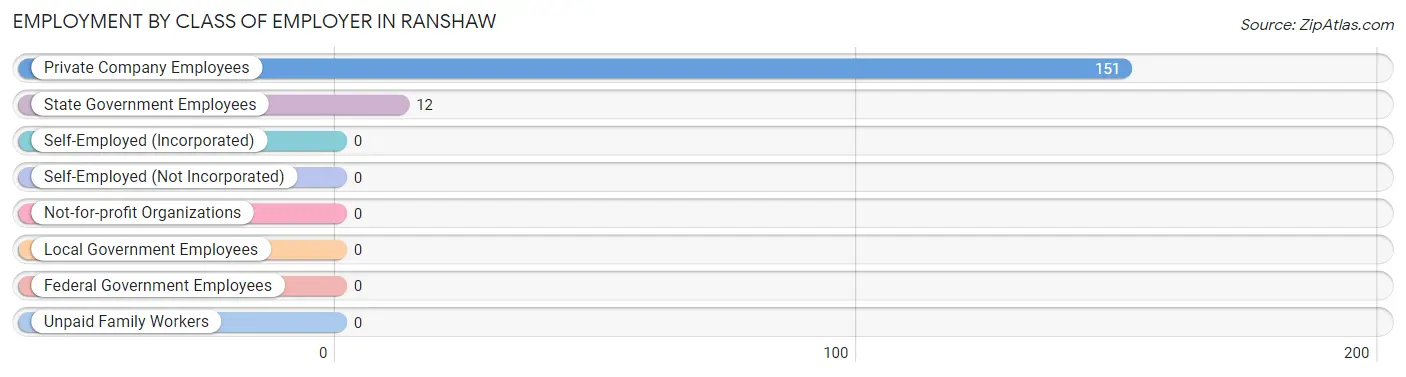
| Employer Class | # Employees | % Employees |
| Private Company Employees | 151 | 92.6% |
| Self-Employed (Incorporated) | 0 | 0.0% |
| Self-Employed (Not Incorporated) | 0 | 0.0% |
| Not-for-profit Organizations | 0 | 0.0% |
| Local Government Employees | 0 | 0.0% |
| State Government Employees | 12 | 7.4% |
| Federal Government Employees | 0 | 0.0% |
| Unpaid Family Workers | 0 | 0.0% |
| Total | 163 | 100.0% |
Employment Status by Age in Ranshaw
According to the labor force statistics for Ranshaw, out of the total population over 16 years of age (266), 67.7% or 180 individuals are in the labor force, with 4.4% or 8 of them unemployed. The age group with the highest labor force participation rate is 20 to 24 years, with 100.0% or 60 individuals in the labor force. Within the labor force, the 20 to 24 years age range has the highest percentage of unemployed individuals, with 13.3% or 8 of them being unemployed.
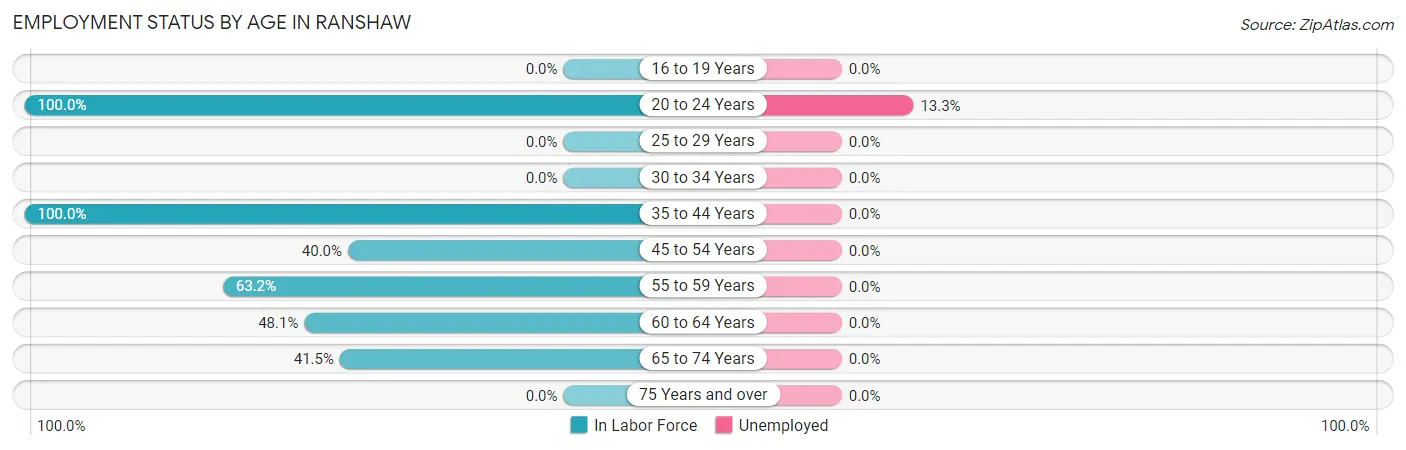
| Age Bracket | In Labor Force | Unemployed |
| 16 to 19 Years | 0 (0.0%) | 0 (0.0%) |
| 20 to 24 Years | 60 (100.0%) | 8 (13.3%) |
| 25 to 29 Years | 0 (0.0%) | 0 (0.0%) |
| 30 to 34 Years | 0 (0.0%) | 0 (0.0%) |
| 35 to 44 Years | 72 (100.0%) | 0 (0.0%) |
| 45 to 54 Years | 6 (40.0%) | 0 (0.0%) |
| 55 to 59 Years | 12 (63.2%) | 0 (0.0%) |
| 60 to 64 Years | 13 (48.1%) | 0 (0.0%) |
| 65 to 74 Years | 17 (41.5%) | 0 (0.0%) |
| 75 Years and over | 0 (0.0%) | 0 (0.0%) |
| Total | 180 (67.7%) | 8 (4.4%) |
Employment Status by Educational Attainment in Ranshaw
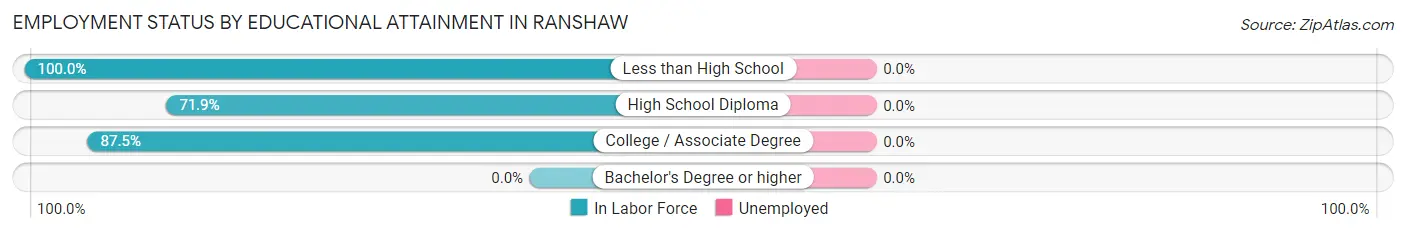
| Educational Attainment | In Labor Force | Unemployed |
| Less than High School | 4 (100.0%) | 0 (0.0%) |
| High School Diploma | 64 (71.9%) | 0 (0.0%) |
| College / Associate Degree | 35 (87.5%) | 0 (0.0%) |
| Bachelor's Degree or higher | 0 (0.0%) | 0 (0.0%) |
| Total | 103 (77.4%) | 0 (0.0%) |
Employment Occupations by Sex in Ranshaw
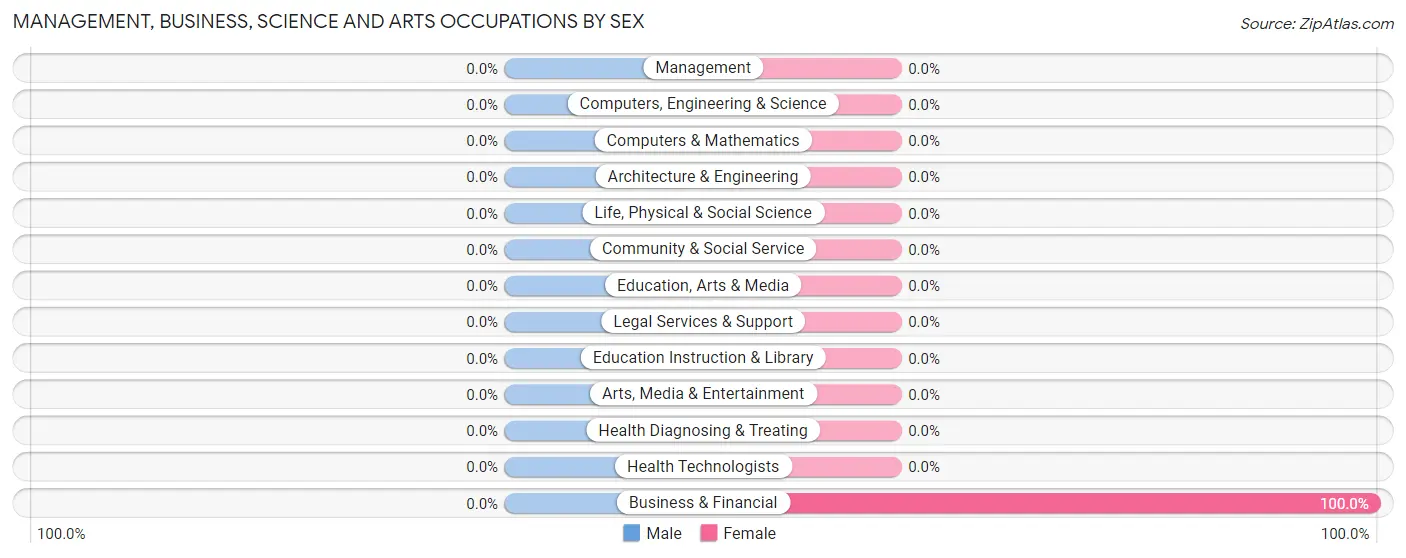
Management, Business, Science and Arts Occupations
The most common Management, Business, Science and Arts occupations in Ranshaw are , and Business & Financial (6 | 3.5%).
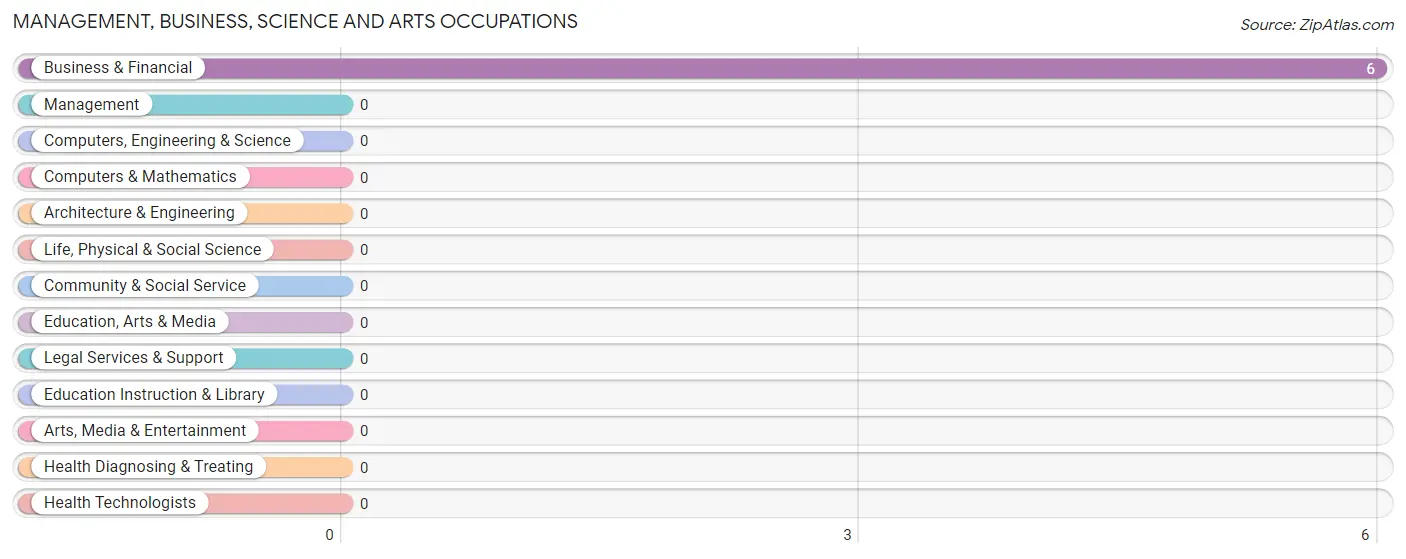
Management, Business, Science and Arts Occupations by Sex
| Occupation | Male | Female |
| Management | 0 (0.0%) | 0 (0.0%) |
| Business & Financial | 0 (0.0%) | 6 (100.0%) |
| Computers, Engineering & Science | 0 (0.0%) | 0 (0.0%) |
| Computers & Mathematics | 0 (0.0%) | 0 (0.0%) |
| Architecture & Engineering | 0 (0.0%) | 0 (0.0%) |
| Life, Physical & Social Science | 0 (0.0%) | 0 (0.0%) |
| Community & Social Service | 0 (0.0%) | 0 (0.0%) |
| Education, Arts & Media | 0 (0.0%) | 0 (0.0%) |
| Legal Services & Support | 0 (0.0%) | 0 (0.0%) |
| Education Instruction & Library | 0 (0.0%) | 0 (0.0%) |
| Arts, Media & Entertainment | 0 (0.0%) | 0 (0.0%) |
| Health Diagnosing & Treating | 0 (0.0%) | 0 (0.0%) |
| Health Technologists | 0 (0.0%) | 0 (0.0%) |
| Total (Category) | 0 (0.0%) | 6 (100.0%) |
| Total (Overall) | 84 (48.8%) | 88 (51.2%) |
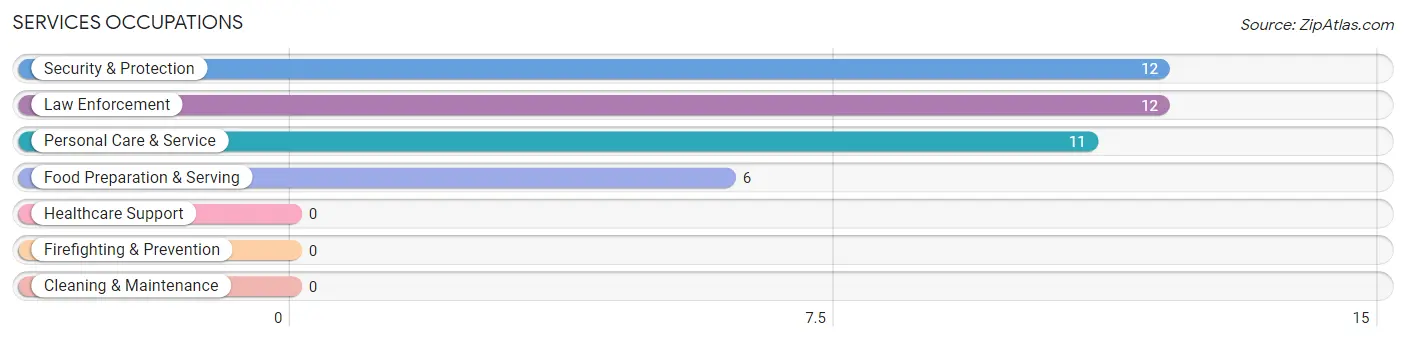
Services Occupations
The most common Services occupations in Ranshaw are Security & Protection (12 | 7.0%), Law Enforcement (12 | 7.0%), Personal Care & Service (11 | 6.4%), and Food Preparation & Serving (6 | 3.5%).
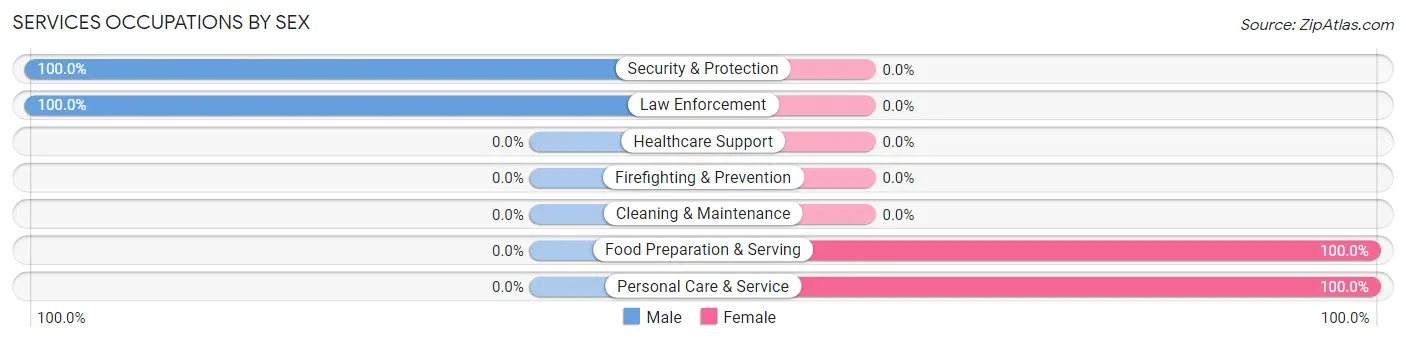
Services Occupations by Sex
Within the Services occupations in Ranshaw, the most male-oriented occupations are Security & Protection (100.0%), and Law Enforcement (100.0%), while the most female-oriented occupations are Food Preparation & Serving (100.0%), and Personal Care & Service (100.0%).
| Occupation | Male | Female |
| Healthcare Support | 0 (0.0%) | 0 (0.0%) |
| Security & Protection | 12 (100.0%) | 0 (0.0%) |
| Firefighting & Prevention | 0 (0.0%) | 0 (0.0%) |
| Law Enforcement | 12 (100.0%) | 0 (0.0%) |
| Food Preparation & Serving | 0 (0.0%) | 6 (100.0%) |
| Cleaning & Maintenance | 0 (0.0%) | 0 (0.0%) |
| Personal Care & Service | 0 (0.0%) | 11 (100.0%) |
| Total (Category) | 12 (41.4%) | 17 (58.6%) |
| Total (Overall) | 84 (48.8%) | 88 (51.2%) |
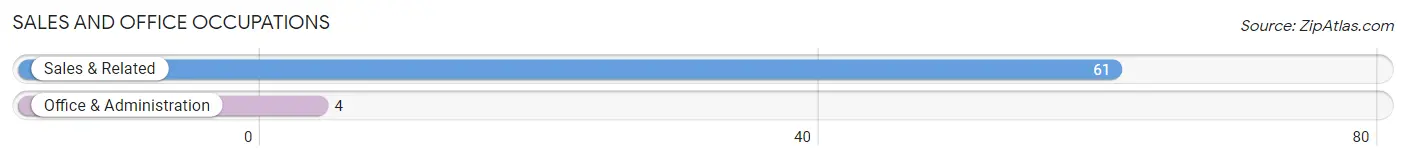
Sales and Office Occupations
The most common Sales and Office occupations in Ranshaw are Sales & Related (61 | 35.5%), and Office & Administration (4 | 2.3%).
Sales and Office Occupations by Sex
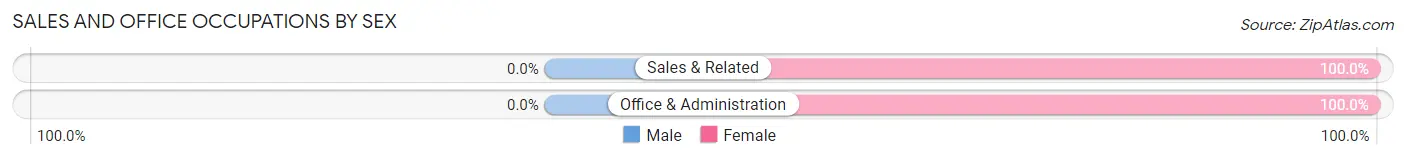
| Occupation | Male | Female |
| Sales & Related | 0 (0.0%) | 61 (100.0%) |
| Office & Administration | 0 (0.0%) | 4 (100.0%) |
| Total (Category) | 0 (0.0%) | 65 (100.0%) |
| Total (Overall) | 84 (48.8%) | 88 (51.2%) |
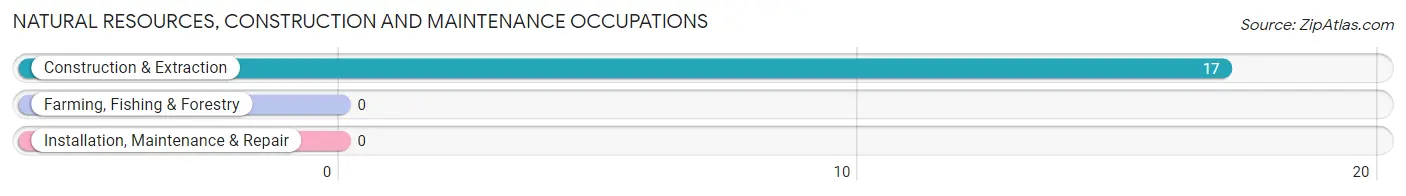
Natural Resources, Construction and Maintenance Occupations
The most common Natural Resources, Construction and Maintenance occupations in Ranshaw are , and Construction & Extraction (17 | 9.9%).
Natural Resources, Construction and Maintenance Occupations by Sex
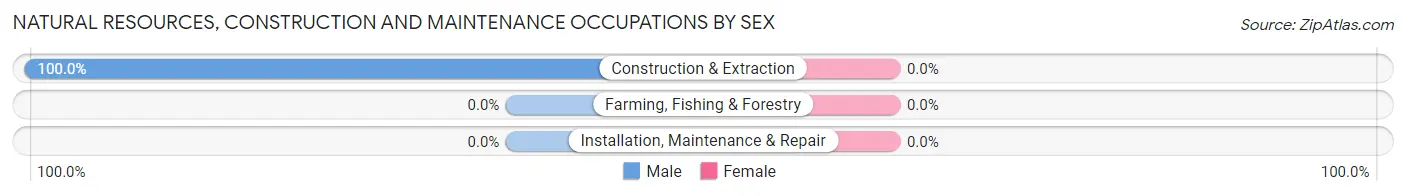
| Occupation | Male | Female |
| Farming, Fishing & Forestry | 0 (0.0%) | 0 (0.0%) |
| Construction & Extraction | 17 (100.0%) | 0 (0.0%) |
| Installation, Maintenance & Repair | 0 (0.0%) | 0 (0.0%) |
| Total (Category) | 17 (100.0%) | 0 (0.0%) |
| Total (Overall) | 84 (48.8%) | 88 (51.2%) |
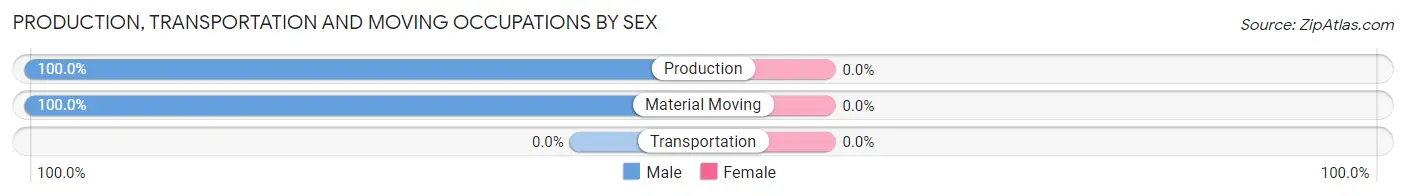
Production, Transportation and Moving Occupations
The most common Production, Transportation and Moving occupations in Ranshaw are Production (49 | 28.5%), and Material Moving (6 | 3.5%).
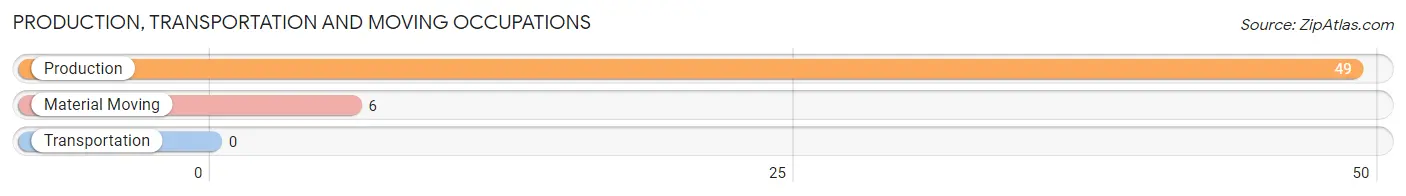
Production, Transportation and Moving Occupations by Sex
| Occupation | Male | Female |
| Production | 49 (100.0%) | 0 (0.0%) |
| Transportation | 0 (0.0%) | 0 (0.0%) |
| Material Moving | 6 (100.0%) | 0 (0.0%) |
| Total (Category) | 55 (100.0%) | 0 (0.0%) |
| Total (Overall) | 84 (48.8%) | 88 (51.2%) |
Employment Industries by Sex in Ranshaw
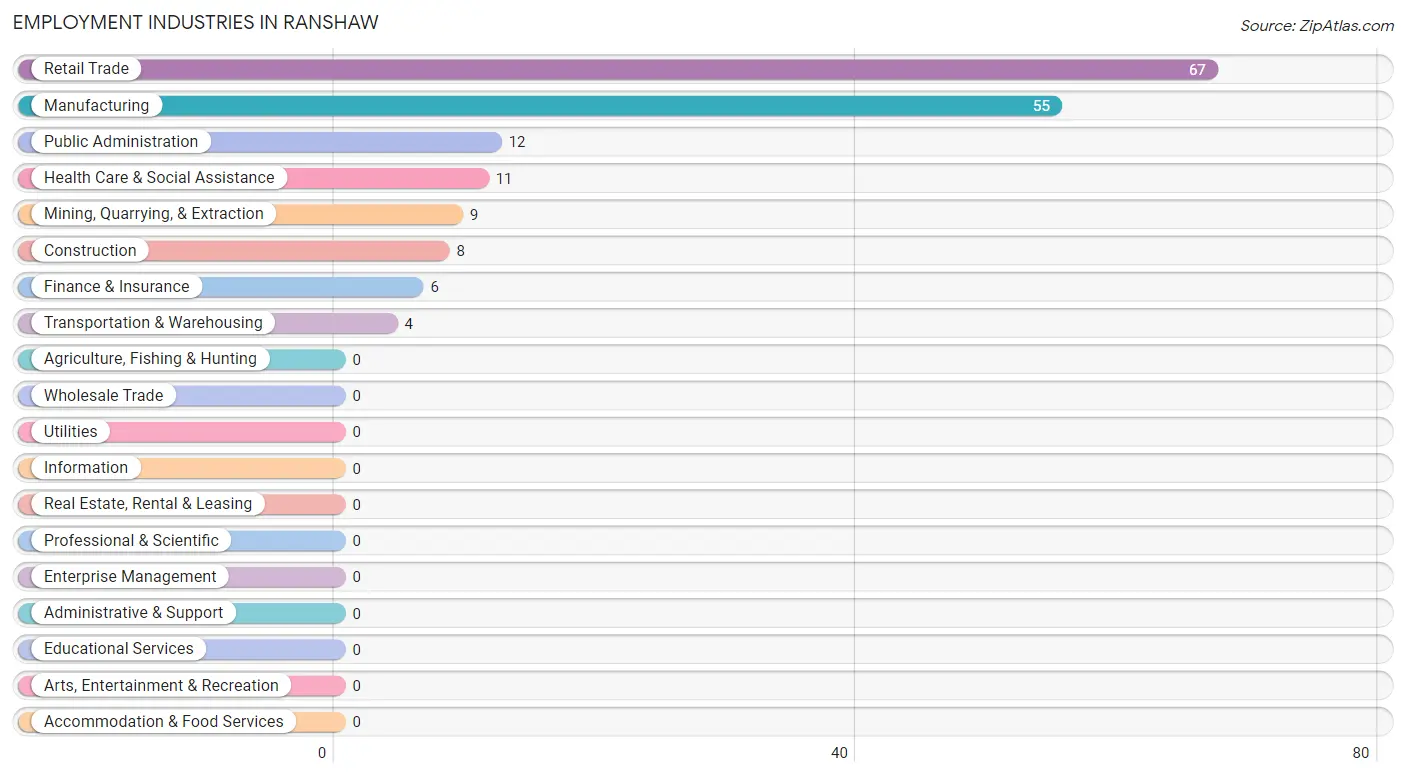
Employment Industries in Ranshaw
The major employment industries in Ranshaw include Retail Trade (67 | 39.0%), Manufacturing (55 | 32.0%), Public Administration (12 | 7.0%), Health Care & Social Assistance (11 | 6.4%), and Mining, Quarrying, & Extraction (9 | 5.2%).
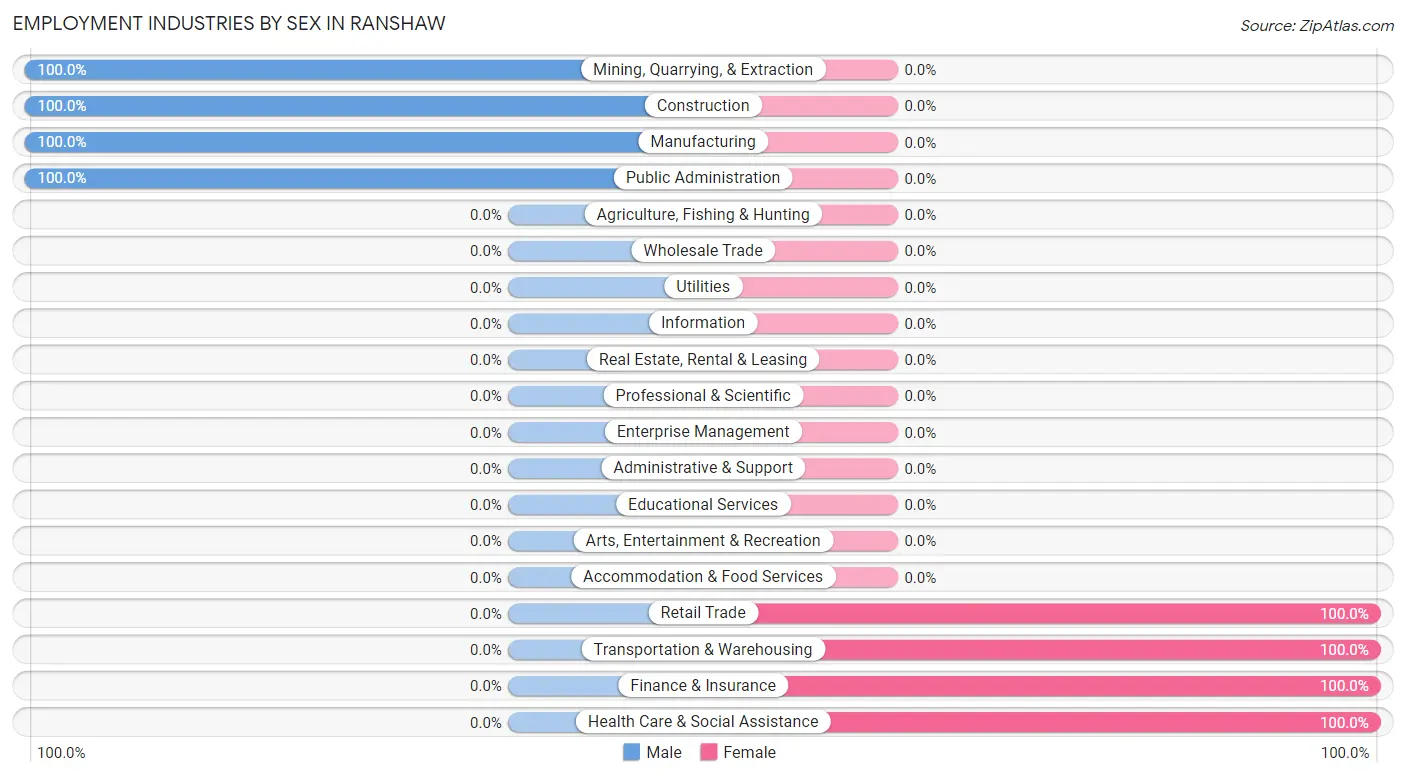
Employment Industries by Sex in Ranshaw
The Ranshaw industries that see more men than women are Mining, Quarrying, & Extraction (100.0%), Construction (100.0%), and Manufacturing (100.0%), whereas the industries that tend to have a higher number of women are Retail Trade (100.0%), Transportation & Warehousing (100.0%), and Finance & Insurance (100.0%).
| Industry | Male | Female |
| Agriculture, Fishing & Hunting | 0 (0.0%) | 0 (0.0%) |
| Mining, Quarrying, & Extraction | 9 (100.0%) | 0 (0.0%) |
| Construction | 8 (100.0%) | 0 (0.0%) |
| Manufacturing | 55 (100.0%) | 0 (0.0%) |
| Wholesale Trade | 0 (0.0%) | 0 (0.0%) |
| Retail Trade | 0 (0.0%) | 67 (100.0%) |
| Transportation & Warehousing | 0 (0.0%) | 4 (100.0%) |
| Utilities | 0 (0.0%) | 0 (0.0%) |
| Information | 0 (0.0%) | 0 (0.0%) |
| Finance & Insurance | 0 (0.0%) | 6 (100.0%) |
| Real Estate, Rental & Leasing | 0 (0.0%) | 0 (0.0%) |
| Professional & Scientific | 0 (0.0%) | 0 (0.0%) |
| Enterprise Management | 0 (0.0%) | 0 (0.0%) |
| Administrative & Support | 0 (0.0%) | 0 (0.0%) |
| Educational Services | 0 (0.0%) | 0 (0.0%) |
| Health Care & Social Assistance | 0 (0.0%) | 11 (100.0%) |
| Arts, Entertainment & Recreation | 0 (0.0%) | 0 (0.0%) |
| Accommodation & Food Services | 0 (0.0%) | 0 (0.0%) |
| Public Administration | 12 (100.0%) | 0 (0.0%) |
| Total | 84 (48.8%) | 88 (51.2%) |
Education in Ranshaw
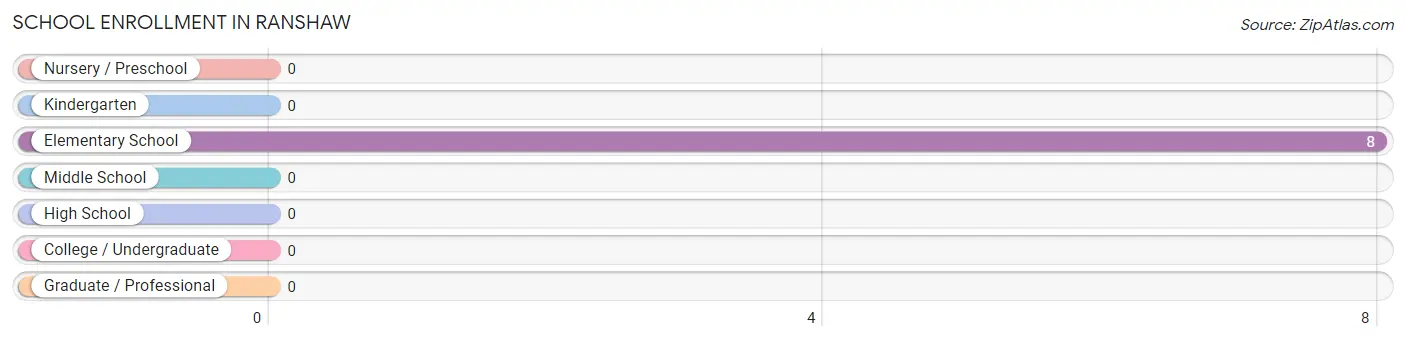
School Enrollment in Ranshaw
| School Level | # Students | % Students |
| Nursery / Preschool | 0 | 0.0% |
| Kindergarten | 0 | 0.0% |
| Elementary School | 8 | 100.0% |
| Middle School | 0 | 0.0% |
| High School | 0 | 0.0% |
| College / Undergraduate | 0 | 0.0% |
| Graduate / Professional | 0 | 0.0% |
| Total | 8 | 100.0% |
School Enrollment by Age by Funding Source in Ranshaw
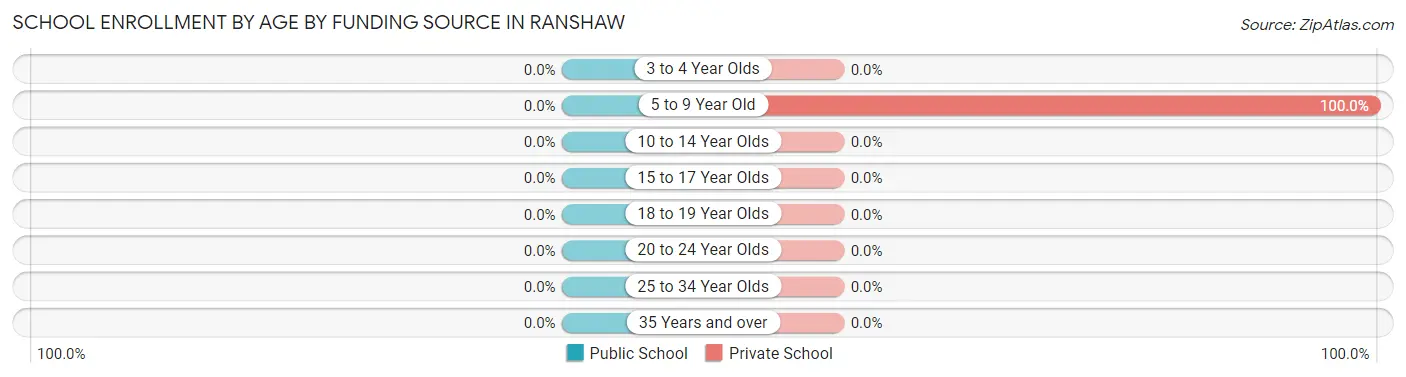
| Age Bracket | Public School | Private School |
| 3 to 4 Year Olds | 0 (0.0%) | 0 (0.0%) |
| 5 to 9 Year Old | 0 (0.0%) | 8 (100.0%) |
| 10 to 14 Year Olds | 0 (0.0%) | 0 (0.0%) |
| 15 to 17 Year Olds | 0 (0.0%) | 0 (0.0%) |
| 18 to 19 Year Olds | 0 (0.0%) | 0 (0.0%) |
| 20 to 24 Year Olds | 0 (0.0%) | 0 (0.0%) |
| 25 to 34 Year Olds | 0 (0.0%) | 0 (0.0%) |
| 35 Years and over | 0 (0.0%) | 0 (0.0%) |
| Total | 0 (0.0%) | 8 (100.0%) |
Educational Attainment by Field of Study in Ranshaw
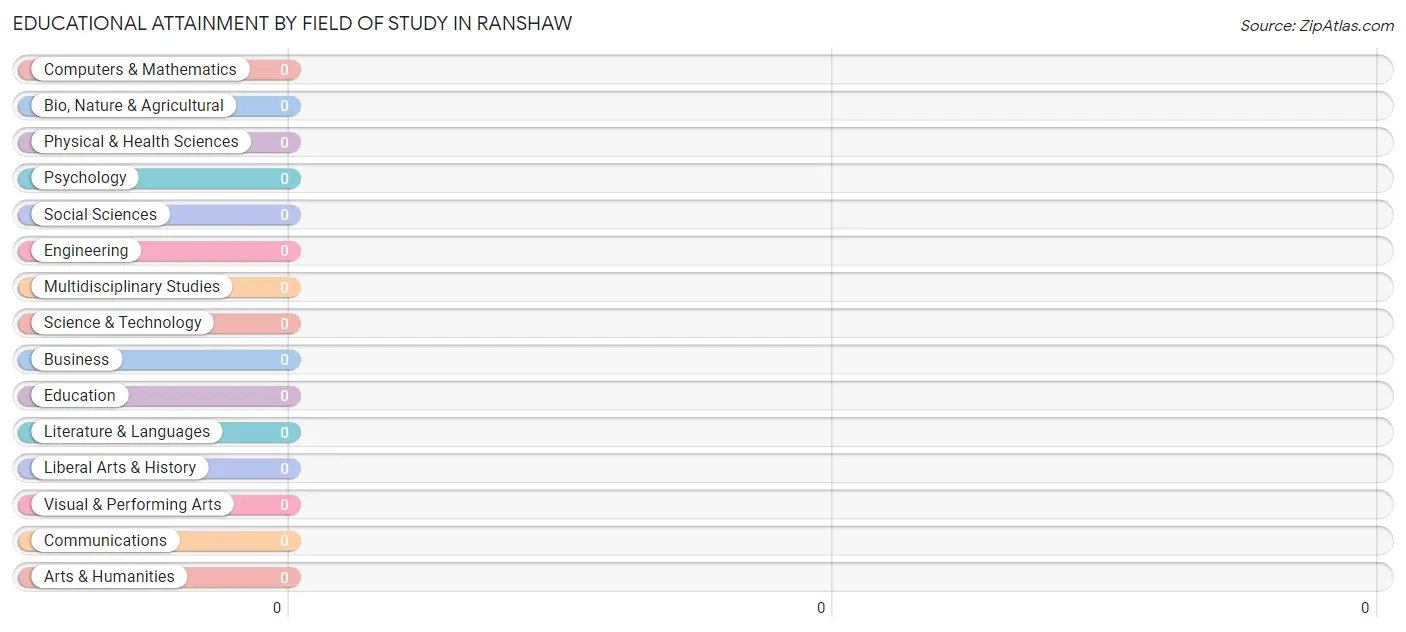
| Field of Study | # Graduates | % Graduates |
| Computers & Mathematics | 0 | 0.0% |
| Bio, Nature & Agricultural | 0 | 0.0% |
| Physical & Health Sciences | 0 | 0.0% |
| Psychology | 0 | 0.0% |
| Social Sciences | 0 | 0.0% |
| Engineering | 0 | 0.0% |
| Multidisciplinary Studies | 0 | 0.0% |
| Science & Technology | 0 | 0.0% |
| Business | 0 | 0.0% |
| Education | 0 | 0.0% |
| Literature & Languages | 0 | 0.0% |
| Liberal Arts & History | 0 | 0.0% |
| Visual & Performing Arts | 0 | 0.0% |
| Communications | 0 | 0.0% |
| Arts & Humanities | 0 | 0.0% |
| Total | 0 | 0.0% |
Transportation & Commute in Ranshaw
Vehicle Availability by Sex in Ranshaw
The most prevalent vehicle ownership categories in Ranshaw are males with 3 vehicles (58, accounting for 69.1%) and females with 3 vehicles (52, making up 73.4%).
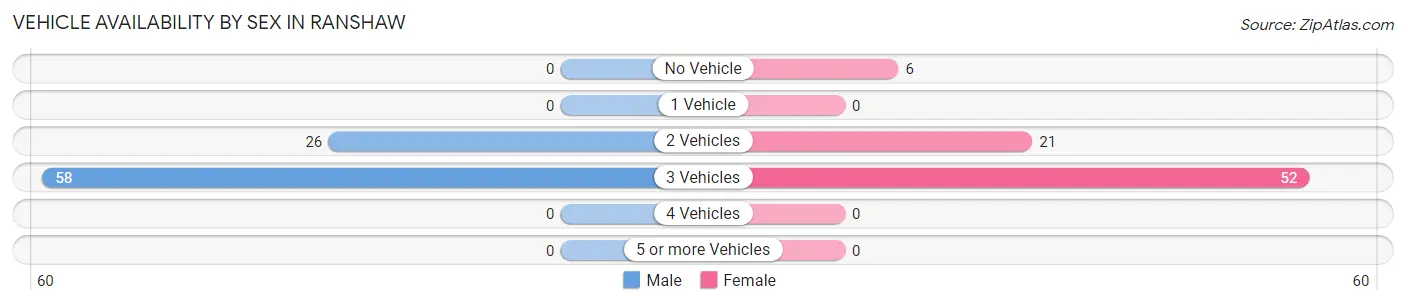
| Vehicles Available | Male | Female |
| No Vehicle | 0 (0.0%) | 6 (7.6%) |
| 1 Vehicle | 0 (0.0%) | 0 (0.0%) |
| 2 Vehicles | 26 (30.9%) | 21 (26.6%) |
| 3 Vehicles | 58 (69.1%) | 52 (65.8%) |
| 4 Vehicles | 0 (0.0%) | 0 (0.0%) |
| 5 or more Vehicles | 0 (0.0%) | 0 (0.0%) |
| Total | 84 (100.0%) | 79 (100.0%) |
Commute Time in Ranshaw
The most frequently occuring commute durations in Ranshaw are 20 to 24 minutes (58 commuters, 35.6%), 90 or more minutes (58 commuters, 35.6%), and 10 to 14 minutes (23 commuters, 14.1%).
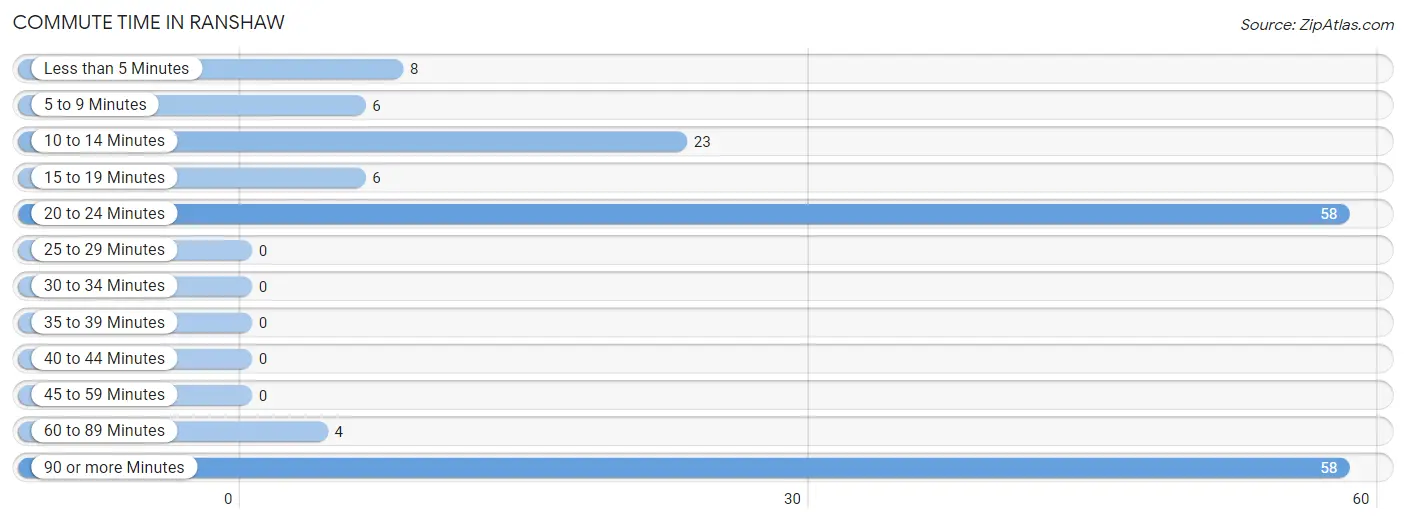
| Commute Time | # Commuters | % Commuters |
| Less than 5 Minutes | 8 | 4.9% |
| 5 to 9 Minutes | 6 | 3.7% |
| 10 to 14 Minutes | 23 | 14.1% |
| 15 to 19 Minutes | 6 | 3.7% |
| 20 to 24 Minutes | 58 | 35.6% |
| 25 to 29 Minutes | 0 | 0.0% |
| 30 to 34 Minutes | 0 | 0.0% |
| 35 to 39 Minutes | 0 | 0.0% |
| 40 to 44 Minutes | 0 | 0.0% |
| 45 to 59 Minutes | 0 | 0.0% |
| 60 to 89 Minutes | 4 | 2.5% |
| 90 or more Minutes | 58 | 35.6% |
Commute Time by Sex in Ranshaw
The most common commute times in Ranshaw are 90 or more minutes (58 commuters, 69.1%) for males and 20 to 24 minutes (58 commuters, 73.4%) for females.
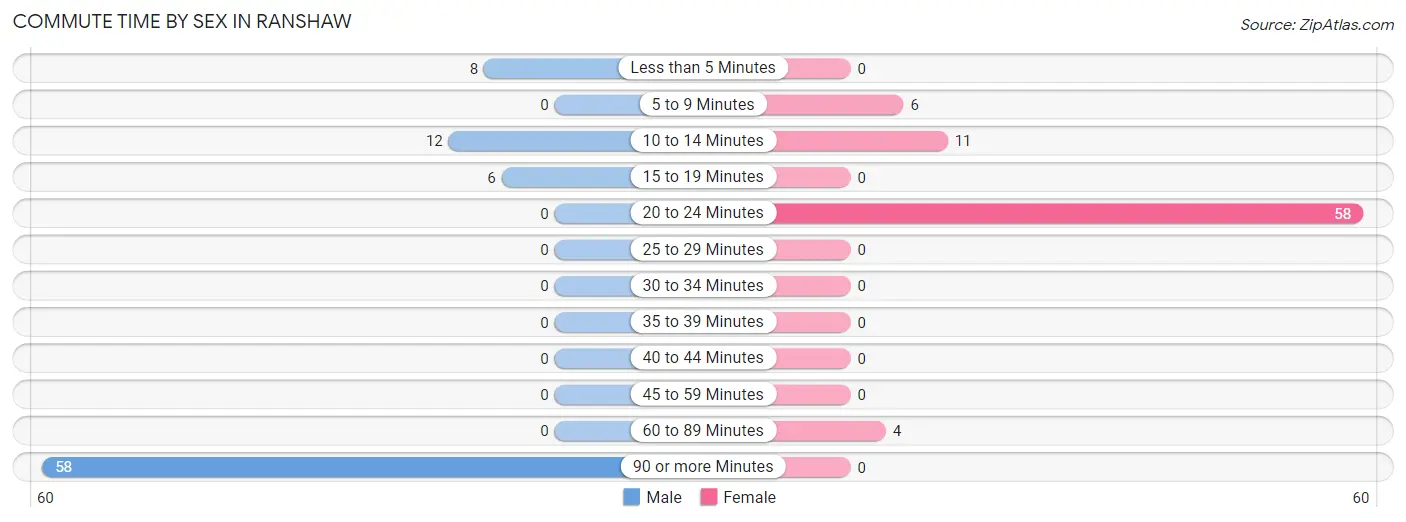
| Commute Time | Male | Female |
| Less than 5 Minutes | 8 (9.5%) | 0 (0.0%) |
| 5 to 9 Minutes | 0 (0.0%) | 6 (7.6%) |
| 10 to 14 Minutes | 12 (14.3%) | 11 (13.9%) |
| 15 to 19 Minutes | 6 (7.1%) | 0 (0.0%) |
| 20 to 24 Minutes | 0 (0.0%) | 58 (73.4%) |
| 25 to 29 Minutes | 0 (0.0%) | 0 (0.0%) |
| 30 to 34 Minutes | 0 (0.0%) | 0 (0.0%) |
| 35 to 39 Minutes | 0 (0.0%) | 0 (0.0%) |
| 40 to 44 Minutes | 0 (0.0%) | 0 (0.0%) |
| 45 to 59 Minutes | 0 (0.0%) | 0 (0.0%) |
| 60 to 89 Minutes | 0 (0.0%) | 4 (5.1%) |
| 90 or more Minutes | 58 (69.1%) | 0 (0.0%) |
Time of Departure to Work by Sex in Ranshaw
The most frequent times of departure to work in Ranshaw are 12:00 AM to 4:59 AM (58, 69.1%) for males and 6:00 AM to 6:29 AM (52, 65.8%) for females.
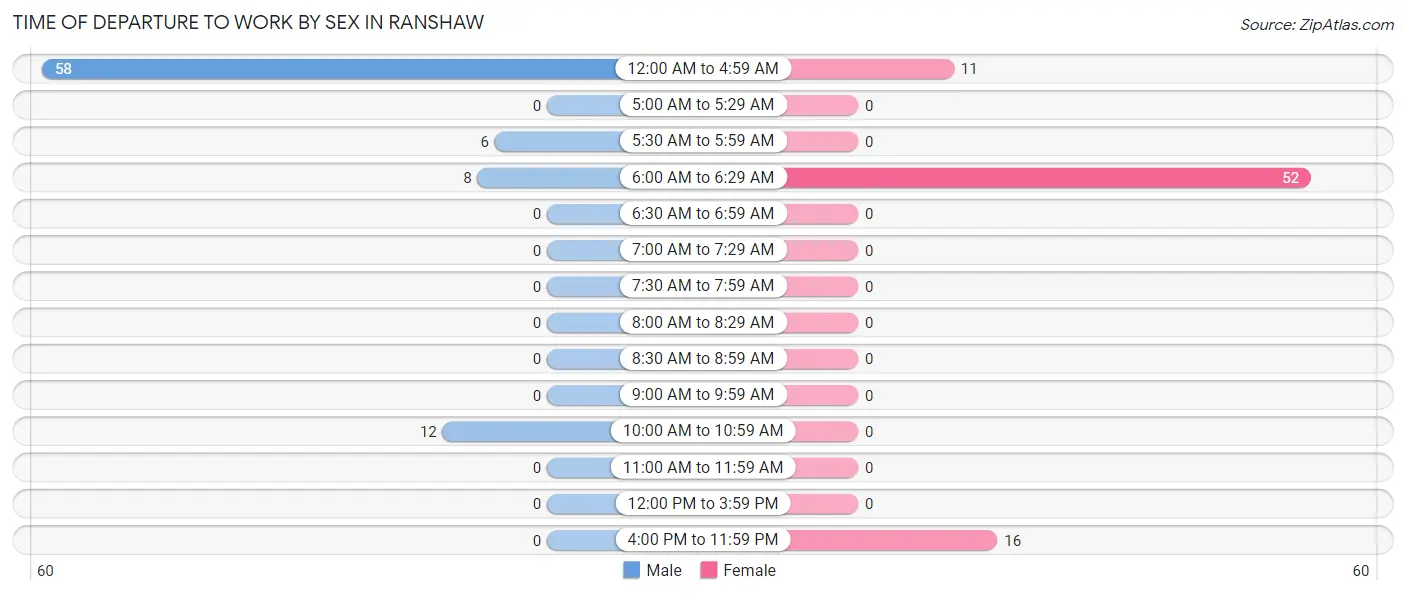
| Time of Departure | Male | Female |
| 12:00 AM to 4:59 AM | 58 (69.1%) | 11 (13.9%) |
| 5:00 AM to 5:29 AM | 0 (0.0%) | 0 (0.0%) |
| 5:30 AM to 5:59 AM | 6 (7.1%) | 0 (0.0%) |
| 6:00 AM to 6:29 AM | 8 (9.5%) | 52 (65.8%) |
| 6:30 AM to 6:59 AM | 0 (0.0%) | 0 (0.0%) |
| 7:00 AM to 7:29 AM | 0 (0.0%) | 0 (0.0%) |
| 7:30 AM to 7:59 AM | 0 (0.0%) | 0 (0.0%) |
| 8:00 AM to 8:29 AM | 0 (0.0%) | 0 (0.0%) |
| 8:30 AM to 8:59 AM | 0 (0.0%) | 0 (0.0%) |
| 9:00 AM to 9:59 AM | 0 (0.0%) | 0 (0.0%) |
| 10:00 AM to 10:59 AM | 12 (14.3%) | 0 (0.0%) |
| 11:00 AM to 11:59 AM | 0 (0.0%) | 0 (0.0%) |
| 12:00 PM to 3:59 PM | 0 (0.0%) | 0 (0.0%) |
| 4:00 PM to 11:59 PM | 0 (0.0%) | 16 (20.3%) |
| Total | 84 (100.0%) | 79 (100.0%) |
Housing Occupancy in Ranshaw
Occupancy by Ownership in Ranshaw
Of the total 148 dwellings in Ranshaw, owner-occupied units account for 126 (85.1%), while renter-occupied units make up 22 (14.9%).
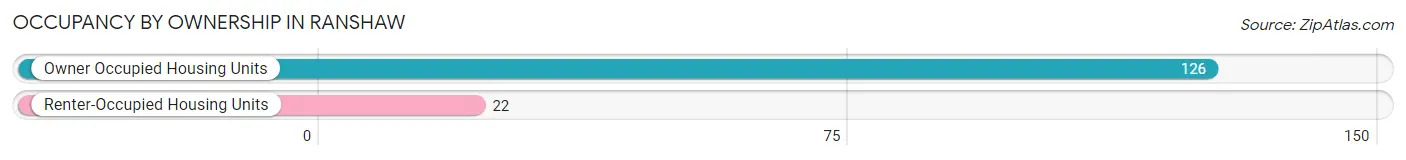
| Occupancy | # Housing Units | % Housing Units |
| Owner Occupied Housing Units | 126 | 85.1% |
| Renter-Occupied Housing Units | 22 | 14.9% |
| Total Occupied Housing Units | 148 | 100.0% |
Occupancy by Household Size in Ranshaw
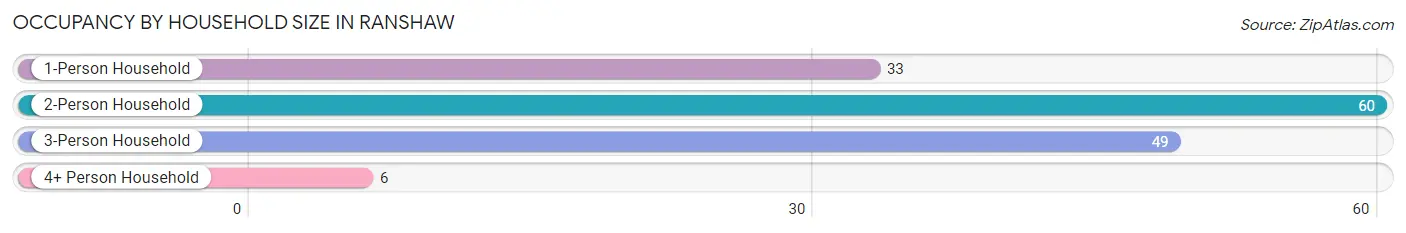
| Household Size | # Housing Units | % Housing Units |
| 1-Person Household | 33 | 22.3% |
| 2-Person Household | 60 | 40.5% |
| 3-Person Household | 49 | 33.1% |
| 4+ Person Household | 6 | 4.1% |
| Total Housing Units | 148 | 100.0% |
Occupancy by Ownership by Household Size in Ranshaw
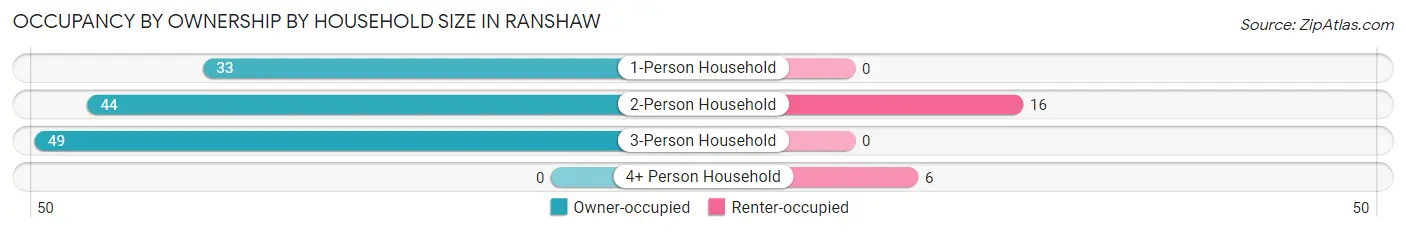
| Household Size | Owner-occupied | Renter-occupied |
| 1-Person Household | 33 (100.0%) | 0 (0.0%) |
| 2-Person Household | 44 (73.3%) | 16 (26.7%) |
| 3-Person Household | 49 (100.0%) | 0 (0.0%) |
| 4+ Person Household | 0 (0.0%) | 6 (100.0%) |
| Total Housing Units | 126 (85.1%) | 22 (14.9%) |
Occupancy by Educational Attainment in Ranshaw
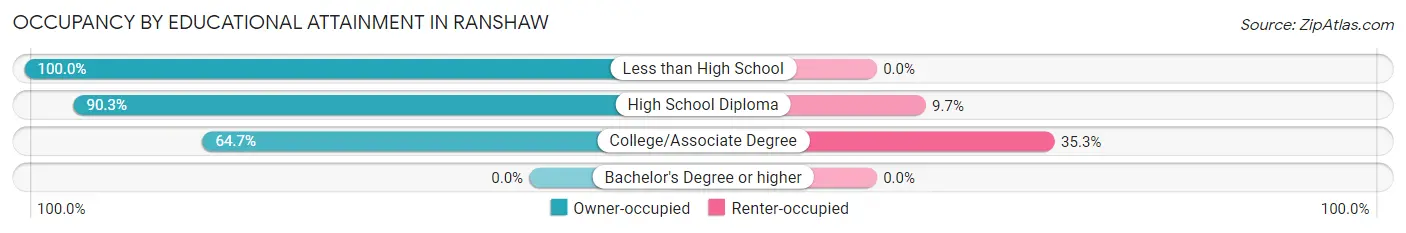
| Household Size | Owner-occupied | Renter-occupied |
| Less than High School | 11 (100.0%) | 0 (0.0%) |
| High School Diploma | 93 (90.3%) | 10 (9.7%) |
| College/Associate Degree | 22 (64.7%) | 12 (35.3%) |
| Bachelor's Degree or higher | 0 (0.0%) | 0 (0.0%) |
Occupancy by Age of Householder in Ranshaw
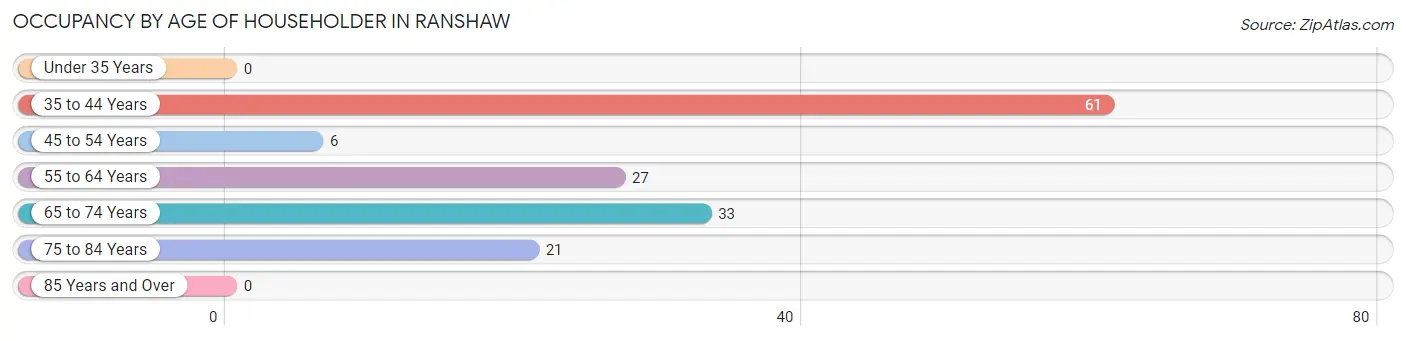
| Age Bracket | # Households | % Households |
| Under 35 Years | 0 | 0.0% |
| 35 to 44 Years | 61 | 41.2% |
| 45 to 54 Years | 6 | 4.1% |
| 55 to 64 Years | 27 | 18.2% |
| 65 to 74 Years | 33 | 22.3% |
| 75 to 84 Years | 21 | 14.2% |
| 85 Years and Over | 0 | 0.0% |
| Total | 148 | 100.0% |
Housing Finances in Ranshaw
Median Income by Occupancy in Ranshaw
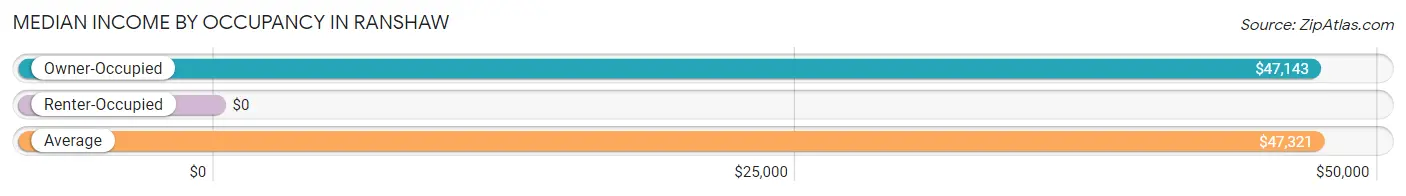
| Occupancy Type | # Households | Median Income |
| Owner-Occupied | 126 (85.1%) | $47,143 |
| Renter-Occupied | 22 (14.9%) | $0 |
| Average | 148 (100.0%) | $47,321 |
Occupancy by Householder Income Bracket in Ranshaw
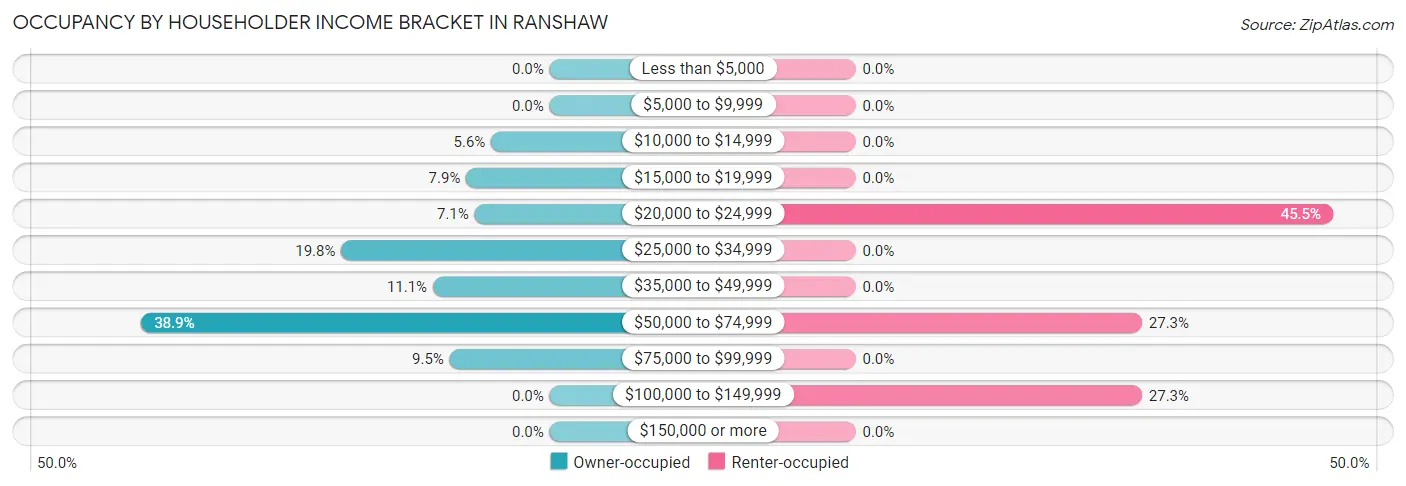
| Income Bracket | Owner-occupied | Renter-occupied |
| Less than $5,000 | 0 (0.0%) | 0 (0.0%) |
| $5,000 to $9,999 | 0 (0.0%) | 0 (0.0%) |
| $10,000 to $14,999 | 7 (5.6%) | 0 (0.0%) |
| $15,000 to $19,999 | 10 (7.9%) | 0 (0.0%) |
| $20,000 to $24,999 | 9 (7.1%) | 10 (45.5%) |
| $25,000 to $34,999 | 25 (19.8%) | 0 (0.0%) |
| $35,000 to $49,999 | 14 (11.1%) | 0 (0.0%) |
| $50,000 to $74,999 | 49 (38.9%) | 6 (27.3%) |
| $75,000 to $99,999 | 12 (9.5%) | 0 (0.0%) |
| $100,000 to $149,999 | 0 (0.0%) | 6 (27.3%) |
| $150,000 or more | 0 (0.0%) | 0 (0.0%) |
| Total | 126 (100.0%) | 22 (100.0%) |
Monthly Housing Cost Tiers in Ranshaw
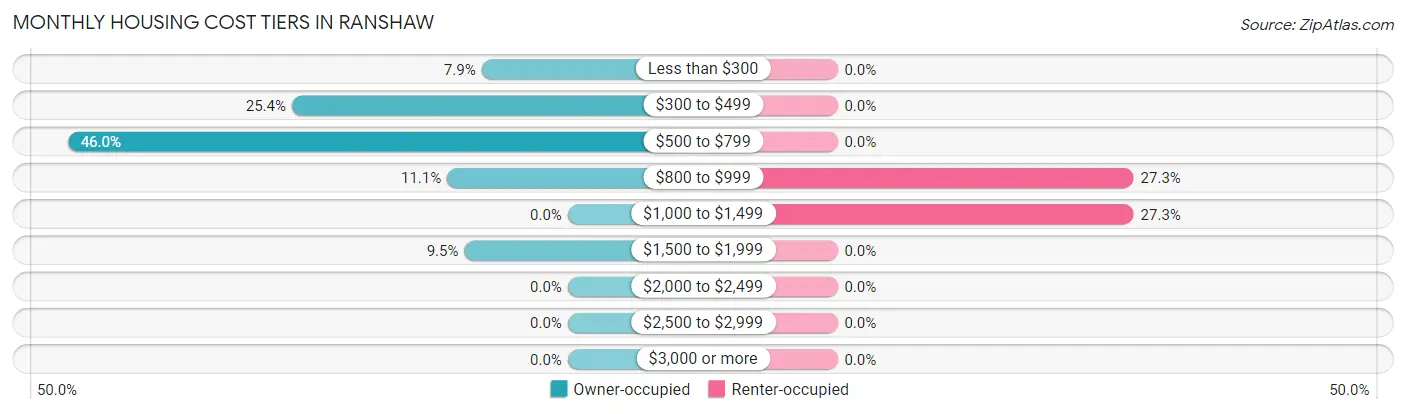
| Monthly Cost | Owner-occupied | Renter-occupied |
| Less than $300 | 10 (7.9%) | 0 (0.0%) |
| $300 to $499 | 32 (25.4%) | 0 (0.0%) |
| $500 to $799 | 58 (46.0%) | 0 (0.0%) |
| $800 to $999 | 14 (11.1%) | 6 (27.3%) |
| $1,000 to $1,499 | 0 (0.0%) | 6 (27.3%) |
| $1,500 to $1,999 | 12 (9.5%) | 0 (0.0%) |
| $2,000 to $2,499 | 0 (0.0%) | 0 (0.0%) |
| $2,500 to $2,999 | 0 (0.0%) | 0 (0.0%) |
| $3,000 or more | 0 (0.0%) | 0 (0.0%) |
| Total | 126 (100.0%) | 22 (100.0%) |
Physical Housing Characteristics in Ranshaw
Housing Structures in Ranshaw
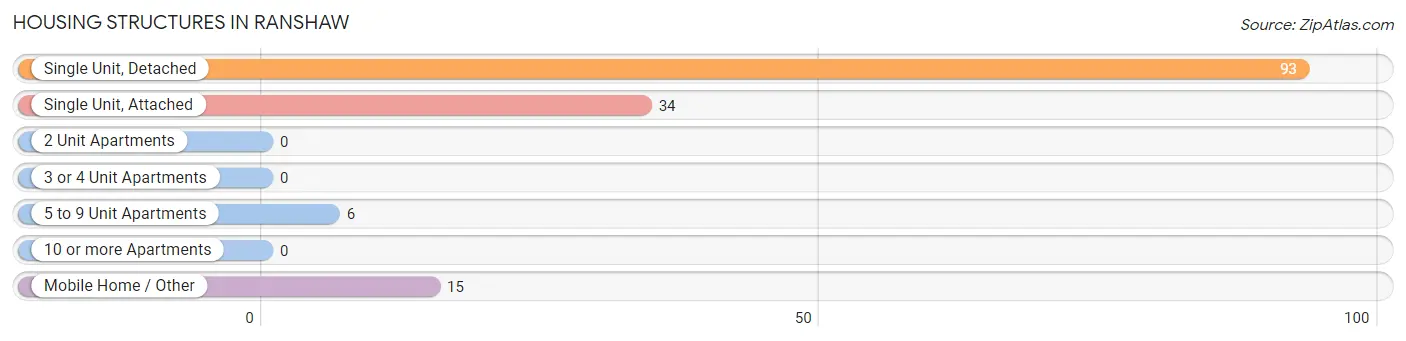
| Structure Type | # Housing Units | % Housing Units |
| Single Unit, Detached | 93 | 62.8% |
| Single Unit, Attached | 34 | 23.0% |
| 2 Unit Apartments | 0 | 0.0% |
| 3 or 4 Unit Apartments | 0 | 0.0% |
| 5 to 9 Unit Apartments | 6 | 4.1% |
| 10 or more Apartments | 0 | 0.0% |
| Mobile Home / Other | 15 | 10.1% |
| Total | 148 | 100.0% |
Housing Structures by Occupancy in Ranshaw
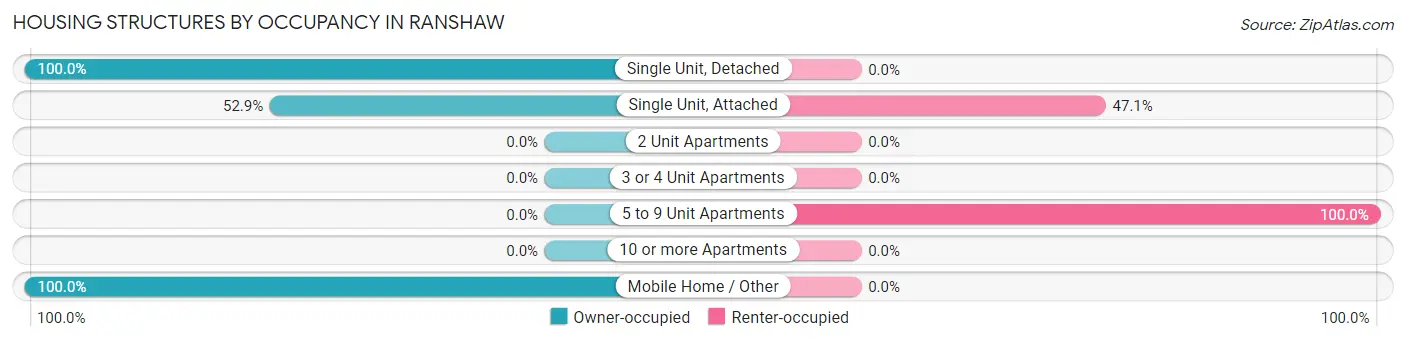
| Structure Type | Owner-occupied | Renter-occupied |
| Single Unit, Detached | 93 (100.0%) | 0 (0.0%) |
| Single Unit, Attached | 18 (52.9%) | 16 (47.1%) |
| 2 Unit Apartments | 0 (0.0%) | 0 (0.0%) |
| 3 or 4 Unit Apartments | 0 (0.0%) | 0 (0.0%) |
| 5 to 9 Unit Apartments | 0 (0.0%) | 6 (100.0%) |
| 10 or more Apartments | 0 (0.0%) | 0 (0.0%) |
| Mobile Home / Other | 15 (100.0%) | 0 (0.0%) |
| Total | 126 (85.1%) | 22 (14.9%) |
Housing Structures by Number of Rooms in Ranshaw
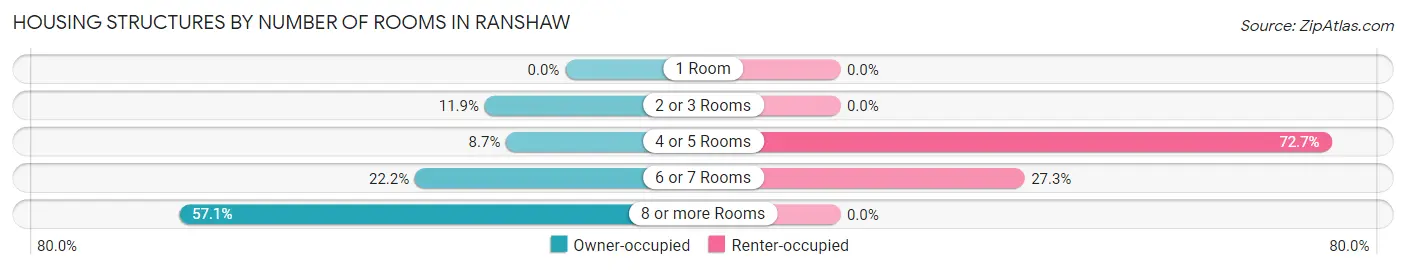
| Number of Rooms | Owner-occupied | Renter-occupied |
| 1 Room | 0 (0.0%) | 0 (0.0%) |
| 2 or 3 Rooms | 15 (11.9%) | 0 (0.0%) |
| 4 or 5 Rooms | 11 (8.7%) | 16 (72.7%) |
| 6 or 7 Rooms | 28 (22.2%) | 6 (27.3%) |
| 8 or more Rooms | 72 (57.1%) | 0 (0.0%) |
| Total | 126 (100.0%) | 22 (100.0%) |
Housing Structure by Heating Type in Ranshaw
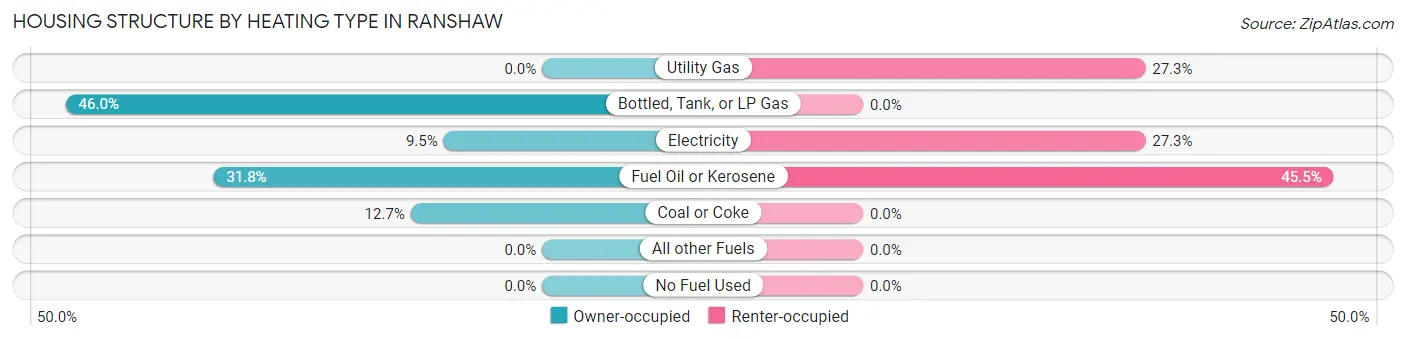
| Heating Type | Owner-occupied | Renter-occupied |
| Utility Gas | 0 (0.0%) | 6 (27.3%) |
| Bottled, Tank, or LP Gas | 58 (46.0%) | 0 (0.0%) |
| Electricity | 12 (9.5%) | 6 (27.3%) |
| Fuel Oil or Kerosene | 40 (31.8%) | 10 (45.5%) |
| Coal or Coke | 16 (12.7%) | 0 (0.0%) |
| All other Fuels | 0 (0.0%) | 0 (0.0%) |
| No Fuel Used | 0 (0.0%) | 0 (0.0%) |
| Total | 126 (100.0%) | 22 (100.0%) |
Household Vehicle Usage in Ranshaw
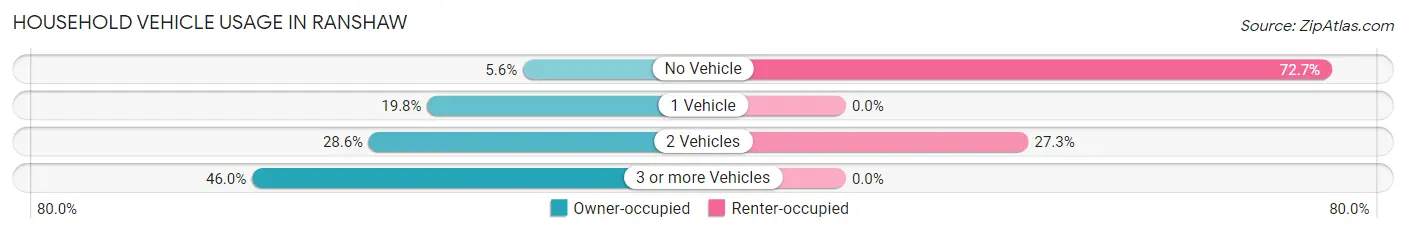
| Vehicles per Household | Owner-occupied | Renter-occupied |
| No Vehicle | 7 (5.6%) | 16 (72.7%) |
| 1 Vehicle | 25 (19.8%) | 0 (0.0%) |
| 2 Vehicles | 36 (28.6%) | 6 (27.3%) |
| 3 or more Vehicles | 58 (46.0%) | 0 (0.0%) |
| Total | 126 (100.0%) | 22 (100.0%) |
Real Estate & Mortgages in Ranshaw
Real Estate and Mortgage Overview in Ranshaw
| Characteristic | Without Mortgage | With Mortgage |
| Housing Units | 51 | 75 |
| Median Property Value | - | - |
| Median Household Income | $26,328 | $0 |
| Monthly Housing Costs | $348 | $0 |
| Real Estate Taxes | $989 | $0 |
Property Value by Mortgage Status in Ranshaw
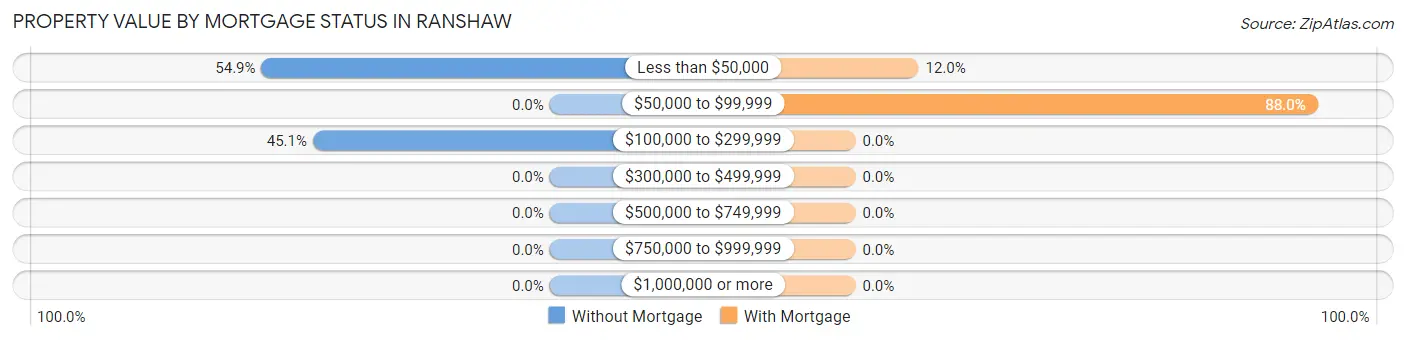
| Property Value | Without Mortgage | With Mortgage |
| Less than $50,000 | 28 (54.9%) | 9 (12.0%) |
| $50,000 to $99,999 | 0 (0.0%) | 66 (88.0%) |
| $100,000 to $299,999 | 23 (45.1%) | 0 (0.0%) |
| $300,000 to $499,999 | 0 (0.0%) | 0 (0.0%) |
| $500,000 to $749,999 | 0 (0.0%) | 0 (0.0%) |
| $750,000 to $999,999 | 0 (0.0%) | 0 (0.0%) |
| $1,000,000 or more | 0 (0.0%) | 0 (0.0%) |
| Total | 51 (100.0%) | 75 (100.0%) |
Household Income by Mortgage Status in Ranshaw
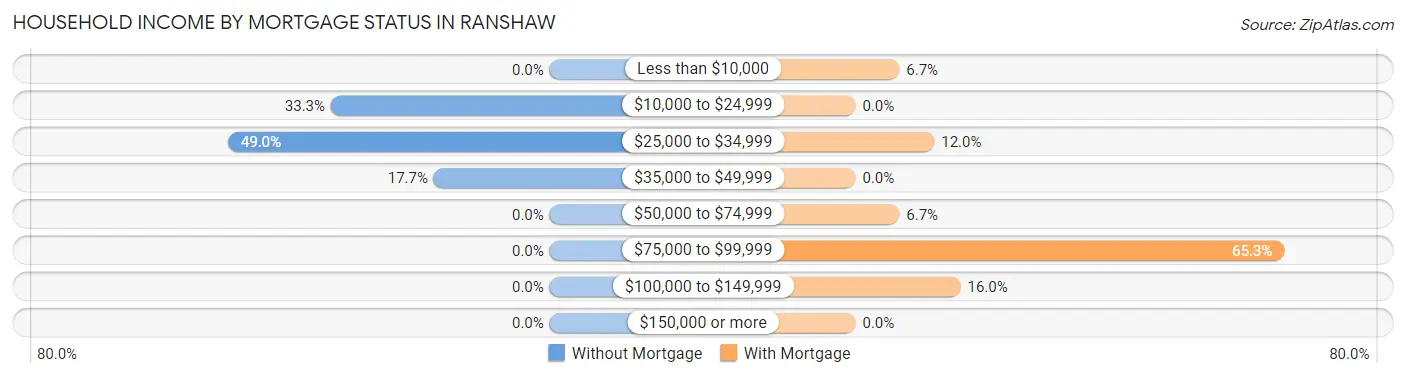
| Household Income | Without Mortgage | With Mortgage |
| Less than $10,000 | 0 (0.0%) | 5 (6.7%) |
| $10,000 to $24,999 | 17 (33.3%) | 0 (0.0%) |
| $25,000 to $34,999 | 25 (49.0%) | 9 (12.0%) |
| $35,000 to $49,999 | 9 (17.6%) | 0 (0.0%) |
| $50,000 to $74,999 | 0 (0.0%) | 5 (6.7%) |
| $75,000 to $99,999 | 0 (0.0%) | 49 (65.3%) |
| $100,000 to $149,999 | 0 (0.0%) | 12 (16.0%) |
| $150,000 or more | 0 (0.0%) | 0 (0.0%) |
| Total | 51 (100.0%) | 75 (100.0%) |
Property Value to Household Income Ratio in Ranshaw
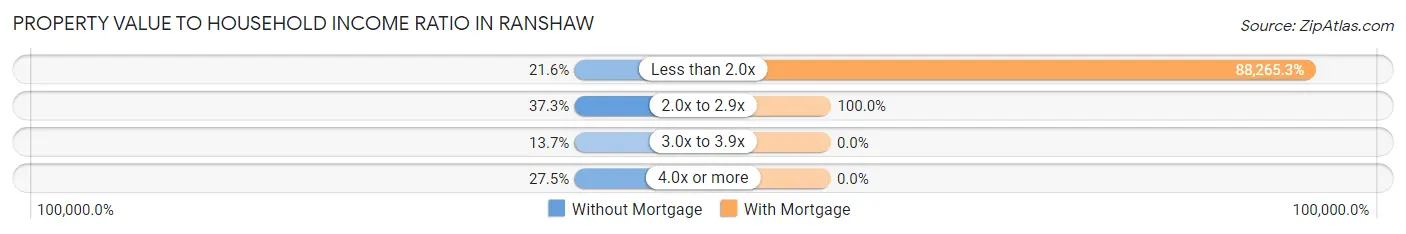
| Value-to-Income Ratio | Without Mortgage | With Mortgage |
| Less than 2.0x | 11 (21.6%) | 66,199 (88,265.3%) |
| 2.0x to 2.9x | 19 (37.2%) | 75 (100.0%) |
| 3.0x to 3.9x | 7 (13.7%) | 0 (0.0%) |
| 4.0x or more | 14 (27.5%) | 0 (0.0%) |
| Total | 51 (100.0%) | 75 (100.0%) |
Real Estate Taxes by Mortgage Status in Ranshaw
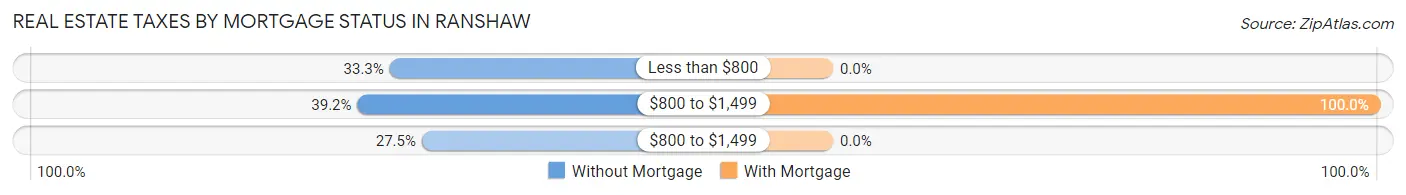
| Property Taxes | Without Mortgage | With Mortgage |
| Less than $800 | 17 (33.3%) | 0 (0.0%) |
| $800 to $1,499 | 20 (39.2%) | 75 (100.0%) |
| $800 to $1,499 | 14 (27.5%) | 0 (0.0%) |
| Total | 51 (100.0%) | 75 (100.0%) |
Health & Disability in Ranshaw
Health Insurance Coverage by Age in Ranshaw
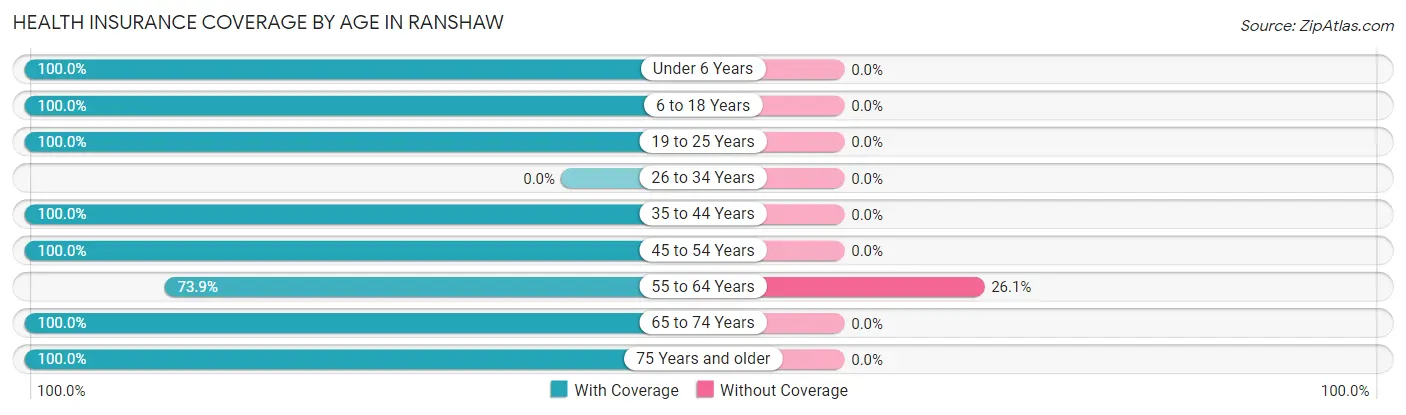
| Age Bracket | With Coverage | Without Coverage |
| Under 6 Years | 54 (100.0%) | 0 (0.0%) |
| 6 to 18 Years | 8 (100.0%) | 0 (0.0%) |
| 19 to 25 Years | 60 (100.0%) | 0 (0.0%) |
| 26 to 34 Years | 0 (0.0%) | 0 (0.0%) |
| 35 to 44 Years | 72 (100.0%) | 0 (0.0%) |
| 45 to 54 Years | 15 (100.0%) | 0 (0.0%) |
| 55 to 64 Years | 34 (73.9%) | 12 (26.1%) |
| 65 to 74 Years | 41 (100.0%) | 0 (0.0%) |
| 75 Years and older | 32 (100.0%) | 0 (0.0%) |
| Total | 316 (96.3%) | 12 (3.7%) |
Health Insurance Coverage by Citizenship Status in Ranshaw
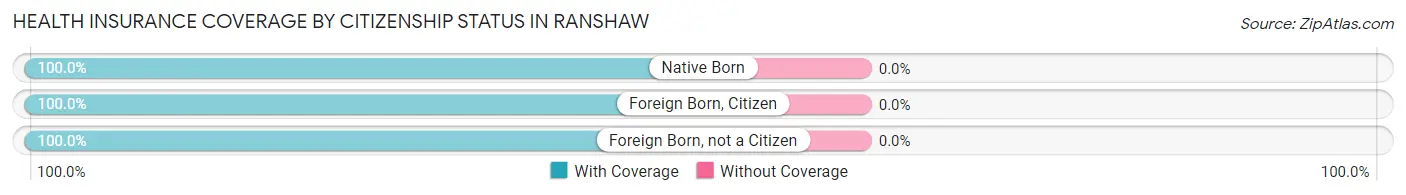
| Citizenship Status | With Coverage | Without Coverage |
| Native Born | 54 (100.0%) | 0 (0.0%) |
| Foreign Born, Citizen | 8 (100.0%) | 0 (0.0%) |
| Foreign Born, not a Citizen | 60 (100.0%) | 0 (0.0%) |
Health Insurance Coverage by Household Income in Ranshaw
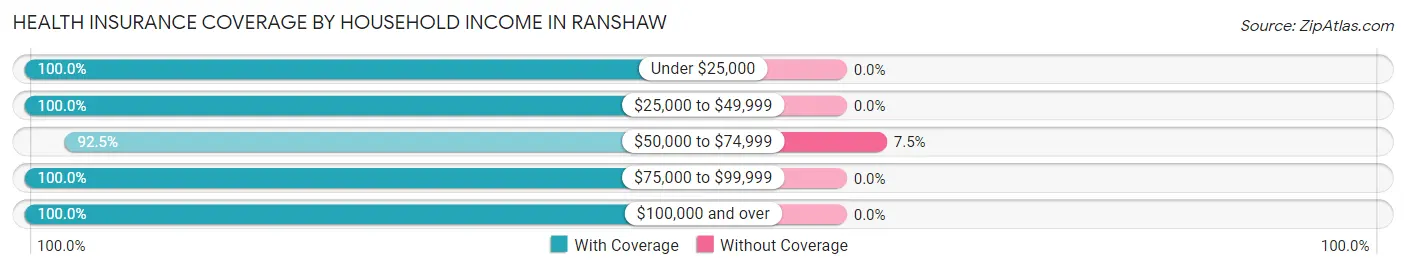
| Household Income | With Coverage | Without Coverage |
| Under $25,000 | 56 (100.0%) | 0 (0.0%) |
| $25,000 to $49,999 | 60 (100.0%) | 0 (0.0%) |
| $50,000 to $74,999 | 148 (92.5%) | 12 (7.5%) |
| $75,000 to $99,999 | 23 (100.0%) | 0 (0.0%) |
| $100,000 and over | 29 (100.0%) | 0 (0.0%) |
Public vs Private Health Insurance Coverage by Age in Ranshaw
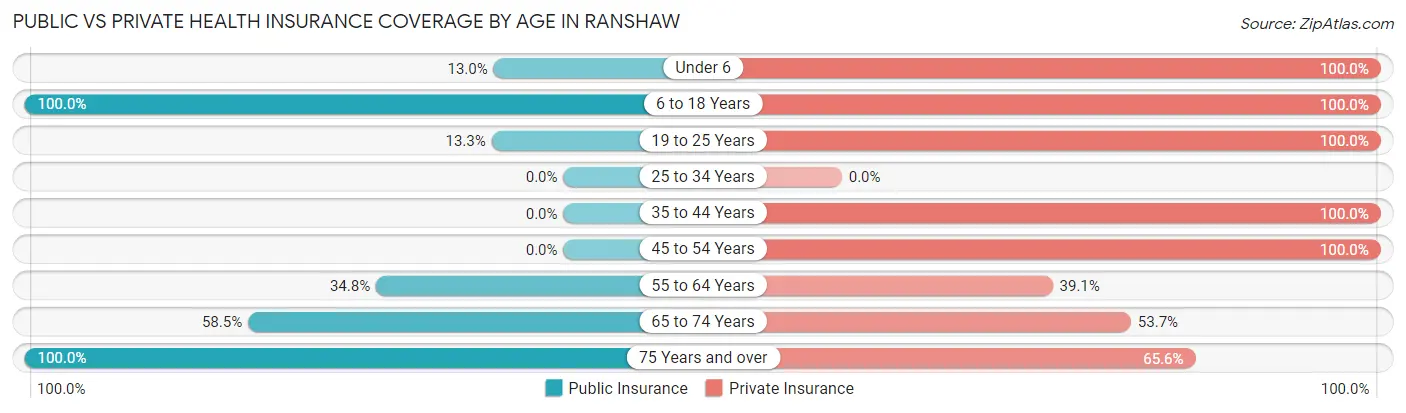
| Age Bracket | Public Insurance | Private Insurance |
| Under 6 | 7 (13.0%) | 54 (100.0%) |
| 6 to 18 Years | 8 (100.0%) | 8 (100.0%) |
| 19 to 25 Years | 8 (13.3%) | 60 (100.0%) |
| 25 to 34 Years | 0 (0.0%) | 0 (0.0%) |
| 35 to 44 Years | 0 (0.0%) | 72 (100.0%) |
| 45 to 54 Years | 0 (0.0%) | 15 (100.0%) |
| 55 to 64 Years | 16 (34.8%) | 18 (39.1%) |
| 65 to 74 Years | 24 (58.5%) | 22 (53.7%) |
| 75 Years and over | 32 (100.0%) | 21 (65.6%) |
| Total | 95 (29.0%) | 270 (82.3%) |
Disability Status by Sex by Age in Ranshaw
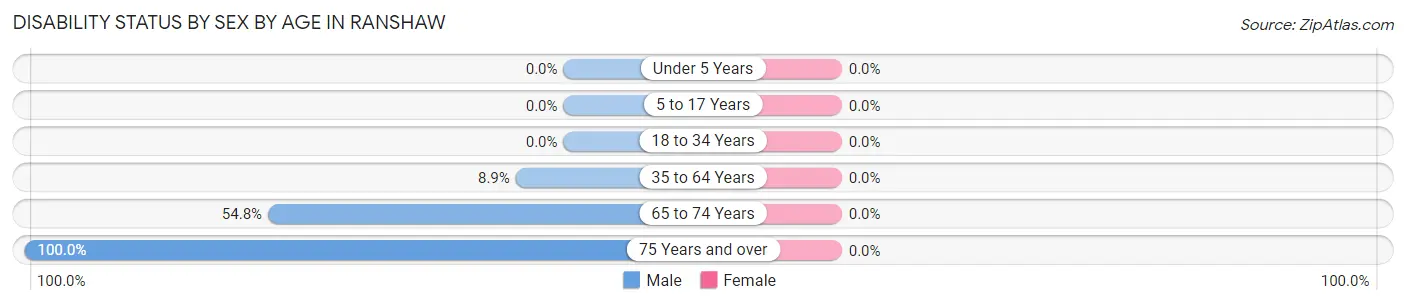
| Age Bracket | Male | Female |
| Under 5 Years | 0 (0.0%) | 0 (0.0%) |
| 5 to 17 Years | 0 (0.0%) | 0 (0.0%) |
| 18 to 34 Years | 0 (0.0%) | 0 (0.0%) |
| 35 to 64 Years | 7 (8.9%) | 0 (0.0%) |
| 65 to 74 Years | 17 (54.8%) | 0 (0.0%) |
| 75 Years and over | 11 (100.0%) | 0 (0.0%) |
Disability Class by Sex by Age in Ranshaw
Disability Class: Hearing Difficulty
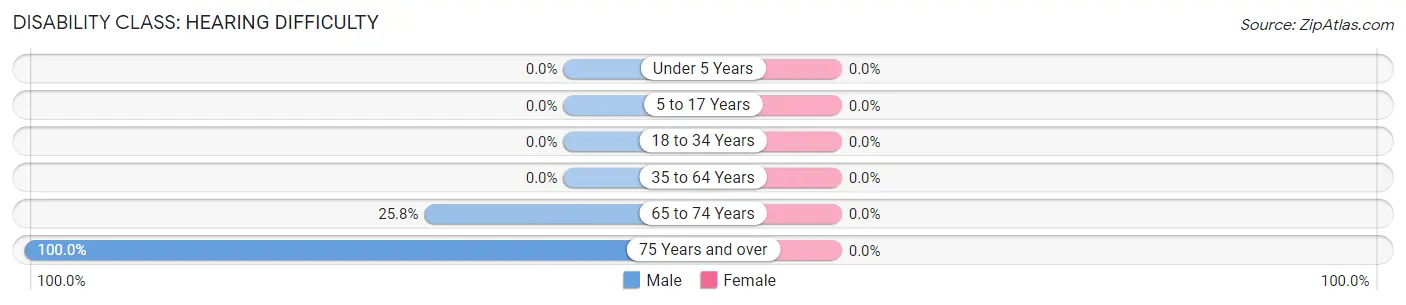
| Age Bracket | Male | Female |
| Under 5 Years | 0 (0.0%) | 0 (0.0%) |
| 5 to 17 Years | 0 (0.0%) | 0 (0.0%) |
| 18 to 34 Years | 0 (0.0%) | 0 (0.0%) |
| 35 to 64 Years | 0 (0.0%) | 0 (0.0%) |
| 65 to 74 Years | 8 (25.8%) | 0 (0.0%) |
| 75 Years and over | 11 (100.0%) | 0 (0.0%) |
Disability Class: Vision Difficulty
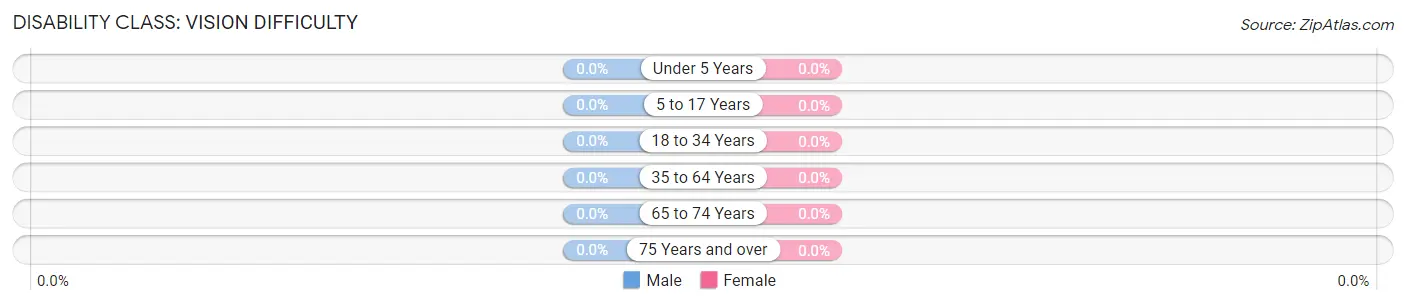
| Age Bracket | Male | Female |
| Under 5 Years | 0 (0.0%) | 0 (0.0%) |
| 5 to 17 Years | 0 (0.0%) | 0 (0.0%) |
| 18 to 34 Years | 0 (0.0%) | 0 (0.0%) |
| 35 to 64 Years | 0 (0.0%) | 0 (0.0%) |
| 65 to 74 Years | 0 (0.0%) | 0 (0.0%) |
| 75 Years and over | 0 (0.0%) | 0 (0.0%) |
Disability Class: Cognitive Difficulty
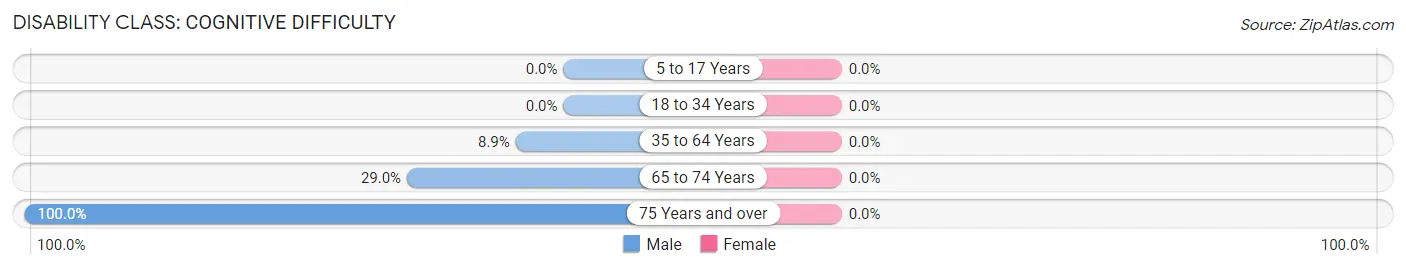
| Age Bracket | Male | Female |
| 5 to 17 Years | 0 (0.0%) | 0 (0.0%) |
| 18 to 34 Years | 0 (0.0%) | 0 (0.0%) |
| 35 to 64 Years | 7 (8.9%) | 0 (0.0%) |
| 65 to 74 Years | 9 (29.0%) | 0 (0.0%) |
| 75 Years and over | 11 (100.0%) | 0 (0.0%) |
Disability Class: Ambulatory Difficulty
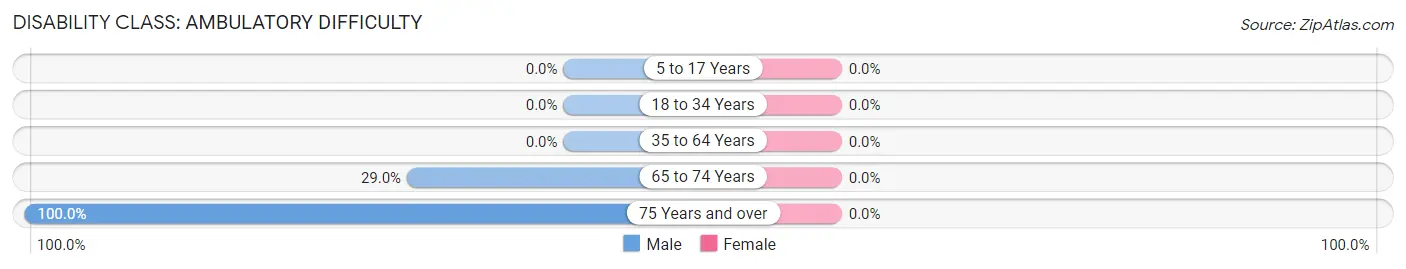
| Age Bracket | Male | Female |
| 5 to 17 Years | 0 (0.0%) | 0 (0.0%) |
| 18 to 34 Years | 0 (0.0%) | 0 (0.0%) |
| 35 to 64 Years | 0 (0.0%) | 0 (0.0%) |
| 65 to 74 Years | 9 (29.0%) | 0 (0.0%) |
| 75 Years and over | 11 (100.0%) | 0 (0.0%) |
Disability Class: Self-Care Difficulty
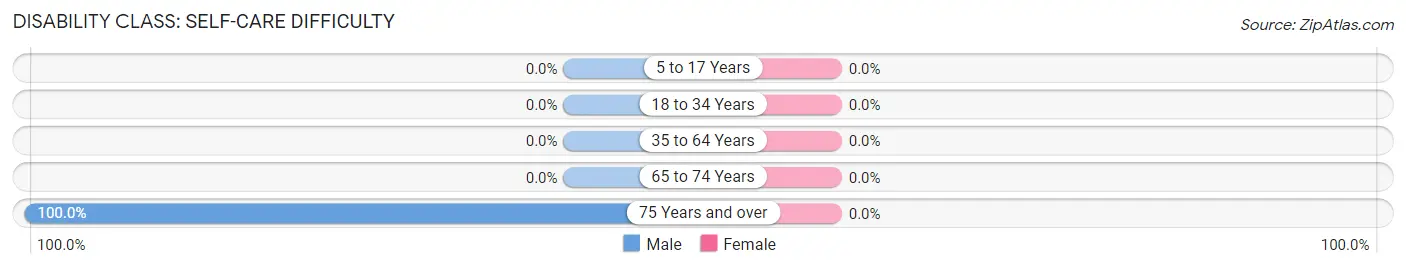
| Age Bracket | Male | Female |
| 5 to 17 Years | 0 (0.0%) | 0 (0.0%) |
| 18 to 34 Years | 0 (0.0%) | 0 (0.0%) |
| 35 to 64 Years | 0 (0.0%) | 0 (0.0%) |
| 65 to 74 Years | 0 (0.0%) | 0 (0.0%) |
| 75 Years and over | 11 (100.0%) | 0 (0.0%) |
Technology Access in Ranshaw
Computing Device Access in Ranshaw
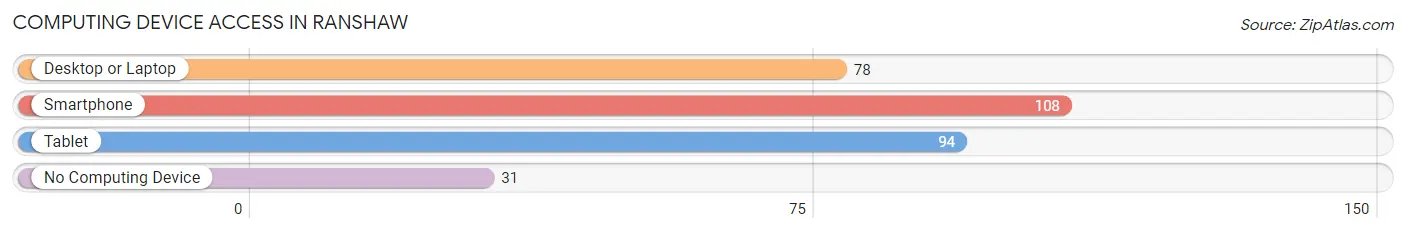
| Device Type | # Households | % Households |
| Desktop or Laptop | 78 | 52.7% |
| Smartphone | 108 | 73.0% |
| Tablet | 94 | 63.5% |
| No Computing Device | 31 | 20.9% |
| Total | 148 | 100.0% |
Internet Access in Ranshaw
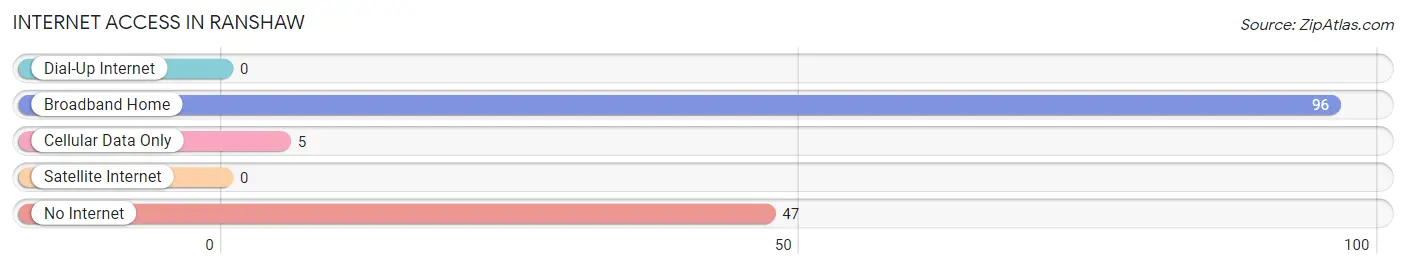
| Internet Type | # Households | % Households |
| Dial-Up Internet | 0 | 0.0% |
| Broadband Home | 96 | 64.9% |
| Cellular Data Only | 5 | 3.4% |
| Satellite Internet | 0 | 0.0% |
| No Internet | 47 | 31.8% |
| Total | 148 | 100.0% |
Ranshaw Summary
Ranshaw is a small borough located in Schuylkill County, Pennsylvania. It is situated in the southern part of the state, approximately two hours northwest of Philadelphia. The borough is bordered by the townships of West Mahanoy, East Mahanoy, Delano, and Kline. According to the 2010 census, the population of Ranshaw was 1,093.
Geography
Ranshaw is located in the southern part of Schuylkill County, Pennsylvania. It is situated in the Appalachian Mountains, and is surrounded by rolling hills and valleys. The borough is located at an elevation of 1,400 feet above sea level. The climate in Ranshaw is humid continental, with cold winters and hot summers. The average annual temperature is 48°F, and the average annual precipitation is 40 inches.
The borough is located in the Mahanoy Creek watershed. The Mahanoy Creek is a tributary of the Schuylkill River, and is the main source of water for the borough. The creek is also used for recreational activities such as fishing and canoeing.
Economy
Ranshaw is a small, rural borough with a limited economy. The primary industries in the borough are agriculture and tourism. The borough is home to several small farms, which produce a variety of crops, including corn, soybeans, and hay. The borough also has several small businesses, including a grocery store, a hardware store, and a restaurant.
Tourism is an important part of the economy in Ranshaw. The borough is home to several attractions, including the Ranshaw Historical Society Museum, the Ranshaw Railroad Museum, and the Ranshaw Nature Center. The borough also hosts several annual events, such as the Ranshaw Fall Festival and the Ranshaw Christmas Parade.
Demographics
According to the 2010 census, the population of Ranshaw was 1,093. The racial makeup of the borough was 97.3% White, 0.7% African American, 0.2% Native American, 0.2% Asian, and 1.6% from other races. The median household income in Ranshaw was $37,917, and the median family income was $45,625. The per capita income in the borough was $17,845.
Conclusion
Ranshaw is a small borough located in Schuylkill County, Pennsylvania. It is situated in the Appalachian Mountains, and is surrounded by rolling hills and valleys. The primary industries in the borough are agriculture and tourism. According to the 2010 census, the population of Ranshaw was 1,093. The racial makeup of the borough was 97.3% White, 0.7% African American, 0.2% Native American, 0.2% Asian, and 1.6% from other races. The median household income in Ranshaw was $37,917, and the median family income was $45,625. The per capita income in the borough was $17,845.
Common Questions
What is the Total Population of Ranshaw?
Total Population of Ranshaw is 328.
What is the Total Male Population of Ranshaw?
Total Male Population of Ranshaw is 175.
What is the Total Female Population of Ranshaw?
Total Female Population of Ranshaw is 153.
What is the Ratio of Males per 100 Females in Ranshaw?
There are 114.38 Males per 100 Females in Ranshaw.
What is the Ratio of Females per 100 Males in Ranshaw?
There are 87.43 Females per 100 Males in Ranshaw.
What is the Median Population Age in Ranshaw?
Median Population Age in Ranshaw is 38.6 Years.
What is the Average Family Size in Ranshaw
Average Family Size in Ranshaw is 2.5 People.
What is the Average Household Size in Ranshaw
Average Household Size in Ranshaw is 2.2 People.
What is Per Capita Income in Ranshaw?
Per Capita income in Ranshaw is $22,886.
What is the Median Family Income in Ranshaw?
Median Family Income in Ranshaw is $65,791.
What is the Median Household income in Ranshaw?
Median Household Income in Ranshaw is $47,321.
What is Income or Wage Gap in Ranshaw?
Income or Wage Gap in Ranshaw is 68.0%.
Women in Ranshaw earn 32.0 cents for every dollar earned by a man.
What is Inequality or Gini Index in Ranshaw?
Inequality or Gini Index in Ranshaw is 0.29.
How Large is the Labor Force in Ranshaw?
There are 180 People in the Labor Forcein in Ranshaw.
What is the Percentage of People in the Labor Force in Ranshaw?
67.7% of People are in the Labor Force in Ranshaw.
What is the Unemployment Rate in Ranshaw?
Unemployment Rate in Ranshaw is 4.4%.