Zip Codes with the Highest Percentage of Population Employed in Security & Protection in Pittston, PA
RELATED REPORTS & OPTIONS
Security & Protection
Pittston
Compare Zip Codes
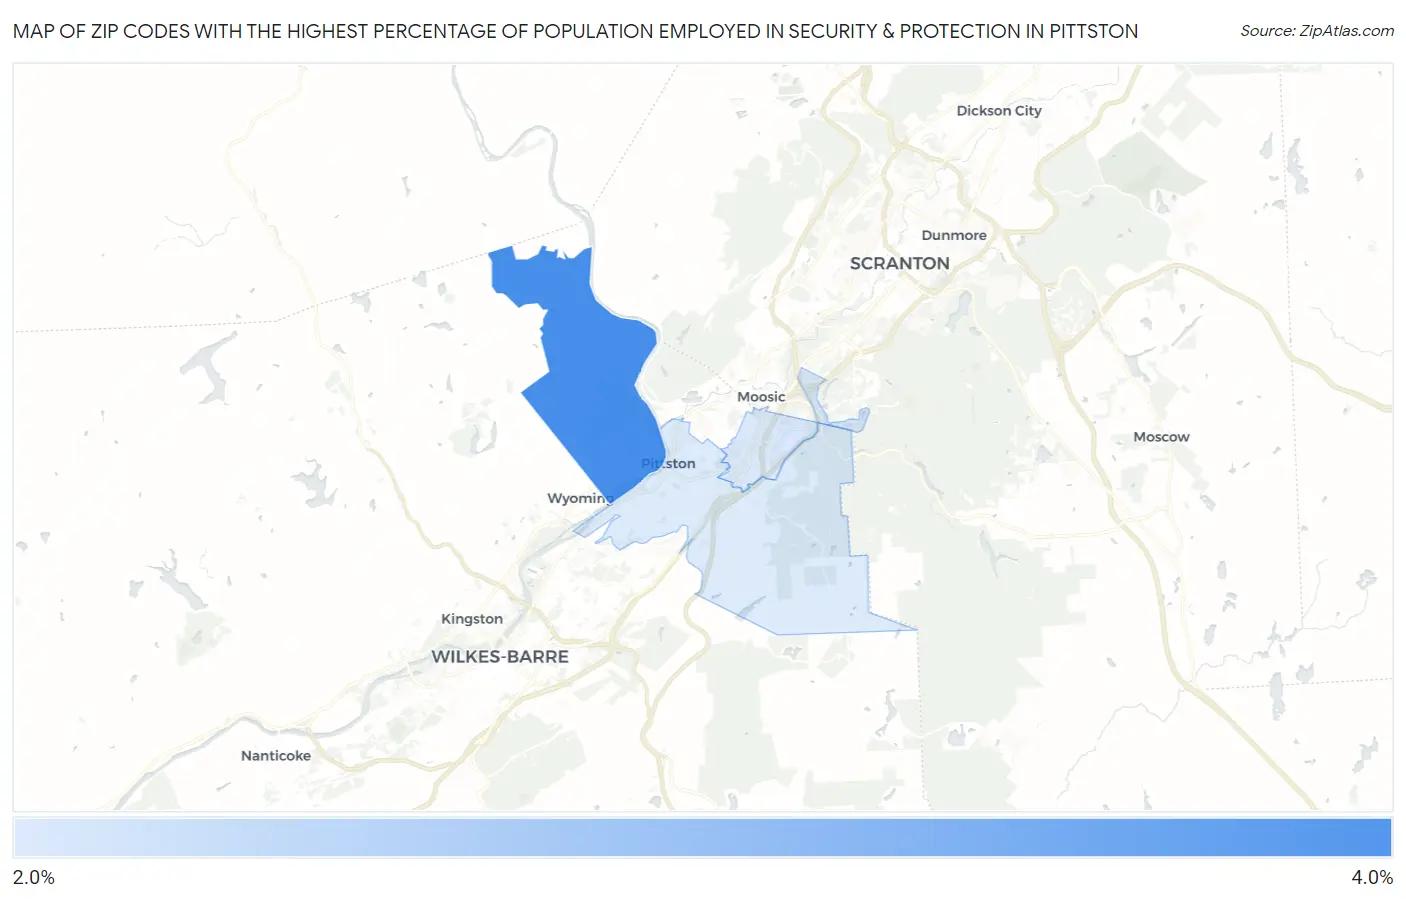
Map of Zip Codes with the Highest Percentage of Population Employed in Security & Protection in Pittston
0.0%
4.0%
Zip Codes with the Highest Percentage of Population Employed in Security & Protection in Pittston, PA
| Zip Code | % Employed | vs State | vs National | |
| 1. | 18643 | 4.0% | 2.0%(+1.96)#202 | 2.1%(+1.83)#4,542 |
| 2. | 18641 | 3.0% | 2.0%(+0.947)#345 | 2.1%(+0.819)#7,356 |
| 3. | 18640 | 2.9% | 2.0%(+0.929)#350 | 2.1%(+0.800)#7,439 |
1
Common Questions
What are the Top Zip Codes with the Highest Percentage of Population Employed in Security & Protection in Pittston, PA?
Top Zip Codes with the Highest Percentage of Population Employed in Security & Protection in Pittston, PA are:
What zip code has the Highest Percentage of Population Employed in Security & Protection in Pittston, PA?
18643 has the Highest Percentage of Population Employed in Security & Protection in Pittston, PA with 4.0%.
What is the Percentage of Population Employed in Security & Protection in Pittston, PA?
Percentage of Population Employed in Security & Protection in Pittston is 2.8%.
What is the Percentage of Population Employed in Security & Protection in Pennsylvania?
Percentage of Population Employed in Security & Protection in Pennsylvania is 2.0%.
What is the Percentage of Population Employed in Security & Protection in the United States?
Percentage of Population Employed in Security & Protection in the United States is 2.1%.