New Alexandria borough, PA
New Alexandria borough Overview
405
TOTAL POPULATION
190
MALE POPULATION
215
FEMALE POPULATION
88.37
MALES / 100 FEMALES
113.16
FEMALES / 100 MALES
63.9
MEDIAN AGE
2.3
AVG FAMILY SIZE
1.9
AVG HOUSEHOLD SIZE
$39,587
PER CAPITA INCOME
$66,146
AVG FAMILY INCOME
$52,237
AVG HOUSEHOLD INCOME
11.3%
WAGE / INCOME GAP [ % ]
88.7¢/ $1
WAGE / INCOME GAP [ $ ]
0.39
INEQUALITY / GINI INDEX
138
LABOR FORCE [ PEOPLE ]
36.5%
PERCENT IN LABOR FORCE
8.0%
UNEMPLOYMENT RATE
Race in New Alexandria borough
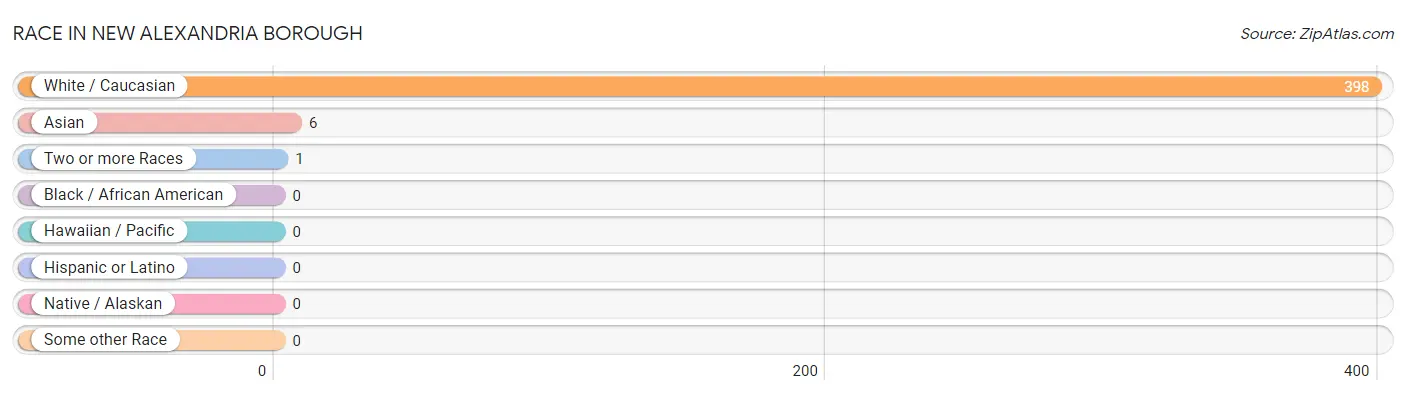
The most populous races in New Alexandria borough are White / Caucasian (398 | 98.3%), Asian (6 | 1.5%), and Two or more Races (1 | 0.3%).
| Race | # Population | % Population |
| Asian | 6 | 1.5% |
| Black / African American | 0 | 0.0% |
| Hawaiian / Pacific | 0 | 0.0% |
| Hispanic or Latino | 0 | 0.0% |
| Native / Alaskan | 0 | 0.0% |
| White / Caucasian | 398 | 98.3% |
| Two or more Races | 1 | 0.3% |
| Some other Race | 0 | 0.0% |
| Total | 405 | 100.0% |
Ancestry in New Alexandria borough
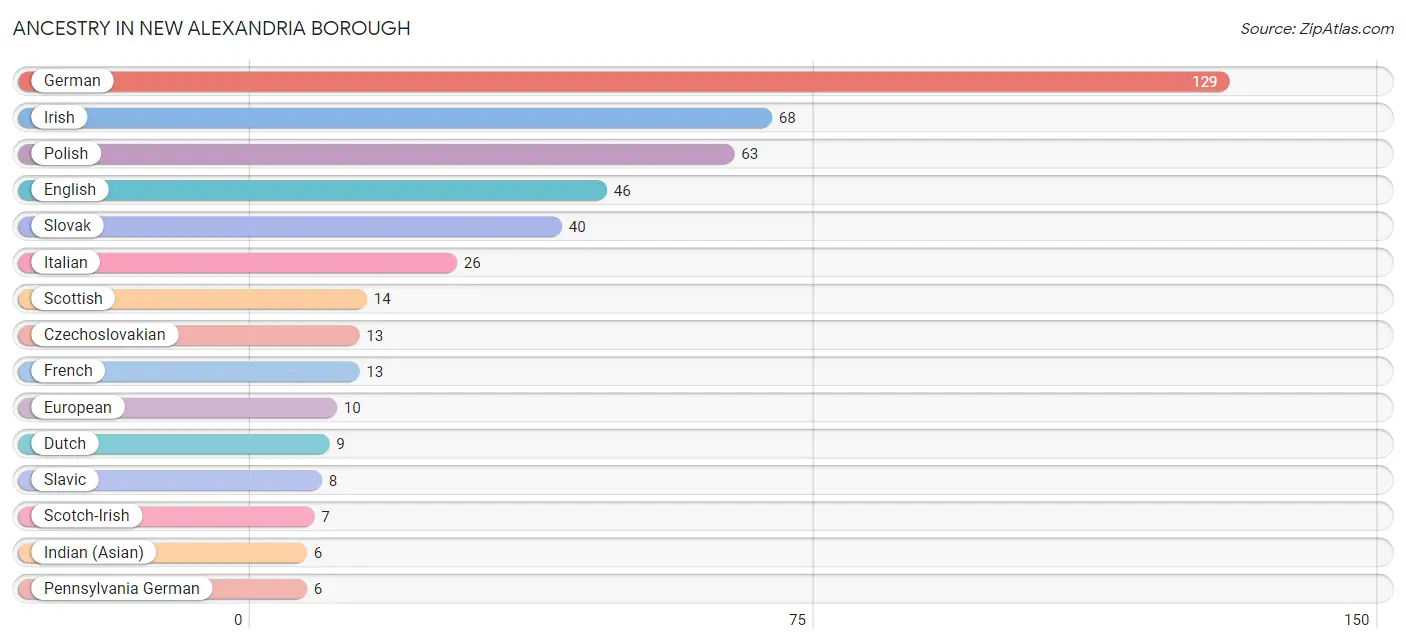
The most populous ancestries reported in New Alexandria borough are German (129 | 31.9%), Irish (68 | 16.8%), Polish (63 | 15.6%), English (46 | 11.4%), and Slovak (40 | 9.9%), together accounting for 85.4% of all New Alexandria borough residents.
| Ancestry | # Population | % Population |
| American | 3 | 0.7% |
| Austrian | 4 | 1.0% |
| Cherokee | 1 | 0.3% |
| Croatian | 3 | 0.7% |
| Czechoslovakian | 13 | 3.2% |
| Dutch | 9 | 2.2% |
| English | 46 | 11.4% |
| European | 10 | 2.5% |
| French | 13 | 3.2% |
| German | 129 | 31.9% |
| Indian (Asian) | 6 | 1.5% |
| Irish | 68 | 16.8% |
| Italian | 26 | 6.4% |
| Pennsylvania German | 6 | 1.5% |
| Polish | 63 | 15.6% |
| Scotch-Irish | 7 | 1.7% |
| Scottish | 14 | 3.5% |
| Slavic | 8 | 2.0% |
| Slovak | 40 | 9.9% |
| Swedish | 5 | 1.2% |
| Ukrainian | 3 | 0.7% | View All 21 Rows |
Immigrants in New Alexandria borough
The most numerous immigrant groups reported in New Alexandria borough came from , and Asia (6 | 1.5%), together accounting for 1.5% of all New Alexandria borough residents.

| Immigration Origin | # Population | % Population |
| Asia | 6 | 1.5% | View All 1 Rows |
Sex and Age in New Alexandria borough
Sex and Age in New Alexandria borough
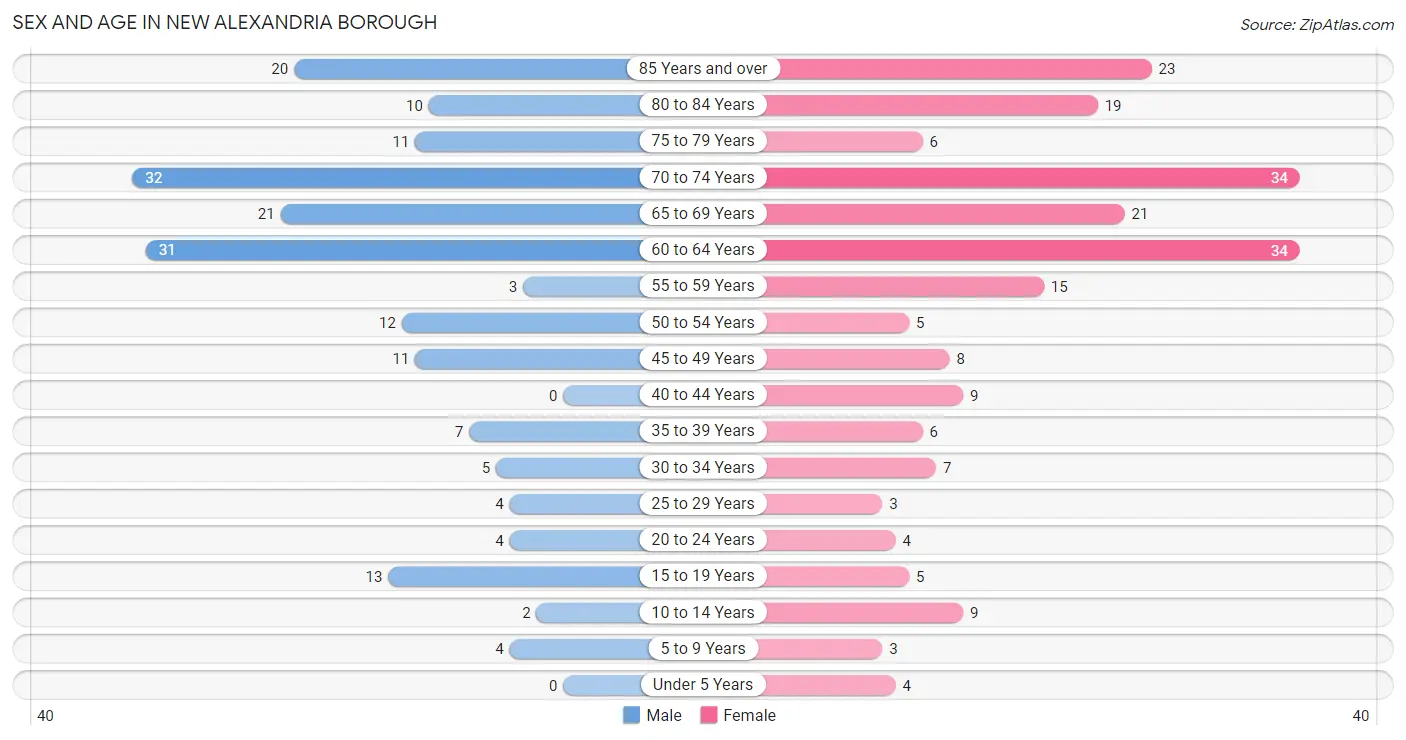
The most populous age groups in New Alexandria borough are 70 to 74 Years (32 | 16.8%) for men and 60 to 64 Years (34 | 15.8%) for women.
| Age Bracket | Male | Female |
| Under 5 Years | 0 (0.0%) | 4 (1.9%) |
| 5 to 9 Years | 4 (2.1%) | 3 (1.4%) |
| 10 to 14 Years | 2 (1.1%) | 9 (4.2%) |
| 15 to 19 Years | 13 (6.8%) | 5 (2.3%) |
| 20 to 24 Years | 4 (2.1%) | 4 (1.9%) |
| 25 to 29 Years | 4 (2.1%) | 3 (1.4%) |
| 30 to 34 Years | 5 (2.6%) | 7 (3.3%) |
| 35 to 39 Years | 7 (3.7%) | 6 (2.8%) |
| 40 to 44 Years | 0 (0.0%) | 9 (4.2%) |
| 45 to 49 Years | 11 (5.8%) | 8 (3.7%) |
| 50 to 54 Years | 12 (6.3%) | 5 (2.3%) |
| 55 to 59 Years | 3 (1.6%) | 15 (7.0%) |
| 60 to 64 Years | 31 (16.3%) | 34 (15.8%) |
| 65 to 69 Years | 21 (11.1%) | 21 (9.8%) |
| 70 to 74 Years | 32 (16.8%) | 34 (15.8%) |
| 75 to 79 Years | 11 (5.8%) | 6 (2.8%) |
| 80 to 84 Years | 10 (5.3%) | 19 (8.8%) |
| 85 Years and over | 20 (10.5%) | 23 (10.7%) |
| Total | 190 (100.0%) | 215 (100.0%) |
Families and Households in New Alexandria borough
Median Family Size in New Alexandria borough
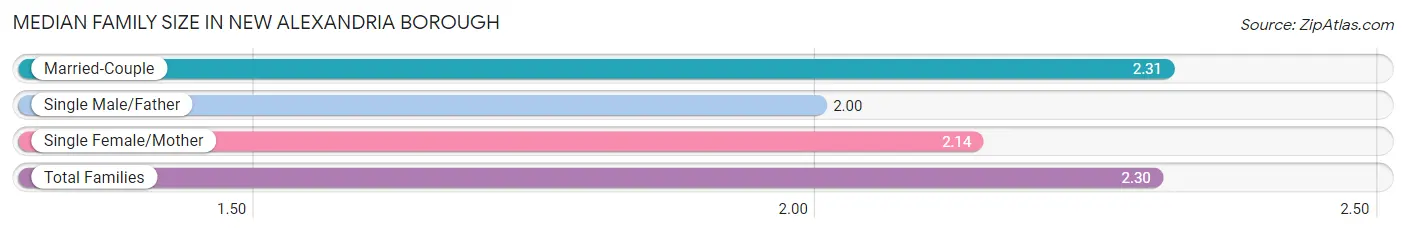
The median family size in New Alexandria borough is 2.30 persons per family, with married-couple families (125 | 94.0%) accounting for the largest median family size of 2.31 persons per family. On the other hand, single male/father families (1 | 0.7%) represent the smallest median family size with 2.00 persons per family.
| Family Type | # Families | Family Size |
| Married-Couple | 125 (94.0%) | 2.31 |
| Single Male/Father | 1 (0.7%) | 2.00 |
| Single Female/Mother | 7 (5.3%) | 2.14 |
| Total Families | 133 (100.0%) | 2.30 |
Median Household Size in New Alexandria borough
The median household size in New Alexandria borough is 1.88 persons per household, with single female/mother households (7 | 3.2%) accounting for the largest median household size of 2.71 persons per household. non-family households (83 | 38.4%) represent the smallest median household size with 1.08 persons per household.
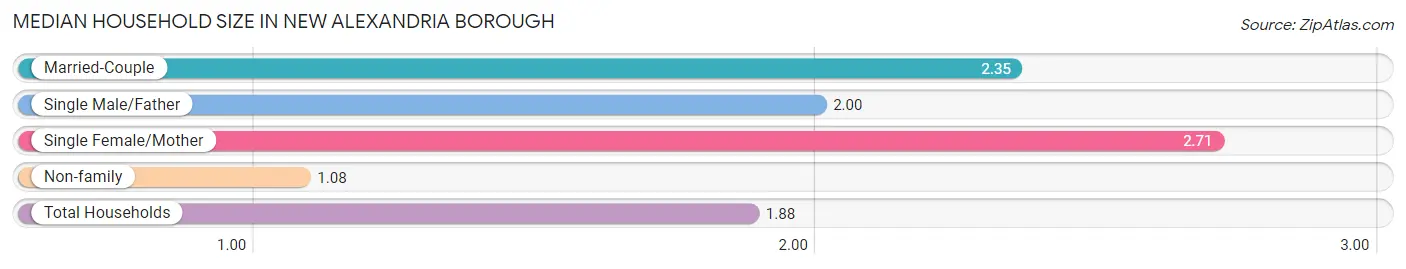
| Household Type | # Households | Household Size |
| Married-Couple | 125 (57.9%) | 2.35 |
| Single Male/Father | 1 (0.5%) | 2.00 |
| Single Female/Mother | 7 (3.2%) | 2.71 |
| Non-family | 83 (38.4%) | 1.08 |
| Total Households | 216 (100.0%) | 1.88 |
Household Size by Marriage Status in New Alexandria borough
Out of a total of 216 households in New Alexandria borough, 133 (61.6%) are family households, while 83 (38.4%) are nonfamily households. The most numerous type of family households are 2-person households, comprising 99, and the most common type of nonfamily households are 1-person households, comprising 75.
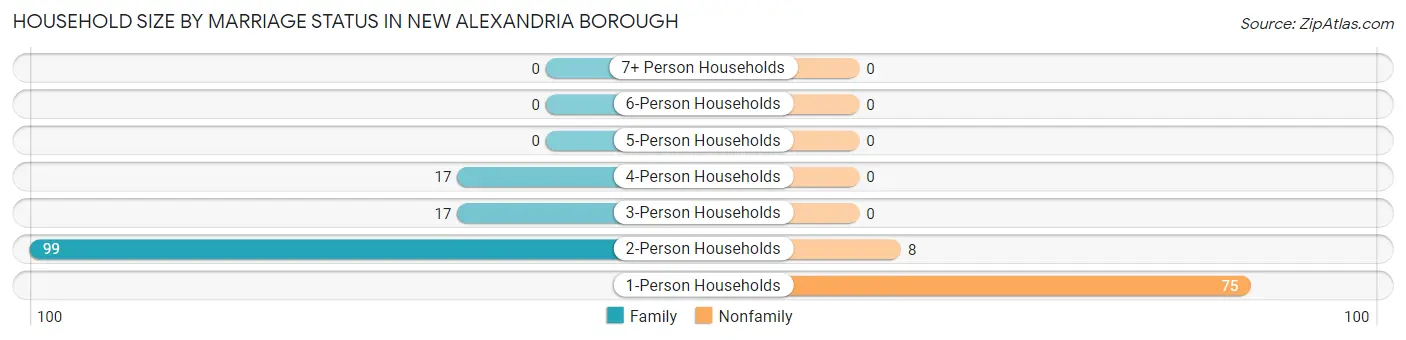
| Household Size | Family Households | Nonfamily Households |
| 1-Person Households | - | 75 (34.7%) |
| 2-Person Households | 99 (45.8%) | 8 (3.7%) |
| 3-Person Households | 17 (7.9%) | 0 (0.0%) |
| 4-Person Households | 17 (7.9%) | 0 (0.0%) |
| 5-Person Households | 0 (0.0%) | 0 (0.0%) |
| 6-Person Households | 0 (0.0%) | 0 (0.0%) |
| 7+ Person Households | 0 (0.0%) | 0 (0.0%) |
| Total | 133 (61.6%) | 83 (38.4%) |
Female Fertility in New Alexandria borough
Fertility by Age in New Alexandria borough
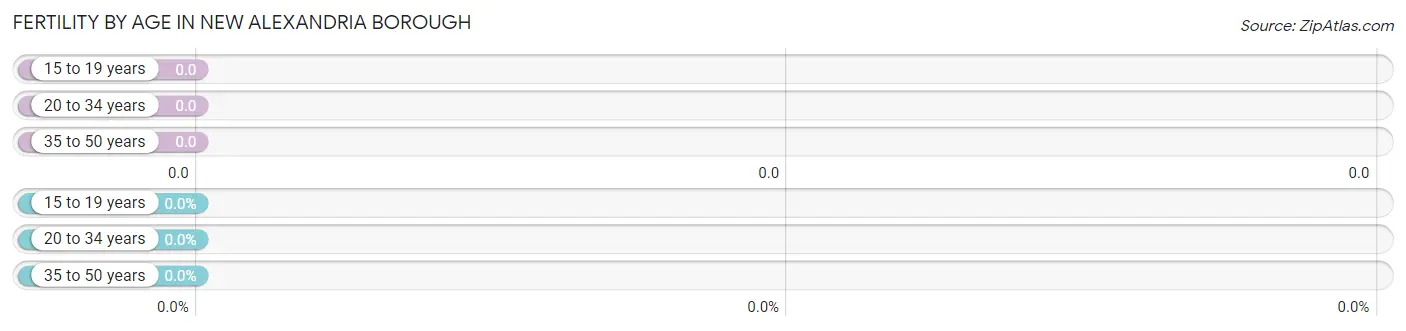
| Age Bracket | Women with Births | Births / 1,000 Women |
| 15 to 19 years | 0 (0.0%) | 0.0 |
| 20 to 34 years | 0 (0.0%) | 0.0 |
| 35 to 50 years | 0 (0.0%) | 0.0 |
| Total | 0 (0.0%) | 0.0 |
Fertility by Age by Marriage Status in New Alexandria borough
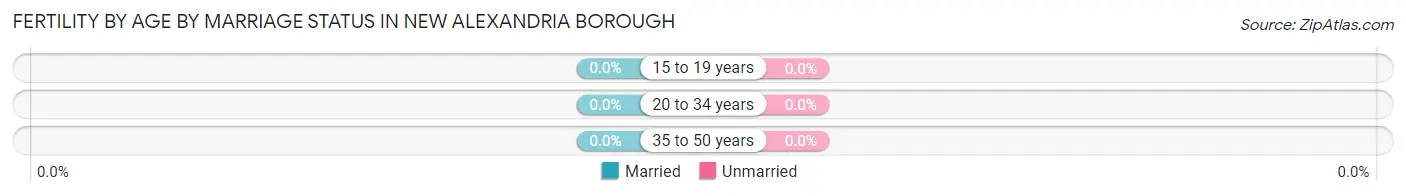
| Age Bracket | Married | Unmarried |
| 15 to 19 years | 0 (0.0%) | 0 (0.0%) |
| 20 to 34 years | 0 (0.0%) | 0 (0.0%) |
| 35 to 50 years | 0 (0.0%) | 0 (0.0%) |
| Total | 0 (0.0%) | 0 (0.0%) |
Fertility by Education in New Alexandria borough
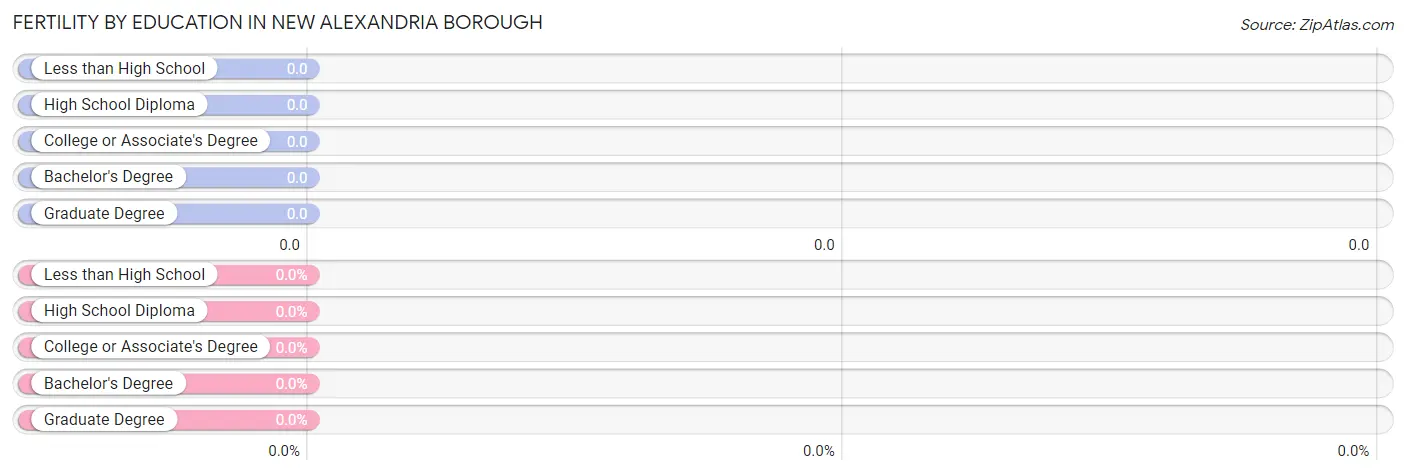
| Educational Attainment | Women with Births | Births / 1,000 Women |
| Less than High School | 0 (0.0%) | 0.0 |
| High School Diploma | 0 (0.0%) | 0.0 |
| College or Associate's Degree | 0 (0.0%) | 0.0 |
| Bachelor's Degree | 0 (0.0%) | 0.0 |
| Graduate Degree | 0 (0.0%) | 0.0 |
| Total | 0 (0.0%) | 0.0 |
Fertility by Education by Marriage Status in New Alexandria borough
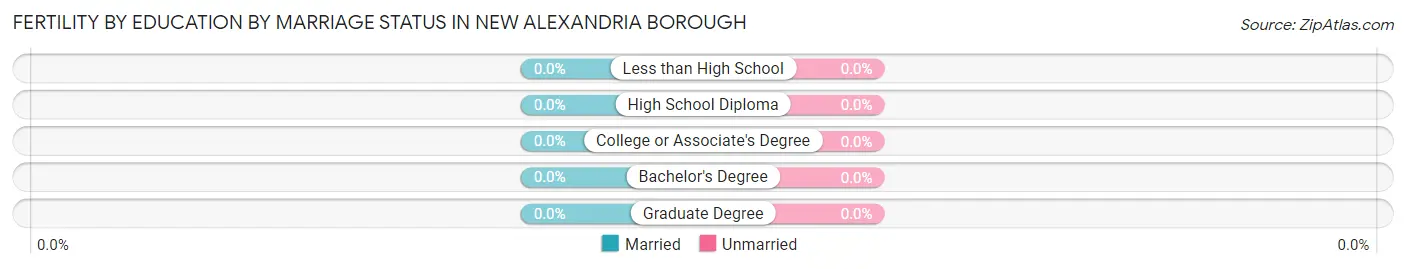
| Educational Attainment | Married | Unmarried |
| Less than High School | 0 (0.0%) | 0 (0.0%) |
| High School Diploma | 0 (0.0%) | 0 (0.0%) |
| College or Associate's Degree | 0 (0.0%) | 0 (0.0%) |
| Bachelor's Degree | 0 (0.0%) | 0 (0.0%) |
| Graduate Degree | 0 (0.0%) | 0 (0.0%) |
| Total | 0 (0.0%) | 0 (0.0%) |
Income in New Alexandria borough
Income Overview in New Alexandria borough
Per Capita Income in New Alexandria borough is $39,587, while median incomes of families and households are $66,146 and $52,237 respectively.
| Characteristic | Number | Measure |
| Per Capita Income | 405 | $39,587 |
| Median Family Income | 133 | $66,146 |
| Mean Family Income | 133 | $88,204 |
| Median Household Income | 216 | $52,237 |
| Mean Household Income | 216 | $74,386 |
| Income Deficit | 133 | $0 |
| Wage / Income Gap (%) | 405 | 11.29% |
| Wage / Income Gap ($) | 405 | 88.71¢ per $1 |
| Gini / Inequality Index | 405 | 0.39 |
Earnings by Sex in New Alexandria borough
Average Earnings in New Alexandria borough are $51,136, $56,875 for men and $50,455 for women, a difference of 11.3%.
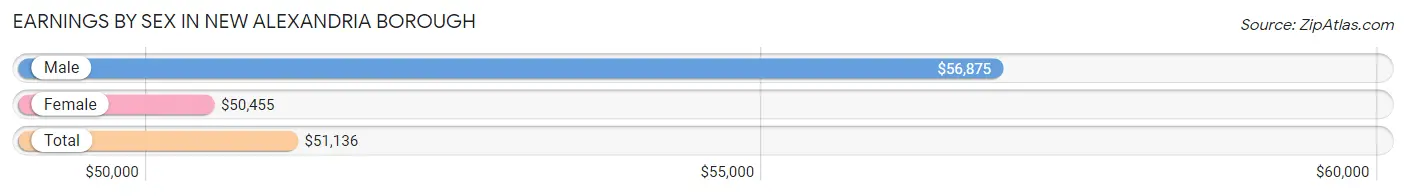
| Sex | Number | Average Earnings |
| Male | 86 (56.6%) | $56,875 |
| Female | 66 (43.4%) | $50,455 |
| Total | 152 (100.0%) | $51,136 |
Earnings by Sex by Income Bracket in New Alexandria borough
The most common earnings brackets in New Alexandria borough are $100,000+ for men (22 | 25.6%) and $50,000 to $54,999 for women (11 | 16.7%).
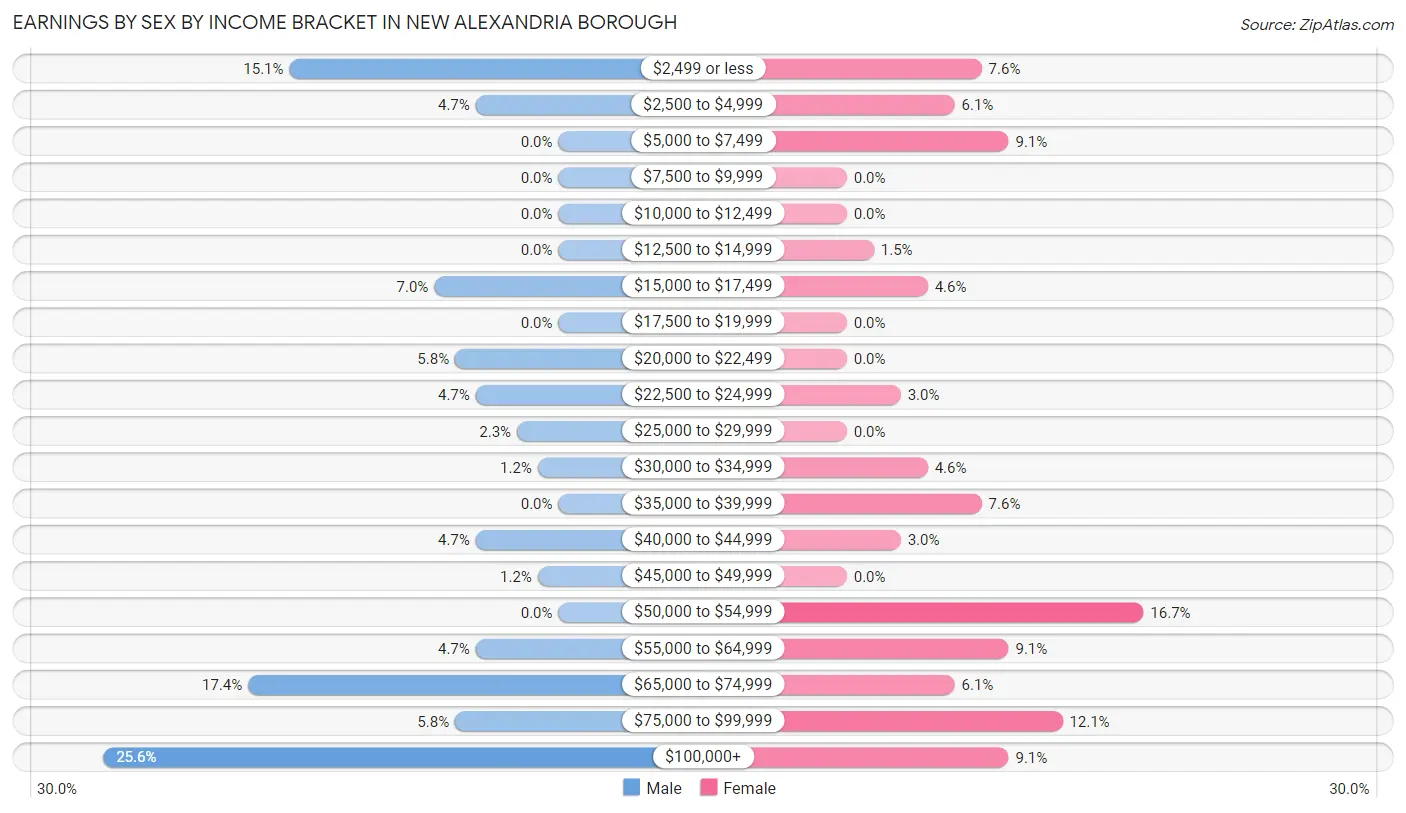
| Income | Male | Female |
| $2,499 or less | 13 (15.1%) | 5 (7.6%) |
| $2,500 to $4,999 | 4 (4.6%) | 4 (6.1%) |
| $5,000 to $7,499 | 0 (0.0%) | 6 (9.1%) |
| $7,500 to $9,999 | 0 (0.0%) | 0 (0.0%) |
| $10,000 to $12,499 | 0 (0.0%) | 0 (0.0%) |
| $12,500 to $14,999 | 0 (0.0%) | 1 (1.5%) |
| $15,000 to $17,499 | 6 (7.0%) | 3 (4.5%) |
| $17,500 to $19,999 | 0 (0.0%) | 0 (0.0%) |
| $20,000 to $22,499 | 5 (5.8%) | 0 (0.0%) |
| $22,500 to $24,999 | 4 (4.6%) | 2 (3.0%) |
| $25,000 to $29,999 | 2 (2.3%) | 0 (0.0%) |
| $30,000 to $34,999 | 1 (1.2%) | 3 (4.5%) |
| $35,000 to $39,999 | 0 (0.0%) | 5 (7.6%) |
| $40,000 to $44,999 | 4 (4.6%) | 2 (3.0%) |
| $45,000 to $49,999 | 1 (1.2%) | 0 (0.0%) |
| $50,000 to $54,999 | 0 (0.0%) | 11 (16.7%) |
| $55,000 to $64,999 | 4 (4.6%) | 6 (9.1%) |
| $65,000 to $74,999 | 15 (17.4%) | 4 (6.1%) |
| $75,000 to $99,999 | 5 (5.8%) | 8 (12.1%) |
| $100,000+ | 22 (25.6%) | 6 (9.1%) |
| Total | 86 (100.0%) | 66 (100.0%) |
Earnings by Sex by Educational Attainment in New Alexandria borough
Average earnings in New Alexandria borough are $69,250 for men and $51,136 for women, a difference of 26.2%. Men with an educational attainment of college or associate's degree enjoy the highest average annual earnings of $69,750, while those with college or associate's degree education earn the least with $69,750. Women with an educational attainment of high school diploma earn the most with the average annual earnings of $52,031, while those with bachelor's degree education have the smallest earnings of $50,833.
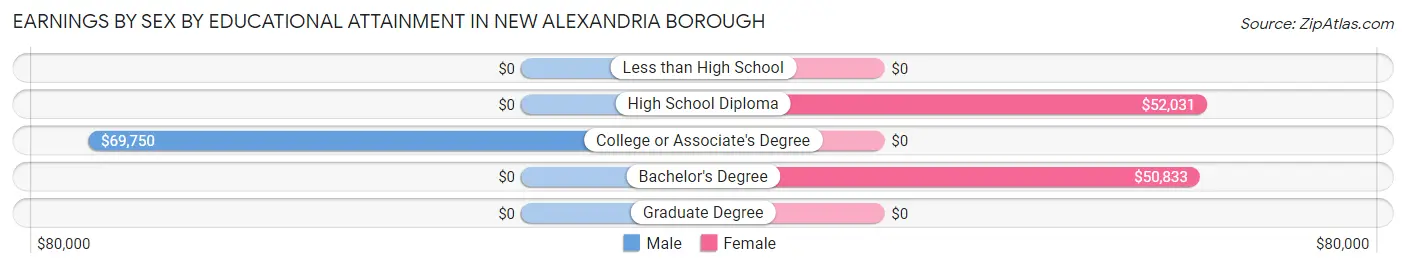
| Educational Attainment | Male Income | Female Income |
| Less than High School | - | - |
| High School Diploma | - | - |
| College or Associate's Degree | $69,750 | $0 |
| Bachelor's Degree | - | - |
| Graduate Degree | - | - |
| Total | $69,250 | $51,136 |
Family Income in New Alexandria borough
Family Income Brackets in New Alexandria borough
According to the New Alexandria borough family income data, there are 36 families falling into the $50,000 to $74,999 income range, which is the most common income bracket and makes up 27.1% of all families.
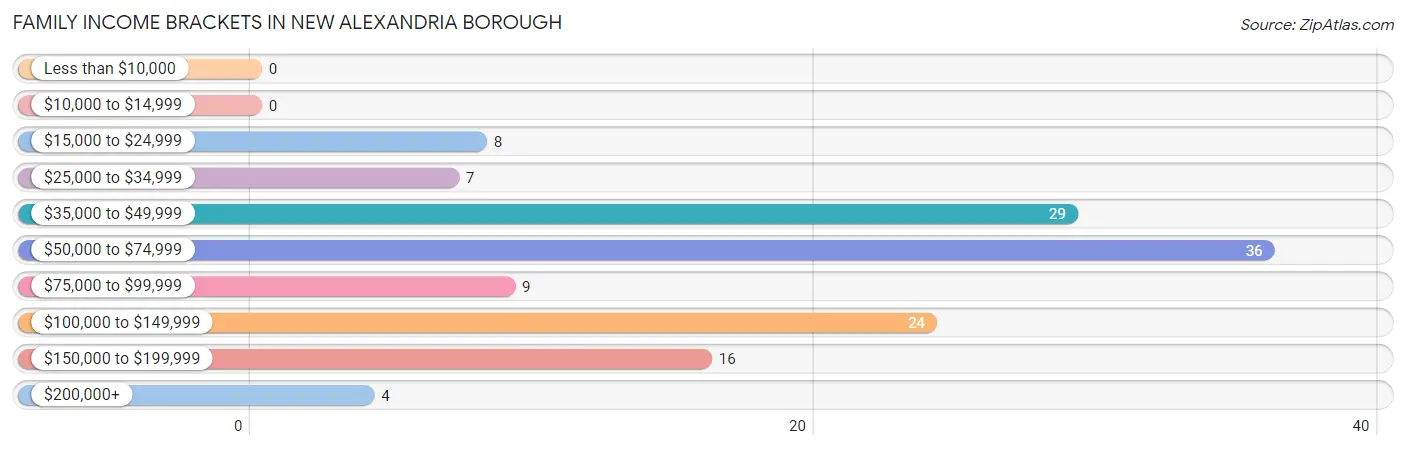
| Income Bracket | # Families | % Families |
| Less than $10,000 | 0 | 0.0% |
| $10,000 to $14,999 | 0 | 0.0% |
| $15,000 to $24,999 | 8 | 6.0% |
| $25,000 to $34,999 | 7 | 5.3% |
| $35,000 to $49,999 | 29 | 21.8% |
| $50,000 to $74,999 | 36 | 27.1% |
| $75,000 to $99,999 | 9 | 6.8% |
| $100,000 to $149,999 | 24 | 18.0% |
| $150,000 to $199,999 | 16 | 12.0% |
| $200,000+ | 4 | 3.0% |
Family Income by Famaliy Size in New Alexandria borough
4-person families (14 | 10.5%) account for the highest median family income in New Alexandria borough with $129,167 per family, while 4-person families (14 | 10.5%) have the highest median income of $32,292 per family member.
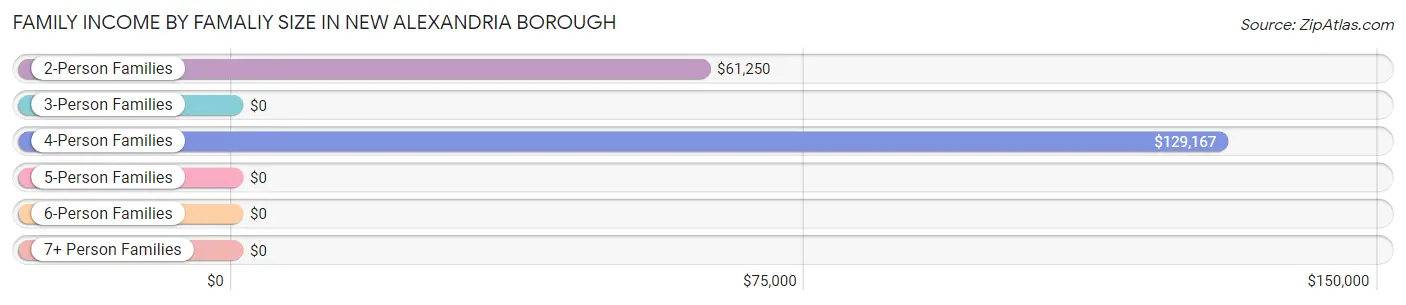
| Income Bracket | # Families | Median Income |
| 2-Person Families | 103 (77.4%) | $61,250 |
| 3-Person Families | 16 (12.0%) | $0 |
| 4-Person Families | 14 (10.5%) | $129,167 |
| 5-Person Families | 0 (0.0%) | $0 |
| 6-Person Families | 0 (0.0%) | $0 |
| 7+ Person Families | 0 (0.0%) | $0 |
| Total | 133 (100.0%) | $66,146 |
Family Income by Number of Earners in New Alexandria borough
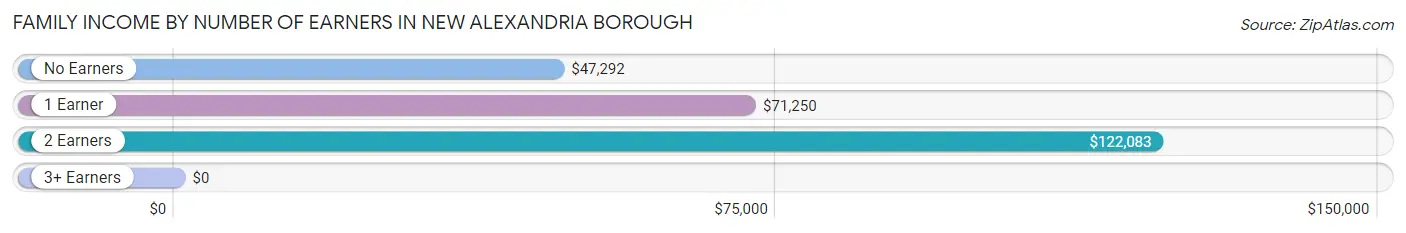
| Number of Earners | # Families | Median Income |
| No Earners | 60 (45.1%) | $47,292 |
| 1 Earner | 34 (25.6%) | $71,250 |
| 2 Earners | 32 (24.1%) | $122,083 |
| 3+ Earners | 7 (5.3%) | $0 |
| Total | 133 (100.0%) | $66,146 |
Household Income in New Alexandria borough
Household Income Brackets in New Alexandria borough
With 52 households falling in the category, the $50,000 to $74,999 income range is the most frequent in New Alexandria borough, accounting for 24.1% of all households.
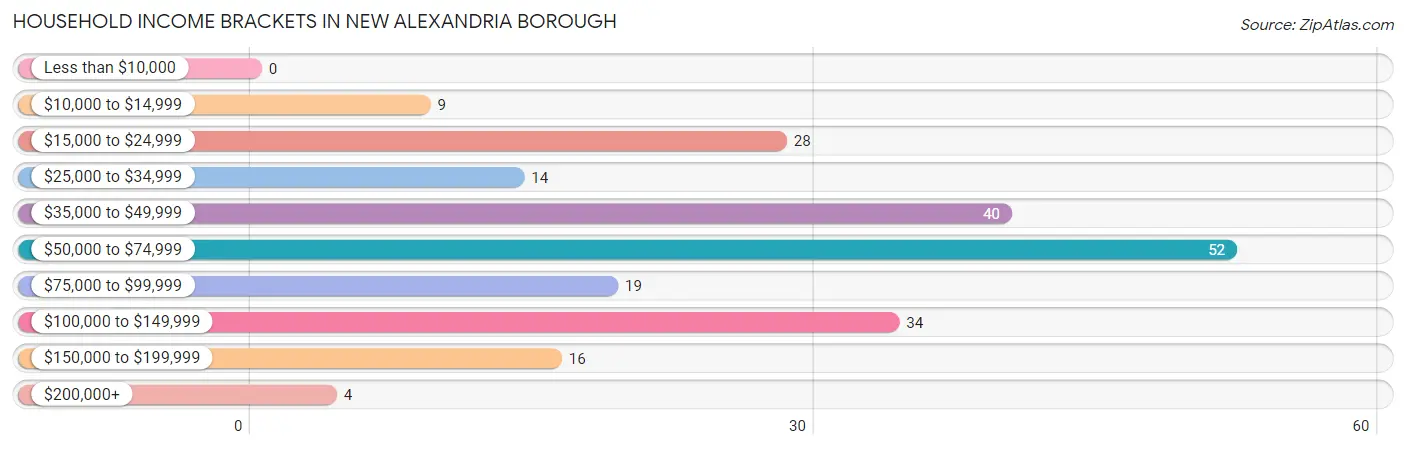
| Income Bracket | # Households | % Households |
| Less than $10,000 | 0 | 0.0% |
| $10,000 to $14,999 | 9 | 4.2% |
| $15,000 to $24,999 | 28 | 13.0% |
| $25,000 to $34,999 | 14 | 6.5% |
| $35,000 to $49,999 | 40 | 18.5% |
| $50,000 to $74,999 | 52 | 24.1% |
| $75,000 to $99,999 | 19 | 8.8% |
| $100,000 to $149,999 | 34 | 15.7% |
| $150,000 to $199,999 | 16 | 7.4% |
| $200,000+ | 4 | 1.9% |
Household Income by Householder Age in New Alexandria borough
The median household income in New Alexandria borough is $52,237, with the highest median household income of $113,125 found in the 45 to 64 years age bracket for the primary householder. A total of 71 households (32.9%) fall into this category.
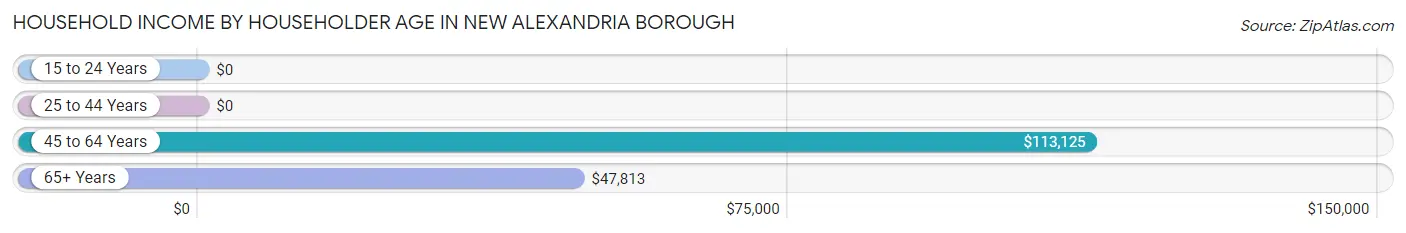
| Income Bracket | # Households | Median Income |
| 15 to 24 Years | 0 (0.0%) | $0 |
| 25 to 44 Years | 19 (8.8%) | $0 |
| 45 to 64 Years | 71 (32.9%) | $113,125 |
| 65+ Years | 126 (58.3%) | $47,813 |
| Total | 216 (100.0%) | $52,237 |
Poverty in New Alexandria borough
Income Below Poverty by Sex and Age in New Alexandria borough
With 10.0% poverty level for males and 7.4% for females among the residents of New Alexandria borough, 55 to 64 year old males and 55 to 64 year old females are the most vulnerable to poverty, with 12 males (35.3%) and 15 females (30.6%) in their respective age groups living below the poverty level.
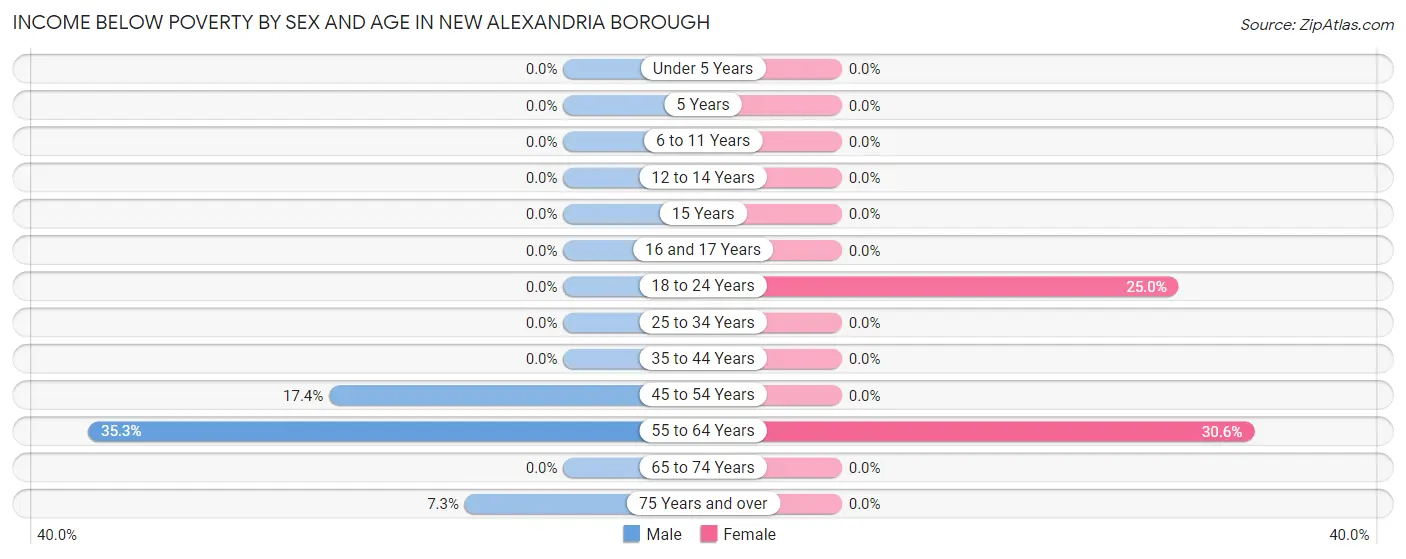
| Age Bracket | Male | Female |
| Under 5 Years | 0 (0.0%) | 0 (0.0%) |
| 5 Years | 0 (0.0%) | 0 (0.0%) |
| 6 to 11 Years | 0 (0.0%) | 0 (0.0%) |
| 12 to 14 Years | 0 (0.0%) | 0 (0.0%) |
| 15 Years | 0 (0.0%) | 0 (0.0%) |
| 16 and 17 Years | 0 (0.0%) | 0 (0.0%) |
| 18 to 24 Years | 0 (0.0%) | 1 (25.0%) |
| 25 to 34 Years | 0 (0.0%) | 0 (0.0%) |
| 35 to 44 Years | 0 (0.0%) | 0 (0.0%) |
| 45 to 54 Years | 4 (17.4%) | 0 (0.0%) |
| 55 to 64 Years | 12 (35.3%) | 15 (30.6%) |
| 65 to 74 Years | 0 (0.0%) | 0 (0.0%) |
| 75 Years and over | 3 (7.3%) | 0 (0.0%) |
| Total | 19 (10.0%) | 16 (7.4%) |
Income Above Poverty by Sex and Age in New Alexandria borough
According to the poverty statistics in New Alexandria borough, males aged 6 to 11 years and females aged under 5 years are the age groups that are most secure financially, with 100.0% of males and 100.0% of females in these age groups living above the poverty line.
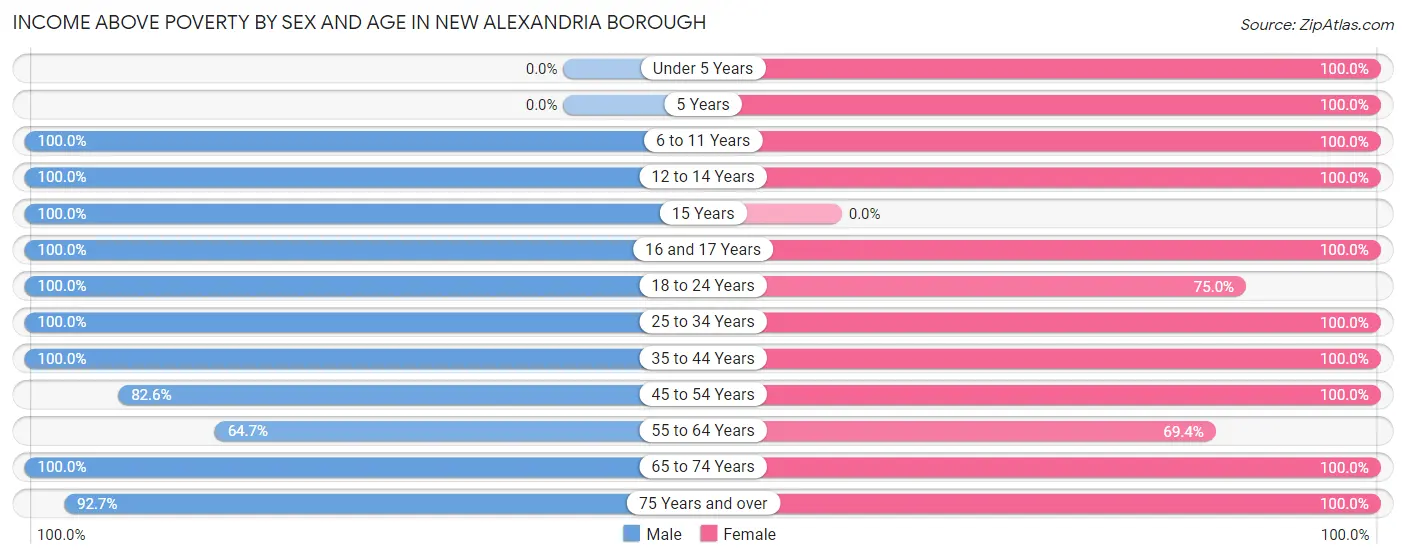
| Age Bracket | Male | Female |
| Under 5 Years | 0 (0.0%) | 4 (100.0%) |
| 5 Years | 0 (0.0%) | 2 (100.0%) |
| 6 to 11 Years | 4 (100.0%) | 6 (100.0%) |
| 12 to 14 Years | 2 (100.0%) | 4 (100.0%) |
| 15 Years | 5 (100.0%) | 0 (0.0%) |
| 16 and 17 Years | 3 (100.0%) | 5 (100.0%) |
| 18 to 24 Years | 9 (100.0%) | 3 (75.0%) |
| 25 to 34 Years | 9 (100.0%) | 10 (100.0%) |
| 35 to 44 Years | 7 (100.0%) | 15 (100.0%) |
| 45 to 54 Years | 19 (82.6%) | 13 (100.0%) |
| 55 to 64 Years | 22 (64.7%) | 34 (69.4%) |
| 65 to 74 Years | 53 (100.0%) | 55 (100.0%) |
| 75 Years and over | 38 (92.7%) | 48 (100.0%) |
| Total | 171 (90.0%) | 199 (92.6%) |
Income Below Poverty Among Married-Couple Families in New Alexandria borough
The poverty statistics for married-couple families in New Alexandria borough show that 6.4% or 8 of the total 125 families live below the poverty line. Families with no children have the highest poverty rate of 7.5%, comprising of 8 families. On the other hand, families with 1 or 2 children have the lowest poverty rate of 0.0%, which includes 0 families.
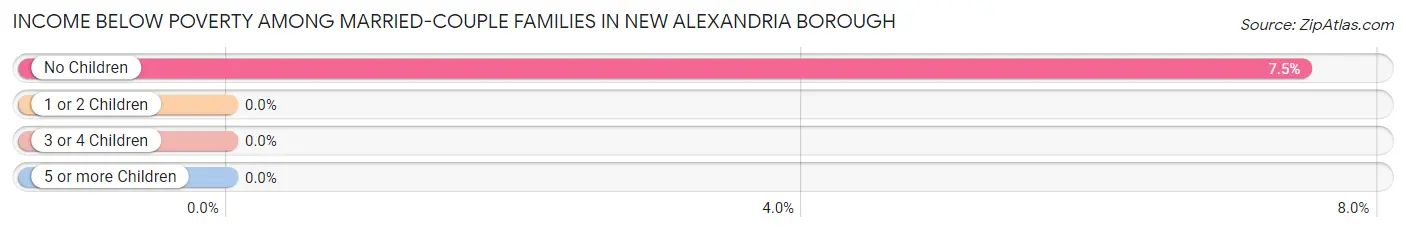
| Children | Above Poverty | Below Poverty |
| No Children | 99 (92.5%) | 8 (7.5%) |
| 1 or 2 Children | 18 (100.0%) | 0 (0.0%) |
| 3 or 4 Children | 0 (0.0%) | 0 (0.0%) |
| 5 or more Children | 0 (0.0%) | 0 (0.0%) |
| Total | 117 (93.6%) | 8 (6.4%) |
Income Below Poverty Among Single-Parent Households in New Alexandria borough
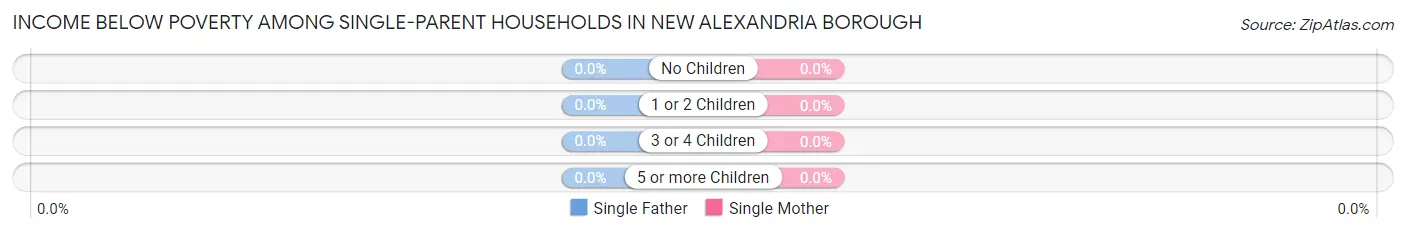
| Children | Single Father | Single Mother |
| No Children | 0 (0.0%) | 0 (0.0%) |
| 1 or 2 Children | 0 (0.0%) | 0 (0.0%) |
| 3 or 4 Children | 0 (0.0%) | 0 (0.0%) |
| 5 or more Children | 0 (0.0%) | 0 (0.0%) |
| Total | 0 (0.0%) | 0 (0.0%) |
Income Below Poverty Among Married-Couple vs Single-Parent Households in New Alexandria borough
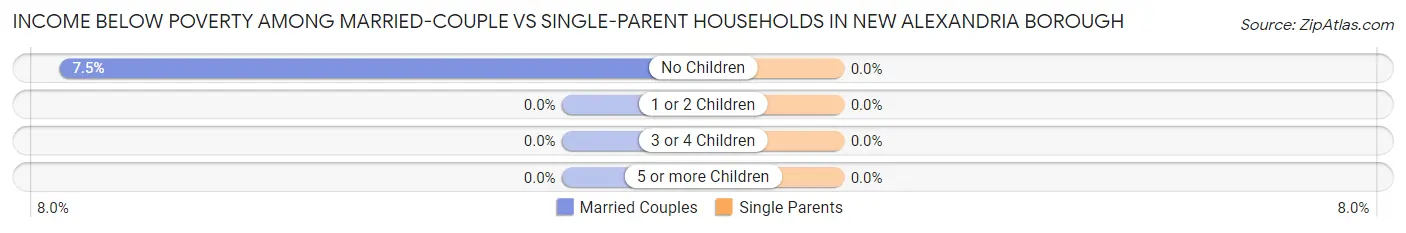
| Children | Married-Couple Families | Single-Parent Households |
| No Children | 8 (7.5%) | 0 (0.0%) |
| 1 or 2 Children | 0 (0.0%) | 0 (0.0%) |
| 3 or 4 Children | 0 (0.0%) | 0 (0.0%) |
| 5 or more Children | 0 (0.0%) | 0 (0.0%) |
| Total | 8 (6.4%) | 0 (0.0%) |
Employment Characteristics in New Alexandria borough
Employment by Class of Employer in New Alexandria borough
Among the 127 employed individuals in New Alexandria borough, private company employees (84 | 66.1%), local government employees (14 | 11.0%), and self-employed (incorporated) (9 | 7.1%) make up the most common classes of employment.
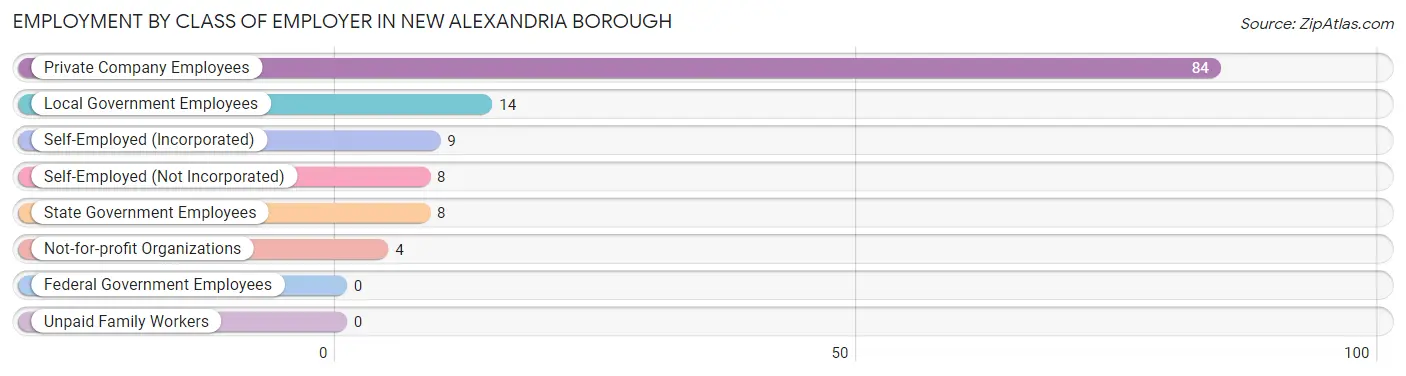
| Employer Class | # Employees | % Employees |
| Private Company Employees | 84 | 66.1% |
| Self-Employed (Incorporated) | 9 | 7.1% |
| Self-Employed (Not Incorporated) | 8 | 6.3% |
| Not-for-profit Organizations | 4 | 3.2% |
| Local Government Employees | 14 | 11.0% |
| State Government Employees | 8 | 6.3% |
| Federal Government Employees | 0 | 0.0% |
| Unpaid Family Workers | 0 | 0.0% |
| Total | 127 | 100.0% |
Employment Status by Age in New Alexandria borough
According to the labor force statistics for New Alexandria borough, out of the total population over 16 years of age (378), 36.5% or 138 individuals are in the labor force, with 8.0% or 11 of them unemployed. The age group with the highest labor force participation rate is 20 to 24 years, with 100.0% or 8 individuals in the labor force. Within the labor force, the 16 to 19 years age range has the highest percentage of unemployed individuals, with 60.0% or 3 of them being unemployed.
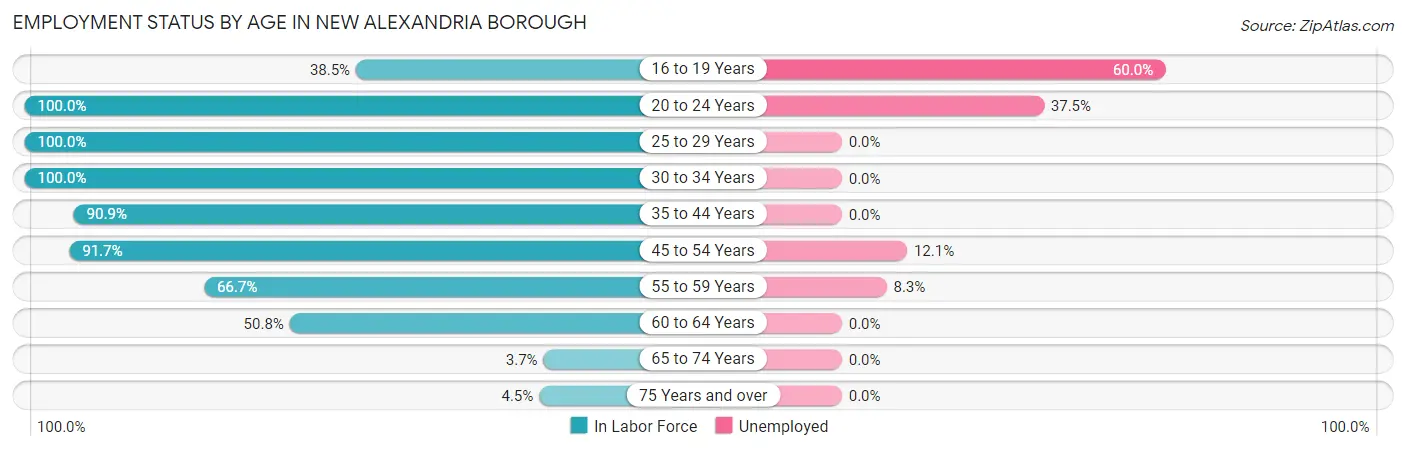
| Age Bracket | In Labor Force | Unemployed |
| 16 to 19 Years | 5 (38.5%) | 3 (60.0%) |
| 20 to 24 Years | 8 (100.0%) | 3 (37.5%) |
| 25 to 29 Years | 7 (100.0%) | 0 (0.0%) |
| 30 to 34 Years | 12 (100.0%) | 0 (0.0%) |
| 35 to 44 Years | 20 (90.9%) | 0 (0.0%) |
| 45 to 54 Years | 33 (91.7%) | 4 (12.1%) |
| 55 to 59 Years | 12 (66.7%) | 1 (8.3%) |
| 60 to 64 Years | 33 (50.8%) | 0 (0.0%) |
| 65 to 74 Years | 4 (3.7%) | 0 (0.0%) |
| 75 Years and over | 4 (4.5%) | 0 (0.0%) |
| Total | 138 (36.5%) | 11 (8.0%) |
Employment Status by Educational Attainment in New Alexandria borough
According to labor force statistics for New Alexandria borough, 73.1% of individuals (117) out of the total population between 25 and 64 years of age (160) are in the labor force, with 4.3% or 5 of them being unemployed. The group with the highest labor force participation rate are those with the educational attainment of less than high school, with 100.0% or 2 individuals in the labor force. Within the labor force, individuals with high school diploma education have the highest percentage of unemployment, with 16.7% or 4 of them being unemployed.
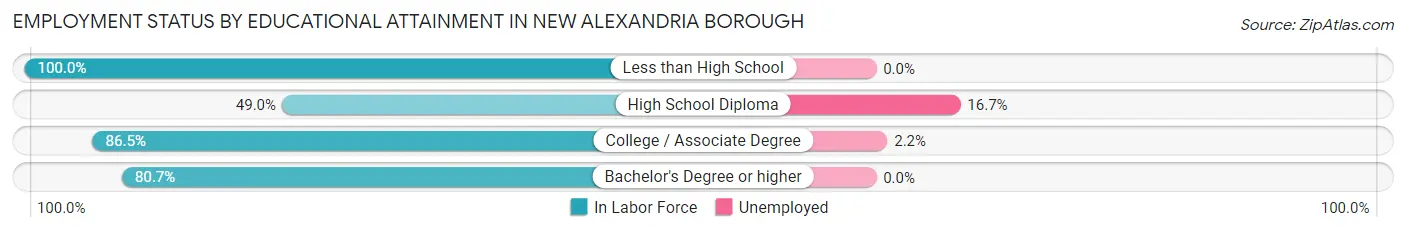
| Educational Attainment | In Labor Force | Unemployed |
| Less than High School | 2 (100.0%) | 0 (0.0%) |
| High School Diploma | 24 (49.0%) | 8 (16.7%) |
| College / Associate Degree | 45 (86.5%) | 1 (2.2%) |
| Bachelor's Degree or higher | 46 (80.7%) | 0 (0.0%) |
| Total | 117 (73.1%) | 7 (4.3%) |
Employment Occupations by Sex in New Alexandria borough
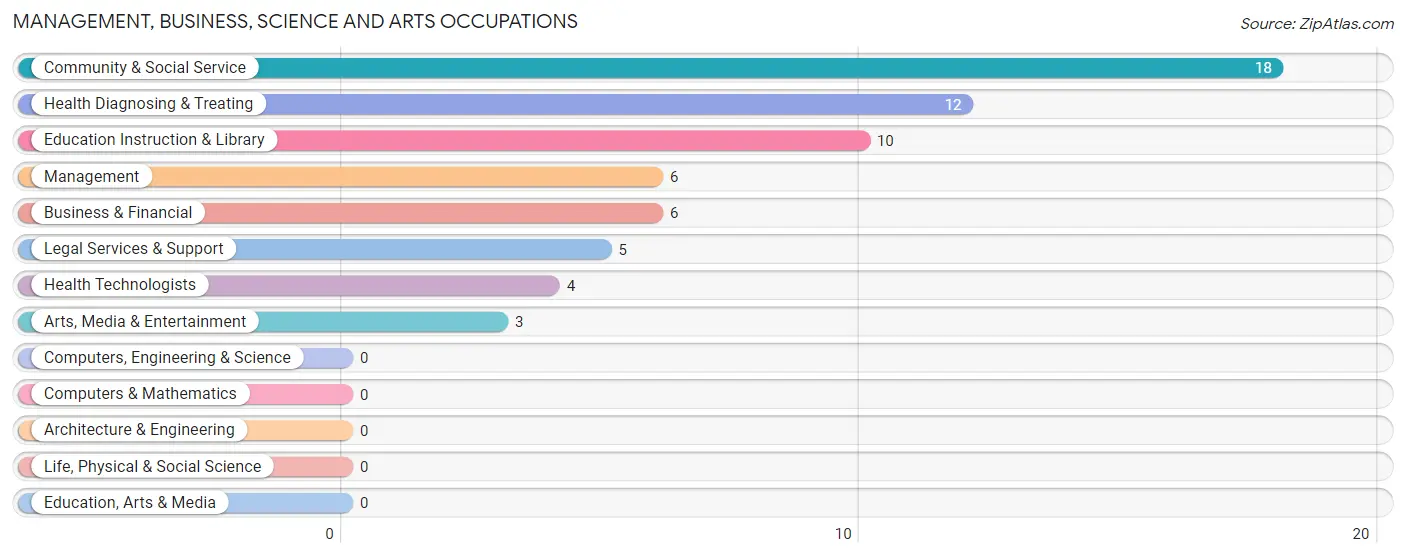
Management, Business, Science and Arts Occupations
The most common Management, Business, Science and Arts occupations in New Alexandria borough are Community & Social Service (18 | 14.2%), Health Diagnosing & Treating (12 | 9.5%), Education Instruction & Library (10 | 7.9%), Management (6 | 4.7%), and Business & Financial (6 | 4.7%).
Management, Business, Science and Arts Occupations by Sex
Within the Management, Business, Science and Arts occupations in New Alexandria borough, the most male-oriented occupations are Management (100.0%), Legal Services & Support (20.0%), and Business & Financial (16.7%), while the most female-oriented occupations are Arts, Media & Entertainment (100.0%), Health Diagnosing & Treating (100.0%), and Health Technologists (100.0%).
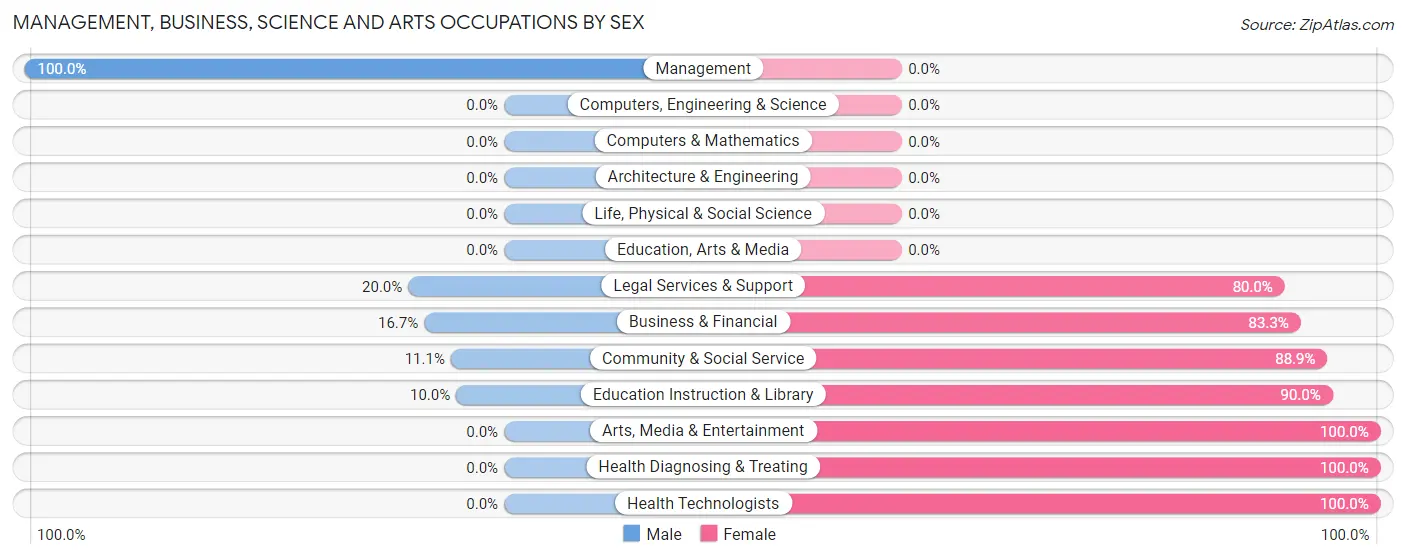
| Occupation | Male | Female |
| Management | 6 (100.0%) | 0 (0.0%) |
| Business & Financial | 1 (16.7%) | 5 (83.3%) |
| Computers, Engineering & Science | 0 (0.0%) | 0 (0.0%) |
| Computers & Mathematics | 0 (0.0%) | 0 (0.0%) |
| Architecture & Engineering | 0 (0.0%) | 0 (0.0%) |
| Life, Physical & Social Science | 0 (0.0%) | 0 (0.0%) |
| Community & Social Service | 2 (11.1%) | 16 (88.9%) |
| Education, Arts & Media | 0 (0.0%) | 0 (0.0%) |
| Legal Services & Support | 1 (20.0%) | 4 (80.0%) |
| Education Instruction & Library | 1 (10.0%) | 9 (90.0%) |
| Arts, Media & Entertainment | 0 (0.0%) | 3 (100.0%) |
| Health Diagnosing & Treating | 0 (0.0%) | 12 (100.0%) |
| Health Technologists | 0 (0.0%) | 4 (100.0%) |
| Total (Category) | 9 (21.4%) | 33 (78.6%) |
| Total (Overall) | 67 (52.8%) | 60 (47.2%) |
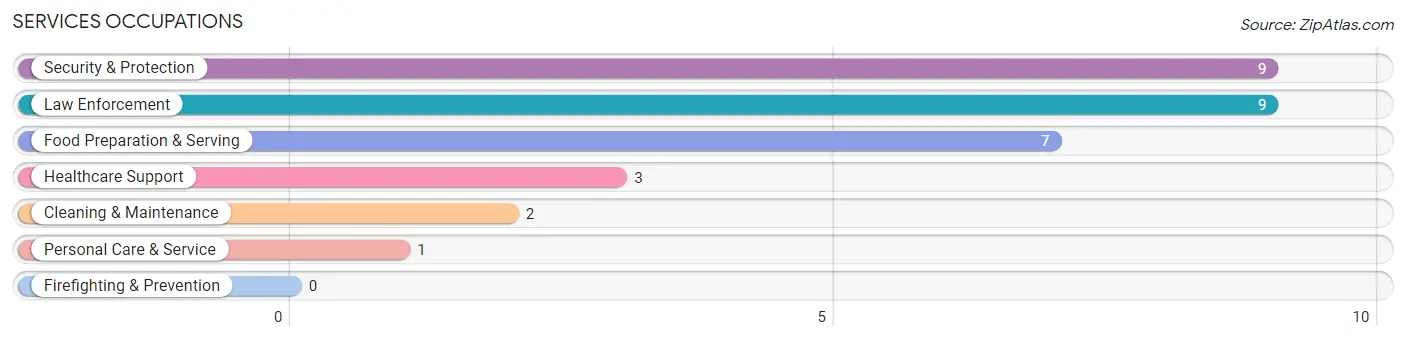
Services Occupations
The most common Services occupations in New Alexandria borough are Security & Protection (9 | 7.1%), Law Enforcement (9 | 7.1%), Food Preparation & Serving (7 | 5.5%), Healthcare Support (3 | 2.4%), and Cleaning & Maintenance (2 | 1.6%).
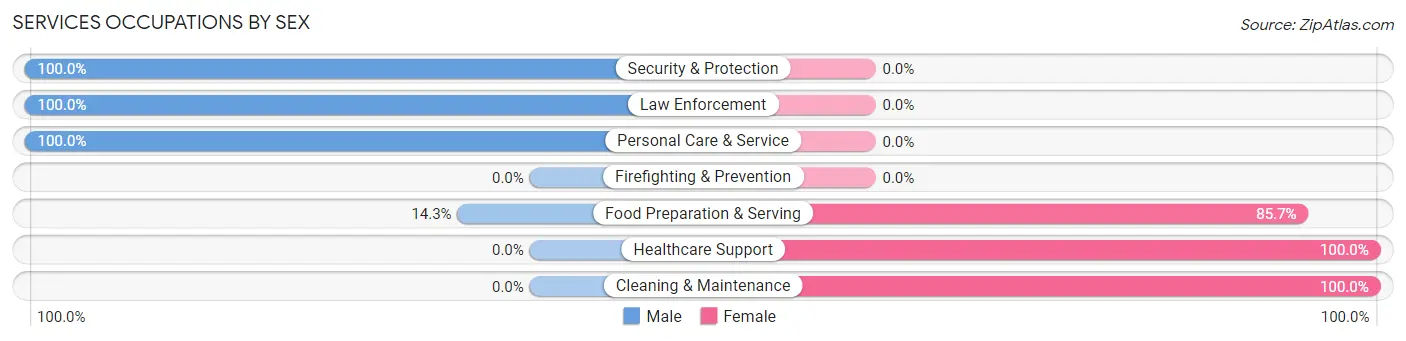
Services Occupations by Sex
Within the Services occupations in New Alexandria borough, the most male-oriented occupations are Security & Protection (100.0%), Law Enforcement (100.0%), and Personal Care & Service (100.0%), while the most female-oriented occupations are Healthcare Support (100.0%), Cleaning & Maintenance (100.0%), and Food Preparation & Serving (85.7%).
| Occupation | Male | Female |
| Healthcare Support | 0 (0.0%) | 3 (100.0%) |
| Security & Protection | 9 (100.0%) | 0 (0.0%) |
| Firefighting & Prevention | 0 (0.0%) | 0 (0.0%) |
| Law Enforcement | 9 (100.0%) | 0 (0.0%) |
| Food Preparation & Serving | 1 (14.3%) | 6 (85.7%) |
| Cleaning & Maintenance | 0 (0.0%) | 2 (100.0%) |
| Personal Care & Service | 1 (100.0%) | 0 (0.0%) |
| Total (Category) | 11 (50.0%) | 11 (50.0%) |
| Total (Overall) | 67 (52.8%) | 60 (47.2%) |
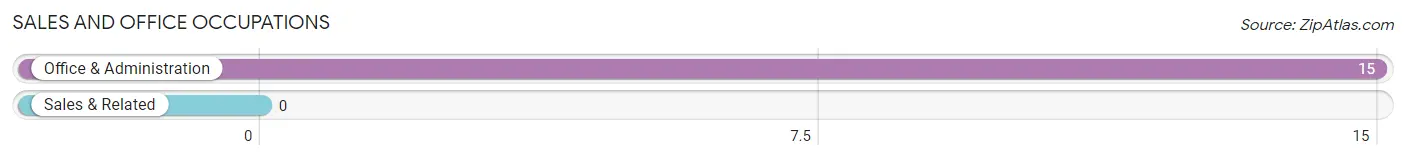
Sales and Office Occupations
The most common Sales and Office occupations in New Alexandria borough are , and Office & Administration (15 | 11.8%).
Sales and Office Occupations by Sex
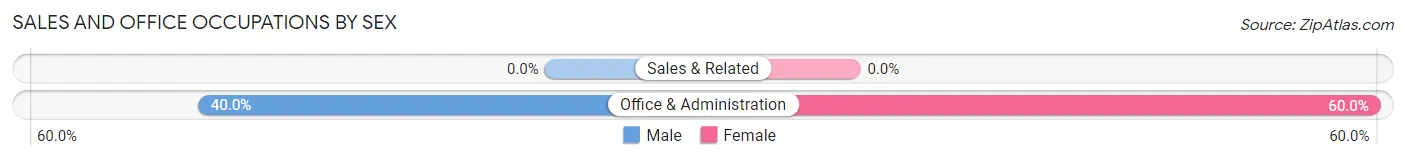
| Occupation | Male | Female |
| Sales & Related | 0 (0.0%) | 0 (0.0%) |
| Office & Administration | 6 (40.0%) | 9 (60.0%) |
| Total (Category) | 6 (40.0%) | 9 (60.0%) |
| Total (Overall) | 67 (52.8%) | 60 (47.2%) |
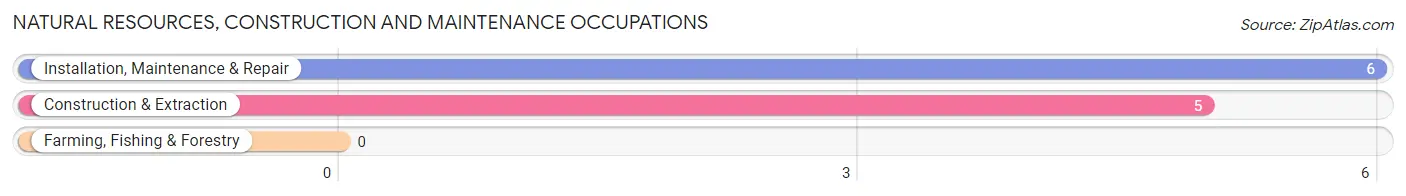
Natural Resources, Construction and Maintenance Occupations
The most common Natural Resources, Construction and Maintenance occupations in New Alexandria borough are Installation, Maintenance & Repair (6 | 4.7%), and Construction & Extraction (5 | 3.9%).
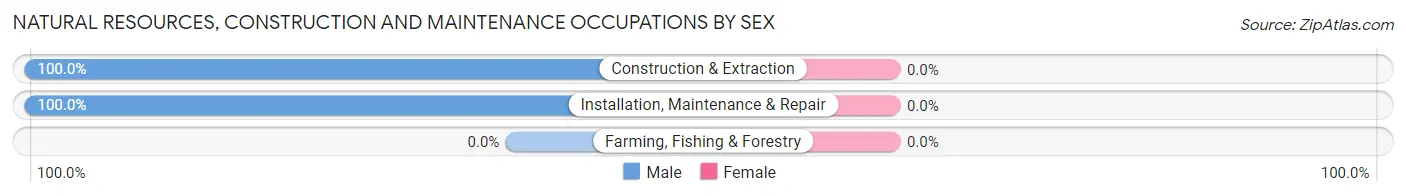
Natural Resources, Construction and Maintenance Occupations by Sex
| Occupation | Male | Female |
| Farming, Fishing & Forestry | 0 (0.0%) | 0 (0.0%) |
| Construction & Extraction | 5 (100.0%) | 0 (0.0%) |
| Installation, Maintenance & Repair | 6 (100.0%) | 0 (0.0%) |
| Total (Category) | 11 (100.0%) | 0 (0.0%) |
| Total (Overall) | 67 (52.8%) | 60 (47.2%) |
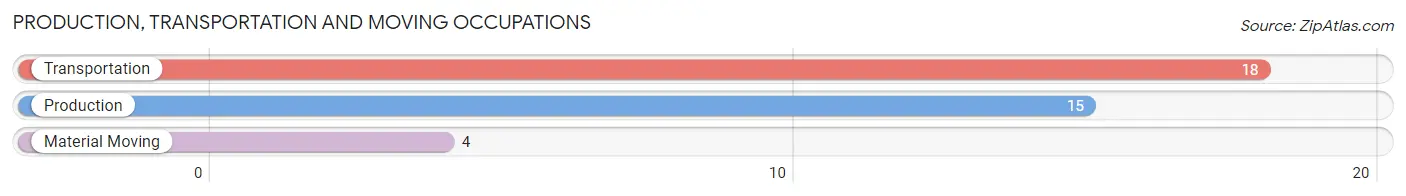
Production, Transportation and Moving Occupations
The most common Production, Transportation and Moving occupations in New Alexandria borough are Transportation (18 | 14.2%), Production (15 | 11.8%), and Material Moving (4 | 3.2%).
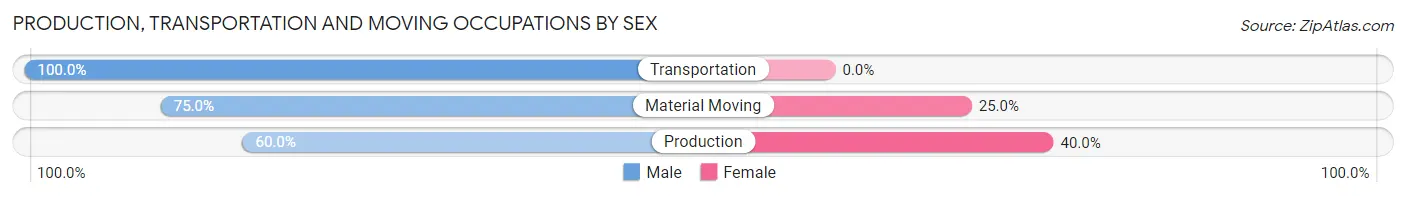
Production, Transportation and Moving Occupations by Sex
| Occupation | Male | Female |
| Production | 9 (60.0%) | 6 (40.0%) |
| Transportation | 18 (100.0%) | 0 (0.0%) |
| Material Moving | 3 (75.0%) | 1 (25.0%) |
| Total (Category) | 30 (81.1%) | 7 (18.9%) |
| Total (Overall) | 67 (52.8%) | 60 (47.2%) |
Employment Industries by Sex in New Alexandria borough
Employment Industries in New Alexandria borough
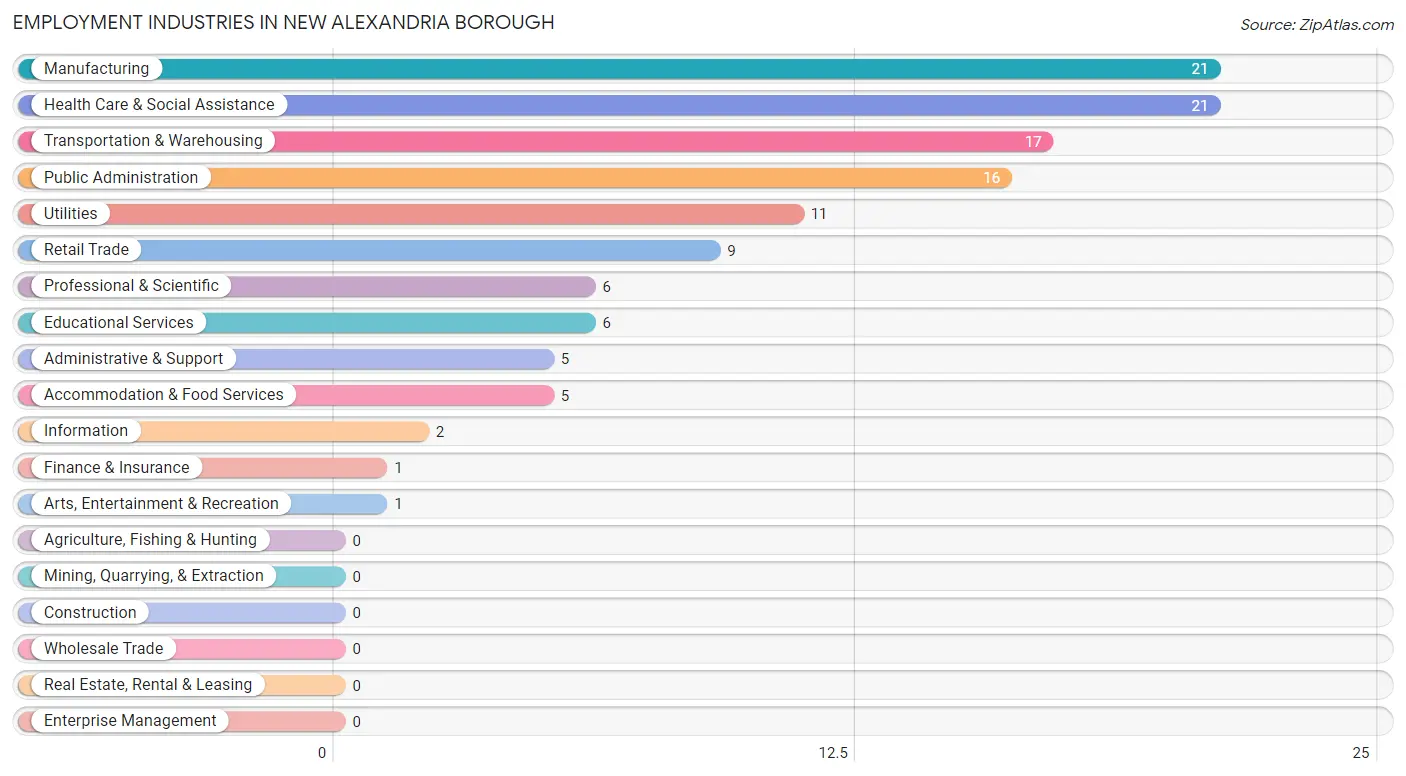
The major employment industries in New Alexandria borough include Manufacturing (21 | 16.5%), Health Care & Social Assistance (21 | 16.5%), Transportation & Warehousing (17 | 13.4%), Public Administration (16 | 12.6%), and Utilities (11 | 8.7%).
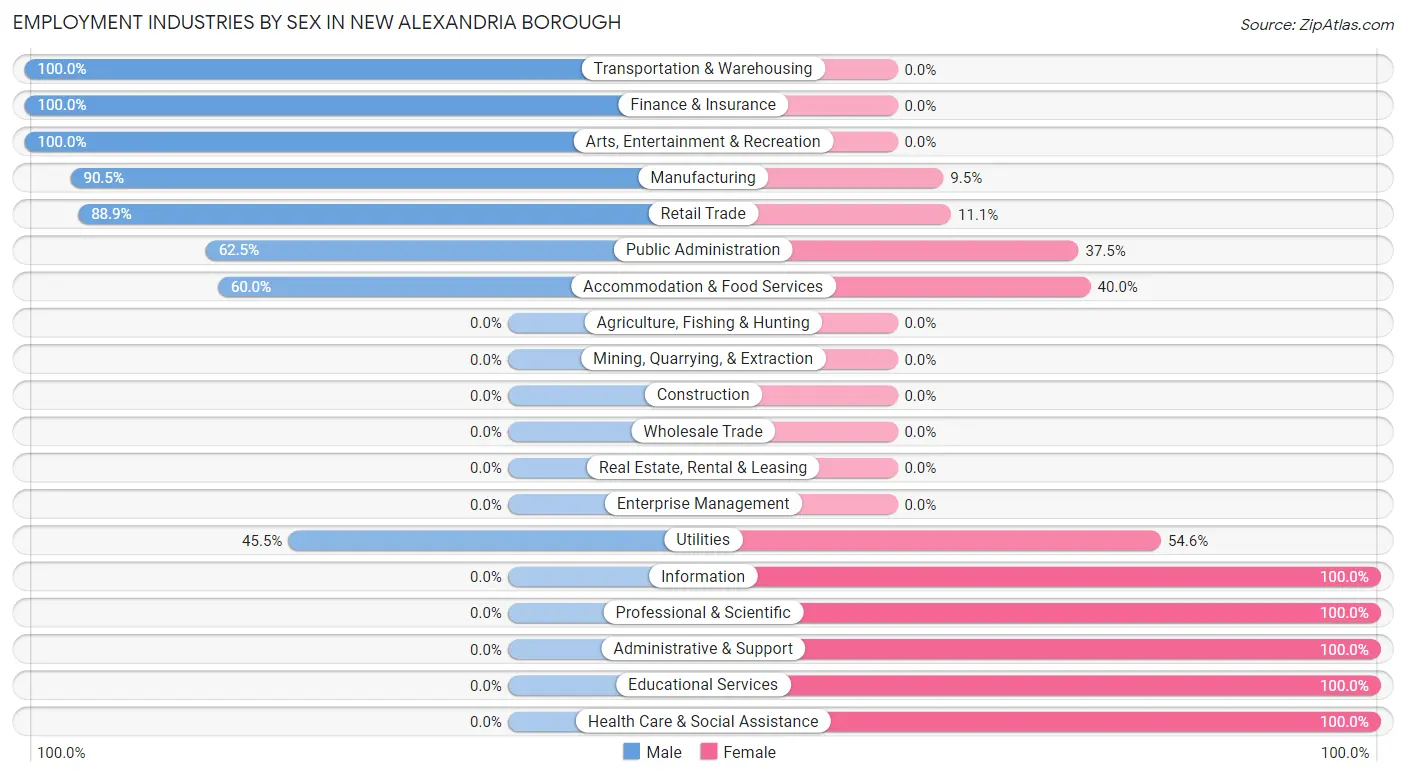
Employment Industries by Sex in New Alexandria borough
The New Alexandria borough industries that see more men than women are Transportation & Warehousing (100.0%), Finance & Insurance (100.0%), and Arts, Entertainment & Recreation (100.0%), whereas the industries that tend to have a higher number of women are Information (100.0%), Professional & Scientific (100.0%), and Administrative & Support (100.0%).
| Industry | Male | Female |
| Agriculture, Fishing & Hunting | 0 (0.0%) | 0 (0.0%) |
| Mining, Quarrying, & Extraction | 0 (0.0%) | 0 (0.0%) |
| Construction | 0 (0.0%) | 0 (0.0%) |
| Manufacturing | 19 (90.5%) | 2 (9.5%) |
| Wholesale Trade | 0 (0.0%) | 0 (0.0%) |
| Retail Trade | 8 (88.9%) | 1 (11.1%) |
| Transportation & Warehousing | 17 (100.0%) | 0 (0.0%) |
| Utilities | 5 (45.5%) | 6 (54.5%) |
| Information | 0 (0.0%) | 2 (100.0%) |
| Finance & Insurance | 1 (100.0%) | 0 (0.0%) |
| Real Estate, Rental & Leasing | 0 (0.0%) | 0 (0.0%) |
| Professional & Scientific | 0 (0.0%) | 6 (100.0%) |
| Enterprise Management | 0 (0.0%) | 0 (0.0%) |
| Administrative & Support | 0 (0.0%) | 5 (100.0%) |
| Educational Services | 0 (0.0%) | 6 (100.0%) |
| Health Care & Social Assistance | 0 (0.0%) | 21 (100.0%) |
| Arts, Entertainment & Recreation | 1 (100.0%) | 0 (0.0%) |
| Accommodation & Food Services | 3 (60.0%) | 2 (40.0%) |
| Public Administration | 10 (62.5%) | 6 (37.5%) |
| Total | 67 (52.8%) | 60 (47.2%) |
Education in New Alexandria borough
School Enrollment in New Alexandria borough
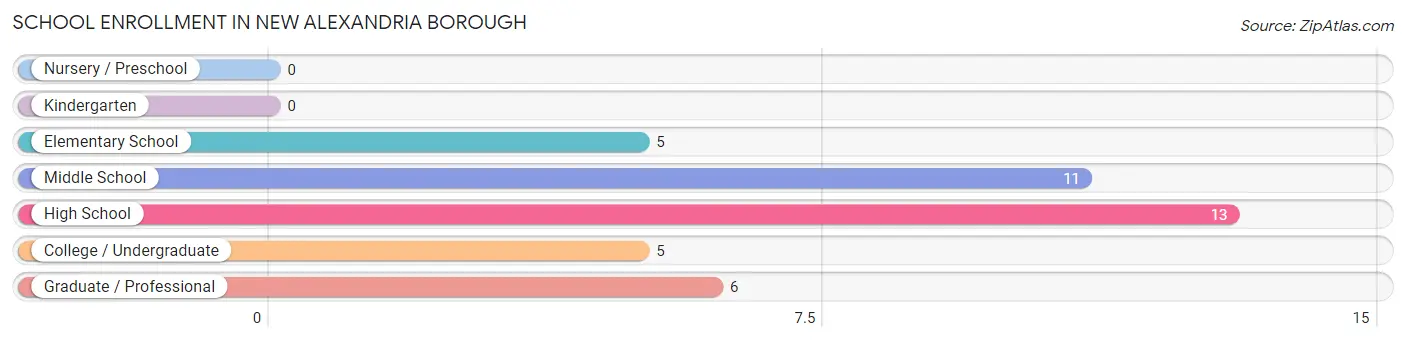
The most common levels of schooling among the 40 students in New Alexandria borough are high school (13 | 32.5%), middle school (11 | 27.5%), and graduate / professional (6 | 15.0%).
| School Level | # Students | % Students |
| Nursery / Preschool | 0 | 0.0% |
| Kindergarten | 0 | 0.0% |
| Elementary School | 5 | 12.5% |
| Middle School | 11 | 27.5% |
| High School | 13 | 32.5% |
| College / Undergraduate | 5 | 12.5% |
| Graduate / Professional | 6 | 15.0% |
| Total | 40 | 100.0% |
School Enrollment by Age by Funding Source in New Alexandria borough
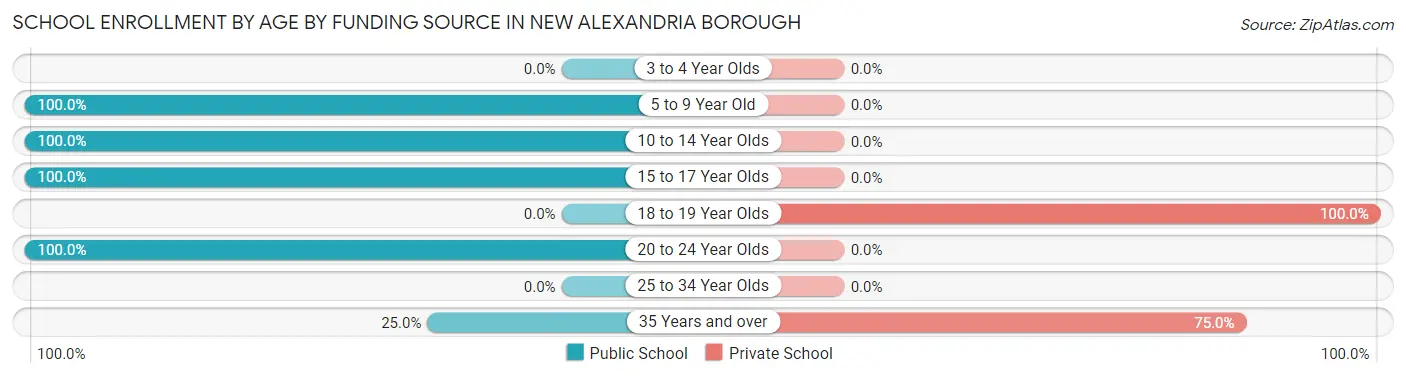
Out of a total of 40 students who are enrolled in schools in New Alexandria borough, 8 (20.0%) attend a private institution, while the remaining 32 (80.0%) are enrolled in public schools. The age group of 18 to 19 year olds has the highest likelihood of being enrolled in private schools, with 2 (100.0% in the age bracket) enrolled. Conversely, the age group of 5 to 9 year old has the lowest likelihood of being enrolled in a private school, with 5 (100.0% in the age bracket) attending a public institution.
| Age Bracket | Public School | Private School |
| 3 to 4 Year Olds | 0 (0.0%) | 0 (0.0%) |
| 5 to 9 Year Old | 5 (100.0%) | 0 (0.0%) |
| 10 to 14 Year Olds | 11 (100.0%) | 0 (0.0%) |
| 15 to 17 Year Olds | 13 (100.0%) | 0 (0.0%) |
| 18 to 19 Year Olds | 0 (0.0%) | 2 (100.0%) |
| 20 to 24 Year Olds | 1 (100.0%) | 0 (0.0%) |
| 25 to 34 Year Olds | 0 (0.0%) | 0 (0.0%) |
| 35 Years and over | 2 (25.0%) | 6 (75.0%) |
| Total | 32 (80.0%) | 8 (20.0%) |
Educational Attainment by Field of Study in New Alexandria borough
Education (32 | 30.2%), business (20 | 18.9%), science & technology (14 | 13.2%), engineering (13 | 12.3%), and liberal arts & history (8 | 7.5%) are the most common fields of study among 106 individuals in New Alexandria borough who have obtained a bachelor's degree or higher.
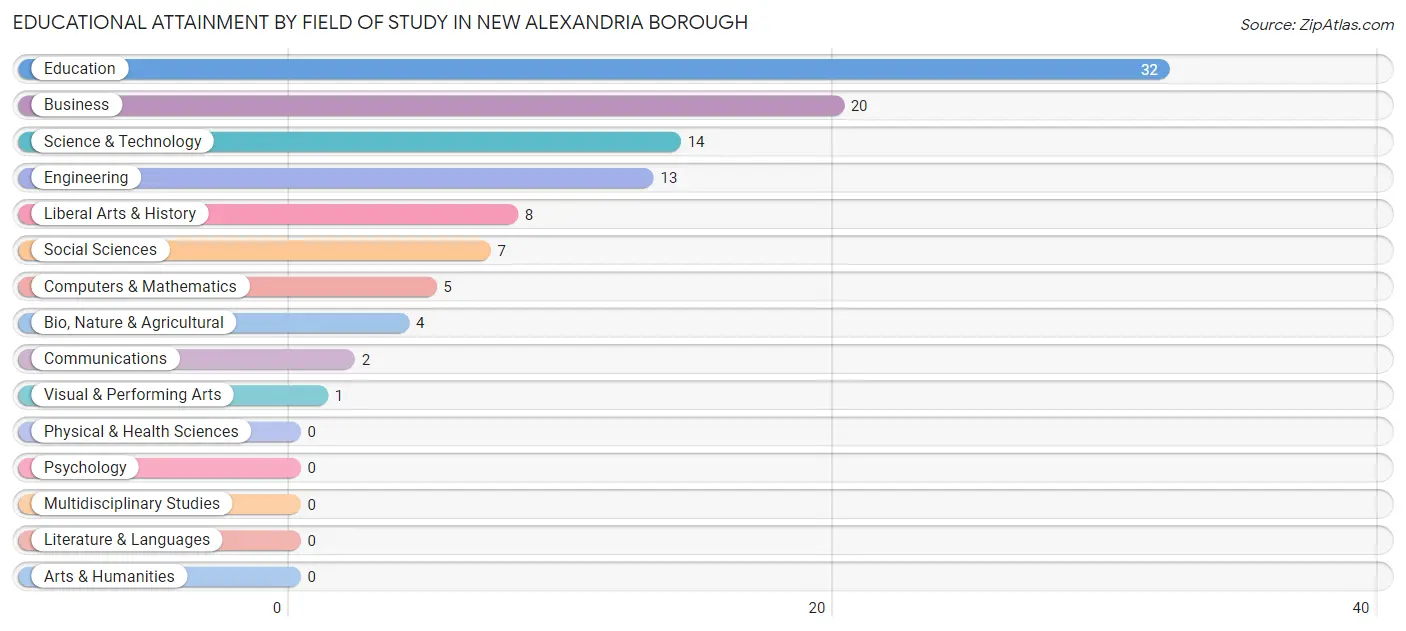
| Field of Study | # Graduates | % Graduates |
| Computers & Mathematics | 5 | 4.7% |
| Bio, Nature & Agricultural | 4 | 3.8% |
| Physical & Health Sciences | 0 | 0.0% |
| Psychology | 0 | 0.0% |
| Social Sciences | 7 | 6.6% |
| Engineering | 13 | 12.3% |
| Multidisciplinary Studies | 0 | 0.0% |
| Science & Technology | 14 | 13.2% |
| Business | 20 | 18.9% |
| Education | 32 | 30.2% |
| Literature & Languages | 0 | 0.0% |
| Liberal Arts & History | 8 | 7.5% |
| Visual & Performing Arts | 1 | 0.9% |
| Communications | 2 | 1.9% |
| Arts & Humanities | 0 | 0.0% |
| Total | 106 | 100.0% |
Transportation & Commute in New Alexandria borough
Vehicle Availability by Sex in New Alexandria borough
The most prevalent vehicle ownership categories in New Alexandria borough are males with 2 vehicles (24, accounting for 35.8%) and females with 2 vehicles (24, making up 40.0%).
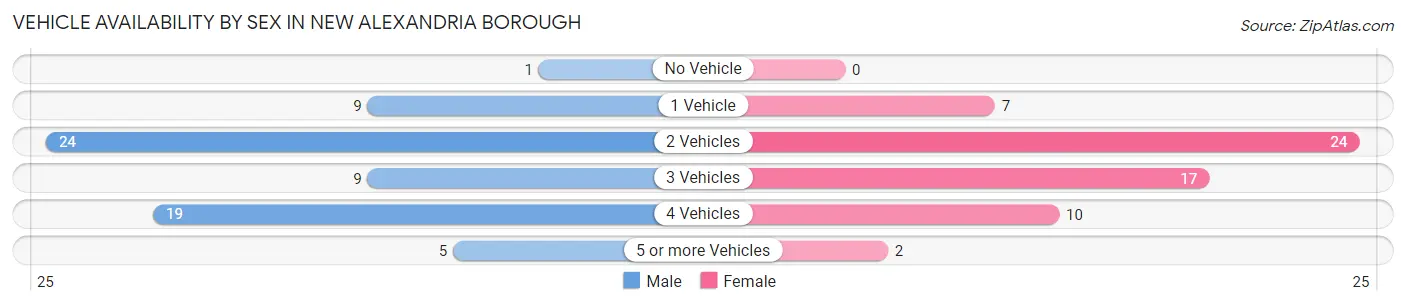
| Vehicles Available | Male | Female |
| No Vehicle | 1 (1.5%) | 0 (0.0%) |
| 1 Vehicle | 9 (13.4%) | 7 (11.7%) |
| 2 Vehicles | 24 (35.8%) | 24 (40.0%) |
| 3 Vehicles | 9 (13.4%) | 17 (28.3%) |
| 4 Vehicles | 19 (28.4%) | 10 (16.7%) |
| 5 or more Vehicles | 5 (7.5%) | 2 (3.3%) |
| Total | 67 (100.0%) | 60 (100.0%) |
Commute Time in New Alexandria borough
The most frequently occuring commute durations in New Alexandria borough are 15 to 19 minutes (33 commuters, 28.0%), 20 to 24 minutes (18 commuters, 15.2%), and 25 to 29 minutes (15 commuters, 12.7%).
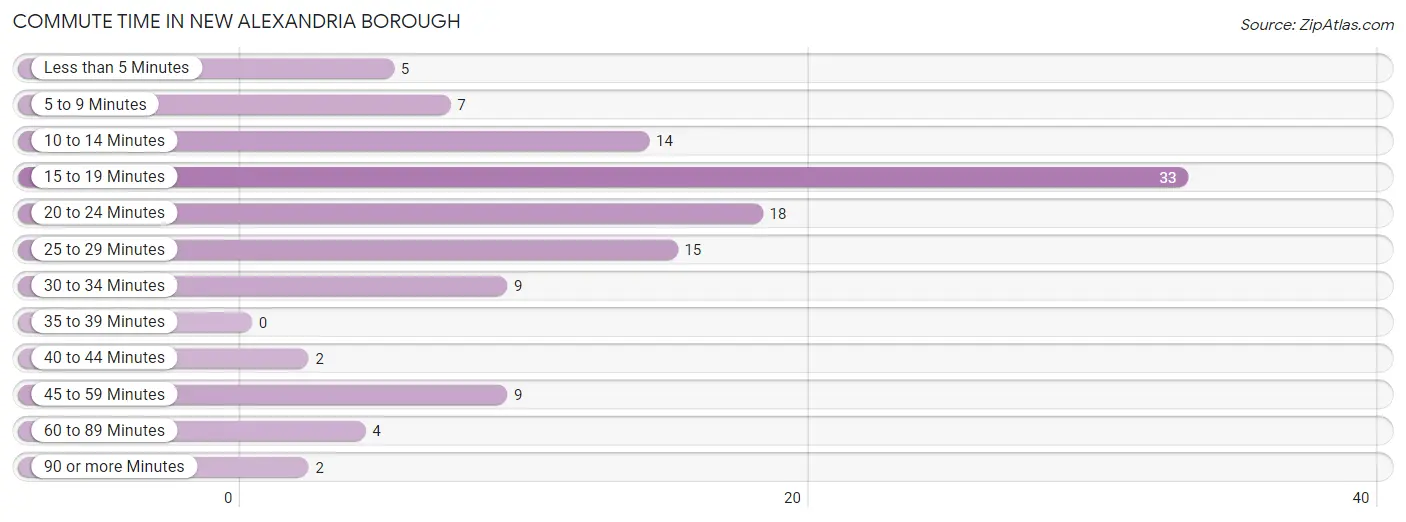
| Commute Time | # Commuters | % Commuters |
| Less than 5 Minutes | 5 | 4.2% |
| 5 to 9 Minutes | 7 | 5.9% |
| 10 to 14 Minutes | 14 | 11.9% |
| 15 to 19 Minutes | 33 | 28.0% |
| 20 to 24 Minutes | 18 | 15.2% |
| 25 to 29 Minutes | 15 | 12.7% |
| 30 to 34 Minutes | 9 | 7.6% |
| 35 to 39 Minutes | 0 | 0.0% |
| 40 to 44 Minutes | 2 | 1.7% |
| 45 to 59 Minutes | 9 | 7.6% |
| 60 to 89 Minutes | 4 | 3.4% |
| 90 or more Minutes | 2 | 1.7% |
Commute Time by Sex in New Alexandria borough
The most common commute times in New Alexandria borough are 15 to 19 minutes (19 commuters, 32.8%) for males and 15 to 19 minutes (14 commuters, 23.3%) for females.
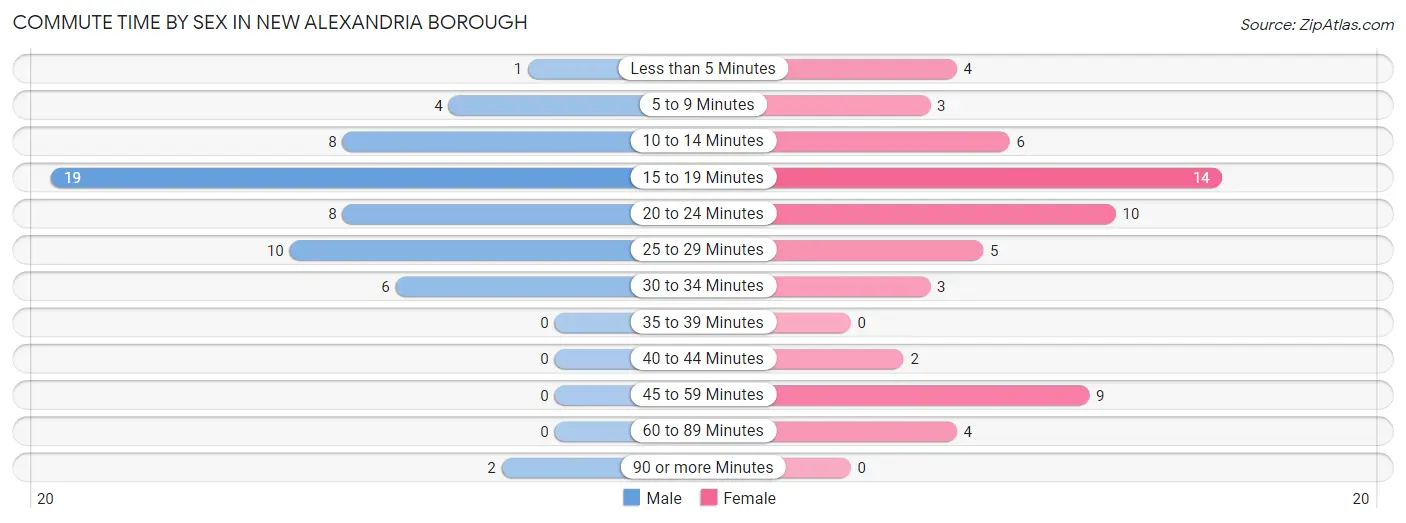
| Commute Time | Male | Female |
| Less than 5 Minutes | 1 (1.7%) | 4 (6.7%) |
| 5 to 9 Minutes | 4 (6.9%) | 3 (5.0%) |
| 10 to 14 Minutes | 8 (13.8%) | 6 (10.0%) |
| 15 to 19 Minutes | 19 (32.8%) | 14 (23.3%) |
| 20 to 24 Minutes | 8 (13.8%) | 10 (16.7%) |
| 25 to 29 Minutes | 10 (17.2%) | 5 (8.3%) |
| 30 to 34 Minutes | 6 (10.3%) | 3 (5.0%) |
| 35 to 39 Minutes | 0 (0.0%) | 0 (0.0%) |
| 40 to 44 Minutes | 0 (0.0%) | 2 (3.3%) |
| 45 to 59 Minutes | 0 (0.0%) | 9 (15.0%) |
| 60 to 89 Minutes | 0 (0.0%) | 4 (6.7%) |
| 90 or more Minutes | 2 (3.5%) | 0 (0.0%) |
Time of Departure to Work by Sex in New Alexandria borough
The most frequent times of departure to work in New Alexandria borough are 12:00 PM to 3:59 PM (17, 29.3%) for males and 7:00 AM to 7:29 AM (15, 25.0%) for females.
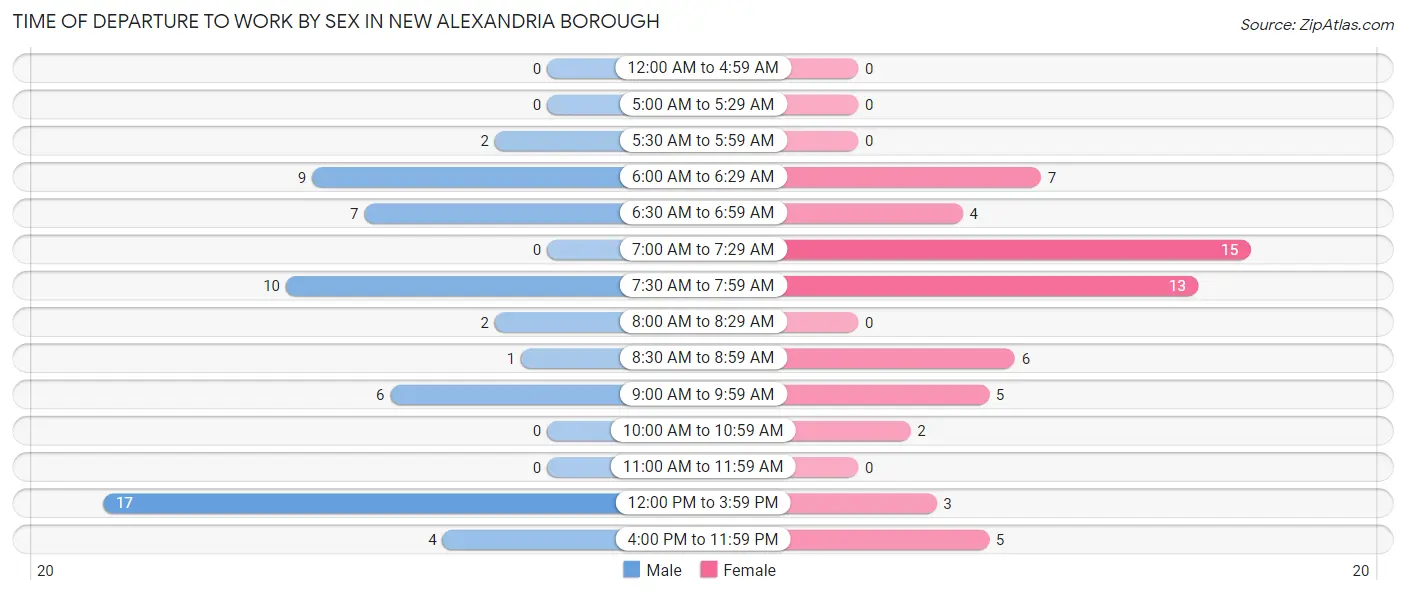
| Time of Departure | Male | Female |
| 12:00 AM to 4:59 AM | 0 (0.0%) | 0 (0.0%) |
| 5:00 AM to 5:29 AM | 0 (0.0%) | 0 (0.0%) |
| 5:30 AM to 5:59 AM | 2 (3.5%) | 0 (0.0%) |
| 6:00 AM to 6:29 AM | 9 (15.5%) | 7 (11.7%) |
| 6:30 AM to 6:59 AM | 7 (12.1%) | 4 (6.7%) |
| 7:00 AM to 7:29 AM | 0 (0.0%) | 15 (25.0%) |
| 7:30 AM to 7:59 AM | 10 (17.2%) | 13 (21.7%) |
| 8:00 AM to 8:29 AM | 2 (3.5%) | 0 (0.0%) |
| 8:30 AM to 8:59 AM | 1 (1.7%) | 6 (10.0%) |
| 9:00 AM to 9:59 AM | 6 (10.3%) | 5 (8.3%) |
| 10:00 AM to 10:59 AM | 0 (0.0%) | 2 (3.3%) |
| 11:00 AM to 11:59 AM | 0 (0.0%) | 0 (0.0%) |
| 12:00 PM to 3:59 PM | 17 (29.3%) | 3 (5.0%) |
| 4:00 PM to 11:59 PM | 4 (6.9%) | 5 (8.3%) |
| Total | 58 (100.0%) | 60 (100.0%) |
Housing Occupancy in New Alexandria borough
Occupancy by Ownership in New Alexandria borough
Of the total 216 dwellings in New Alexandria borough, owner-occupied units account for 185 (85.7%), while renter-occupied units make up 31 (14.3%).
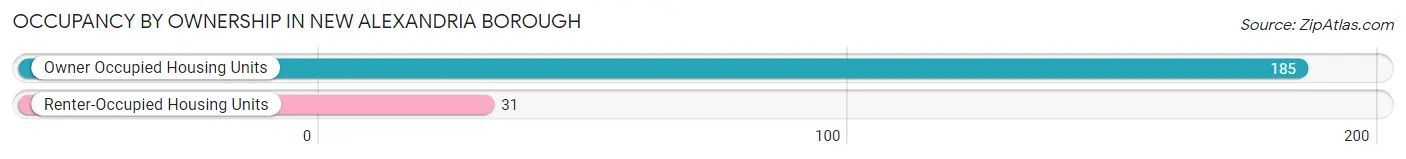
| Occupancy | # Housing Units | % Housing Units |
| Owner Occupied Housing Units | 185 | 85.7% |
| Renter-Occupied Housing Units | 31 | 14.3% |
| Total Occupied Housing Units | 216 | 100.0% |
Occupancy by Household Size in New Alexandria borough
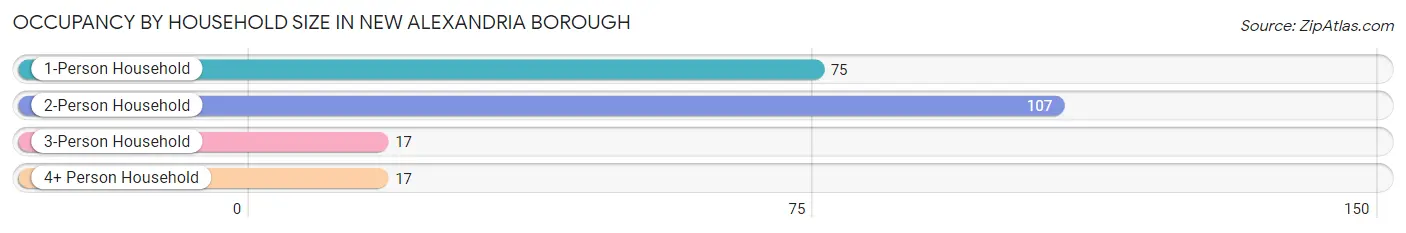
| Household Size | # Housing Units | % Housing Units |
| 1-Person Household | 75 | 34.7% |
| 2-Person Household | 107 | 49.5% |
| 3-Person Household | 17 | 7.9% |
| 4+ Person Household | 17 | 7.9% |
| Total Housing Units | 216 | 100.0% |
Occupancy by Ownership by Household Size in New Alexandria borough
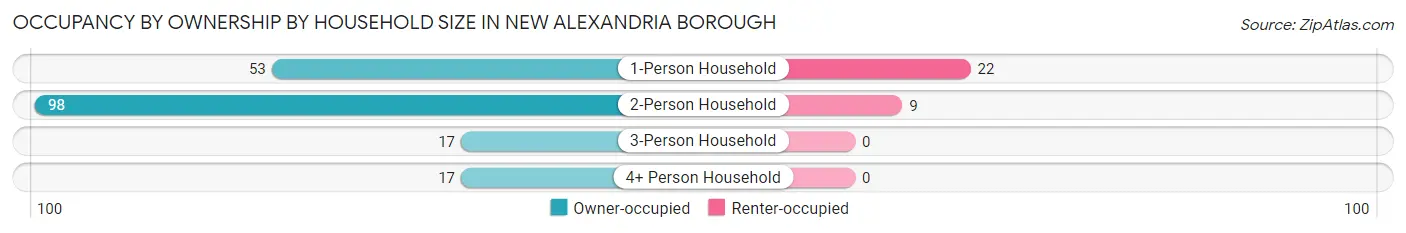
| Household Size | Owner-occupied | Renter-occupied |
| 1-Person Household | 53 (70.7%) | 22 (29.3%) |
| 2-Person Household | 98 (91.6%) | 9 (8.4%) |
| 3-Person Household | 17 (100.0%) | 0 (0.0%) |
| 4+ Person Household | 17 (100.0%) | 0 (0.0%) |
| Total Housing Units | 185 (85.7%) | 31 (14.3%) |
Occupancy by Educational Attainment in New Alexandria borough
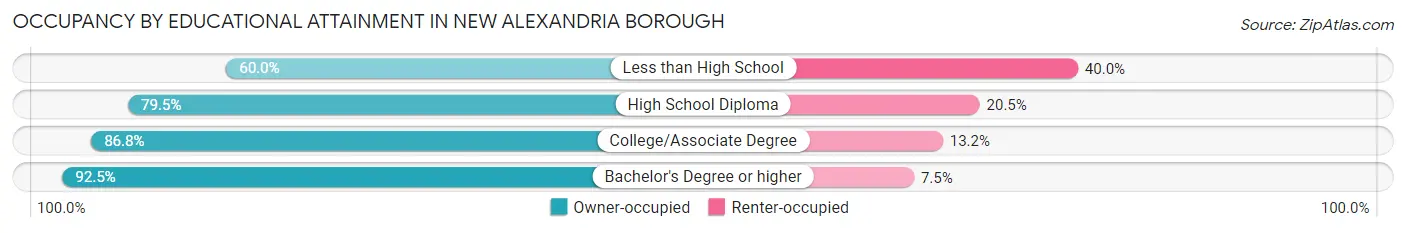
| Household Size | Owner-occupied | Renter-occupied |
| Less than High School | 3 (60.0%) | 2 (40.0%) |
| High School Diploma | 62 (79.5%) | 16 (20.5%) |
| College/Associate Degree | 46 (86.8%) | 7 (13.2%) |
| Bachelor's Degree or higher | 74 (92.5%) | 6 (7.5%) |
Occupancy by Age of Householder in New Alexandria borough
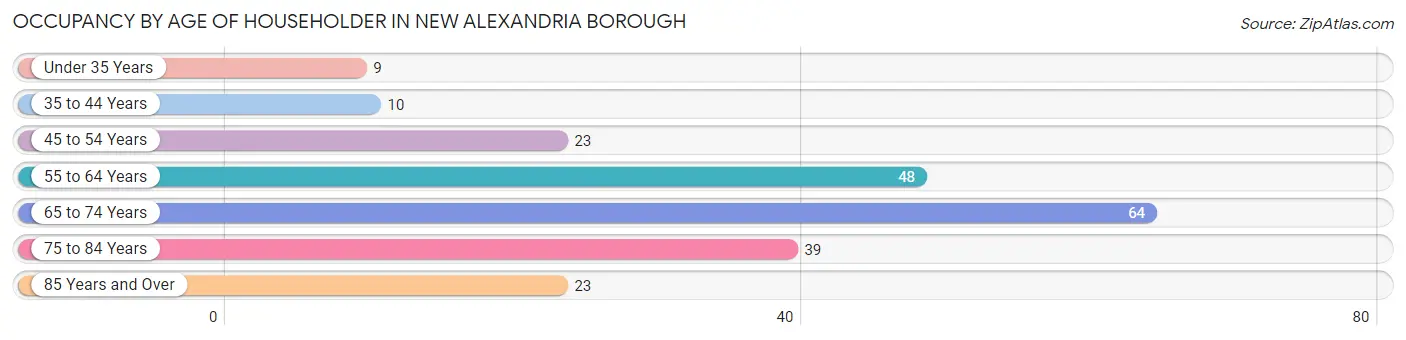
| Age Bracket | # Households | % Households |
| Under 35 Years | 9 | 4.2% |
| 35 to 44 Years | 10 | 4.6% |
| 45 to 54 Years | 23 | 10.6% |
| 55 to 64 Years | 48 | 22.2% |
| 65 to 74 Years | 64 | 29.6% |
| 75 to 84 Years | 39 | 18.1% |
| 85 Years and Over | 23 | 10.6% |
| Total | 216 | 100.0% |
Housing Finances in New Alexandria borough
Median Income by Occupancy in New Alexandria borough
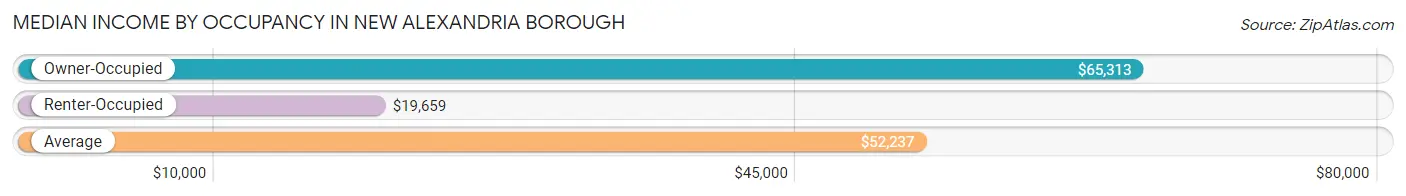
| Occupancy Type | # Households | Median Income |
| Owner-Occupied | 185 (85.7%) | $65,313 |
| Renter-Occupied | 31 (14.3%) | $19,659 |
| Average | 216 (100.0%) | $52,237 |
Occupancy by Householder Income Bracket in New Alexandria borough
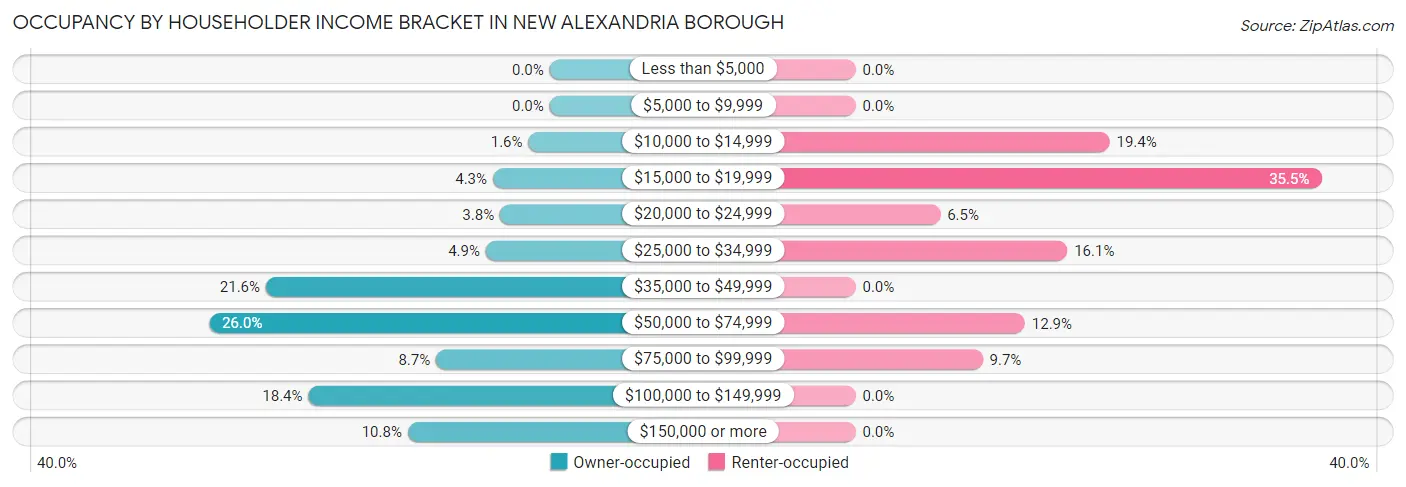
| Income Bracket | Owner-occupied | Renter-occupied |
| Less than $5,000 | 0 (0.0%) | 0 (0.0%) |
| $5,000 to $9,999 | 0 (0.0%) | 0 (0.0%) |
| $10,000 to $14,999 | 3 (1.6%) | 6 (19.4%) |
| $15,000 to $19,999 | 8 (4.3%) | 11 (35.5%) |
| $20,000 to $24,999 | 7 (3.8%) | 2 (6.5%) |
| $25,000 to $34,999 | 9 (4.9%) | 5 (16.1%) |
| $35,000 to $49,999 | 40 (21.6%) | 0 (0.0%) |
| $50,000 to $74,999 | 48 (26.0%) | 4 (12.9%) |
| $75,000 to $99,999 | 16 (8.6%) | 3 (9.7%) |
| $100,000 to $149,999 | 34 (18.4%) | 0 (0.0%) |
| $150,000 or more | 20 (10.8%) | 0 (0.0%) |
| Total | 185 (100.0%) | 31 (100.0%) |
Monthly Housing Cost Tiers in New Alexandria borough
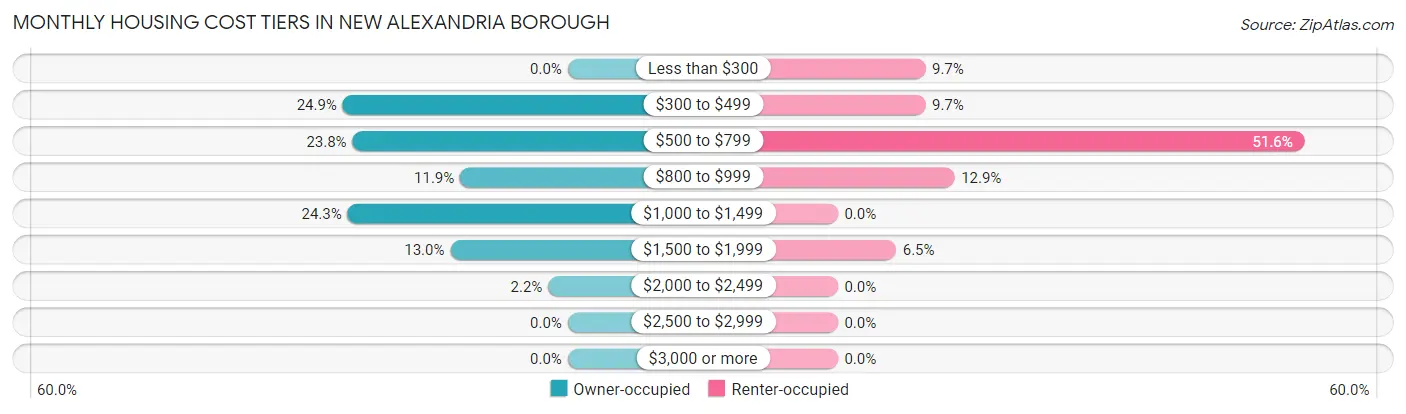
| Monthly Cost | Owner-occupied | Renter-occupied |
| Less than $300 | 0 (0.0%) | 3 (9.7%) |
| $300 to $499 | 46 (24.9%) | 3 (9.7%) |
| $500 to $799 | 44 (23.8%) | 16 (51.6%) |
| $800 to $999 | 22 (11.9%) | 4 (12.9%) |
| $1,000 to $1,499 | 45 (24.3%) | 0 (0.0%) |
| $1,500 to $1,999 | 24 (13.0%) | 2 (6.5%) |
| $2,000 to $2,499 | 4 (2.2%) | 0 (0.0%) |
| $2,500 to $2,999 | 0 (0.0%) | 0 (0.0%) |
| $3,000 or more | 0 (0.0%) | 0 (0.0%) |
| Total | 185 (100.0%) | 31 (100.0%) |
Physical Housing Characteristics in New Alexandria borough
Housing Structures in New Alexandria borough
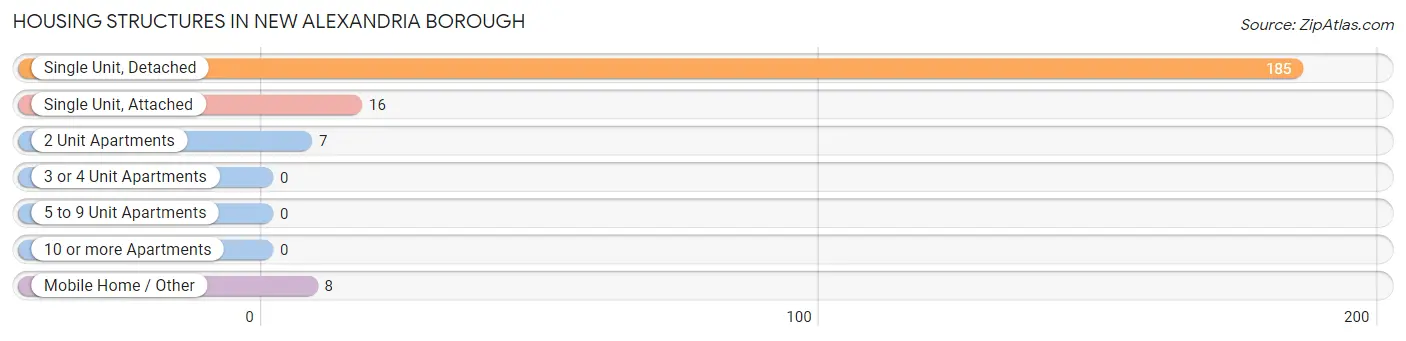
| Structure Type | # Housing Units | % Housing Units |
| Single Unit, Detached | 185 | 85.7% |
| Single Unit, Attached | 16 | 7.4% |
| 2 Unit Apartments | 7 | 3.2% |
| 3 or 4 Unit Apartments | 0 | 0.0% |
| 5 to 9 Unit Apartments | 0 | 0.0% |
| 10 or more Apartments | 0 | 0.0% |
| Mobile Home / Other | 8 | 3.7% |
| Total | 216 | 100.0% |
Housing Structures by Occupancy in New Alexandria borough
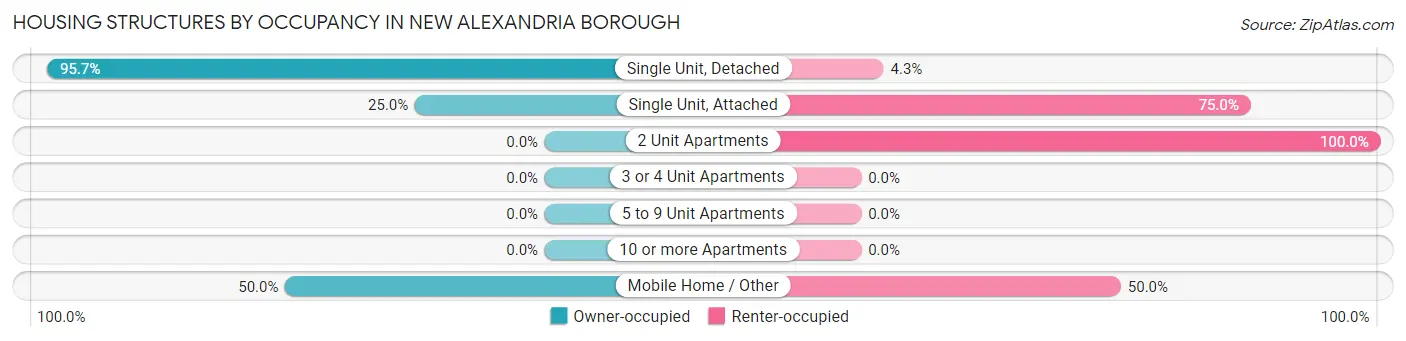
| Structure Type | Owner-occupied | Renter-occupied |
| Single Unit, Detached | 177 (95.7%) | 8 (4.3%) |
| Single Unit, Attached | 4 (25.0%) | 12 (75.0%) |
| 2 Unit Apartments | 0 (0.0%) | 7 (100.0%) |
| 3 or 4 Unit Apartments | 0 (0.0%) | 0 (0.0%) |
| 5 to 9 Unit Apartments | 0 (0.0%) | 0 (0.0%) |
| 10 or more Apartments | 0 (0.0%) | 0 (0.0%) |
| Mobile Home / Other | 4 (50.0%) | 4 (50.0%) |
| Total | 185 (85.7%) | 31 (14.3%) |
Housing Structures by Number of Rooms in New Alexandria borough
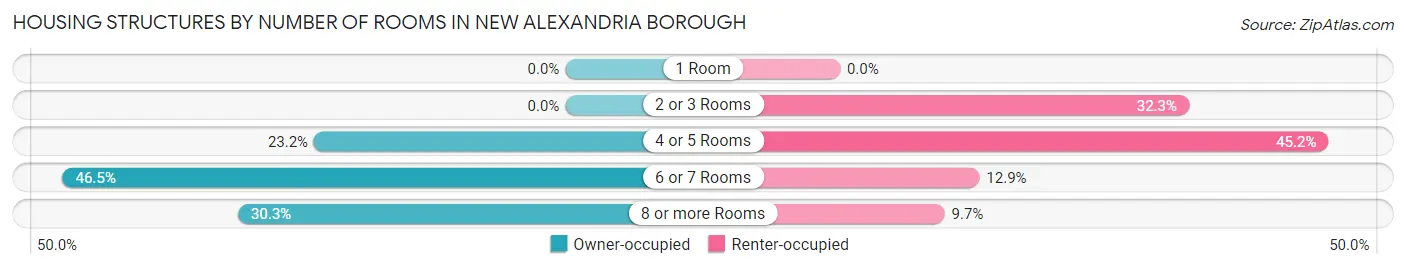
| Number of Rooms | Owner-occupied | Renter-occupied |
| 1 Room | 0 (0.0%) | 0 (0.0%) |
| 2 or 3 Rooms | 0 (0.0%) | 10 (32.3%) |
| 4 or 5 Rooms | 43 (23.2%) | 14 (45.2%) |
| 6 or 7 Rooms | 86 (46.5%) | 4 (12.9%) |
| 8 or more Rooms | 56 (30.3%) | 3 (9.7%) |
| Total | 185 (100.0%) | 31 (100.0%) |
Housing Structure by Heating Type in New Alexandria borough
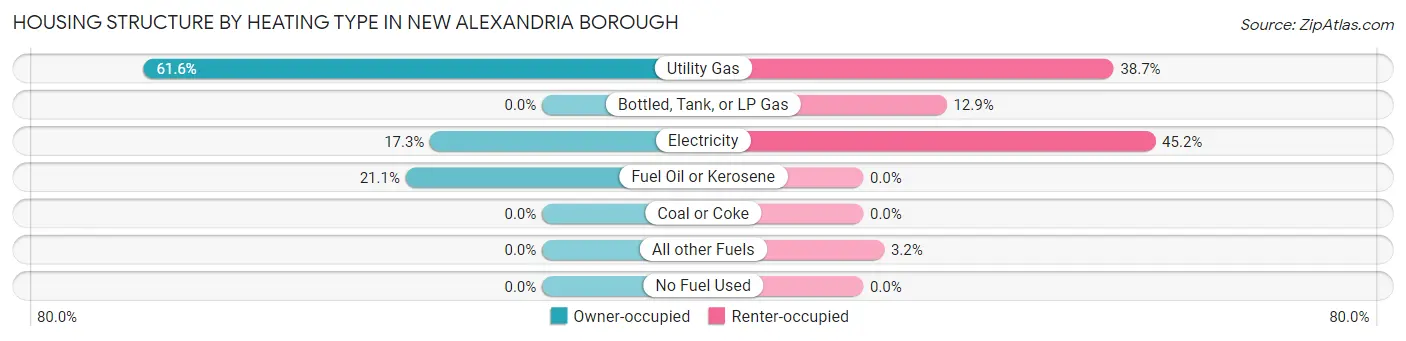
| Heating Type | Owner-occupied | Renter-occupied |
| Utility Gas | 114 (61.6%) | 12 (38.7%) |
| Bottled, Tank, or LP Gas | 0 (0.0%) | 4 (12.9%) |
| Electricity | 32 (17.3%) | 14 (45.2%) |
| Fuel Oil or Kerosene | 39 (21.1%) | 0 (0.0%) |
| Coal or Coke | 0 (0.0%) | 0 (0.0%) |
| All other Fuels | 0 (0.0%) | 1 (3.2%) |
| No Fuel Used | 0 (0.0%) | 0 (0.0%) |
| Total | 185 (100.0%) | 31 (100.0%) |
Household Vehicle Usage in New Alexandria borough
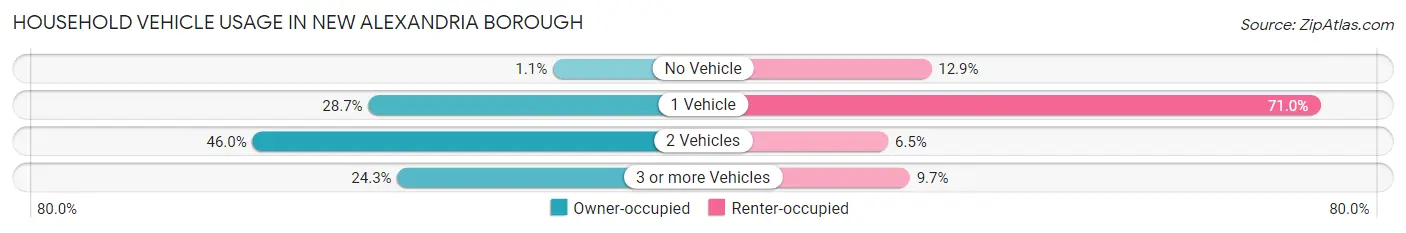
| Vehicles per Household | Owner-occupied | Renter-occupied |
| No Vehicle | 2 (1.1%) | 4 (12.9%) |
| 1 Vehicle | 53 (28.6%) | 22 (71.0%) |
| 2 Vehicles | 85 (46.0%) | 2 (6.5%) |
| 3 or more Vehicles | 45 (24.3%) | 3 (9.7%) |
| Total | 185 (100.0%) | 31 (100.0%) |
Real Estate & Mortgages in New Alexandria borough
Real Estate and Mortgage Overview in New Alexandria borough
| Characteristic | Without Mortgage | With Mortgage |
| Housing Units | 94 | 91 |
| Median Property Value | $150,000 | $182,800 |
| Median Household Income | $49,688 | $16 |
| Monthly Housing Costs | $507 | $0 |
| Real Estate Taxes | $1,639 | $0 |
Property Value by Mortgage Status in New Alexandria borough
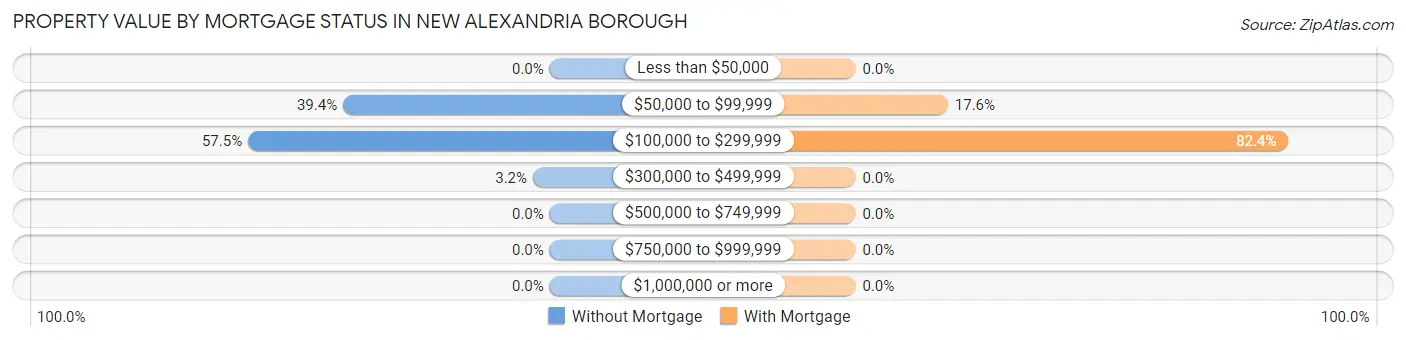
| Property Value | Without Mortgage | With Mortgage |
| Less than $50,000 | 0 (0.0%) | 0 (0.0%) |
| $50,000 to $99,999 | 37 (39.4%) | 16 (17.6%) |
| $100,000 to $299,999 | 54 (57.5%) | 75 (82.4%) |
| $300,000 to $499,999 | 3 (3.2%) | 0 (0.0%) |
| $500,000 to $749,999 | 0 (0.0%) | 0 (0.0%) |
| $750,000 to $999,999 | 0 (0.0%) | 0 (0.0%) |
| $1,000,000 or more | 0 (0.0%) | 0 (0.0%) |
| Total | 94 (100.0%) | 91 (100.0%) |
Household Income by Mortgage Status in New Alexandria borough
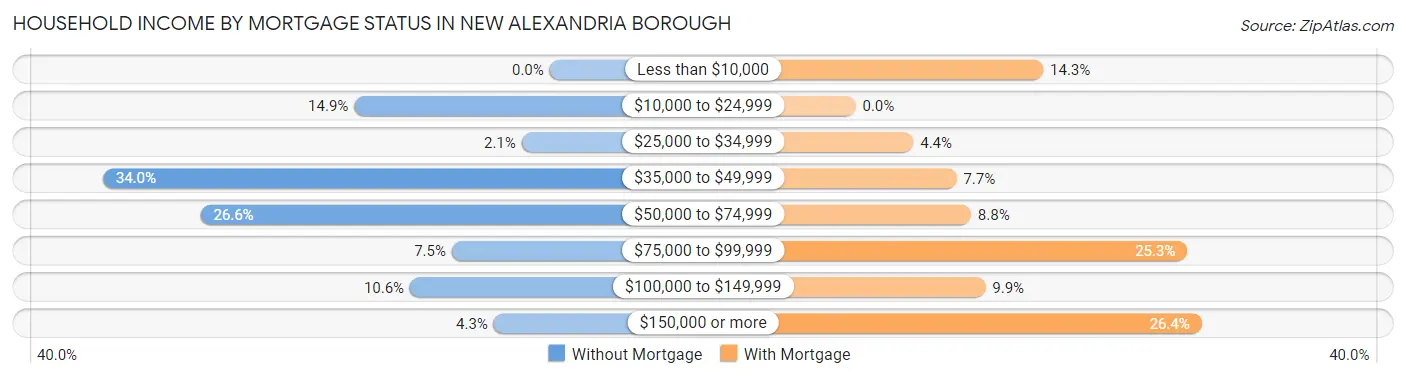
| Household Income | Without Mortgage | With Mortgage |
| Less than $10,000 | 0 (0.0%) | 13 (14.3%) |
| $10,000 to $24,999 | 14 (14.9%) | 0 (0.0%) |
| $25,000 to $34,999 | 2 (2.1%) | 4 (4.4%) |
| $35,000 to $49,999 | 32 (34.0%) | 7 (7.7%) |
| $50,000 to $74,999 | 25 (26.6%) | 8 (8.8%) |
| $75,000 to $99,999 | 7 (7.4%) | 23 (25.3%) |
| $100,000 to $149,999 | 10 (10.6%) | 9 (9.9%) |
| $150,000 or more | 4 (4.3%) | 24 (26.4%) |
| Total | 94 (100.0%) | 91 (100.0%) |
Property Value to Household Income Ratio in New Alexandria borough
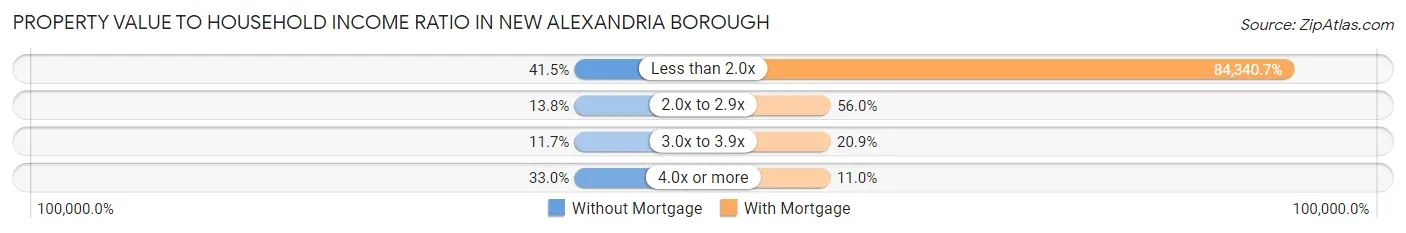
| Value-to-Income Ratio | Without Mortgage | With Mortgage |
| Less than 2.0x | 39 (41.5%) | 76,750 (84,340.7%) |
| 2.0x to 2.9x | 13 (13.8%) | 51 (56.0%) |
| 3.0x to 3.9x | 11 (11.7%) | 19 (20.9%) |
| 4.0x or more | 31 (33.0%) | 10 (11.0%) |
| Total | 94 (100.0%) | 91 (100.0%) |
Real Estate Taxes by Mortgage Status in New Alexandria borough
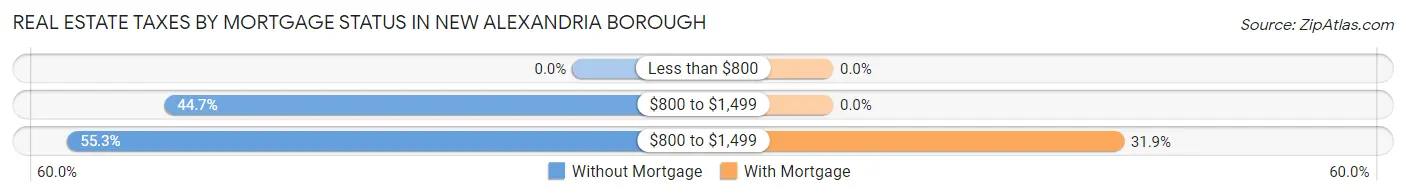
| Property Taxes | Without Mortgage | With Mortgage |
| Less than $800 | 0 (0.0%) | 0 (0.0%) |
| $800 to $1,499 | 42 (44.7%) | 0 (0.0%) |
| $800 to $1,499 | 52 (55.3%) | 29 (31.9%) |
| Total | 94 (100.0%) | 91 (100.0%) |
Health & Disability in New Alexandria borough
Health Insurance Coverage by Age in New Alexandria borough
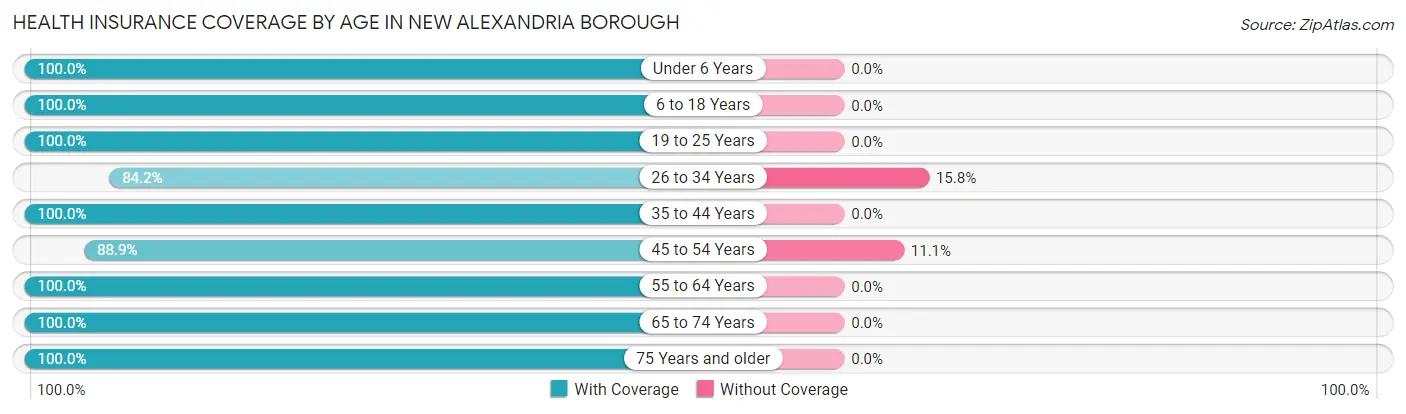
| Age Bracket | With Coverage | Without Coverage |
| Under 6 Years | 6 (100.0%) | 0 (0.0%) |
| 6 to 18 Years | 32 (100.0%) | 0 (0.0%) |
| 19 to 25 Years | 10 (100.0%) | 0 (0.0%) |
| 26 to 34 Years | 16 (84.2%) | 3 (15.8%) |
| 35 to 44 Years | 22 (100.0%) | 0 (0.0%) |
| 45 to 54 Years | 32 (88.9%) | 4 (11.1%) |
| 55 to 64 Years | 83 (100.0%) | 0 (0.0%) |
| 65 to 74 Years | 108 (100.0%) | 0 (0.0%) |
| 75 Years and older | 89 (100.0%) | 0 (0.0%) |
| Total | 398 (98.3%) | 7 (1.7%) |
Health Insurance Coverage by Citizenship Status in New Alexandria borough
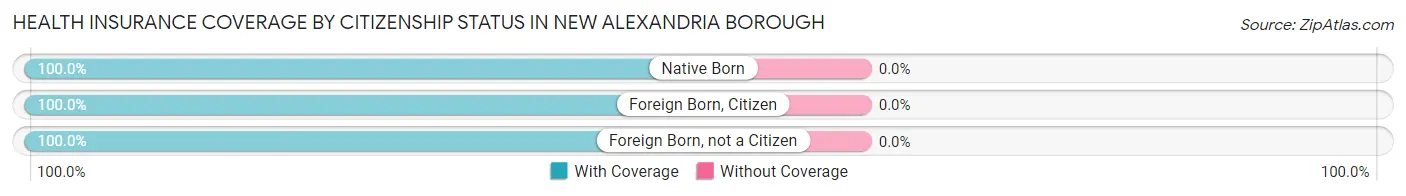
| Citizenship Status | With Coverage | Without Coverage |
| Native Born | 6 (100.0%) | 0 (0.0%) |
| Foreign Born, Citizen | 32 (100.0%) | 0 (0.0%) |
| Foreign Born, not a Citizen | 10 (100.0%) | 0 (0.0%) |
Health Insurance Coverage by Household Income in New Alexandria borough
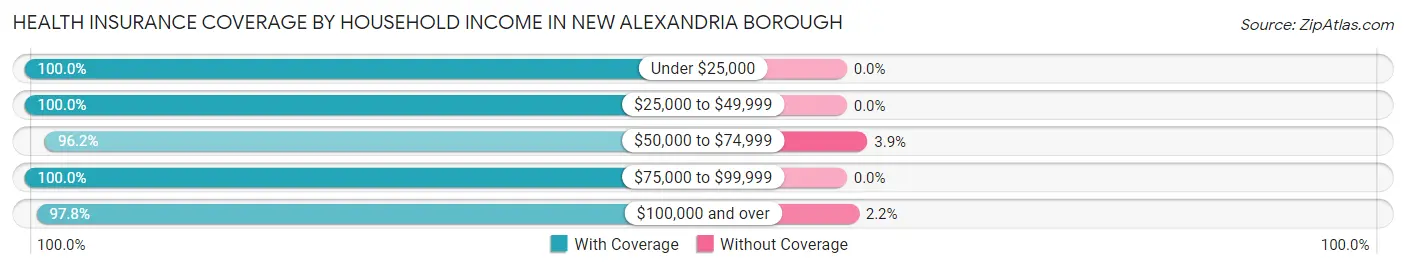
| Household Income | With Coverage | Without Coverage |
| Under $25,000 | 50 (100.0%) | 0 (0.0%) |
| $25,000 to $49,999 | 85 (100.0%) | 0 (0.0%) |
| $50,000 to $74,999 | 100 (96.2%) | 4 (3.8%) |
| $75,000 to $99,999 | 32 (100.0%) | 0 (0.0%) |
| $100,000 and over | 131 (97.8%) | 3 (2.2%) |
Public vs Private Health Insurance Coverage by Age in New Alexandria borough
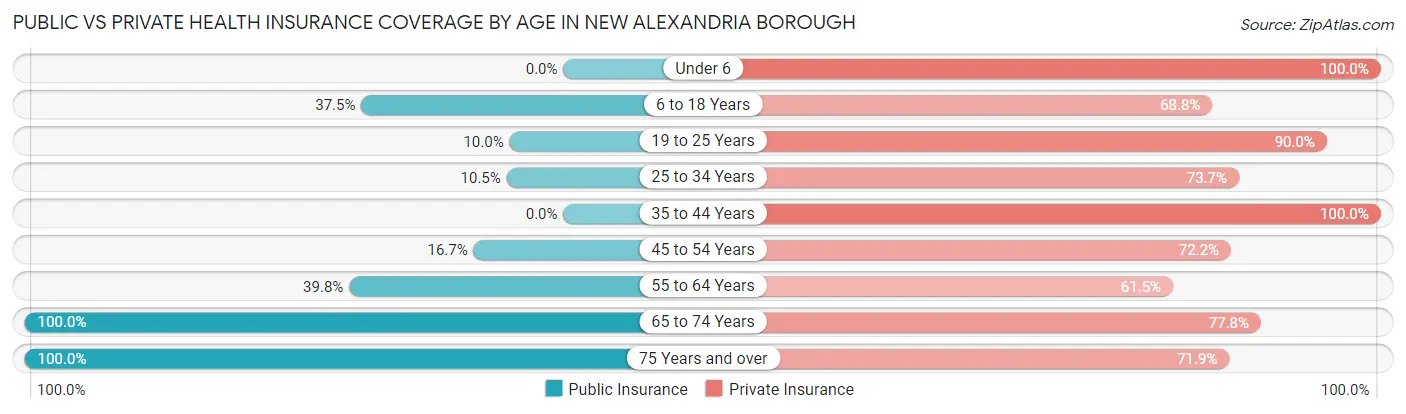
| Age Bracket | Public Insurance | Private Insurance |
| Under 6 | 0 (0.0%) | 6 (100.0%) |
| 6 to 18 Years | 12 (37.5%) | 22 (68.8%) |
| 19 to 25 Years | 1 (10.0%) | 9 (90.0%) |
| 25 to 34 Years | 2 (10.5%) | 14 (73.7%) |
| 35 to 44 Years | 0 (0.0%) | 22 (100.0%) |
| 45 to 54 Years | 6 (16.7%) | 26 (72.2%) |
| 55 to 64 Years | 33 (39.8%) | 51 (61.5%) |
| 65 to 74 Years | 108 (100.0%) | 84 (77.8%) |
| 75 Years and over | 89 (100.0%) | 64 (71.9%) |
| Total | 251 (62.0%) | 298 (73.6%) |
Disability Status by Sex by Age in New Alexandria borough
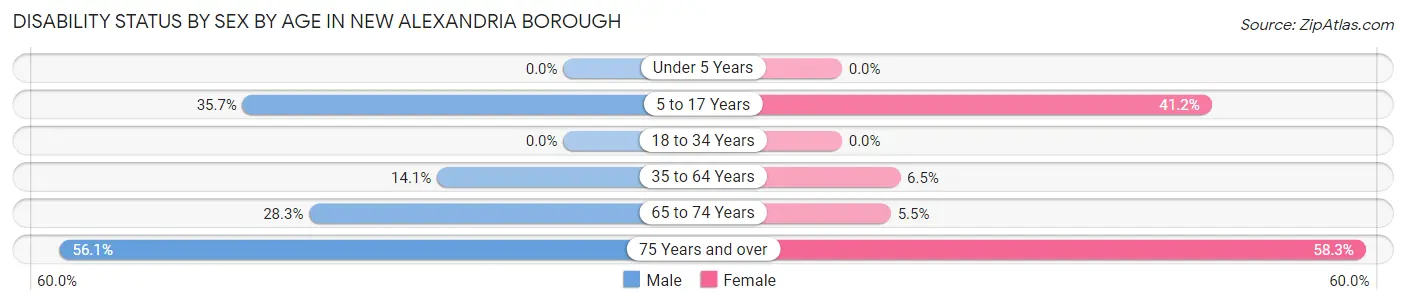
| Age Bracket | Male | Female |
| Under 5 Years | 0 (0.0%) | 0 (0.0%) |
| 5 to 17 Years | 5 (35.7%) | 7 (41.2%) |
| 18 to 34 Years | 0 (0.0%) | 0 (0.0%) |
| 35 to 64 Years | 9 (14.1%) | 5 (6.5%) |
| 65 to 74 Years | 15 (28.3%) | 3 (5.4%) |
| 75 Years and over | 23 (56.1%) | 28 (58.3%) |
Disability Class by Sex by Age in New Alexandria borough
Disability Class: Hearing Difficulty
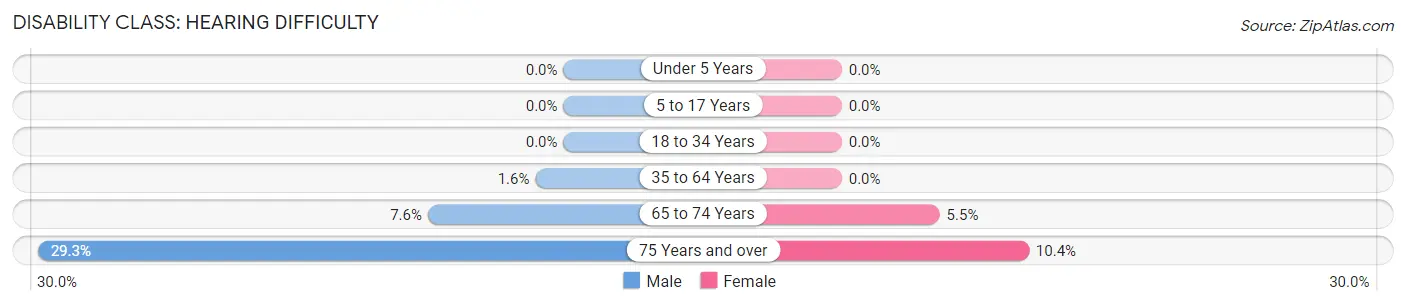
| Age Bracket | Male | Female |
| Under 5 Years | 0 (0.0%) | 0 (0.0%) |
| 5 to 17 Years | 0 (0.0%) | 0 (0.0%) |
| 18 to 34 Years | 0 (0.0%) | 0 (0.0%) |
| 35 to 64 Years | 1 (1.6%) | 0 (0.0%) |
| 65 to 74 Years | 4 (7.5%) | 3 (5.4%) |
| 75 Years and over | 12 (29.3%) | 5 (10.4%) |
Disability Class: Vision Difficulty
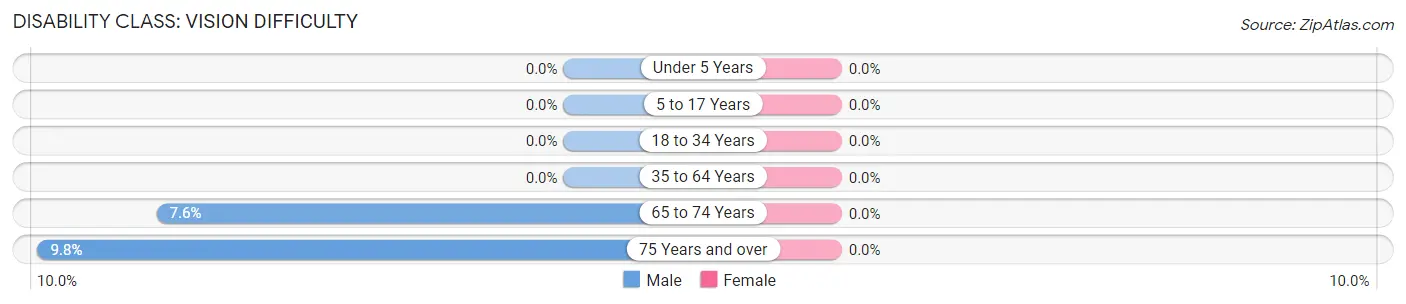
| Age Bracket | Male | Female |
| Under 5 Years | 0 (0.0%) | 0 (0.0%) |
| 5 to 17 Years | 0 (0.0%) | 0 (0.0%) |
| 18 to 34 Years | 0 (0.0%) | 0 (0.0%) |
| 35 to 64 Years | 0 (0.0%) | 0 (0.0%) |
| 65 to 74 Years | 4 (7.5%) | 0 (0.0%) |
| 75 Years and over | 4 (9.8%) | 0 (0.0%) |
Disability Class: Cognitive Difficulty
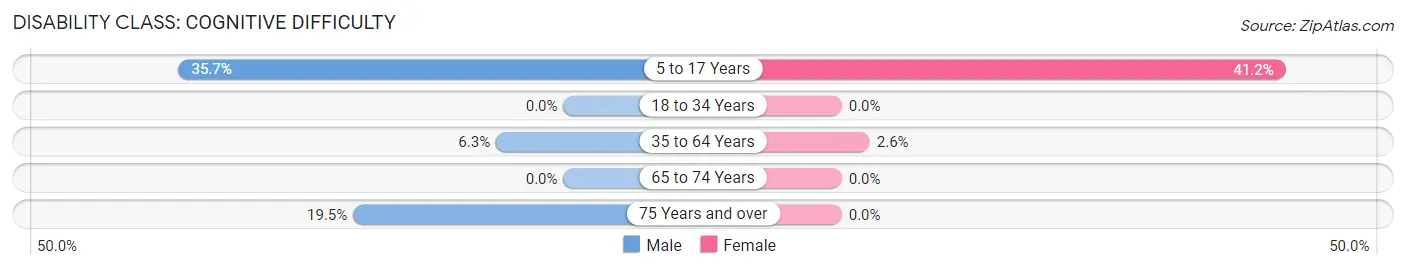
| Age Bracket | Male | Female |
| 5 to 17 Years | 5 (35.7%) | 7 (41.2%) |
| 18 to 34 Years | 0 (0.0%) | 0 (0.0%) |
| 35 to 64 Years | 4 (6.2%) | 2 (2.6%) |
| 65 to 74 Years | 0 (0.0%) | 0 (0.0%) |
| 75 Years and over | 8 (19.5%) | 0 (0.0%) |
Disability Class: Ambulatory Difficulty
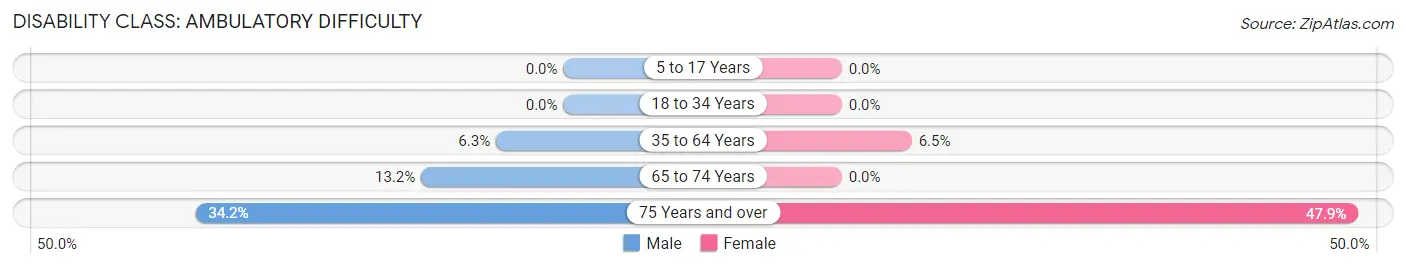
| Age Bracket | Male | Female |
| 5 to 17 Years | 0 (0.0%) | 0 (0.0%) |
| 18 to 34 Years | 0 (0.0%) | 0 (0.0%) |
| 35 to 64 Years | 4 (6.2%) | 5 (6.5%) |
| 65 to 74 Years | 7 (13.2%) | 0 (0.0%) |
| 75 Years and over | 14 (34.2%) | 23 (47.9%) |
Disability Class: Self-Care Difficulty
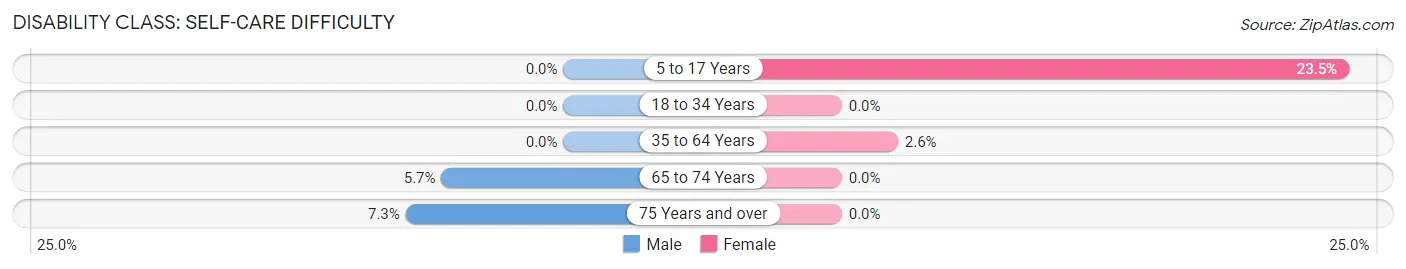
| Age Bracket | Male | Female |
| 5 to 17 Years | 0 (0.0%) | 4 (23.5%) |
| 18 to 34 Years | 0 (0.0%) | 0 (0.0%) |
| 35 to 64 Years | 0 (0.0%) | 2 (2.6%) |
| 65 to 74 Years | 3 (5.7%) | 0 (0.0%) |
| 75 Years and over | 3 (7.3%) | 0 (0.0%) |
Technology Access in New Alexandria borough
Computing Device Access in New Alexandria borough
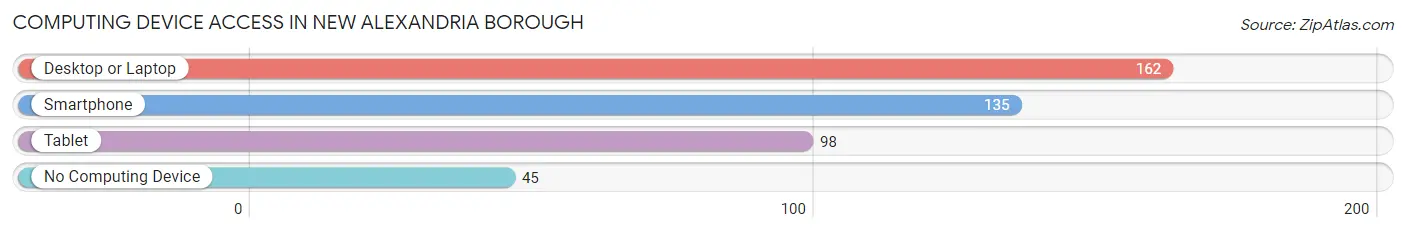
| Device Type | # Households | % Households |
| Desktop or Laptop | 162 | 75.0% |
| Smartphone | 135 | 62.5% |
| Tablet | 98 | 45.4% |
| No Computing Device | 45 | 20.8% |
| Total | 216 | 100.0% |
Internet Access in New Alexandria borough
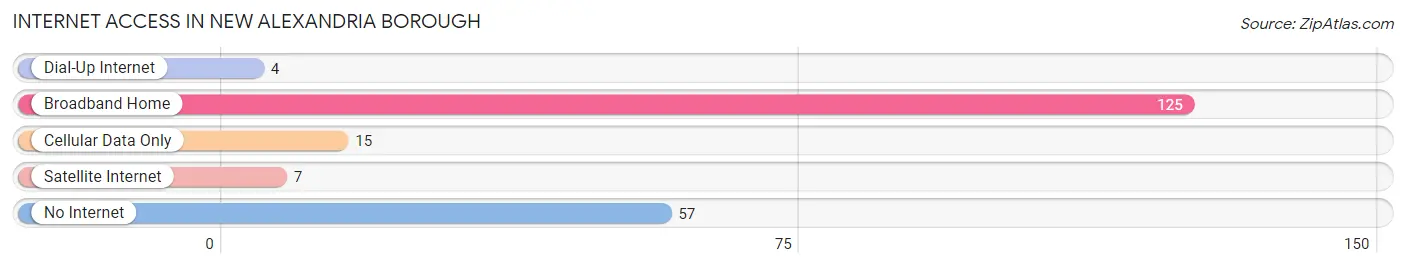
| Internet Type | # Households | % Households |
| Dial-Up Internet | 4 | 1.8% |
| Broadband Home | 125 | 57.9% |
| Cellular Data Only | 15 | 6.9% |
| Satellite Internet | 7 | 3.2% |
| No Internet | 57 | 26.4% |
| Total | 216 | 100.0% |
New Alexandria borough Summary
New Alexandria Borough is a small borough located in Westmoreland County, Pennsylvania. It is situated in the Laurel Highlands region of the state, and is part of the Pittsburgh metropolitan area. The borough has a population of approximately 1,400 people, and is home to a variety of businesses, including a few small manufacturing companies.
History
New Alexandria Borough was founded in 1845 by a group of settlers from Alexandria, Virginia. The settlers named the borough after their hometown, and it has remained a small, rural community ever since. The borough was officially incorporated in 1872, and has remained relatively unchanged since then.
The borough was originally a farming community, and the main crops grown were wheat, corn, and oats. In the late 19th century, the borough began to industrialize, and several small manufacturing companies were established. These companies included a brickyard, a sawmill, and a furniture factory.
Geography
New Alexandria Borough is located in Westmoreland County, Pennsylvania. It is situated in the Laurel Highlands region of the state, and is part of the Pittsburgh metropolitan area. The borough is located in the Allegheny Mountains, and is surrounded by rolling hills and forests. The borough is located approximately 30 miles southeast of Pittsburgh, and is accessible via Interstate 70 and U.S. Route 22.
The borough has a total area of 0.7 square miles, all of which is land. The borough is located at an elevation of 1,400 feet above sea level. The climate in the borough is classified as humid continental, with cold winters and hot, humid summers.
Economy
New Alexandria Borough has a small, but diverse economy. The borough is home to a few small manufacturing companies, including a brickyard, a sawmill, and a furniture factory. The borough also has several small businesses, including restaurants, retail stores, and service providers.
The borough is also home to a few tourist attractions, including a historic train station and a museum. The borough is also home to a few parks and recreational areas, including a golf course and a swimming pool.
Demographics
As of the 2010 census, the population of New Alexandria Borough was 1,400 people. The racial makeup of the borough was 97.6% White, 0.7% African American, 0.1% Native American, 0.3% Asian, and 1.3% from other races. The median household income in the borough was $41,250, and the median family income was $50,000.
The borough has a high rate of homeownership, with approximately 75% of the population owning their own homes. The borough also has a high rate of educational attainment, with approximately 90% of the population having at least a high school diploma.
Conclusion
New Alexandria Borough is a small borough located in Westmoreland County, Pennsylvania. It is situated in the Laurel Highlands region of the state, and is part of the Pittsburgh metropolitan area. The borough has a population of approximately 1,400 people, and is home to a variety of businesses, including a few small manufacturing companies. The borough has a small, but diverse economy, and is home to a few tourist attractions, including a historic train station and a museum. The borough has a high rate of homeownership and educational attainment, and is a great place to live and work.
Common Questions
What is the Total Population of New Alexandria borough?
Total Population of New Alexandria borough is 405.
What is the Total Male Population of New Alexandria borough?
Total Male Population of New Alexandria borough is 190.
What is the Total Female Population of New Alexandria borough?
Total Female Population of New Alexandria borough is 215.
What is the Ratio of Males per 100 Females in New Alexandria borough?
There are 88.37 Males per 100 Females in New Alexandria borough.
What is the Ratio of Females per 100 Males in New Alexandria borough?
There are 113.16 Females per 100 Males in New Alexandria borough.
What is the Median Population Age in New Alexandria borough?
Median Population Age in New Alexandria borough is 63.9 Years.
What is the Average Family Size in New Alexandria borough
Average Family Size in New Alexandria borough is 2.3 People.
What is the Average Household Size in New Alexandria borough
Average Household Size in New Alexandria borough is 1.9 People.
What is Per Capita Income in New Alexandria borough?
Per Capita income in New Alexandria borough is $39,587.
What is the Median Family Income in New Alexandria borough?
Median Family Income in New Alexandria borough is $66,146.
What is the Median Household income in New Alexandria borough?
Median Household Income in New Alexandria borough is $52,237.
What is Income or Wage Gap in New Alexandria borough?
Income or Wage Gap in New Alexandria borough is 11.3%.
Women in New Alexandria borough earn 88.7 cents for every dollar earned by a man.
What is Inequality or Gini Index in New Alexandria borough?
Inequality or Gini Index in New Alexandria borough is 0.39.
How Large is the Labor Force in New Alexandria borough?
There are 138 People in the Labor Forcein in New Alexandria borough.
What is the Percentage of People in the Labor Force in New Alexandria borough?
36.5% of People are in the Labor Force in New Alexandria borough.
What is the Unemployment Rate in New Alexandria borough?
Unemployment Rate in New Alexandria borough is 8.0%.