Clintonville borough, PA
Clintonville borough Overview
498
TOTAL POPULATION
228
MALE POPULATION
270
FEMALE POPULATION
84.44
MALES / 100 FEMALES
118.42
FEMALES / 100 MALES
43.0
MEDIAN AGE
3.1
AVG FAMILY SIZE
2.2
AVG HOUSEHOLD SIZE
$30,826
PER CAPITA INCOME
$73,929
AVG FAMILY INCOME
$46,875
AVG HOUSEHOLD INCOME
15.9%
WAGE / INCOME GAP [ % ]
84.1¢/ $1
WAGE / INCOME GAP [ $ ]
0.41
INEQUALITY / GINI INDEX
233
LABOR FORCE [ PEOPLE ]
56.1%
PERCENT IN LABOR FORCE
11.6%
UNEMPLOYMENT RATE
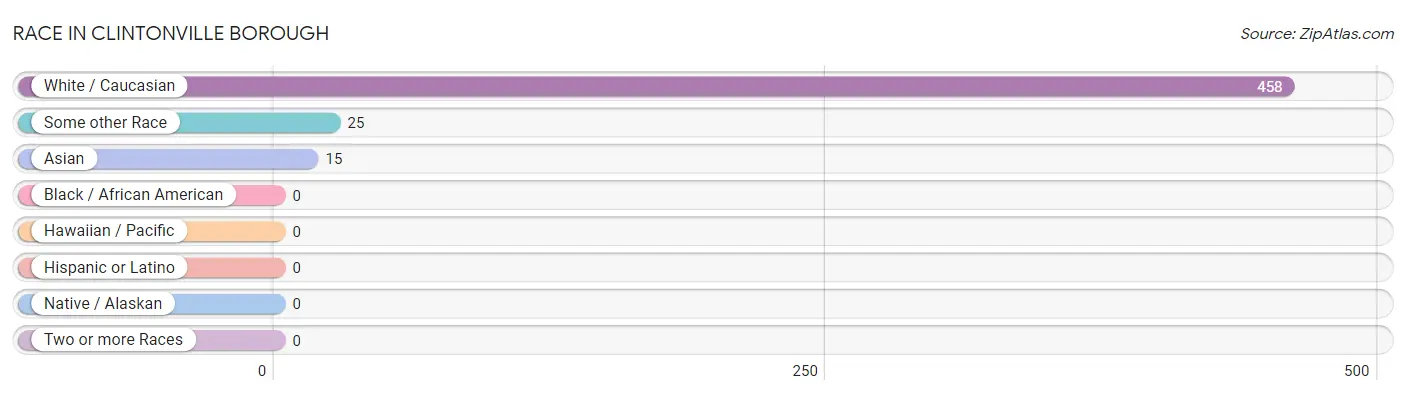
Race in Clintonville borough
The most populous races in Clintonville borough are White / Caucasian (458 | 92.0%), Some other Race (25 | 5.0%), and Asian (15 | 3.0%).
| Race | # Population | % Population |
| Asian | 15 | 3.0% |
| Black / African American | 0 | 0.0% |
| Hawaiian / Pacific | 0 | 0.0% |
| Hispanic or Latino | 0 | 0.0% |
| Native / Alaskan | 0 | 0.0% |
| White / Caucasian | 458 | 92.0% |
| Two or more Races | 0 | 0.0% |
| Some other Race | 25 | 5.0% |
| Total | 498 | 100.0% |
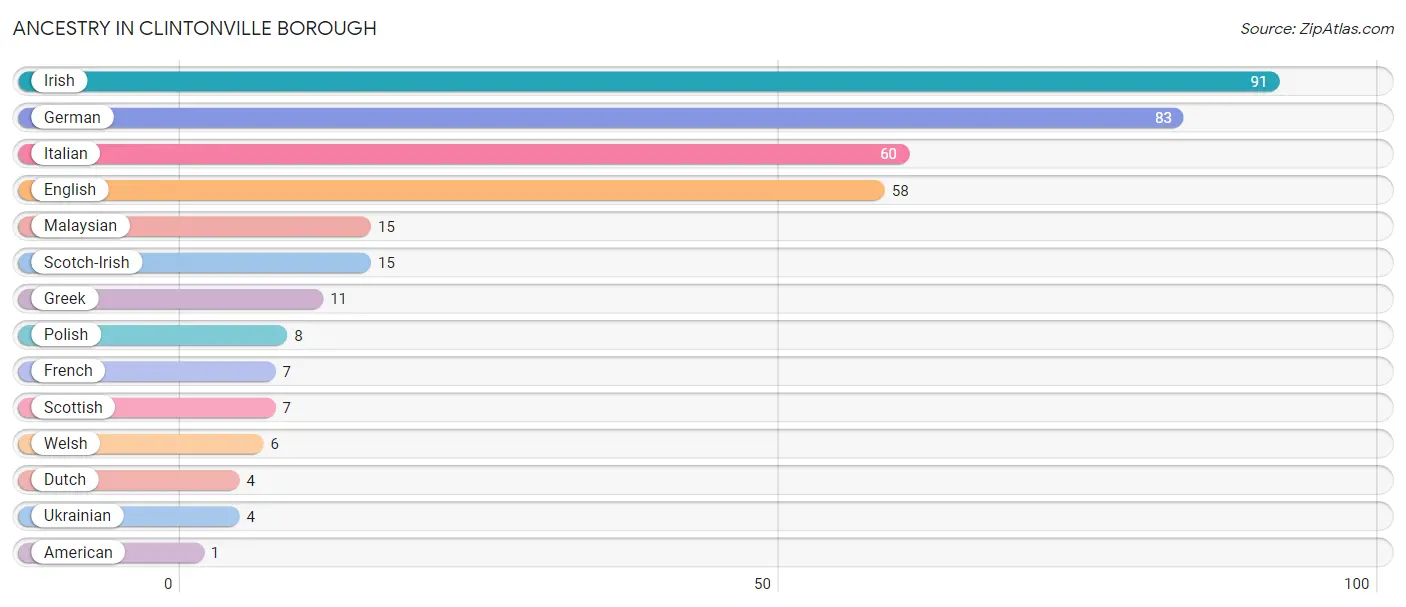
Ancestry in Clintonville borough
The most populous ancestries reported in Clintonville borough are Irish (91 | 18.3%), German (83 | 16.7%), Italian (60 | 12.0%), English (58 | 11.7%), and Malaysian (15 | 3.0%), together accounting for 61.7% of all Clintonville borough residents.
| Ancestry | # Population | % Population |
| American | 1 | 0.2% |
| Dutch | 4 | 0.8% |
| English | 58 | 11.7% |
| French | 7 | 1.4% |
| German | 83 | 16.7% |
| Greek | 11 | 2.2% |
| Irish | 91 | 18.3% |
| Italian | 60 | 12.0% |
| Malaysian | 15 | 3.0% |
| Polish | 8 | 1.6% |
| Scotch-Irish | 15 | 3.0% |
| Scottish | 7 | 1.4% |
| Ukrainian | 4 | 0.8% |
| Welsh | 6 | 1.2% | View All 14 Rows |
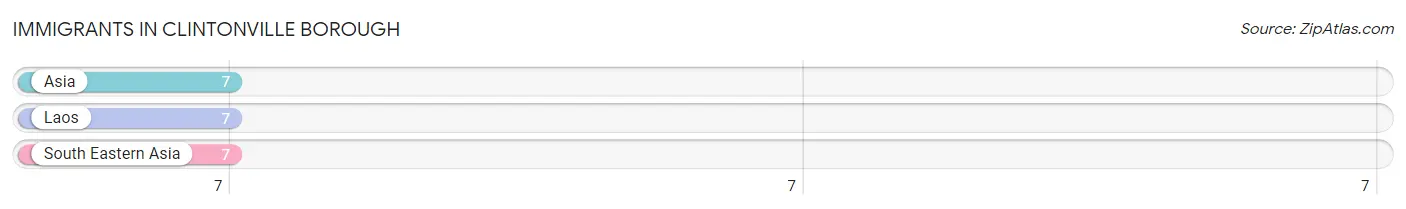
Immigrants in Clintonville borough
The most numerous immigrant groups reported in Clintonville borough came from Asia (7 | 1.4%), Laos (7 | 1.4%), and South Eastern Asia (7 | 1.4%), together accounting for 4.2% of all Clintonville borough residents.
| Immigration Origin | # Population | % Population |
| Asia | 7 | 1.4% |
| Laos | 7 | 1.4% |
| South Eastern Asia | 7 | 1.4% | View All 3 Rows |
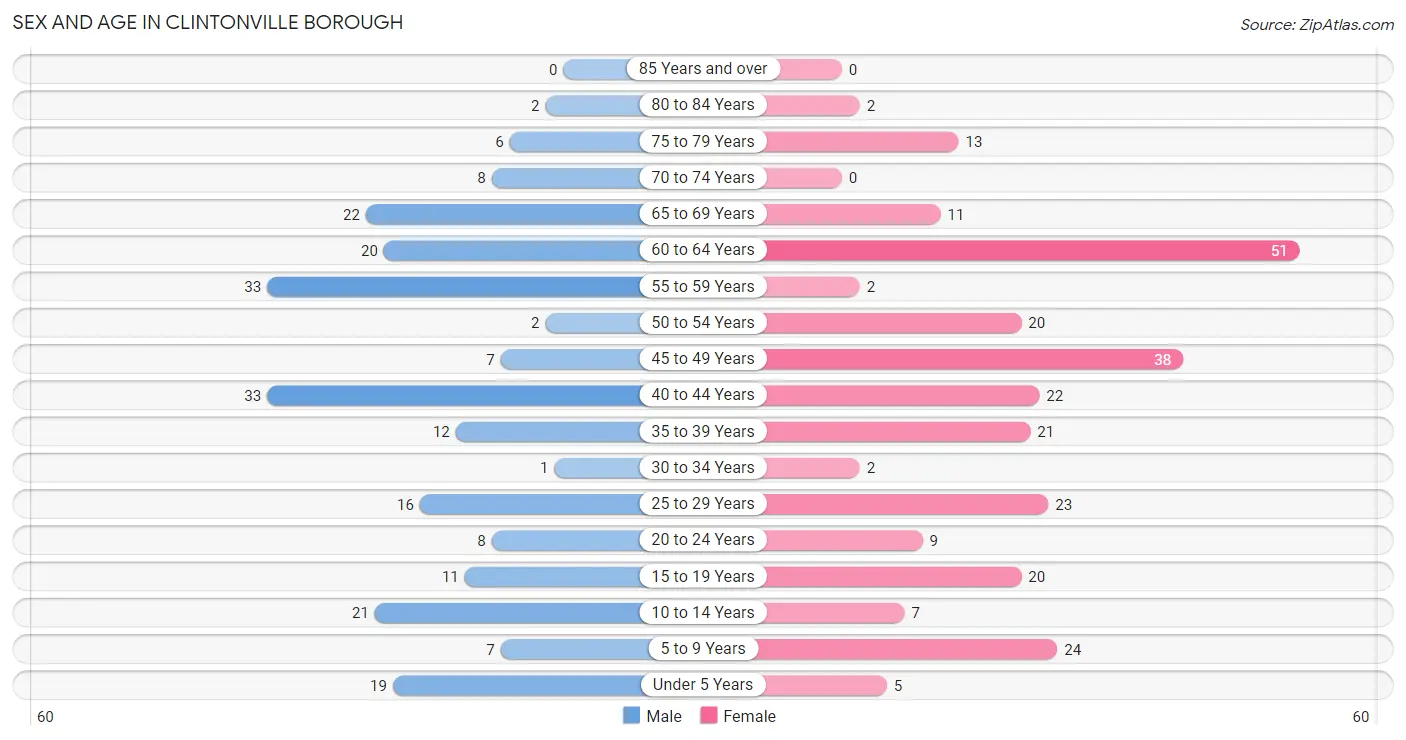
Sex and Age in Clintonville borough
Sex and Age in Clintonville borough
The most populous age groups in Clintonville borough are 40 to 44 Years (33 | 14.5%) for men and 60 to 64 Years (51 | 18.9%) for women.
| Age Bracket | Male | Female |
| Under 5 Years | 19 (8.3%) | 5 (1.8%) |
| 5 to 9 Years | 7 (3.1%) | 24 (8.9%) |
| 10 to 14 Years | 21 (9.2%) | 7 (2.6%) |
| 15 to 19 Years | 11 (4.8%) | 20 (7.4%) |
| 20 to 24 Years | 8 (3.5%) | 9 (3.3%) |
| 25 to 29 Years | 16 (7.0%) | 23 (8.5%) |
| 30 to 34 Years | 1 (0.4%) | 2 (0.7%) |
| 35 to 39 Years | 12 (5.3%) | 21 (7.8%) |
| 40 to 44 Years | 33 (14.5%) | 22 (8.2%) |
| 45 to 49 Years | 7 (3.1%) | 38 (14.1%) |
| 50 to 54 Years | 2 (0.9%) | 20 (7.4%) |
| 55 to 59 Years | 33 (14.5%) | 2 (0.7%) |
| 60 to 64 Years | 20 (8.8%) | 51 (18.9%) |
| 65 to 69 Years | 22 (9.7%) | 11 (4.1%) |
| 70 to 74 Years | 8 (3.5%) | 0 (0.0%) |
| 75 to 79 Years | 6 (2.6%) | 13 (4.8%) |
| 80 to 84 Years | 2 (0.9%) | 2 (0.7%) |
| 85 Years and over | 0 (0.0%) | 0 (0.0%) |
| Total | 228 (100.0%) | 270 (100.0%) |
Families and Households in Clintonville borough
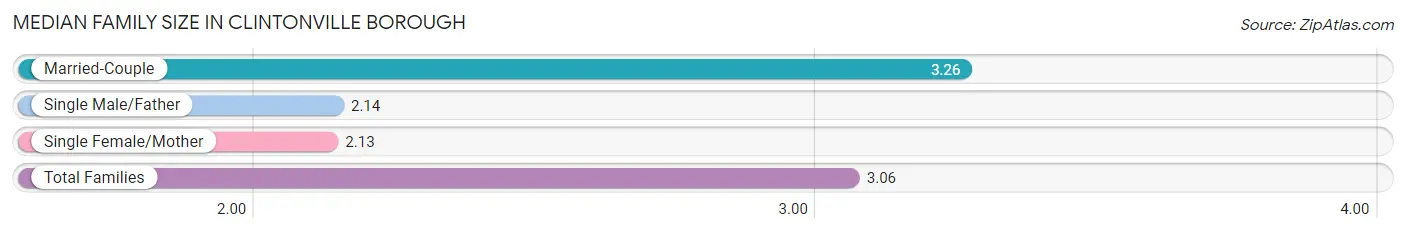
Median Family Size in Clintonville borough
The median family size in Clintonville borough is 3.06 persons per family, with married-couple families (103 | 81.8%) accounting for the largest median family size of 3.26 persons per family. On the other hand, single female/mother families (16 | 12.7%) represent the smallest median family size with 2.13 persons per family.
| Family Type | # Families | Family Size |
| Married-Couple | 103 (81.8%) | 3.26 |
| Single Male/Father | 7 (5.6%) | 2.14 |
| Single Female/Mother | 16 (12.7%) | 2.13 |
| Total Families | 126 (100.0%) | 3.06 |
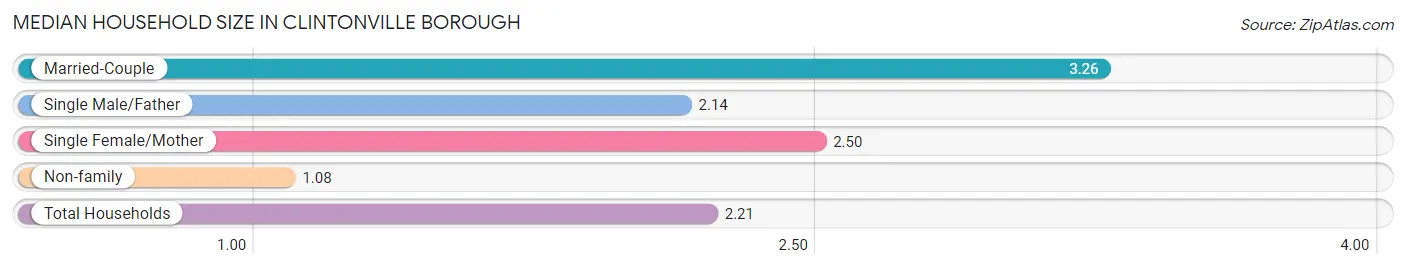
Median Household Size in Clintonville borough
The median household size in Clintonville borough is 2.21 persons per household, with married-couple households (103 | 45.8%) accounting for the largest median household size of 3.26 persons per household. non-family households (99 | 44.0%) represent the smallest median household size with 1.08 persons per household.
| Household Type | # Households | Household Size |
| Married-Couple | 103 (45.8%) | 3.26 |
| Single Male/Father | 7 (3.1%) | 2.14 |
| Single Female/Mother | 16 (7.1%) | 2.50 |
| Non-family | 99 (44.0%) | 1.08 |
| Total Households | 225 (100.0%) | 2.21 |
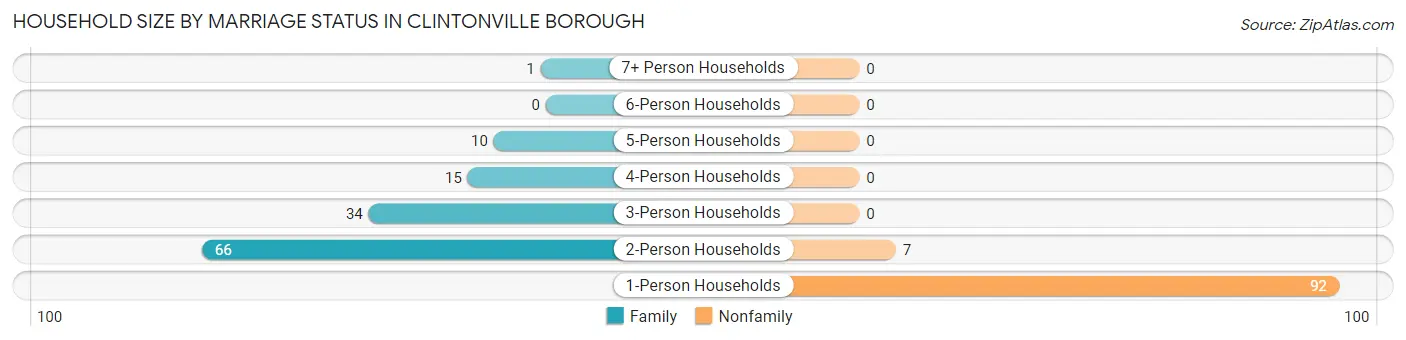
Household Size by Marriage Status in Clintonville borough
Out of a total of 225 households in Clintonville borough, 126 (56.0%) are family households, while 99 (44.0%) are nonfamily households. The most numerous type of family households are 2-person households, comprising 66, and the most common type of nonfamily households are 1-person households, comprising 92.
| Household Size | Family Households | Nonfamily Households |
| 1-Person Households | - | 92 (40.9%) |
| 2-Person Households | 66 (29.3%) | 7 (3.1%) |
| 3-Person Households | 34 (15.1%) | 0 (0.0%) |
| 4-Person Households | 15 (6.7%) | 0 (0.0%) |
| 5-Person Households | 10 (4.4%) | 0 (0.0%) |
| 6-Person Households | 0 (0.0%) | 0 (0.0%) |
| 7+ Person Households | 1 (0.4%) | 0 (0.0%) |
| Total | 126 (56.0%) | 99 (44.0%) |
Female Fertility in Clintonville borough
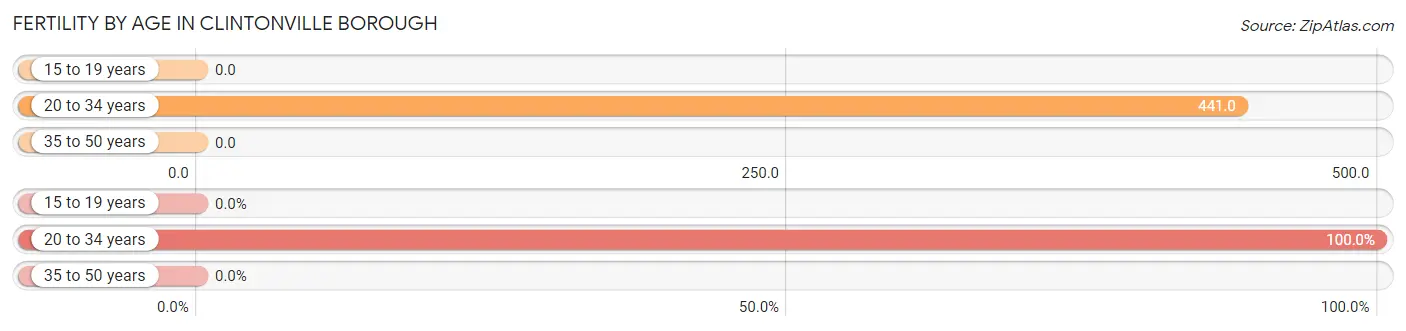
Fertility by Age in Clintonville borough
Average fertility rate in Clintonville borough is 111.0 births per 1,000 women. Women in the age bracket of 20 to 34 years have the highest fertility rate with 441.0 births per 1,000 women. Women in the age bracket of 20 to 34 years acount for 100.0% of all women with births.
| Age Bracket | Women with Births | Births / 1,000 Women |
| 15 to 19 years | 0 (0.0%) | 0.0 |
| 20 to 34 years | 15 (100.0%) | 441.0 |
| 35 to 50 years | 0 (0.0%) | 0.0 |
| Total | 15 (100.0%) | 111.0 |
Fertility by Age by Marriage Status in Clintonville borough
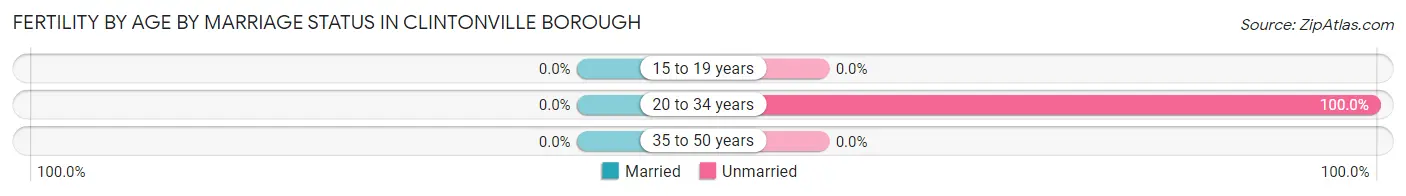
| Age Bracket | Married | Unmarried |
| 15 to 19 years | 0 (0.0%) | 0 (0.0%) |
| 20 to 34 years | 0 (0.0%) | 15 (100.0%) |
| 35 to 50 years | 0 (0.0%) | 0 (0.0%) |
| Total | 0 (0.0%) | 15 (100.0%) |
Fertility by Education in Clintonville borough
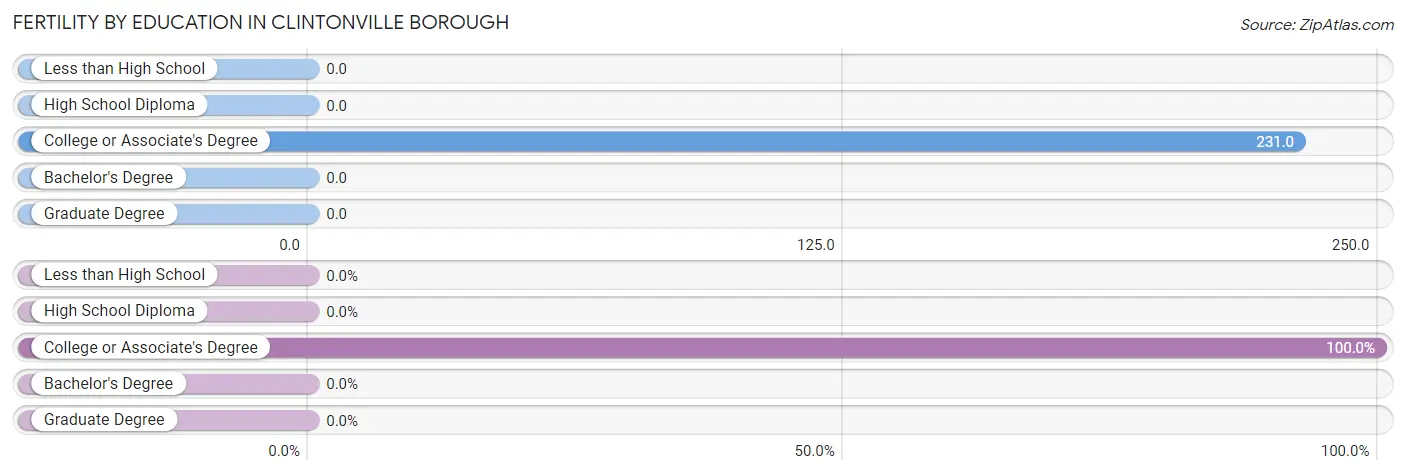
| Educational Attainment | Women with Births | Births / 1,000 Women |
| Less than High School | 0 (0.0%) | 0.0 |
| High School Diploma | 0 (0.0%) | 0.0 |
| College or Associate's Degree | 15 (100.0%) | 231.0 |
| Bachelor's Degree | 0 (0.0%) | 0.0 |
| Graduate Degree | 0 (0.0%) | 0.0 |
| Total | 15 (100.0%) | 111.0 |
Fertility by Education by Marriage Status in Clintonville borough
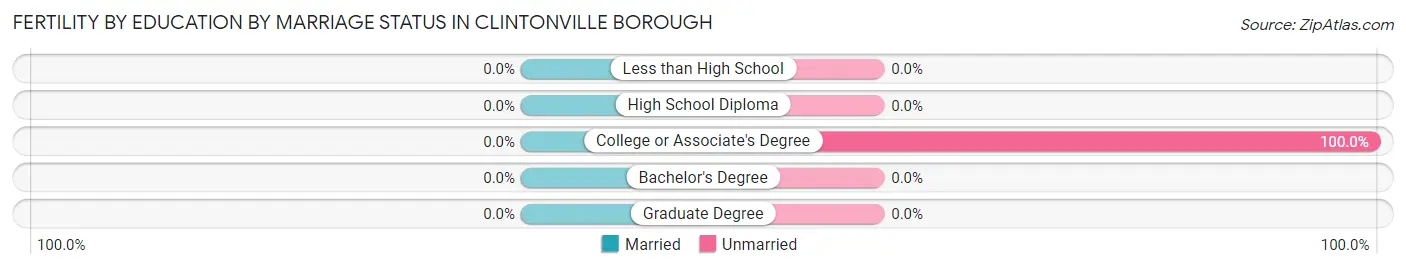
| Educational Attainment | Married | Unmarried |
| Less than High School | 0 (0.0%) | 0 (0.0%) |
| High School Diploma | 0 (0.0%) | 0 (0.0%) |
| College or Associate's Degree | 0 (0.0%) | 15 (100.0%) |
| Bachelor's Degree | 0 (0.0%) | 0 (0.0%) |
| Graduate Degree | 0 (0.0%) | 0 (0.0%) |
| Total | 0 (0.0%) | 15 (100.0%) |
Income in Clintonville borough
Income Overview in Clintonville borough
Per Capita Income in Clintonville borough is $30,826, while median incomes of families and households are $73,929 and $46,875 respectively.
| Characteristic | Number | Measure |
| Per Capita Income | 498 | $30,826 |
| Median Family Income | 126 | $73,929 |
| Mean Family Income | 126 | $81,035 |
| Median Household Income | 225 | $46,875 |
| Mean Household Income | 225 | $62,666 |
| Income Deficit | 126 | $0 |
| Wage / Income Gap (%) | 498 | 15.93% |
| Wage / Income Gap ($) | 498 | 84.07¢ per $1 |
| Gini / Inequality Index | 498 | 0.41 |
Earnings by Sex in Clintonville borough
Average Earnings in Clintonville borough are $37,303, $42,500 for men and $35,729 for women, a difference of 15.9%.
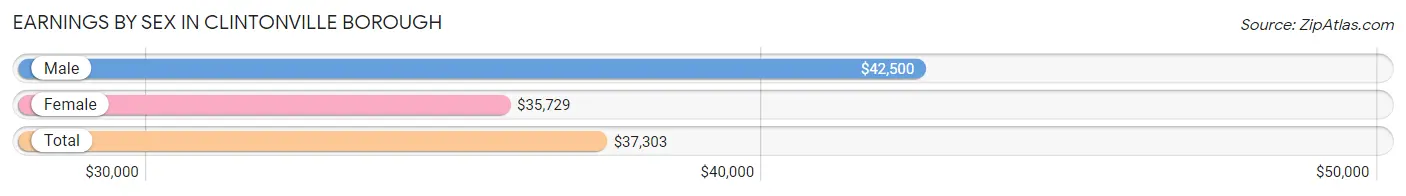
| Sex | Number | Average Earnings |
| Male | 102 (42.3%) | $42,500 |
| Female | 139 (57.7%) | $35,729 |
| Total | 241 (100.0%) | $37,303 |
Earnings by Sex by Income Bracket in Clintonville borough
The most common earnings brackets in Clintonville borough are $75,000 to $99,999 for men (23 | 22.6%) and $25,000 to $29,999 for women (37 | 26.6%).
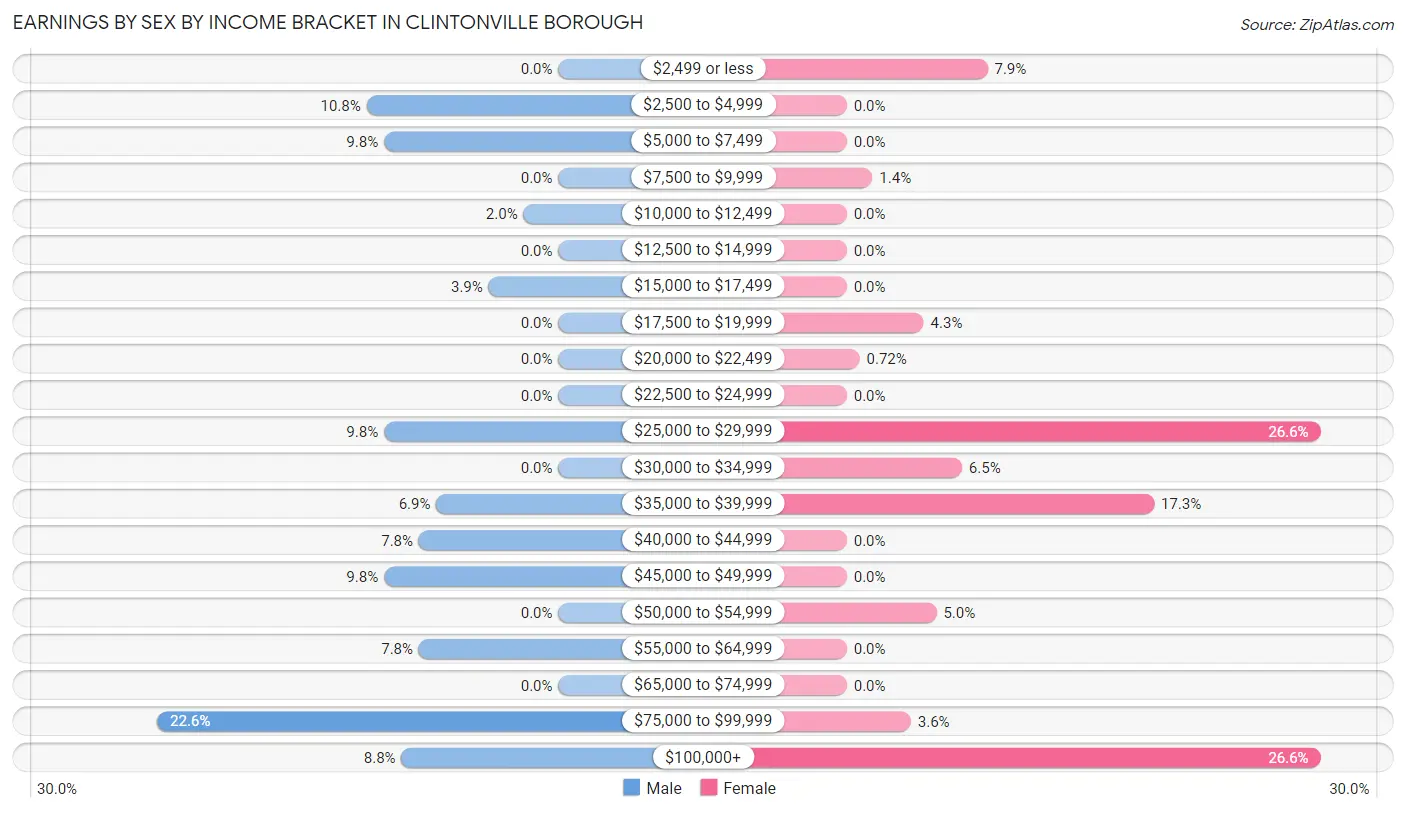
| Income | Male | Female |
| $2,499 or less | 0 (0.0%) | 11 (7.9%) |
| $2,500 to $4,999 | 11 (10.8%) | 0 (0.0%) |
| $5,000 to $7,499 | 10 (9.8%) | 0 (0.0%) |
| $7,500 to $9,999 | 0 (0.0%) | 2 (1.4%) |
| $10,000 to $12,499 | 2 (2.0%) | 0 (0.0%) |
| $12,500 to $14,999 | 0 (0.0%) | 0 (0.0%) |
| $15,000 to $17,499 | 4 (3.9%) | 0 (0.0%) |
| $17,500 to $19,999 | 0 (0.0%) | 6 (4.3%) |
| $20,000 to $22,499 | 0 (0.0%) | 1 (0.7%) |
| $22,500 to $24,999 | 0 (0.0%) | 0 (0.0%) |
| $25,000 to $29,999 | 10 (9.8%) | 37 (26.6%) |
| $30,000 to $34,999 | 0 (0.0%) | 9 (6.5%) |
| $35,000 to $39,999 | 7 (6.9%) | 24 (17.3%) |
| $40,000 to $44,999 | 8 (7.8%) | 0 (0.0%) |
| $45,000 to $49,999 | 10 (9.8%) | 0 (0.0%) |
| $50,000 to $54,999 | 0 (0.0%) | 7 (5.0%) |
| $55,000 to $64,999 | 8 (7.8%) | 0 (0.0%) |
| $65,000 to $74,999 | 0 (0.0%) | 0 (0.0%) |
| $75,000 to $99,999 | 23 (22.6%) | 5 (3.6%) |
| $100,000+ | 9 (8.8%) | 37 (26.6%) |
| Total | 102 (100.0%) | 139 (100.0%) |
Earnings by Sex by Educational Attainment in Clintonville borough
Average earnings in Clintonville borough are $48,571 for men and $37,813 for women, a difference of 22.2%. Men with an educational attainment of college or associate's degree enjoy the highest average annual earnings of $55,625, while those with high school diploma education earn the least with $32,500. Women with an educational attainment of high school diploma earn the most with the average annual earnings of $37,917, while those with high school diploma education have the smallest earnings of $37,917.
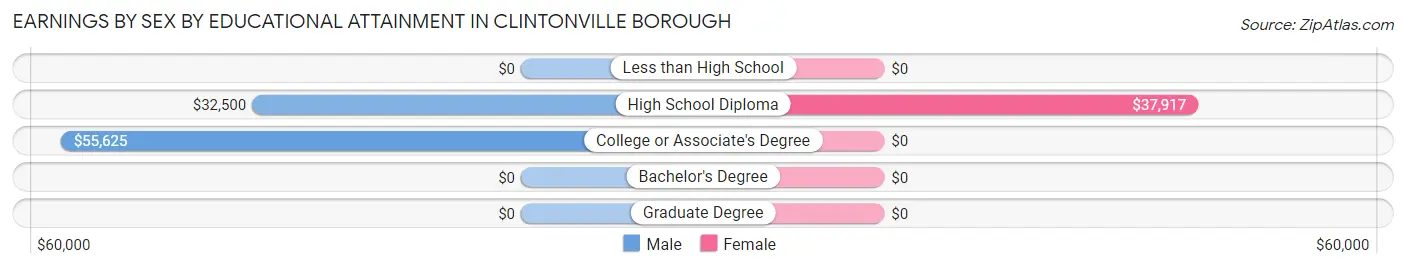
| Educational Attainment | Male Income | Female Income |
| Less than High School | - | - |
| High School Diploma | $32,500 | $37,917 |
| College or Associate's Degree | $55,625 | $0 |
| Bachelor's Degree | - | - |
| Graduate Degree | - | - |
| Total | $48,571 | $37,813 |
Family Income in Clintonville borough
Family Income Brackets in Clintonville borough
According to the Clintonville borough family income data, there are 40 families falling into the $100,000 to $149,999 income range, which is the most common income bracket and makes up 31.8% of all families.
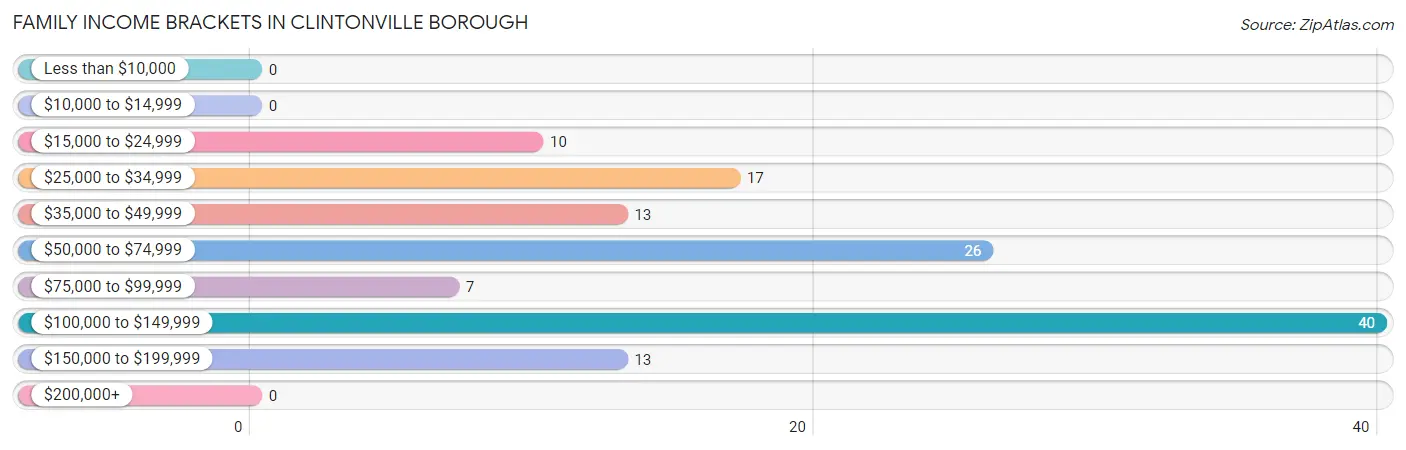
| Income Bracket | # Families | % Families |
| Less than $10,000 | 0 | 0.0% |
| $10,000 to $14,999 | 0 | 0.0% |
| $15,000 to $24,999 | 10 | 7.9% |
| $25,000 to $34,999 | 17 | 13.5% |
| $35,000 to $49,999 | 13 | 10.3% |
| $50,000 to $74,999 | 26 | 20.6% |
| $75,000 to $99,999 | 7 | 5.6% |
| $100,000 to $149,999 | 40 | 31.7% |
| $150,000 to $199,999 | 13 | 10.3% |
| $200,000+ | 0 | 0.0% |
Family Income by Famaliy Size in Clintonville borough
3-person families (29 | 23.0%) account for the highest median family income in Clintonville borough with $107,969 per family, while 3-person families (29 | 23.0%) have the highest median income of $35,990 per family member.
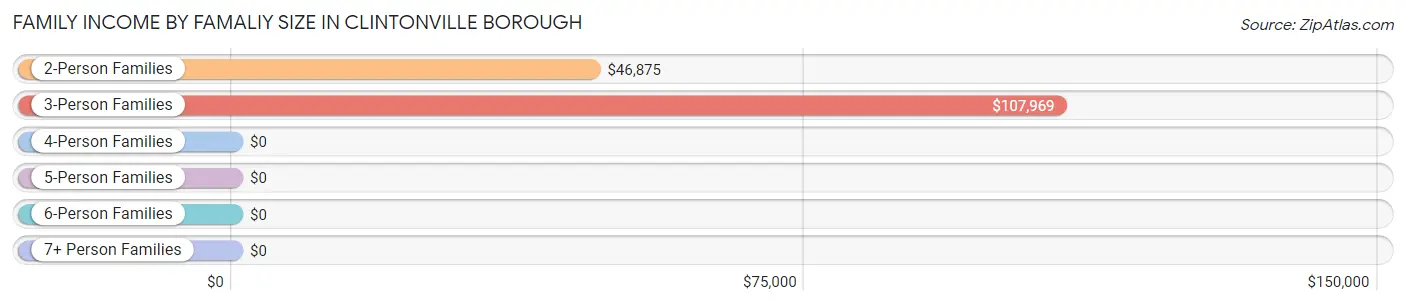
| Income Bracket | # Families | Median Income |
| 2-Person Families | 71 (56.4%) | $46,875 |
| 3-Person Families | 29 (23.0%) | $107,969 |
| 4-Person Families | 15 (11.9%) | $0 |
| 5-Person Families | 10 (7.9%) | $0 |
| 6-Person Families | 0 (0.0%) | $0 |
| 7+ Person Families | 1 (0.8%) | $0 |
| Total | 126 (100.0%) | $73,929 |
Family Income by Number of Earners in Clintonville borough
The median family income in Clintonville borough is $73,929, with families comprising 3+ earners (34) having the highest median family income of $108,125, while families with no earners (30) have the lowest median family income of $27,500, accounting for 27.0% and 23.8% of families, respectively.
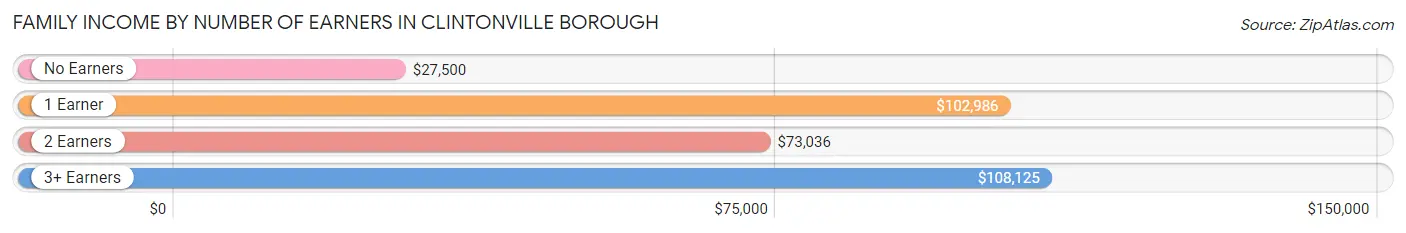
| Number of Earners | # Families | Median Income |
| No Earners | 30 (23.8%) | $27,500 |
| 1 Earner | 47 (37.3%) | $102,986 |
| 2 Earners | 15 (11.9%) | $73,036 |
| 3+ Earners | 34 (27.0%) | $108,125 |
| Total | 126 (100.0%) | $73,929 |
Household Income in Clintonville borough
Household Income Brackets in Clintonville borough
With 58 households falling in the category, the $100,000 to $149,999 income range is the most frequent in Clintonville borough, accounting for 25.8% of all households.
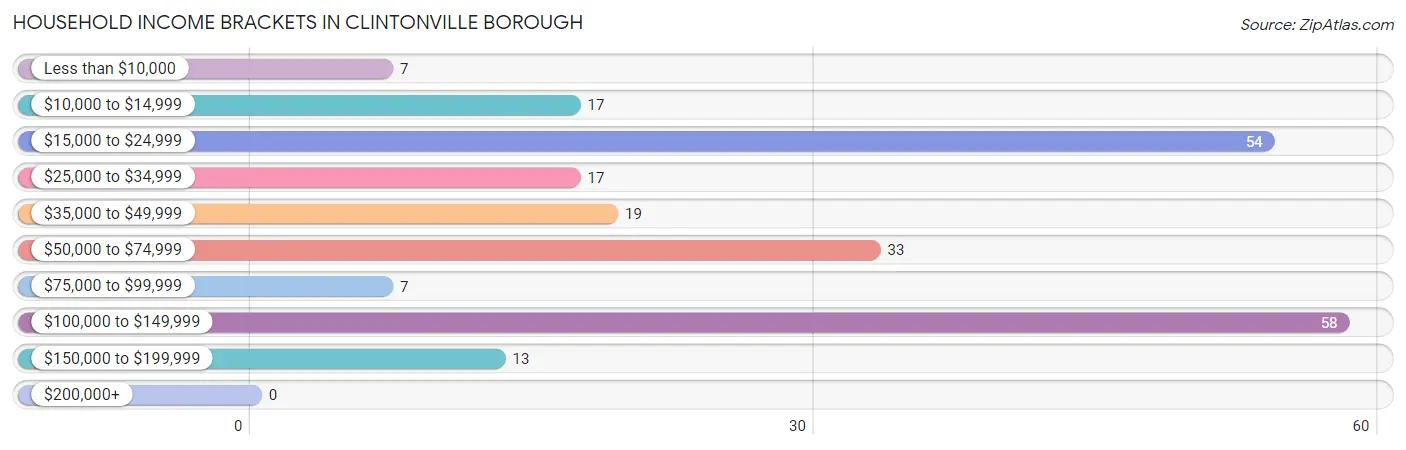
| Income Bracket | # Households | % Households |
| Less than $10,000 | 7 | 3.1% |
| $10,000 to $14,999 | 17 | 7.6% |
| $15,000 to $24,999 | 54 | 24.0% |
| $25,000 to $34,999 | 17 | 7.6% |
| $35,000 to $49,999 | 19 | 8.4% |
| $50,000 to $74,999 | 33 | 14.7% |
| $75,000 to $99,999 | 7 | 3.1% |
| $100,000 to $149,999 | 58 | 25.8% |
| $150,000 to $199,999 | 13 | 5.8% |
| $200,000+ | 0 | 0.0% |
Household Income by Householder Age in Clintonville borough
The median household income in Clintonville borough is $46,875, with the highest median household income of $70,469 found in the 25 to 44 years age bracket for the primary householder. A total of 61 households (27.1%) fall into this category. Meanwhile, the 15 to 24 years age bracket for the primary householder has the lowest median household income of $0, with 5 households (2.2%) in this group.
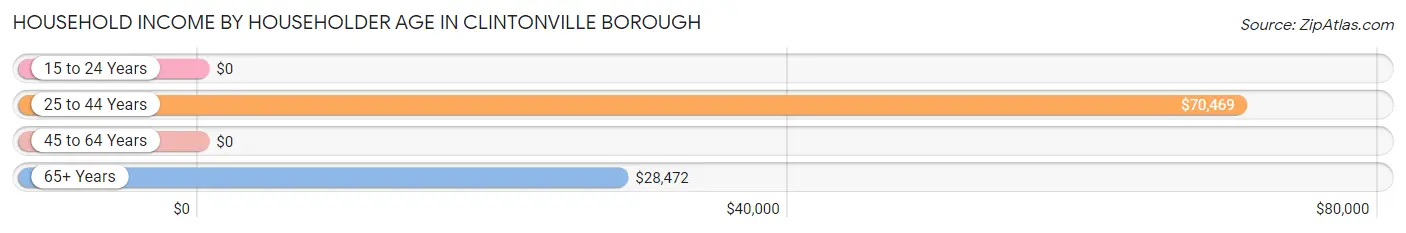
| Income Bracket | # Households | Median Income |
| 15 to 24 Years | 5 (2.2%) | $0 |
| 25 to 44 Years | 61 (27.1%) | $70,469 |
| 45 to 64 Years | 126 (56.0%) | $0 |
| 65+ Years | 33 (14.7%) | $28,472 |
| Total | 225 (100.0%) | $46,875 |
Poverty in Clintonville borough
Income Below Poverty by Sex and Age in Clintonville borough
With 14.9% poverty level for males and 8.9% for females among the residents of Clintonville borough, 6 to 11 year old males and under 5 year old females are the most vulnerable to poverty, with 11 males (64.7%) and 5 females (100.0%) in their respective age groups living below the poverty level.
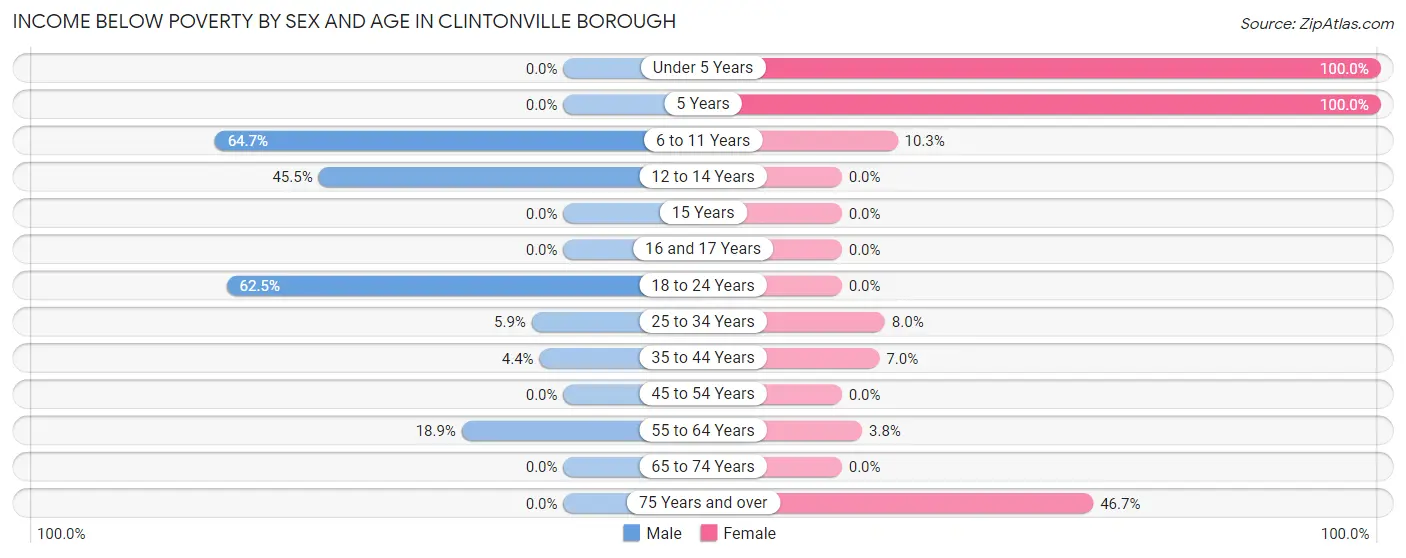
| Age Bracket | Male | Female |
| Under 5 Years | 0 (0.0%) | 5 (100.0%) |
| 5 Years | 0 (0.0%) | 2 (100.0%) |
| 6 to 11 Years | 11 (64.7%) | 3 (10.3%) |
| 12 to 14 Years | 5 (45.5%) | 0 (0.0%) |
| 15 Years | 0 (0.0%) | 0 (0.0%) |
| 16 and 17 Years | 0 (0.0%) | 0 (0.0%) |
| 18 to 24 Years | 5 (62.5%) | 0 (0.0%) |
| 25 to 34 Years | 1 (5.9%) | 2 (8.0%) |
| 35 to 44 Years | 2 (4.4%) | 3 (7.0%) |
| 45 to 54 Years | 0 (0.0%) | 0 (0.0%) |
| 55 to 64 Years | 10 (18.9%) | 2 (3.8%) |
| 65 to 74 Years | 0 (0.0%) | 0 (0.0%) |
| 75 Years and over | 0 (0.0%) | 7 (46.7%) |
| Total | 34 (14.9%) | 24 (8.9%) |
Income Above Poverty by Sex and Age in Clintonville borough
According to the poverty statistics in Clintonville borough, males aged under 5 years and females aged 16 and 17 years are the age groups that are most secure financially, with 100.0% of males and 100.0% of females in these age groups living above the poverty line.
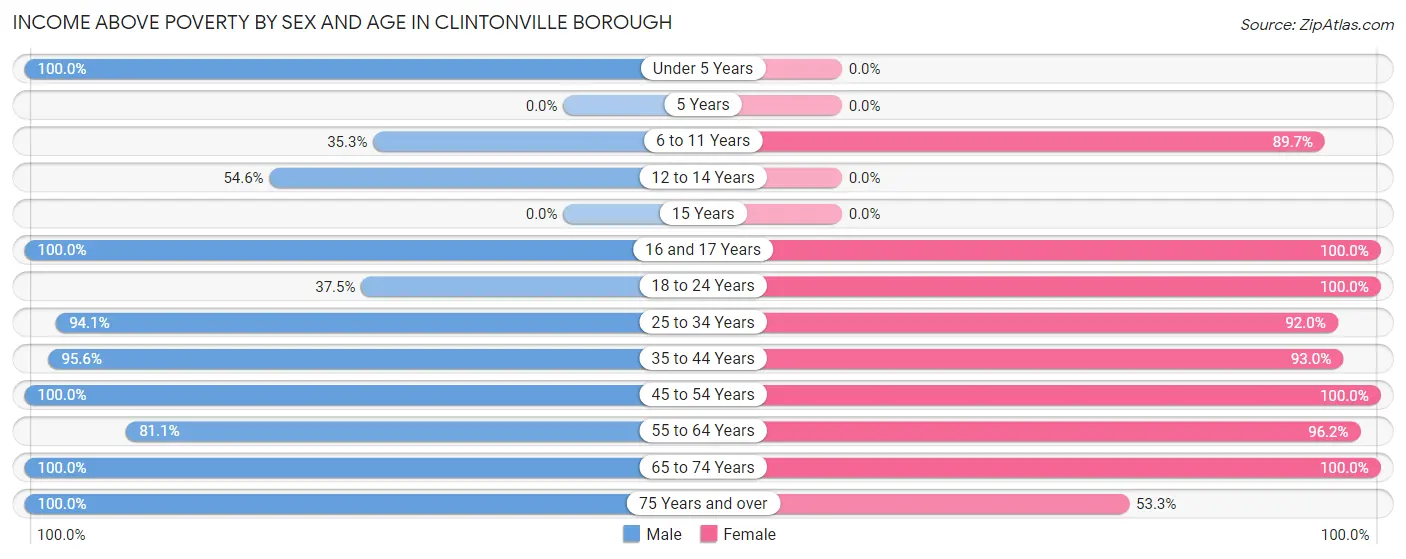
| Age Bracket | Male | Female |
| Under 5 Years | 19 (100.0%) | 0 (0.0%) |
| 5 Years | 0 (0.0%) | 0 (0.0%) |
| 6 to 11 Years | 6 (35.3%) | 26 (89.7%) |
| 12 to 14 Years | 6 (54.5%) | 0 (0.0%) |
| 15 Years | 0 (0.0%) | 0 (0.0%) |
| 16 and 17 Years | 11 (100.0%) | 9 (100.0%) |
| 18 to 24 Years | 3 (37.5%) | 20 (100.0%) |
| 25 to 34 Years | 16 (94.1%) | 23 (92.0%) |
| 35 to 44 Years | 43 (95.6%) | 40 (93.0%) |
| 45 to 54 Years | 9 (100.0%) | 58 (100.0%) |
| 55 to 64 Years | 43 (81.1%) | 51 (96.2%) |
| 65 to 74 Years | 30 (100.0%) | 11 (100.0%) |
| 75 Years and over | 8 (100.0%) | 8 (53.3%) |
| Total | 194 (85.1%) | 246 (91.1%) |
Income Below Poverty Among Married-Couple Families in Clintonville borough
The poverty statistics for married-couple families in Clintonville borough show that 2.9% or 3 of the total 103 families live below the poverty line. Families with 3 or 4 children have the highest poverty rate of 100.0%, comprising of 2 families. On the other hand, families with no children have the lowest poverty rate of 0.0%, which includes 0 families.
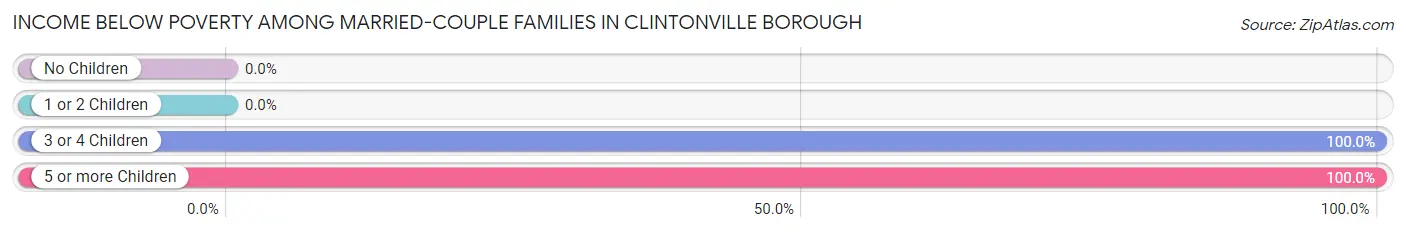
| Children | Above Poverty | Below Poverty |
| No Children | 57 (100.0%) | 0 (0.0%) |
| 1 or 2 Children | 43 (100.0%) | 0 (0.0%) |
| 3 or 4 Children | 0 (0.0%) | 2 (100.0%) |
| 5 or more Children | 0 (0.0%) | 1 (100.0%) |
| Total | 100 (97.1%) | 3 (2.9%) |
Income Below Poverty Among Single-Parent Households in Clintonville borough
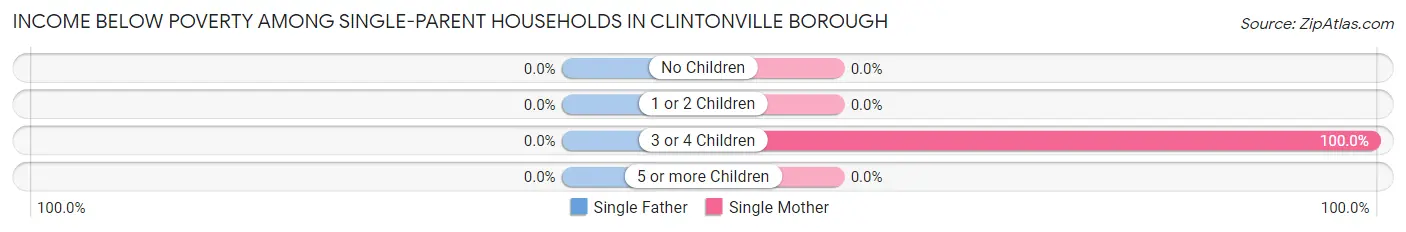
| Children | Single Father | Single Mother |
| No Children | 0 (0.0%) | 0 (0.0%) |
| 1 or 2 Children | 0 (0.0%) | 0 (0.0%) |
| 3 or 4 Children | 0 (0.0%) | 1 (100.0%) |
| 5 or more Children | 0 (0.0%) | 0 (0.0%) |
| Total | 0 (0.0%) | 1 (6.2%) |
Income Below Poverty Among Married-Couple vs Single-Parent Households in Clintonville borough
The poverty data for Clintonville borough shows that 3 of the married-couple family households (2.9%) and 1 of the single-parent households (4.3%) are living below the poverty level. Within the married-couple family households, those with 3 or 4 children have the highest poverty rate, with 2 households (100.0%) falling below the poverty line. Among the single-parent households, those with 3 or 4 children have the highest poverty rate, with 1 household (100.0%) living below poverty.
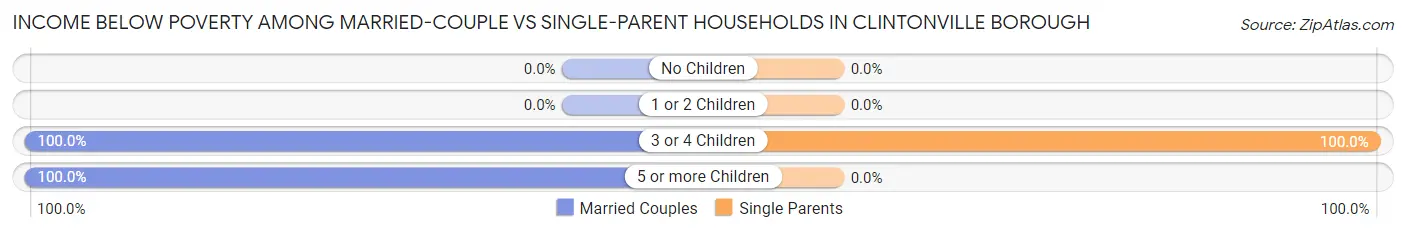
| Children | Married-Couple Families | Single-Parent Households |
| No Children | 0 (0.0%) | 0 (0.0%) |
| 1 or 2 Children | 0 (0.0%) | 0 (0.0%) |
| 3 or 4 Children | 2 (100.0%) | 1 (100.0%) |
| 5 or more Children | 1 (100.0%) | 0 (0.0%) |
| Total | 3 (2.9%) | 1 (4.3%) |
Employment Characteristics in Clintonville borough
Employment by Class of Employer in Clintonville borough
Among the 206 employed individuals in Clintonville borough, private company employees (113 | 54.8%), federal government employees (65 | 31.6%), and not-for-profit organizations (14 | 6.8%) make up the most common classes of employment.
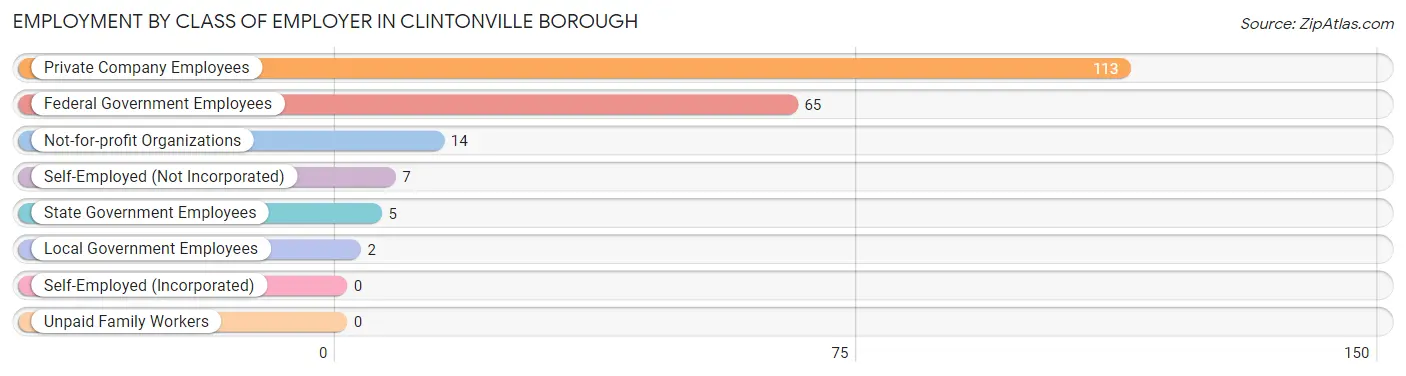
| Employer Class | # Employees | % Employees |
| Private Company Employees | 113 | 54.8% |
| Self-Employed (Incorporated) | 0 | 0.0% |
| Self-Employed (Not Incorporated) | 7 | 3.4% |
| Not-for-profit Organizations | 14 | 6.8% |
| Local Government Employees | 2 | 1.0% |
| State Government Employees | 5 | 2.4% |
| Federal Government Employees | 65 | 31.6% |
| Unpaid Family Workers | 0 | 0.0% |
| Total | 206 | 100.0% |
Employment Status by Age in Clintonville borough
According to the labor force statistics for Clintonville borough, out of the total population over 16 years of age (415), 56.1% or 233 individuals are in the labor force, with 11.6% or 27 of them unemployed. The age group with the highest labor force participation rate is 25 to 29 years, with 100.0% or 39 individuals in the labor force. Within the labor force, the 65 to 74 years age range has the highest percentage of unemployed individuals, with 71.4% or 5 of them being unemployed.
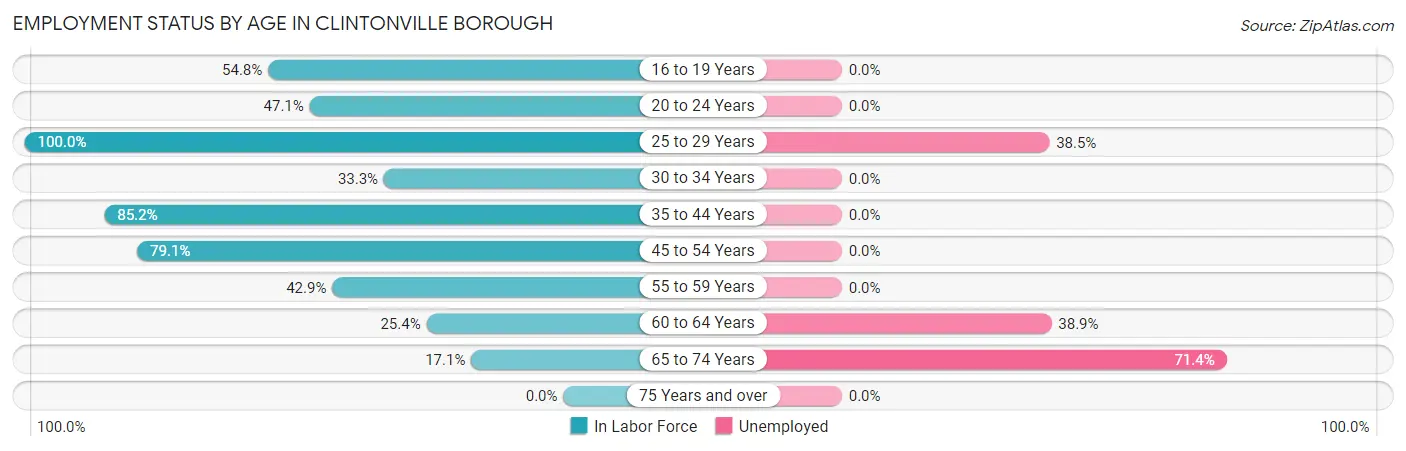
| Age Bracket | In Labor Force | Unemployed |
| 16 to 19 Years | 17 (54.8%) | 0 (0.0%) |
| 20 to 24 Years | 8 (47.1%) | 0 (0.0%) |
| 25 to 29 Years | 39 (100.0%) | 15 (38.5%) |
| 30 to 34 Years | 1 (33.3%) | 0 (0.0%) |
| 35 to 44 Years | 75 (85.2%) | 0 (0.0%) |
| 45 to 54 Years | 53 (79.1%) | 0 (0.0%) |
| 55 to 59 Years | 15 (42.9%) | 0 (0.0%) |
| 60 to 64 Years | 18 (25.4%) | 7 (38.9%) |
| 65 to 74 Years | 7 (17.1%) | 5 (71.4%) |
| 75 Years and over | 0 (0.0%) | 0 (0.0%) |
| Total | 233 (56.1%) | 27 (11.6%) |
Employment Status by Educational Attainment in Clintonville borough
According to labor force statistics for Clintonville borough, 66.3% of individuals (201) out of the total population between 25 and 64 years of age (303) are in the labor force, with 10.9% or 22 of them being unemployed. The group with the highest labor force participation rate are those with the educational attainment of bachelor's degree or higher, with 100.0% or 25 individuals in the labor force. Within the labor force, individuals with less than high school education have the highest percentage of unemployment, with 41.2% or 7 of them being unemployed.
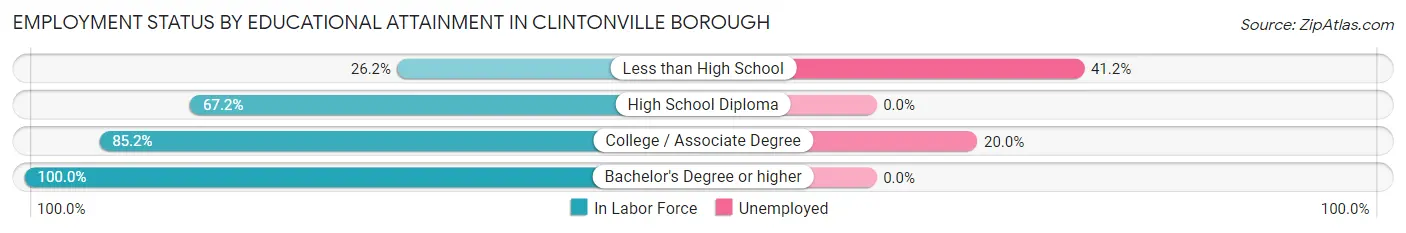
| Educational Attainment | In Labor Force | Unemployed |
| Less than High School | 17 (26.2%) | 27 (41.2%) |
| High School Diploma | 84 (67.2%) | 0 (0.0%) |
| College / Associate Degree | 75 (85.2%) | 18 (20.0%) |
| Bachelor's Degree or higher | 25 (100.0%) | 0 (0.0%) |
| Total | 201 (66.3%) | 33 (10.9%) |
Employment Occupations by Sex in Clintonville borough
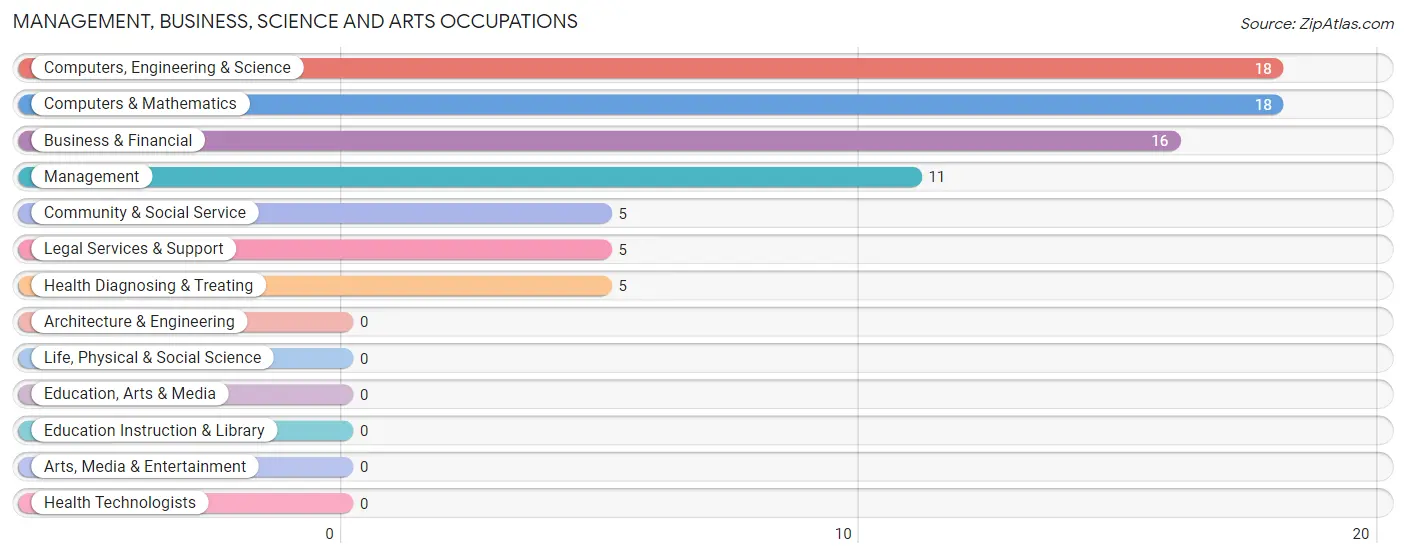
Management, Business, Science and Arts Occupations
The most common Management, Business, Science and Arts occupations in Clintonville borough are Computers, Engineering & Science (18 | 8.7%), Computers & Mathematics (18 | 8.7%), Business & Financial (16 | 7.8%), Management (11 | 5.3%), and Community & Social Service (5 | 2.4%).
Management, Business, Science and Arts Occupations by Sex
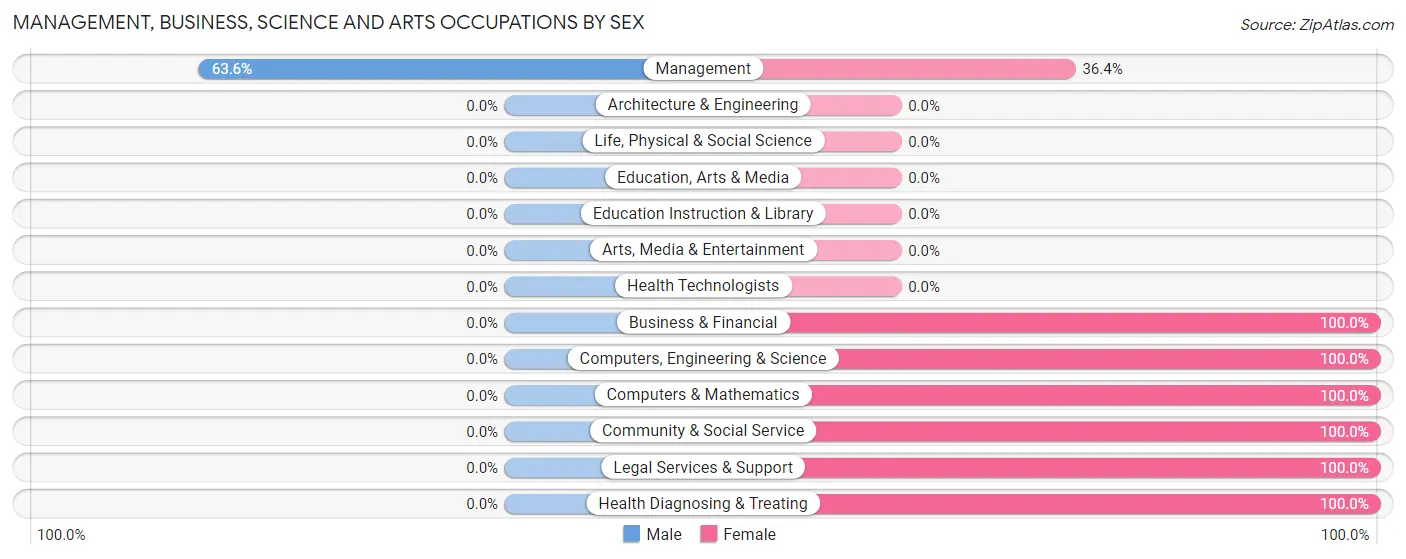
| Occupation | Male | Female |
| Management | 7 (63.6%) | 4 (36.4%) |
| Business & Financial | 0 (0.0%) | 16 (100.0%) |
| Computers, Engineering & Science | 0 (0.0%) | 18 (100.0%) |
| Computers & Mathematics | 0 (0.0%) | 18 (100.0%) |
| Architecture & Engineering | 0 (0.0%) | 0 (0.0%) |
| Life, Physical & Social Science | 0 (0.0%) | 0 (0.0%) |
| Community & Social Service | 0 (0.0%) | 5 (100.0%) |
| Education, Arts & Media | 0 (0.0%) | 0 (0.0%) |
| Legal Services & Support | 0 (0.0%) | 5 (100.0%) |
| Education Instruction & Library | 0 (0.0%) | 0 (0.0%) |
| Arts, Media & Entertainment | 0 (0.0%) | 0 (0.0%) |
| Health Diagnosing & Treating | 0 (0.0%) | 5 (100.0%) |
| Health Technologists | 0 (0.0%) | 0 (0.0%) |
| Total (Category) | 7 (12.7%) | 48 (87.3%) |
| Total (Overall) | 91 (44.2%) | 115 (55.8%) |
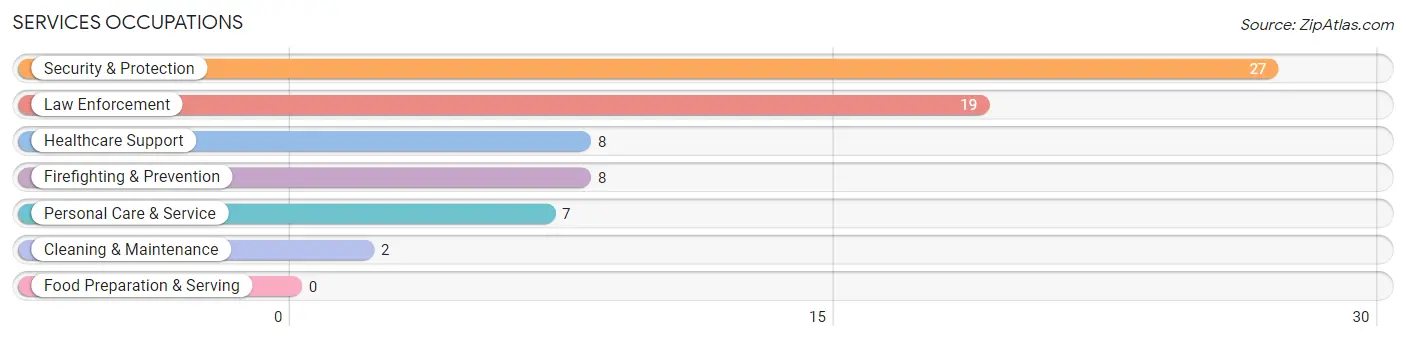
Services Occupations
The most common Services occupations in Clintonville borough are Security & Protection (27 | 13.1%), Law Enforcement (19 | 9.2%), Healthcare Support (8 | 3.9%), Firefighting & Prevention (8 | 3.9%), and Personal Care & Service (7 | 3.4%).
Services Occupations by Sex
Within the Services occupations in Clintonville borough, the most male-oriented occupations are Firefighting & Prevention (100.0%), and Security & Protection (29.6%), while the most female-oriented occupations are Healthcare Support (100.0%), Law Enforcement (100.0%), and Cleaning & Maintenance (100.0%).
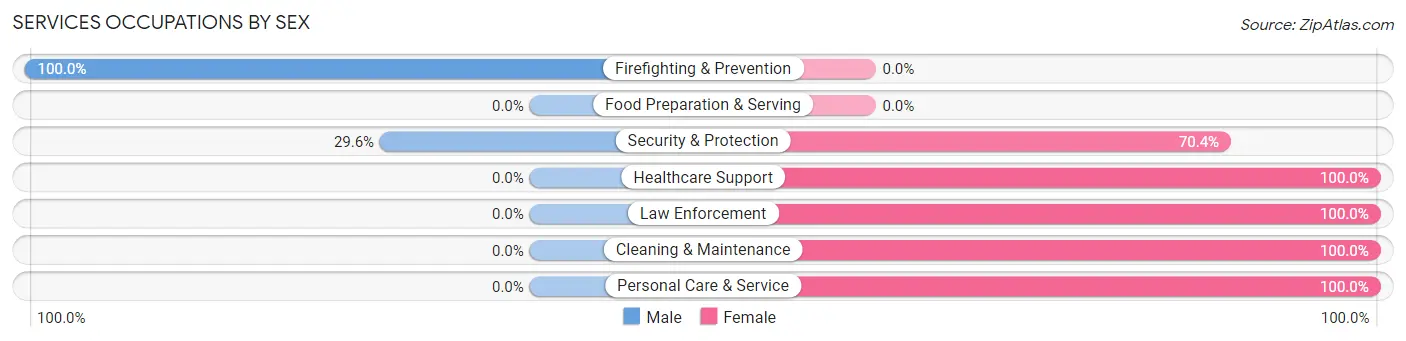
| Occupation | Male | Female |
| Healthcare Support | 0 (0.0%) | 8 (100.0%) |
| Security & Protection | 8 (29.6%) | 19 (70.4%) |
| Firefighting & Prevention | 8 (100.0%) | 0 (0.0%) |
| Law Enforcement | 0 (0.0%) | 19 (100.0%) |
| Food Preparation & Serving | 0 (0.0%) | 0 (0.0%) |
| Cleaning & Maintenance | 0 (0.0%) | 2 (100.0%) |
| Personal Care & Service | 0 (0.0%) | 7 (100.0%) |
| Total (Category) | 8 (18.2%) | 36 (81.8%) |
| Total (Overall) | 91 (44.2%) | 115 (55.8%) |
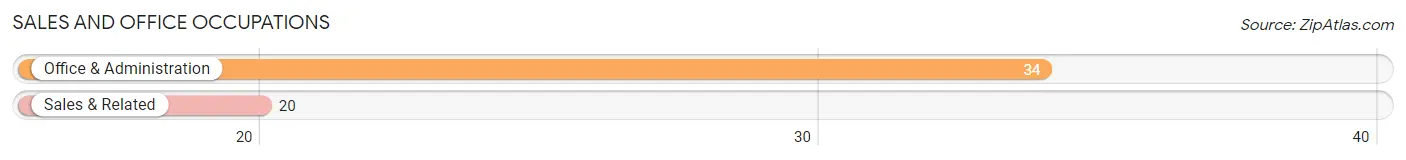
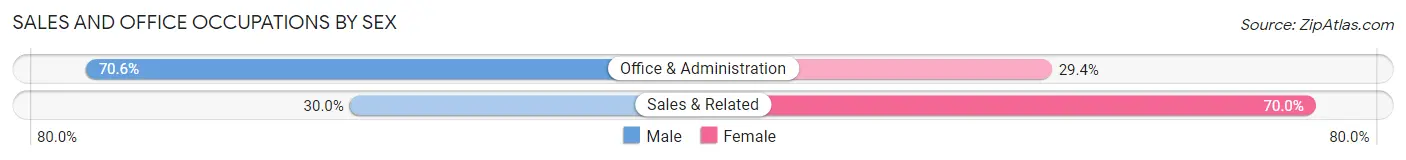
Sales and Office Occupations
The most common Sales and Office occupations in Clintonville borough are Office & Administration (34 | 16.5%), and Sales & Related (20 | 9.7%).
Sales and Office Occupations by Sex
| Occupation | Male | Female |
| Sales & Related | 6 (30.0%) | 14 (70.0%) |
| Office & Administration | 24 (70.6%) | 10 (29.4%) |
| Total (Category) | 30 (55.6%) | 24 (44.4%) |
| Total (Overall) | 91 (44.2%) | 115 (55.8%) |
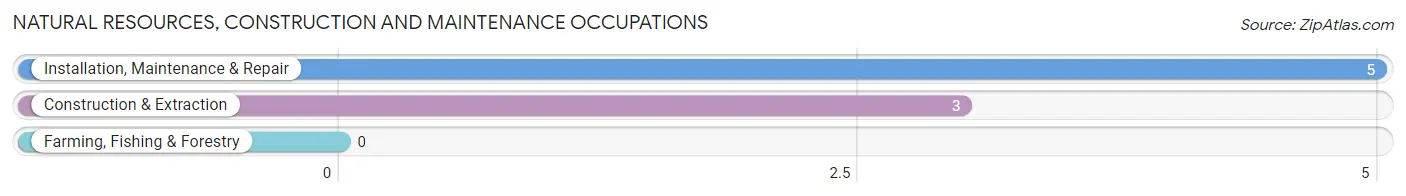
Natural Resources, Construction and Maintenance Occupations
The most common Natural Resources, Construction and Maintenance occupations in Clintonville borough are Installation, Maintenance & Repair (5 | 2.4%), and Construction & Extraction (3 | 1.5%).
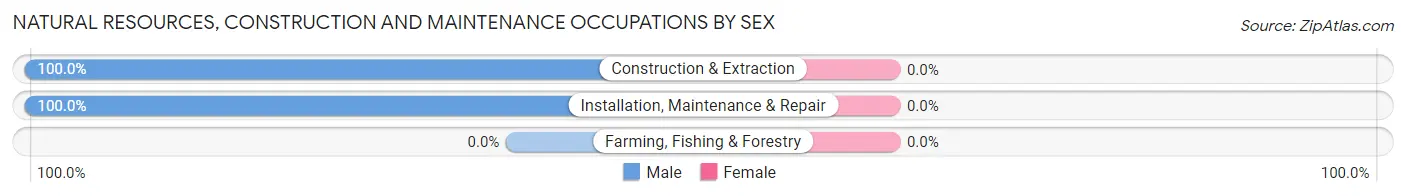
Natural Resources, Construction and Maintenance Occupations by Sex
| Occupation | Male | Female |
| Farming, Fishing & Forestry | 0 (0.0%) | 0 (0.0%) |
| Construction & Extraction | 3 (100.0%) | 0 (0.0%) |
| Installation, Maintenance & Repair | 5 (100.0%) | 0 (0.0%) |
| Total (Category) | 8 (100.0%) | 0 (0.0%) |
| Total (Overall) | 91 (44.2%) | 115 (55.8%) |
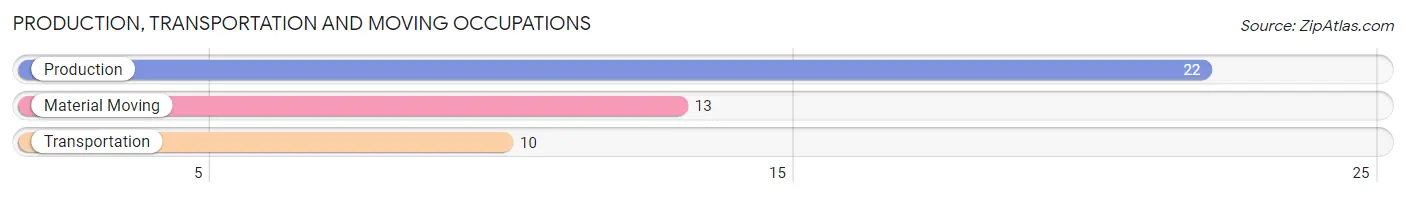
Production, Transportation and Moving Occupations
The most common Production, Transportation and Moving occupations in Clintonville borough are Production (22 | 10.7%), Material Moving (13 | 6.3%), and Transportation (10 | 4.9%).
Production, Transportation and Moving Occupations by Sex
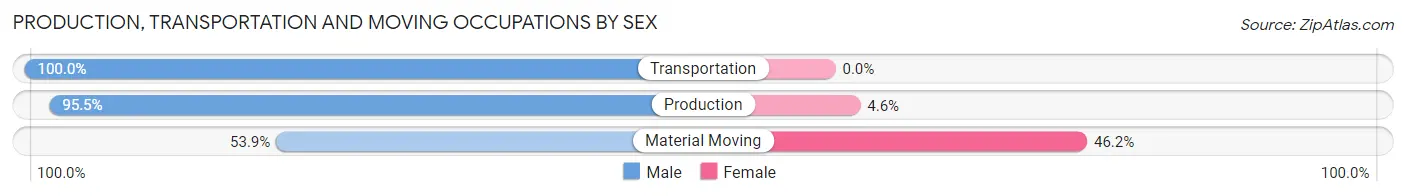
| Occupation | Male | Female |
| Production | 21 (95.5%) | 1 (4.5%) |
| Transportation | 10 (100.0%) | 0 (0.0%) |
| Material Moving | 7 (53.8%) | 6 (46.2%) |
| Total (Category) | 38 (84.4%) | 7 (15.6%) |
| Total (Overall) | 91 (44.2%) | 115 (55.8%) |
Employment Industries by Sex in Clintonville borough
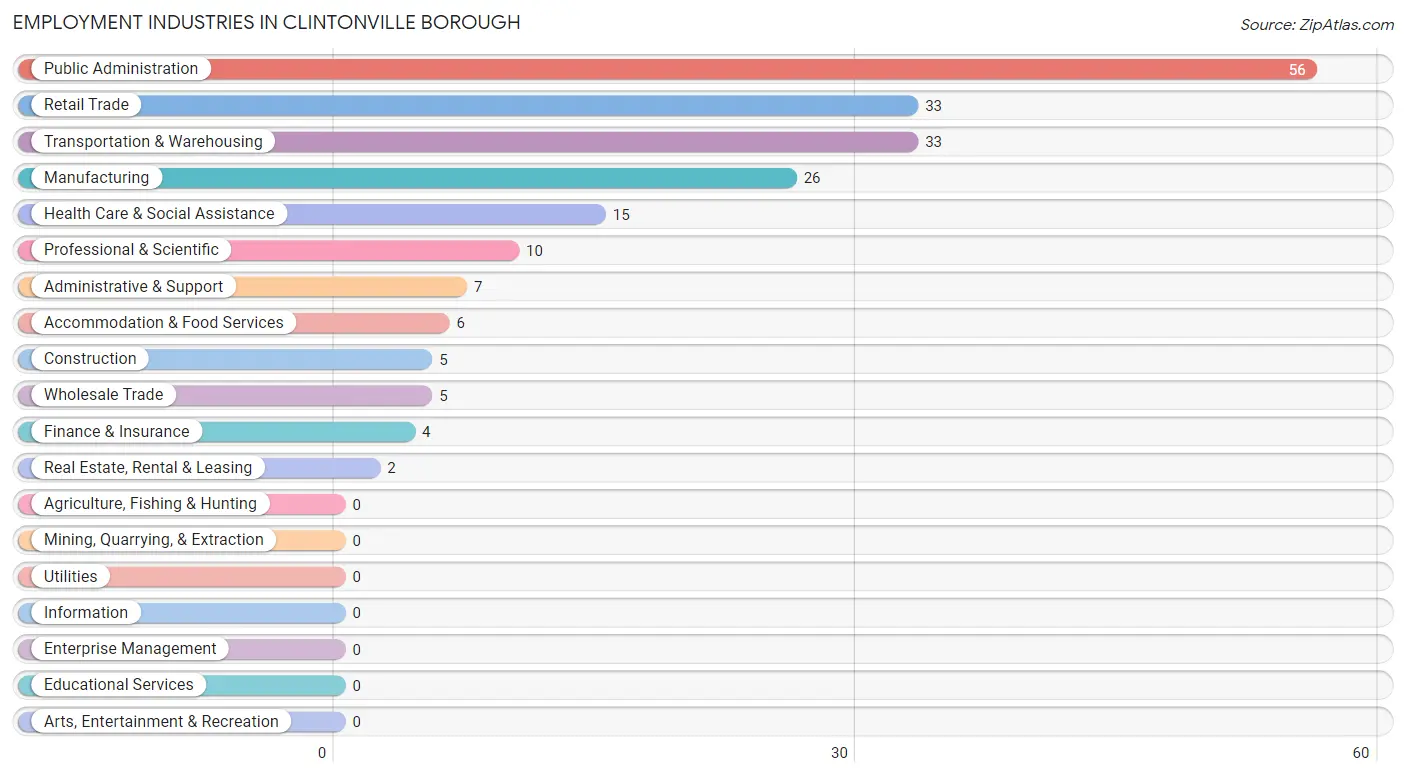
Employment Industries in Clintonville borough
The major employment industries in Clintonville borough include Public Administration (56 | 27.2%), Retail Trade (33 | 16.0%), Transportation & Warehousing (33 | 16.0%), Manufacturing (26 | 12.6%), and Health Care & Social Assistance (15 | 7.3%).
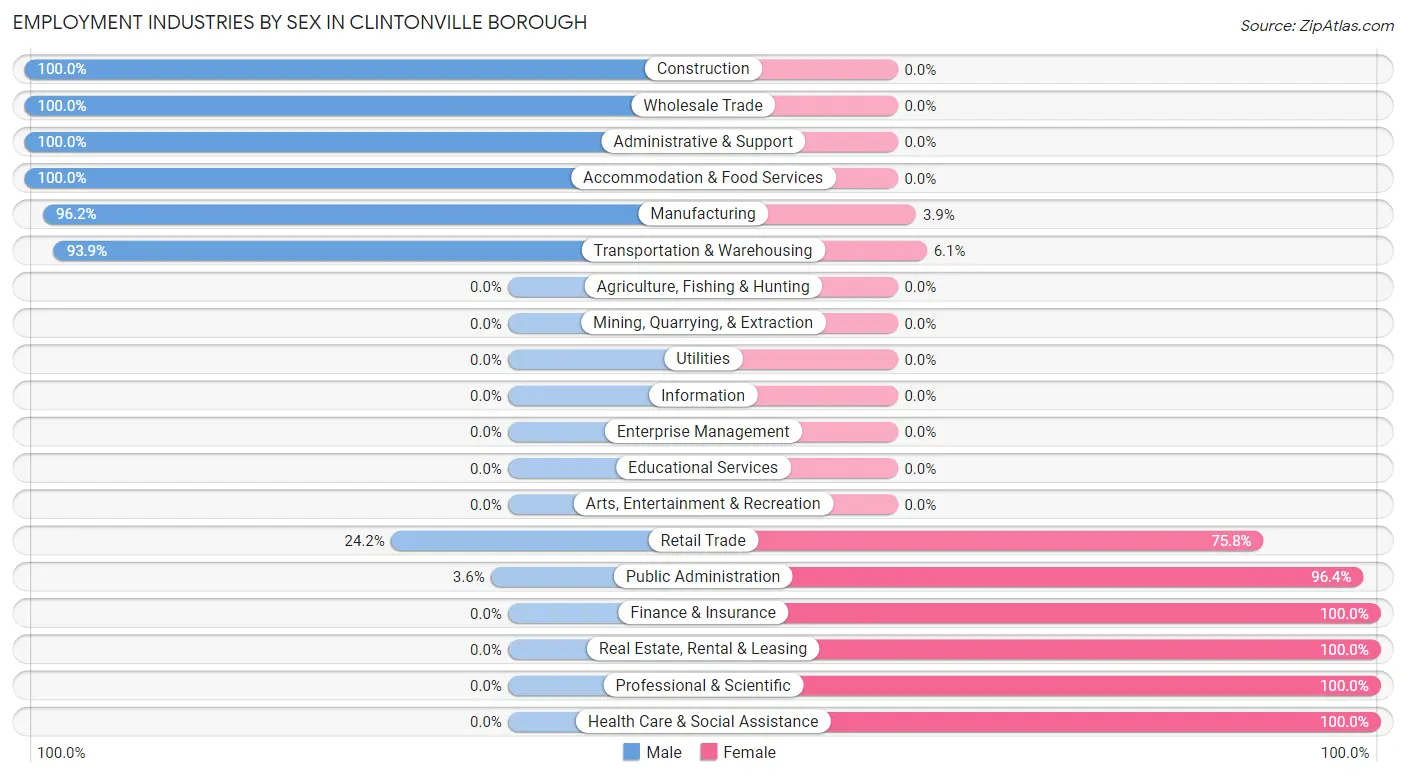
Employment Industries by Sex in Clintonville borough
The Clintonville borough industries that see more men than women are Construction (100.0%), Wholesale Trade (100.0%), and Administrative & Support (100.0%), whereas the industries that tend to have a higher number of women are Finance & Insurance (100.0%), Real Estate, Rental & Leasing (100.0%), and Professional & Scientific (100.0%).
| Industry | Male | Female |
| Agriculture, Fishing & Hunting | 0 (0.0%) | 0 (0.0%) |
| Mining, Quarrying, & Extraction | 0 (0.0%) | 0 (0.0%) |
| Construction | 5 (100.0%) | 0 (0.0%) |
| Manufacturing | 25 (96.2%) | 1 (3.8%) |
| Wholesale Trade | 5 (100.0%) | 0 (0.0%) |
| Retail Trade | 8 (24.2%) | 25 (75.8%) |
| Transportation & Warehousing | 31 (93.9%) | 2 (6.1%) |
| Utilities | 0 (0.0%) | 0 (0.0%) |
| Information | 0 (0.0%) | 0 (0.0%) |
| Finance & Insurance | 0 (0.0%) | 4 (100.0%) |
| Real Estate, Rental & Leasing | 0 (0.0%) | 2 (100.0%) |
| Professional & Scientific | 0 (0.0%) | 10 (100.0%) |
| Enterprise Management | 0 (0.0%) | 0 (0.0%) |
| Administrative & Support | 7 (100.0%) | 0 (0.0%) |
| Educational Services | 0 (0.0%) | 0 (0.0%) |
| Health Care & Social Assistance | 0 (0.0%) | 15 (100.0%) |
| Arts, Entertainment & Recreation | 0 (0.0%) | 0 (0.0%) |
| Accommodation & Food Services | 6 (100.0%) | 0 (0.0%) |
| Public Administration | 2 (3.6%) | 54 (96.4%) |
| Total | 91 (44.2%) | 115 (55.8%) |
Education in Clintonville borough
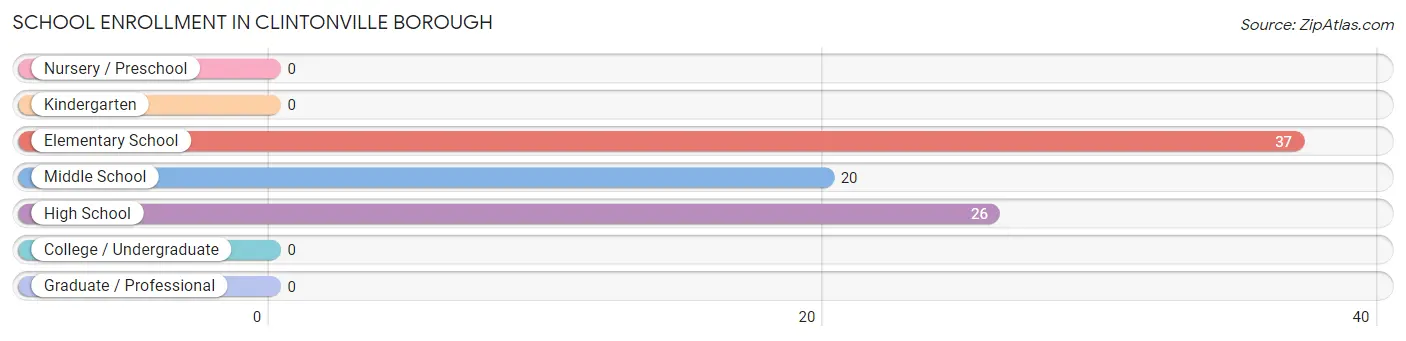
School Enrollment in Clintonville borough
The most common levels of schooling among the 83 students in Clintonville borough are elementary school (37 | 44.6%), high school (26 | 31.3%), and middle school (20 | 24.1%).
| School Level | # Students | % Students |
| Nursery / Preschool | 0 | 0.0% |
| Kindergarten | 0 | 0.0% |
| Elementary School | 37 | 44.6% |
| Middle School | 20 | 24.1% |
| High School | 26 | 31.3% |
| College / Undergraduate | 0 | 0.0% |
| Graduate / Professional | 0 | 0.0% |
| Total | 83 | 100.0% |
School Enrollment by Age by Funding Source in Clintonville borough
Out of a total of 83 students who are enrolled in schools in Clintonville borough, 12 (14.5%) attend a private institution, while the remaining 71 (85.5%) are enrolled in public schools. The age group of 5 to 9 year old has the highest likelihood of being enrolled in private schools, with 10 (34.5% in the age bracket) enrolled. Conversely, the age group of 15 to 17 year olds has the lowest likelihood of being enrolled in a private school, with 20 (100.0% in the age bracket) attending a public institution.
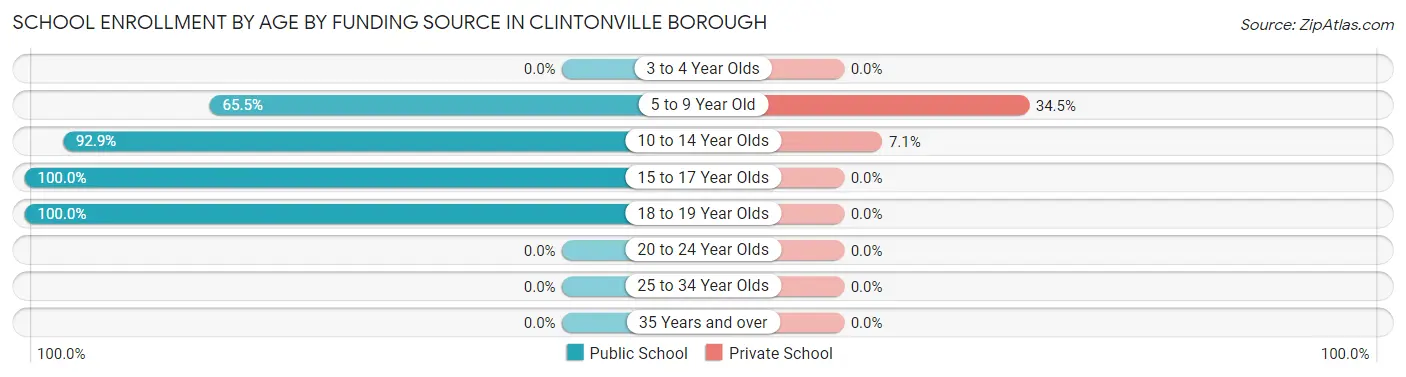
| Age Bracket | Public School | Private School |
| 3 to 4 Year Olds | 0 (0.0%) | 0 (0.0%) |
| 5 to 9 Year Old | 19 (65.5%) | 10 (34.5%) |
| 10 to 14 Year Olds | 26 (92.9%) | 2 (7.1%) |
| 15 to 17 Year Olds | 20 (100.0%) | 0 (0.0%) |
| 18 to 19 Year Olds | 6 (100.0%) | 0 (0.0%) |
| 20 to 24 Year Olds | 0 (0.0%) | 0 (0.0%) |
| 25 to 34 Year Olds | 0 (0.0%) | 0 (0.0%) |
| 35 Years and over | 0 (0.0%) | 0 (0.0%) |
| Total | 71 (85.5%) | 12 (14.5%) |
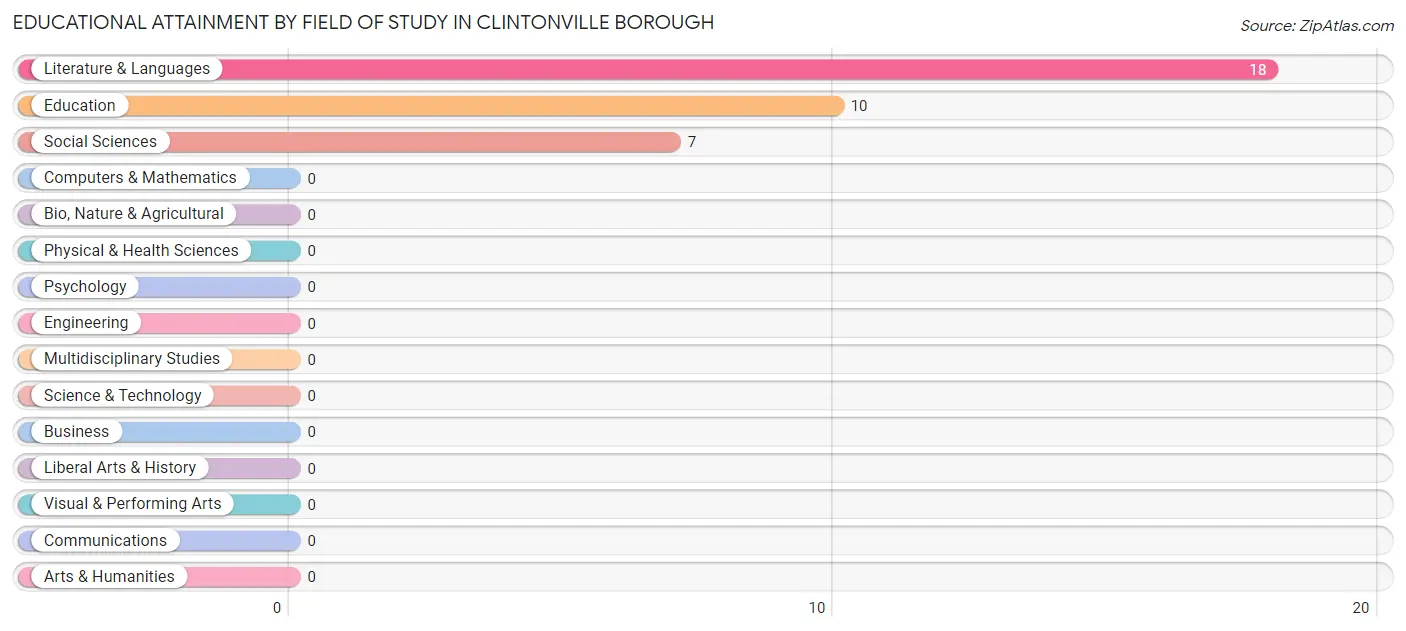
Educational Attainment by Field of Study in Clintonville borough
Literature & languages (18 | 51.4%), education (10 | 28.6%), and social sciences (7 | 20.0%) are the most common fields of study among 35 individuals in Clintonville borough who have obtained a bachelor's degree or higher.
| Field of Study | # Graduates | % Graduates |
| Computers & Mathematics | 0 | 0.0% |
| Bio, Nature & Agricultural | 0 | 0.0% |
| Physical & Health Sciences | 0 | 0.0% |
| Psychology | 0 | 0.0% |
| Social Sciences | 7 | 20.0% |
| Engineering | 0 | 0.0% |
| Multidisciplinary Studies | 0 | 0.0% |
| Science & Technology | 0 | 0.0% |
| Business | 0 | 0.0% |
| Education | 10 | 28.6% |
| Literature & Languages | 18 | 51.4% |
| Liberal Arts & History | 0 | 0.0% |
| Visual & Performing Arts | 0 | 0.0% |
| Communications | 0 | 0.0% |
| Arts & Humanities | 0 | 0.0% |
| Total | 35 | 100.0% |
Transportation & Commute in Clintonville borough
Vehicle Availability by Sex in Clintonville borough
The most prevalent vehicle ownership categories in Clintonville borough are males with 3 vehicles (37, accounting for 40.7%) and females with 3 vehicles (20, making up 32.2%).
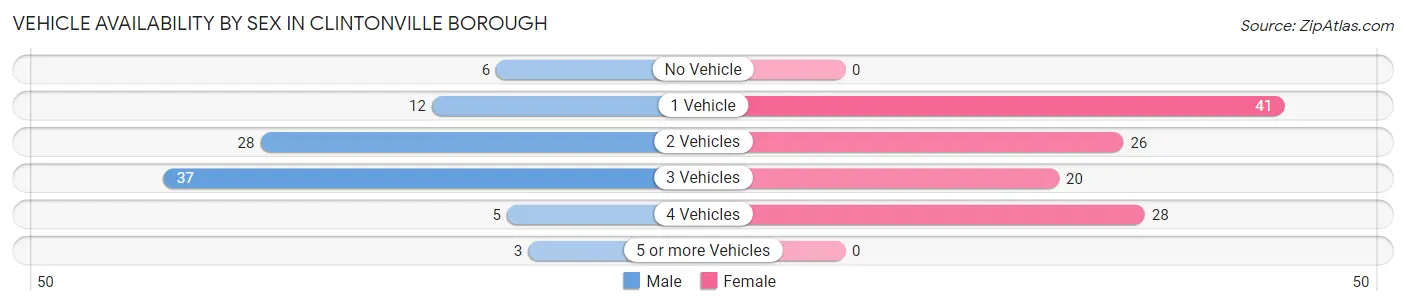
| Vehicles Available | Male | Female |
| No Vehicle | 6 (6.6%) | 0 (0.0%) |
| 1 Vehicle | 12 (13.2%) | 41 (35.6%) |
| 2 Vehicles | 28 (30.8%) | 26 (22.6%) |
| 3 Vehicles | 37 (40.7%) | 20 (17.4%) |
| 4 Vehicles | 5 (5.5%) | 28 (24.3%) |
| 5 or more Vehicles | 3 (3.3%) | 0 (0.0%) |
| Total | 91 (100.0%) | 115 (100.0%) |
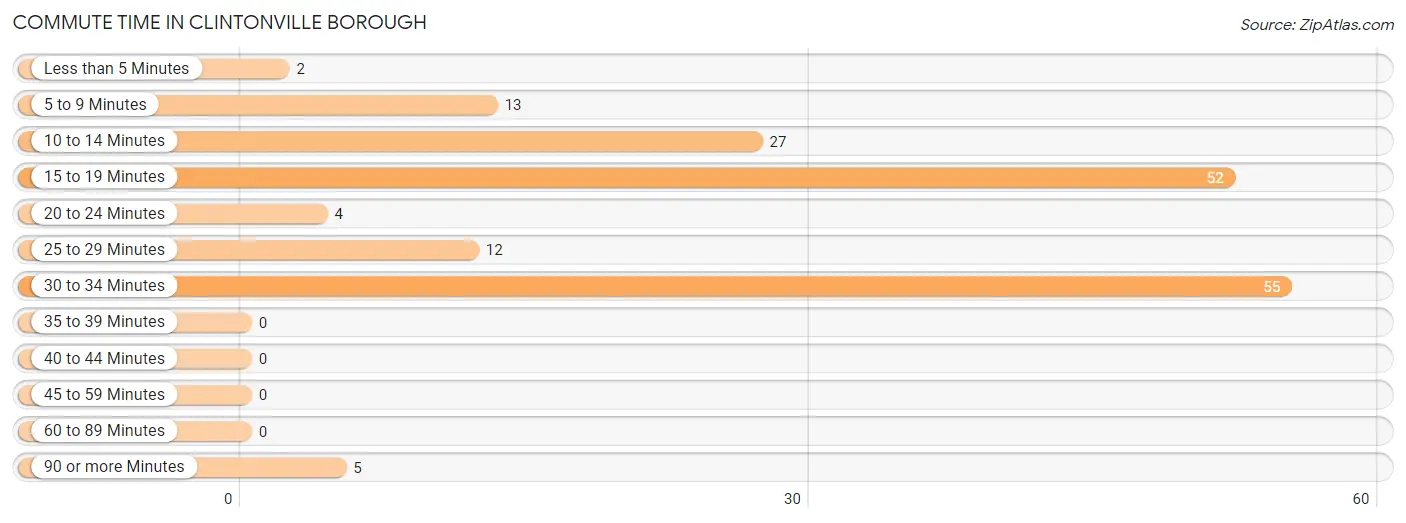
Commute Time in Clintonville borough
The most frequently occuring commute durations in Clintonville borough are 30 to 34 minutes (55 commuters, 32.4%), 15 to 19 minutes (52 commuters, 30.6%), and 10 to 14 minutes (27 commuters, 15.9%).
| Commute Time | # Commuters | % Commuters |
| Less than 5 Minutes | 2 | 1.2% |
| 5 to 9 Minutes | 13 | 7.6% |
| 10 to 14 Minutes | 27 | 15.9% |
| 15 to 19 Minutes | 52 | 30.6% |
| 20 to 24 Minutes | 4 | 2.4% |
| 25 to 29 Minutes | 12 | 7.1% |
| 30 to 34 Minutes | 55 | 32.4% |
| 35 to 39 Minutes | 0 | 0.0% |
| 40 to 44 Minutes | 0 | 0.0% |
| 45 to 59 Minutes | 0 | 0.0% |
| 60 to 89 Minutes | 0 | 0.0% |
| 90 or more Minutes | 5 | 2.9% |
Commute Time by Sex in Clintonville borough
The most common commute times in Clintonville borough are 15 to 19 minutes (38 commuters, 41.8%) for males and 30 to 34 minutes (29 commuters, 36.7%) for females.
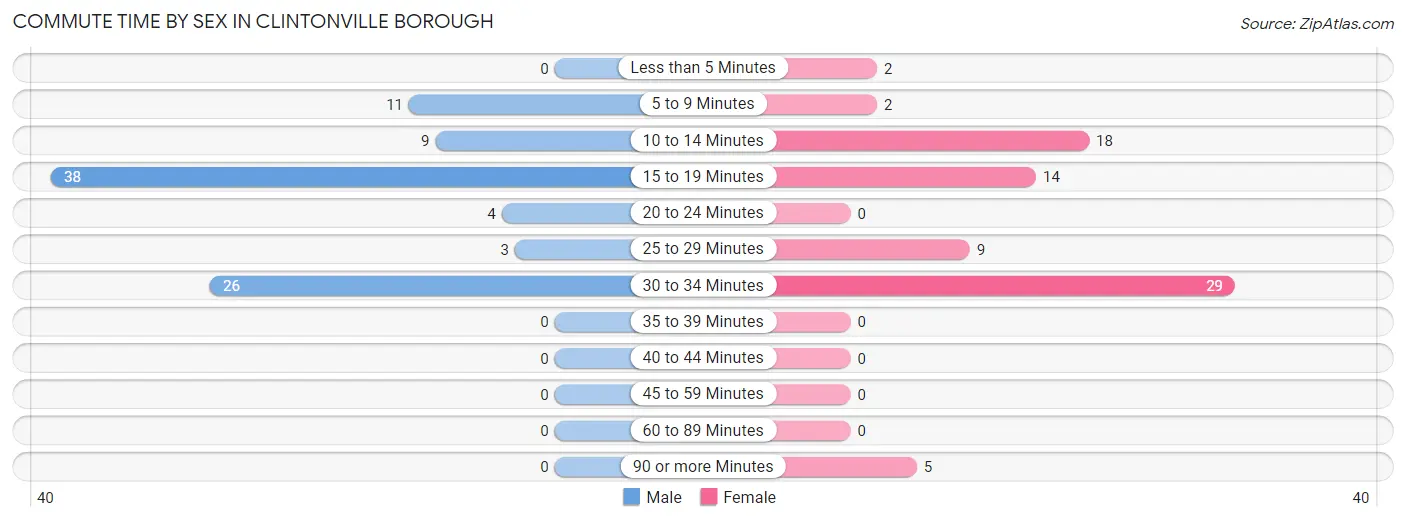
| Commute Time | Male | Female |
| Less than 5 Minutes | 0 (0.0%) | 2 (2.5%) |
| 5 to 9 Minutes | 11 (12.1%) | 2 (2.5%) |
| 10 to 14 Minutes | 9 (9.9%) | 18 (22.8%) |
| 15 to 19 Minutes | 38 (41.8%) | 14 (17.7%) |
| 20 to 24 Minutes | 4 (4.4%) | 0 (0.0%) |
| 25 to 29 Minutes | 3 (3.3%) | 9 (11.4%) |
| 30 to 34 Minutes | 26 (28.6%) | 29 (36.7%) |
| 35 to 39 Minutes | 0 (0.0%) | 0 (0.0%) |
| 40 to 44 Minutes | 0 (0.0%) | 0 (0.0%) |
| 45 to 59 Minutes | 0 (0.0%) | 0 (0.0%) |
| 60 to 89 Minutes | 0 (0.0%) | 0 (0.0%) |
| 90 or more Minutes | 0 (0.0%) | 5 (6.3%) |
Time of Departure to Work by Sex in Clintonville borough
The most frequent times of departure to work in Clintonville borough are 7:00 AM to 7:29 AM (28, 30.8%) for males and 7:30 AM to 7:59 AM (22, 27.9%) for females.
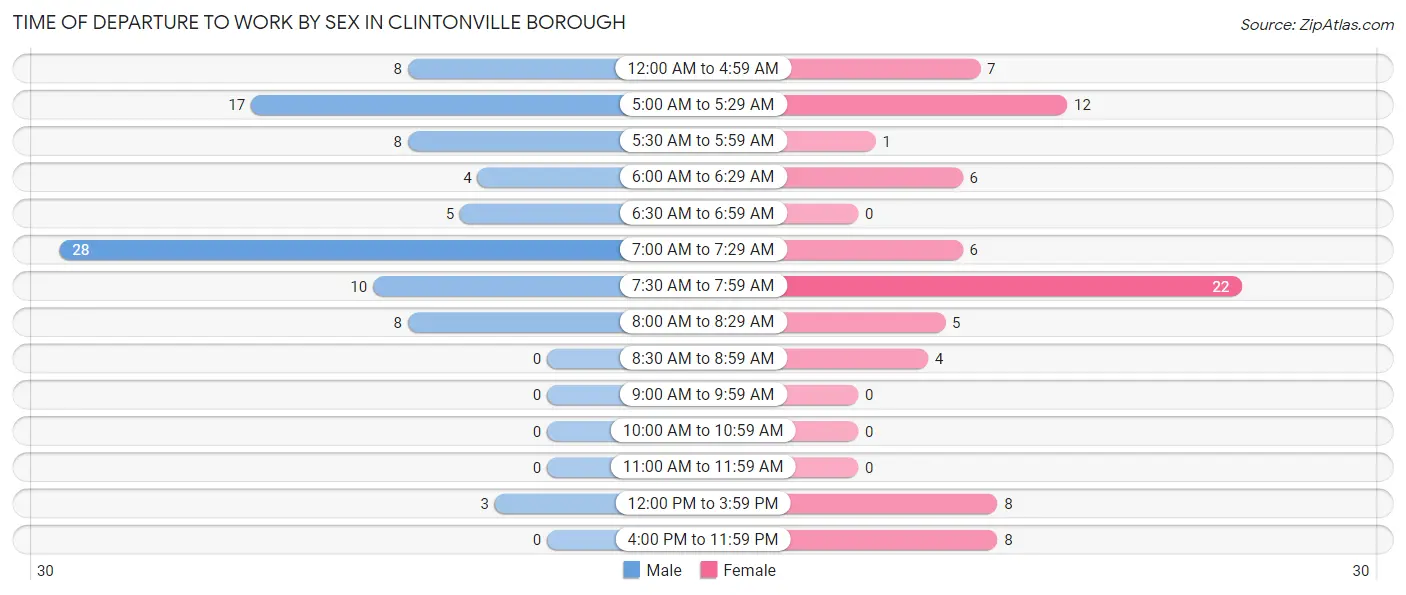
| Time of Departure | Male | Female |
| 12:00 AM to 4:59 AM | 8 (8.8%) | 7 (8.9%) |
| 5:00 AM to 5:29 AM | 17 (18.7%) | 12 (15.2%) |
| 5:30 AM to 5:59 AM | 8 (8.8%) | 1 (1.3%) |
| 6:00 AM to 6:29 AM | 4 (4.4%) | 6 (7.6%) |
| 6:30 AM to 6:59 AM | 5 (5.5%) | 0 (0.0%) |
| 7:00 AM to 7:29 AM | 28 (30.8%) | 6 (7.6%) |
| 7:30 AM to 7:59 AM | 10 (11.0%) | 22 (27.9%) |
| 8:00 AM to 8:29 AM | 8 (8.8%) | 5 (6.3%) |
| 8:30 AM to 8:59 AM | 0 (0.0%) | 4 (5.1%) |
| 9:00 AM to 9:59 AM | 0 (0.0%) | 0 (0.0%) |
| 10:00 AM to 10:59 AM | 0 (0.0%) | 0 (0.0%) |
| 11:00 AM to 11:59 AM | 0 (0.0%) | 0 (0.0%) |
| 12:00 PM to 3:59 PM | 3 (3.3%) | 8 (10.1%) |
| 4:00 PM to 11:59 PM | 0 (0.0%) | 8 (10.1%) |
| Total | 91 (100.0%) | 79 (100.0%) |
Housing Occupancy in Clintonville borough
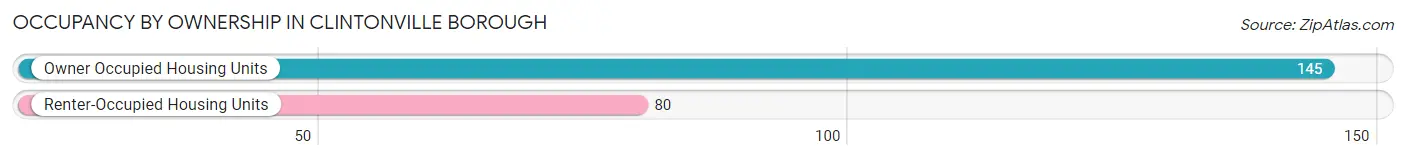
Occupancy by Ownership in Clintonville borough
Of the total 225 dwellings in Clintonville borough, owner-occupied units account for 145 (64.4%), while renter-occupied units make up 80 (35.6%).
| Occupancy | # Housing Units | % Housing Units |
| Owner Occupied Housing Units | 145 | 64.4% |
| Renter-Occupied Housing Units | 80 | 35.6% |
| Total Occupied Housing Units | 225 | 100.0% |
Occupancy by Household Size in Clintonville borough
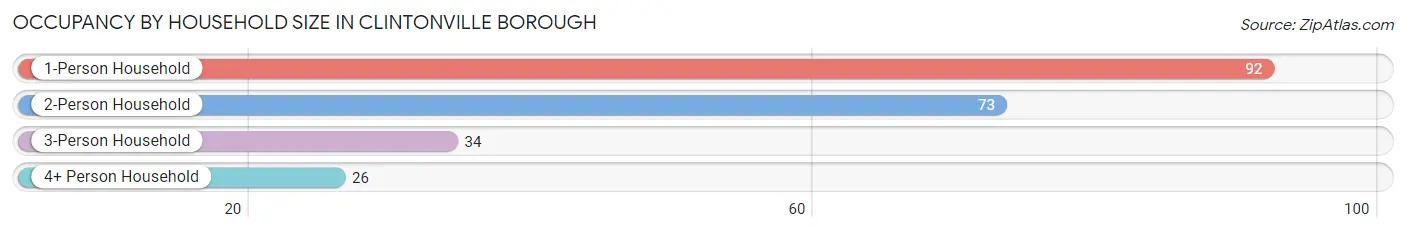
| Household Size | # Housing Units | % Housing Units |
| 1-Person Household | 92 | 40.9% |
| 2-Person Household | 73 | 32.4% |
| 3-Person Household | 34 | 15.1% |
| 4+ Person Household | 26 | 11.6% |
| Total Housing Units | 225 | 100.0% |
Occupancy by Ownership by Household Size in Clintonville borough
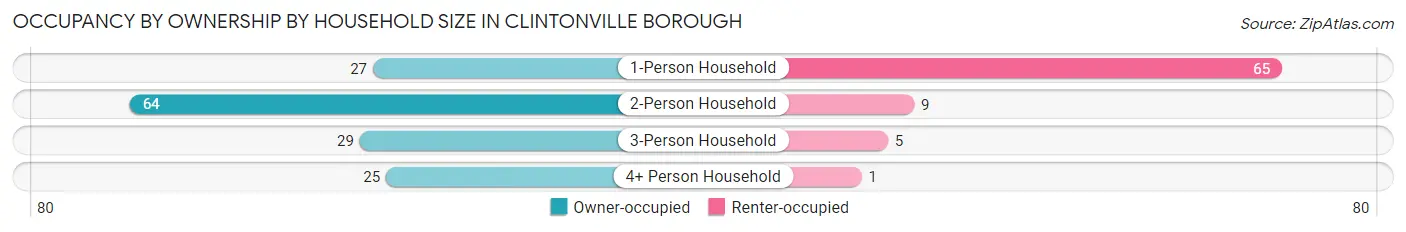
| Household Size | Owner-occupied | Renter-occupied |
| 1-Person Household | 27 (29.3%) | 65 (70.7%) |
| 2-Person Household | 64 (87.7%) | 9 (12.3%) |
| 3-Person Household | 29 (85.3%) | 5 (14.7%) |
| 4+ Person Household | 25 (96.2%) | 1 (3.8%) |
| Total Housing Units | 145 (64.4%) | 80 (35.6%) |
Occupancy by Educational Attainment in Clintonville borough
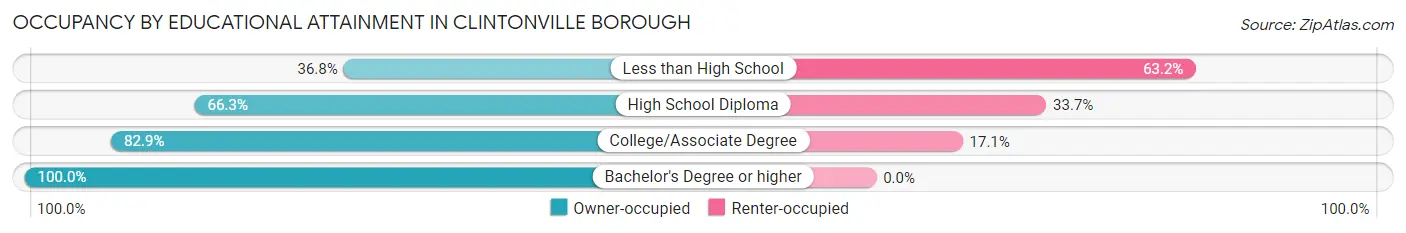
| Household Size | Owner-occupied | Renter-occupied |
| Less than High School | 25 (36.8%) | 43 (63.2%) |
| High School Diploma | 61 (66.3%) | 31 (33.7%) |
| College/Associate Degree | 29 (82.9%) | 6 (17.1%) |
| Bachelor's Degree or higher | 30 (100.0%) | 0 (0.0%) |
Occupancy by Age of Householder in Clintonville borough
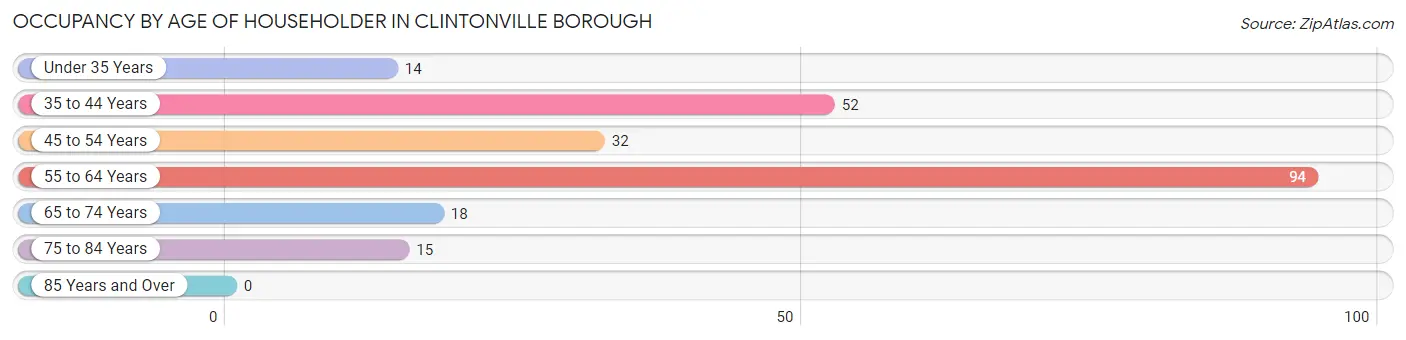
| Age Bracket | # Households | % Households |
| Under 35 Years | 14 | 6.2% |
| 35 to 44 Years | 52 | 23.1% |
| 45 to 54 Years | 32 | 14.2% |
| 55 to 64 Years | 94 | 41.8% |
| 65 to 74 Years | 18 | 8.0% |
| 75 to 84 Years | 15 | 6.7% |
| 85 Years and Over | 0 | 0.0% |
| Total | 225 | 100.0% |
Housing Finances in Clintonville borough
Median Income by Occupancy in Clintonville borough
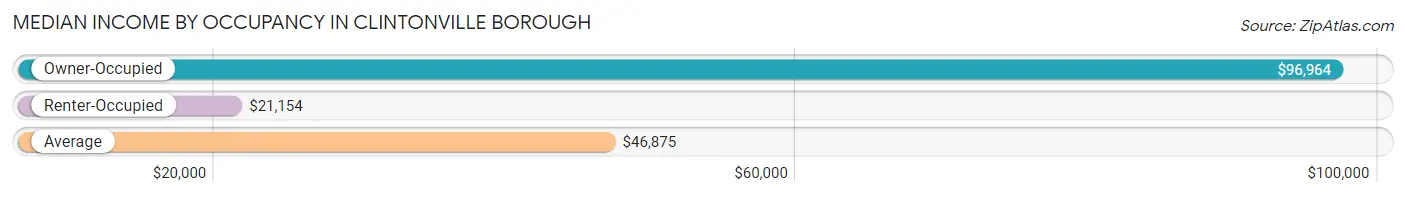
| Occupancy Type | # Households | Median Income |
| Owner-Occupied | 145 (64.4%) | $96,964 |
| Renter-Occupied | 80 (35.6%) | $21,154 |
| Average | 225 (100.0%) | $46,875 |
Occupancy by Householder Income Bracket in Clintonville borough
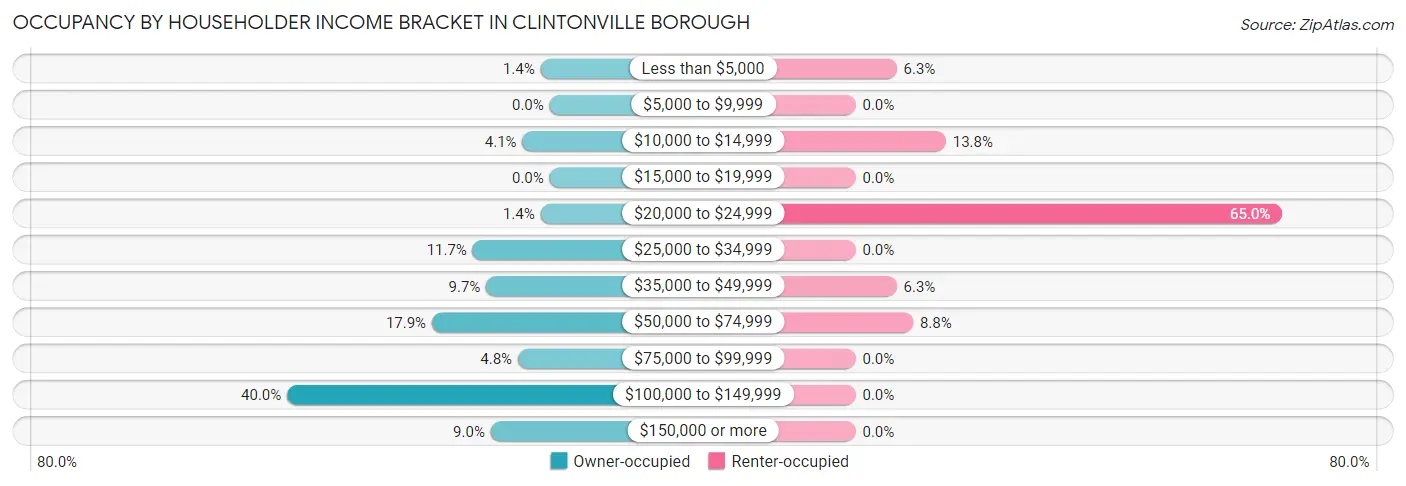
| Income Bracket | Owner-occupied | Renter-occupied |
| Less than $5,000 | 2 (1.4%) | 5 (6.2%) |
| $5,000 to $9,999 | 0 (0.0%) | 0 (0.0%) |
| $10,000 to $14,999 | 6 (4.1%) | 11 (13.8%) |
| $15,000 to $19,999 | 0 (0.0%) | 0 (0.0%) |
| $20,000 to $24,999 | 2 (1.4%) | 52 (65.0%) |
| $25,000 to $34,999 | 17 (11.7%) | 0 (0.0%) |
| $35,000 to $49,999 | 14 (9.7%) | 5 (6.2%) |
| $50,000 to $74,999 | 26 (17.9%) | 7 (8.7%) |
| $75,000 to $99,999 | 7 (4.8%) | 0 (0.0%) |
| $100,000 to $149,999 | 58 (40.0%) | 0 (0.0%) |
| $150,000 or more | 13 (9.0%) | 0 (0.0%) |
| Total | 145 (100.0%) | 80 (100.0%) |
Monthly Housing Cost Tiers in Clintonville borough
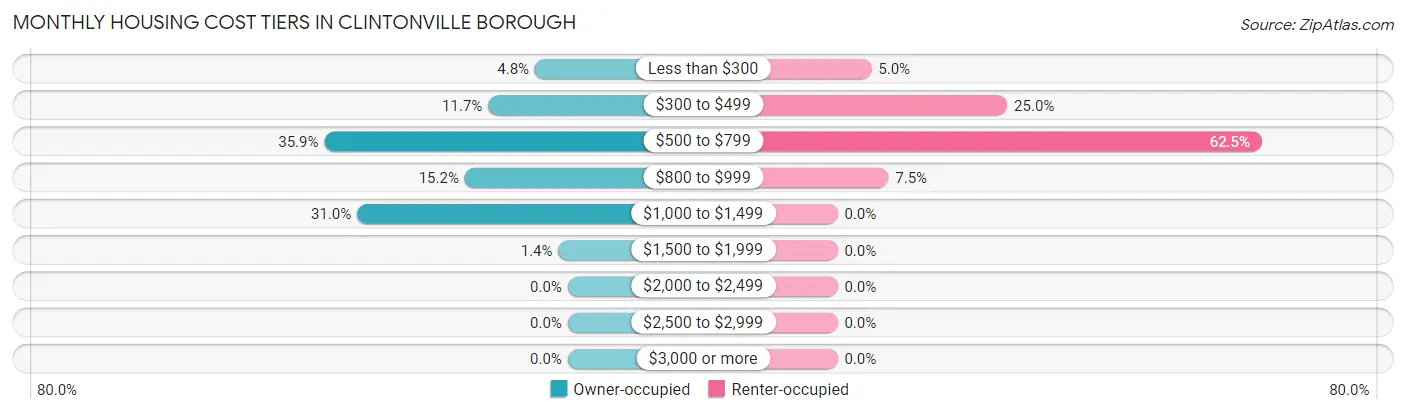
| Monthly Cost | Owner-occupied | Renter-occupied |
| Less than $300 | 7 (4.8%) | 4 (5.0%) |
| $300 to $499 | 17 (11.7%) | 20 (25.0%) |
| $500 to $799 | 52 (35.9%) | 50 (62.5%) |
| $800 to $999 | 22 (15.2%) | 6 (7.5%) |
| $1,000 to $1,499 | 45 (31.0%) | 0 (0.0%) |
| $1,500 to $1,999 | 2 (1.4%) | 0 (0.0%) |
| $2,000 to $2,499 | 0 (0.0%) | 0 (0.0%) |
| $2,500 to $2,999 | 0 (0.0%) | 0 (0.0%) |
| $3,000 or more | 0 (0.0%) | 0 (0.0%) |
| Total | 145 (100.0%) | 80 (100.0%) |
Physical Housing Characteristics in Clintonville borough
Housing Structures in Clintonville borough
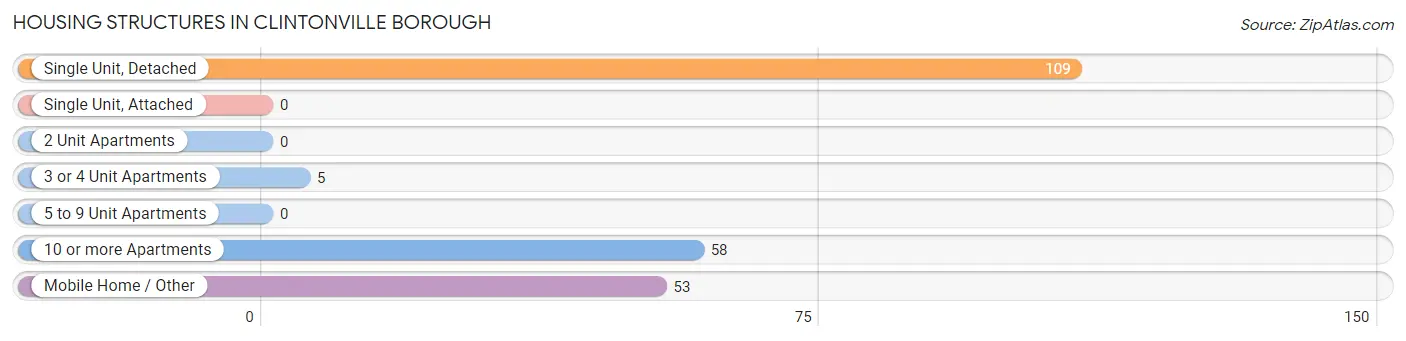
| Structure Type | # Housing Units | % Housing Units |
| Single Unit, Detached | 109 | 48.4% |
| Single Unit, Attached | 0 | 0.0% |
| 2 Unit Apartments | 0 | 0.0% |
| 3 or 4 Unit Apartments | 5 | 2.2% |
| 5 to 9 Unit Apartments | 0 | 0.0% |
| 10 or more Apartments | 58 | 25.8% |
| Mobile Home / Other | 53 | 23.6% |
| Total | 225 | 100.0% |
Housing Structures by Occupancy in Clintonville borough
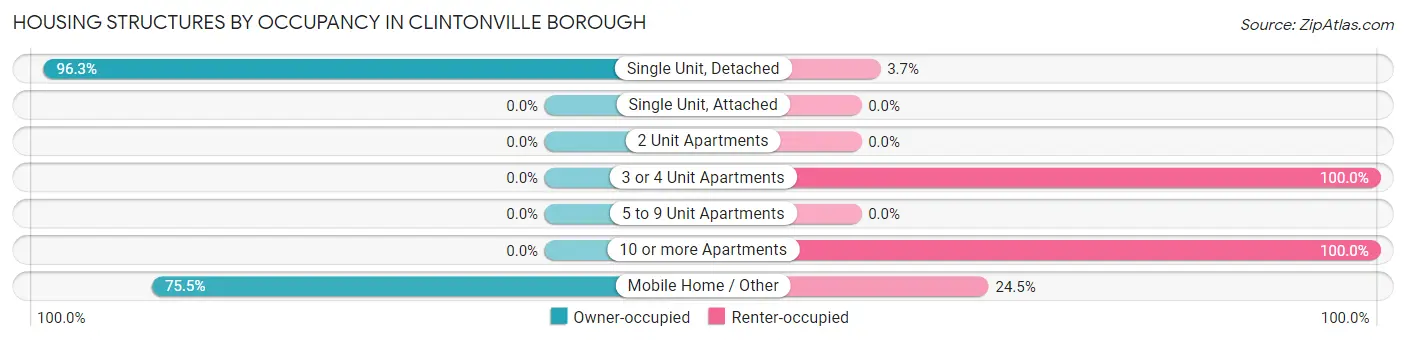
| Structure Type | Owner-occupied | Renter-occupied |
| Single Unit, Detached | 105 (96.3%) | 4 (3.7%) |
| Single Unit, Attached | 0 (0.0%) | 0 (0.0%) |
| 2 Unit Apartments | 0 (0.0%) | 0 (0.0%) |
| 3 or 4 Unit Apartments | 0 (0.0%) | 5 (100.0%) |
| 5 to 9 Unit Apartments | 0 (0.0%) | 0 (0.0%) |
| 10 or more Apartments | 0 (0.0%) | 58 (100.0%) |
| Mobile Home / Other | 40 (75.5%) | 13 (24.5%) |
| Total | 145 (64.4%) | 80 (35.6%) |
Housing Structures by Number of Rooms in Clintonville borough
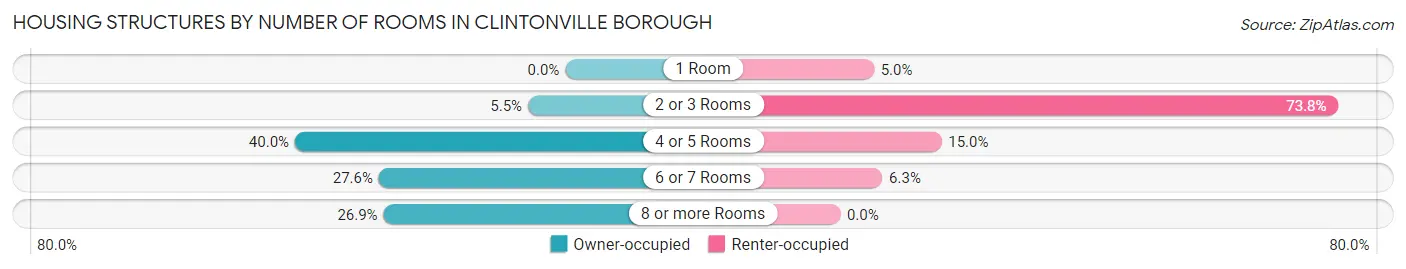
| Number of Rooms | Owner-occupied | Renter-occupied |
| 1 Room | 0 (0.0%) | 4 (5.0%) |
| 2 or 3 Rooms | 8 (5.5%) | 59 (73.8%) |
| 4 or 5 Rooms | 58 (40.0%) | 12 (15.0%) |
| 6 or 7 Rooms | 40 (27.6%) | 5 (6.2%) |
| 8 or more Rooms | 39 (26.9%) | 0 (0.0%) |
| Total | 145 (100.0%) | 80 (100.0%) |
Housing Structure by Heating Type in Clintonville borough
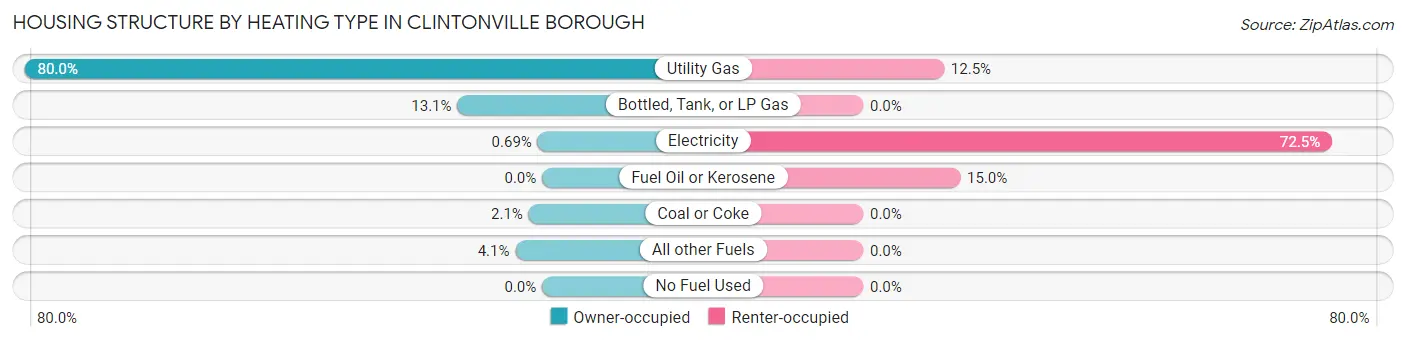
| Heating Type | Owner-occupied | Renter-occupied |
| Utility Gas | 116 (80.0%) | 10 (12.5%) |
| Bottled, Tank, or LP Gas | 19 (13.1%) | 0 (0.0%) |
| Electricity | 1 (0.7%) | 58 (72.5%) |
| Fuel Oil or Kerosene | 0 (0.0%) | 12 (15.0%) |
| Coal or Coke | 3 (2.1%) | 0 (0.0%) |
| All other Fuels | 6 (4.1%) | 0 (0.0%) |
| No Fuel Used | 0 (0.0%) | 0 (0.0%) |
| Total | 145 (100.0%) | 80 (100.0%) |
Household Vehicle Usage in Clintonville borough
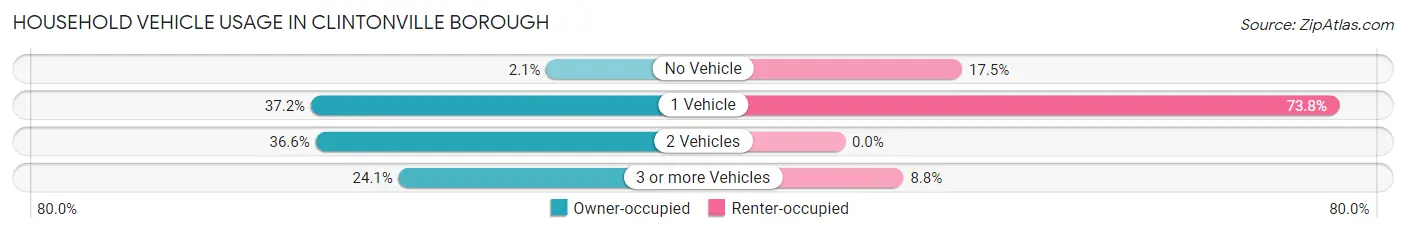
| Vehicles per Household | Owner-occupied | Renter-occupied |
| No Vehicle | 3 (2.1%) | 14 (17.5%) |
| 1 Vehicle | 54 (37.2%) | 59 (73.8%) |
| 2 Vehicles | 53 (36.5%) | 0 (0.0%) |
| 3 or more Vehicles | 35 (24.1%) | 7 (8.7%) |
| Total | 145 (100.0%) | 80 (100.0%) |
Real Estate & Mortgages in Clintonville borough
Real Estate and Mortgage Overview in Clintonville borough
| Characteristic | Without Mortgage | With Mortgage |
| Housing Units | 80 | 65 |
| Median Property Value | $92,000 | $90,700 |
| Median Household Income | $102,778 | $4 |
| Monthly Housing Costs | $630 | $0 |
| Real Estate Taxes | $1,000 | $0 |
Property Value by Mortgage Status in Clintonville borough
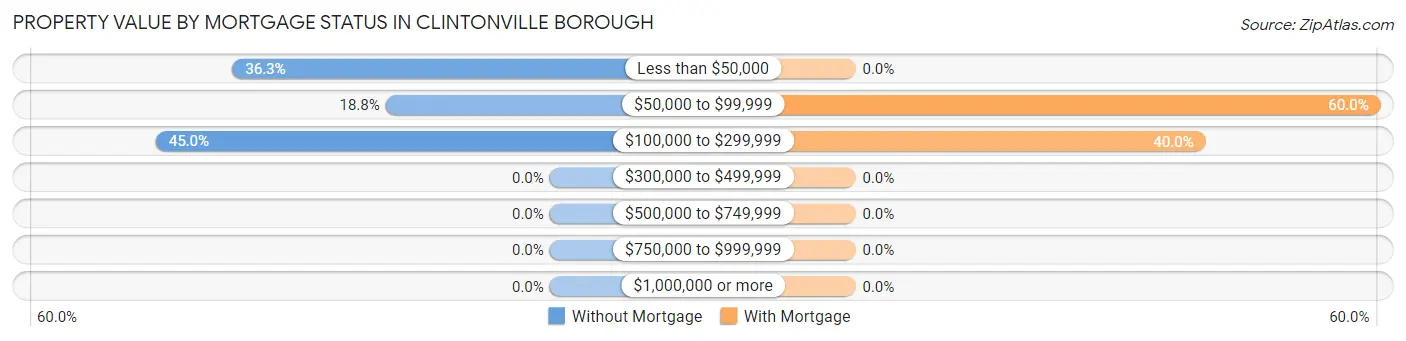
| Property Value | Without Mortgage | With Mortgage |
| Less than $50,000 | 29 (36.2%) | 0 (0.0%) |
| $50,000 to $99,999 | 15 (18.8%) | 39 (60.0%) |
| $100,000 to $299,999 | 36 (45.0%) | 26 (40.0%) |
| $300,000 to $499,999 | 0 (0.0%) | 0 (0.0%) |
| $500,000 to $749,999 | 0 (0.0%) | 0 (0.0%) |
| $750,000 to $999,999 | 0 (0.0%) | 0 (0.0%) |
| $1,000,000 or more | 0 (0.0%) | 0 (0.0%) |
| Total | 80 (100.0%) | 65 (100.0%) |
Household Income by Mortgage Status in Clintonville borough
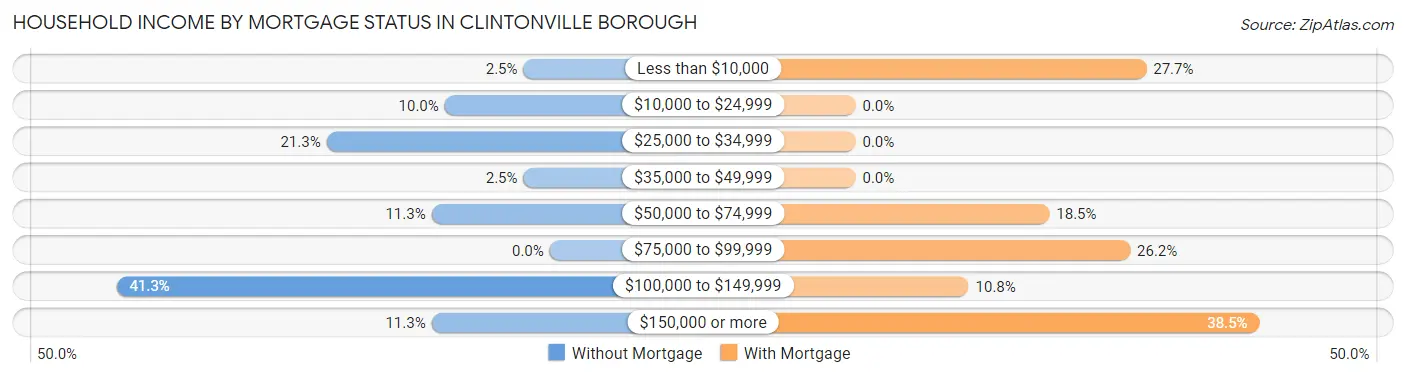
| Household Income | Without Mortgage | With Mortgage |
| Less than $10,000 | 2 (2.5%) | 18 (27.7%) |
| $10,000 to $24,999 | 8 (10.0%) | 0 (0.0%) |
| $25,000 to $34,999 | 17 (21.2%) | 0 (0.0%) |
| $35,000 to $49,999 | 2 (2.5%) | 0 (0.0%) |
| $50,000 to $74,999 | 9 (11.3%) | 12 (18.5%) |
| $75,000 to $99,999 | 0 (0.0%) | 17 (26.2%) |
| $100,000 to $149,999 | 33 (41.2%) | 7 (10.8%) |
| $150,000 or more | 9 (11.3%) | 25 (38.5%) |
| Total | 80 (100.0%) | 65 (100.0%) |
Property Value to Household Income Ratio in Clintonville borough
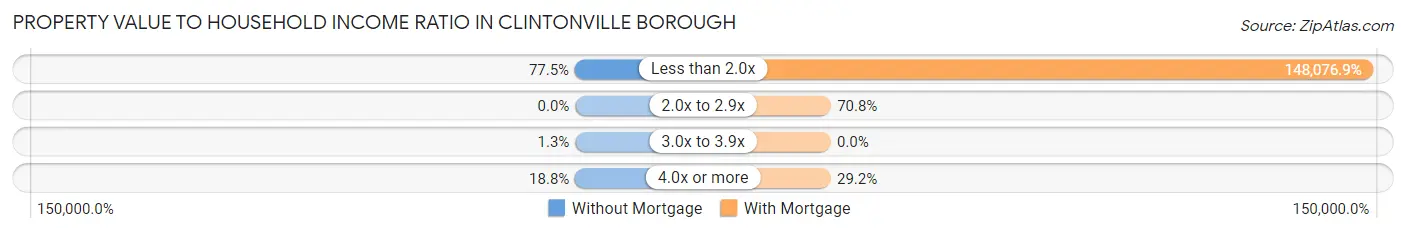
| Value-to-Income Ratio | Without Mortgage | With Mortgage |
| Less than 2.0x | 62 (77.5%) | 96,250 (148,076.9%) |
| 2.0x to 2.9x | 0 (0.0%) | 46 (70.8%) |
| 3.0x to 3.9x | 1 (1.3%) | 0 (0.0%) |
| 4.0x or more | 15 (18.8%) | 19 (29.2%) |
| Total | 80 (100.0%) | 65 (100.0%) |
Real Estate Taxes by Mortgage Status in Clintonville borough
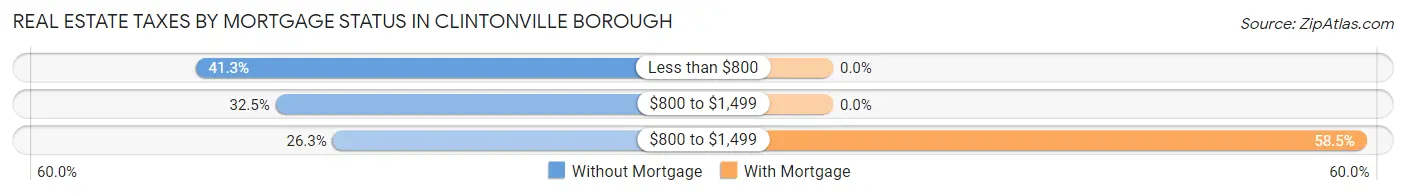
| Property Taxes | Without Mortgage | With Mortgage |
| Less than $800 | 33 (41.2%) | 0 (0.0%) |
| $800 to $1,499 | 26 (32.5%) | 0 (0.0%) |
| $800 to $1,499 | 21 (26.3%) | 38 (58.5%) |
| Total | 80 (100.0%) | 65 (100.0%) |
Health & Disability in Clintonville borough
Health Insurance Coverage by Age in Clintonville borough
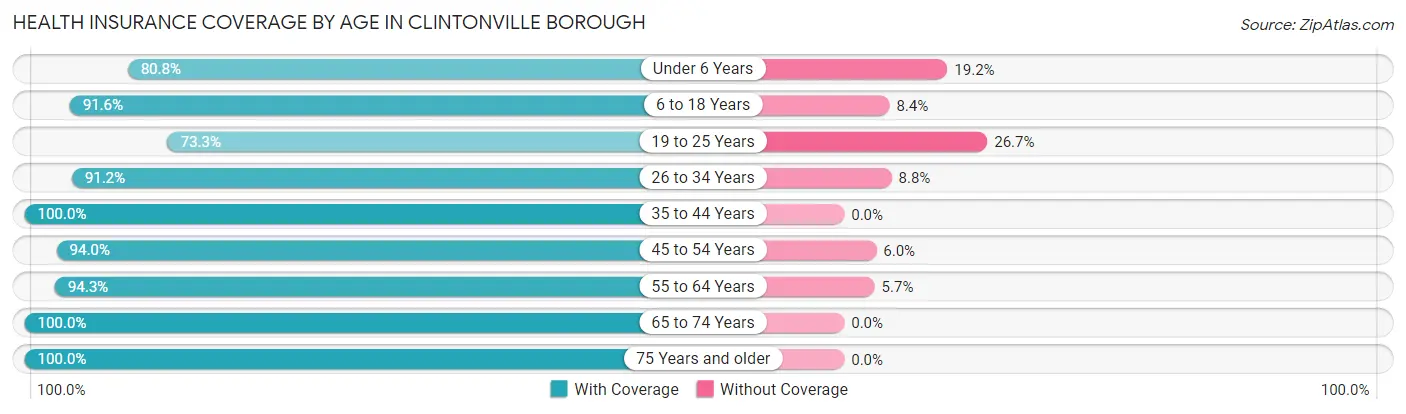
| Age Bracket | With Coverage | Without Coverage |
| Under 6 Years | 21 (80.8%) | 5 (19.2%) |
| 6 to 18 Years | 76 (91.6%) | 7 (8.4%) |
| 19 to 25 Years | 22 (73.3%) | 8 (26.7%) |
| 26 to 34 Years | 31 (91.2%) | 3 (8.8%) |
| 35 to 44 Years | 88 (100.0%) | 0 (0.0%) |
| 45 to 54 Years | 63 (94.0%) | 4 (6.0%) |
| 55 to 64 Years | 100 (94.3%) | 6 (5.7%) |
| 65 to 74 Years | 41 (100.0%) | 0 (0.0%) |
| 75 Years and older | 23 (100.0%) | 0 (0.0%) |
| Total | 465 (93.4%) | 33 (6.6%) |
Health Insurance Coverage by Citizenship Status in Clintonville borough
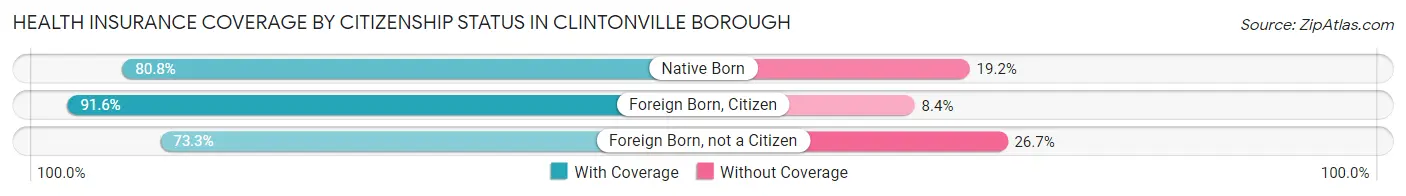
| Citizenship Status | With Coverage | Without Coverage |
| Native Born | 21 (80.8%) | 5 (19.2%) |
| Foreign Born, Citizen | 76 (91.6%) | 7 (8.4%) |
| Foreign Born, not a Citizen | 22 (73.3%) | 8 (26.7%) |
Health Insurance Coverage by Household Income in Clintonville borough
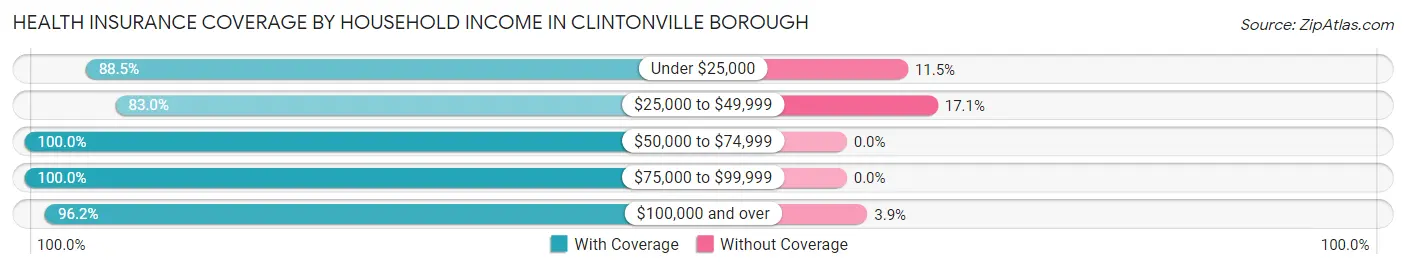
| Household Income | With Coverage | Without Coverage |
| Under $25,000 | 85 (88.5%) | 11 (11.5%) |
| $25,000 to $49,999 | 73 (83.0%) | 15 (17.1%) |
| $50,000 to $74,999 | 107 (100.0%) | 0 (0.0%) |
| $75,000 to $99,999 | 25 (100.0%) | 0 (0.0%) |
| $100,000 and over | 175 (96.2%) | 7 (3.8%) |
Public vs Private Health Insurance Coverage by Age in Clintonville borough
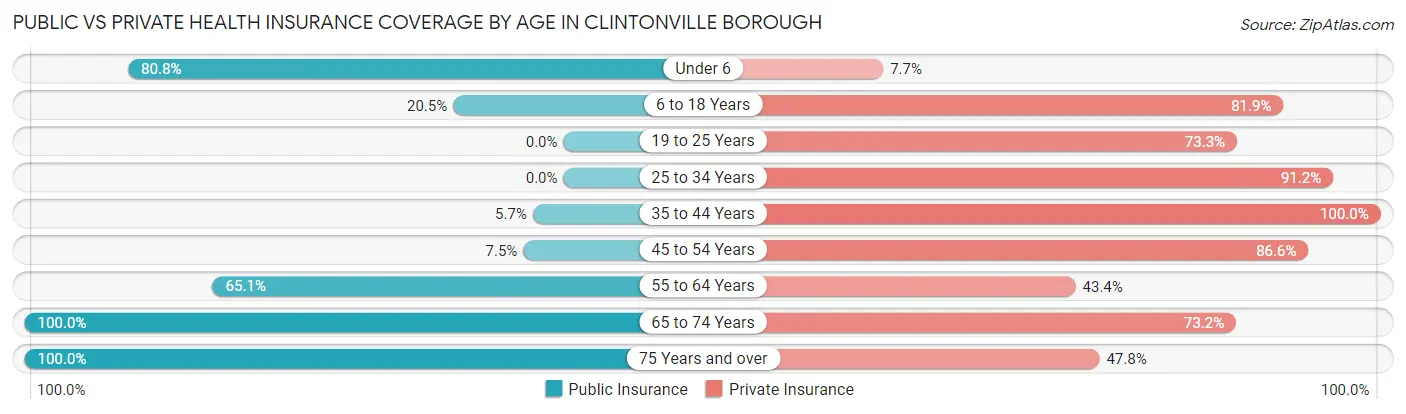
| Age Bracket | Public Insurance | Private Insurance |
| Under 6 | 21 (80.8%) | 2 (7.7%) |
| 6 to 18 Years | 17 (20.5%) | 68 (81.9%) |
| 19 to 25 Years | 0 (0.0%) | 22 (73.3%) |
| 25 to 34 Years | 0 (0.0%) | 31 (91.2%) |
| 35 to 44 Years | 5 (5.7%) | 88 (100.0%) |
| 45 to 54 Years | 5 (7.5%) | 58 (86.6%) |
| 55 to 64 Years | 69 (65.1%) | 46 (43.4%) |
| 65 to 74 Years | 41 (100.0%) | 30 (73.2%) |
| 75 Years and over | 23 (100.0%) | 11 (47.8%) |
| Total | 181 (36.3%) | 356 (71.5%) |
Disability Status by Sex by Age in Clintonville borough
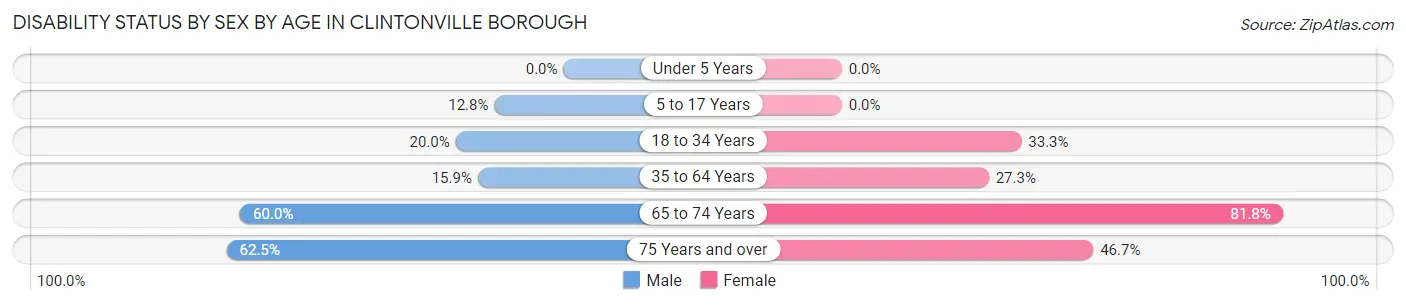
| Age Bracket | Male | Female |
| Under 5 Years | 0 (0.0%) | 0 (0.0%) |
| 5 to 17 Years | 5 (12.8%) | 0 (0.0%) |
| 18 to 34 Years | 5 (20.0%) | 15 (33.3%) |
| 35 to 64 Years | 17 (15.9%) | 42 (27.3%) |
| 65 to 74 Years | 18 (60.0%) | 9 (81.8%) |
| 75 Years and over | 5 (62.5%) | 7 (46.7%) |
Disability Class by Sex by Age in Clintonville borough
Disability Class: Hearing Difficulty
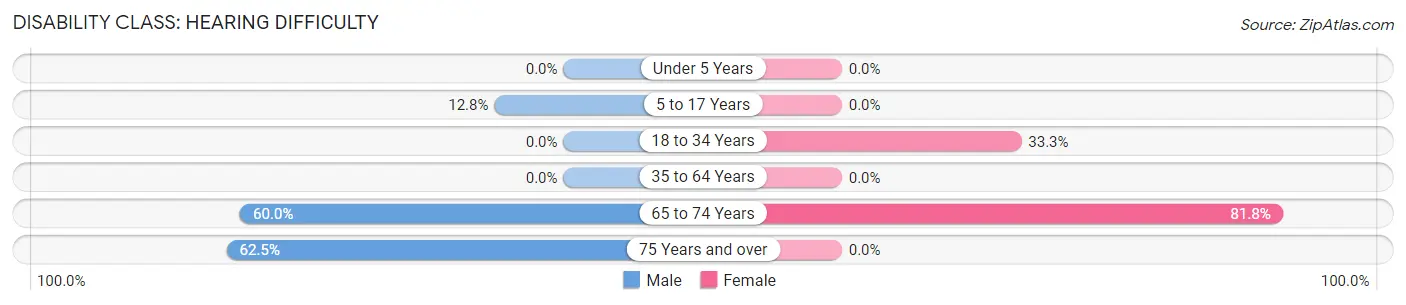
| Age Bracket | Male | Female |
| Under 5 Years | 0 (0.0%) | 0 (0.0%) |
| 5 to 17 Years | 5 (12.8%) | 0 (0.0%) |
| 18 to 34 Years | 0 (0.0%) | 15 (33.3%) |
| 35 to 64 Years | 0 (0.0%) | 0 (0.0%) |
| 65 to 74 Years | 18 (60.0%) | 9 (81.8%) |
| 75 Years and over | 5 (62.5%) | 0 (0.0%) |
Disability Class: Vision Difficulty
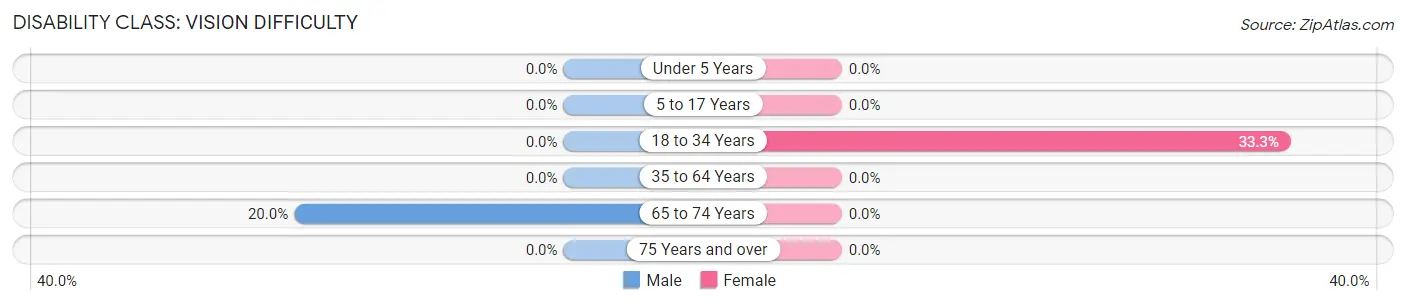
| Age Bracket | Male | Female |
| Under 5 Years | 0 (0.0%) | 0 (0.0%) |
| 5 to 17 Years | 0 (0.0%) | 0 (0.0%) |
| 18 to 34 Years | 0 (0.0%) | 15 (33.3%) |
| 35 to 64 Years | 0 (0.0%) | 0 (0.0%) |
| 65 to 74 Years | 6 (20.0%) | 0 (0.0%) |
| 75 Years and over | 0 (0.0%) | 0 (0.0%) |
Disability Class: Cognitive Difficulty
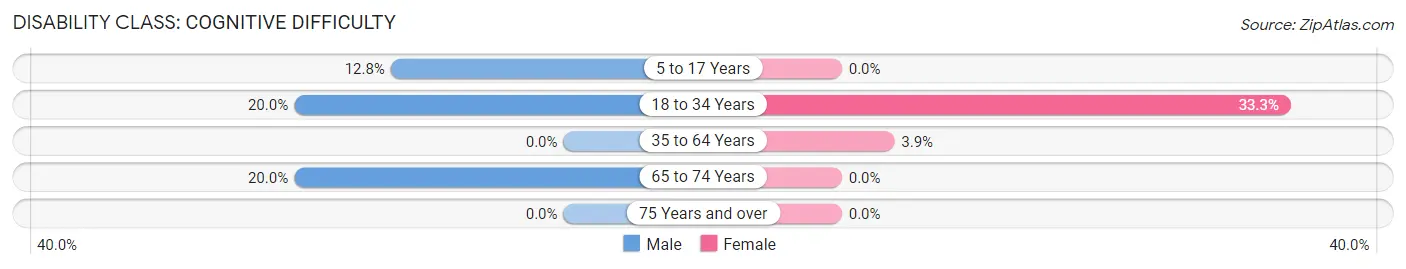
| Age Bracket | Male | Female |
| 5 to 17 Years | 5 (12.8%) | 0 (0.0%) |
| 18 to 34 Years | 5 (20.0%) | 15 (33.3%) |
| 35 to 64 Years | 0 (0.0%) | 6 (3.9%) |
| 65 to 74 Years | 6 (20.0%) | 0 (0.0%) |
| 75 Years and over | 0 (0.0%) | 0 (0.0%) |
Disability Class: Ambulatory Difficulty
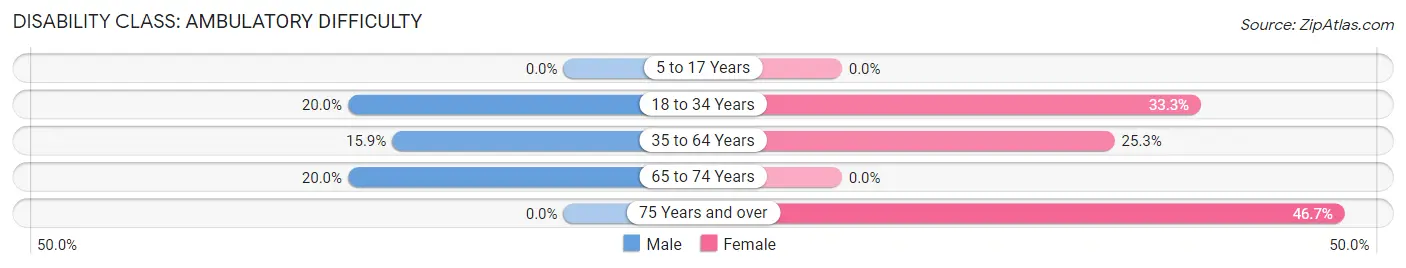
| Age Bracket | Male | Female |
| 5 to 17 Years | 0 (0.0%) | 0 (0.0%) |
| 18 to 34 Years | 5 (20.0%) | 15 (33.3%) |
| 35 to 64 Years | 17 (15.9%) | 39 (25.3%) |
| 65 to 74 Years | 6 (20.0%) | 0 (0.0%) |
| 75 Years and over | 0 (0.0%) | 7 (46.7%) |
Disability Class: Self-Care Difficulty
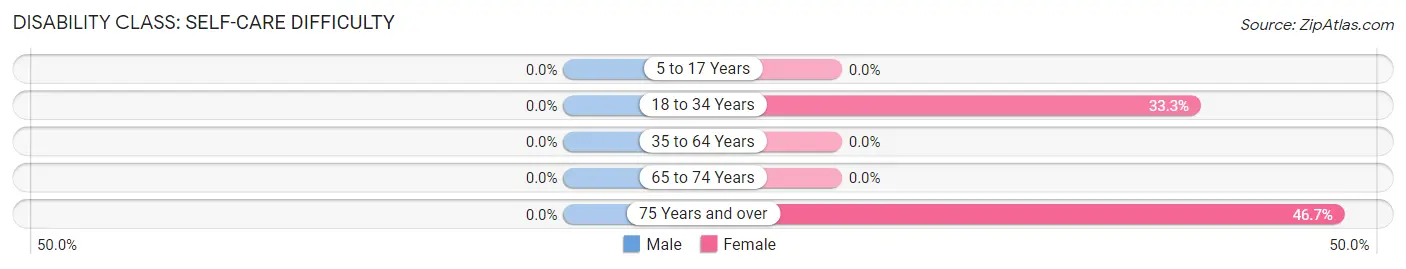
| Age Bracket | Male | Female |
| 5 to 17 Years | 0 (0.0%) | 0 (0.0%) |
| 18 to 34 Years | 0 (0.0%) | 15 (33.3%) |
| 35 to 64 Years | 0 (0.0%) | 0 (0.0%) |
| 65 to 74 Years | 0 (0.0%) | 0 (0.0%) |
| 75 Years and over | 0 (0.0%) | 7 (46.7%) |
Technology Access in Clintonville borough
Computing Device Access in Clintonville borough
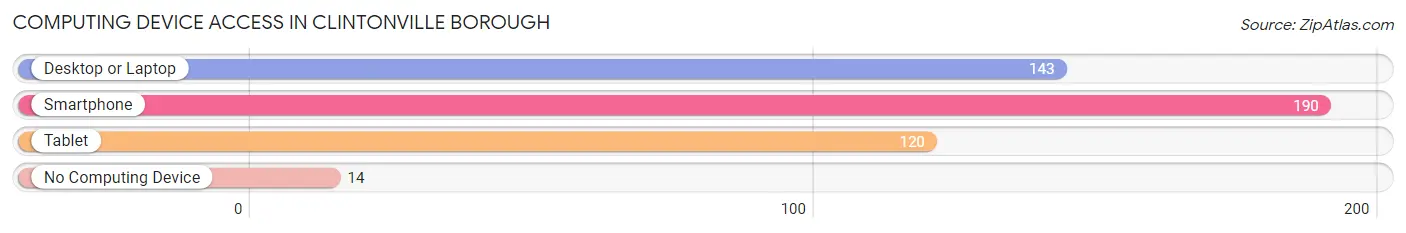
| Device Type | # Households | % Households |
| Desktop or Laptop | 143 | 63.6% |
| Smartphone | 190 | 84.4% |
| Tablet | 120 | 53.3% |
| No Computing Device | 14 | 6.2% |
| Total | 225 | 100.0% |
Internet Access in Clintonville borough
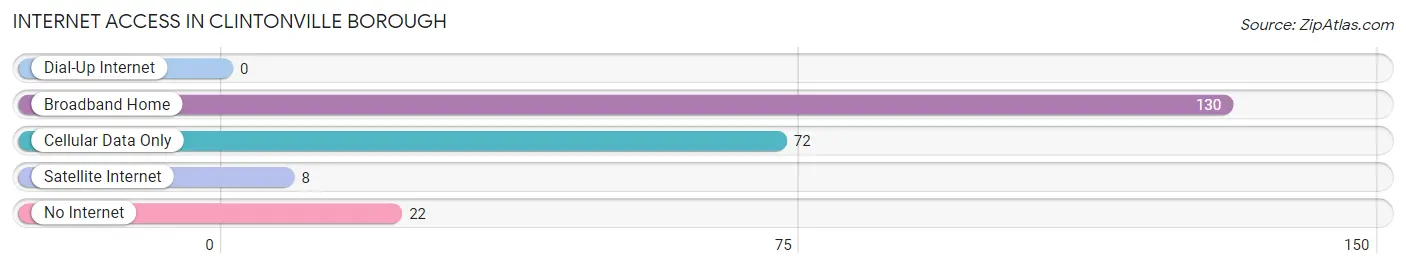
| Internet Type | # Households | % Households |
| Dial-Up Internet | 0 | 0.0% |
| Broadband Home | 130 | 57.8% |
| Cellular Data Only | 72 | 32.0% |
| Satellite Internet | 8 | 3.6% |
| No Internet | 22 | 9.8% |
| Total | 225 | 100.0% |
Clintonville borough Summary
Introduction
Located in the heart of Pennsylvania’s Susquehanna Valley, the borough of Clintonville is a small, rural community with a population of just over 1,000 people. The borough is situated in the northern part of Northumberland County, and is bordered by the Susquehanna River to the east and the West Branch of the Susquehanna River to the west. The borough is home to a variety of businesses, including a grocery store, a hardware store, a restaurant, and a few other small businesses. The borough is also home to a number of churches, a library, and a post office.
History
The borough of Clintonville was founded in 1845 by a group of settlers from the nearby town of Milton. The settlers named the borough after DeWitt Clinton, the former governor of New York. The borough was officially incorporated in 1851.
In the late 19th century, the borough was a thriving agricultural community, with many of the residents working in the local farms and orchards. The borough also had a number of small businesses, including a sawmill, a gristmill, and a tannery.
In the early 20th century, the borough began to experience a decline in population as many of the residents moved away to larger cities in search of better job opportunities. The borough’s population continued to decline until the 1950s, when the population began to slowly increase again.
Geography
The borough of Clintonville is located in the northern part of Northumberland County, Pennsylvania. The borough is bordered by the Susquehanna River to the east and the West Branch of the Susquehanna River to the west. The borough is located approximately 25 miles north of Harrisburg, the state capital.
The borough is situated in a rural area, with rolling hills and forests. The borough is home to a variety of wildlife, including deer, foxes, and other small animals. The borough is also home to a number of small streams and creeks, which provide a habitat for a variety of fish and other aquatic life.
Economy
The economy of Clintonville is largely based on agriculture and tourism. The borough is home to a number of small farms, which produce a variety of crops, including corn, soybeans, and hay. The borough is also home to a number of orchards, which produce apples, peaches, and other fruits.
The borough is also home to a number of small businesses, including a grocery store, a hardware store, a restaurant, and a few other small businesses. The borough is also home to a number of churches, a library, and a post office.
Demographics
As of the 2010 census, the population of Clintonville was 1,072. The population is largely white (97.2%), with a small percentage of African Americans (1.2%) and Hispanics (1.6%). The median household income in the borough is $41,250, and the median age is 43.
Conclusion
The borough of Clintonville is a small, rural community located in the northern part of Northumberland County, Pennsylvania. The borough is home to a variety of businesses, including a grocery store, a hardware store, a restaurant, and a few other small businesses. The borough is also home to a number of churches, a library, and a post office. The economy of the borough is largely based on agriculture and tourism, and the population is largely white.
Common Questions
What is the Total Population of Clintonville borough?
Total Population of Clintonville borough is 498.
What is the Total Male Population of Clintonville borough?
Total Male Population of Clintonville borough is 228.
What is the Total Female Population of Clintonville borough?
Total Female Population of Clintonville borough is 270.
What is the Ratio of Males per 100 Females in Clintonville borough?
There are 84.44 Males per 100 Females in Clintonville borough.
What is the Ratio of Females per 100 Males in Clintonville borough?
There are 118.42 Females per 100 Males in Clintonville borough.
What is the Median Population Age in Clintonville borough?
Median Population Age in Clintonville borough is 43.0 Years.
What is the Average Family Size in Clintonville borough
Average Family Size in Clintonville borough is 3.1 People.
What is the Average Household Size in Clintonville borough
Average Household Size in Clintonville borough is 2.2 People.
What is Per Capita Income in Clintonville borough?
Per Capita income in Clintonville borough is $30,826.
What is the Median Family Income in Clintonville borough?
Median Family Income in Clintonville borough is $73,929.
What is the Median Household income in Clintonville borough?
Median Household Income in Clintonville borough is $46,875.
What is Income or Wage Gap in Clintonville borough?
Income or Wage Gap in Clintonville borough is 15.9%.
Women in Clintonville borough earn 84.1 cents for every dollar earned by a man.
What is Inequality or Gini Index in Clintonville borough?
Inequality or Gini Index in Clintonville borough is 0.41.
How Large is the Labor Force in Clintonville borough?
There are 233 People in the Labor Forcein in Clintonville borough.
What is the Percentage of People in the Labor Force in Clintonville borough?
56.1% of People are in the Labor Force in Clintonville borough.
What is the Unemployment Rate in Clintonville borough?
Unemployment Rate in Clintonville borough is 11.6%.