Zip Codes with the Highest Percentage of Population Employed in Security & Protection in Philadelphia, PA

RELATED REPORTS & OPTIONS

Security & Protection
Population
Families and Households
Female Fertility
Female Fertility (Unmarried)
Race (Community Size)
Race (Percentage)
Ancestry (Community Size)
AfghanAfricanAlaska NativeAlaskan AthabascanAlbanianAmericanApacheArabArgentineanArmenianAustralianAustrianBahamianBangladeshiBarbadianBasqueBelgianBelizeanBermudanBhutaneseBlackfeetBolivianBrazilianBritishBritish West IndianBulgarianBurmeseCajunCambodianCanadianCape VerdeanCarpatho RusynCelticCentral AmericanCentral American IndianCherokeeChickasawChileanChippewaChoctawColombianCosta RicanCreekCroatianCubanCypriotCzechCzechoslovakianDanishDelawareDominicanDutchEastern EuropeanEcuadorianEgyptianEnglishEstonianEthiopianEuropeanFilipinoFinnishFrenchFrench American IndianFrench CanadianGermanGerman RussianGhanaianGreekGuamanian / ChamorroGuatemalanGuyaneseHaitianHonduranHungarianIcelanderIndian (Asian)IndonesianInupiatIranianIraqiIrishIroquoisIsraeliItalianJamaicanJapaneseJordanianKenyanKoreanLaotianLatvianLebaneseLiberianLithuanianLumbeeMacedonianMalaysianMexicanMexican American IndianMongolianMoroccanNative HawaiianNavajoNew ZealanderNicaraguanNigerianNorthern EuropeanNorwegianOkinawanPakistaniPalestinianPanamanianParaguayanPennsylvania GermanPeruvianPolishPortuguesePotawatomiPuerto RicanRomanianRussianSalvadoranSamoanScandinavianScotch-IrishScottishSeminoleSenegaleseSerbianShoshoneSierra LeoneanSiouxSlavicSlovakSloveneSomaliSouth AfricanSouth AmericanSouth American IndianSpaniardSpanishSpanish AmericanSri LankanSubsaharan AfricanSudaneseSwedishSwissSyrianThaiTrinidadian and TobagonianTurkishU.S. Virgin IslanderUgandanUkrainianUruguayanVenezuelanVietnameseWelshWest IndianYugoslavian
Ancestry (Percentage)
AfghanAfricanAlaska NativeAlaskan AthabascanAlbanianAmericanApacheArabArgentineanArmenianAustralianAustrianBahamianBangladeshiBarbadianBasqueBelgianBelizeanBermudanBhutaneseBlackfeetBolivianBrazilianBritishBritish West IndianBulgarianBurmeseCajunCambodianCanadianCape VerdeanCarpatho RusynCelticCentral AmericanCentral American IndianCherokeeChickasawChileanChippewaChoctawColombianCosta RicanCreekCroatianCubanCypriotCzechCzechoslovakianDanishDelawareDominicanDutchEastern EuropeanEcuadorianEgyptianEnglishEstonianEthiopianEuropeanFilipinoFinnishFrenchFrench American IndianFrench CanadianGermanGerman RussianGhanaianGreekGuamanian / ChamorroGuatemalanGuyaneseHaitianHonduranHungarianIcelanderIndian (Asian)IndonesianInupiatIranianIraqiIrishIroquoisIsraeliItalianJamaicanJapaneseJordanianKenyanKoreanLaotianLatvianLebaneseLiberianLithuanianLumbeeMacedonianMalaysianMexicanMexican American IndianMongolianMoroccanNative HawaiianNavajoNew ZealanderNicaraguanNigerianNorthern EuropeanNorwegianOkinawanPakistaniPalestinianPanamanianParaguayanPennsylvania GermanPeruvianPolishPortuguesePotawatomiPuerto RicanRomanianRussianSalvadoranSamoanScandinavianScotch-IrishScottishSeminoleSenegaleseSerbianShoshoneSierra LeoneanSiouxSlavicSlovakSloveneSomaliSouth AfricanSouth AmericanSouth American IndianSpaniardSpanishSpanish AmericanSri LankanSubsaharan AfricanSudaneseSwedishSwissSyrianThaiTrinidadian and TobagonianTurkishU.S. Virgin IslanderUgandanUkrainianUruguayanVenezuelanVietnameseWelshWest IndianYugoslavian
Immigrant Origin (Total)
AfghanistanAfricaAlbaniaArgentinaArmeniaAsiaAustraliaAustriaBangladeshBarbadosBelarusBelgiumBelizeBoliviaBosnia and HerzegovinaBrazilBulgariaBurma / MyanmarCambodiaCameroonCanadaCaribbeanCentral AmericaChileChinaColombiaCongoCosta RicaCroatiaCubaCzechoslovakiaDenmarkDominicaDominican RepublicEastern AfricaEastern AsiaEastern EuropeEcuadorEgyptEl SalvadorEnglandEritreaEthiopiaEuropeFranceGermanyGhanaGreeceGrenadaGuatemalaGuyanaHaitiHondurasHong KongHungaryIndiaIndonesiaIranIraqIrelandIsraelItalyJamaicaJapanJordanKazakhstanKenyaKoreaKuwaitLaosLatin AmericaLatviaLebanonLiberiaLithuaniaMalaysiaMexicoMiddle AfricaMoldovaMoroccoNepalNetherlandsNicaraguaNigeriaNorth MacedoniaNorthern AfricaNorthern EuropeNorwayOceaniaPakistanPanamaPeruPhilippinesPolandPortugalRomaniaRussiaSaudi ArabiaScotlandSenegalSerbiaSierra LeoneSingaporeSouth AfricaSouth AmericaSouth Central AsiaSouth Eastern AsiaSouthern EuropeSpainSri LankaSt. Vincent and the GrenadinesSudanSwedenSwitzerlandSyriaTaiwanThailandTrinidad and TobagoTurkeyUkraineUruguayUzbekistanVenezuelaVietnamWest IndiesWestern AfricaWestern AsiaWestern EuropeZaireZimbabwe
Immigrant Origin (Percentage)
AfghanistanAfricaAlbaniaArgentinaArmeniaAsiaAustraliaAustriaBangladeshBarbadosBelarusBelgiumBelizeBoliviaBosnia and HerzegovinaBrazilBulgariaBurma / MyanmarCambodiaCameroonCanadaCaribbeanCentral AmericaChileChinaColombiaCongoCosta RicaCroatiaCubaCzechoslovakiaDenmarkDominicaDominican RepublicEastern AfricaEastern AsiaEastern EuropeEcuadorEgyptEl SalvadorEnglandEritreaEthiopiaEuropeFranceGermanyGhanaGreeceGrenadaGuatemalaGuyanaHaitiHondurasHong KongHungaryIndiaIndonesiaIranIraqIrelandIsraelItalyJamaicaJapanJordanKazakhstanKenyaKoreaKuwaitLaosLatin AmericaLatviaLebanonLiberiaLithuaniaMalaysiaMexicoMiddle AfricaMoldovaMoroccoNepalNetherlandsNicaraguaNigeriaNorth MacedoniaNorthern AfricaNorthern EuropeNorwayOceaniaPakistanPanamaPeruPhilippinesPolandPortugalRomaniaRussiaSaudi ArabiaScotlandSenegalSerbiaSierra LeoneSingaporeSouth AfricaSouth AmericaSouth Central AsiaSouth Eastern AsiaSouthern EuropeSpainSri LankaSt. Vincent and the GrenadinesSudanSwedenSwitzerlandSyriaTaiwanThailandTrinidad and TobagoTurkeyUkraineUruguayUzbekistanVenezuelaVietnamWest IndiesWestern AfricaWestern AsiaWestern EuropeZaireZimbabwe
Income
Income (Families)
Income (Households)
Poverty
Poverty (Families)
Unemployment
Employment Occupations
Employment Industries
Employer Class
Commute Time
Commute Means
School Enrollment
Education by Degree Field
Occupancy
Finances
Physical Characteristics
Philadelphia
Compare Zip Codes
Comparison Subject

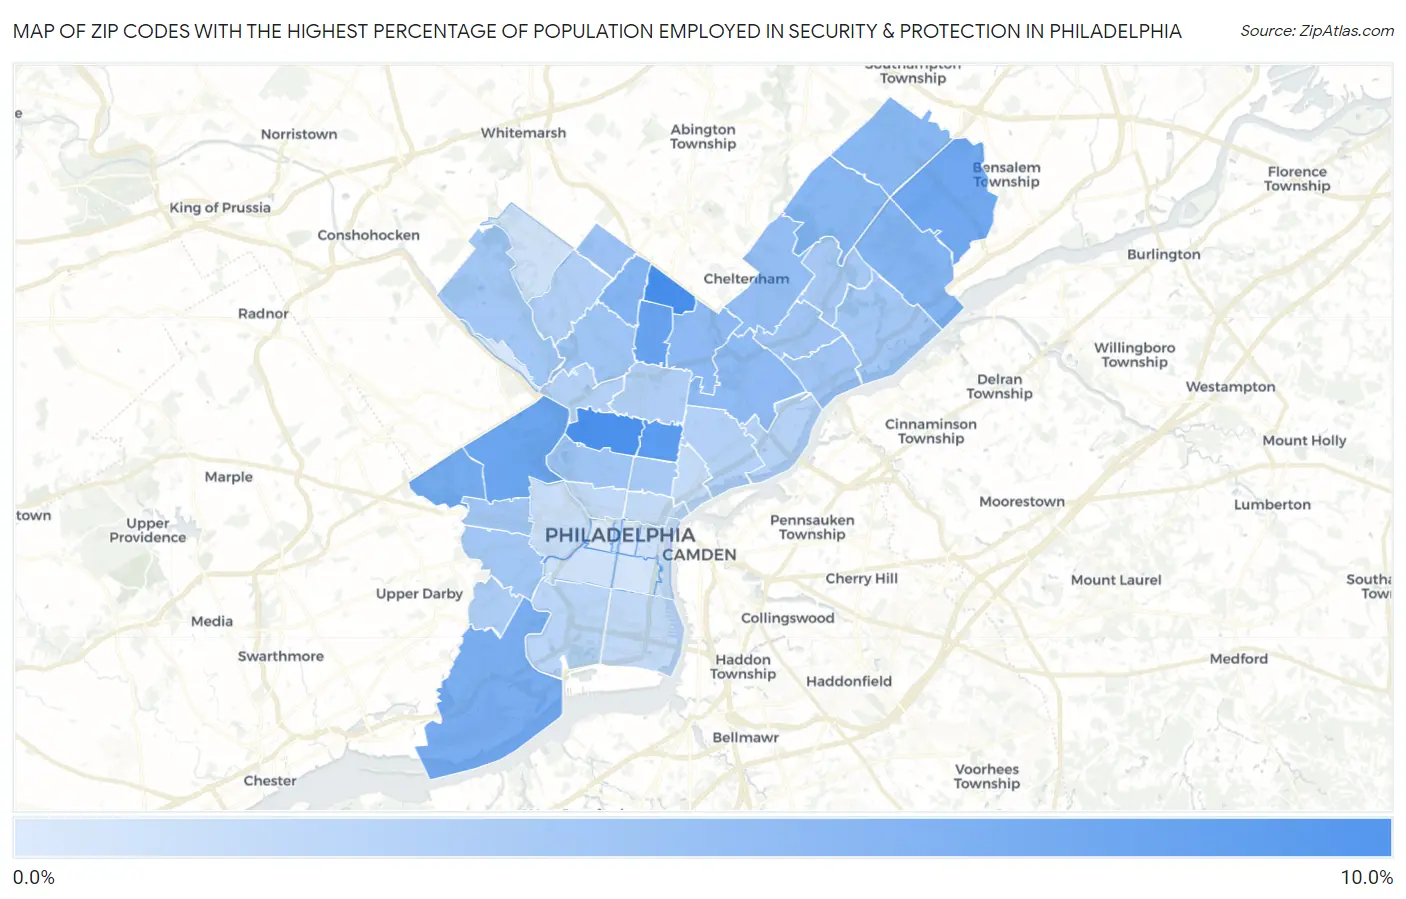
Map of Zip Codes with the Highest Percentage of Population Employed in Security & Protection in Philadelphia

0.0%
10.0%
Zip Codes with the Highest Percentage of Population Employed in Security & Protection in Philadelphia Map

Zip Codes with the Highest Percentage of Population Employed in Security & Protection in Philadelphia, PA

Zip Code % Employed vs State vs National
1.191268.6%2.0%(+6.57)#452.1%(+6.44)#986
2.191328.5%2.0%(+6.44)#522.1%(+6.31)#1,019
3.191337.5%2.0%(+5.48)#632.1%(+5.36)#1,334
4.191416.7%2.0%(+4.71)#832.1%(+4.58)#1,672
5.191316.4%2.0%(+4.41)#892.1%(+4.28)#1,815
6.191546.3%2.0%(+4.24)#912.1%(+4.11)#1,919
7.191515.9%2.0%(+3.89)#1002.1%(+3.77)#2,138
8.191535.6%2.0%(+3.60)#1102.1%(+3.48)#2,354
9.191145.2%2.0%(+3.20)#1232.1%(+3.07)#2,696
10.191385.0%2.0%(+3.03)#1322.1%(+2.90)#2,870
11.191165.0%2.0%(+2.93)#1362.1%(+2.80)#2,978
12.191154.9%2.0%(+2.90)#1372.1%(+2.77)#3,028
13.191204.6%2.0%(+2.53)#1542.1%(+2.40)#3,521
14.191244.5%2.0%(+2.52)#1582.1%(+2.40)#3,541
15.191114.3%2.0%(+2.26)#1752.1%(+2.13)#3,977
16.191503.9%2.0%(+1.84)#2112.1%(+1.72)#4,768
17.191443.7%2.0%(+1.65)#2312.1%(+1.52)#5,224
18.191213.6%2.0%(+1.63)#2352.1%(+1.50)#5,285
19.191393.5%2.0%(+1.52)#2452.1%(+1.39)#5,584
20.191353.5%2.0%(+1.48)#2522.1%(+1.35)#5,667
21.191493.5%2.0%(+1.46)#2562.1%(+1.34)#5,710
22.191363.4%2.0%(+1.38)#2692.1%(+1.25)#5,936
23.191433.3%2.0%(+1.31)#2772.1%(+1.18)#6,153
24.191283.3%2.0%(+1.28)#2862.1%(+1.15)#6,232
25.191523.3%2.0%(+1.26)#2892.1%(+1.14)#6,296
26.191223.0%2.0%(+1.03)#3252.1%(+0.897)#7,059
27.191422.9%2.0%(+0.831)#3672.1%(+0.703)#7,859
28.191402.8%2.0%(+0.740)#3902.1%(+0.612)#8,276
29.191192.6%2.0%(+0.627)#4192.1%(+0.498)#8,786
30.191342.5%2.0%(+0.461)#4542.1%(+0.333)#9,611
31.191292.5%2.0%(+0.443)#4572.1%(+0.314)#9,715
32.191372.3%2.0%(+0.282)#5142.1%(+0.154)#10,638
33.191452.1%2.0%(+0.072)#5922.1%(-0.057)#11,969
34.191481.8%2.0%(-0.262)#7282.1%(-0.391)#14,250
35.191301.7%2.0%(-0.321)#7482.1%(-0.450)#14,697
36.191251.6%2.0%(-0.403)#7832.1%(-0.532)#15,286
37.191231.5%2.0%(-0.486)#8212.1%(-0.615)#15,917
38.191041.4%2.0%(-0.663)#8902.1%(-0.792)#17,285
39.191021.2%2.0%(-0.828)#9592.1%(-0.957)#18,567
40.191461.0%2.0%(-1.01)#1,0382.1%(-1.14)#19,934
41.191180.94%2.0%(-1.08)#1,0762.1%(-1.21)#20,524
42.191060.81%2.0%(-1.21)#1,1232.1%(-1.34)#21,375
43.191470.70%2.0%(-1.32)#1,1602.1%(-1.44)#22,052
44.191270.46%2.0%(-1.56)#1,2332.1%(-1.68)#23,423
45.191070.41%2.0%(-1.61)#1,2432.1%(-1.74)#23,686
46.191030.21%2.0%(-1.81)#1,2902.1%(-1.94)#24,493

Common Questions

What are the Top 10 Zip Codes with the Highest Percentage of Population Employed in Security & Protection in Philadelphia, PA?
Top 10 Zip Codes with the Highest Percentage of Population Employed in Security & Protection in Philadelphia, PA are:
#1
8.6%
#2
8.5%
#3
7.5%
#4
6.7%
#5
6.4%
#6
6.3%
#7
5.9%
#8
5.6%
#9
5.2%
#10
5.0%
What zip code has the Highest Percentage of Population Employed in Security & Protection in Philadelphia, PA?
19126 has the Highest Percentage of Population Employed in Security & Protection in Philadelphia, PA with 8.6%.
What is the Percentage of Population Employed in Security & Protection in Philadelphia, PA?
Percentage of Population Employed in Security & Protection in Philadelphia is 3.4%.
What is the Percentage of Population Employed in Security & Protection in Pennsylvania?
Percentage of Population Employed in Security & Protection in Pennsylvania is 2.0%.
What is the Percentage of Population Employed in Security & Protection in the United States?
Percentage of Population Employed in Security & Protection in the United States is 2.1%.