South Uniontown, PA
South Uniontown Map
South Uniontown Overview
1,216
TOTAL POPULATION
598
MALE POPULATION
618
FEMALE POPULATION
96.76
MALES / 100 FEMALES
103.34
FEMALES / 100 MALES
49.4
MEDIAN AGE
2.5
AVG FAMILY SIZE
2.1
AVG HOUSEHOLD SIZE
$37,244
PER CAPITA INCOME
$93,173
AVG FAMILY INCOME
$70,489
AVG HOUSEHOLD INCOME
58.2%
WAGE / INCOME GAP [ % ]
41.8¢/ $1
WAGE / INCOME GAP [ $ ]
0.29
INEQUALITY / GINI INDEX
576
LABOR FORCE [ PEOPLE ]
55.1%
PERCENT IN LABOR FORCE
1.2%
UNEMPLOYMENT RATE
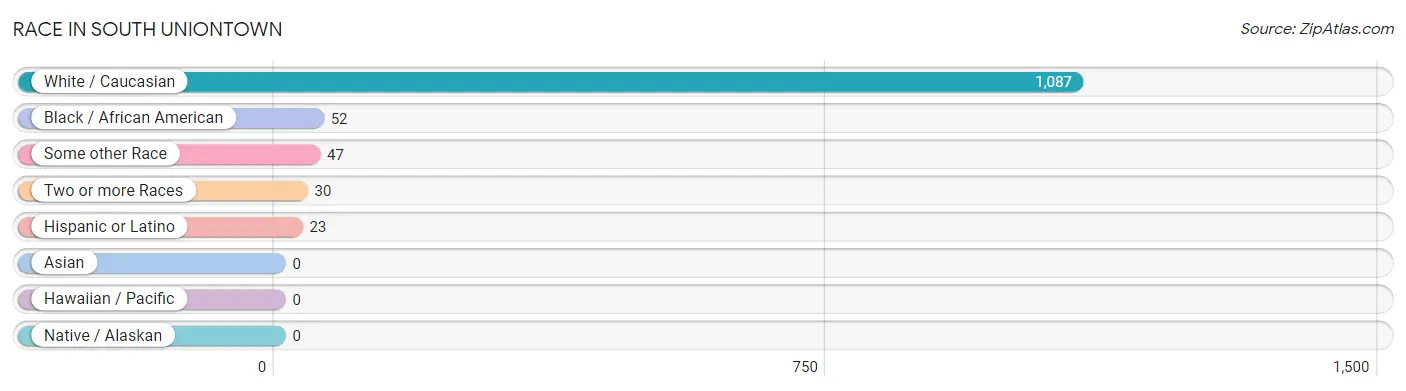
Race in South Uniontown
The most populous races in South Uniontown are White / Caucasian (1,087 | 89.4%), Black / African American (52 | 4.3%), and Some other Race (47 | 3.9%).
| Race | # Population | % Population |
| Asian | 0 | 0.0% |
| Black / African American | 52 | 4.3% |
| Hawaiian / Pacific | 0 | 0.0% |
| Hispanic or Latino | 23 | 1.9% |
| Native / Alaskan | 0 | 0.0% |
| White / Caucasian | 1,087 | 89.4% |
| Two or more Races | 30 | 2.5% |
| Some other Race | 47 | 3.9% |
| Total | 1,216 | 100.0% |
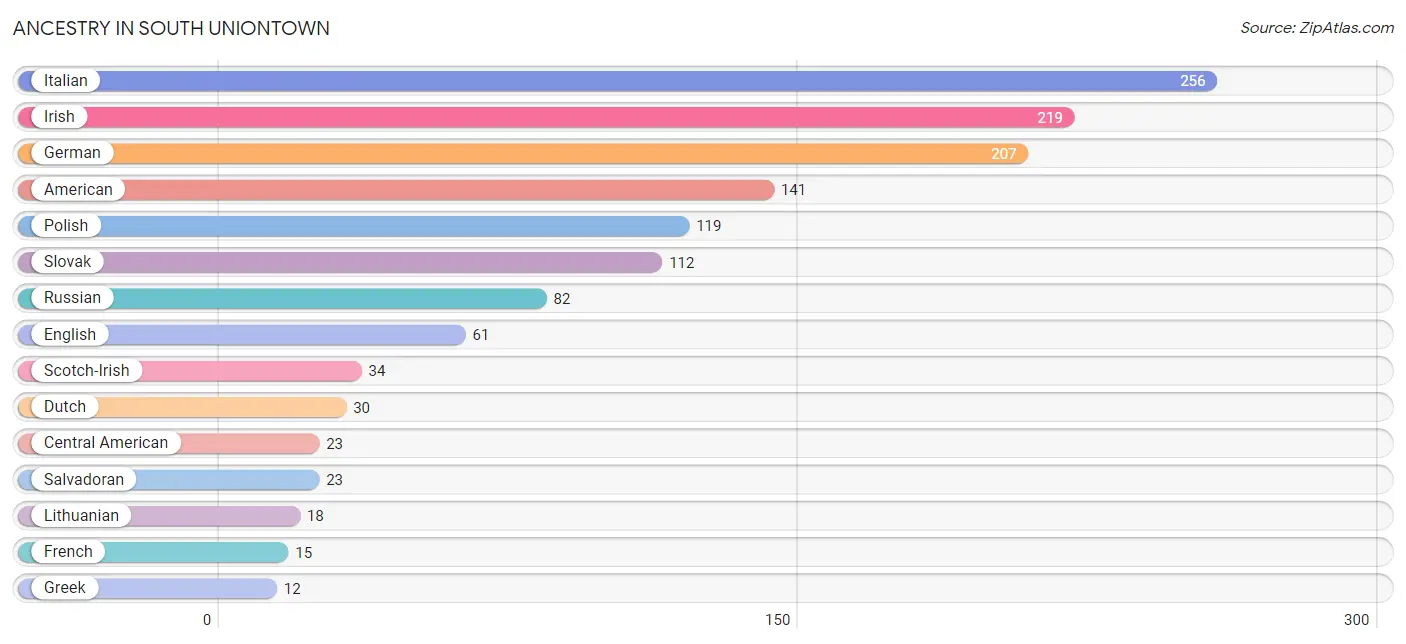
Ancestry in South Uniontown
The most populous ancestries reported in South Uniontown are Italian (256 | 21.0%), Irish (219 | 18.0%), German (207 | 17.0%), American (141 | 11.6%), and Polish (119 | 9.8%), together accounting for 77.5% of all South Uniontown residents.
| Ancestry | # Population | % Population |
| American | 141 | 11.6% |
| Central American | 23 | 1.9% |
| Dutch | 30 | 2.5% |
| English | 61 | 5.0% |
| French | 15 | 1.2% |
| German | 207 | 17.0% |
| Greek | 12 | 1.0% |
| Irish | 219 | 18.0% |
| Italian | 256 | 21.0% |
| Korean | 10 | 0.8% |
| Lithuanian | 18 | 1.5% |
| Polish | 119 | 9.8% |
| Russian | 82 | 6.7% |
| Salvadoran | 23 | 1.9% |
| Scotch-Irish | 34 | 2.8% |
| Scottish | 7 | 0.6% |
| Slovak | 112 | 9.2% |
| Swedish | 7 | 0.6% |
| Ukrainian | 9 | 0.7% |
| Welsh | 11 | 0.9% | View All 20 Rows |
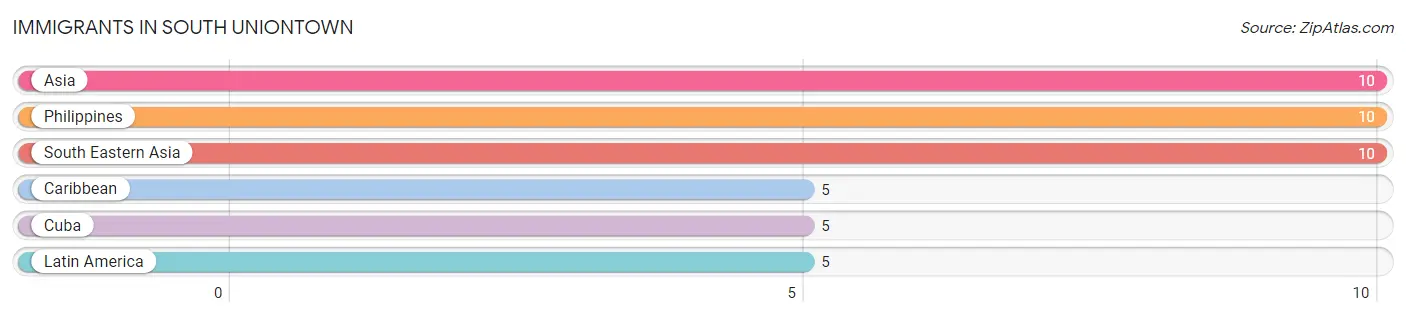
Immigrants in South Uniontown
The most numerous immigrant groups reported in South Uniontown came from Asia (10 | 0.8%), Philippines (10 | 0.8%), South Eastern Asia (10 | 0.8%), Caribbean (5 | 0.4%), and Cuba (5 | 0.4%), together accounting for 3.3% of all South Uniontown residents.
| Immigration Origin | # Population | % Population |
| Asia | 10 | 0.8% |
| Caribbean | 5 | 0.4% |
| Cuba | 5 | 0.4% |
| Latin America | 5 | 0.4% |
| Philippines | 10 | 0.8% |
| South Eastern Asia | 10 | 0.8% | View All 6 Rows |
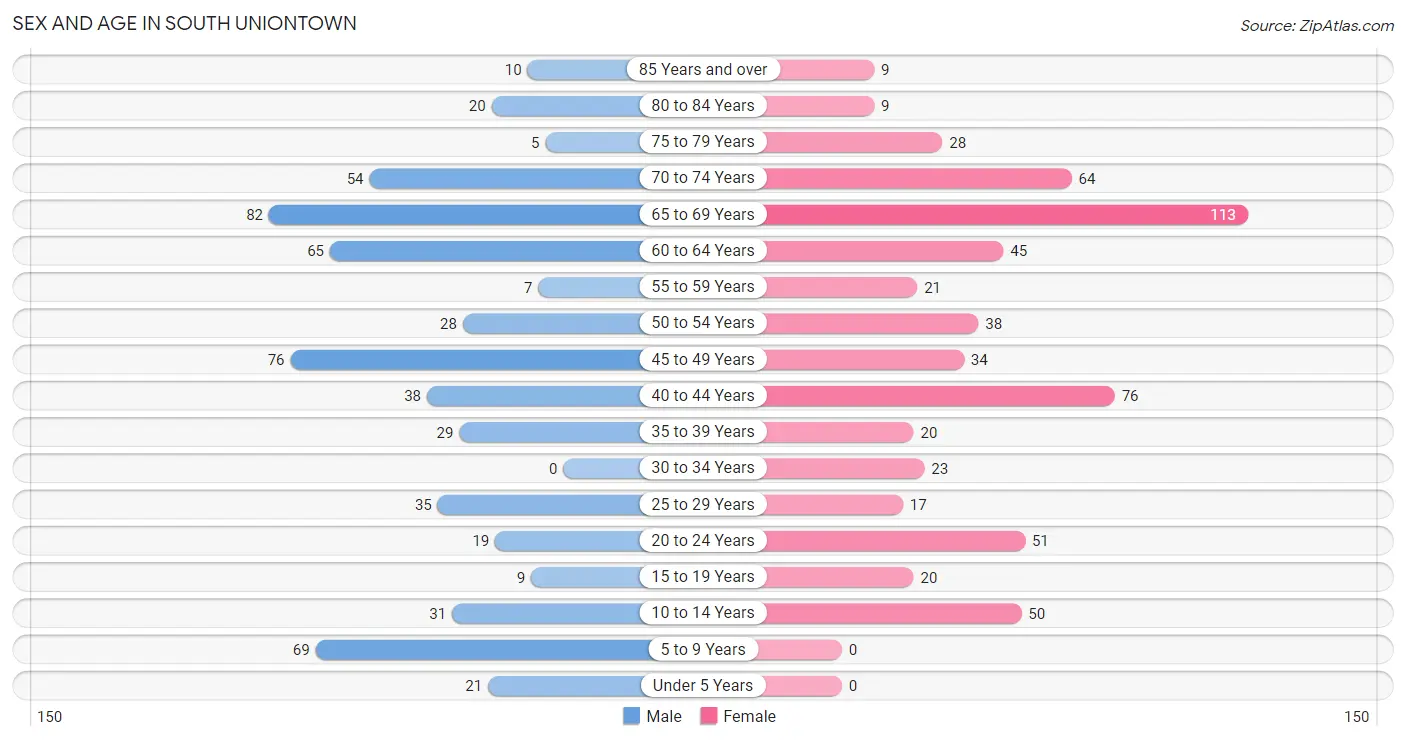
Sex and Age in South Uniontown
Sex and Age in South Uniontown
The most populous age groups in South Uniontown are 65 to 69 Years (82 | 13.7%) for men and 65 to 69 Years (113 | 18.3%) for women.
| Age Bracket | Male | Female |
| Under 5 Years | 21 (3.5%) | 0 (0.0%) |
| 5 to 9 Years | 69 (11.5%) | 0 (0.0%) |
| 10 to 14 Years | 31 (5.2%) | 50 (8.1%) |
| 15 to 19 Years | 9 (1.5%) | 20 (3.2%) |
| 20 to 24 Years | 19 (3.2%) | 51 (8.3%) |
| 25 to 29 Years | 35 (5.9%) | 17 (2.8%) |
| 30 to 34 Years | 0 (0.0%) | 23 (3.7%) |
| 35 to 39 Years | 29 (4.9%) | 20 (3.2%) |
| 40 to 44 Years | 38 (6.4%) | 76 (12.3%) |
| 45 to 49 Years | 76 (12.7%) | 34 (5.5%) |
| 50 to 54 Years | 28 (4.7%) | 38 (6.1%) |
| 55 to 59 Years | 7 (1.2%) | 21 (3.4%) |
| 60 to 64 Years | 65 (10.9%) | 45 (7.3%) |
| 65 to 69 Years | 82 (13.7%) | 113 (18.3%) |
| 70 to 74 Years | 54 (9.0%) | 64 (10.4%) |
| 75 to 79 Years | 5 (0.8%) | 28 (4.5%) |
| 80 to 84 Years | 20 (3.3%) | 9 (1.5%) |
| 85 Years and over | 10 (1.7%) | 9 (1.5%) |
| Total | 598 (100.0%) | 618 (100.0%) |
Families and Households in South Uniontown
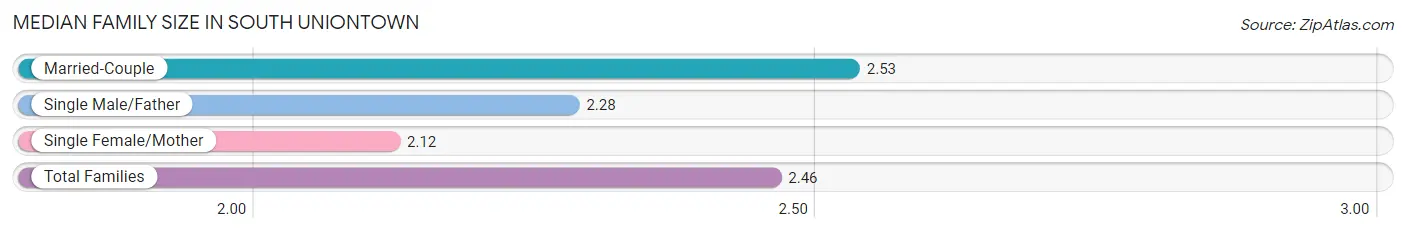
Median Family Size in South Uniontown
The median family size in South Uniontown is 2.46 persons per family, with married-couple families (331 | 81.3%) accounting for the largest median family size of 2.53 persons per family. On the other hand, single female/mother families (51 | 12.5%) represent the smallest median family size with 2.12 persons per family.
| Family Type | # Families | Family Size |
| Married-Couple | 331 (81.3%) | 2.53 |
| Single Male/Father | 25 (6.1%) | 2.28 |
| Single Female/Mother | 51 (12.5%) | 2.12 |
| Total Families | 407 (100.0%) | 2.46 |
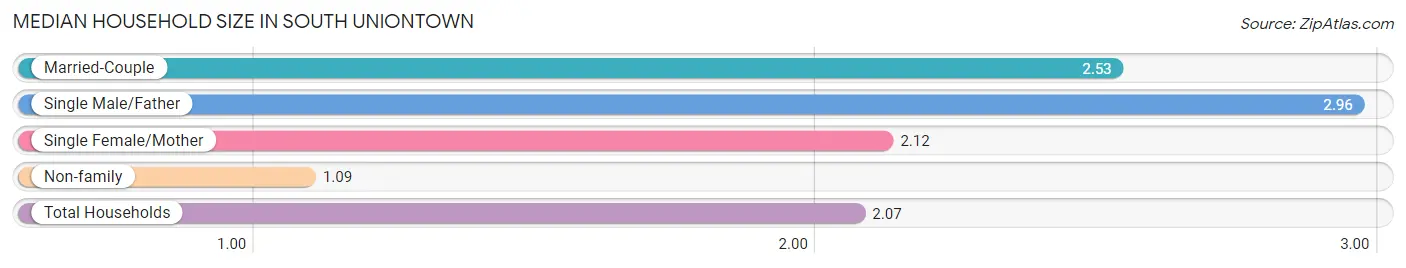
Median Household Size in South Uniontown
The median household size in South Uniontown is 2.07 persons per household, with single male/father households (25 | 4.3%) accounting for the largest median household size of 2.96 persons per household. non-family households (180 | 30.7%) represent the smallest median household size with 1.09 persons per household.
| Household Type | # Households | Household Size |
| Married-Couple | 331 (56.4%) | 2.53 |
| Single Male/Father | 25 (4.3%) | 2.96 |
| Single Female/Mother | 51 (8.7%) | 2.12 |
| Non-family | 180 (30.7%) | 1.09 |
| Total Households | 587 (100.0%) | 2.07 |
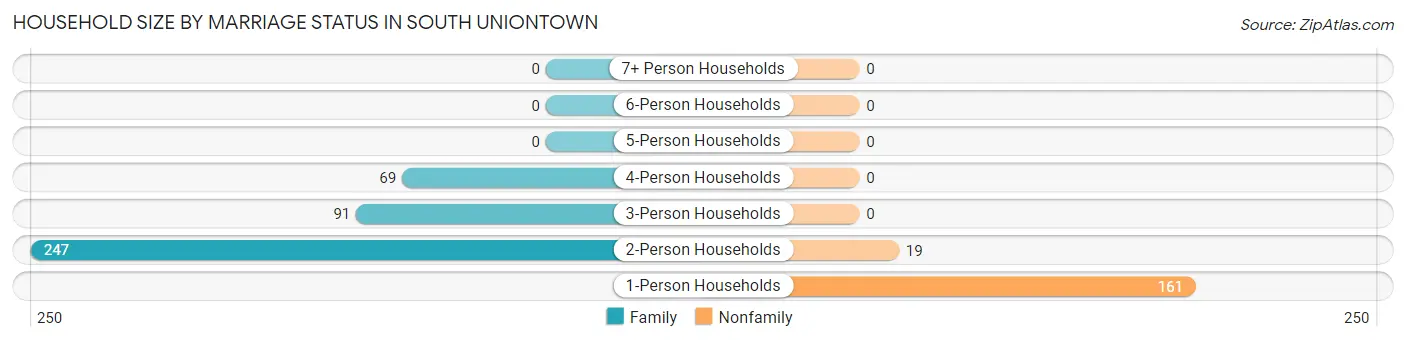
Household Size by Marriage Status in South Uniontown
Out of a total of 587 households in South Uniontown, 407 (69.3%) are family households, while 180 (30.7%) are nonfamily households. The most numerous type of family households are 2-person households, comprising 247, and the most common type of nonfamily households are 1-person households, comprising 161.
| Household Size | Family Households | Nonfamily Households |
| 1-Person Households | - | 161 (27.4%) |
| 2-Person Households | 247 (42.1%) | 19 (3.2%) |
| 3-Person Households | 91 (15.5%) | 0 (0.0%) |
| 4-Person Households | 69 (11.7%) | 0 (0.0%) |
| 5-Person Households | 0 (0.0%) | 0 (0.0%) |
| 6-Person Households | 0 (0.0%) | 0 (0.0%) |
| 7+ Person Households | 0 (0.0%) | 0 (0.0%) |
| Total | 407 (69.3%) | 180 (30.7%) |
Female Fertility in South Uniontown
Fertility by Age in South Uniontown
Average fertility rate in South Uniontown is 70.0 births per 1,000 women. Women in the age bracket of 20 to 34 years have the highest fertility rate with 187.0 births per 1,000 women. Women in the age bracket of 20 to 34 years acount for 100.0% of all women with births.
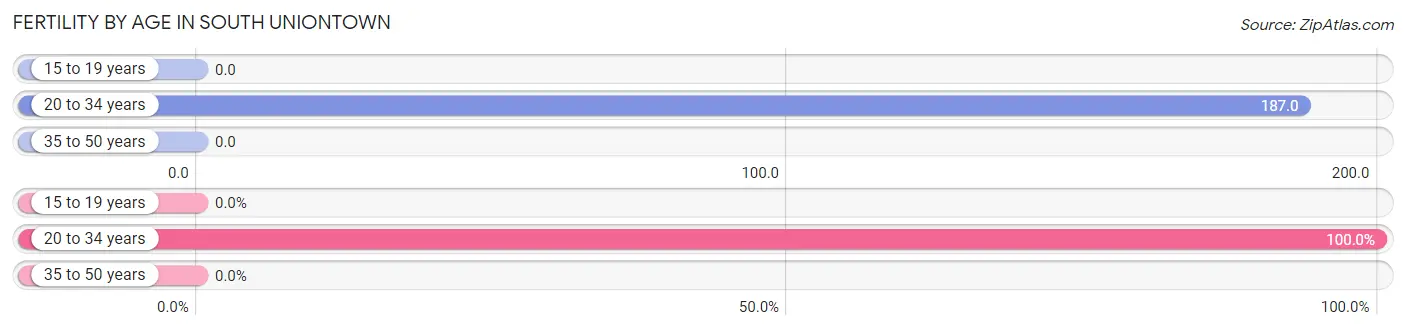
| Age Bracket | Women with Births | Births / 1,000 Women |
| 15 to 19 years | 0 (0.0%) | 0.0 |
| 20 to 34 years | 17 (100.0%) | 187.0 |
| 35 to 50 years | 0 (0.0%) | 0.0 |
| Total | 17 (100.0%) | 70.0 |
Fertility by Age by Marriage Status in South Uniontown
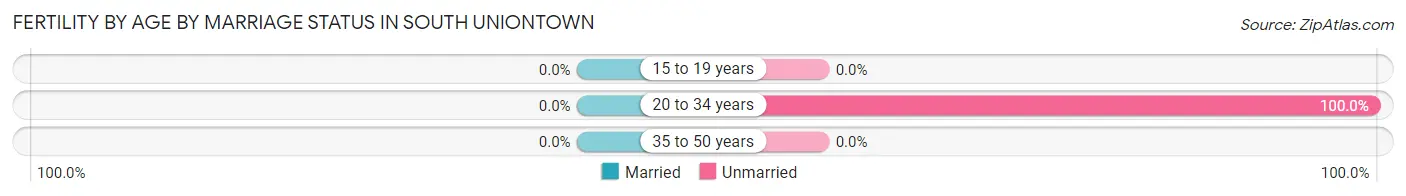
| Age Bracket | Married | Unmarried |
| 15 to 19 years | 0 (0.0%) | 0 (0.0%) |
| 20 to 34 years | 0 (0.0%) | 17 (100.0%) |
| 35 to 50 years | 0 (0.0%) | 0 (0.0%) |
| Total | 0 (0.0%) | 17 (100.0%) |
Fertility by Education in South Uniontown
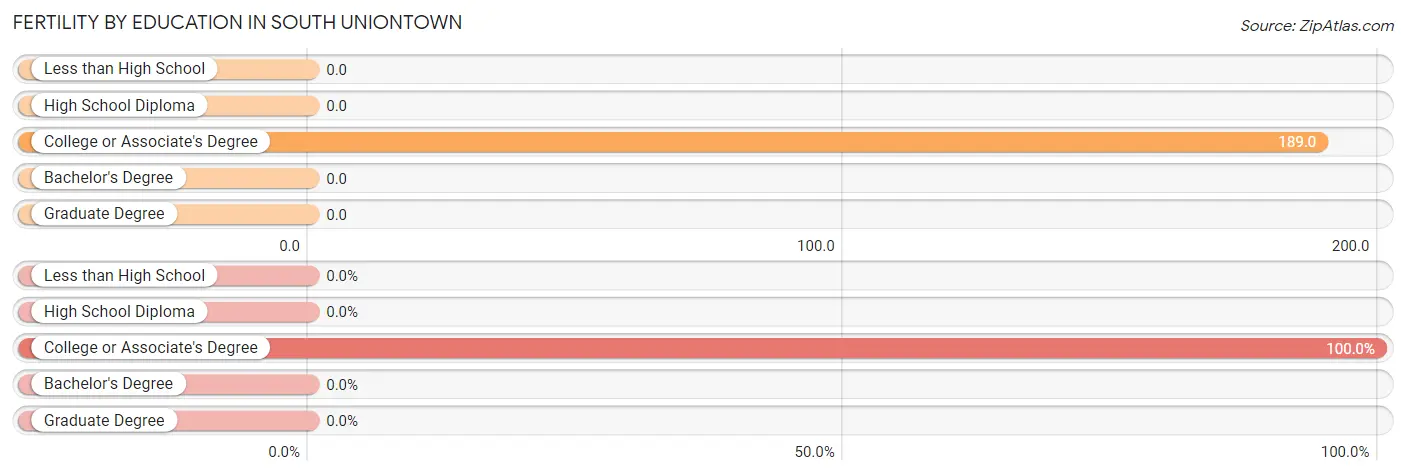
| Educational Attainment | Women with Births | Births / 1,000 Women |
| Less than High School | 0 (0.0%) | 0.0 |
| High School Diploma | 0 (0.0%) | 0.0 |
| College or Associate's Degree | 17 (100.0%) | 189.0 |
| Bachelor's Degree | 0 (0.0%) | 0.0 |
| Graduate Degree | 0 (0.0%) | 0.0 |
| Total | 17 (100.0%) | 70.0 |
Fertility by Education by Marriage Status in South Uniontown
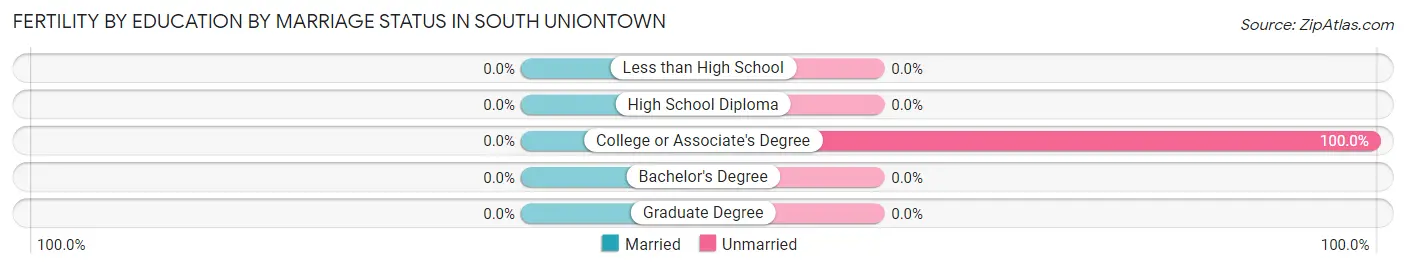
| Educational Attainment | Married | Unmarried |
| Less than High School | 0 (0.0%) | 0 (0.0%) |
| High School Diploma | 0 (0.0%) | 0 (0.0%) |
| College or Associate's Degree | 0 (0.0%) | 17 (100.0%) |
| Bachelor's Degree | 0 (0.0%) | 0 (0.0%) |
| Graduate Degree | 0 (0.0%) | 0 (0.0%) |
| Total | 0 (0.0%) | 17 (100.0%) |
Income in South Uniontown
Income Overview in South Uniontown
Per Capita Income in South Uniontown is $37,244, while median incomes of families and households are $93,173 and $70,489 respectively.
| Characteristic | Number | Measure |
| Per Capita Income | 1,216 | $37,244 |
| Median Family Income | 407 | $93,173 |
| Mean Family Income | 407 | $88,598 |
| Median Household Income | 587 | $70,489 |
| Mean Household Income | 587 | $77,590 |
| Income Deficit | 407 | $0 |
| Wage / Income Gap (%) | 1,216 | 58.15% |
| Wage / Income Gap ($) | 1,216 | 41.85¢ per $1 |
| Gini / Inequality Index | 1,216 | 0.29 |
Earnings by Sex in South Uniontown
Average Earnings in South Uniontown are $44,667, $65,714 for men and $27,500 for women, a difference of 58.2%.
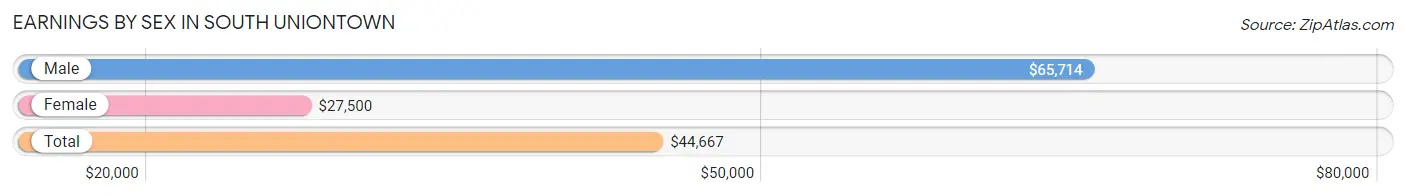
| Sex | Number | Average Earnings |
| Male | 276 (44.4%) | $65,714 |
| Female | 346 (55.6%) | $27,500 |
| Total | 622 (100.0%) | $44,667 |
Earnings by Sex by Income Bracket in South Uniontown
The most common earnings brackets in South Uniontown are $65,000 to $74,999 for men (62 | 22.5%) and $65,000 to $74,999 for women (56 | 16.2%).
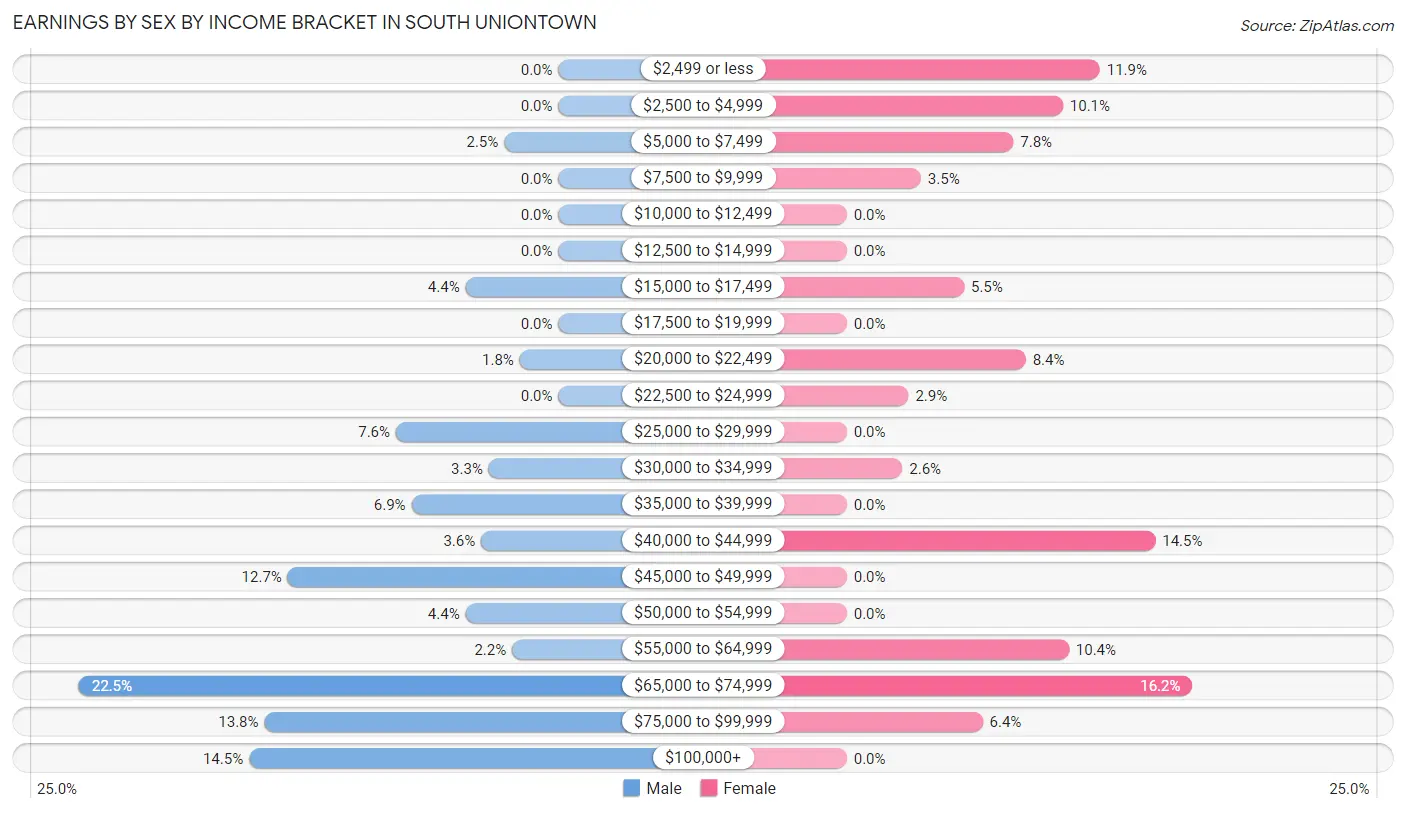
| Income | Male | Female |
| $2,499 or less | 0 (0.0%) | 41 (11.8%) |
| $2,500 to $4,999 | 0 (0.0%) | 35 (10.1%) |
| $5,000 to $7,499 | 7 (2.5%) | 27 (7.8%) |
| $7,500 to $9,999 | 0 (0.0%) | 12 (3.5%) |
| $10,000 to $12,499 | 0 (0.0%) | 0 (0.0%) |
| $12,500 to $14,999 | 0 (0.0%) | 0 (0.0%) |
| $15,000 to $17,499 | 12 (4.3%) | 19 (5.5%) |
| $17,500 to $19,999 | 0 (0.0%) | 0 (0.0%) |
| $20,000 to $22,499 | 5 (1.8%) | 29 (8.4%) |
| $22,500 to $24,999 | 0 (0.0%) | 10 (2.9%) |
| $25,000 to $29,999 | 21 (7.6%) | 0 (0.0%) |
| $30,000 to $34,999 | 9 (3.3%) | 9 (2.6%) |
| $35,000 to $39,999 | 19 (6.9%) | 0 (0.0%) |
| $40,000 to $44,999 | 10 (3.6%) | 50 (14.4%) |
| $45,000 to $49,999 | 35 (12.7%) | 0 (0.0%) |
| $50,000 to $54,999 | 12 (4.3%) | 0 (0.0%) |
| $55,000 to $64,999 | 6 (2.2%) | 36 (10.4%) |
| $65,000 to $74,999 | 62 (22.5%) | 56 (16.2%) |
| $75,000 to $99,999 | 38 (13.8%) | 22 (6.4%) |
| $100,000+ | 40 (14.5%) | 0 (0.0%) |
| Total | 276 (100.0%) | 346 (100.0%) |
Earnings by Sex by Educational Attainment in South Uniontown
Average earnings in South Uniontown are $67,321 for men and $41,583 for women, a difference of 38.2%. Men with an educational attainment of bachelor's degree enjoy the highest average annual earnings of $73,250, while those with high school diploma education earn the least with $49,135. Women with an educational attainment of graduate degree earn the most with the average annual earnings of $62,604, while those with college or associate's degree education have the smallest earnings of $40,250.
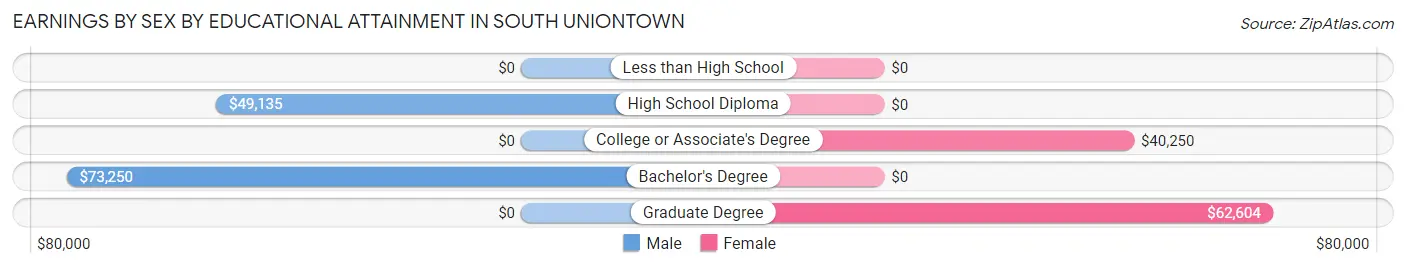
| Educational Attainment | Male Income | Female Income |
| Less than High School | - | - |
| High School Diploma | $49,135 | $0 |
| College or Associate's Degree | - | - |
| Bachelor's Degree | $73,250 | $0 |
| Graduate Degree | - | - |
| Total | $67,321 | $41,583 |
Family Income in South Uniontown
Family Income Brackets in South Uniontown
According to the South Uniontown family income data, there are 164 families falling into the $100,000 to $149,999 income range, which is the most common income bracket and makes up 40.3% of all families.
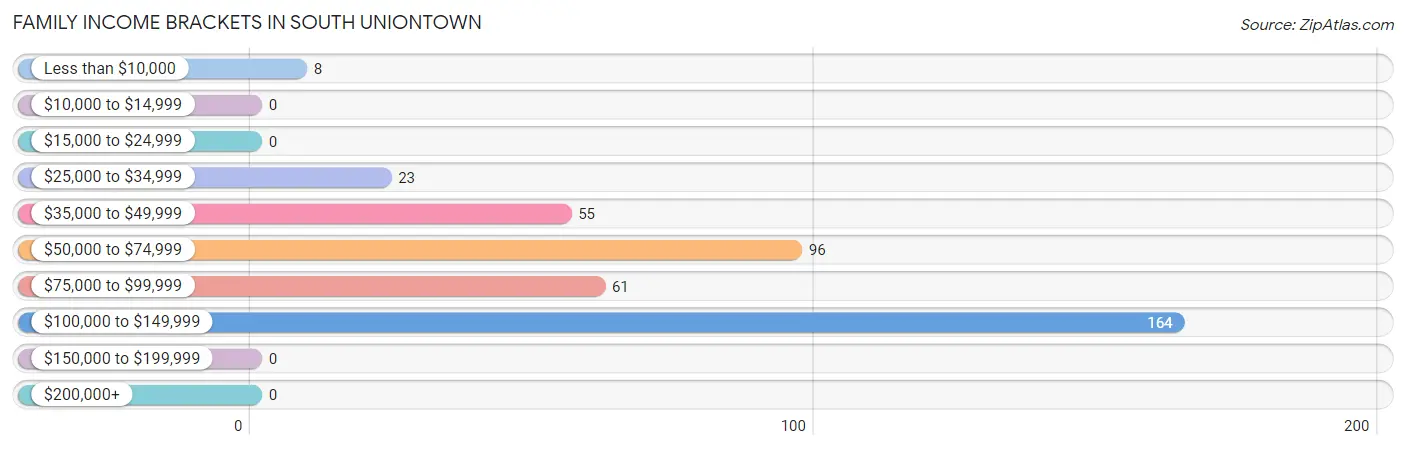
| Income Bracket | # Families | % Families |
| Less than $10,000 | 8 | 2.0% |
| $10,000 to $14,999 | 0 | 0.0% |
| $15,000 to $24,999 | 0 | 0.0% |
| $25,000 to $34,999 | 23 | 5.7% |
| $35,000 to $49,999 | 55 | 13.5% |
| $50,000 to $74,999 | 96 | 23.6% |
| $75,000 to $99,999 | 61 | 15.0% |
| $100,000 to $149,999 | 164 | 40.3% |
| $150,000 to $199,999 | 0 | 0.0% |
| $200,000+ | 0 | 0.0% |
Family Income by Famaliy Size in South Uniontown
3-person families (75 | 18.4%) account for the highest median family income in South Uniontown with $107,898 per family, while 3-person families (75 | 18.4%) have the highest median income of $35,966 per family member.
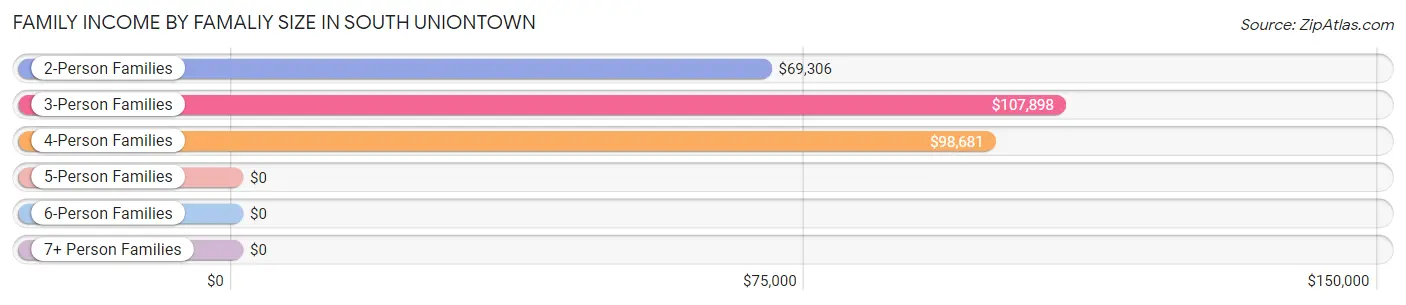
| Income Bracket | # Families | Median Income |
| 2-Person Families | 263 (64.6%) | $69,306 |
| 3-Person Families | 75 (18.4%) | $107,898 |
| 4-Person Families | 69 (17.0%) | $98,681 |
| 5-Person Families | 0 (0.0%) | $0 |
| 6-Person Families | 0 (0.0%) | $0 |
| 7+ Person Families | 0 (0.0%) | $0 |
| Total | 407 (100.0%) | $93,173 |
Family Income by Number of Earners in South Uniontown
The median family income in South Uniontown is $93,173, with families comprising 2 earners (166) having the highest median family income of $108,676, while families with 1 earner (89) have the lowest median family income of $61,458, accounting for 40.8% and 21.9% of families, respectively.
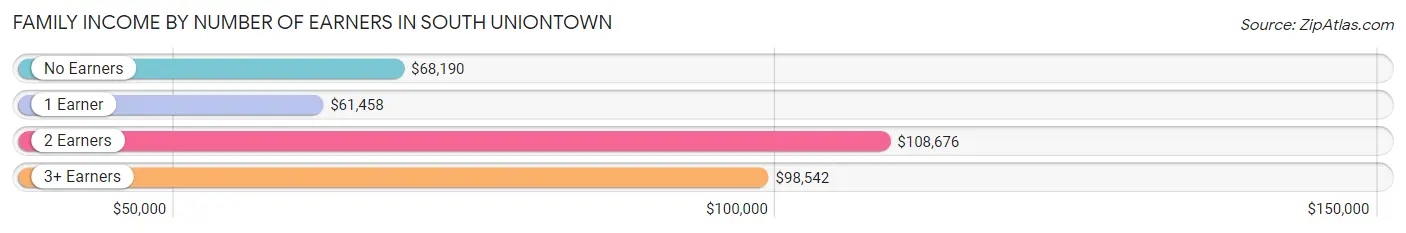
| Number of Earners | # Families | Median Income |
| No Earners | 118 (29.0%) | $68,190 |
| 1 Earner | 89 (21.9%) | $61,458 |
| 2 Earners | 166 (40.8%) | $108,676 |
| 3+ Earners | 34 (8.4%) | $98,542 |
| Total | 407 (100.0%) | $93,173 |
Household Income in South Uniontown
Household Income Brackets in South Uniontown
With 183 households falling in the category, the $100,000 to $149,999 income range is the most frequent in South Uniontown, accounting for 31.2% of all households.
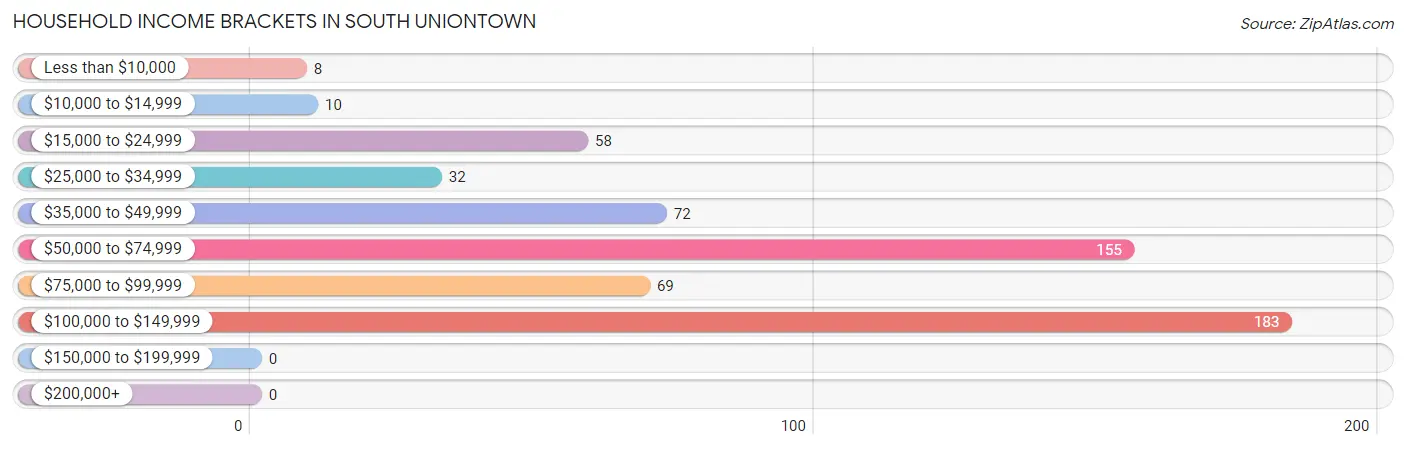
| Income Bracket | # Households | % Households |
| Less than $10,000 | 8 | 1.4% |
| $10,000 to $14,999 | 10 | 1.7% |
| $15,000 to $24,999 | 58 | 9.9% |
| $25,000 to $34,999 | 32 | 5.5% |
| $35,000 to $49,999 | 72 | 12.3% |
| $50,000 to $74,999 | 155 | 26.4% |
| $75,000 to $99,999 | 69 | 11.8% |
| $100,000 to $149,999 | 183 | 31.2% |
| $150,000 to $199,999 | 0 | 0.0% |
| $200,000+ | 0 | 0.0% |
Household Income by Householder Age in South Uniontown
The median household income in South Uniontown is $70,489, with the highest median household income of $98,229 found in the 45 to 64 years age bracket for the primary householder. A total of 181 households (30.8%) fall into this category. Meanwhile, the 15 to 24 years age bracket for the primary householder has the lowest median household income of $0, with 12 households (2.0%) in this group.
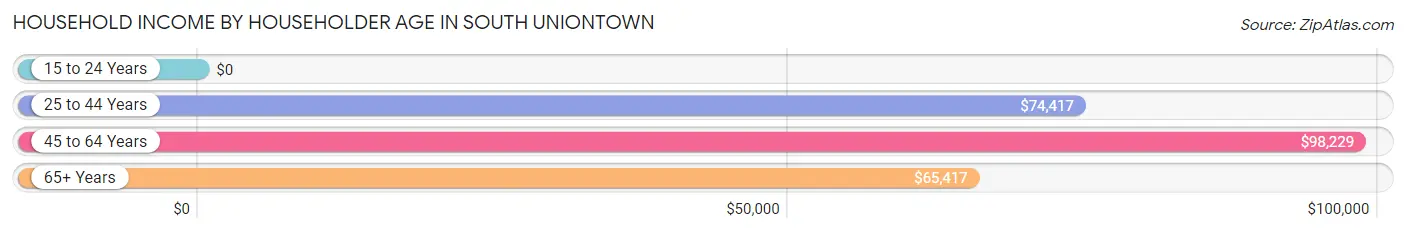
| Income Bracket | # Households | Median Income |
| 15 to 24 Years | 12 (2.0%) | $0 |
| 25 to 44 Years | 139 (23.7%) | $74,417 |
| 45 to 64 Years | 181 (30.8%) | $98,229 |
| 65+ Years | 255 (43.4%) | $65,417 |
| Total | 587 (100.0%) | $70,489 |
Poverty in South Uniontown
Income Below Poverty by Sex and Age in South Uniontown
With 6.2% poverty level for males and 4.4% for females among the residents of South Uniontown, 16 and 17 year old males and 25 to 34 year old females are the most vulnerable to poverty, with 9 males (100.0%) and 17 females (42.5%) in their respective age groups living below the poverty level.
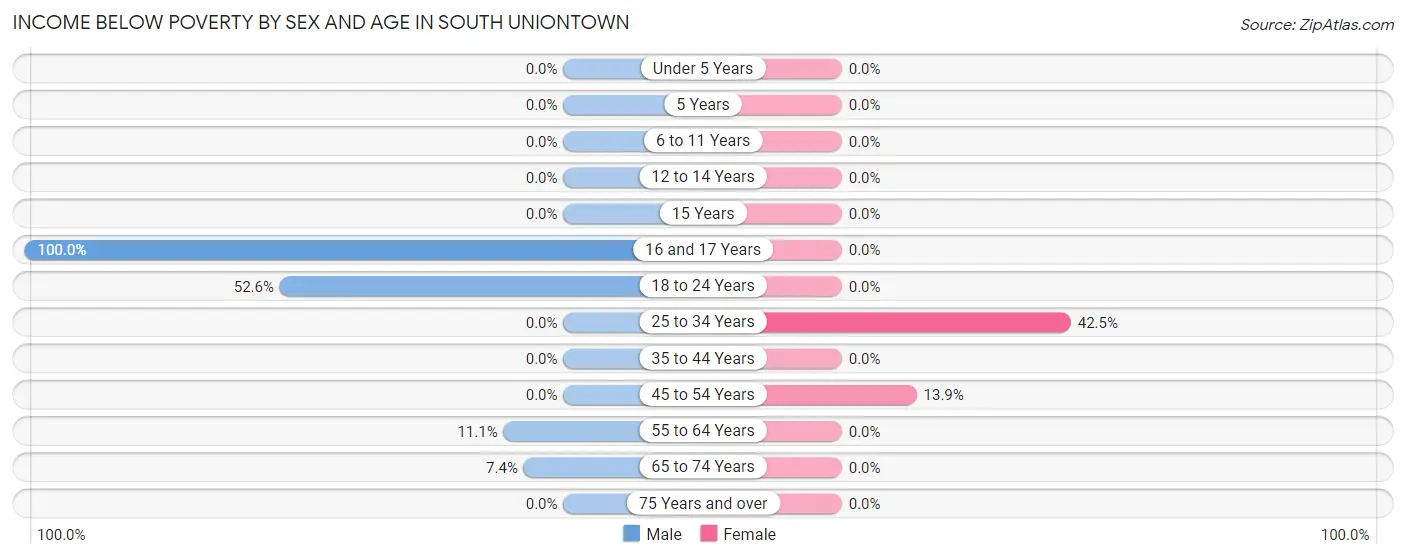
| Age Bracket | Male | Female |
| Under 5 Years | 0 (0.0%) | 0 (0.0%) |
| 5 Years | 0 (0.0%) | 0 (0.0%) |
| 6 to 11 Years | 0 (0.0%) | 0 (0.0%) |
| 12 to 14 Years | 0 (0.0%) | 0 (0.0%) |
| 15 Years | 0 (0.0%) | 0 (0.0%) |
| 16 and 17 Years | 9 (100.0%) | 0 (0.0%) |
| 18 to 24 Years | 10 (52.6%) | 0 (0.0%) |
| 25 to 34 Years | 0 (0.0%) | 17 (42.5%) |
| 35 to 44 Years | 0 (0.0%) | 0 (0.0%) |
| 45 to 54 Years | 0 (0.0%) | 10 (13.9%) |
| 55 to 64 Years | 8 (11.1%) | 0 (0.0%) |
| 65 to 74 Years | 10 (7.3%) | 0 (0.0%) |
| 75 Years and over | 0 (0.0%) | 0 (0.0%) |
| Total | 37 (6.2%) | 27 (4.4%) |
Income Above Poverty by Sex and Age in South Uniontown
According to the poverty statistics in South Uniontown, males aged under 5 years and females aged 6 to 11 years are the age groups that are most secure financially, with 100.0% of males and 100.0% of females in these age groups living above the poverty line.
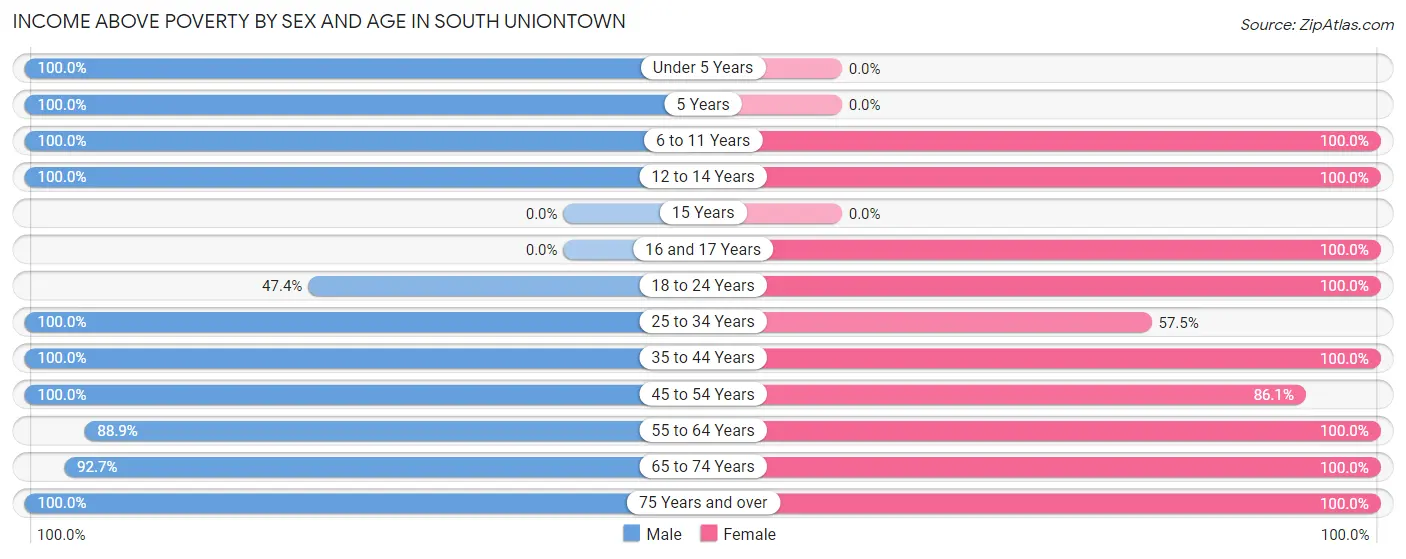
| Age Bracket | Male | Female |
| Under 5 Years | 21 (100.0%) | 0 (0.0%) |
| 5 Years | 24 (100.0%) | 0 (0.0%) |
| 6 to 11 Years | 62 (100.0%) | 41 (100.0%) |
| 12 to 14 Years | 14 (100.0%) | 9 (100.0%) |
| 15 Years | 0 (0.0%) | 0 (0.0%) |
| 16 and 17 Years | 0 (0.0%) | 15 (100.0%) |
| 18 to 24 Years | 9 (47.4%) | 56 (100.0%) |
| 25 to 34 Years | 35 (100.0%) | 23 (57.5%) |
| 35 to 44 Years | 67 (100.0%) | 96 (100.0%) |
| 45 to 54 Years | 104 (100.0%) | 62 (86.1%) |
| 55 to 64 Years | 64 (88.9%) | 66 (100.0%) |
| 65 to 74 Years | 126 (92.6%) | 177 (100.0%) |
| 75 Years and over | 35 (100.0%) | 46 (100.0%) |
| Total | 561 (93.8%) | 591 (95.6%) |
Income Below Poverty Among Married-Couple Families in South Uniontown
The poverty statistics for married-couple families in South Uniontown show that 2.4% or 8 of the total 331 families live below the poverty line. Families with 1 or 2 children have the highest poverty rate of 9.3%, comprising of 8 families. On the other hand, families with no children have the lowest poverty rate of 0.0%, which includes 0 families.
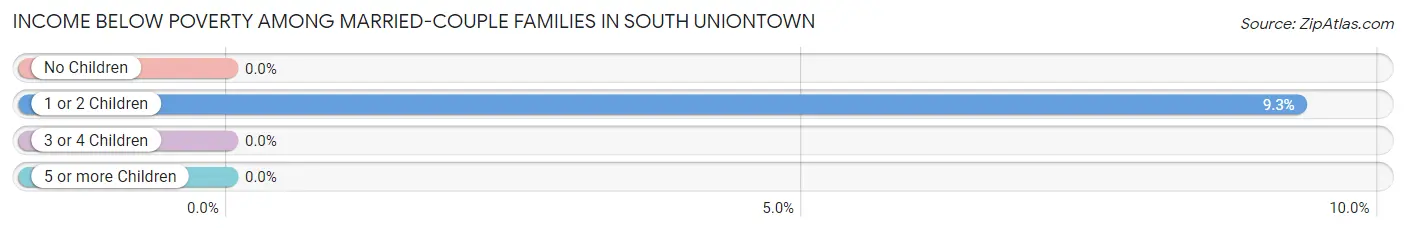
| Children | Above Poverty | Below Poverty |
| No Children | 245 (100.0%) | 0 (0.0%) |
| 1 or 2 Children | 78 (90.7%) | 8 (9.3%) |
| 3 or 4 Children | 0 (0.0%) | 0 (0.0%) |
| 5 or more Children | 0 (0.0%) | 0 (0.0%) |
| Total | 323 (97.6%) | 8 (2.4%) |
Income Below Poverty Among Single-Parent Households in South Uniontown
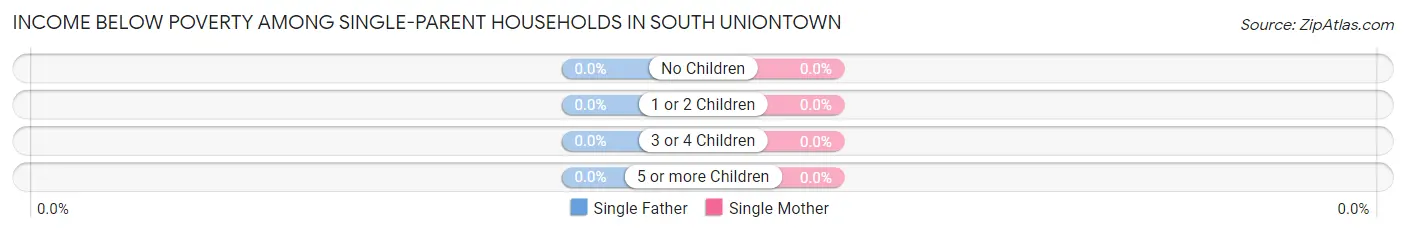
| Children | Single Father | Single Mother |
| No Children | 0 (0.0%) | 0 (0.0%) |
| 1 or 2 Children | 0 (0.0%) | 0 (0.0%) |
| 3 or 4 Children | 0 (0.0%) | 0 (0.0%) |
| 5 or more Children | 0 (0.0%) | 0 (0.0%) |
| Total | 0 (0.0%) | 0 (0.0%) |
Income Below Poverty Among Married-Couple vs Single-Parent Households in South Uniontown
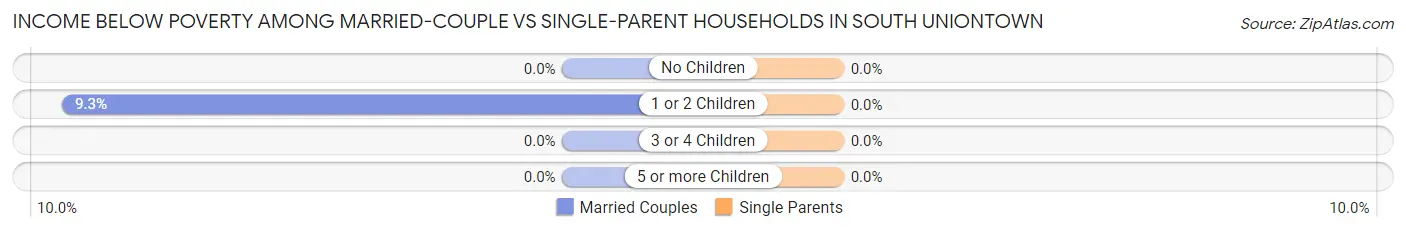
| Children | Married-Couple Families | Single-Parent Households |
| No Children | 0 (0.0%) | 0 (0.0%) |
| 1 or 2 Children | 8 (9.3%) | 0 (0.0%) |
| 3 or 4 Children | 0 (0.0%) | 0 (0.0%) |
| 5 or more Children | 0 (0.0%) | 0 (0.0%) |
| Total | 8 (2.4%) | 0 (0.0%) |
Employment Characteristics in South Uniontown
Employment by Class of Employer in South Uniontown
Among the 562 employed individuals in South Uniontown, private company employees (240 | 42.7%), not-for-profit organizations (133 | 23.7%), and federal government employees (52 | 9.2%) make up the most common classes of employment.
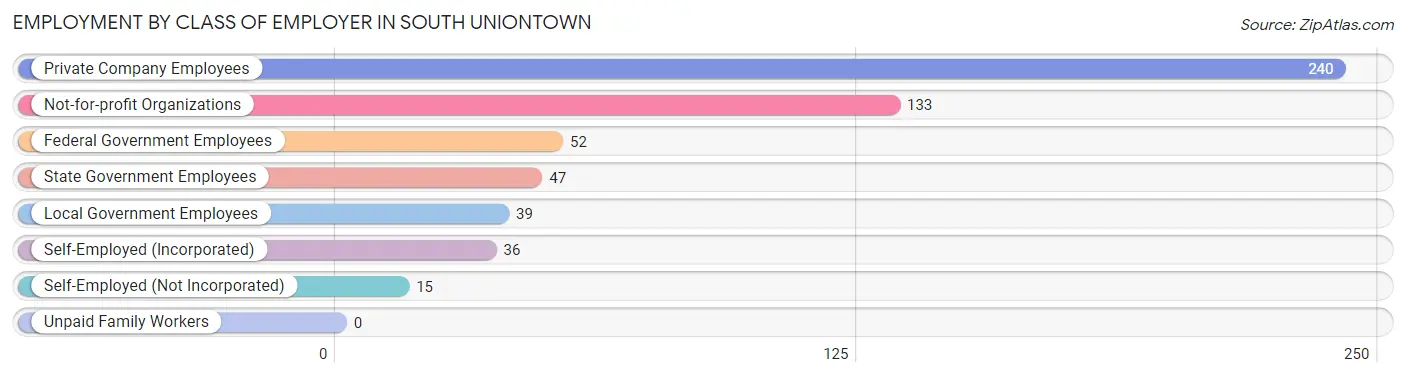
| Employer Class | # Employees | % Employees |
| Private Company Employees | 240 | 42.7% |
| Self-Employed (Incorporated) | 36 | 6.4% |
| Self-Employed (Not Incorporated) | 15 | 2.7% |
| Not-for-profit Organizations | 133 | 23.7% |
| Local Government Employees | 39 | 6.9% |
| State Government Employees | 47 | 8.4% |
| Federal Government Employees | 52 | 9.2% |
| Unpaid Family Workers | 0 | 0.0% |
| Total | 562 | 100.0% |
Employment Status by Age in South Uniontown
According to the labor force statistics for South Uniontown, out of the total population over 16 years of age (1,045), 55.1% or 576 individuals are in the labor force, with 1.2% or 7 of them unemployed. The age group with the highest labor force participation rate is 25 to 29 years, with 100.0% or 52 individuals in the labor force. Within the labor force, the 45 to 54 years age range has the highest percentage of unemployed individuals, with 4.5% or 7 of them being unemployed.
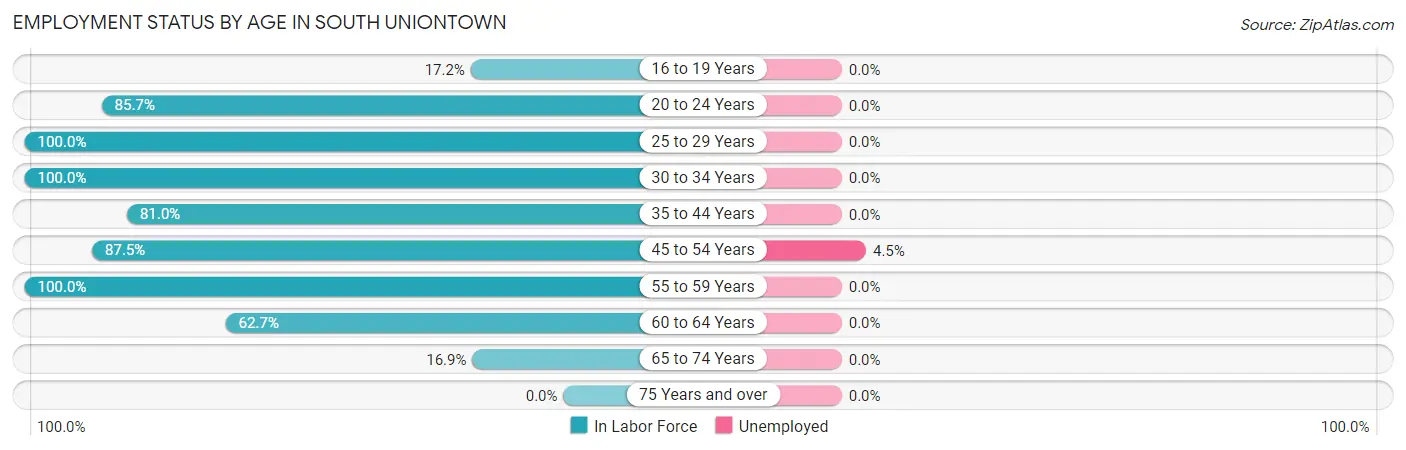
| Age Bracket | In Labor Force | Unemployed |
| 16 to 19 Years | 5 (17.2%) | 0 (0.0%) |
| 20 to 24 Years | 60 (85.7%) | 0 (0.0%) |
| 25 to 29 Years | 52 (100.0%) | 0 (0.0%) |
| 30 to 34 Years | 23 (100.0%) | 0 (0.0%) |
| 35 to 44 Years | 132 (81.0%) | 0 (0.0%) |
| 45 to 54 Years | 154 (87.5%) | 7 (4.5%) |
| 55 to 59 Years | 28 (100.0%) | 0 (0.0%) |
| 60 to 64 Years | 69 (62.7%) | 0 (0.0%) |
| 65 to 74 Years | 53 (16.9%) | 0 (0.0%) |
| 75 Years and over | 0 (0.0%) | 0 (0.0%) |
| Total | 576 (55.1%) | 7 (1.2%) |
Employment Status by Educational Attainment in South Uniontown
According to labor force statistics for South Uniontown, 83.0% of individuals (458) out of the total population between 25 and 64 years of age (552) are in the labor force, with 1.5% or 7 of them being unemployed. The group with the highest labor force participation rate are those with the educational attainment of college / associate degree, with 86.0% or 141 individuals in the labor force. Within the labor force, individuals with bachelor's degree or higher education have the highest percentage of unemployment, with 3.3% or 7 of them being unemployed.
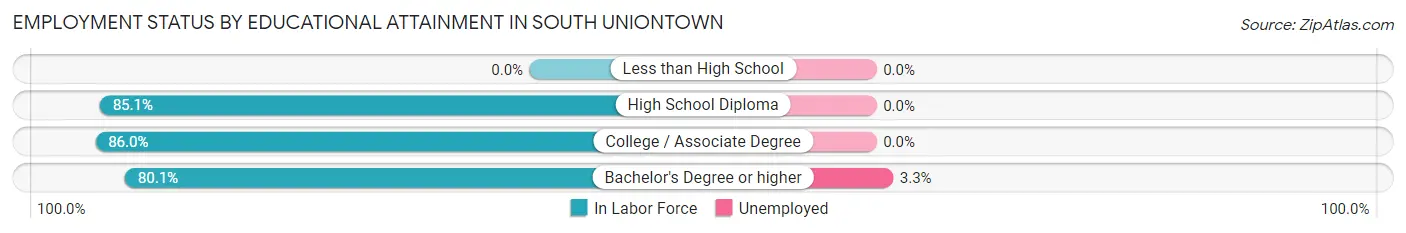
| Educational Attainment | In Labor Force | Unemployed |
| Less than High School | 0 (0.0%) | 0 (0.0%) |
| High School Diploma | 103 (85.1%) | 0 (0.0%) |
| College / Associate Degree | 141 (86.0%) | 0 (0.0%) |
| Bachelor's Degree or higher | 214 (80.1%) | 9 (3.3%) |
| Total | 458 (83.0%) | 8 (1.5%) |
Employment Occupations by Sex in South Uniontown
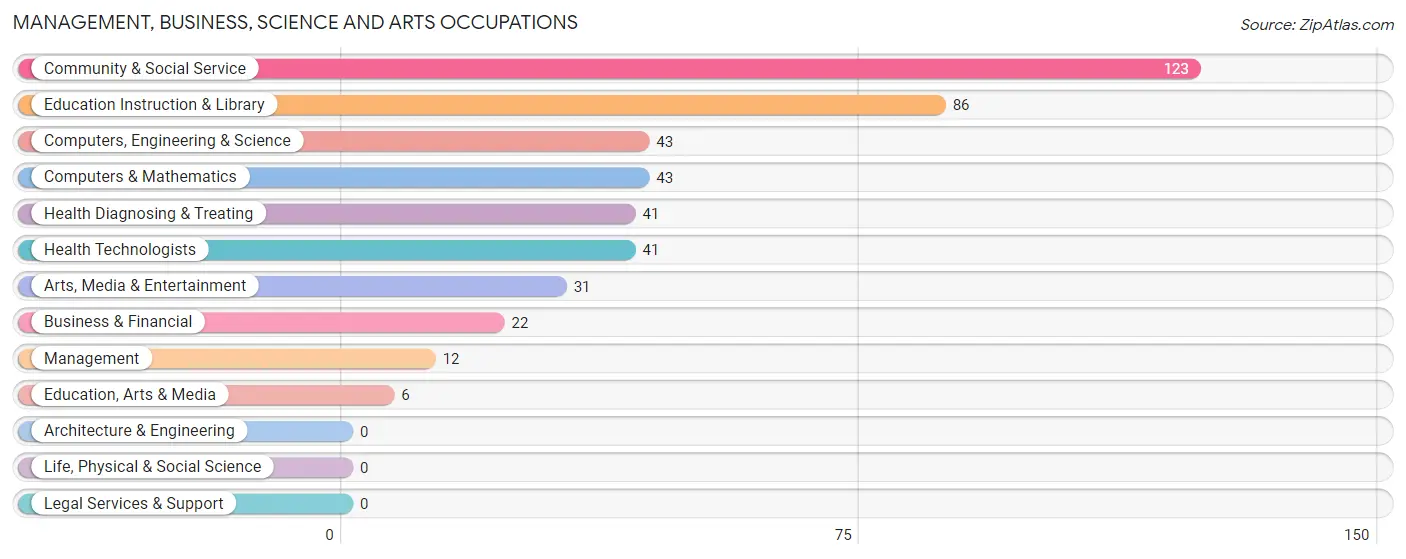
Management, Business, Science and Arts Occupations
The most common Management, Business, Science and Arts occupations in South Uniontown are Community & Social Service (123 | 21.6%), Education Instruction & Library (86 | 15.1%), Computers, Engineering & Science (43 | 7.6%), Computers & Mathematics (43 | 7.6%), and Health Diagnosing & Treating (41 | 7.2%).
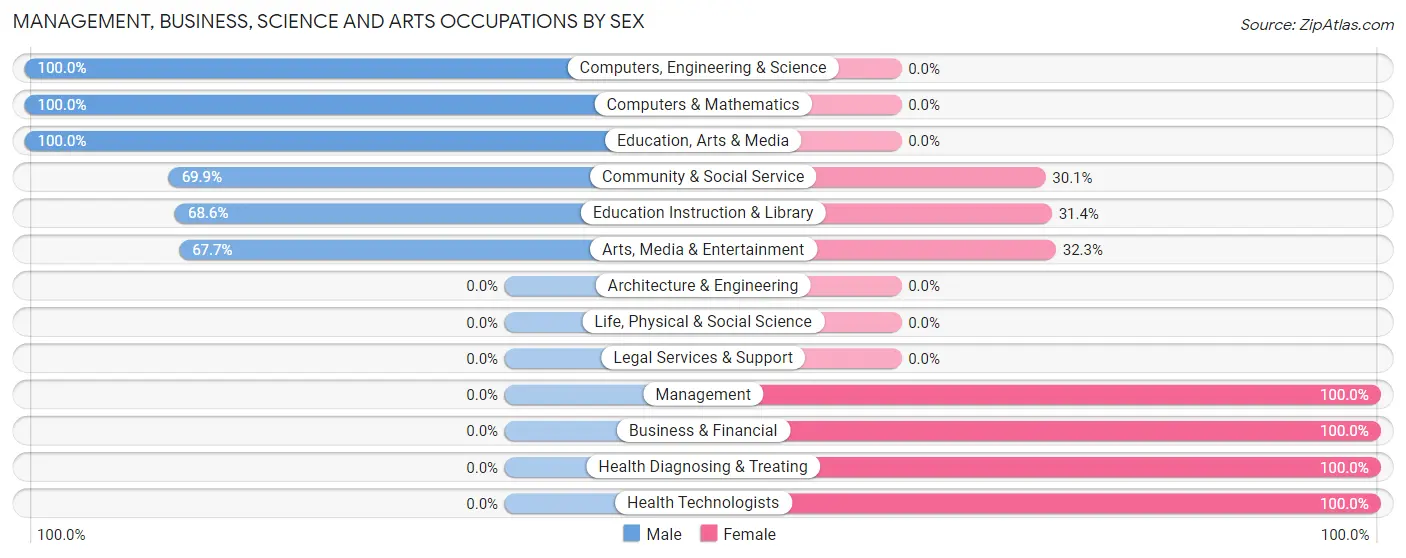
Management, Business, Science and Arts Occupations by Sex
Within the Management, Business, Science and Arts occupations in South Uniontown, the most male-oriented occupations are Computers, Engineering & Science (100.0%), Computers & Mathematics (100.0%), and Education, Arts & Media (100.0%), while the most female-oriented occupations are Management (100.0%), Business & Financial (100.0%), and Health Diagnosing & Treating (100.0%).
| Occupation | Male | Female |
| Management | 0 (0.0%) | 12 (100.0%) |
| Business & Financial | 0 (0.0%) | 22 (100.0%) |
| Computers, Engineering & Science | 43 (100.0%) | 0 (0.0%) |
| Computers & Mathematics | 43 (100.0%) | 0 (0.0%) |
| Architecture & Engineering | 0 (0.0%) | 0 (0.0%) |
| Life, Physical & Social Science | 0 (0.0%) | 0 (0.0%) |
| Community & Social Service | 86 (69.9%) | 37 (30.1%) |
| Education, Arts & Media | 6 (100.0%) | 0 (0.0%) |
| Legal Services & Support | 0 (0.0%) | 0 (0.0%) |
| Education Instruction & Library | 59 (68.6%) | 27 (31.4%) |
| Arts, Media & Entertainment | 21 (67.7%) | 10 (32.3%) |
| Health Diagnosing & Treating | 0 (0.0%) | 41 (100.0%) |
| Health Technologists | 0 (0.0%) | 41 (100.0%) |
| Total (Category) | 129 (53.5%) | 112 (46.5%) |
| Total (Overall) | 276 (48.5%) | 293 (51.5%) |
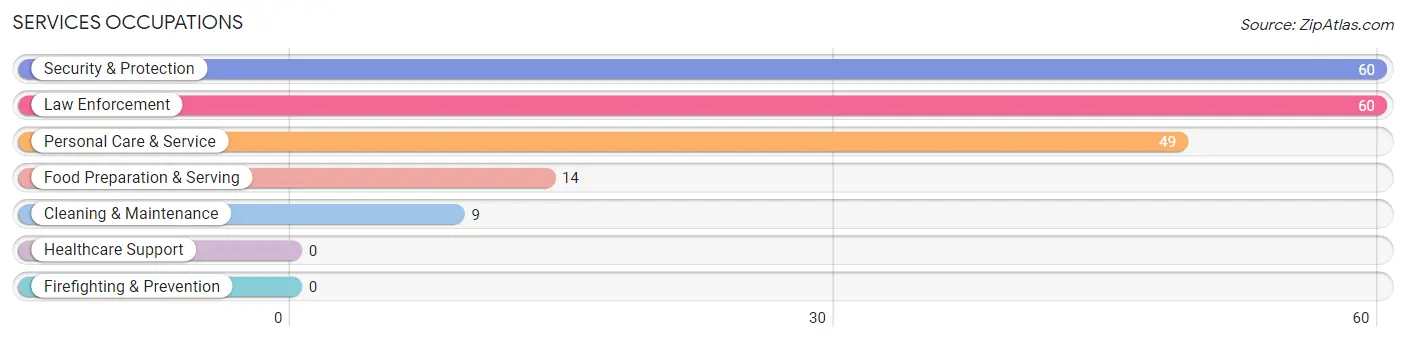
Services Occupations
The most common Services occupations in South Uniontown are Security & Protection (60 | 10.5%), Law Enforcement (60 | 10.5%), Personal Care & Service (49 | 8.6%), Food Preparation & Serving (14 | 2.5%), and Cleaning & Maintenance (9 | 1.6%).
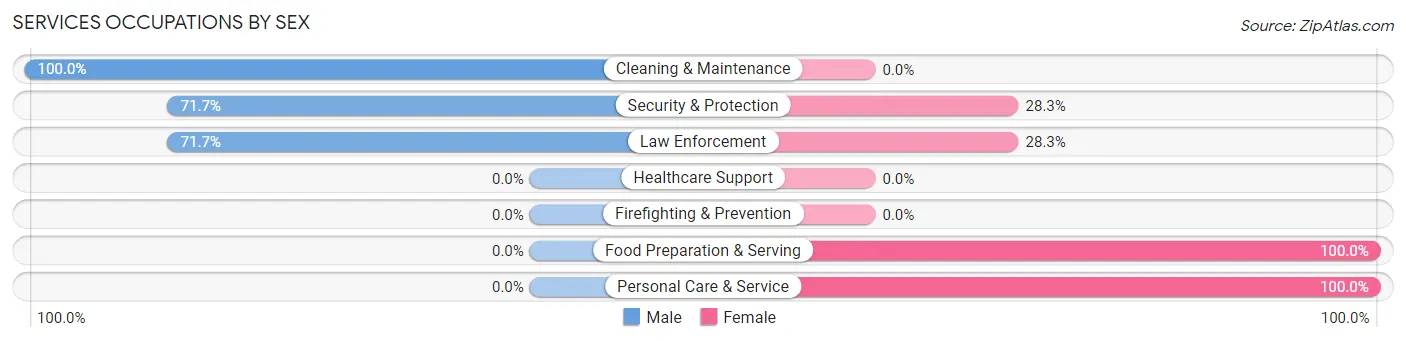
Services Occupations by Sex
Within the Services occupations in South Uniontown, the most male-oriented occupations are Cleaning & Maintenance (100.0%), Security & Protection (71.7%), and Law Enforcement (71.7%), while the most female-oriented occupations are Food Preparation & Serving (100.0%), Personal Care & Service (100.0%), and Security & Protection (28.3%).
| Occupation | Male | Female |
| Healthcare Support | 0 (0.0%) | 0 (0.0%) |
| Security & Protection | 43 (71.7%) | 17 (28.3%) |
| Firefighting & Prevention | 0 (0.0%) | 0 (0.0%) |
| Law Enforcement | 43 (71.7%) | 17 (28.3%) |
| Food Preparation & Serving | 0 (0.0%) | 14 (100.0%) |
| Cleaning & Maintenance | 9 (100.0%) | 0 (0.0%) |
| Personal Care & Service | 0 (0.0%) | 49 (100.0%) |
| Total (Category) | 52 (39.4%) | 80 (60.6%) |
| Total (Overall) | 276 (48.5%) | 293 (51.5%) |
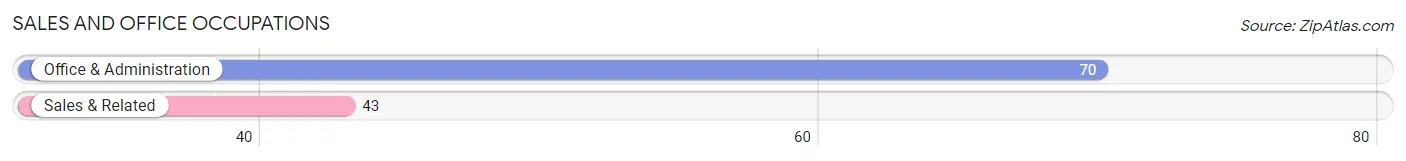
Sales and Office Occupations
The most common Sales and Office occupations in South Uniontown are Office & Administration (70 | 12.3%), and Sales & Related (43 | 7.6%).
Sales and Office Occupations by Sex
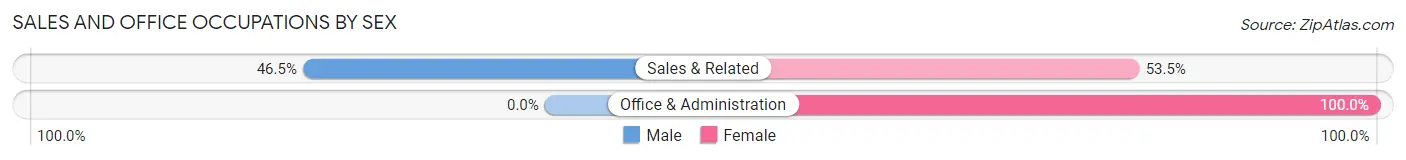
| Occupation | Male | Female |
| Sales & Related | 20 (46.5%) | 23 (53.5%) |
| Office & Administration | 0 (0.0%) | 70 (100.0%) |
| Total (Category) | 20 (17.7%) | 93 (82.3%) |
| Total (Overall) | 276 (48.5%) | 293 (51.5%) |
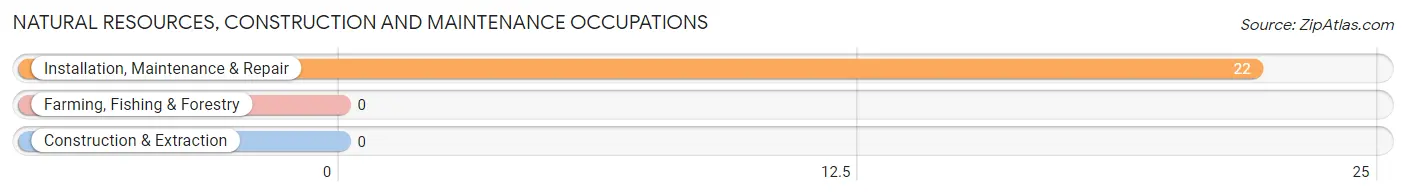
Natural Resources, Construction and Maintenance Occupations
The most common Natural Resources, Construction and Maintenance occupations in South Uniontown are , and Installation, Maintenance & Repair (22 | 3.9%).
Natural Resources, Construction and Maintenance Occupations by Sex
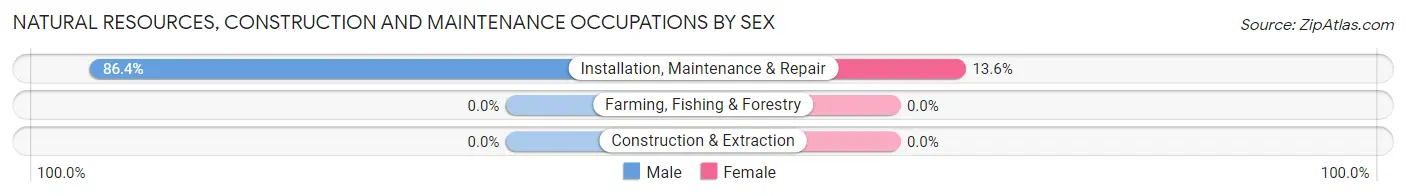
| Occupation | Male | Female |
| Farming, Fishing & Forestry | 0 (0.0%) | 0 (0.0%) |
| Construction & Extraction | 0 (0.0%) | 0 (0.0%) |
| Installation, Maintenance & Repair | 19 (86.4%) | 3 (13.6%) |
| Total (Category) | 19 (86.4%) | 3 (13.6%) |
| Total (Overall) | 276 (48.5%) | 293 (51.5%) |
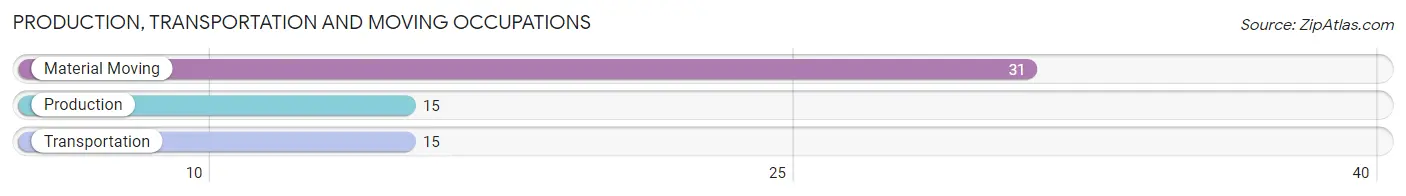
Production, Transportation and Moving Occupations
The most common Production, Transportation and Moving occupations in South Uniontown are Material Moving (31 | 5.4%), Production (15 | 2.6%), and Transportation (15 | 2.6%).
Production, Transportation and Moving Occupations by Sex
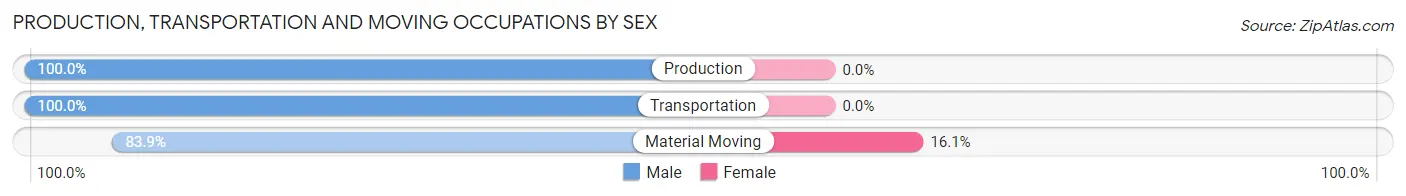
| Occupation | Male | Female |
| Production | 15 (100.0%) | 0 (0.0%) |
| Transportation | 15 (100.0%) | 0 (0.0%) |
| Material Moving | 26 (83.9%) | 5 (16.1%) |
| Total (Category) | 56 (91.8%) | 5 (8.2%) |
| Total (Overall) | 276 (48.5%) | 293 (51.5%) |
Employment Industries by Sex in South Uniontown
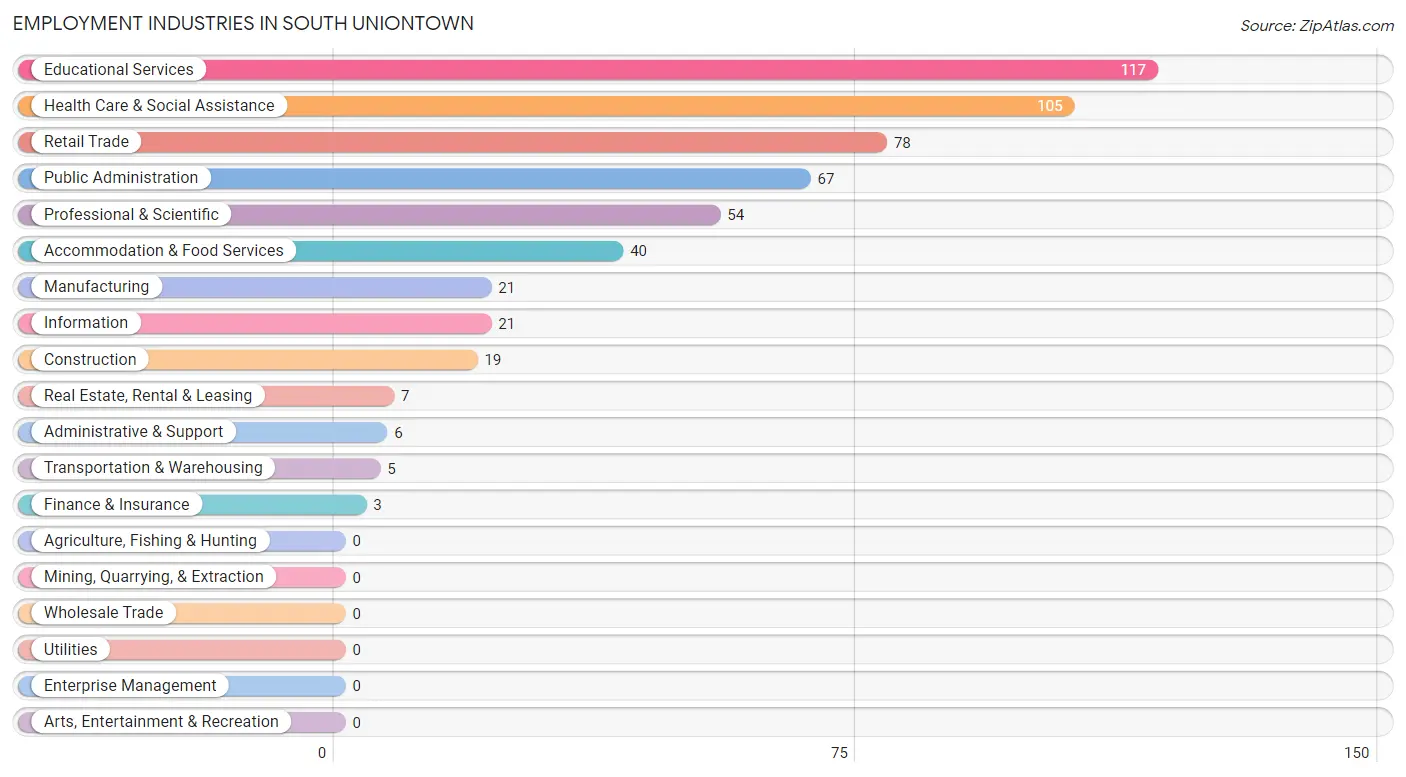
Employment Industries in South Uniontown
The major employment industries in South Uniontown include Educational Services (117 | 20.6%), Health Care & Social Assistance (105 | 18.4%), Retail Trade (78 | 13.7%), Public Administration (67 | 11.8%), and Professional & Scientific (54 | 9.5%).
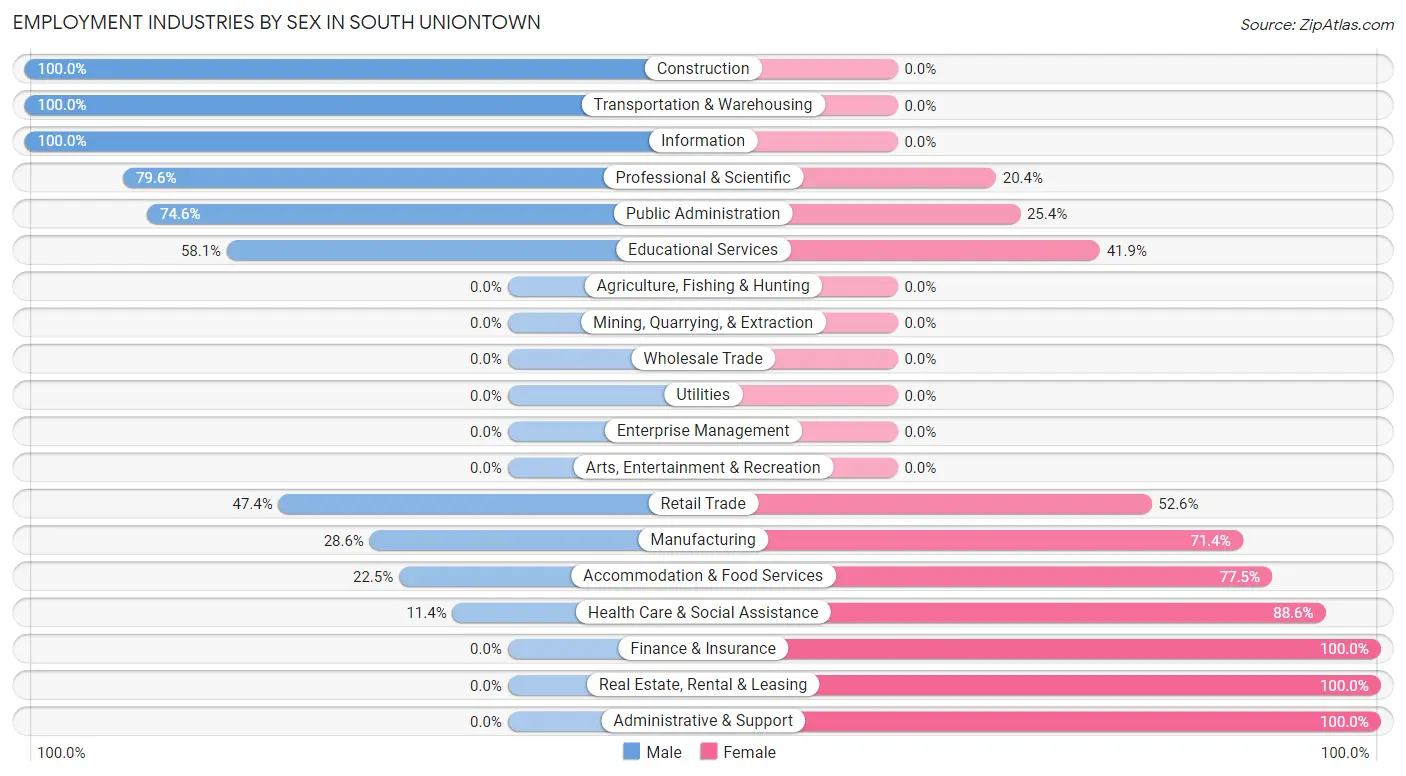
Employment Industries by Sex in South Uniontown
The South Uniontown industries that see more men than women are Construction (100.0%), Transportation & Warehousing (100.0%), and Information (100.0%), whereas the industries that tend to have a higher number of women are Finance & Insurance (100.0%), Real Estate, Rental & Leasing (100.0%), and Administrative & Support (100.0%).
| Industry | Male | Female |
| Agriculture, Fishing & Hunting | 0 (0.0%) | 0 (0.0%) |
| Mining, Quarrying, & Extraction | 0 (0.0%) | 0 (0.0%) |
| Construction | 19 (100.0%) | 0 (0.0%) |
| Manufacturing | 6 (28.6%) | 15 (71.4%) |
| Wholesale Trade | 0 (0.0%) | 0 (0.0%) |
| Retail Trade | 37 (47.4%) | 41 (52.6%) |
| Transportation & Warehousing | 5 (100.0%) | 0 (0.0%) |
| Utilities | 0 (0.0%) | 0 (0.0%) |
| Information | 21 (100.0%) | 0 (0.0%) |
| Finance & Insurance | 0 (0.0%) | 3 (100.0%) |
| Real Estate, Rental & Leasing | 0 (0.0%) | 7 (100.0%) |
| Professional & Scientific | 43 (79.6%) | 11 (20.4%) |
| Enterprise Management | 0 (0.0%) | 0 (0.0%) |
| Administrative & Support | 0 (0.0%) | 6 (100.0%) |
| Educational Services | 68 (58.1%) | 49 (41.9%) |
| Health Care & Social Assistance | 12 (11.4%) | 93 (88.6%) |
| Arts, Entertainment & Recreation | 0 (0.0%) | 0 (0.0%) |
| Accommodation & Food Services | 9 (22.5%) | 31 (77.5%) |
| Public Administration | 50 (74.6%) | 17 (25.4%) |
| Total | 276 (48.5%) | 293 (51.5%) |
Education in South Uniontown
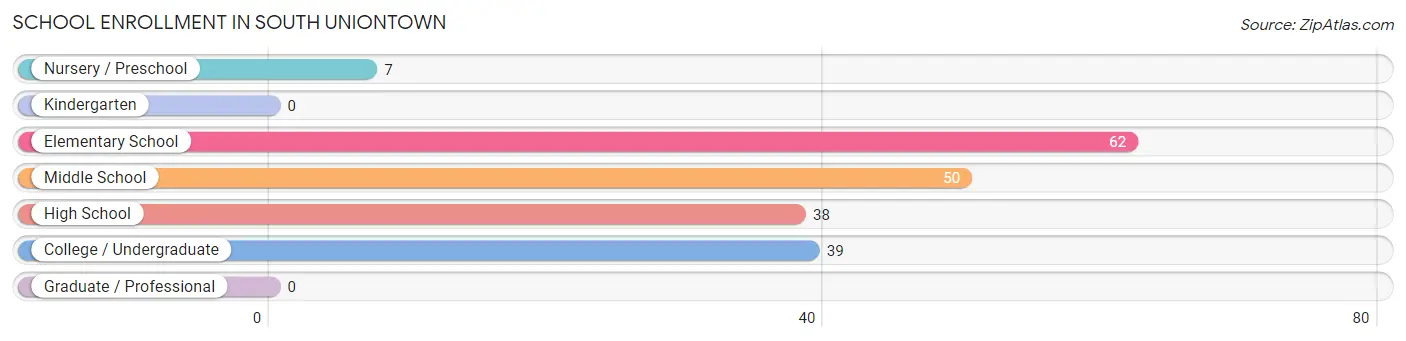
School Enrollment in South Uniontown
The most common levels of schooling among the 196 students in South Uniontown are elementary school (62 | 31.6%), middle school (50 | 25.5%), and college / undergraduate (39 | 19.9%).
| School Level | # Students | % Students |
| Nursery / Preschool | 7 | 3.6% |
| Kindergarten | 0 | 0.0% |
| Elementary School | 62 | 31.6% |
| Middle School | 50 | 25.5% |
| High School | 38 | 19.4% |
| College / Undergraduate | 39 | 19.9% |
| Graduate / Professional | 0 | 0.0% |
| Total | 196 | 100.0% |
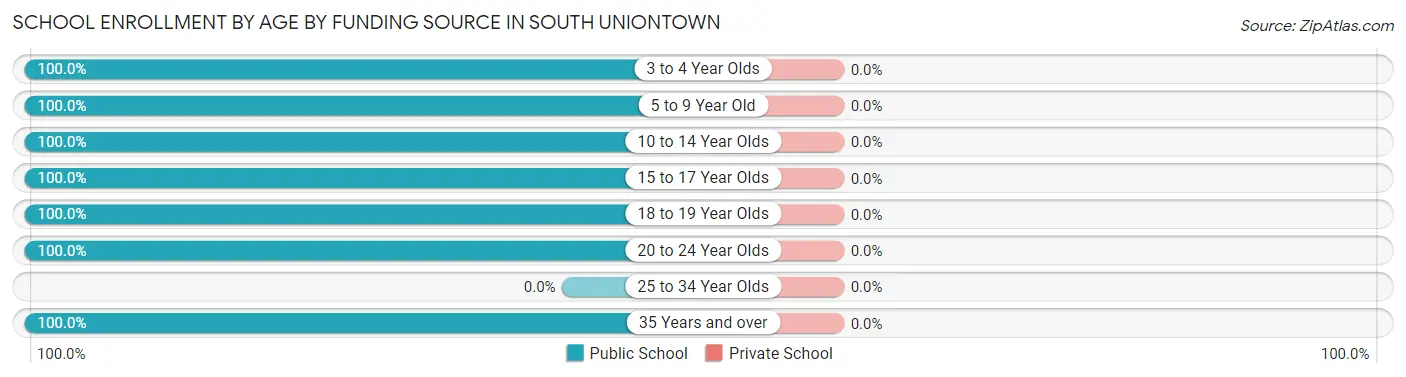
School Enrollment by Age by Funding Source in South Uniontown
| Age Bracket | Public School | Private School |
| 3 to 4 Year Olds | 7 (100.0%) | 0 (0.0%) |
| 5 to 9 Year Old | 45 (100.0%) | 0 (0.0%) |
| 10 to 14 Year Olds | 81 (100.0%) | 0 (0.0%) |
| 15 to 17 Year Olds | 24 (100.0%) | 0 (0.0%) |
| 18 to 19 Year Olds | 5 (100.0%) | 0 (0.0%) |
| 20 to 24 Year Olds | 19 (100.0%) | 0 (0.0%) |
| 25 to 34 Year Olds | 0 (0.0%) | 0 (0.0%) |
| 35 Years and over | 15 (100.0%) | 0 (0.0%) |
| Total | 196 (100.0%) | 0 (0.0%) |
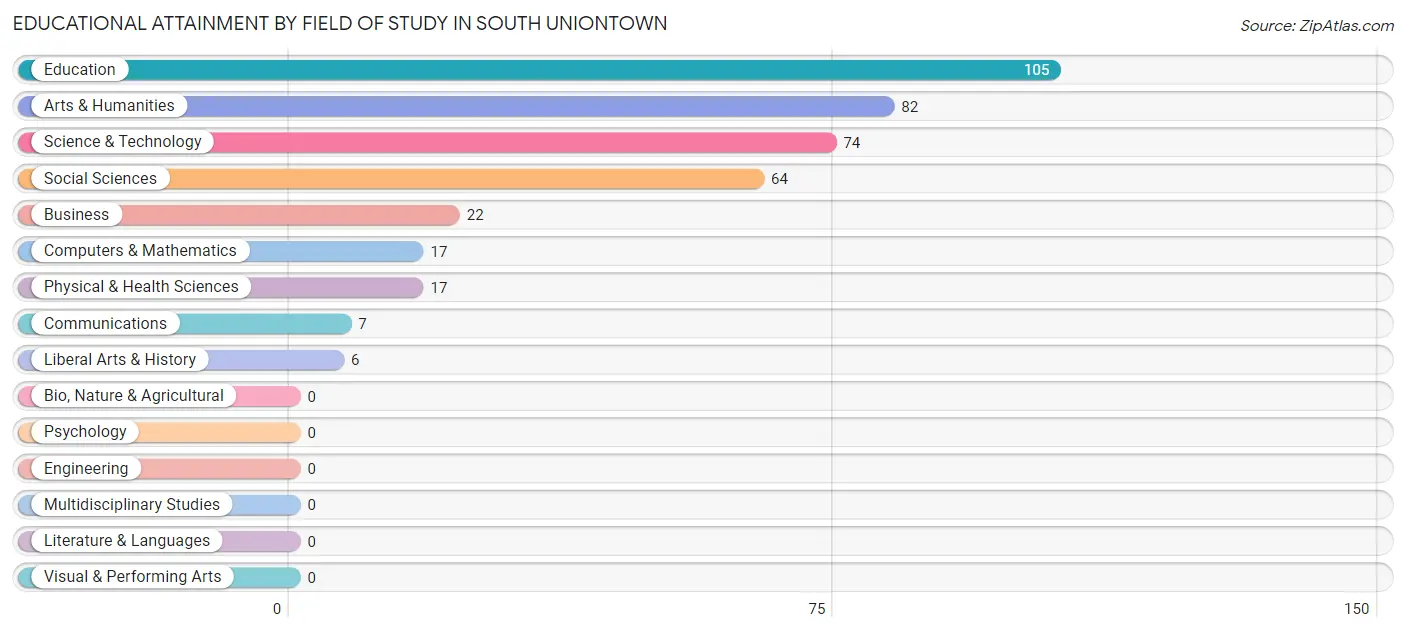
Educational Attainment by Field of Study in South Uniontown
Education (105 | 26.7%), arts & humanities (82 | 20.8%), science & technology (74 | 18.8%), social sciences (64 | 16.2%), and business (22 | 5.6%) are the most common fields of study among 394 individuals in South Uniontown who have obtained a bachelor's degree or higher.
| Field of Study | # Graduates | % Graduates |
| Computers & Mathematics | 17 | 4.3% |
| Bio, Nature & Agricultural | 0 | 0.0% |
| Physical & Health Sciences | 17 | 4.3% |
| Psychology | 0 | 0.0% |
| Social Sciences | 64 | 16.2% |
| Engineering | 0 | 0.0% |
| Multidisciplinary Studies | 0 | 0.0% |
| Science & Technology | 74 | 18.8% |
| Business | 22 | 5.6% |
| Education | 105 | 26.7% |
| Literature & Languages | 0 | 0.0% |
| Liberal Arts & History | 6 | 1.5% |
| Visual & Performing Arts | 0 | 0.0% |
| Communications | 7 | 1.8% |
| Arts & Humanities | 82 | 20.8% |
| Total | 394 | 100.0% |
Transportation & Commute in South Uniontown
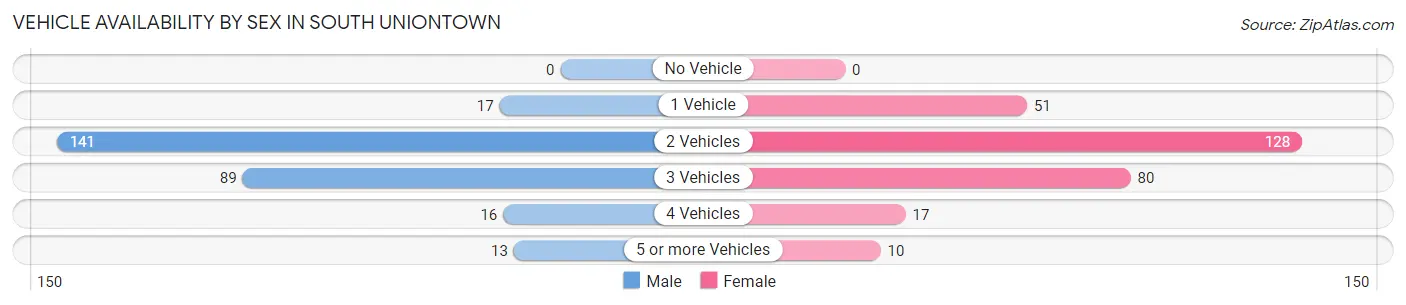
Vehicle Availability by Sex in South Uniontown
The most prevalent vehicle ownership categories in South Uniontown are males with 2 vehicles (141, accounting for 51.1%) and females with 2 vehicles (128, making up 49.3%).
| Vehicles Available | Male | Female |
| No Vehicle | 0 (0.0%) | 0 (0.0%) |
| 1 Vehicle | 17 (6.2%) | 51 (17.8%) |
| 2 Vehicles | 141 (51.1%) | 128 (44.8%) |
| 3 Vehicles | 89 (32.3%) | 80 (28.0%) |
| 4 Vehicles | 16 (5.8%) | 17 (5.9%) |
| 5 or more Vehicles | 13 (4.7%) | 10 (3.5%) |
| Total | 276 (100.0%) | 286 (100.0%) |
Commute Time in South Uniontown
The most frequently occuring commute durations in South Uniontown are 5 to 9 minutes (154 commuters, 30.9%), 45 to 59 minutes (74 commuters, 14.9%), and 10 to 14 minutes (71 commuters, 14.3%).
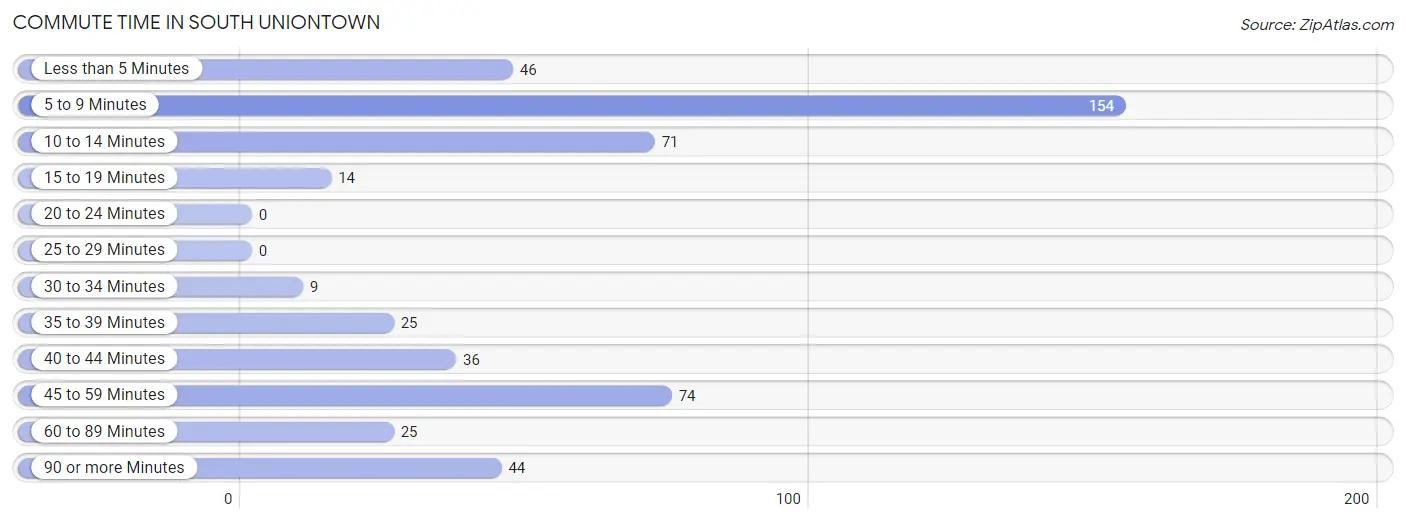
| Commute Time | # Commuters | % Commuters |
| Less than 5 Minutes | 46 | 9.2% |
| 5 to 9 Minutes | 154 | 30.9% |
| 10 to 14 Minutes | 71 | 14.3% |
| 15 to 19 Minutes | 14 | 2.8% |
| 20 to 24 Minutes | 0 | 0.0% |
| 25 to 29 Minutes | 0 | 0.0% |
| 30 to 34 Minutes | 9 | 1.8% |
| 35 to 39 Minutes | 25 | 5.0% |
| 40 to 44 Minutes | 36 | 7.2% |
| 45 to 59 Minutes | 74 | 14.9% |
| 60 to 89 Minutes | 25 | 5.0% |
| 90 or more Minutes | 44 | 8.8% |
Commute Time by Sex in South Uniontown
The most common commute times in South Uniontown are 5 to 9 minutes (89 commuters, 38.2%) for males and 5 to 9 minutes (65 commuters, 24.5%) for females.
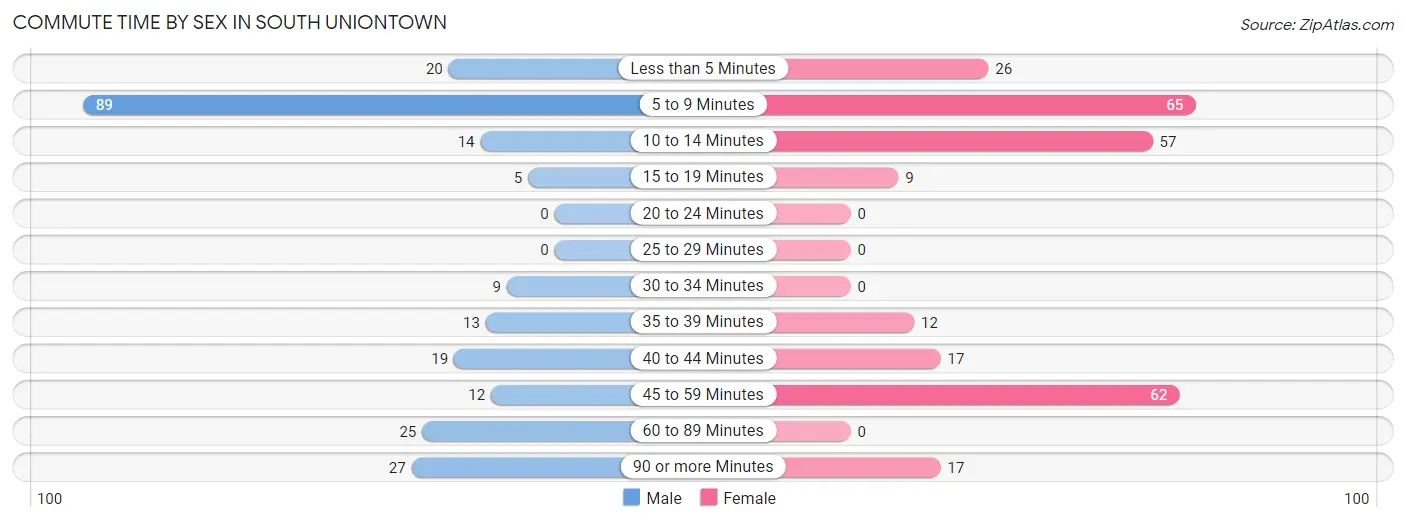
| Commute Time | Male | Female |
| Less than 5 Minutes | 20 (8.6%) | 26 (9.8%) |
| 5 to 9 Minutes | 89 (38.2%) | 65 (24.5%) |
| 10 to 14 Minutes | 14 (6.0%) | 57 (21.5%) |
| 15 to 19 Minutes | 5 (2.1%) | 9 (3.4%) |
| 20 to 24 Minutes | 0 (0.0%) | 0 (0.0%) |
| 25 to 29 Minutes | 0 (0.0%) | 0 (0.0%) |
| 30 to 34 Minutes | 9 (3.9%) | 0 (0.0%) |
| 35 to 39 Minutes | 13 (5.6%) | 12 (4.5%) |
| 40 to 44 Minutes | 19 (8.2%) | 17 (6.4%) |
| 45 to 59 Minutes | 12 (5.1%) | 62 (23.4%) |
| 60 to 89 Minutes | 25 (10.7%) | 0 (0.0%) |
| 90 or more Minutes | 27 (11.6%) | 17 (6.4%) |
Time of Departure to Work by Sex in South Uniontown
The most frequent times of departure to work in South Uniontown are 5:30 AM to 5:59 AM (45, 19.3%) for males and 7:30 AM to 7:59 AM (69, 26.0%) for females.
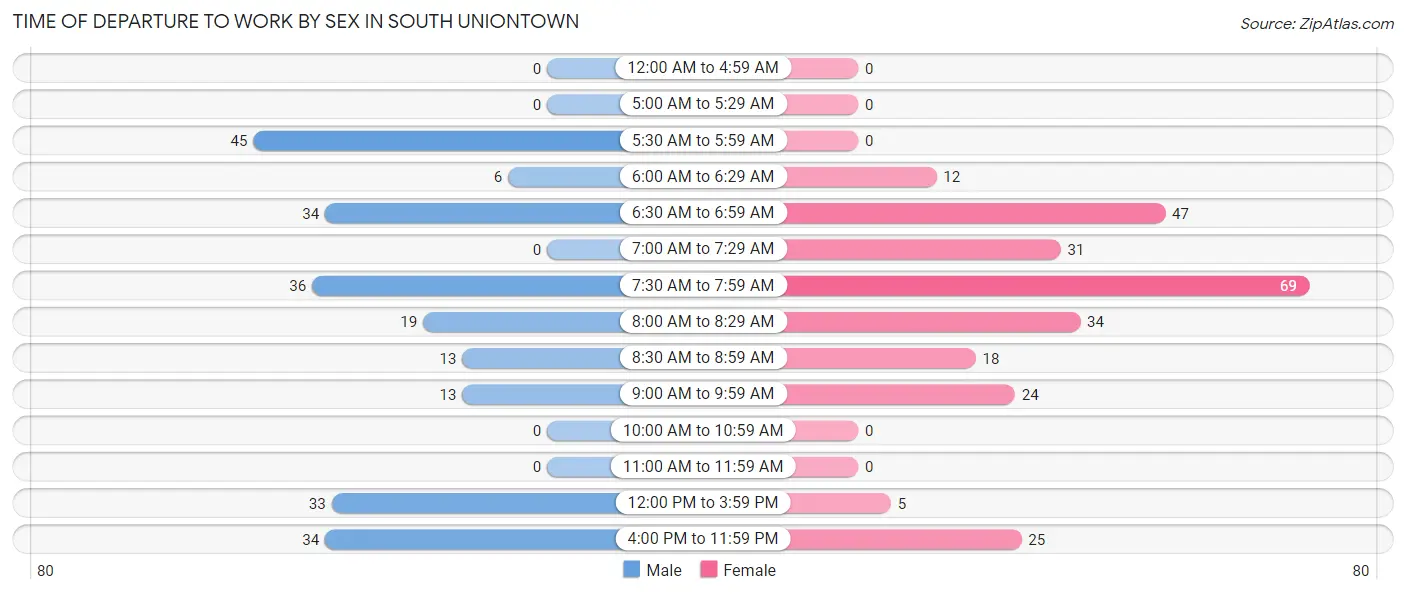
| Time of Departure | Male | Female |
| 12:00 AM to 4:59 AM | 0 (0.0%) | 0 (0.0%) |
| 5:00 AM to 5:29 AM | 0 (0.0%) | 0 (0.0%) |
| 5:30 AM to 5:59 AM | 45 (19.3%) | 0 (0.0%) |
| 6:00 AM to 6:29 AM | 6 (2.6%) | 12 (4.5%) |
| 6:30 AM to 6:59 AM | 34 (14.6%) | 47 (17.7%) |
| 7:00 AM to 7:29 AM | 0 (0.0%) | 31 (11.7%) |
| 7:30 AM to 7:59 AM | 36 (15.4%) | 69 (26.0%) |
| 8:00 AM to 8:29 AM | 19 (8.2%) | 34 (12.8%) |
| 8:30 AM to 8:59 AM | 13 (5.6%) | 18 (6.8%) |
| 9:00 AM to 9:59 AM | 13 (5.6%) | 24 (9.1%) |
| 10:00 AM to 10:59 AM | 0 (0.0%) | 0 (0.0%) |
| 11:00 AM to 11:59 AM | 0 (0.0%) | 0 (0.0%) |
| 12:00 PM to 3:59 PM | 33 (14.2%) | 5 (1.9%) |
| 4:00 PM to 11:59 PM | 34 (14.6%) | 25 (9.4%) |
| Total | 233 (100.0%) | 265 (100.0%) |
Housing Occupancy in South Uniontown
Occupancy by Ownership in South Uniontown
Of the total 587 dwellings in South Uniontown, owner-occupied units account for 544 (92.7%), while renter-occupied units make up 43 (7.3%).
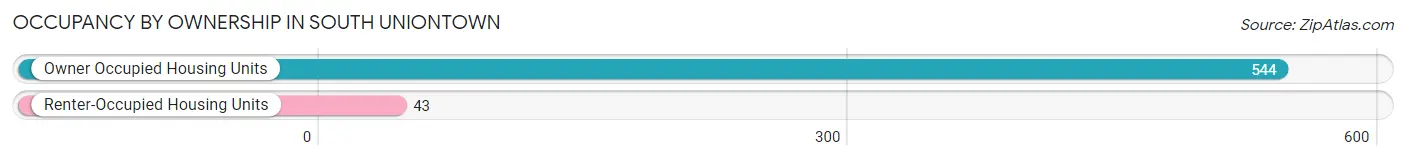
| Occupancy | # Housing Units | % Housing Units |
| Owner Occupied Housing Units | 544 | 92.7% |
| Renter-Occupied Housing Units | 43 | 7.3% |
| Total Occupied Housing Units | 587 | 100.0% |
Occupancy by Household Size in South Uniontown
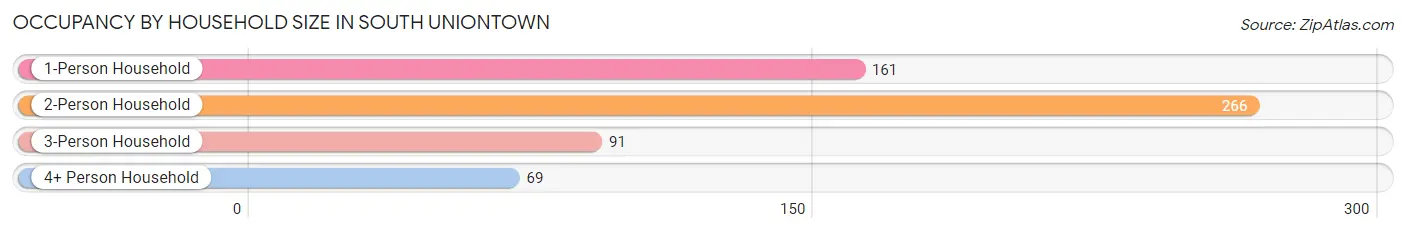
| Household Size | # Housing Units | % Housing Units |
| 1-Person Household | 161 | 27.4% |
| 2-Person Household | 266 | 45.3% |
| 3-Person Household | 91 | 15.5% |
| 4+ Person Household | 69 | 11.7% |
| Total Housing Units | 587 | 100.0% |
Occupancy by Ownership by Household Size in South Uniontown
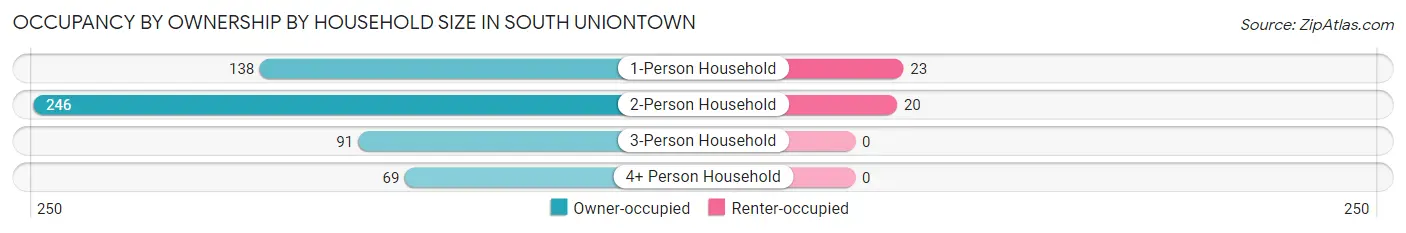
| Household Size | Owner-occupied | Renter-occupied |
| 1-Person Household | 138 (85.7%) | 23 (14.3%) |
| 2-Person Household | 246 (92.5%) | 20 (7.5%) |
| 3-Person Household | 91 (100.0%) | 0 (0.0%) |
| 4+ Person Household | 69 (100.0%) | 0 (0.0%) |
| Total Housing Units | 544 (92.7%) | 43 (7.3%) |
Occupancy by Educational Attainment in South Uniontown
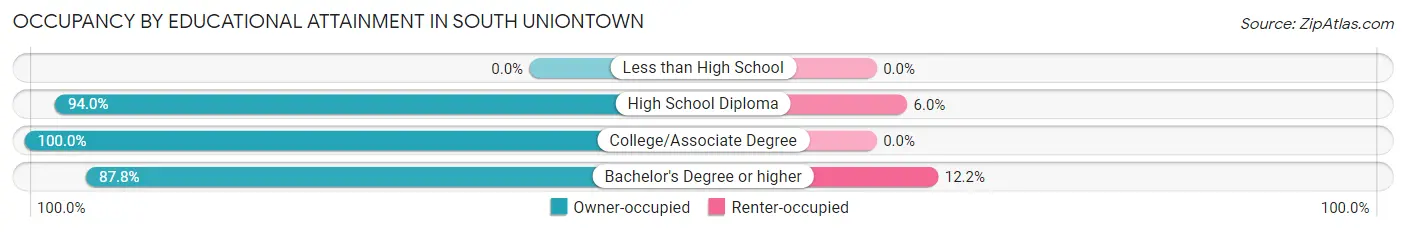
| Household Size | Owner-occupied | Renter-occupied |
| Less than High School | 0 (0.0%) | 0 (0.0%) |
| High School Diploma | 171 (94.0%) | 11 (6.0%) |
| College/Associate Degree | 143 (100.0%) | 0 (0.0%) |
| Bachelor's Degree or higher | 230 (87.8%) | 32 (12.2%) |
Occupancy by Age of Householder in South Uniontown
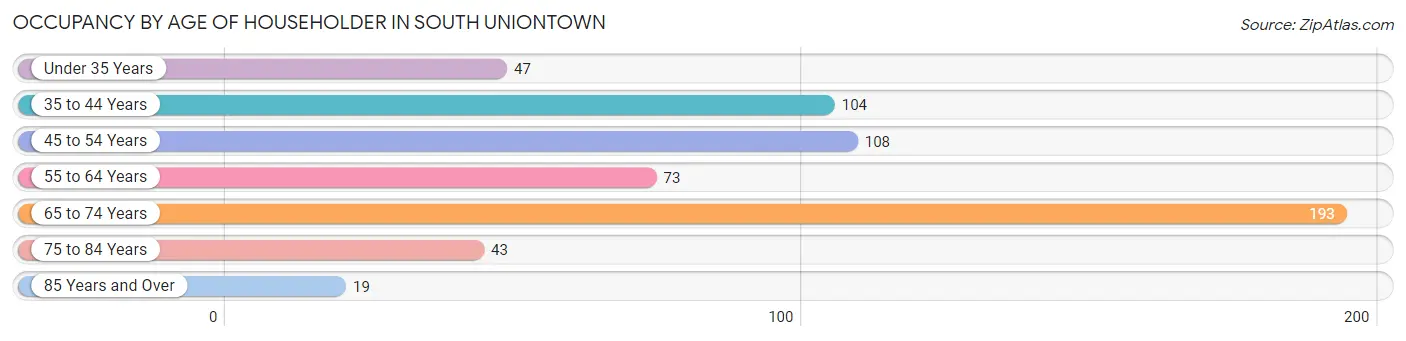
| Age Bracket | # Households | % Households |
| Under 35 Years | 47 | 8.0% |
| 35 to 44 Years | 104 | 17.7% |
| 45 to 54 Years | 108 | 18.4% |
| 55 to 64 Years | 73 | 12.4% |
| 65 to 74 Years | 193 | 32.9% |
| 75 to 84 Years | 43 | 7.3% |
| 85 Years and Over | 19 | 3.2% |
| Total | 587 | 100.0% |
Housing Finances in South Uniontown
Median Income by Occupancy in South Uniontown
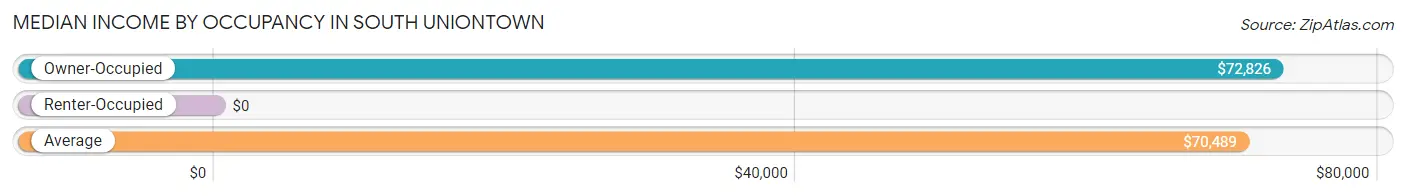
| Occupancy Type | # Households | Median Income |
| Owner-Occupied | 544 (92.7%) | $72,826 |
| Renter-Occupied | 43 (7.3%) | $0 |
| Average | 587 (100.0%) | $70,489 |
Occupancy by Householder Income Bracket in South Uniontown
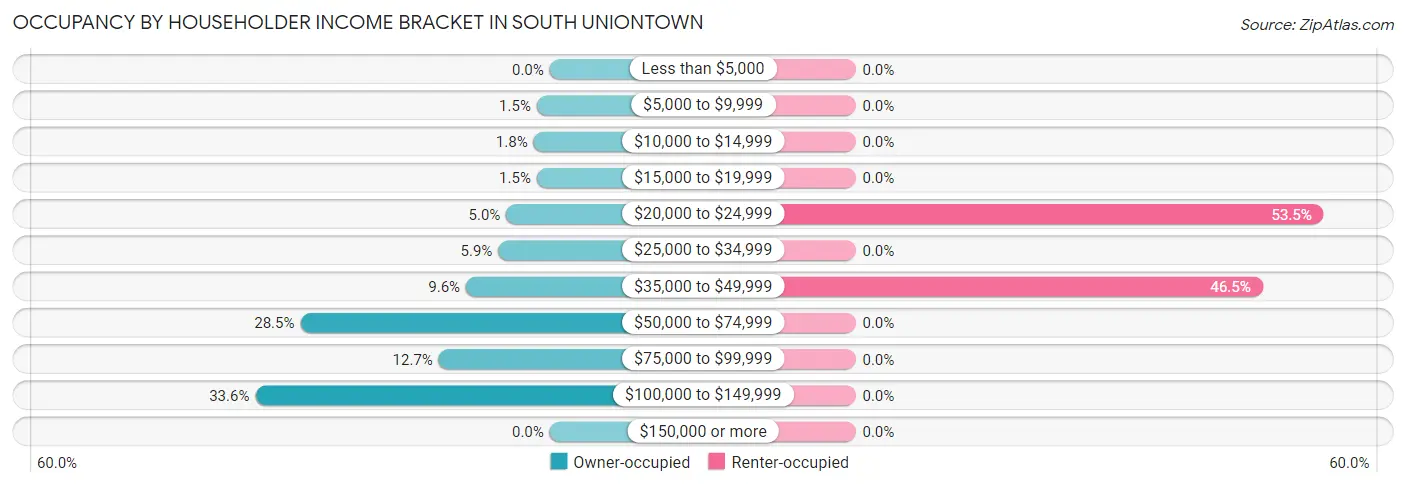
| Income Bracket | Owner-occupied | Renter-occupied |
| Less than $5,000 | 0 (0.0%) | 0 (0.0%) |
| $5,000 to $9,999 | 8 (1.5%) | 0 (0.0%) |
| $10,000 to $14,999 | 10 (1.8%) | 0 (0.0%) |
| $15,000 to $19,999 | 8 (1.5%) | 0 (0.0%) |
| $20,000 to $24,999 | 27 (5.0%) | 23 (53.5%) |
| $25,000 to $34,999 | 32 (5.9%) | 0 (0.0%) |
| $35,000 to $49,999 | 52 (9.6%) | 20 (46.5%) |
| $50,000 to $74,999 | 155 (28.5%) | 0 (0.0%) |
| $75,000 to $99,999 | 69 (12.7%) | 0 (0.0%) |
| $100,000 to $149,999 | 183 (33.6%) | 0 (0.0%) |
| $150,000 or more | 0 (0.0%) | 0 (0.0%) |
| Total | 544 (100.0%) | 43 (100.0%) |
Monthly Housing Cost Tiers in South Uniontown
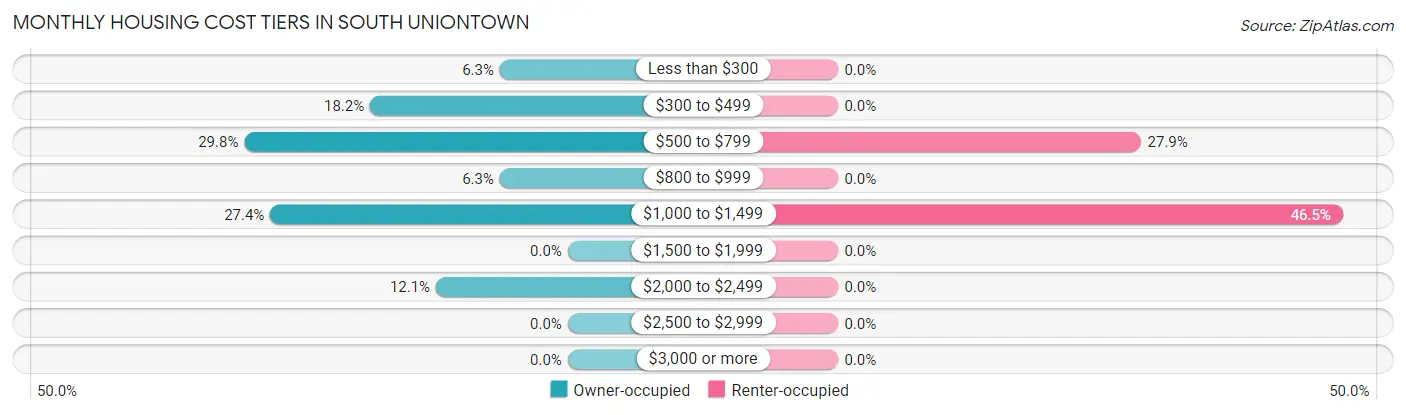
| Monthly Cost | Owner-occupied | Renter-occupied |
| Less than $300 | 34 (6.2%) | 0 (0.0%) |
| $300 to $499 | 99 (18.2%) | 0 (0.0%) |
| $500 to $799 | 162 (29.8%) | 12 (27.9%) |
| $800 to $999 | 34 (6.2%) | 0 (0.0%) |
| $1,000 to $1,499 | 149 (27.4%) | 20 (46.5%) |
| $1,500 to $1,999 | 0 (0.0%) | 0 (0.0%) |
| $2,000 to $2,499 | 66 (12.1%) | 0 (0.0%) |
| $2,500 to $2,999 | 0 (0.0%) | 0 (0.0%) |
| $3,000 or more | 0 (0.0%) | 0 (0.0%) |
| Total | 544 (100.0%) | 43 (100.0%) |
Physical Housing Characteristics in South Uniontown
Housing Structures in South Uniontown
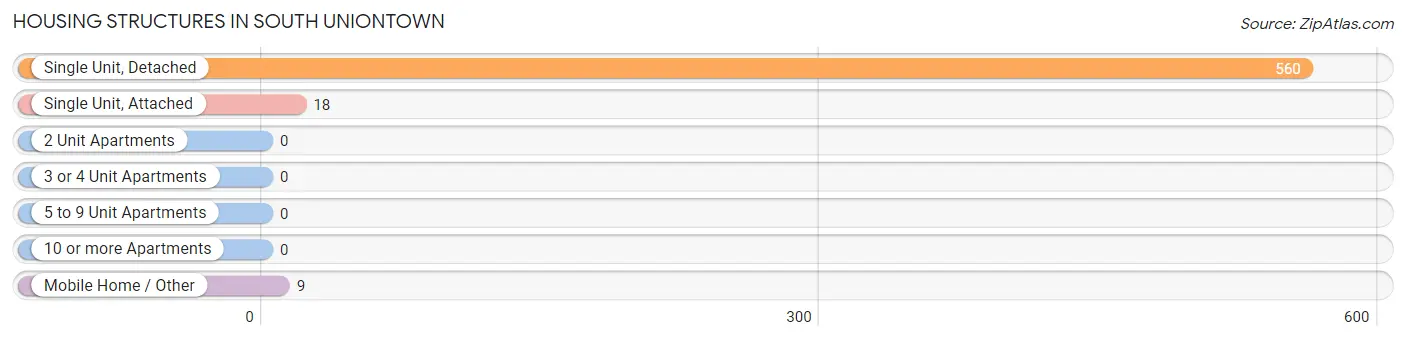
| Structure Type | # Housing Units | % Housing Units |
| Single Unit, Detached | 560 | 95.4% |
| Single Unit, Attached | 18 | 3.1% |
| 2 Unit Apartments | 0 | 0.0% |
| 3 or 4 Unit Apartments | 0 | 0.0% |
| 5 to 9 Unit Apartments | 0 | 0.0% |
| 10 or more Apartments | 0 | 0.0% |
| Mobile Home / Other | 9 | 1.5% |
| Total | 587 | 100.0% |
Housing Structures by Occupancy in South Uniontown
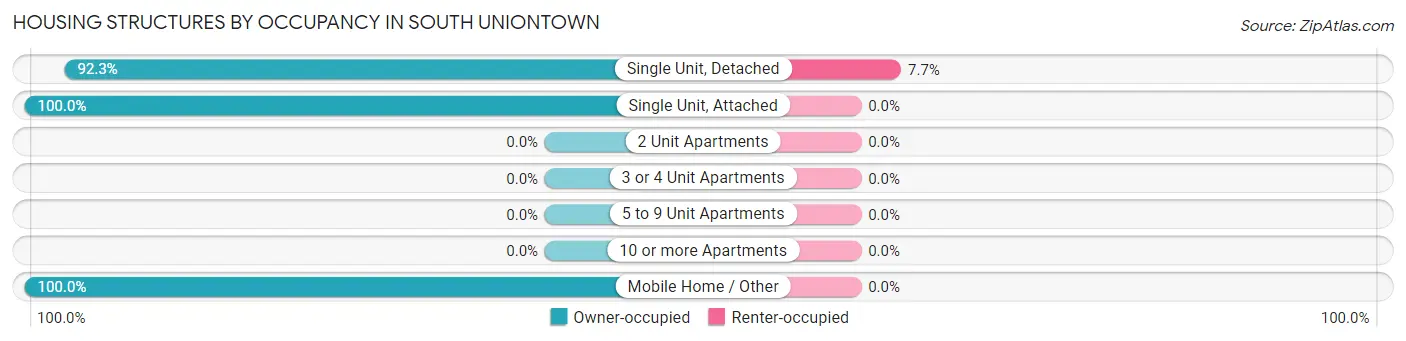
| Structure Type | Owner-occupied | Renter-occupied |
| Single Unit, Detached | 517 (92.3%) | 43 (7.7%) |
| Single Unit, Attached | 18 (100.0%) | 0 (0.0%) |
| 2 Unit Apartments | 0 (0.0%) | 0 (0.0%) |
| 3 or 4 Unit Apartments | 0 (0.0%) | 0 (0.0%) |
| 5 to 9 Unit Apartments | 0 (0.0%) | 0 (0.0%) |
| 10 or more Apartments | 0 (0.0%) | 0 (0.0%) |
| Mobile Home / Other | 9 (100.0%) | 0 (0.0%) |
| Total | 544 (92.7%) | 43 (7.3%) |
Housing Structures by Number of Rooms in South Uniontown
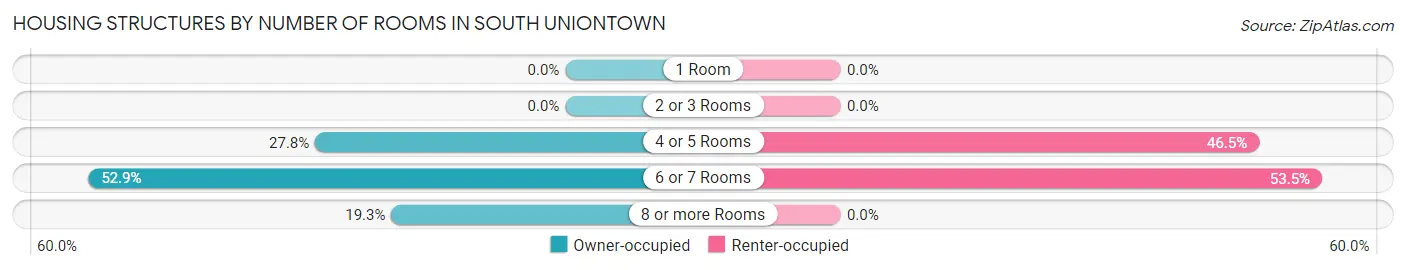
| Number of Rooms | Owner-occupied | Renter-occupied |
| 1 Room | 0 (0.0%) | 0 (0.0%) |
| 2 or 3 Rooms | 0 (0.0%) | 0 (0.0%) |
| 4 or 5 Rooms | 151 (27.8%) | 20 (46.5%) |
| 6 or 7 Rooms | 288 (52.9%) | 23 (53.5%) |
| 8 or more Rooms | 105 (19.3%) | 0 (0.0%) |
| Total | 544 (100.0%) | 43 (100.0%) |
Housing Structure by Heating Type in South Uniontown
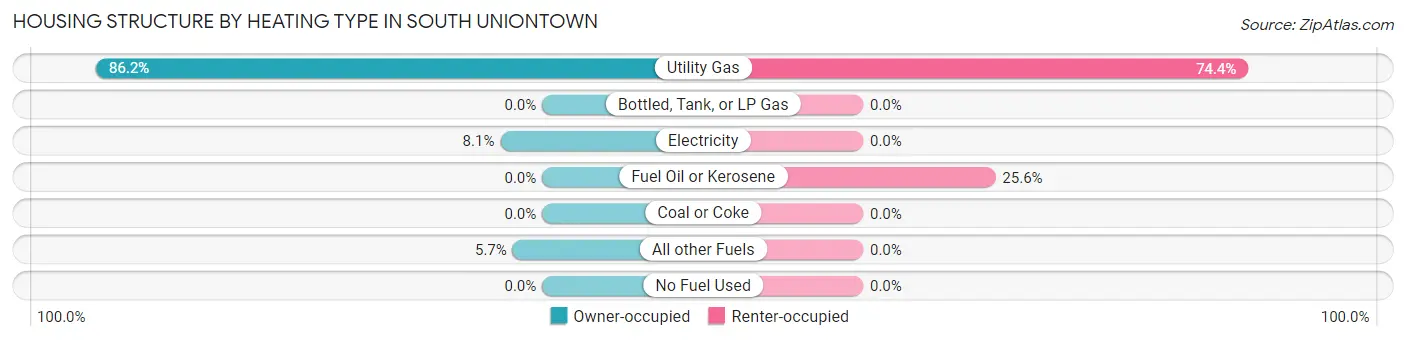
| Heating Type | Owner-occupied | Renter-occupied |
| Utility Gas | 469 (86.2%) | 32 (74.4%) |
| Bottled, Tank, or LP Gas | 0 (0.0%) | 0 (0.0%) |
| Electricity | 44 (8.1%) | 0 (0.0%) |
| Fuel Oil or Kerosene | 0 (0.0%) | 11 (25.6%) |
| Coal or Coke | 0 (0.0%) | 0 (0.0%) |
| All other Fuels | 31 (5.7%) | 0 (0.0%) |
| No Fuel Used | 0 (0.0%) | 0 (0.0%) |
| Total | 544 (100.0%) | 43 (100.0%) |
Household Vehicle Usage in South Uniontown
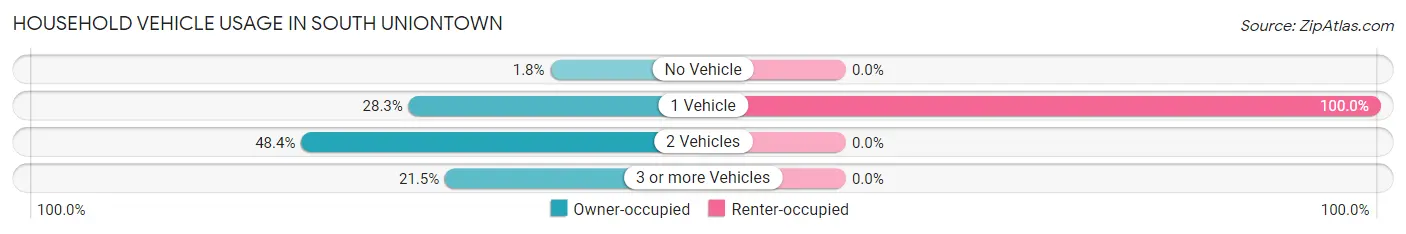
| Vehicles per Household | Owner-occupied | Renter-occupied |
| No Vehicle | 10 (1.8%) | 0 (0.0%) |
| 1 Vehicle | 154 (28.3%) | 43 (100.0%) |
| 2 Vehicles | 263 (48.3%) | 0 (0.0%) |
| 3 or more Vehicles | 117 (21.5%) | 0 (0.0%) |
| Total | 544 (100.0%) | 43 (100.0%) |
Real Estate & Mortgages in South Uniontown
Real Estate and Mortgage Overview in South Uniontown
| Characteristic | Without Mortgage | With Mortgage |
| Housing Units | 244 | 300 |
| Median Property Value | $129,400 | $142,400 |
| Median Household Income | $68,017 | $0 |
| Monthly Housing Costs | $462 | $0 |
| Real Estate Taxes | $1,157 | $15 |
Property Value by Mortgage Status in South Uniontown
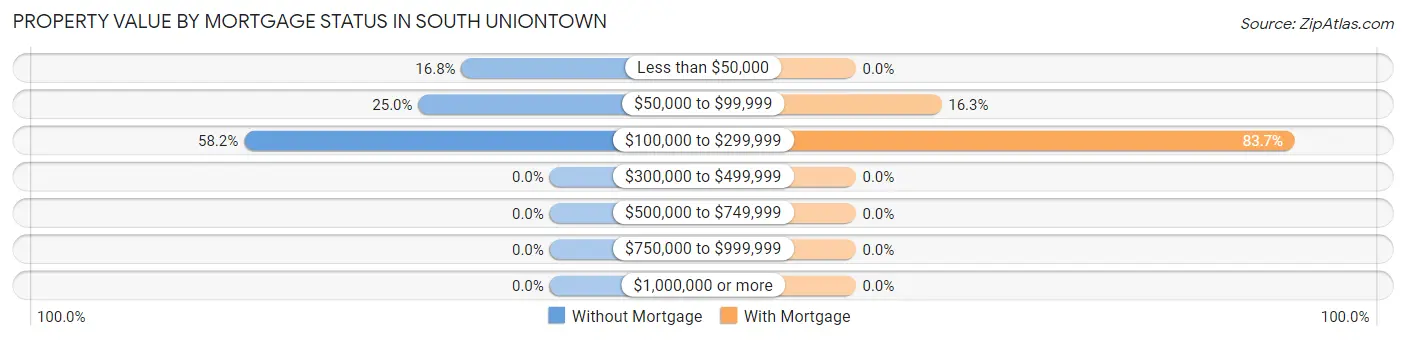
| Property Value | Without Mortgage | With Mortgage |
| Less than $50,000 | 41 (16.8%) | 0 (0.0%) |
| $50,000 to $99,999 | 61 (25.0%) | 49 (16.3%) |
| $100,000 to $299,999 | 142 (58.2%) | 251 (83.7%) |
| $300,000 to $499,999 | 0 (0.0%) | 0 (0.0%) |
| $500,000 to $749,999 | 0 (0.0%) | 0 (0.0%) |
| $750,000 to $999,999 | 0 (0.0%) | 0 (0.0%) |
| $1,000,000 or more | 0 (0.0%) | 0 (0.0%) |
| Total | 244 (100.0%) | 300 (100.0%) |
Household Income by Mortgage Status in South Uniontown
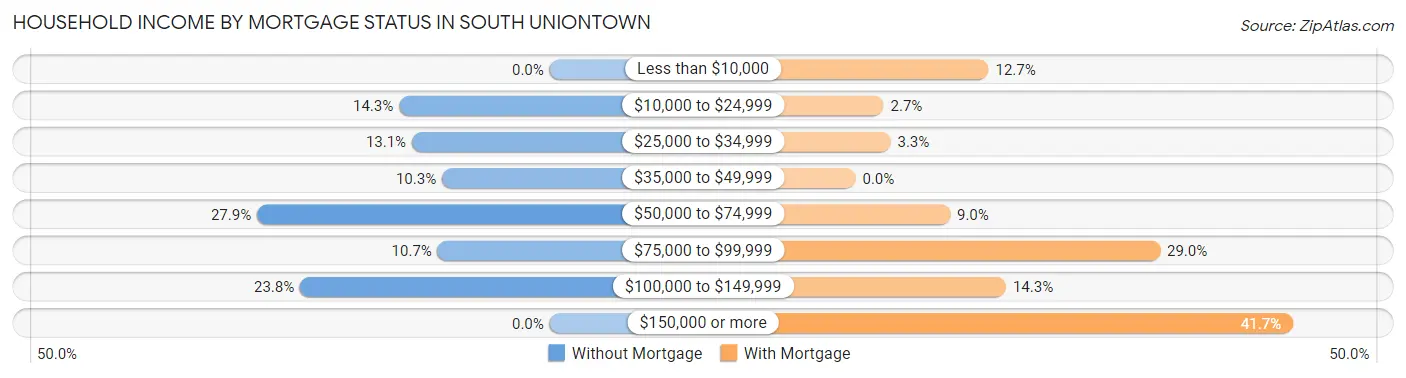
| Household Income | Without Mortgage | With Mortgage |
| Less than $10,000 | 0 (0.0%) | 38 (12.7%) |
| $10,000 to $24,999 | 35 (14.3%) | 8 (2.7%) |
| $25,000 to $34,999 | 32 (13.1%) | 10 (3.3%) |
| $35,000 to $49,999 | 25 (10.2%) | 0 (0.0%) |
| $50,000 to $74,999 | 68 (27.9%) | 27 (9.0%) |
| $75,000 to $99,999 | 26 (10.7%) | 87 (29.0%) |
| $100,000 to $149,999 | 58 (23.8%) | 43 (14.3%) |
| $150,000 or more | 0 (0.0%) | 125 (41.7%) |
| Total | 244 (100.0%) | 300 (100.0%) |
Property Value to Household Income Ratio in South Uniontown
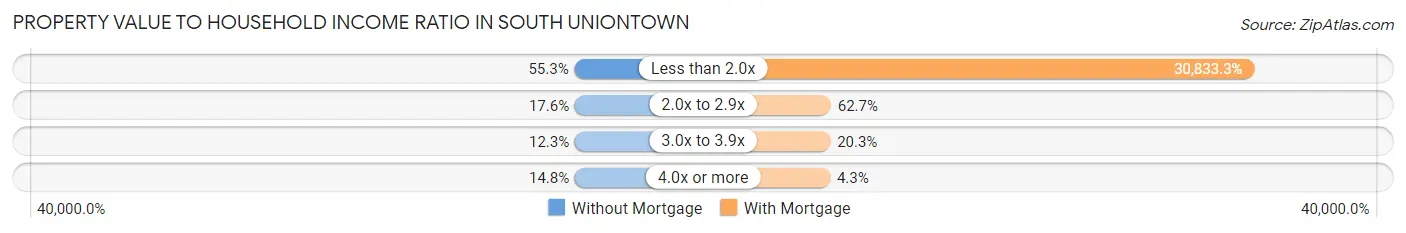
| Value-to-Income Ratio | Without Mortgage | With Mortgage |
| Less than 2.0x | 135 (55.3%) | 92,500 (30,833.3%) |
| 2.0x to 2.9x | 43 (17.6%) | 188 (62.7%) |
| 3.0x to 3.9x | 30 (12.3%) | 61 (20.3%) |
| 4.0x or more | 36 (14.7%) | 13 (4.3%) |
| Total | 244 (100.0%) | 300 (100.0%) |
Real Estate Taxes by Mortgage Status in South Uniontown
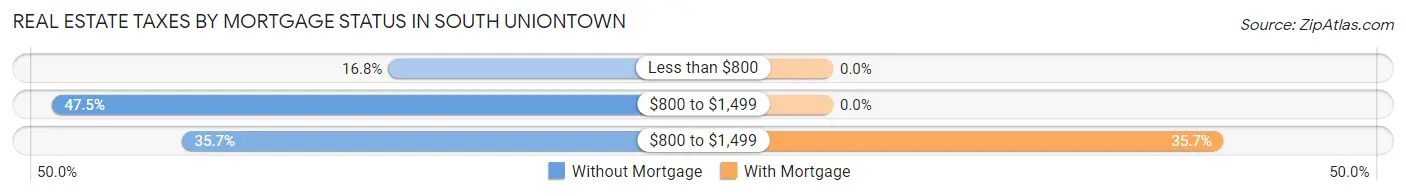
| Property Taxes | Without Mortgage | With Mortgage |
| Less than $800 | 41 (16.8%) | 0 (0.0%) |
| $800 to $1,499 | 116 (47.5%) | 0 (0.0%) |
| $800 to $1,499 | 87 (35.7%) | 107 (35.7%) |
| Total | 244 (100.0%) | 300 (100.0%) |
Health & Disability in South Uniontown
Health Insurance Coverage by Age in South Uniontown
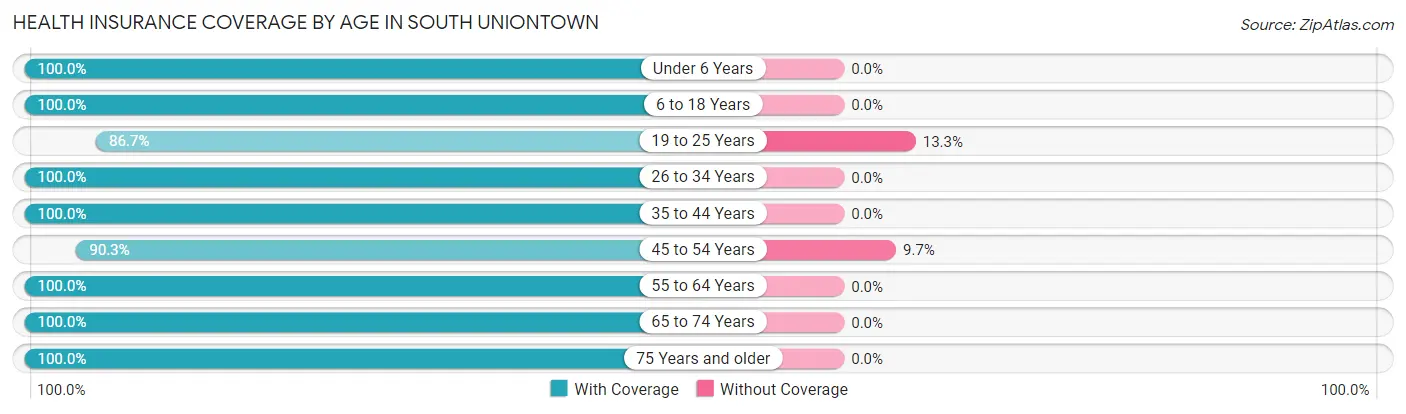
| Age Bracket | With Coverage | Without Coverage |
| Under 6 Years | 45 (100.0%) | 0 (0.0%) |
| 6 to 18 Years | 150 (100.0%) | 0 (0.0%) |
| 19 to 25 Years | 65 (86.7%) | 10 (13.3%) |
| 26 to 34 Years | 75 (100.0%) | 0 (0.0%) |
| 35 to 44 Years | 163 (100.0%) | 0 (0.0%) |
| 45 to 54 Years | 159 (90.3%) | 17 (9.7%) |
| 55 to 64 Years | 138 (100.0%) | 0 (0.0%) |
| 65 to 74 Years | 313 (100.0%) | 0 (0.0%) |
| 75 Years and older | 81 (100.0%) | 0 (0.0%) |
| Total | 1,189 (97.8%) | 27 (2.2%) |
Health Insurance Coverage by Citizenship Status in South Uniontown
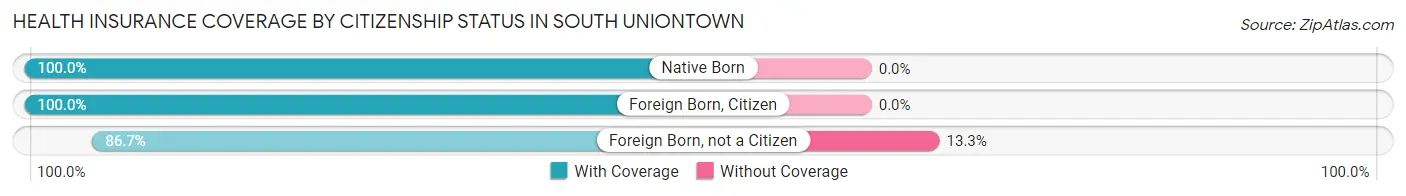
| Citizenship Status | With Coverage | Without Coverage |
| Native Born | 45 (100.0%) | 0 (0.0%) |
| Foreign Born, Citizen | 150 (100.0%) | 0 (0.0%) |
| Foreign Born, not a Citizen | 65 (86.7%) | 10 (13.3%) |
Health Insurance Coverage by Household Income in South Uniontown
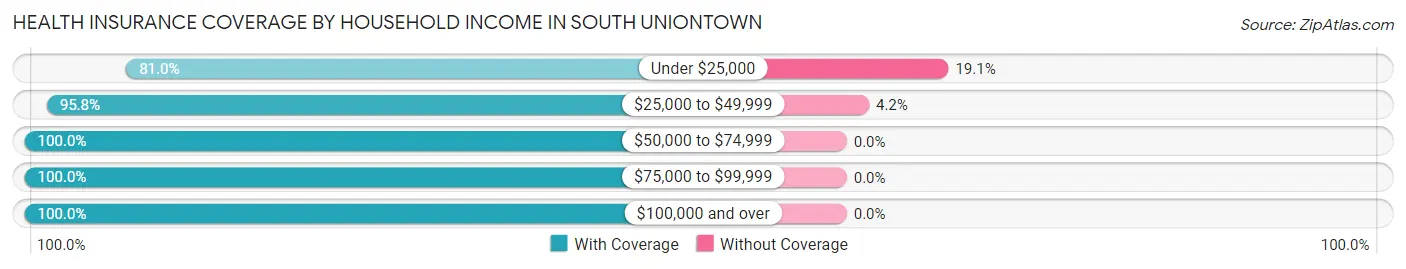
| Household Income | With Coverage | Without Coverage |
| Under $25,000 | 85 (80.9%) | 20 (19.1%) |
| $25,000 to $49,999 | 161 (95.8%) | 7 (4.2%) |
| $50,000 to $74,999 | 288 (100.0%) | 0 (0.0%) |
| $75,000 to $99,999 | 224 (100.0%) | 0 (0.0%) |
| $100,000 and over | 431 (100.0%) | 0 (0.0%) |
Public vs Private Health Insurance Coverage by Age in South Uniontown
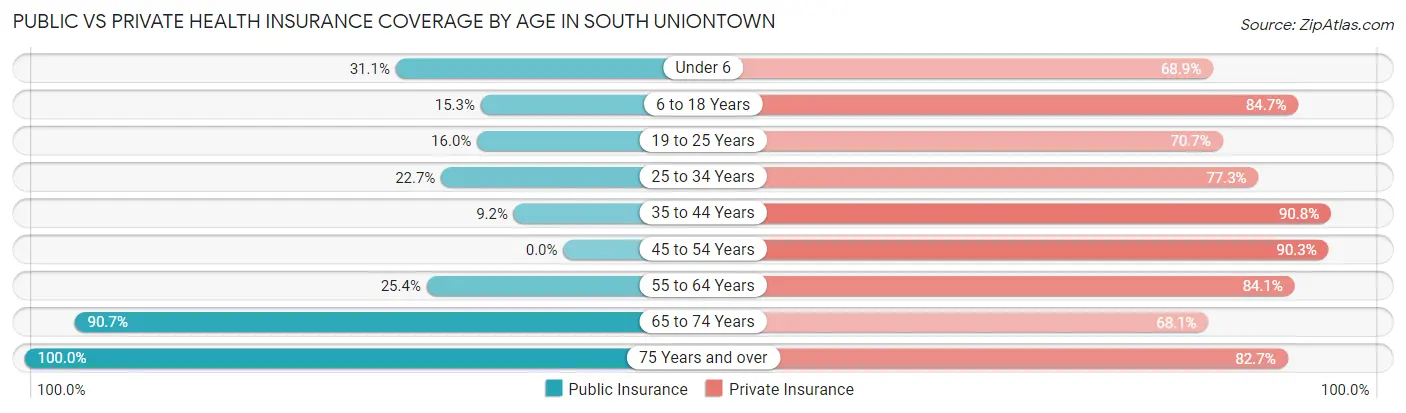
| Age Bracket | Public Insurance | Private Insurance |
| Under 6 | 14 (31.1%) | 31 (68.9%) |
| 6 to 18 Years | 23 (15.3%) | 127 (84.7%) |
| 19 to 25 Years | 12 (16.0%) | 53 (70.7%) |
| 25 to 34 Years | 17 (22.7%) | 58 (77.3%) |
| 35 to 44 Years | 15 (9.2%) | 148 (90.8%) |
| 45 to 54 Years | 0 (0.0%) | 159 (90.3%) |
| 55 to 64 Years | 35 (25.4%) | 116 (84.1%) |
| 65 to 74 Years | 284 (90.7%) | 213 (68.0%) |
| 75 Years and over | 81 (100.0%) | 67 (82.7%) |
| Total | 481 (39.6%) | 972 (79.9%) |
Disability Status by Sex by Age in South Uniontown
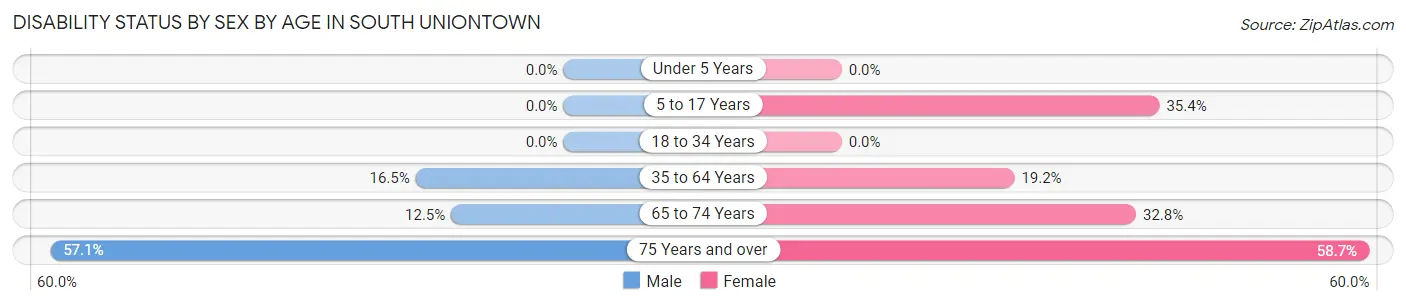
| Age Bracket | Male | Female |
| Under 5 Years | 0 (0.0%) | 0 (0.0%) |
| 5 to 17 Years | 0 (0.0%) | 23 (35.4%) |
| 18 to 34 Years | 0 (0.0%) | 0 (0.0%) |
| 35 to 64 Years | 40 (16.5%) | 45 (19.2%) |
| 65 to 74 Years | 17 (12.5%) | 58 (32.8%) |
| 75 Years and over | 20 (57.1%) | 27 (58.7%) |
Disability Class by Sex by Age in South Uniontown
Disability Class: Hearing Difficulty
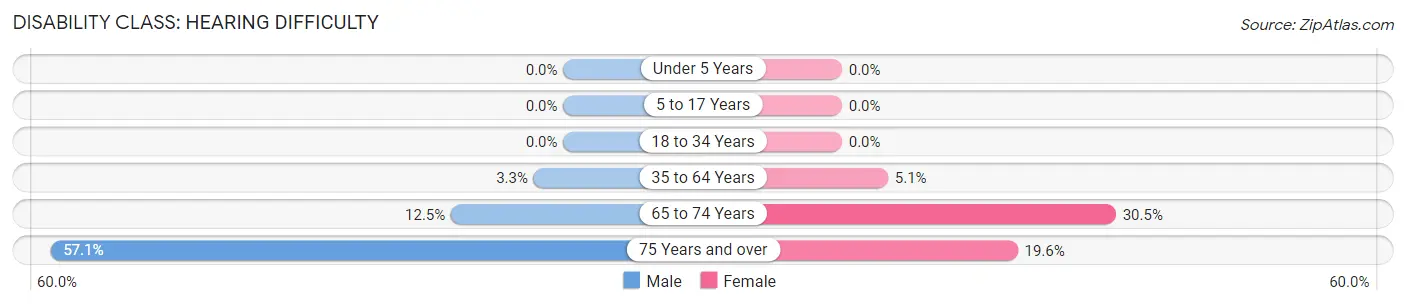
| Age Bracket | Male | Female |
| Under 5 Years | 0 (0.0%) | 0 (0.0%) |
| 5 to 17 Years | 0 (0.0%) | 0 (0.0%) |
| 18 to 34 Years | 0 (0.0%) | 0 (0.0%) |
| 35 to 64 Years | 8 (3.3%) | 12 (5.1%) |
| 65 to 74 Years | 17 (12.5%) | 54 (30.5%) |
| 75 Years and over | 20 (57.1%) | 9 (19.6%) |
Disability Class: Vision Difficulty
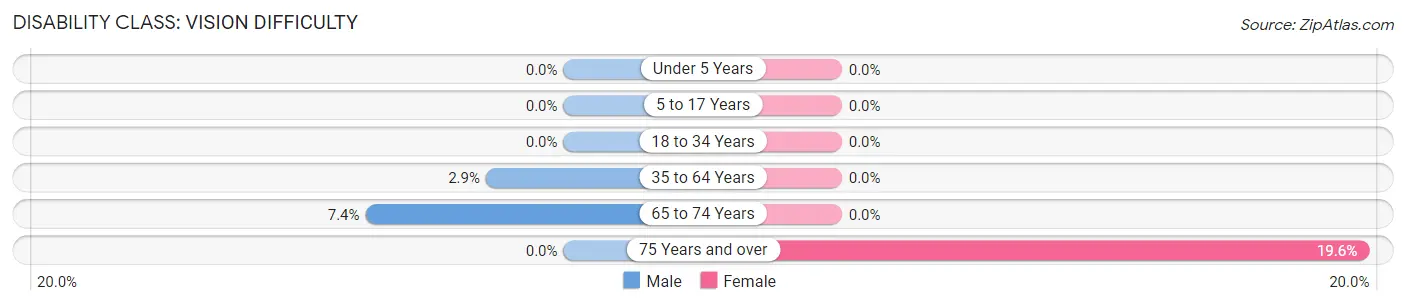
| Age Bracket | Male | Female |
| Under 5 Years | 0 (0.0%) | 0 (0.0%) |
| 5 to 17 Years | 0 (0.0%) | 0 (0.0%) |
| 18 to 34 Years | 0 (0.0%) | 0 (0.0%) |
| 35 to 64 Years | 7 (2.9%) | 0 (0.0%) |
| 65 to 74 Years | 10 (7.3%) | 0 (0.0%) |
| 75 Years and over | 0 (0.0%) | 9 (19.6%) |
Disability Class: Cognitive Difficulty
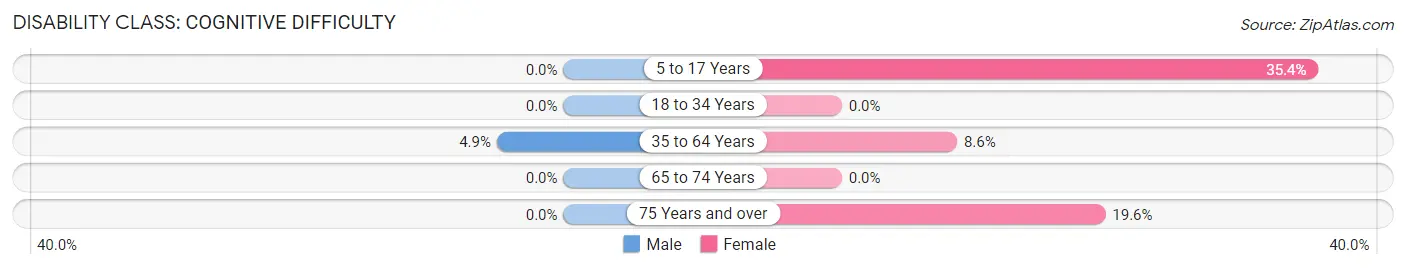
| Age Bracket | Male | Female |
| 5 to 17 Years | 0 (0.0%) | 23 (35.4%) |
| 18 to 34 Years | 0 (0.0%) | 0 (0.0%) |
| 35 to 64 Years | 12 (4.9%) | 20 (8.6%) |
| 65 to 74 Years | 0 (0.0%) | 0 (0.0%) |
| 75 Years and over | 0 (0.0%) | 9 (19.6%) |
Disability Class: Ambulatory Difficulty
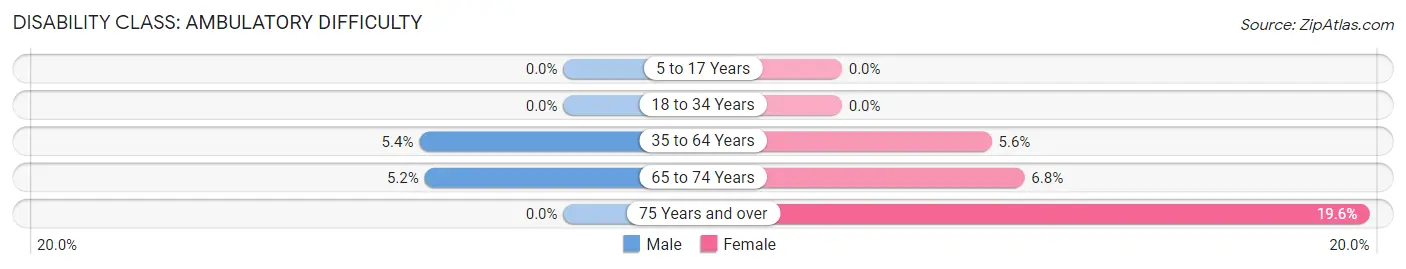
| Age Bracket | Male | Female |
| 5 to 17 Years | 0 (0.0%) | 0 (0.0%) |
| 18 to 34 Years | 0 (0.0%) | 0 (0.0%) |
| 35 to 64 Years | 13 (5.3%) | 13 (5.6%) |
| 65 to 74 Years | 7 (5.1%) | 12 (6.8%) |
| 75 Years and over | 0 (0.0%) | 9 (19.6%) |
Disability Class: Self-Care Difficulty
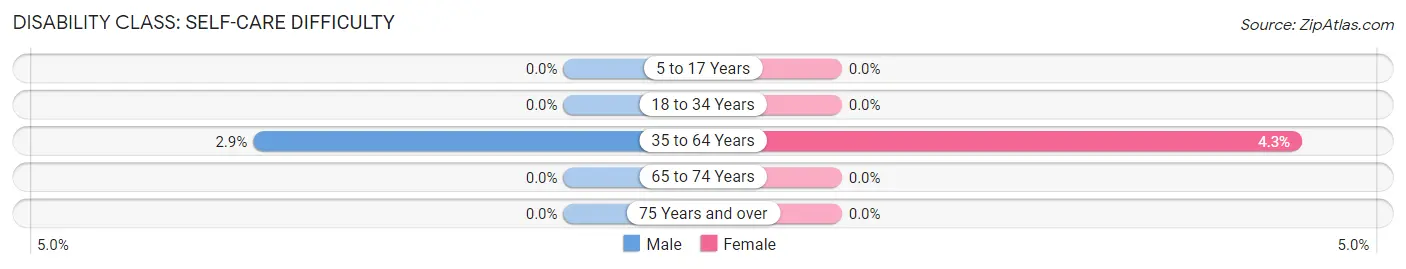
| Age Bracket | Male | Female |
| 5 to 17 Years | 0 (0.0%) | 0 (0.0%) |
| 18 to 34 Years | 0 (0.0%) | 0 (0.0%) |
| 35 to 64 Years | 7 (2.9%) | 10 (4.3%) |
| 65 to 74 Years | 0 (0.0%) | 0 (0.0%) |
| 75 Years and over | 0 (0.0%) | 0 (0.0%) |
Technology Access in South Uniontown
Computing Device Access in South Uniontown
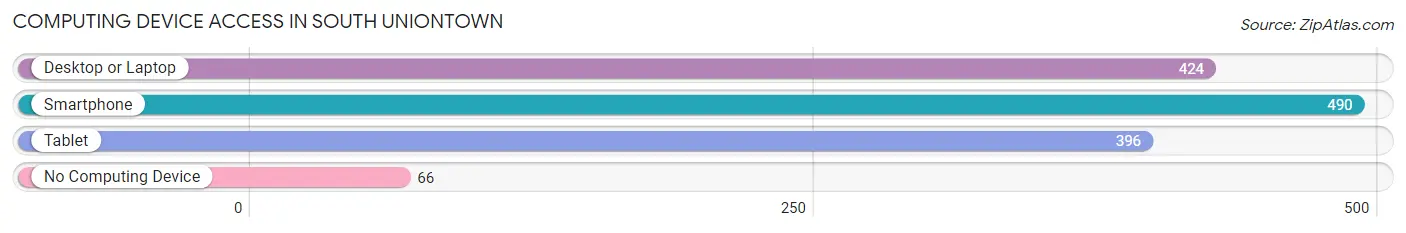
| Device Type | # Households | % Households |
| Desktop or Laptop | 424 | 72.2% |
| Smartphone | 490 | 83.5% |
| Tablet | 396 | 67.5% |
| No Computing Device | 66 | 11.2% |
| Total | 587 | 100.0% |
Internet Access in South Uniontown
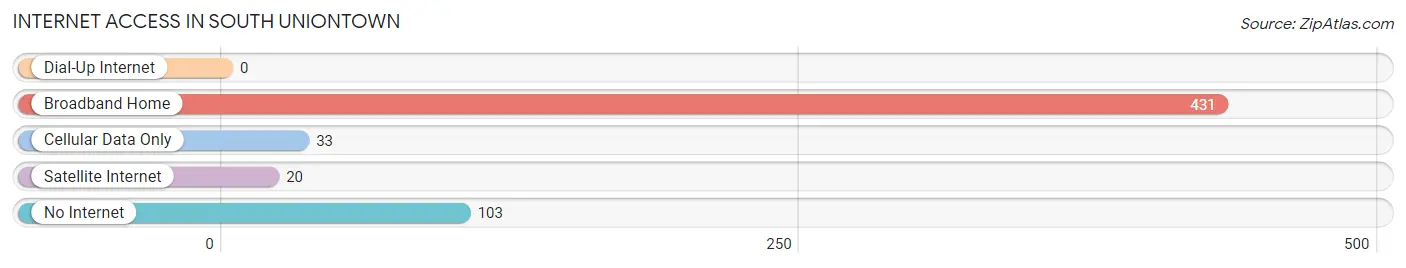
| Internet Type | # Households | % Households |
| Dial-Up Internet | 0 | 0.0% |
| Broadband Home | 431 | 73.4% |
| Cellular Data Only | 33 | 5.6% |
| Satellite Internet | 20 | 3.4% |
| No Internet | 103 | 17.5% |
| Total | 587 | 100.0% |
South Uniontown Summary
Uniontown, Pennsylvania is a city located in Fayette County, Pennsylvania. It is the county seat of Fayette County and is located in the southwestern part of the state. The city is situated in the Laurel Highlands region of the Allegheny Mountains and is part of the Pittsburgh metropolitan area. Uniontown is located approximately 50 miles south of Pittsburgh and is the largest city in Fayette County.
History
Uniontown was founded in 1776 by William Burdsall, a settler from Maryland. The town was originally known as Burdsall's Town, but was later renamed Uniontown in 1793. The name was chosen to reflect the town's location at the junction of two major roads, the National Road and the Pittsburgh-Cumberland Road.
Uniontown was an important stop on the Underground Railroad, a network of secret routes and safe houses used by African-American slaves to escape to freedom in the northern United States and Canada. The town was also the site of the Battle of Uniontown during the American Civil War.
Geography
Uniontown is located at the confluence of the Monongahela and Youghiogheny Rivers. The city has a total area of 4.2 square miles, all of which is land. The city is located in the Appalachian Mountains and is surrounded by rolling hills and forests.
Economy
Uniontown's economy is largely based on manufacturing and retail. The city is home to several large manufacturing companies, including the Uniontown Steel Company, the Uniontown Glass Company, and the Uniontown Brick Company. The city is also home to several retail stores, including Walmart, Target, and Kmart.
Demographics
As of the 2010 census, Uniontown had a population of 10,372. The racial makeup of the city was 79.2% White, 15.7% African American, 0.3% Native American, 0.4% Asian, 0.1% Pacific Islander, and 4.3% from two or more races. Hispanic or Latino of any race were 1.7% of the population.
The median household income in Uniontown was $30,945, and the median family income was $37,813. The per capita income for the city was $17,845. About 17.2% of families and 20.3% of the population were below the poverty line, including 28.2% of those under age 18 and 11.2% of those age 65 or over.
Uniontown is served by the Uniontown Area School District, which consists of five elementary schools, two middle schools, and one high school. The city is also home to the University of Pittsburgh at Uniontown, a branch of the University of Pittsburgh.
Common Questions
What is the Total Population of South Uniontown?
Total Population of South Uniontown is 1,216.
What is the Total Male Population of South Uniontown?
Total Male Population of South Uniontown is 598.
What is the Total Female Population of South Uniontown?
Total Female Population of South Uniontown is 618.
What is the Ratio of Males per 100 Females in South Uniontown?
There are 96.76 Males per 100 Females in South Uniontown.
What is the Ratio of Females per 100 Males in South Uniontown?
There are 103.34 Females per 100 Males in South Uniontown.
What is the Median Population Age in South Uniontown?
Median Population Age in South Uniontown is 49.4 Years.
What is the Average Family Size in South Uniontown
Average Family Size in South Uniontown is 2.5 People.
What is the Average Household Size in South Uniontown
Average Household Size in South Uniontown is 2.1 People.
What is Per Capita Income in South Uniontown?
Per Capita income in South Uniontown is $37,244.
What is the Median Family Income in South Uniontown?
Median Family Income in South Uniontown is $93,173.
What is the Median Household income in South Uniontown?
Median Household Income in South Uniontown is $70,489.
What is Income or Wage Gap in South Uniontown?
Income or Wage Gap in South Uniontown is 58.2%.
Women in South Uniontown earn 41.8 cents for every dollar earned by a man.
What is Inequality or Gini Index in South Uniontown?
Inequality or Gini Index in South Uniontown is 0.29.
How Large is the Labor Force in South Uniontown?
There are 576 People in the Labor Forcein in South Uniontown.
What is the Percentage of People in the Labor Force in South Uniontown?
55.1% of People are in the Labor Force in South Uniontown.
What is the Unemployment Rate in South Uniontown?
Unemployment Rate in South Uniontown is 1.2%.