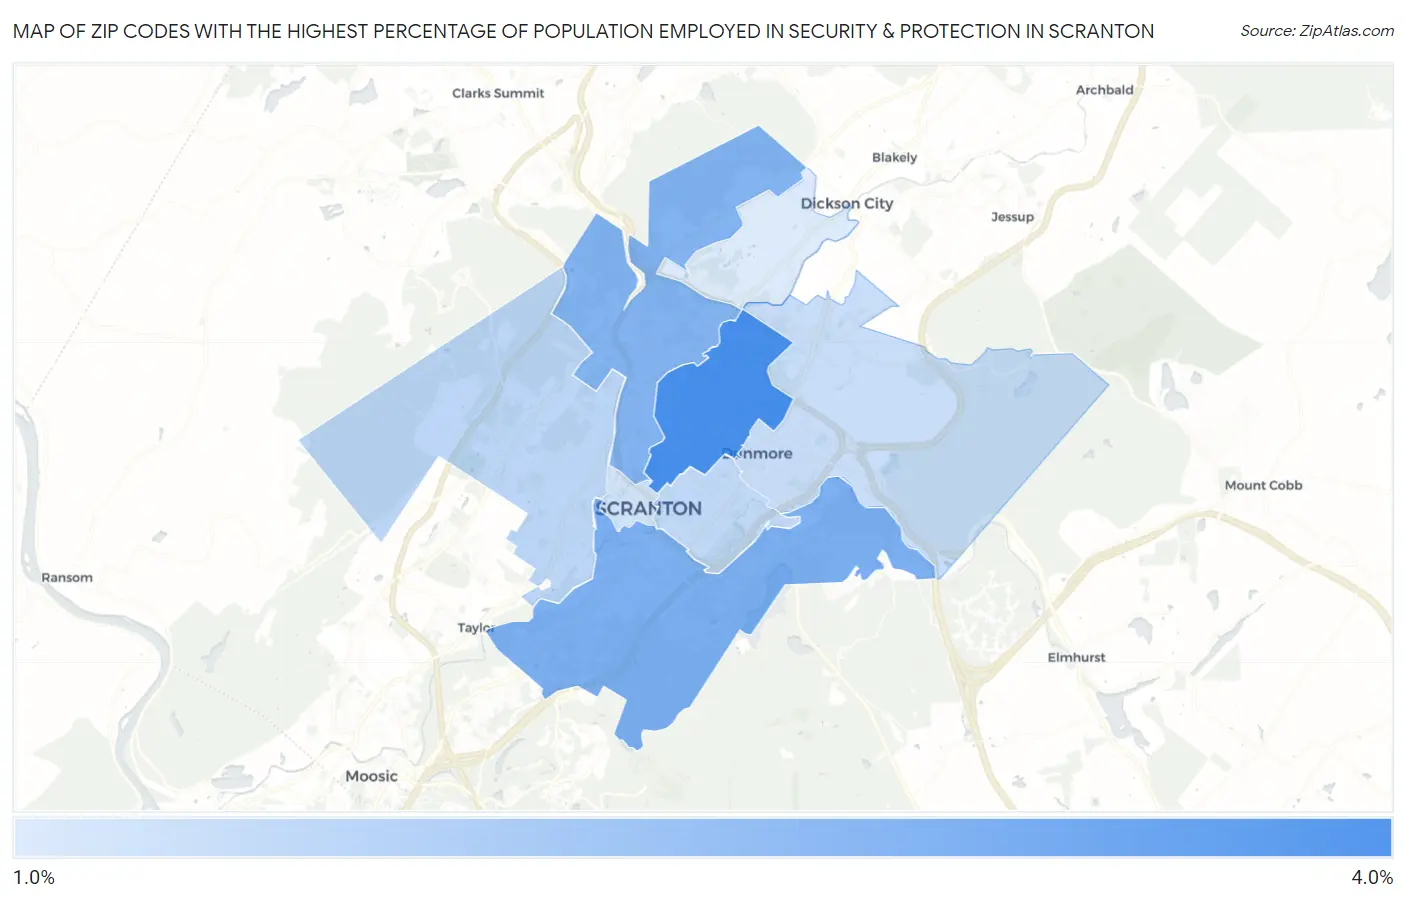
Zip Codes with the Highest Percentage of Population Employed in Security & Protection in Scranton, PA
RELATED REPORTS & OPTIONS
Security & Protection
Scranton
Compare Zip Codes
Map of Zip Codes with the Highest Percentage of Population Employed in Security & Protection in Scranton
0.0%
4.0%
Zip Codes with the Highest Percentage of Population Employed in Security & Protection in Scranton, PA
| Zip Code | % Employed | vs State | vs National | |
| 1. | 18509 | 3.9% | 2.0%(+1.90)#206 | 2.1%(+1.77)#4,657 |
| 2. | 18505 | 3.1% | 2.0%(+1.07)#318 | 2.1%(+0.946)#6,907 |
| 3. | 18508 | 3.0% | 2.0%(+0.950)#343 | 2.1%(+0.821)#7,344 |
| 4. | 18504 | 2.1% | 2.0%(+0.072)#591 | 2.1%(-0.056)#11,966 |
| 5. | 18510 | 2.0% | 2.0%(+0.014)#612 | 2.1%(-0.115)#12,346 |
| 6. | 18512 | 1.9% | 2.0%(-0.108)#653 | 2.1%(-0.237)#13,138 |
| 7. | 18503 | 1.8% | 2.0%(-0.254)#725 | 2.1%(-0.382)#14,185 |
| 8. | 18519 | 1.6% | 2.0%(-0.424)#797 | 2.1%(-0.552)#15,448 |
1
Common Questions
What are the Top 5 Zip Codes with the Highest Percentage of Population Employed in Security & Protection in Scranton, PA?
Top 5 Zip Codes with the Highest Percentage of Population Employed in Security & Protection in Scranton, PA are:
What zip code has the Highest Percentage of Population Employed in Security & Protection in Scranton, PA?
18509 has the Highest Percentage of Population Employed in Security & Protection in Scranton, PA with 3.9%.
What is the Percentage of Population Employed in Security & Protection in Scranton, PA?
Percentage of Population Employed in Security & Protection in Scranton is 2.8%.
What is the Percentage of Population Employed in Security & Protection in Pennsylvania?
Percentage of Population Employed in Security & Protection in Pennsylvania is 2.0%.
What is the Percentage of Population Employed in Security & Protection in the United States?
Percentage of Population Employed in Security & Protection in the United States is 2.1%.