Centre Hall borough, PA
Centre Hall borough Overview
1,472
TOTAL POPULATION
698
MALE POPULATION
774
FEMALE POPULATION
90.18
MALES / 100 FEMALES
110.89
FEMALES / 100 MALES
46.4
MEDIAN AGE
2.9
AVG FAMILY SIZE
2.4
AVG HOUSEHOLD SIZE
$30,328
PER CAPITA INCOME
$77,143
AVG FAMILY INCOME
$63,942
AVG HOUSEHOLD INCOME
38.8%
WAGE / INCOME GAP [ % ]
61.2¢/ $1
WAGE / INCOME GAP [ $ ]
0.33
INEQUALITY / GINI INDEX
751
LABOR FORCE [ PEOPLE ]
64.4%
PERCENT IN LABOR FORCE
5.5%
UNEMPLOYMENT RATE
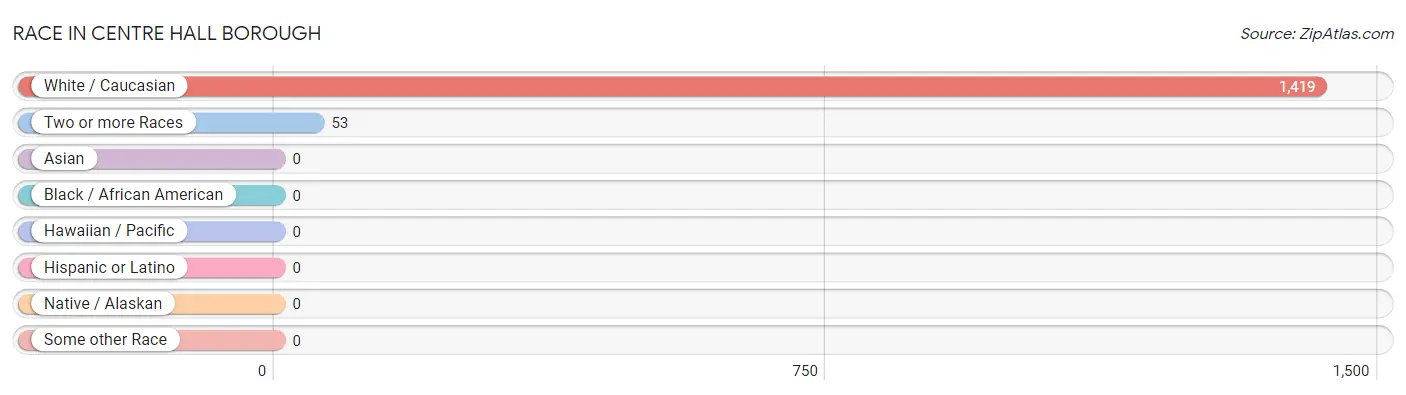
Race in Centre Hall borough
The most populous races in Centre Hall borough are White / Caucasian (1,419 | 96.4%), and Two or more Races (53 | 3.6%).
| Race | # Population | % Population |
| Asian | 0 | 0.0% |
| Black / African American | 0 | 0.0% |
| Hawaiian / Pacific | 0 | 0.0% |
| Hispanic or Latino | 0 | 0.0% |
| Native / Alaskan | 0 | 0.0% |
| White / Caucasian | 1,419 | 96.4% |
| Two or more Races | 53 | 3.6% |
| Some other Race | 0 | 0.0% |
| Total | 1,472 | 100.0% |
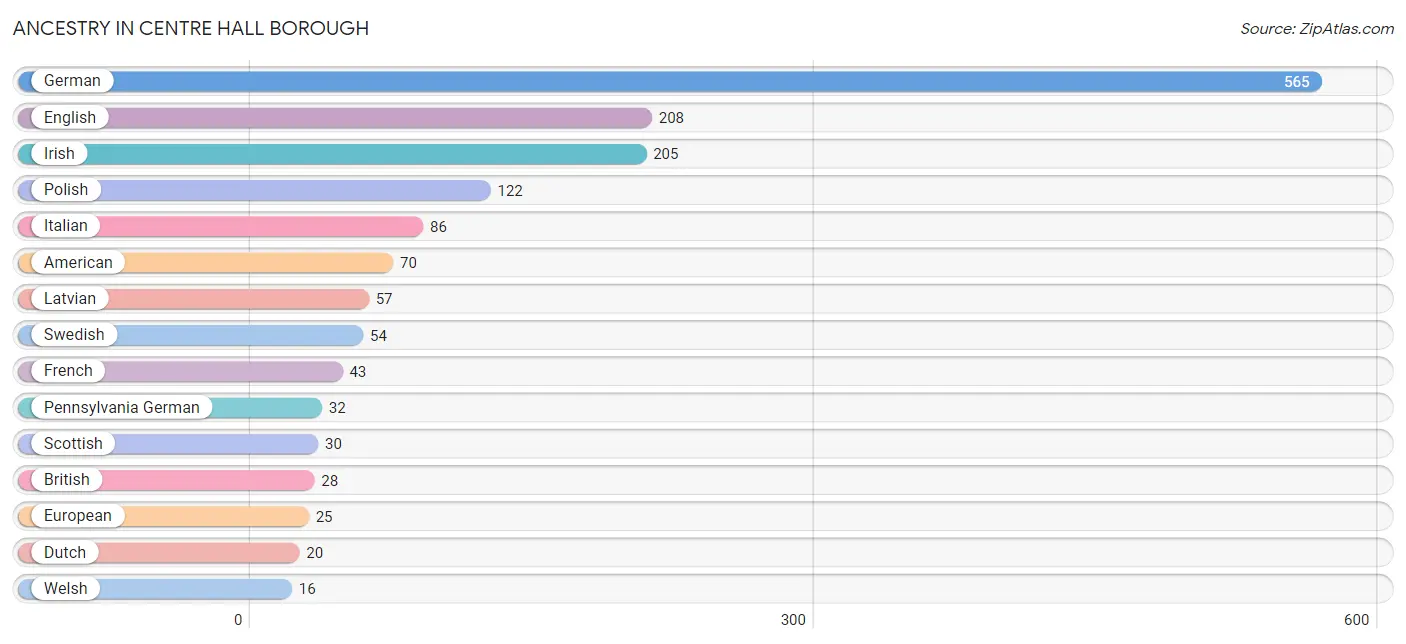
Ancestry in Centre Hall borough
The most populous ancestries reported in Centre Hall borough are German (565 | 38.4%), English (208 | 14.1%), Irish (205 | 13.9%), Polish (122 | 8.3%), and Italian (86 | 5.8%), together accounting for 80.6% of all Centre Hall borough residents.
| Ancestry | # Population | % Population |
| American | 70 | 4.8% |
| Bhutanese | 7 | 0.5% |
| British | 28 | 1.9% |
| Czech | 9 | 0.6% |
| Dutch | 20 | 1.4% |
| English | 208 | 14.1% |
| European | 25 | 1.7% |
| French | 43 | 2.9% |
| French Canadian | 3 | 0.2% |
| German | 565 | 38.4% |
| Hungarian | 2 | 0.1% |
| Irish | 205 | 13.9% |
| Italian | 86 | 5.8% |
| Latvian | 57 | 3.9% |
| Pennsylvania German | 32 | 2.2% |
| Polish | 122 | 8.3% |
| Russian | 3 | 0.2% |
| Scandinavian | 7 | 0.5% |
| Scotch-Irish | 9 | 0.6% |
| Scottish | 30 | 2.0% |
| Slovak | 14 | 0.9% |
| Swedish | 54 | 3.7% |
| Ukrainian | 5 | 0.3% |
| Welsh | 16 | 1.1% | View All 24 Rows |
Immigrants in Centre Hall borough

| Immigration Origin | # Population | % Population | View All 0 Rows |
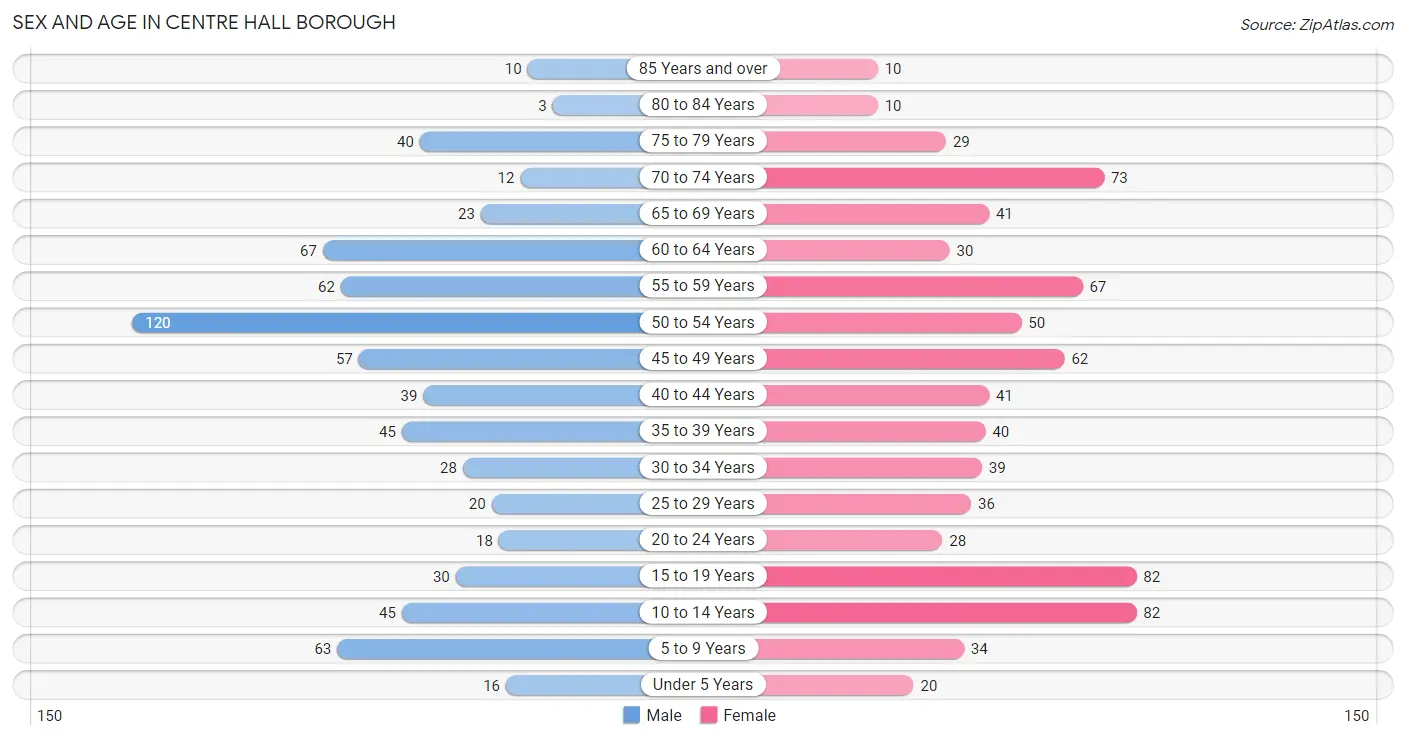
Sex and Age in Centre Hall borough
Sex and Age in Centre Hall borough
The most populous age groups in Centre Hall borough are 50 to 54 Years (120 | 17.2%) for men and 10 to 14 Years (82 | 10.6%) for women.
| Age Bracket | Male | Female |
| Under 5 Years | 16 (2.3%) | 20 (2.6%) |
| 5 to 9 Years | 63 (9.0%) | 34 (4.4%) |
| 10 to 14 Years | 45 (6.5%) | 82 (10.6%) |
| 15 to 19 Years | 30 (4.3%) | 82 (10.6%) |
| 20 to 24 Years | 18 (2.6%) | 28 (3.6%) |
| 25 to 29 Years | 20 (2.9%) | 36 (4.6%) |
| 30 to 34 Years | 28 (4.0%) | 39 (5.0%) |
| 35 to 39 Years | 45 (6.5%) | 40 (5.2%) |
| 40 to 44 Years | 39 (5.6%) | 41 (5.3%) |
| 45 to 49 Years | 57 (8.2%) | 62 (8.0%) |
| 50 to 54 Years | 120 (17.2%) | 50 (6.5%) |
| 55 to 59 Years | 62 (8.9%) | 67 (8.7%) |
| 60 to 64 Years | 67 (9.6%) | 30 (3.9%) |
| 65 to 69 Years | 23 (3.3%) | 41 (5.3%) |
| 70 to 74 Years | 12 (1.7%) | 73 (9.4%) |
| 75 to 79 Years | 40 (5.7%) | 29 (3.7%) |
| 80 to 84 Years | 3 (0.4%) | 10 (1.3%) |
| 85 Years and over | 10 (1.4%) | 10 (1.3%) |
| Total | 698 (100.0%) | 774 (100.0%) |
Families and Households in Centre Hall borough
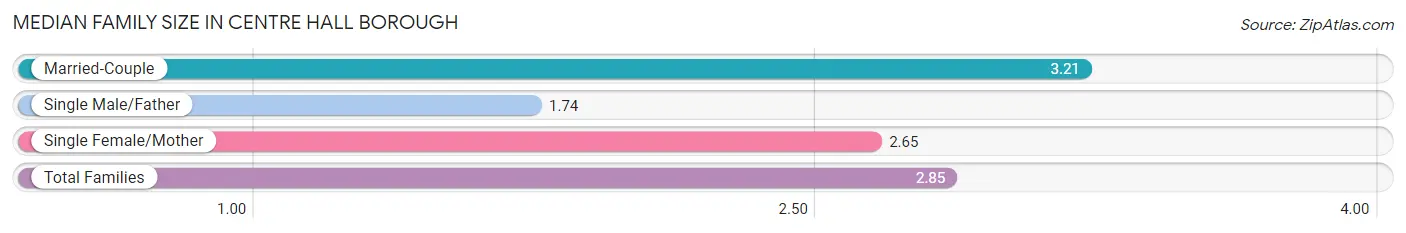
Median Family Size in Centre Hall borough
The median family size in Centre Hall borough is 2.85 persons per family, with married-couple families (280 | 63.9%) accounting for the largest median family size of 3.21 persons per family. On the other hand, single male/father families (77 | 17.6%) represent the smallest median family size with 1.74 persons per family.
| Family Type | # Families | Family Size |
| Married-Couple | 280 (63.9%) | 3.21 |
| Single Male/Father | 77 (17.6%) | 1.74 |
| Single Female/Mother | 81 (18.5%) | 2.65 |
| Total Families | 438 (100.0%) | 2.85 |
Median Household Size in Centre Hall borough
The median household size in Centre Hall borough is 2.39 persons per household, with married-couple households (280 | 45.5%) accounting for the largest median household size of 3.21 persons per household. non-family households (177 | 28.8%) represent the smallest median household size with 1.16 persons per household.
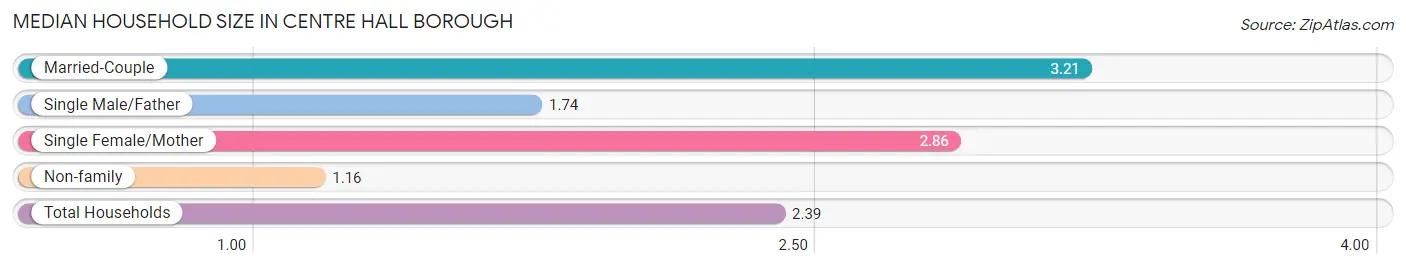
| Household Type | # Households | Household Size |
| Married-Couple | 280 (45.5%) | 3.21 |
| Single Male/Father | 77 (12.5%) | 1.74 |
| Single Female/Mother | 81 (13.2%) | 2.86 |
| Non-family | 177 (28.8%) | 1.16 |
| Total Households | 615 (100.0%) | 2.39 |
Household Size by Marriage Status in Centre Hall borough
Out of a total of 615 households in Centre Hall borough, 438 (71.2%) are family households, while 177 (28.8%) are nonfamily households. The most numerous type of family households are 2-person households, comprising 250, and the most common type of nonfamily households are 1-person households, comprising 154.
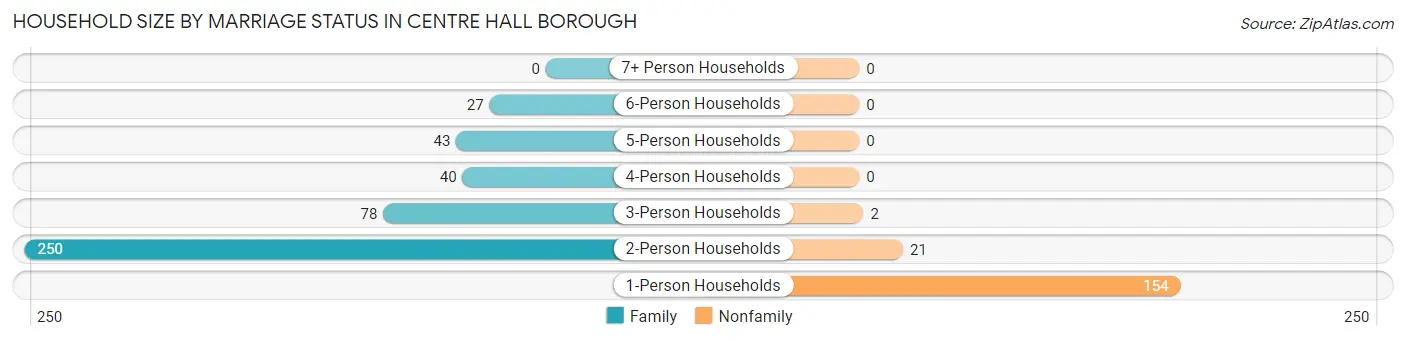
| Household Size | Family Households | Nonfamily Households |
| 1-Person Households | - | 154 (25.0%) |
| 2-Person Households | 250 (40.6%) | 21 (3.4%) |
| 3-Person Households | 78 (12.7%) | 2 (0.3%) |
| 4-Person Households | 40 (6.5%) | 0 (0.0%) |
| 5-Person Households | 43 (7.0%) | 0 (0.0%) |
| 6-Person Households | 27 (4.4%) | 0 (0.0%) |
| 7+ Person Households | 0 (0.0%) | 0 (0.0%) |
| Total | 438 (71.2%) | 177 (28.8%) |
Female Fertility in Centre Hall borough
Fertility by Age in Centre Hall borough
Average fertility rate in Centre Hall borough is 15.0 births per 1,000 women. Women in the age bracket of 20 to 34 years have the highest fertility rate with 19.0 births per 1,000 women. Women in the age bracket of 35 to 50 years acount for 60.0% of all women with births.
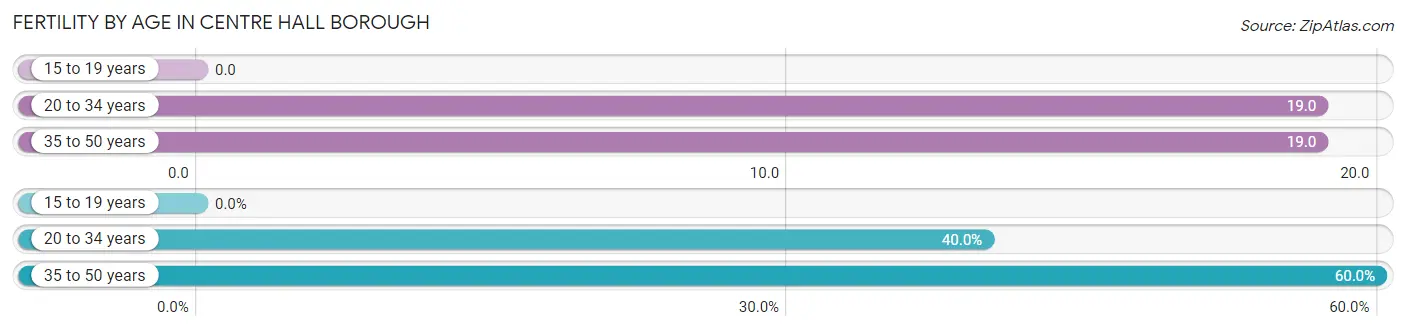
| Age Bracket | Women with Births | Births / 1,000 Women |
| 15 to 19 years | 0 (0.0%) | 0.0 |
| 20 to 34 years | 2 (40.0%) | 19.0 |
| 35 to 50 years | 3 (60.0%) | 19.0 |
| Total | 5 (100.0%) | 15.0 |
Fertility by Age by Marriage Status in Centre Hall borough
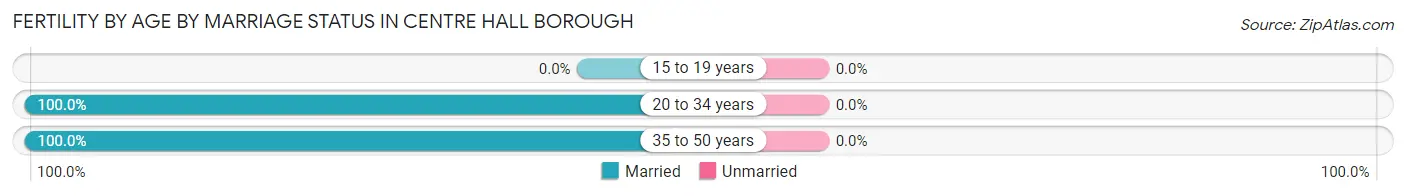
| Age Bracket | Married | Unmarried |
| 15 to 19 years | 0 (0.0%) | 0 (0.0%) |
| 20 to 34 years | 2 (100.0%) | 0 (0.0%) |
| 35 to 50 years | 3 (100.0%) | 0 (0.0%) |
| Total | 5 (100.0%) | 0 (0.0%) |
Fertility by Education in Centre Hall borough
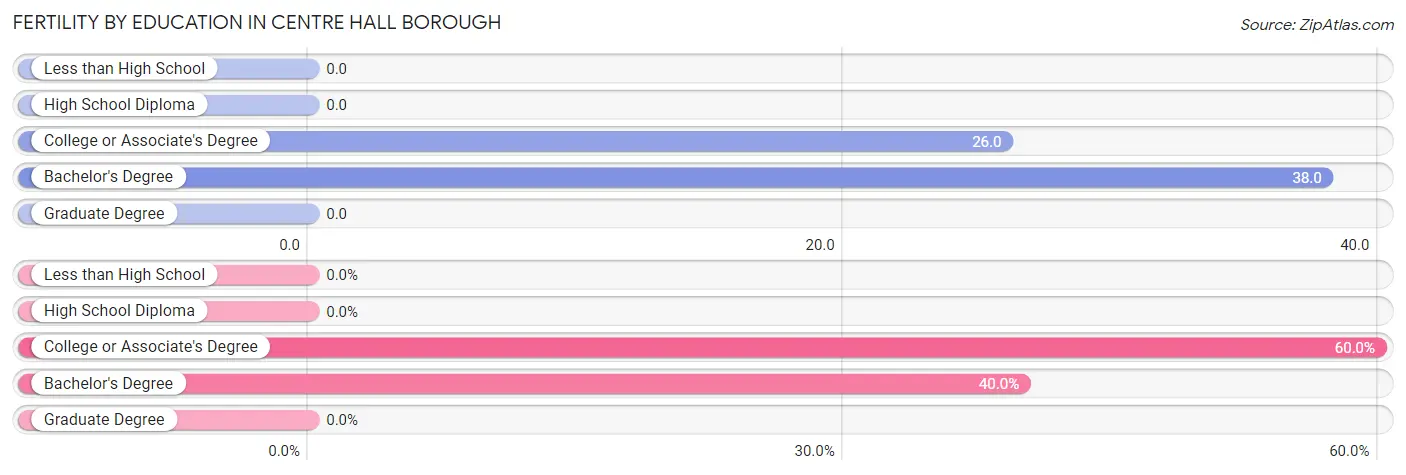
| Educational Attainment | Women with Births | Births / 1,000 Women |
| Less than High School | 0 (0.0%) | 0.0 |
| High School Diploma | 0 (0.0%) | 0.0 |
| College or Associate's Degree | 3 (60.0%) | 26.0 |
| Bachelor's Degree | 2 (40.0%) | 38.0 |
| Graduate Degree | 0 (0.0%) | 0.0 |
| Total | 5 (100.0%) | 15.0 |
Fertility by Education by Marriage Status in Centre Hall borough
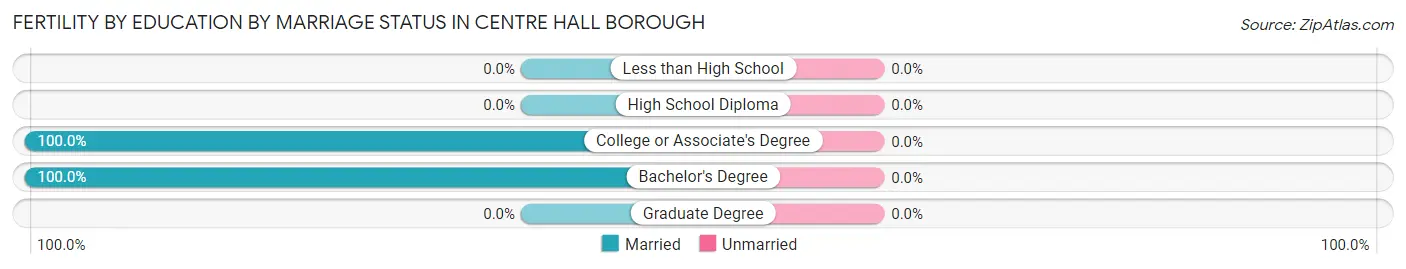
| Educational Attainment | Married | Unmarried |
| Less than High School | 0 (0.0%) | 0 (0.0%) |
| High School Diploma | 0 (0.0%) | 0 (0.0%) |
| College or Associate's Degree | 3 (100.0%) | 0 (0.0%) |
| Bachelor's Degree | 2 (100.0%) | 0 (0.0%) |
| Graduate Degree | 0 (0.0%) | 0 (0.0%) |
| Total | 5 (100.0%) | 0 (0.0%) |
Income in Centre Hall borough
Income Overview in Centre Hall borough
Per Capita Income in Centre Hall borough is $30,328, while median incomes of families and households are $77,143 and $63,942 respectively.
| Characteristic | Number | Measure |
| Per Capita Income | 1,472 | $30,328 |
| Median Family Income | 438 | $77,143 |
| Mean Family Income | 438 | $81,717 |
| Median Household Income | 615 | $63,942 |
| Mean Household Income | 615 | $72,406 |
| Income Deficit | 438 | $0 |
| Wage / Income Gap (%) | 1,472 | 38.80% |
| Wage / Income Gap ($) | 1,472 | 61.20¢ per $1 |
| Gini / Inequality Index | 1,472 | 0.33 |
Earnings by Sex in Centre Hall borough
Average Earnings in Centre Hall borough are $37,104, $52,308 for men and $32,015 for women, a difference of 38.8%.
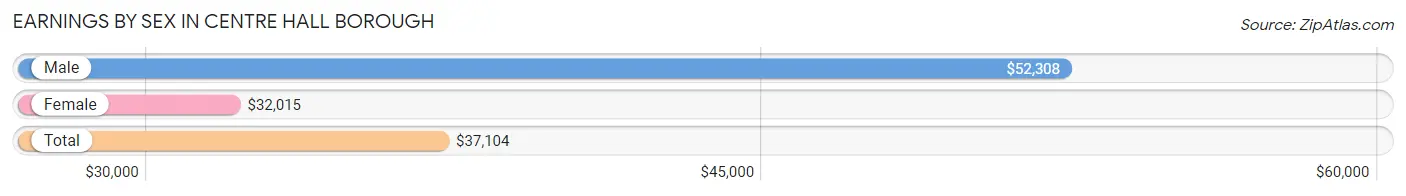
| Sex | Number | Average Earnings |
| Male | 402 (54.1%) | $52,308 |
| Female | 341 (45.9%) | $32,015 |
| Total | 743 (100.0%) | $37,104 |
Earnings by Sex by Income Bracket in Centre Hall borough
The most common earnings brackets in Centre Hall borough are $75,000 to $99,999 for men (78 | 19.4%) and $30,000 to $34,999 for women (65 | 19.1%).
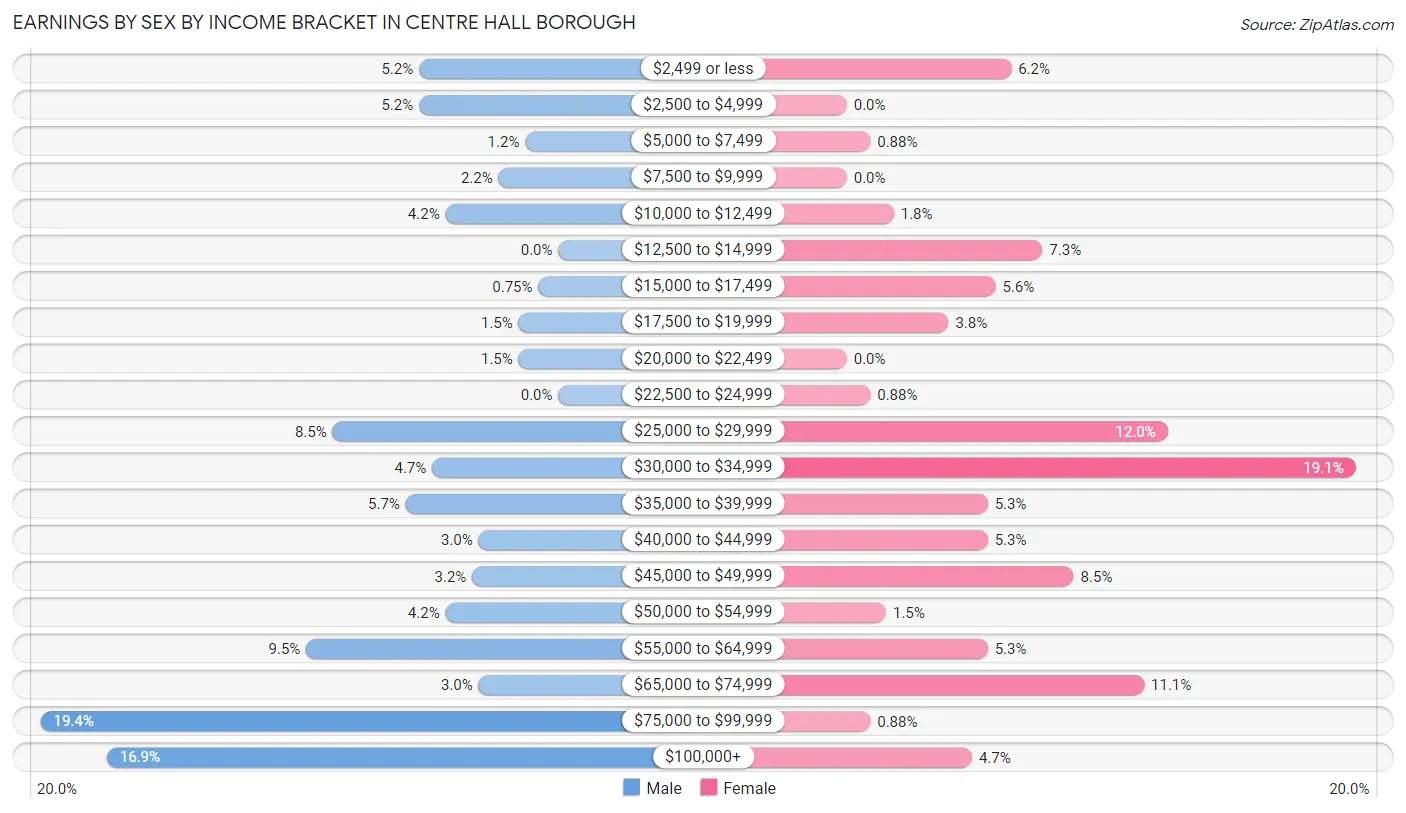
| Income | Male | Female |
| $2,499 or less | 21 (5.2%) | 21 (6.2%) |
| $2,500 to $4,999 | 21 (5.2%) | 0 (0.0%) |
| $5,000 to $7,499 | 5 (1.2%) | 3 (0.9%) |
| $7,500 to $9,999 | 9 (2.2%) | 0 (0.0%) |
| $10,000 to $12,499 | 17 (4.2%) | 6 (1.8%) |
| $12,500 to $14,999 | 0 (0.0%) | 25 (7.3%) |
| $15,000 to $17,499 | 3 (0.7%) | 19 (5.6%) |
| $17,500 to $19,999 | 6 (1.5%) | 13 (3.8%) |
| $20,000 to $22,499 | 6 (1.5%) | 0 (0.0%) |
| $22,500 to $24,999 | 0 (0.0%) | 3 (0.9%) |
| $25,000 to $29,999 | 34 (8.5%) | 41 (12.0%) |
| $30,000 to $34,999 | 19 (4.7%) | 65 (19.1%) |
| $35,000 to $39,999 | 23 (5.7%) | 18 (5.3%) |
| $40,000 to $44,999 | 12 (3.0%) | 18 (5.3%) |
| $45,000 to $49,999 | 13 (3.2%) | 29 (8.5%) |
| $50,000 to $54,999 | 17 (4.2%) | 5 (1.5%) |
| $55,000 to $64,999 | 38 (9.5%) | 18 (5.3%) |
| $65,000 to $74,999 | 12 (3.0%) | 38 (11.1%) |
| $75,000 to $99,999 | 78 (19.4%) | 3 (0.9%) |
| $100,000+ | 68 (16.9%) | 16 (4.7%) |
| Total | 402 (100.0%) | 341 (100.0%) |
Earnings by Sex by Educational Attainment in Centre Hall borough
Average earnings in Centre Hall borough are $60,441 for men and $32,449 for women, a difference of 46.3%. Men with an educational attainment of graduate degree enjoy the highest average annual earnings of $80,694, while those with bachelor's degree education earn the least with $50,000. Women with an educational attainment of bachelor's degree earn the most with the average annual earnings of $37,000, while those with college or associate's degree education have the smallest earnings of $31,310.
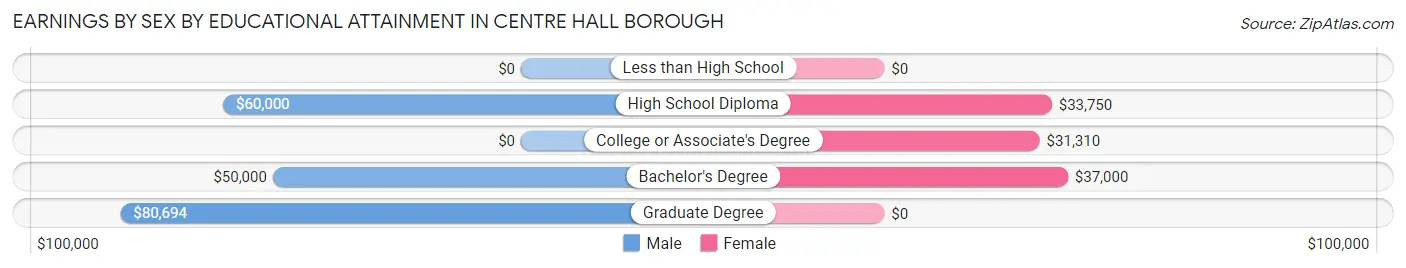
| Educational Attainment | Male Income | Female Income |
| Less than High School | - | - |
| High School Diploma | $60,000 | $33,750 |
| College or Associate's Degree | - | - |
| Bachelor's Degree | $50,000 | $37,000 |
| Graduate Degree | $80,694 | $0 |
| Total | $60,441 | $32,449 |
Family Income in Centre Hall borough
Family Income Brackets in Centre Hall borough
According to the Centre Hall borough family income data, there are 132 families falling into the $100,000 to $149,999 income range, which is the most common income bracket and makes up 30.1% of all families. Conversely, the less than $10,000 income bracket is the least frequent group with only 3 families (0.7%) belonging to this category.
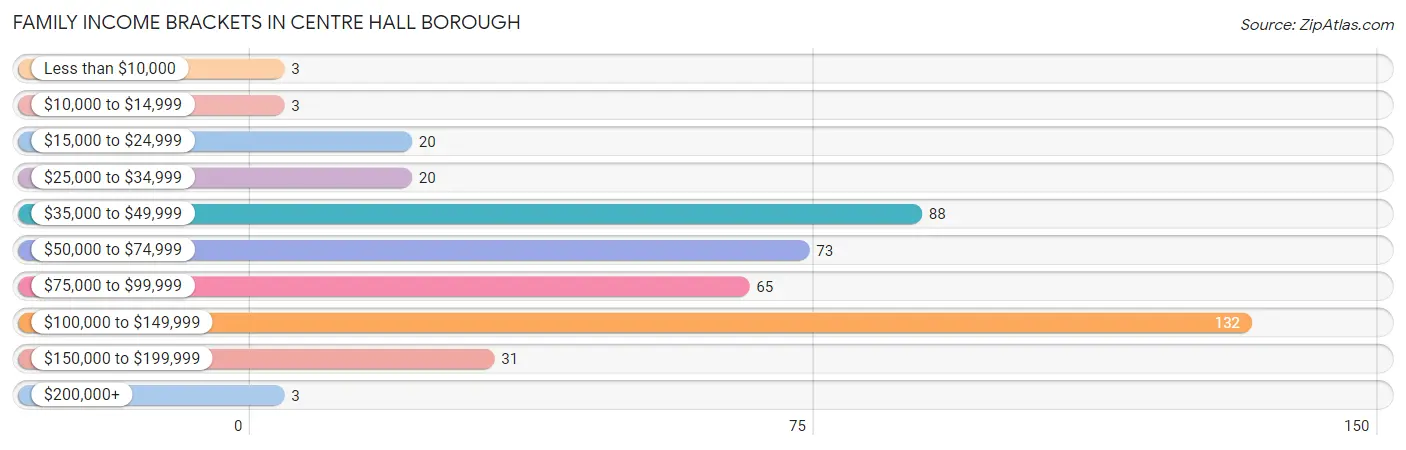
| Income Bracket | # Families | % Families |
| Less than $10,000 | 3 | 0.7% |
| $10,000 to $14,999 | 3 | 0.7% |
| $15,000 to $24,999 | 20 | 4.6% |
| $25,000 to $34,999 | 20 | 4.6% |
| $35,000 to $49,999 | 88 | 20.1% |
| $50,000 to $74,999 | 73 | 16.7% |
| $75,000 to $99,999 | 65 | 14.8% |
| $100,000 to $149,999 | 132 | 30.1% |
| $150,000 to $199,999 | 31 | 7.1% |
| $200,000+ | 3 | 0.7% |
Family Income by Famaliy Size in Centre Hall borough
2-person families (262 | 59.8%) account for the highest median family income in Centre Hall borough with $90,000 per family, while 2-person families (262 | 59.8%) have the highest median income of $45,000 per family member.
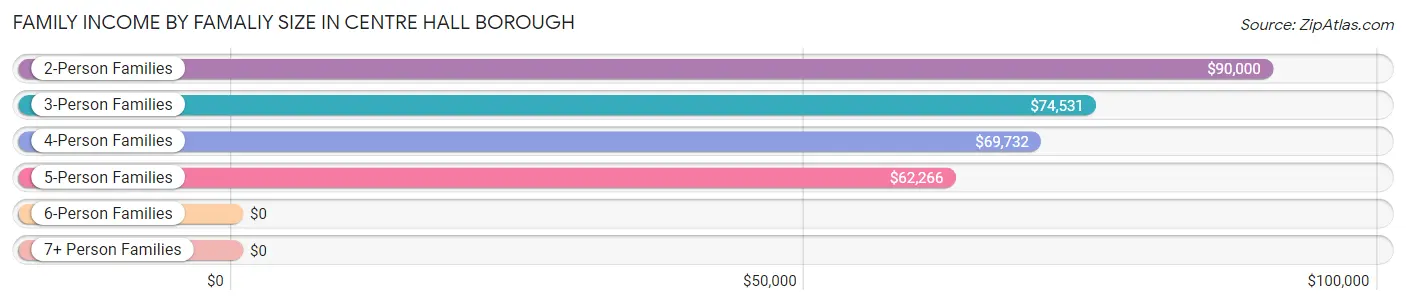
| Income Bracket | # Families | Median Income |
| 2-Person Families | 262 (59.8%) | $90,000 |
| 3-Person Families | 69 (15.8%) | $74,531 |
| 4-Person Families | 37 (8.5%) | $69,732 |
| 5-Person Families | 43 (9.8%) | $62,266 |
| 6-Person Families | 27 (6.2%) | $0 |
| 7+ Person Families | 0 (0.0%) | $0 |
| Total | 438 (100.0%) | $77,143 |
Family Income by Number of Earners in Centre Hall borough
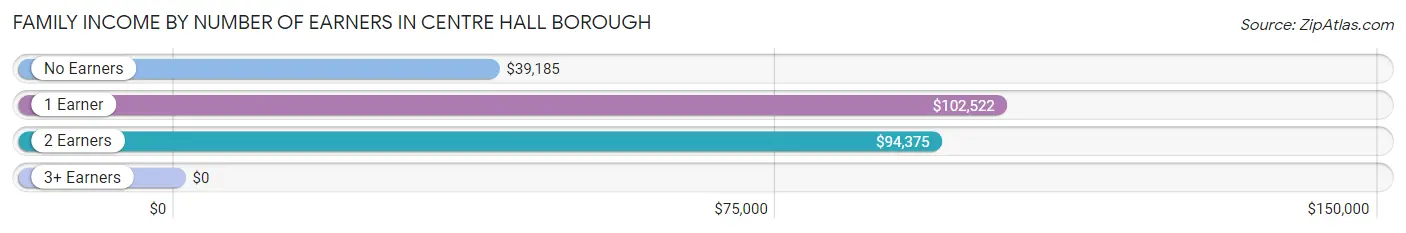
| Number of Earners | # Families | Median Income |
| No Earners | 72 (16.4%) | $39,185 |
| 1 Earner | 153 (34.9%) | $102,522 |
| 2 Earners | 183 (41.8%) | $94,375 |
| 3+ Earners | 30 (6.9%) | $0 |
| Total | 438 (100.0%) | $77,143 |
Household Income in Centre Hall borough
Household Income Brackets in Centre Hall borough
With 155 households falling in the category, the $100,000 to $149,999 income range is the most frequent in Centre Hall borough, accounting for 25.2% of all households. In contrast, only 3 households (0.5%) fall into the $200,000+ income bracket, making it the least populous group.
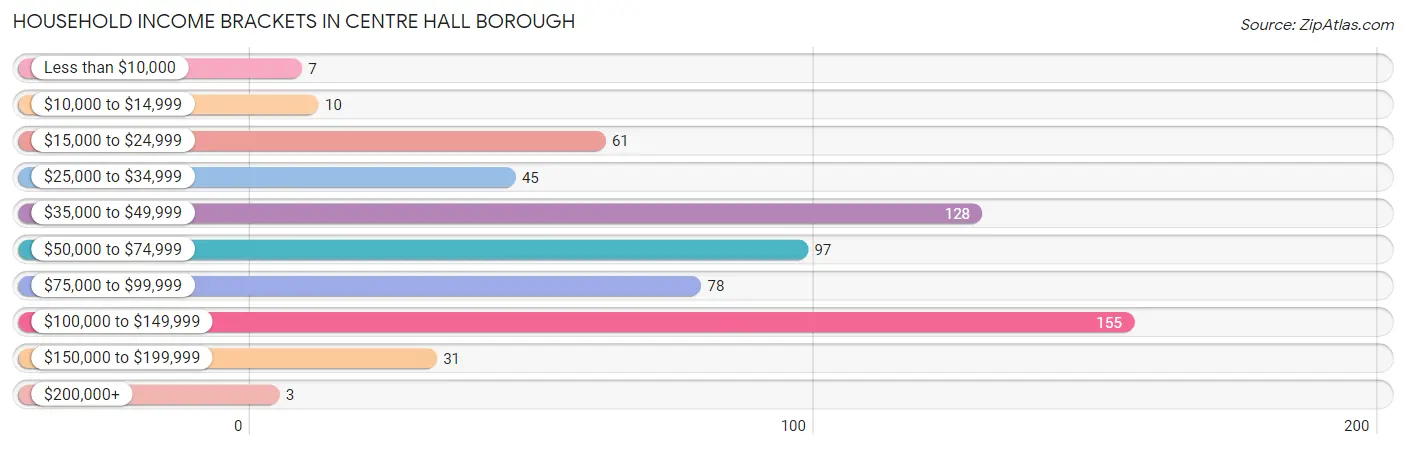
| Income Bracket | # Households | % Households |
| Less than $10,000 | 7 | 1.1% |
| $10,000 to $14,999 | 10 | 1.6% |
| $15,000 to $24,999 | 61 | 9.9% |
| $25,000 to $34,999 | 45 | 7.3% |
| $35,000 to $49,999 | 128 | 20.8% |
| $50,000 to $74,999 | 97 | 15.8% |
| $75,000 to $99,999 | 78 | 12.7% |
| $100,000 to $149,999 | 155 | 25.2% |
| $150,000 to $199,999 | 31 | 5.0% |
| $200,000+ | 3 | 0.5% |
Household Income by Householder Age in Centre Hall borough
The median household income in Centre Hall borough is $63,942, with the highest median household income of $85,139 found in the 45 to 64 years age bracket for the primary householder. A total of 313 households (50.9%) fall into this category. Meanwhile, the 15 to 24 years age bracket for the primary householder has the lowest median household income of $0, with 4 households (0.6%) in this group.
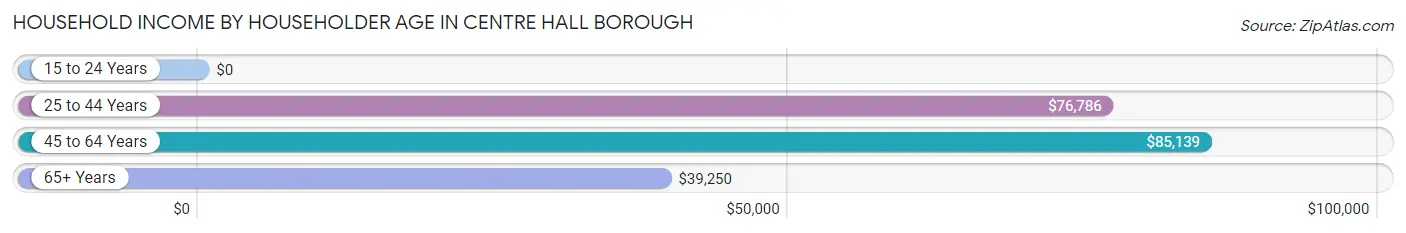
| Income Bracket | # Households | Median Income |
| 15 to 24 Years | 4 (0.6%) | $0 |
| 25 to 44 Years | 122 (19.8%) | $76,786 |
| 45 to 64 Years | 313 (50.9%) | $85,139 |
| 65+ Years | 176 (28.6%) | $39,250 |
| Total | 615 (100.0%) | $63,942 |
Poverty in Centre Hall borough
Income Below Poverty by Sex and Age in Centre Hall borough
With 9.9% poverty level for males and 12.1% for females among the residents of Centre Hall borough, 12 to 14 year old males and 5 year old females are the most vulnerable to poverty, with 13 males (68.4%) and 6 females (75.0%) in their respective age groups living below the poverty level.
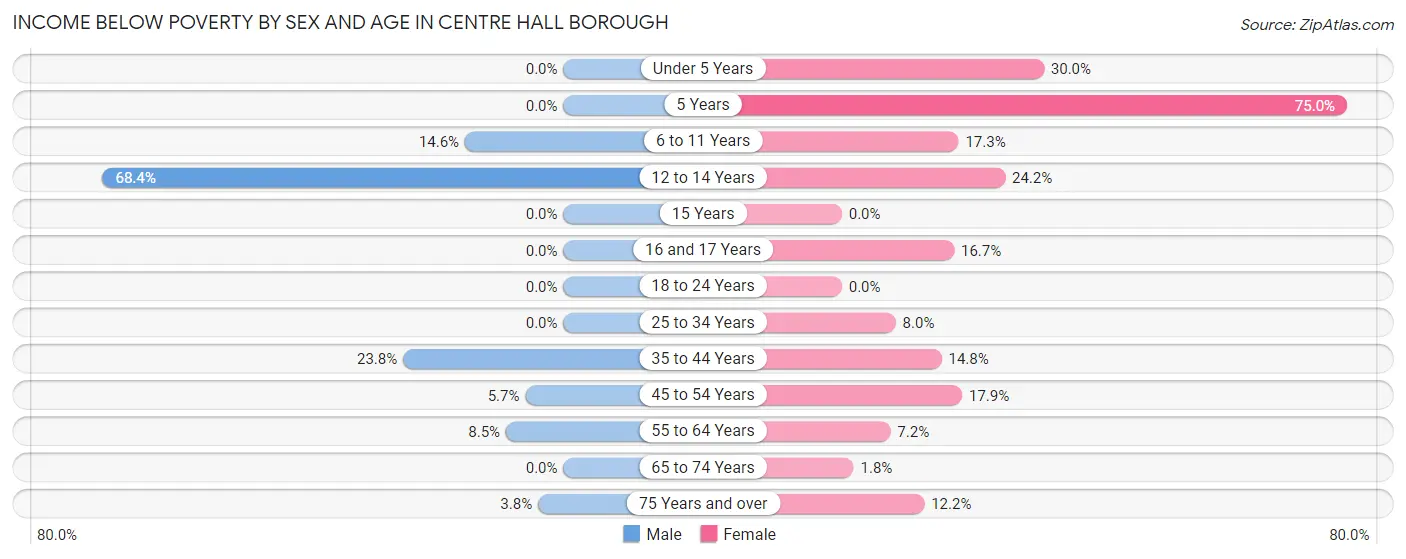
| Age Bracket | Male | Female |
| Under 5 Years | 0 (0.0%) | 6 (30.0%) |
| 5 Years | 0 (0.0%) | 6 (75.0%) |
| 6 to 11 Years | 13 (14.6%) | 13 (17.3%) |
| 12 to 14 Years | 13 (68.4%) | 8 (24.2%) |
| 15 Years | 0 (0.0%) | 0 (0.0%) |
| 16 and 17 Years | 0 (0.0%) | 8 (16.7%) |
| 18 to 24 Years | 0 (0.0%) | 0 (0.0%) |
| 25 to 34 Years | 0 (0.0%) | 6 (8.0%) |
| 35 to 44 Years | 20 (23.8%) | 12 (14.8%) |
| 45 to 54 Years | 10 (5.7%) | 20 (17.9%) |
| 55 to 64 Years | 11 (8.5%) | 7 (7.2%) |
| 65 to 74 Years | 0 (0.0%) | 2 (1.8%) |
| 75 Years and over | 2 (3.8%) | 6 (12.2%) |
| Total | 69 (9.9%) | 94 (12.1%) |
Income Above Poverty by Sex and Age in Centre Hall borough
According to the poverty statistics in Centre Hall borough, males aged under 5 years and females aged 15 years are the age groups that are most secure financially, with 100.0% of males and 100.0% of females in these age groups living above the poverty line.
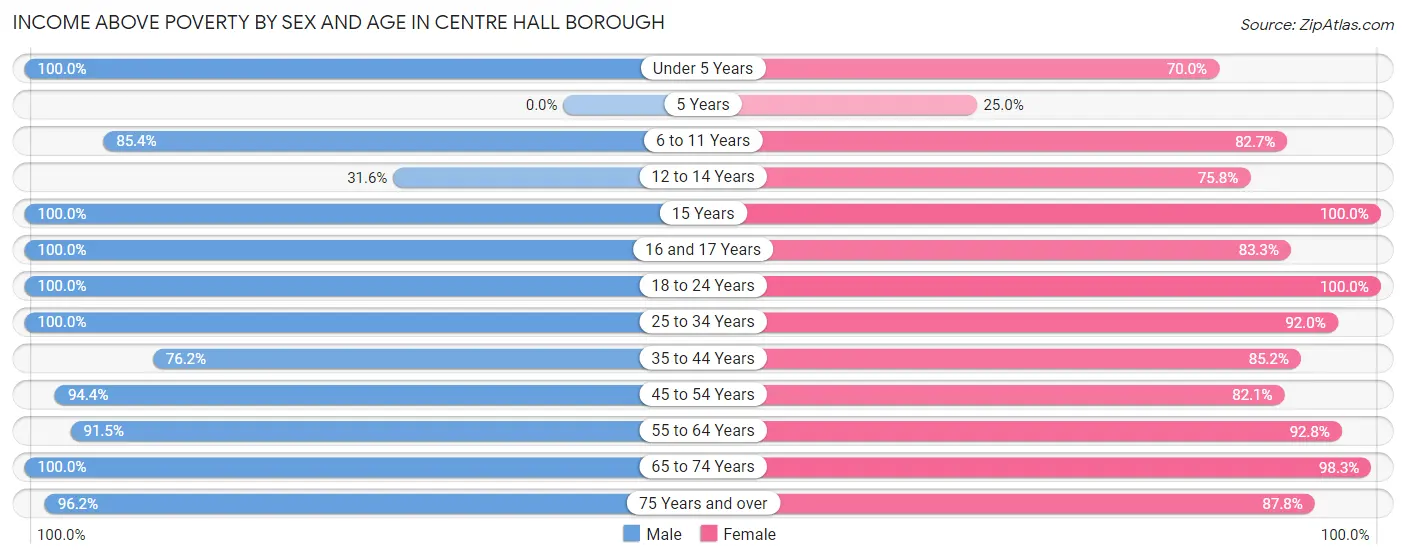
| Age Bracket | Male | Female |
| Under 5 Years | 16 (100.0%) | 14 (70.0%) |
| 5 Years | 0 (0.0%) | 2 (25.0%) |
| 6 to 11 Years | 76 (85.4%) | 62 (82.7%) |
| 12 to 14 Years | 6 (31.6%) | 25 (75.8%) |
| 15 Years | 14 (100.0%) | 32 (100.0%) |
| 16 and 17 Years | 15 (100.0%) | 40 (83.3%) |
| 18 to 24 Years | 19 (100.0%) | 30 (100.0%) |
| 25 to 34 Years | 48 (100.0%) | 69 (92.0%) |
| 35 to 44 Years | 64 (76.2%) | 69 (85.2%) |
| 45 to 54 Years | 167 (94.4%) | 92 (82.1%) |
| 55 to 64 Years | 118 (91.5%) | 90 (92.8%) |
| 65 to 74 Years | 35 (100.0%) | 112 (98.3%) |
| 75 Years and over | 51 (96.2%) | 43 (87.8%) |
| Total | 629 (90.1%) | 680 (87.9%) |
Income Below Poverty Among Married-Couple Families in Centre Hall borough
The poverty statistics for married-couple families in Centre Hall borough show that 10.4% or 29 of the total 280 families live below the poverty line. Families with 3 or 4 children have the highest poverty rate of 22.9%, comprising of 16 families. On the other hand, families with 1 or 2 children have the lowest poverty rate of 0.0%, which includes 0 families.
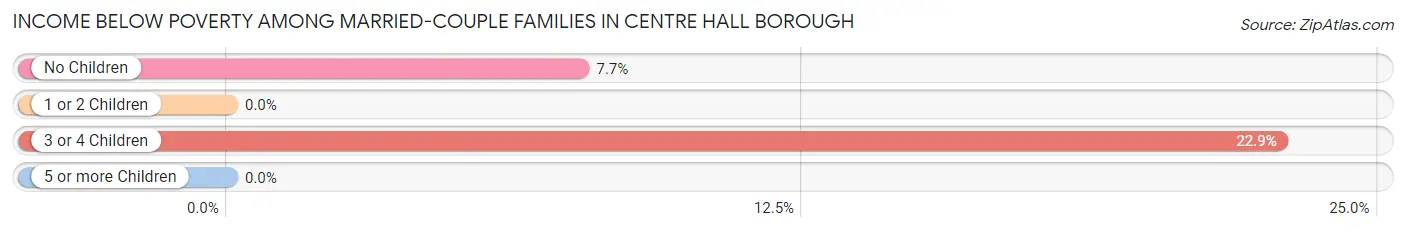
| Children | Above Poverty | Below Poverty |
| No Children | 157 (92.3%) | 13 (7.6%) |
| 1 or 2 Children | 40 (100.0%) | 0 (0.0%) |
| 3 or 4 Children | 54 (77.1%) | 16 (22.9%) |
| 5 or more Children | 0 (0.0%) | 0 (0.0%) |
| Total | 251 (89.6%) | 29 (10.4%) |
Income Below Poverty Among Single-Parent Households in Centre Hall borough
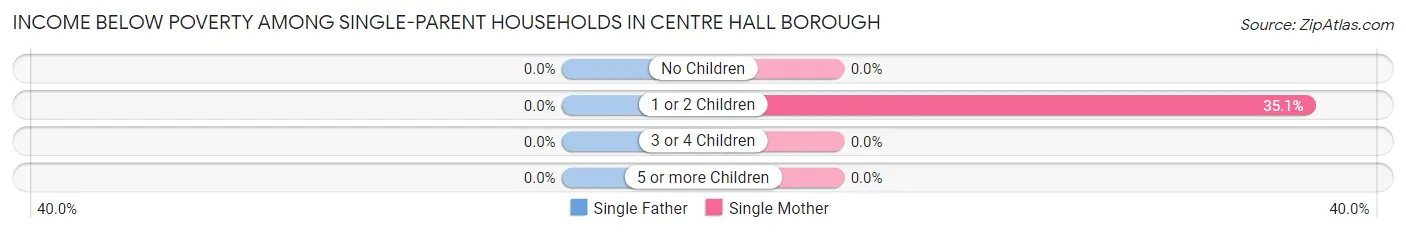
| Children | Single Father | Single Mother |
| No Children | 0 (0.0%) | 0 (0.0%) |
| 1 or 2 Children | 0 (0.0%) | 13 (35.1%) |
| 3 or 4 Children | 0 (0.0%) | 0 (0.0%) |
| 5 or more Children | 0 (0.0%) | 0 (0.0%) |
| Total | 0 (0.0%) | 13 (16.1%) |
Income Below Poverty Among Married-Couple vs Single-Parent Households in Centre Hall borough
The poverty data for Centre Hall borough shows that 29 of the married-couple family households (10.4%) and 13 of the single-parent households (8.2%) are living below the poverty level. Within the married-couple family households, those with 3 or 4 children have the highest poverty rate, with 16 households (22.9%) falling below the poverty line. Among the single-parent households, those with 1 or 2 children have the highest poverty rate, with 13 household (13.0%) living below poverty.
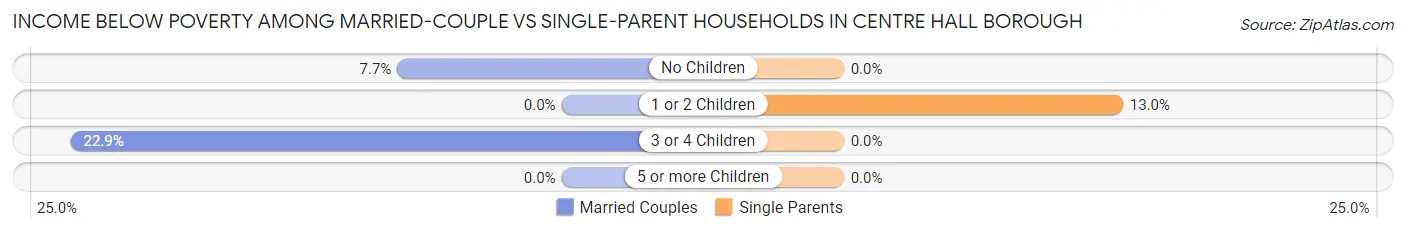
| Children | Married-Couple Families | Single-Parent Households |
| No Children | 13 (7.6%) | 0 (0.0%) |
| 1 or 2 Children | 0 (0.0%) | 13 (13.0%) |
| 3 or 4 Children | 16 (22.9%) | 0 (0.0%) |
| 5 or more Children | 0 (0.0%) | 0 (0.0%) |
| Total | 29 (10.4%) | 13 (8.2%) |
Employment Characteristics in Centre Hall borough
Employment by Class of Employer in Centre Hall borough
Among the 696 employed individuals in Centre Hall borough, private company employees (480 | 69.0%), state government employees (93 | 13.4%), and not-for-profit organizations (54 | 7.8%) make up the most common classes of employment.
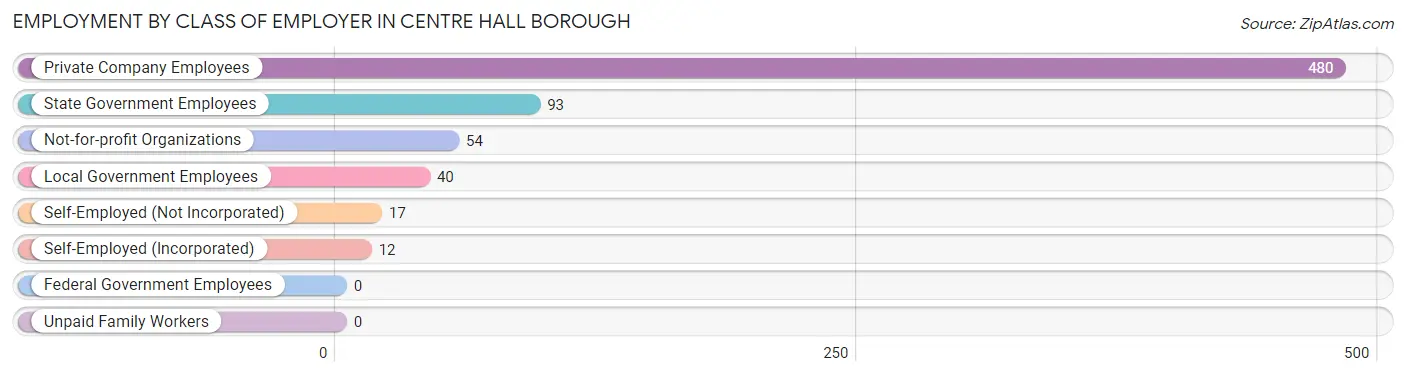
| Employer Class | # Employees | % Employees |
| Private Company Employees | 480 | 69.0% |
| Self-Employed (Incorporated) | 12 | 1.7% |
| Self-Employed (Not Incorporated) | 17 | 2.4% |
| Not-for-profit Organizations | 54 | 7.8% |
| Local Government Employees | 40 | 5.8% |
| State Government Employees | 93 | 13.4% |
| Federal Government Employees | 0 | 0.0% |
| Unpaid Family Workers | 0 | 0.0% |
| Total | 696 | 100.0% |
Employment Status by Age in Centre Hall borough
According to the labor force statistics for Centre Hall borough, out of the total population over 16 years of age (1,166), 64.4% or 751 individuals are in the labor force, with 5.5% or 41 of them unemployed. The age group with the highest labor force participation rate is 25 to 29 years, with 100.0% or 56 individuals in the labor force. Within the labor force, the 16 to 19 years age range has the highest percentage of unemployed individuals, with 64.2% or 34 of them being unemployed.
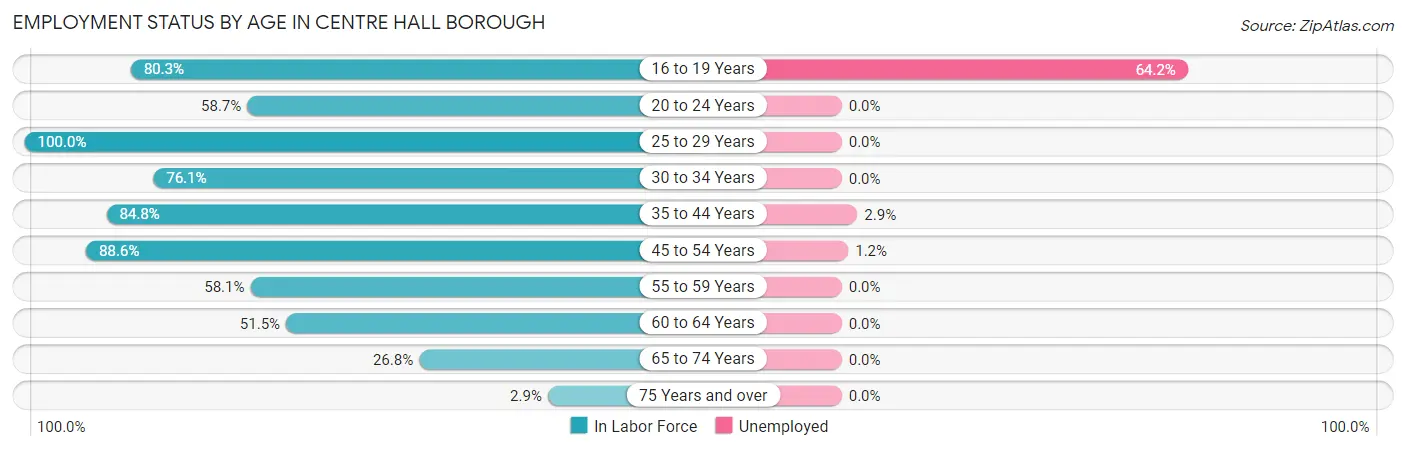
| Age Bracket | In Labor Force | Unemployed |
| 16 to 19 Years | 53 (80.3%) | 34 (64.2%) |
| 20 to 24 Years | 27 (58.7%) | 0 (0.0%) |
| 25 to 29 Years | 56 (100.0%) | 0 (0.0%) |
| 30 to 34 Years | 51 (76.1%) | 0 (0.0%) |
| 35 to 44 Years | 140 (84.8%) | 4 (2.9%) |
| 45 to 54 Years | 256 (88.6%) | 3 (1.2%) |
| 55 to 59 Years | 75 (58.1%) | 0 (0.0%) |
| 60 to 64 Years | 50 (51.5%) | 0 (0.0%) |
| 65 to 74 Years | 40 (26.8%) | 0 (0.0%) |
| 75 Years and over | 3 (2.9%) | 0 (0.0%) |
| Total | 751 (64.4%) | 41 (5.5%) |
Employment Status by Educational Attainment in Centre Hall borough
According to labor force statistics for Centre Hall borough, 78.2% of individuals (628) out of the total population between 25 and 64 years of age (803) are in the labor force, with 1.1% or 7 of them being unemployed. The group with the highest labor force participation rate are those with the educational attainment of bachelor's degree or higher, with 97.0% or 194 individuals in the labor force. Within the labor force, individuals with less than high school education have the highest percentage of unemployment, with 18.2% or 4 of them being unemployed.
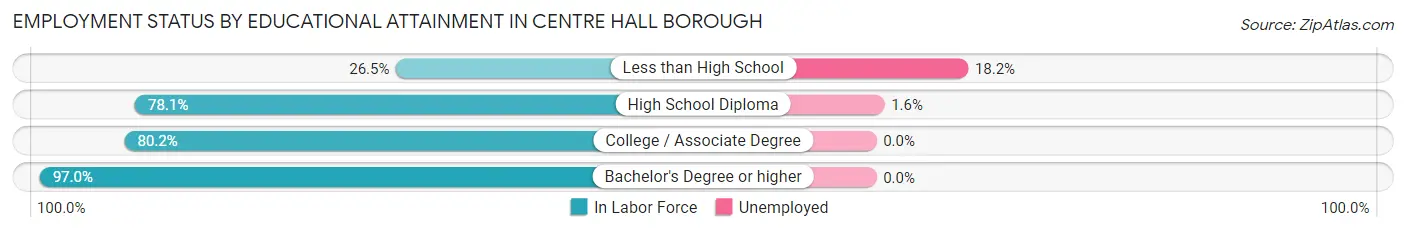
| Educational Attainment | In Labor Force | Unemployed |
| Less than High School | 22 (26.5%) | 15 (18.2%) |
| High School Diploma | 189 (78.1%) | 4 (1.6%) |
| College / Associate Degree | 223 (80.2%) | 0 (0.0%) |
| Bachelor's Degree or higher | 194 (97.0%) | 0 (0.0%) |
| Total | 628 (78.2%) | 9 (1.1%) |
Employment Occupations by Sex in Centre Hall borough
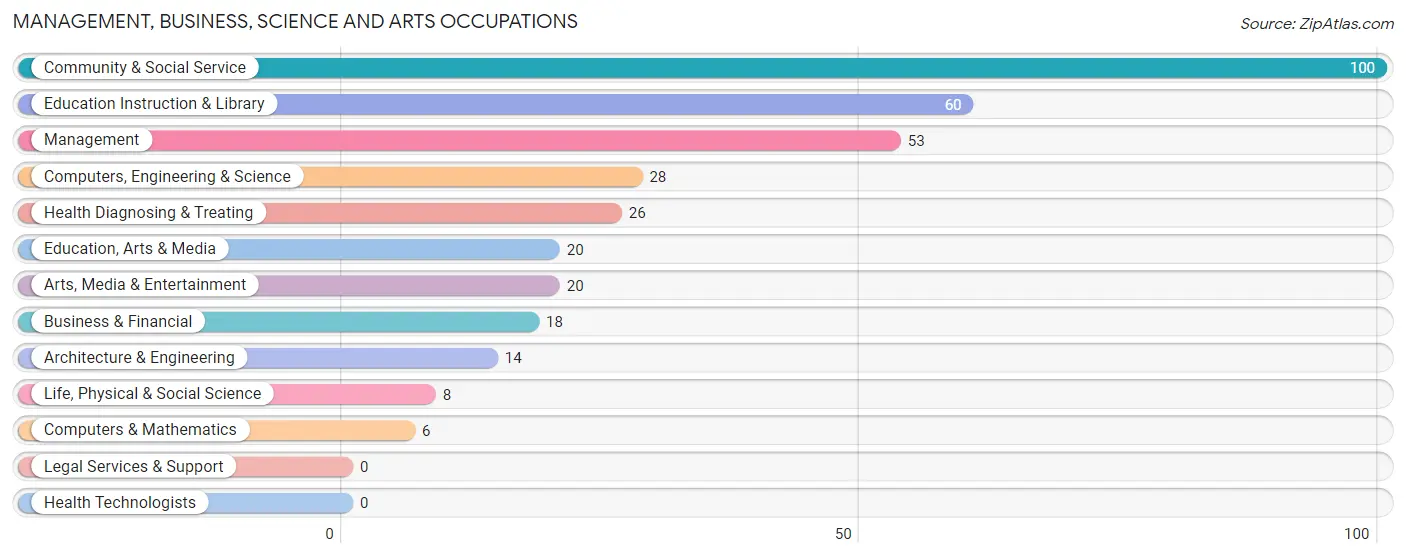
Management, Business, Science and Arts Occupations
The most common Management, Business, Science and Arts occupations in Centre Hall borough are Community & Social Service (100 | 14.1%), Education Instruction & Library (60 | 8.5%), Management (53 | 7.5%), Computers, Engineering & Science (28 | 3.9%), and Health Diagnosing & Treating (26 | 3.7%).
Management, Business, Science and Arts Occupations by Sex
Within the Management, Business, Science and Arts occupations in Centre Hall borough, the most male-oriented occupations are Computers & Mathematics (100.0%), Architecture & Engineering (78.6%), and Management (71.7%), while the most female-oriented occupations are Business & Financial (100.0%), Health Diagnosing & Treating (100.0%), and Life, Physical & Social Science (62.5%).
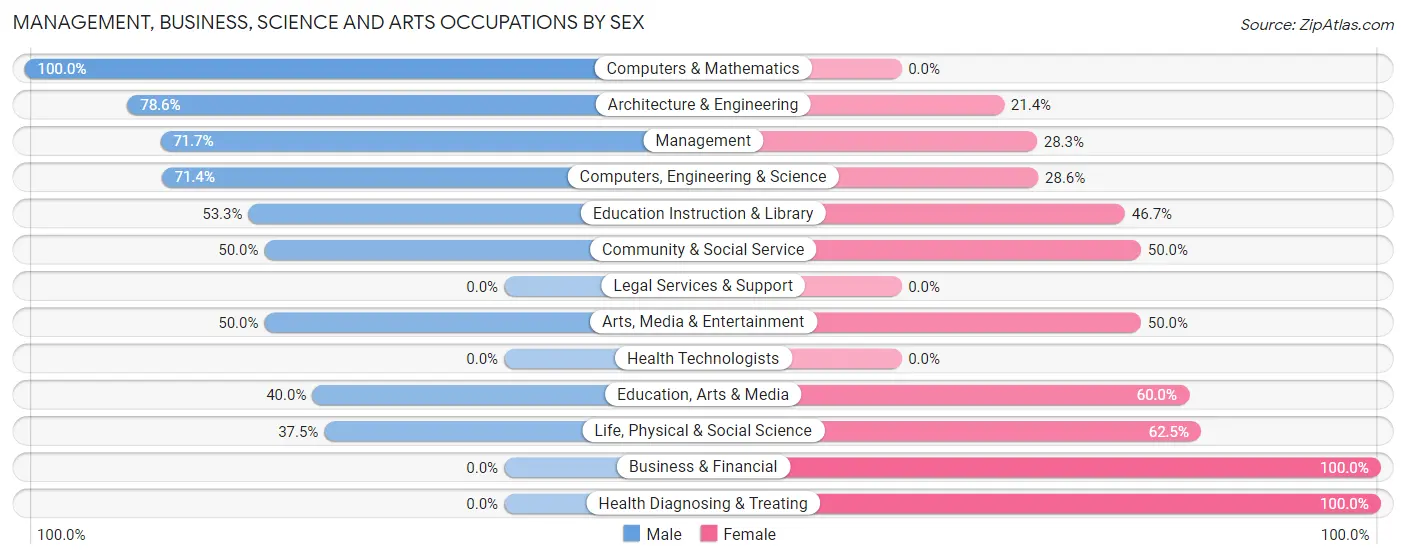
| Occupation | Male | Female |
| Management | 38 (71.7%) | 15 (28.3%) |
| Business & Financial | 0 (0.0%) | 18 (100.0%) |
| Computers, Engineering & Science | 20 (71.4%) | 8 (28.6%) |
| Computers & Mathematics | 6 (100.0%) | 0 (0.0%) |
| Architecture & Engineering | 11 (78.6%) | 3 (21.4%) |
| Life, Physical & Social Science | 3 (37.5%) | 5 (62.5%) |
| Community & Social Service | 50 (50.0%) | 50 (50.0%) |
| Education, Arts & Media | 8 (40.0%) | 12 (60.0%) |
| Legal Services & Support | 0 (0.0%) | 0 (0.0%) |
| Education Instruction & Library | 32 (53.3%) | 28 (46.7%) |
| Arts, Media & Entertainment | 10 (50.0%) | 10 (50.0%) |
| Health Diagnosing & Treating | 0 (0.0%) | 26 (100.0%) |
| Health Technologists | 0 (0.0%) | 0 (0.0%) |
| Total (Category) | 108 (48.0%) | 117 (52.0%) |
| Total (Overall) | 387 (54.5%) | 323 (45.5%) |
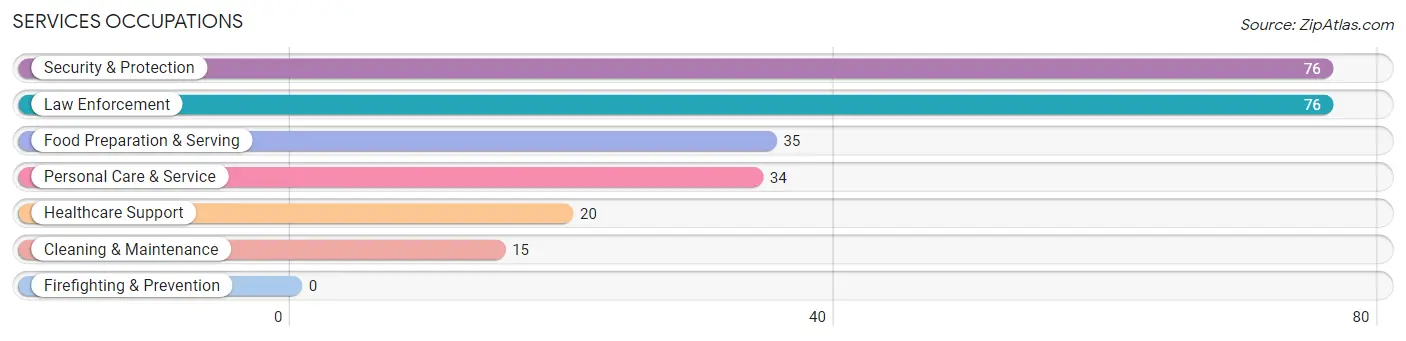
Services Occupations
The most common Services occupations in Centre Hall borough are Security & Protection (76 | 10.7%), Law Enforcement (76 | 10.7%), Food Preparation & Serving (35 | 4.9%), Personal Care & Service (34 | 4.8%), and Healthcare Support (20 | 2.8%).
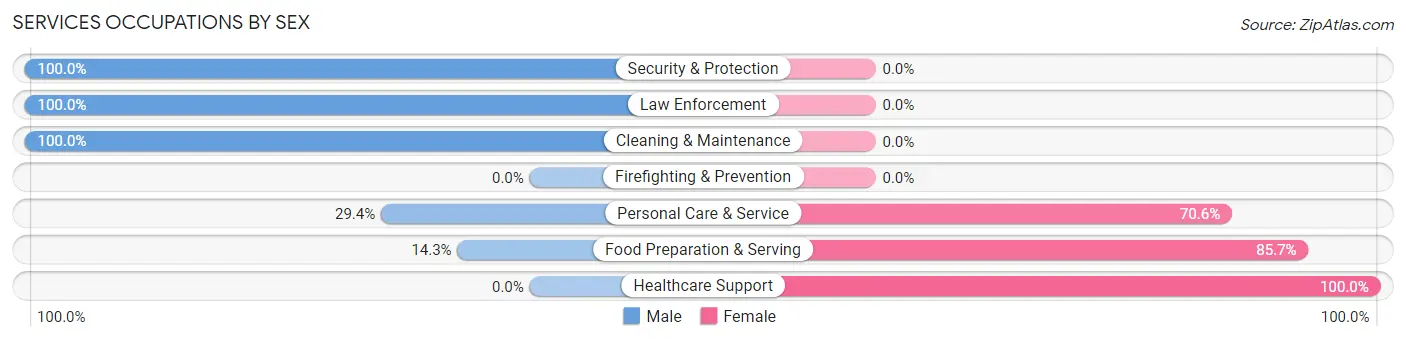
Services Occupations by Sex
Within the Services occupations in Centre Hall borough, the most male-oriented occupations are Security & Protection (100.0%), Law Enforcement (100.0%), and Cleaning & Maintenance (100.0%), while the most female-oriented occupations are Healthcare Support (100.0%), Food Preparation & Serving (85.7%), and Personal Care & Service (70.6%).
| Occupation | Male | Female |
| Healthcare Support | 0 (0.0%) | 20 (100.0%) |
| Security & Protection | 76 (100.0%) | 0 (0.0%) |
| Firefighting & Prevention | 0 (0.0%) | 0 (0.0%) |
| Law Enforcement | 76 (100.0%) | 0 (0.0%) |
| Food Preparation & Serving | 5 (14.3%) | 30 (85.7%) |
| Cleaning & Maintenance | 15 (100.0%) | 0 (0.0%) |
| Personal Care & Service | 10 (29.4%) | 24 (70.6%) |
| Total (Category) | 106 (58.9%) | 74 (41.1%) |
| Total (Overall) | 387 (54.5%) | 323 (45.5%) |
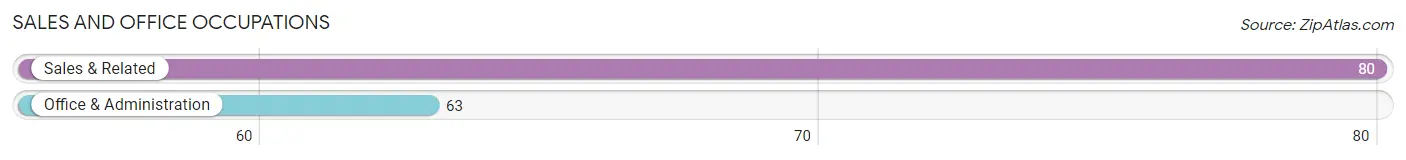
Sales and Office Occupations
The most common Sales and Office occupations in Centre Hall borough are Sales & Related (80 | 11.3%), and Office & Administration (63 | 8.9%).
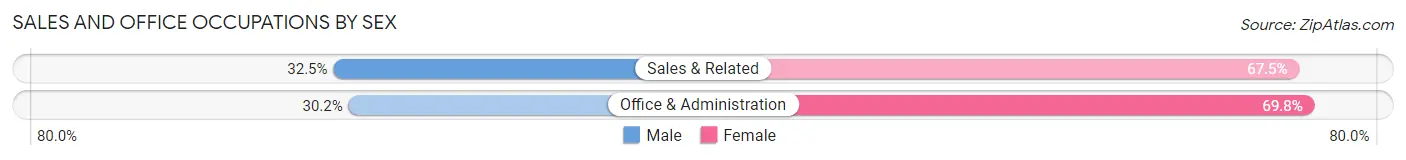
Sales and Office Occupations by Sex
| Occupation | Male | Female |
| Sales & Related | 26 (32.5%) | 54 (67.5%) |
| Office & Administration | 19 (30.2%) | 44 (69.8%) |
| Total (Category) | 45 (31.5%) | 98 (68.5%) |
| Total (Overall) | 387 (54.5%) | 323 (45.5%) |
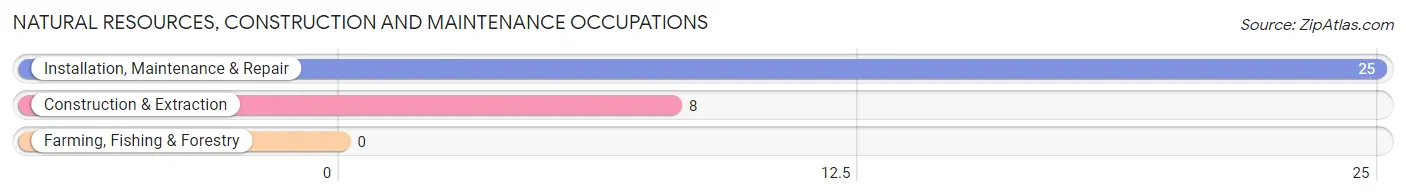
Natural Resources, Construction and Maintenance Occupations
The most common Natural Resources, Construction and Maintenance occupations in Centre Hall borough are Installation, Maintenance & Repair (25 | 3.5%), and Construction & Extraction (8 | 1.1%).
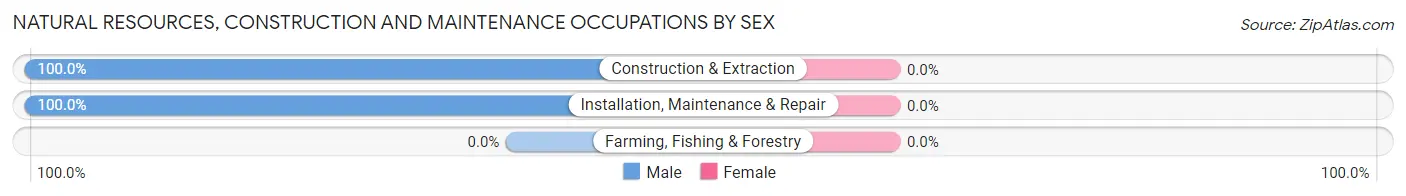
Natural Resources, Construction and Maintenance Occupations by Sex
| Occupation | Male | Female |
| Farming, Fishing & Forestry | 0 (0.0%) | 0 (0.0%) |
| Construction & Extraction | 8 (100.0%) | 0 (0.0%) |
| Installation, Maintenance & Repair | 25 (100.0%) | 0 (0.0%) |
| Total (Category) | 33 (100.0%) | 0 (0.0%) |
| Total (Overall) | 387 (54.5%) | 323 (45.5%) |
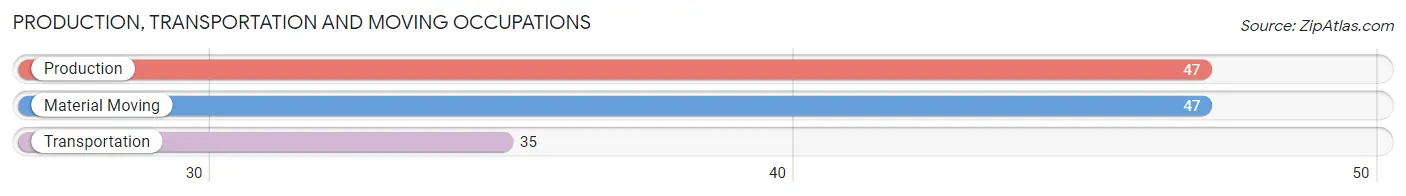
Production, Transportation and Moving Occupations
The most common Production, Transportation and Moving occupations in Centre Hall borough are Production (47 | 6.6%), Material Moving (47 | 6.6%), and Transportation (35 | 4.9%).
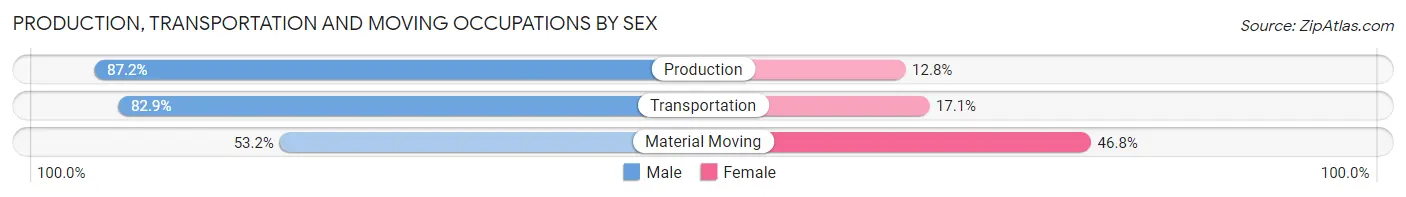
Production, Transportation and Moving Occupations by Sex
| Occupation | Male | Female |
| Production | 41 (87.2%) | 6 (12.8%) |
| Transportation | 29 (82.9%) | 6 (17.1%) |
| Material Moving | 25 (53.2%) | 22 (46.8%) |
| Total (Category) | 95 (73.6%) | 34 (26.4%) |
| Total (Overall) | 387 (54.5%) | 323 (45.5%) |
Employment Industries by Sex in Centre Hall borough
Employment Industries in Centre Hall borough
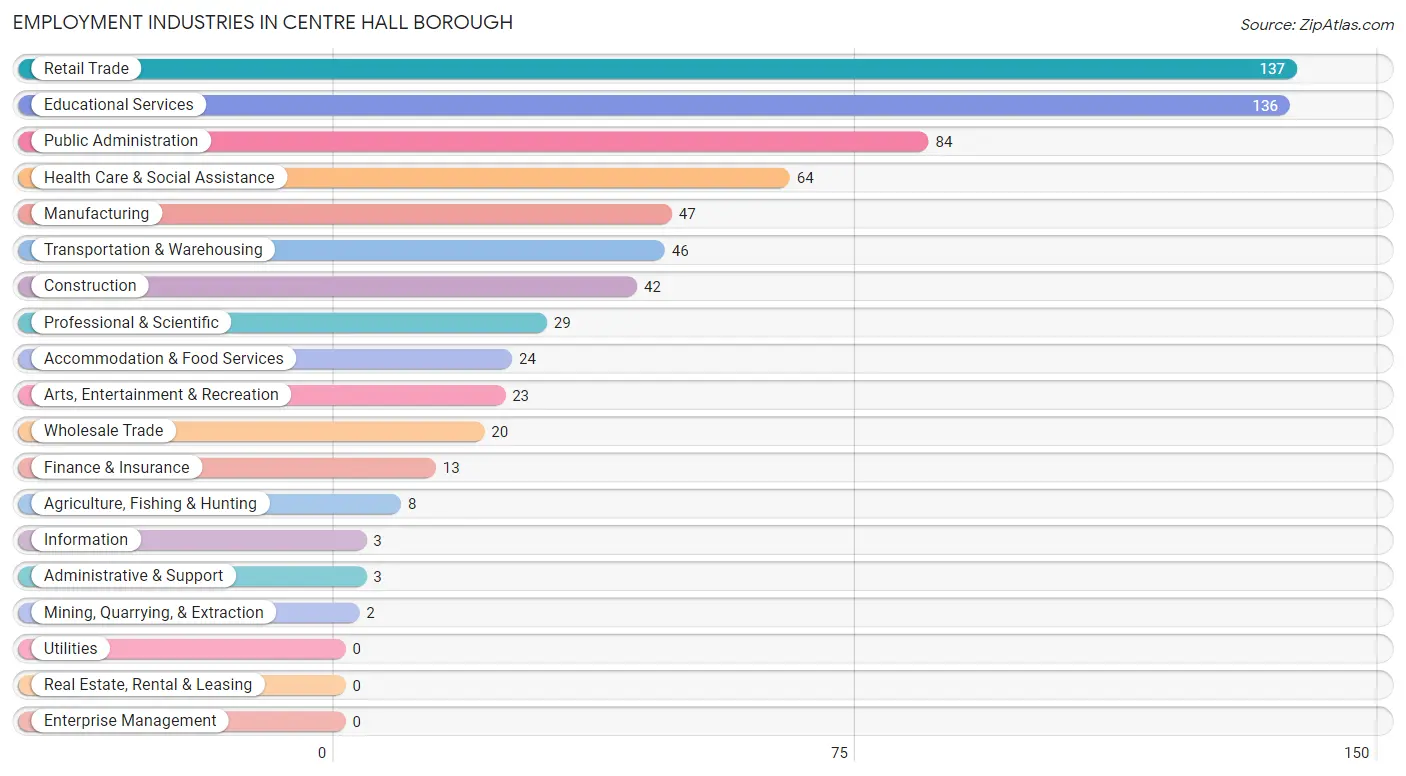
The major employment industries in Centre Hall borough include Retail Trade (137 | 19.3%), Educational Services (136 | 19.2%), Public Administration (84 | 11.8%), Health Care & Social Assistance (64 | 9.0%), and Manufacturing (47 | 6.6%).
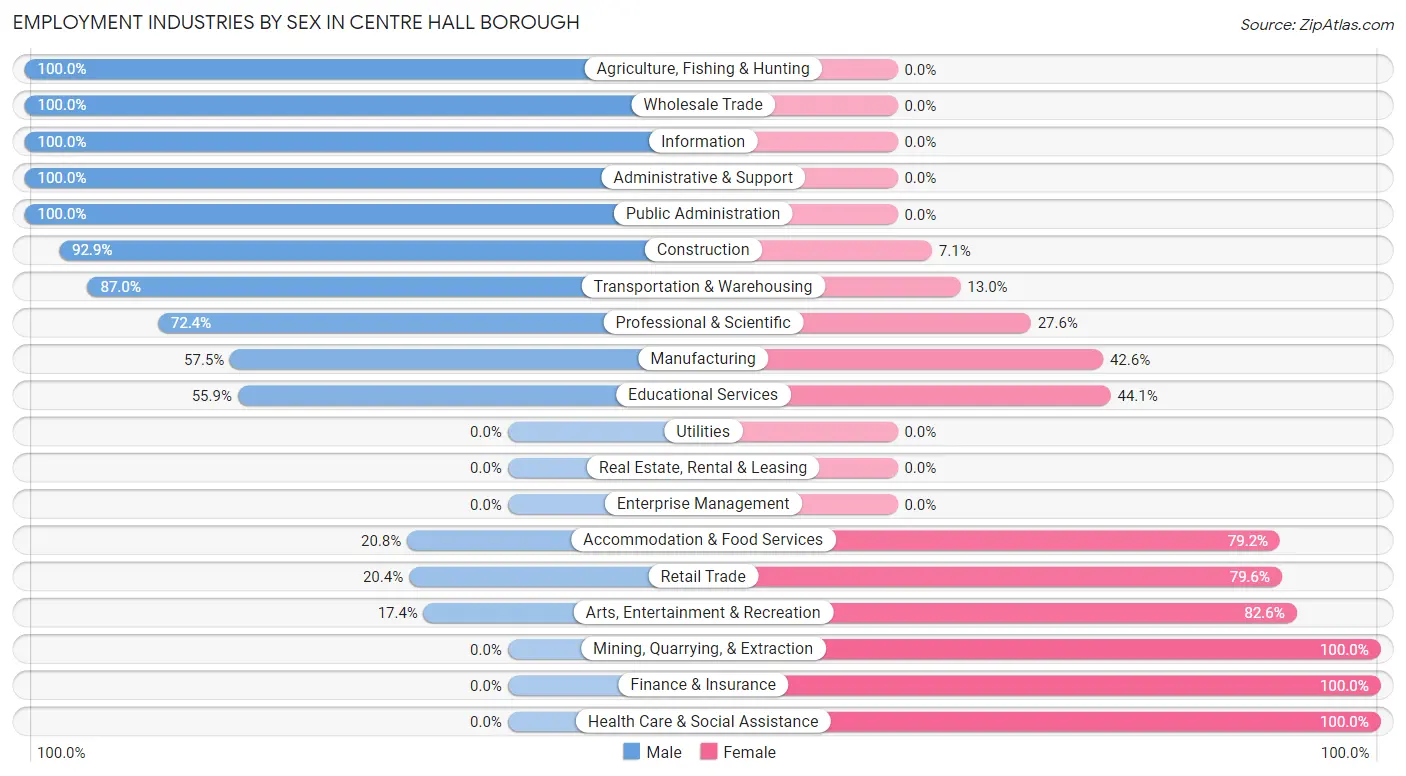
Employment Industries by Sex in Centre Hall borough
The Centre Hall borough industries that see more men than women are Agriculture, Fishing & Hunting (100.0%), Wholesale Trade (100.0%), and Information (100.0%), whereas the industries that tend to have a higher number of women are Mining, Quarrying, & Extraction (100.0%), Finance & Insurance (100.0%), and Health Care & Social Assistance (100.0%).
| Industry | Male | Female |
| Agriculture, Fishing & Hunting | 8 (100.0%) | 0 (0.0%) |
| Mining, Quarrying, & Extraction | 0 (0.0%) | 2 (100.0%) |
| Construction | 39 (92.9%) | 3 (7.1%) |
| Manufacturing | 27 (57.5%) | 20 (42.5%) |
| Wholesale Trade | 20 (100.0%) | 0 (0.0%) |
| Retail Trade | 28 (20.4%) | 109 (79.6%) |
| Transportation & Warehousing | 40 (87.0%) | 6 (13.0%) |
| Utilities | 0 (0.0%) | 0 (0.0%) |
| Information | 3 (100.0%) | 0 (0.0%) |
| Finance & Insurance | 0 (0.0%) | 13 (100.0%) |
| Real Estate, Rental & Leasing | 0 (0.0%) | 0 (0.0%) |
| Professional & Scientific | 21 (72.4%) | 8 (27.6%) |
| Enterprise Management | 0 (0.0%) | 0 (0.0%) |
| Administrative & Support | 3 (100.0%) | 0 (0.0%) |
| Educational Services | 76 (55.9%) | 60 (44.1%) |
| Health Care & Social Assistance | 0 (0.0%) | 64 (100.0%) |
| Arts, Entertainment & Recreation | 4 (17.4%) | 19 (82.6%) |
| Accommodation & Food Services | 5 (20.8%) | 19 (79.2%) |
| Public Administration | 84 (100.0%) | 0 (0.0%) |
| Total | 387 (54.5%) | 323 (45.5%) |
Education in Centre Hall borough
School Enrollment in Centre Hall borough
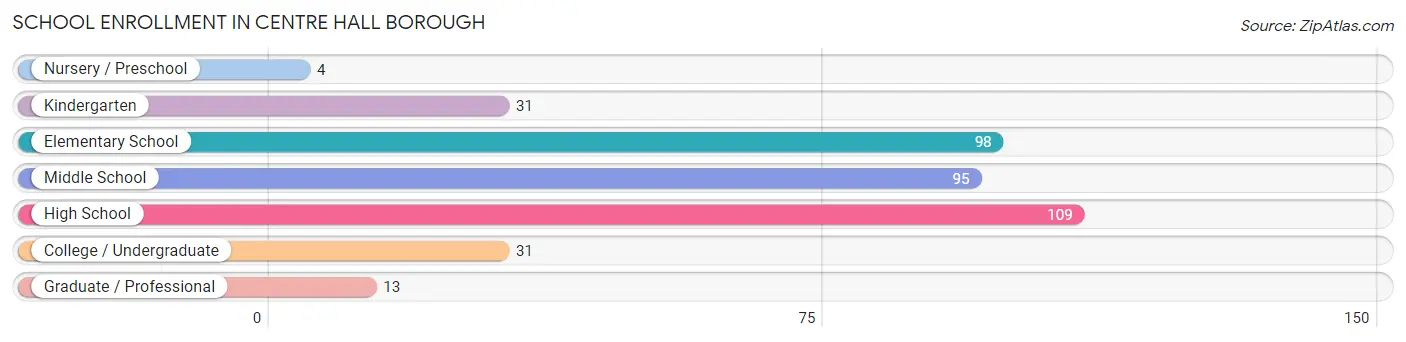
The most common levels of schooling among the 381 students in Centre Hall borough are high school (109 | 28.6%), elementary school (98 | 25.7%), and middle school (95 | 24.9%).
| School Level | # Students | % Students |
| Nursery / Preschool | 4 | 1.1% |
| Kindergarten | 31 | 8.1% |
| Elementary School | 98 | 25.7% |
| Middle School | 95 | 24.9% |
| High School | 109 | 28.6% |
| College / Undergraduate | 31 | 8.1% |
| Graduate / Professional | 13 | 3.4% |
| Total | 381 | 100.0% |
School Enrollment by Age by Funding Source in Centre Hall borough
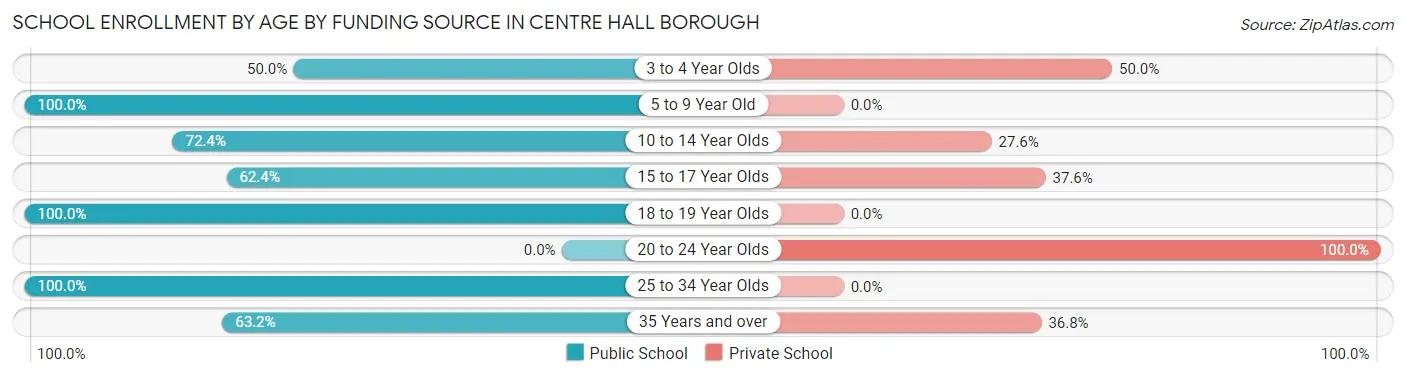
Out of a total of 381 students who are enrolled in schools in Centre Hall borough, 96 (25.2%) attend a private institution, while the remaining 285 (74.8%) are enrolled in public schools. The age group of 20 to 24 year olds has the highest likelihood of being enrolled in private schools, with 11 (100.0% in the age bracket) enrolled. Conversely, the age group of 5 to 9 year old has the lowest likelihood of being enrolled in a private school, with 97 (100.0% in the age bracket) attending a public institution.
| Age Bracket | Public School | Private School |
| 3 to 4 Year Olds | 2 (50.0%) | 2 (50.0%) |
| 5 to 9 Year Old | 97 (100.0%) | 0 (0.0%) |
| 10 to 14 Year Olds | 92 (72.4%) | 35 (27.6%) |
| 15 to 17 Year Olds | 68 (62.4%) | 41 (37.6%) |
| 18 to 19 Year Olds | 1 (100.0%) | 0 (0.0%) |
| 20 to 24 Year Olds | 0 (0.0%) | 11 (100.0%) |
| 25 to 34 Year Olds | 13 (100.0%) | 0 (0.0%) |
| 35 Years and over | 12 (63.2%) | 7 (36.8%) |
| Total | 285 (74.8%) | 96 (25.2%) |
Educational Attainment by Field of Study in Centre Hall borough
Arts & humanities (51 | 20.3%), business (41 | 16.3%), education (29 | 11.6%), science & technology (28 | 11.2%), and psychology (23 | 9.2%) are the most common fields of study among 251 individuals in Centre Hall borough who have obtained a bachelor's degree or higher.
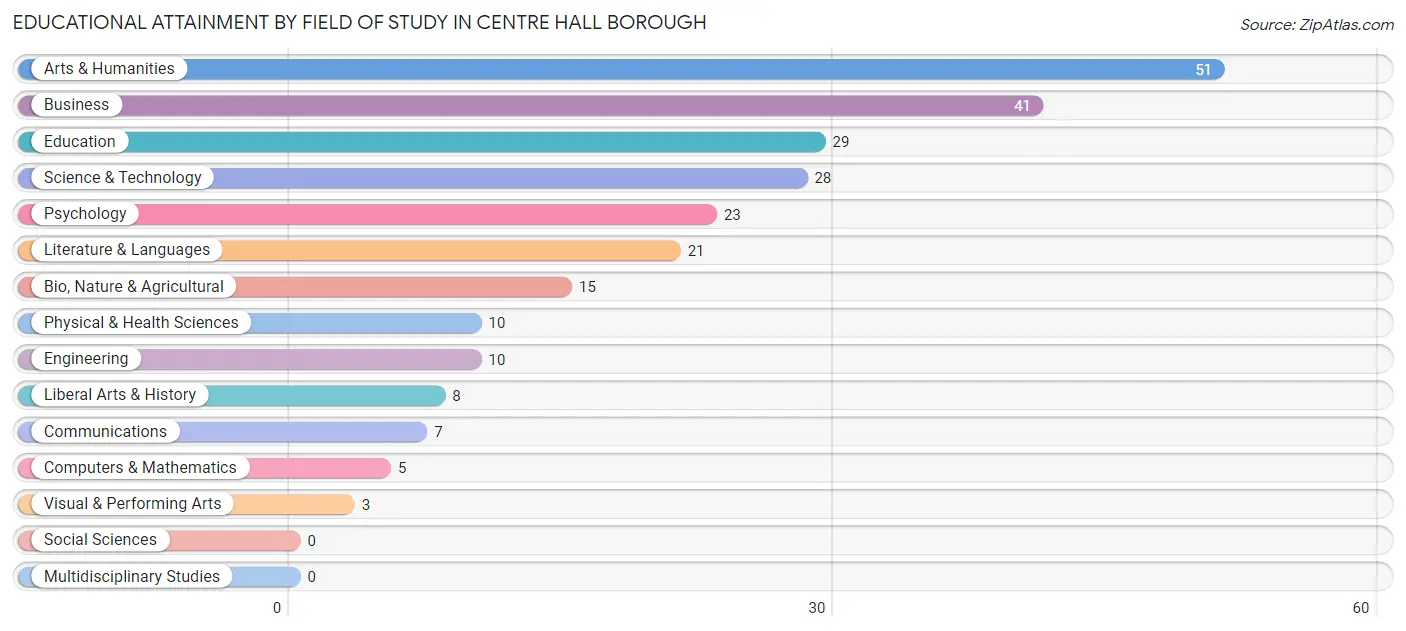
| Field of Study | # Graduates | % Graduates |
| Computers & Mathematics | 5 | 2.0% |
| Bio, Nature & Agricultural | 15 | 6.0% |
| Physical & Health Sciences | 10 | 4.0% |
| Psychology | 23 | 9.2% |
| Social Sciences | 0 | 0.0% |
| Engineering | 10 | 4.0% |
| Multidisciplinary Studies | 0 | 0.0% |
| Science & Technology | 28 | 11.2% |
| Business | 41 | 16.3% |
| Education | 29 | 11.6% |
| Literature & Languages | 21 | 8.4% |
| Liberal Arts & History | 8 | 3.2% |
| Visual & Performing Arts | 3 | 1.2% |
| Communications | 7 | 2.8% |
| Arts & Humanities | 51 | 20.3% |
| Total | 251 | 100.0% |
Transportation & Commute in Centre Hall borough
Vehicle Availability by Sex in Centre Hall borough
The most prevalent vehicle ownership categories in Centre Hall borough are males with 2 vehicles (202, accounting for 53.7%) and females with 2 vehicles (168, making up 63.1%).
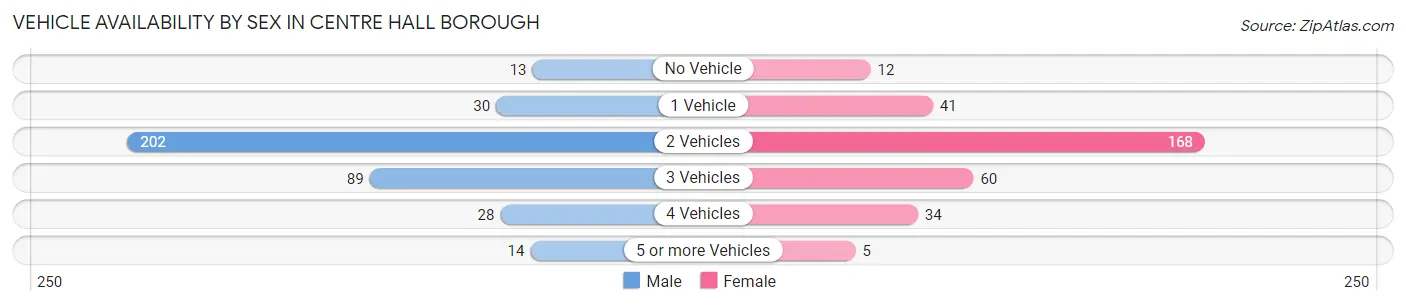
| Vehicles Available | Male | Female |
| No Vehicle | 13 (3.5%) | 12 (3.7%) |
| 1 Vehicle | 30 (8.0%) | 41 (12.8%) |
| 2 Vehicles | 202 (53.7%) | 168 (52.5%) |
| 3 Vehicles | 89 (23.7%) | 60 (18.8%) |
| 4 Vehicles | 28 (7.4%) | 34 (10.6%) |
| 5 or more Vehicles | 14 (3.7%) | 5 (1.6%) |
| Total | 376 (100.0%) | 320 (100.0%) |
Commute Time in Centre Hall borough
The most frequently occuring commute durations in Centre Hall borough are 20 to 24 minutes (214 commuters, 32.2%), 15 to 19 minutes (148 commuters, 22.3%), and 10 to 14 minutes (115 commuters, 17.3%).
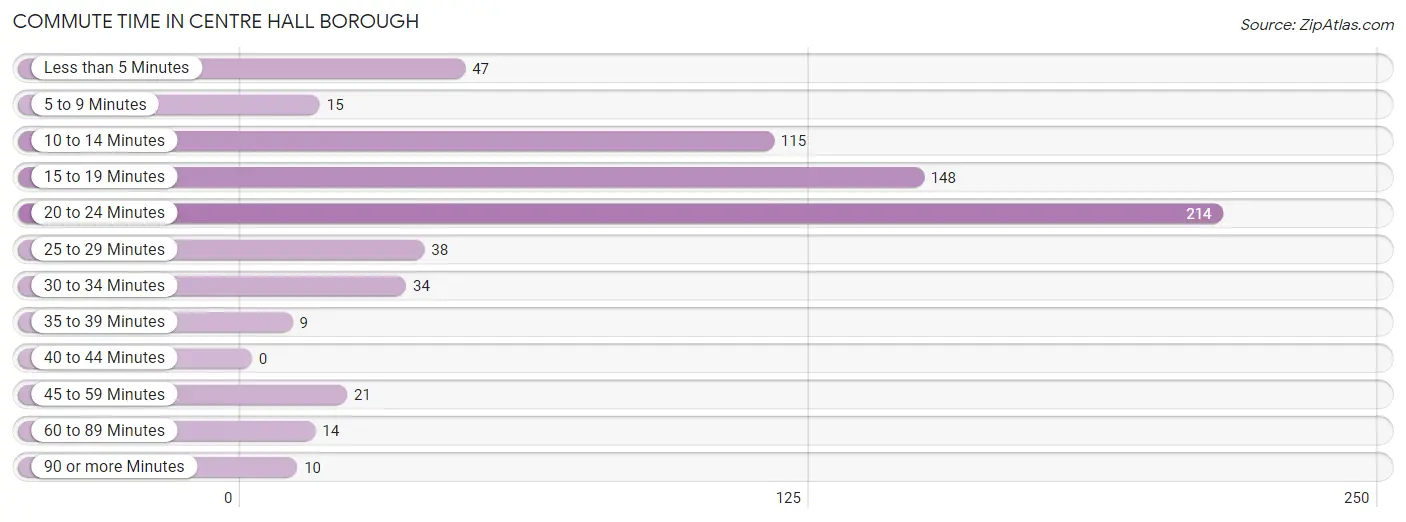
| Commute Time | # Commuters | % Commuters |
| Less than 5 Minutes | 47 | 7.1% |
| 5 to 9 Minutes | 15 | 2.3% |
| 10 to 14 Minutes | 115 | 17.3% |
| 15 to 19 Minutes | 148 | 22.3% |
| 20 to 24 Minutes | 214 | 32.2% |
| 25 to 29 Minutes | 38 | 5.7% |
| 30 to 34 Minutes | 34 | 5.1% |
| 35 to 39 Minutes | 9 | 1.3% |
| 40 to 44 Minutes | 0 | 0.0% |
| 45 to 59 Minutes | 21 | 3.2% |
| 60 to 89 Minutes | 14 | 2.1% |
| 90 or more Minutes | 10 | 1.5% |
Commute Time by Sex in Centre Hall borough
The most common commute times in Centre Hall borough are 15 to 19 minutes (92 commuters, 26.3%) for males and 20 to 24 minutes (122 commuters, 38.7%) for females.
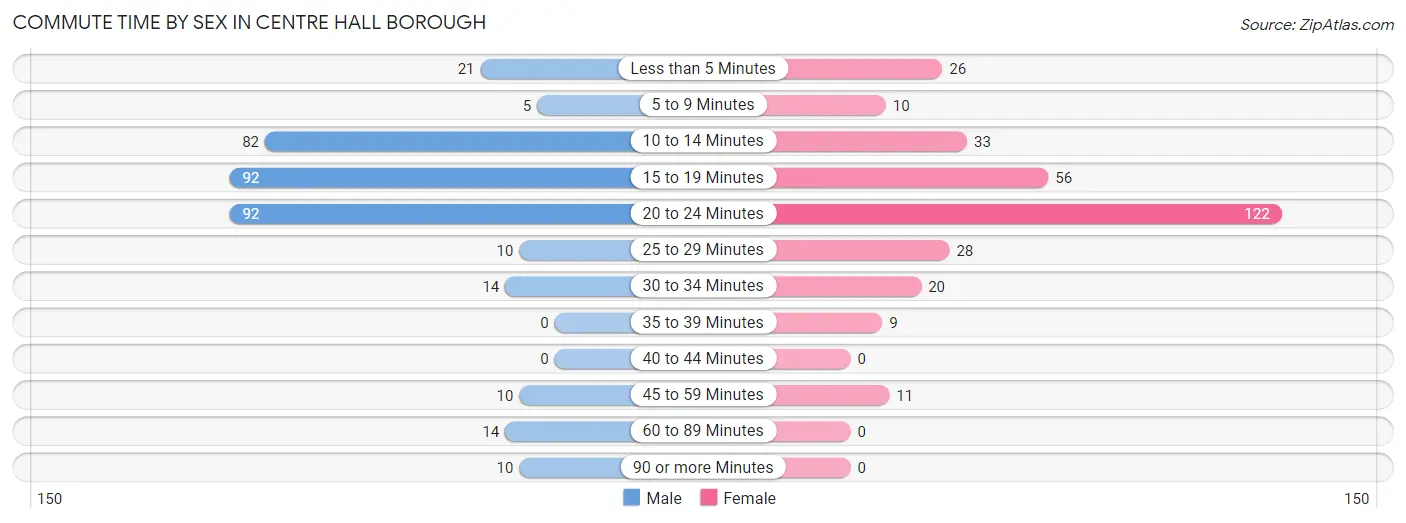
| Commute Time | Male | Female |
| Less than 5 Minutes | 21 (6.0%) | 26 (8.3%) |
| 5 to 9 Minutes | 5 (1.4%) | 10 (3.2%) |
| 10 to 14 Minutes | 82 (23.4%) | 33 (10.5%) |
| 15 to 19 Minutes | 92 (26.3%) | 56 (17.8%) |
| 20 to 24 Minutes | 92 (26.3%) | 122 (38.7%) |
| 25 to 29 Minutes | 10 (2.9%) | 28 (8.9%) |
| 30 to 34 Minutes | 14 (4.0%) | 20 (6.4%) |
| 35 to 39 Minutes | 0 (0.0%) | 9 (2.9%) |
| 40 to 44 Minutes | 0 (0.0%) | 0 (0.0%) |
| 45 to 59 Minutes | 10 (2.9%) | 11 (3.5%) |
| 60 to 89 Minutes | 14 (4.0%) | 0 (0.0%) |
| 90 or more Minutes | 10 (2.9%) | 0 (0.0%) |
Time of Departure to Work by Sex in Centre Hall borough
The most frequent times of departure to work in Centre Hall borough are 5:30 AM to 5:59 AM (73, 20.9%) for males and 7:30 AM to 7:59 AM (58, 18.4%) for females.
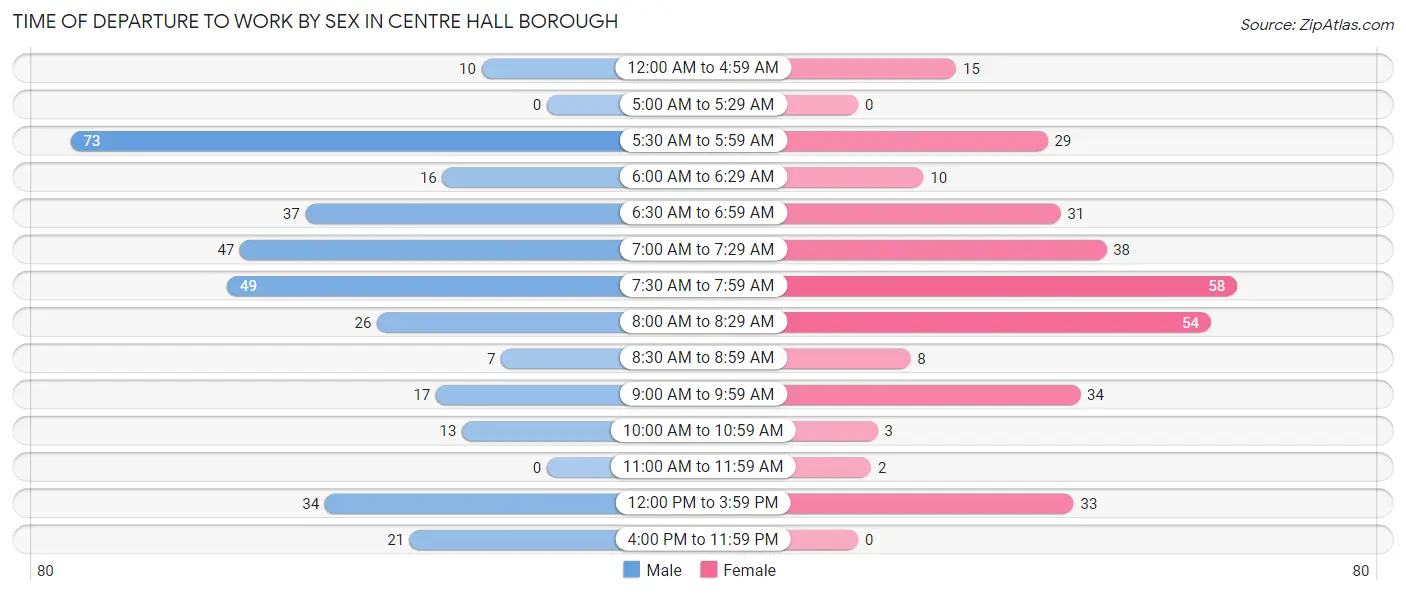
| Time of Departure | Male | Female |
| 12:00 AM to 4:59 AM | 10 (2.9%) | 15 (4.8%) |
| 5:00 AM to 5:29 AM | 0 (0.0%) | 0 (0.0%) |
| 5:30 AM to 5:59 AM | 73 (20.9%) | 29 (9.2%) |
| 6:00 AM to 6:29 AM | 16 (4.6%) | 10 (3.2%) |
| 6:30 AM to 6:59 AM | 37 (10.6%) | 31 (9.8%) |
| 7:00 AM to 7:29 AM | 47 (13.4%) | 38 (12.1%) |
| 7:30 AM to 7:59 AM | 49 (14.0%) | 58 (18.4%) |
| 8:00 AM to 8:29 AM | 26 (7.4%) | 54 (17.1%) |
| 8:30 AM to 8:59 AM | 7 (2.0%) | 8 (2.5%) |
| 9:00 AM to 9:59 AM | 17 (4.9%) | 34 (10.8%) |
| 10:00 AM to 10:59 AM | 13 (3.7%) | 3 (0.9%) |
| 11:00 AM to 11:59 AM | 0 (0.0%) | 2 (0.6%) |
| 12:00 PM to 3:59 PM | 34 (9.7%) | 33 (10.5%) |
| 4:00 PM to 11:59 PM | 21 (6.0%) | 0 (0.0%) |
| Total | 350 (100.0%) | 315 (100.0%) |
Housing Occupancy in Centre Hall borough
Occupancy by Ownership in Centre Hall borough
Of the total 615 dwellings in Centre Hall borough, owner-occupied units account for 437 (71.1%), while renter-occupied units make up 178 (28.9%).
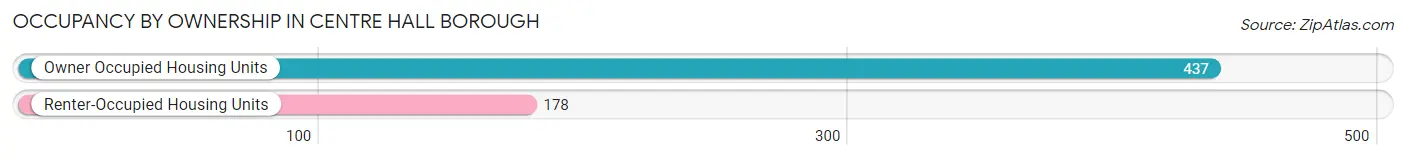
| Occupancy | # Housing Units | % Housing Units |
| Owner Occupied Housing Units | 437 | 71.1% |
| Renter-Occupied Housing Units | 178 | 28.9% |
| Total Occupied Housing Units | 615 | 100.0% |
Occupancy by Household Size in Centre Hall borough
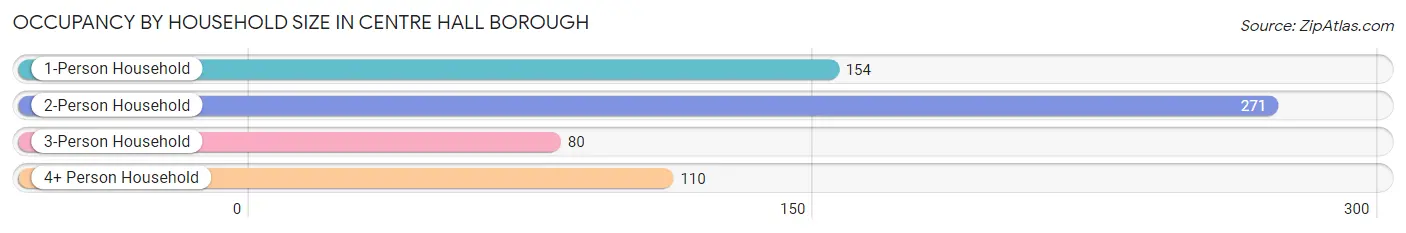
| Household Size | # Housing Units | % Housing Units |
| 1-Person Household | 154 | 25.0% |
| 2-Person Household | 271 | 44.1% |
| 3-Person Household | 80 | 13.0% |
| 4+ Person Household | 110 | 17.9% |
| Total Housing Units | 615 | 100.0% |
Occupancy by Ownership by Household Size in Centre Hall borough
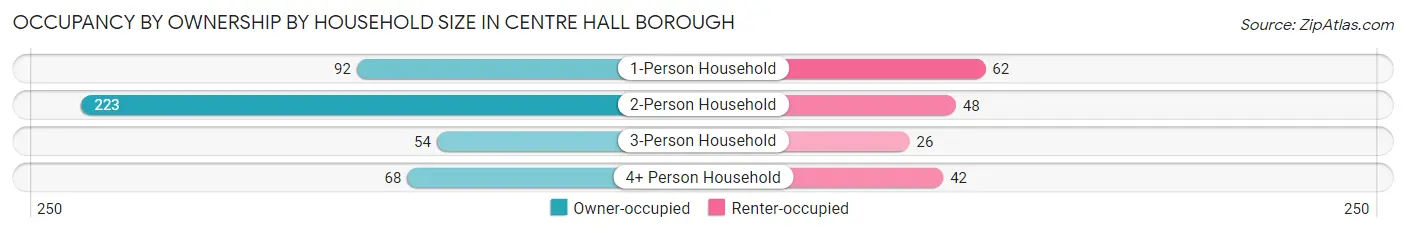
| Household Size | Owner-occupied | Renter-occupied |
| 1-Person Household | 92 (59.7%) | 62 (40.3%) |
| 2-Person Household | 223 (82.3%) | 48 (17.7%) |
| 3-Person Household | 54 (67.5%) | 26 (32.5%) |
| 4+ Person Household | 68 (61.8%) | 42 (38.2%) |
| Total Housing Units | 437 (71.1%) | 178 (28.9%) |
Occupancy by Educational Attainment in Centre Hall borough
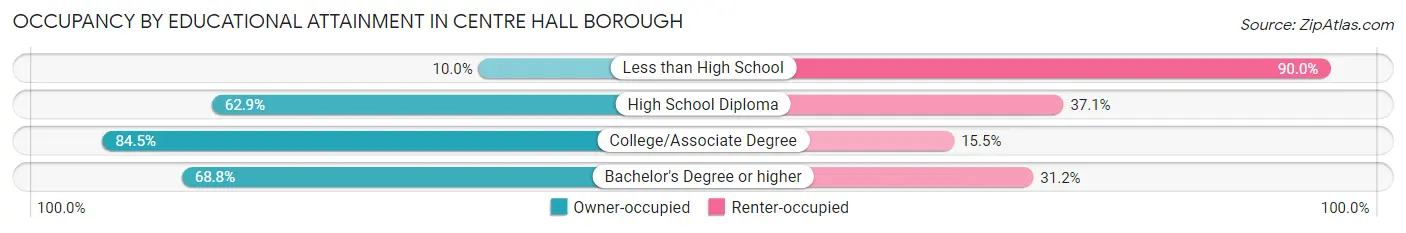
| Household Size | Owner-occupied | Renter-occupied |
| Less than High School | 2 (10.0%) | 18 (90.0%) |
| High School Diploma | 127 (62.9%) | 75 (37.1%) |
| College/Associate Degree | 202 (84.5%) | 37 (15.5%) |
| Bachelor's Degree or higher | 106 (68.8%) | 48 (31.2%) |
Occupancy by Age of Householder in Centre Hall borough
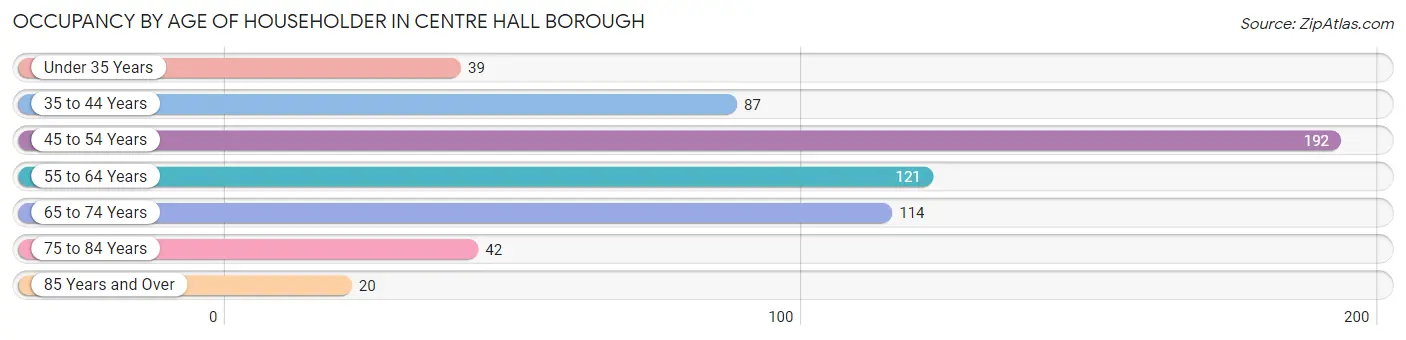
| Age Bracket | # Households | % Households |
| Under 35 Years | 39 | 6.3% |
| 35 to 44 Years | 87 | 14.1% |
| 45 to 54 Years | 192 | 31.2% |
| 55 to 64 Years | 121 | 19.7% |
| 65 to 74 Years | 114 | 18.5% |
| 75 to 84 Years | 42 | 6.8% |
| 85 Years and Over | 20 | 3.3% |
| Total | 615 | 100.0% |
Housing Finances in Centre Hall borough
Median Income by Occupancy in Centre Hall borough
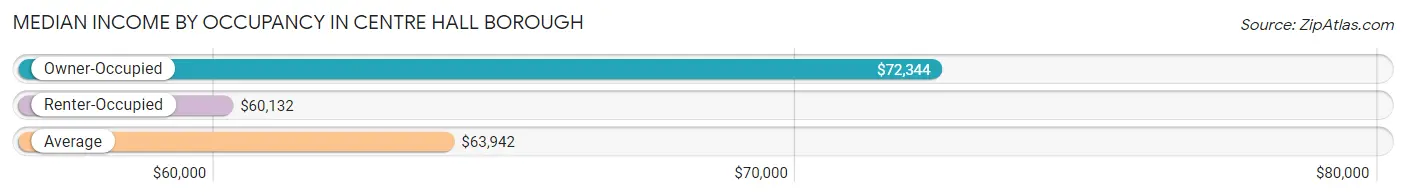
| Occupancy Type | # Households | Median Income |
| Owner-Occupied | 437 (71.1%) | $72,344 |
| Renter-Occupied | 178 (28.9%) | $60,132 |
| Average | 615 (100.0%) | $63,942 |
Occupancy by Householder Income Bracket in Centre Hall borough
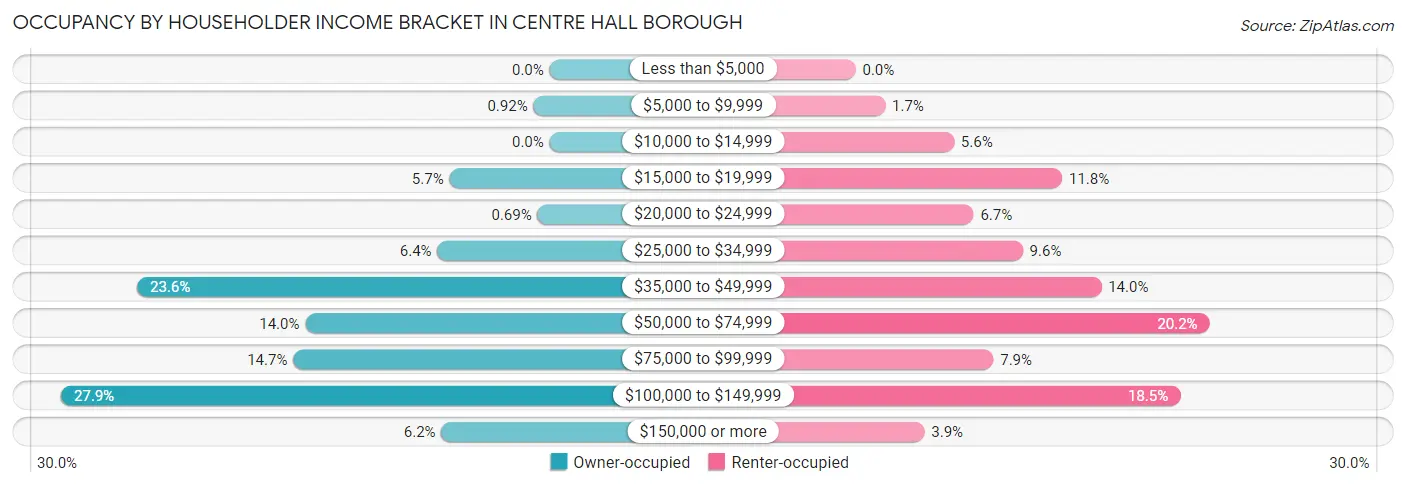
| Income Bracket | Owner-occupied | Renter-occupied |
| Less than $5,000 | 0 (0.0%) | 0 (0.0%) |
| $5,000 to $9,999 | 4 (0.9%) | 3 (1.7%) |
| $10,000 to $14,999 | 0 (0.0%) | 10 (5.6%) |
| $15,000 to $19,999 | 25 (5.7%) | 21 (11.8%) |
| $20,000 to $24,999 | 3 (0.7%) | 12 (6.7%) |
| $25,000 to $34,999 | 28 (6.4%) | 17 (9.6%) |
| $35,000 to $49,999 | 103 (23.6%) | 25 (14.0%) |
| $50,000 to $74,999 | 61 (14.0%) | 36 (20.2%) |
| $75,000 to $99,999 | 64 (14.6%) | 14 (7.9%) |
| $100,000 to $149,999 | 122 (27.9%) | 33 (18.5%) |
| $150,000 or more | 27 (6.2%) | 7 (3.9%) |
| Total | 437 (100.0%) | 178 (100.0%) |
Monthly Housing Cost Tiers in Centre Hall borough
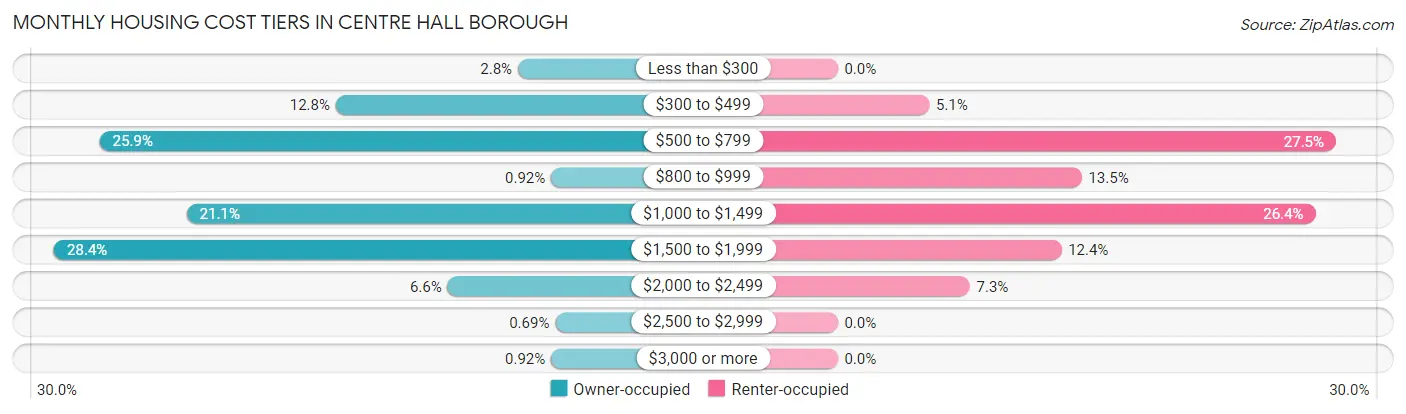
| Monthly Cost | Owner-occupied | Renter-occupied |
| Less than $300 | 12 (2.8%) | 0 (0.0%) |
| $300 to $499 | 56 (12.8%) | 9 (5.1%) |
| $500 to $799 | 113 (25.9%) | 49 (27.5%) |
| $800 to $999 | 4 (0.9%) | 24 (13.5%) |
| $1,000 to $1,499 | 92 (21.0%) | 47 (26.4%) |
| $1,500 to $1,999 | 124 (28.4%) | 22 (12.4%) |
| $2,000 to $2,499 | 29 (6.6%) | 13 (7.3%) |
| $2,500 to $2,999 | 3 (0.7%) | 0 (0.0%) |
| $3,000 or more | 4 (0.9%) | 0 (0.0%) |
| Total | 437 (100.0%) | 178 (100.0%) |
Physical Housing Characteristics in Centre Hall borough
Housing Structures in Centre Hall borough
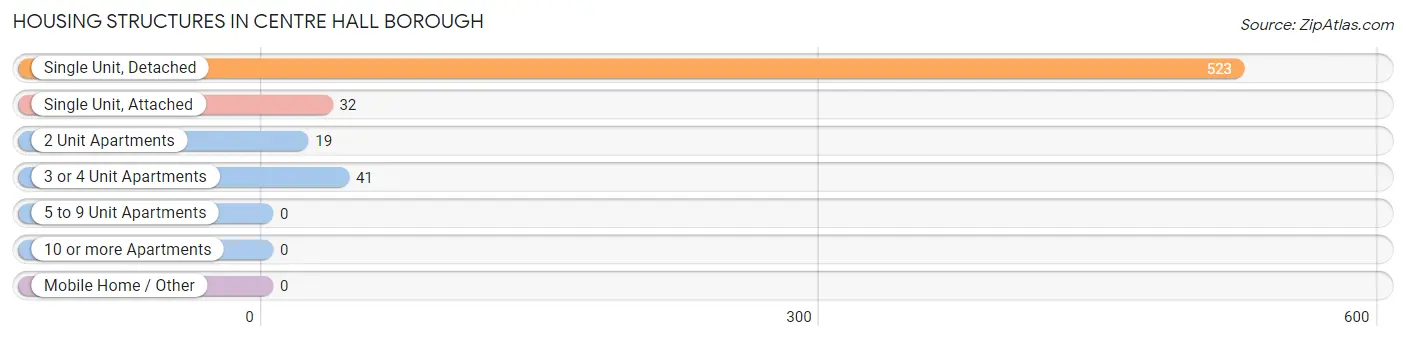
| Structure Type | # Housing Units | % Housing Units |
| Single Unit, Detached | 523 | 85.0% |
| Single Unit, Attached | 32 | 5.2% |
| 2 Unit Apartments | 19 | 3.1% |
| 3 or 4 Unit Apartments | 41 | 6.7% |
| 5 to 9 Unit Apartments | 0 | 0.0% |
| 10 or more Apartments | 0 | 0.0% |
| Mobile Home / Other | 0 | 0.0% |
| Total | 615 | 100.0% |
Housing Structures by Occupancy in Centre Hall borough
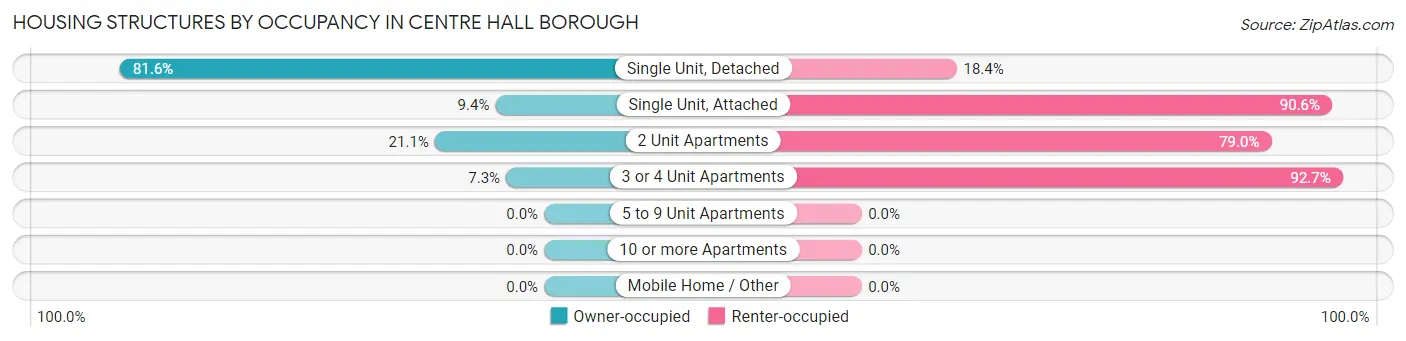
| Structure Type | Owner-occupied | Renter-occupied |
| Single Unit, Detached | 427 (81.6%) | 96 (18.4%) |
| Single Unit, Attached | 3 (9.4%) | 29 (90.6%) |
| 2 Unit Apartments | 4 (21.0%) | 15 (78.9%) |
| 3 or 4 Unit Apartments | 3 (7.3%) | 38 (92.7%) |
| 5 to 9 Unit Apartments | 0 (0.0%) | 0 (0.0%) |
| 10 or more Apartments | 0 (0.0%) | 0 (0.0%) |
| Mobile Home / Other | 0 (0.0%) | 0 (0.0%) |
| Total | 437 (71.1%) | 178 (28.9%) |
Housing Structures by Number of Rooms in Centre Hall borough
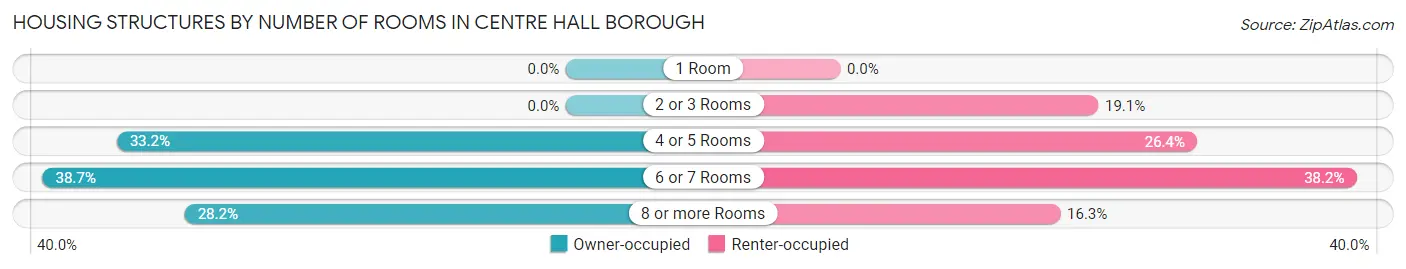
| Number of Rooms | Owner-occupied | Renter-occupied |
| 1 Room | 0 (0.0%) | 0 (0.0%) |
| 2 or 3 Rooms | 0 (0.0%) | 34 (19.1%) |
| 4 or 5 Rooms | 145 (33.2%) | 47 (26.4%) |
| 6 or 7 Rooms | 169 (38.7%) | 68 (38.2%) |
| 8 or more Rooms | 123 (28.1%) | 29 (16.3%) |
| Total | 437 (100.0%) | 178 (100.0%) |
Housing Structure by Heating Type in Centre Hall borough
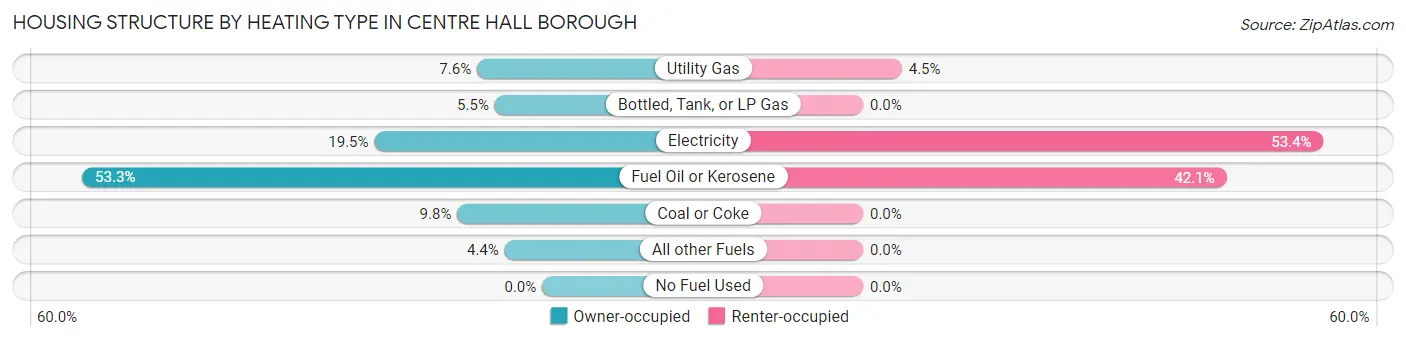
| Heating Type | Owner-occupied | Renter-occupied |
| Utility Gas | 33 (7.5%) | 8 (4.5%) |
| Bottled, Tank, or LP Gas | 24 (5.5%) | 0 (0.0%) |
| Electricity | 85 (19.5%) | 95 (53.4%) |
| Fuel Oil or Kerosene | 233 (53.3%) | 75 (42.1%) |
| Coal or Coke | 43 (9.8%) | 0 (0.0%) |
| All other Fuels | 19 (4.3%) | 0 (0.0%) |
| No Fuel Used | 0 (0.0%) | 0 (0.0%) |
| Total | 437 (100.0%) | 178 (100.0%) |
Household Vehicle Usage in Centre Hall borough
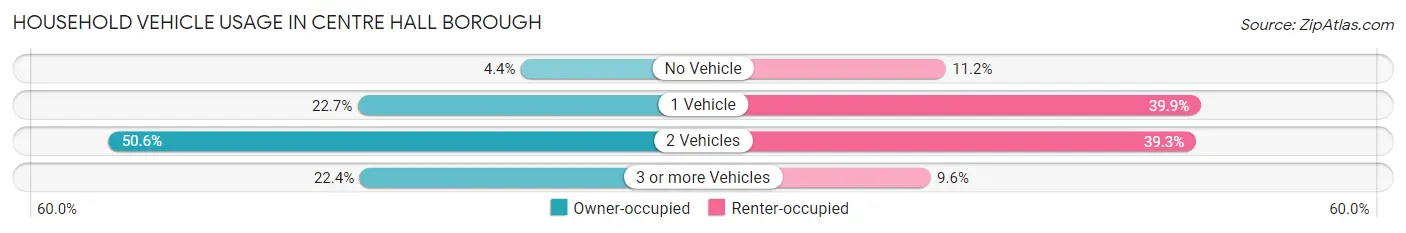
| Vehicles per Household | Owner-occupied | Renter-occupied |
| No Vehicle | 19 (4.3%) | 20 (11.2%) |
| 1 Vehicle | 99 (22.7%) | 71 (39.9%) |
| 2 Vehicles | 221 (50.6%) | 70 (39.3%) |
| 3 or more Vehicles | 98 (22.4%) | 17 (9.6%) |
| Total | 437 (100.0%) | 178 (100.0%) |
Real Estate & Mortgages in Centre Hall borough
Real Estate and Mortgage Overview in Centre Hall borough
| Characteristic | Without Mortgage | With Mortgage |
| Housing Units | 164 | 273 |
| Median Property Value | $258,300 | $221,600 |
| Median Household Income | $39,063 | $27 |
| Monthly Housing Costs | $538 | $4 |
| Real Estate Taxes | $2,288 | $0 |
Property Value by Mortgage Status in Centre Hall borough
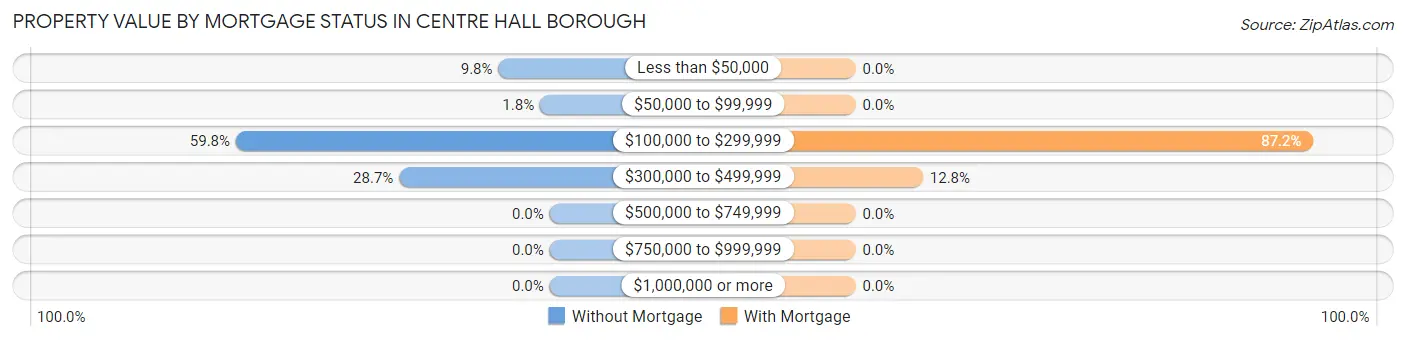
| Property Value | Without Mortgage | With Mortgage |
| Less than $50,000 | 16 (9.8%) | 0 (0.0%) |
| $50,000 to $99,999 | 3 (1.8%) | 0 (0.0%) |
| $100,000 to $299,999 | 98 (59.8%) | 238 (87.2%) |
| $300,000 to $499,999 | 47 (28.7%) | 35 (12.8%) |
| $500,000 to $749,999 | 0 (0.0%) | 0 (0.0%) |
| $750,000 to $999,999 | 0 (0.0%) | 0 (0.0%) |
| $1,000,000 or more | 0 (0.0%) | 0 (0.0%) |
| Total | 164 (100.0%) | 273 (100.0%) |
Household Income by Mortgage Status in Centre Hall borough
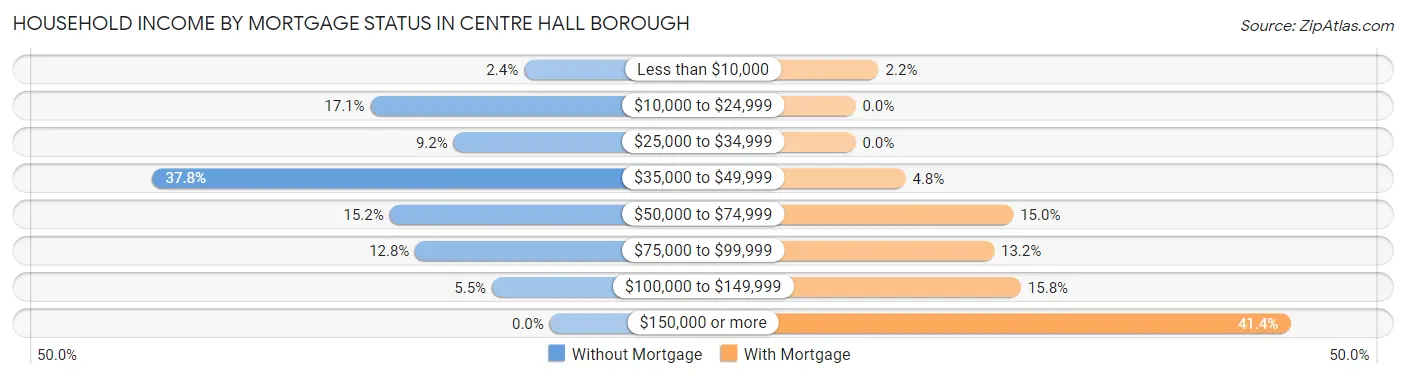
| Household Income | Without Mortgage | With Mortgage |
| Less than $10,000 | 4 (2.4%) | 6 (2.2%) |
| $10,000 to $24,999 | 28 (17.1%) | 0 (0.0%) |
| $25,000 to $34,999 | 15 (9.1%) | 0 (0.0%) |
| $35,000 to $49,999 | 62 (37.8%) | 13 (4.8%) |
| $50,000 to $74,999 | 25 (15.2%) | 41 (15.0%) |
| $75,000 to $99,999 | 21 (12.8%) | 36 (13.2%) |
| $100,000 to $149,999 | 9 (5.5%) | 43 (15.8%) |
| $150,000 or more | 0 (0.0%) | 113 (41.4%) |
| Total | 164 (100.0%) | 273 (100.0%) |
Property Value to Household Income Ratio in Centre Hall borough
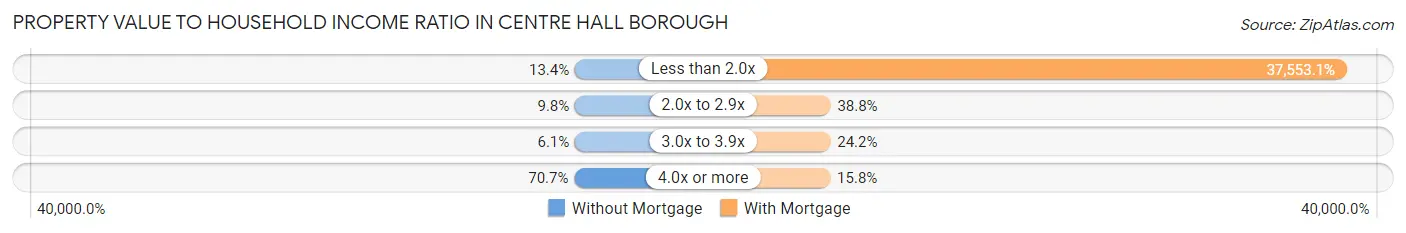
| Value-to-Income Ratio | Without Mortgage | With Mortgage |
| Less than 2.0x | 22 (13.4%) | 102,520 (37,553.1%) |
| 2.0x to 2.9x | 16 (9.8%) | 106 (38.8%) |
| 3.0x to 3.9x | 10 (6.1%) | 66 (24.2%) |
| 4.0x or more | 116 (70.7%) | 43 (15.8%) |
| Total | 164 (100.0%) | 273 (100.0%) |
Real Estate Taxes by Mortgage Status in Centre Hall borough
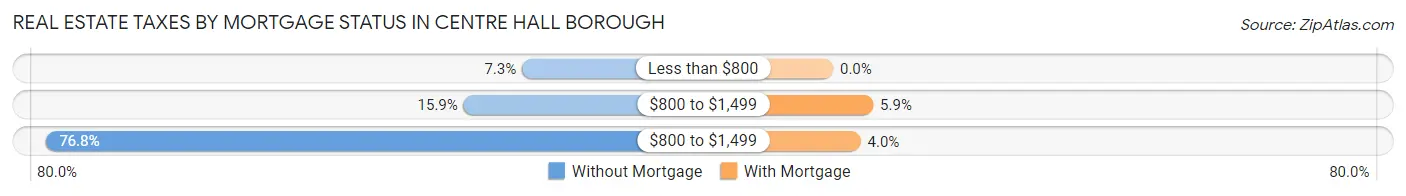
| Property Taxes | Without Mortgage | With Mortgage |
| Less than $800 | 12 (7.3%) | 0 (0.0%) |
| $800 to $1,499 | 26 (15.9%) | 16 (5.9%) |
| $800 to $1,499 | 126 (76.8%) | 11 (4.0%) |
| Total | 164 (100.0%) | 273 (100.0%) |
Health & Disability in Centre Hall borough
Health Insurance Coverage by Age in Centre Hall borough
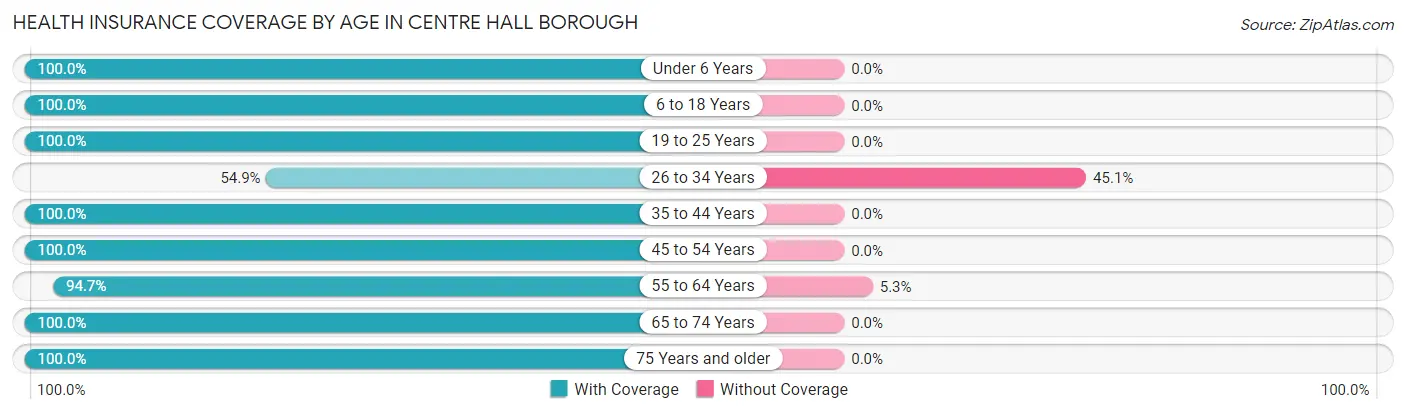
| Age Bracket | With Coverage | Without Coverage |
| Under 6 Years | 44 (100.0%) | 0 (0.0%) |
| 6 to 18 Years | 327 (100.0%) | 0 (0.0%) |
| 19 to 25 Years | 68 (100.0%) | 0 (0.0%) |
| 26 to 34 Years | 56 (54.9%) | 46 (45.1%) |
| 35 to 44 Years | 165 (100.0%) | 0 (0.0%) |
| 45 to 54 Years | 289 (100.0%) | 0 (0.0%) |
| 55 to 64 Years | 214 (94.7%) | 12 (5.3%) |
| 65 to 74 Years | 149 (100.0%) | 0 (0.0%) |
| 75 Years and older | 102 (100.0%) | 0 (0.0%) |
| Total | 1,414 (96.1%) | 58 (3.9%) |
Health Insurance Coverage by Citizenship Status in Centre Hall borough
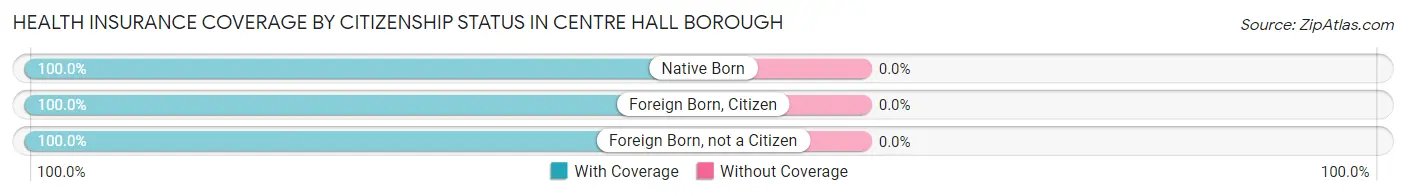
| Citizenship Status | With Coverage | Without Coverage |
| Native Born | 44 (100.0%) | 0 (0.0%) |
| Foreign Born, Citizen | 327 (100.0%) | 0 (0.0%) |
| Foreign Born, not a Citizen | 68 (100.0%) | 0 (0.0%) |
Health Insurance Coverage by Household Income in Centre Hall borough
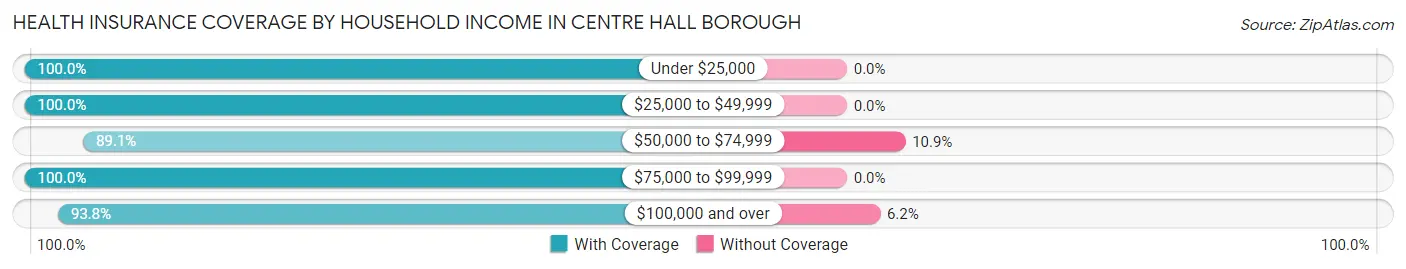
| Household Income | With Coverage | Without Coverage |
| Under $25,000 | 106 (100.0%) | 0 (0.0%) |
| $25,000 to $49,999 | 393 (100.0%) | 0 (0.0%) |
| $50,000 to $74,999 | 228 (89.1%) | 28 (10.9%) |
| $75,000 to $99,999 | 235 (100.0%) | 0 (0.0%) |
| $100,000 and over | 452 (93.8%) | 30 (6.2%) |
Public vs Private Health Insurance Coverage by Age in Centre Hall borough
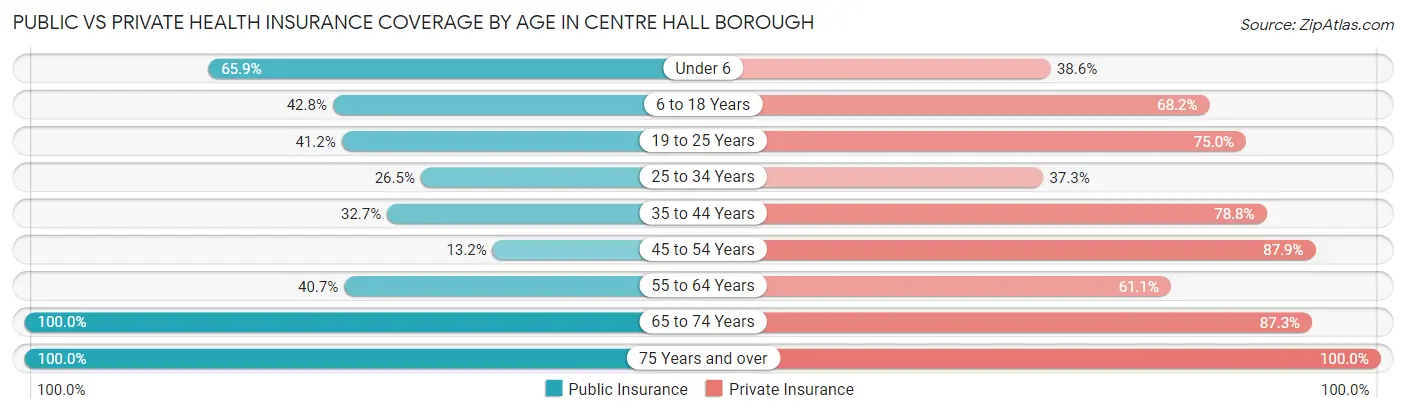
| Age Bracket | Public Insurance | Private Insurance |
| Under 6 | 29 (65.9%) | 17 (38.6%) |
| 6 to 18 Years | 140 (42.8%) | 223 (68.2%) |
| 19 to 25 Years | 28 (41.2%) | 51 (75.0%) |
| 25 to 34 Years | 27 (26.5%) | 38 (37.2%) |
| 35 to 44 Years | 54 (32.7%) | 130 (78.8%) |
| 45 to 54 Years | 38 (13.2%) | 254 (87.9%) |
| 55 to 64 Years | 92 (40.7%) | 138 (61.1%) |
| 65 to 74 Years | 149 (100.0%) | 130 (87.3%) |
| 75 Years and over | 102 (100.0%) | 102 (100.0%) |
| Total | 659 (44.8%) | 1,083 (73.6%) |
Disability Status by Sex by Age in Centre Hall borough
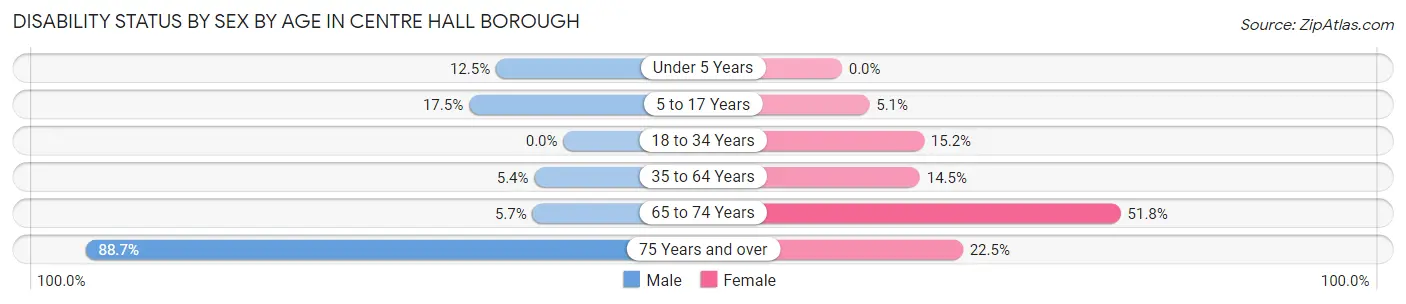
| Age Bracket | Male | Female |
| Under 5 Years | 2 (12.5%) | 0 (0.0%) |
| 5 to 17 Years | 24 (17.5%) | 10 (5.1%) |
| 18 to 34 Years | 0 (0.0%) | 16 (15.2%) |
| 35 to 64 Years | 21 (5.4%) | 42 (14.5%) |
| 65 to 74 Years | 2 (5.7%) | 59 (51.7%) |
| 75 Years and over | 47 (88.7%) | 11 (22.5%) |
Disability Class by Sex by Age in Centre Hall borough
Disability Class: Hearing Difficulty
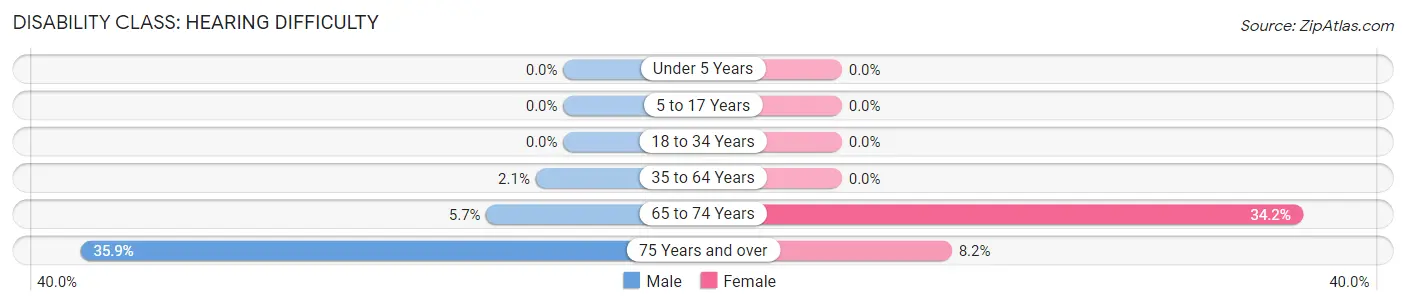
| Age Bracket | Male | Female |
| Under 5 Years | 0 (0.0%) | 0 (0.0%) |
| 5 to 17 Years | 0 (0.0%) | 0 (0.0%) |
| 18 to 34 Years | 0 (0.0%) | 0 (0.0%) |
| 35 to 64 Years | 8 (2.1%) | 0 (0.0%) |
| 65 to 74 Years | 2 (5.7%) | 39 (34.2%) |
| 75 Years and over | 19 (35.8%) | 4 (8.2%) |
Disability Class: Vision Difficulty
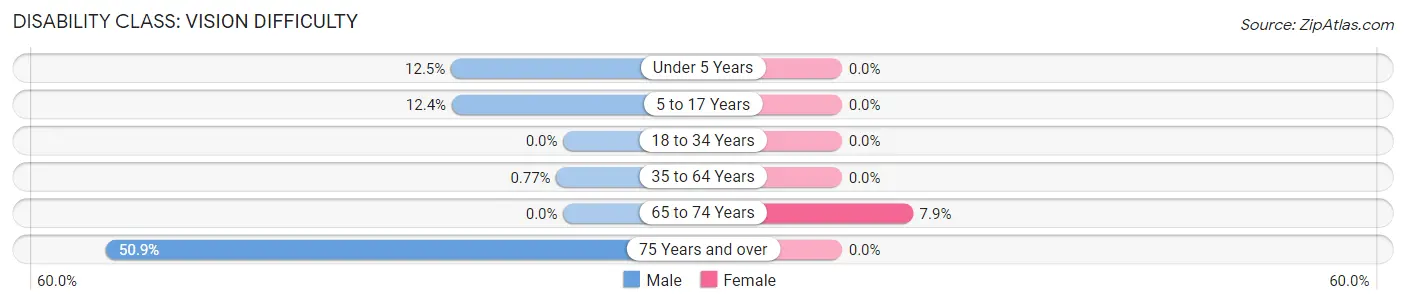
| Age Bracket | Male | Female |
| Under 5 Years | 2 (12.5%) | 0 (0.0%) |
| 5 to 17 Years | 17 (12.4%) | 0 (0.0%) |
| 18 to 34 Years | 0 (0.0%) | 0 (0.0%) |
| 35 to 64 Years | 3 (0.8%) | 0 (0.0%) |
| 65 to 74 Years | 0 (0.0%) | 9 (7.9%) |
| 75 Years and over | 27 (50.9%) | 0 (0.0%) |
Disability Class: Cognitive Difficulty
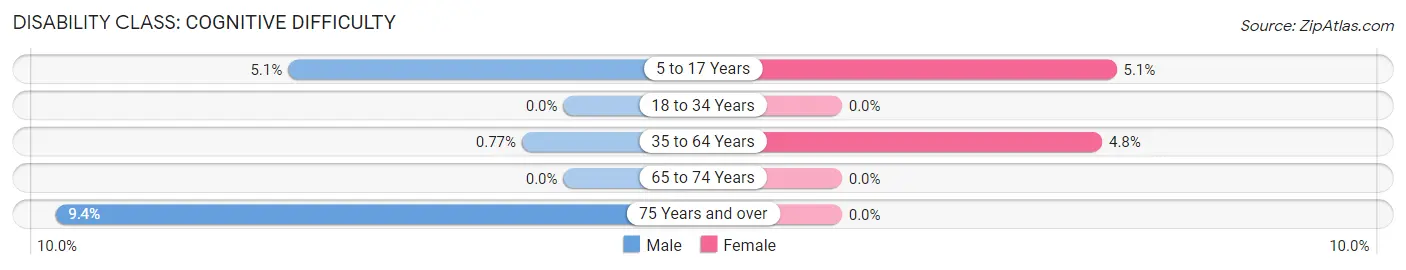
| Age Bracket | Male | Female |
| 5 to 17 Years | 7 (5.1%) | 10 (5.1%) |
| 18 to 34 Years | 0 (0.0%) | 0 (0.0%) |
| 35 to 64 Years | 3 (0.8%) | 14 (4.8%) |
| 65 to 74 Years | 0 (0.0%) | 0 (0.0%) |
| 75 Years and over | 5 (9.4%) | 0 (0.0%) |
Disability Class: Ambulatory Difficulty
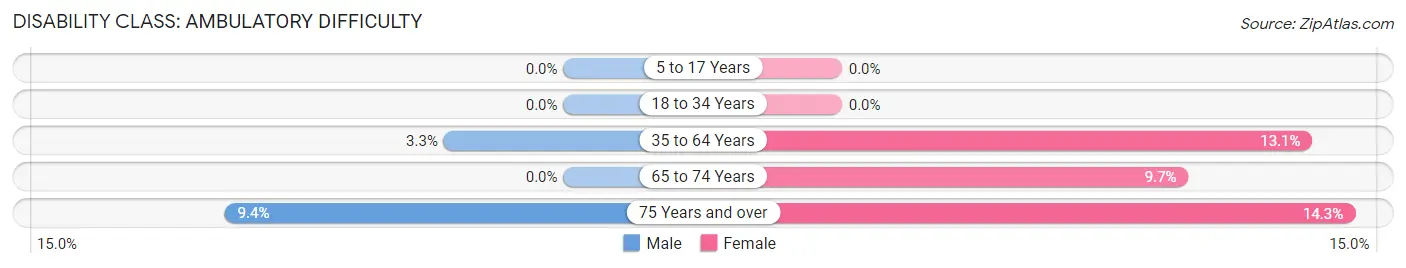
| Age Bracket | Male | Female |
| 5 to 17 Years | 0 (0.0%) | 0 (0.0%) |
| 18 to 34 Years | 0 (0.0%) | 0 (0.0%) |
| 35 to 64 Years | 13 (3.3%) | 38 (13.1%) |
| 65 to 74 Years | 0 (0.0%) | 11 (9.7%) |
| 75 Years and over | 5 (9.4%) | 7 (14.3%) |
Disability Class: Self-Care Difficulty
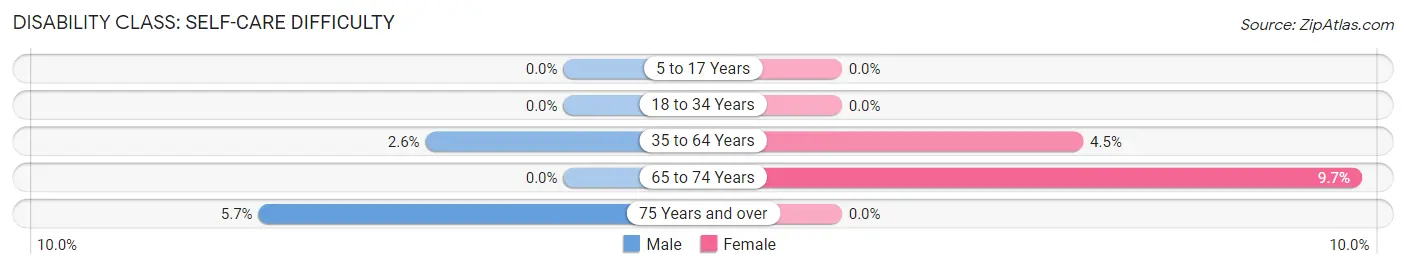
| Age Bracket | Male | Female |
| 5 to 17 Years | 0 (0.0%) | 0 (0.0%) |
| 18 to 34 Years | 0 (0.0%) | 0 (0.0%) |
| 35 to 64 Years | 10 (2.6%) | 13 (4.5%) |
| 65 to 74 Years | 0 (0.0%) | 11 (9.7%) |
| 75 Years and over | 3 (5.7%) | 0 (0.0%) |
Technology Access in Centre Hall borough
Computing Device Access in Centre Hall borough
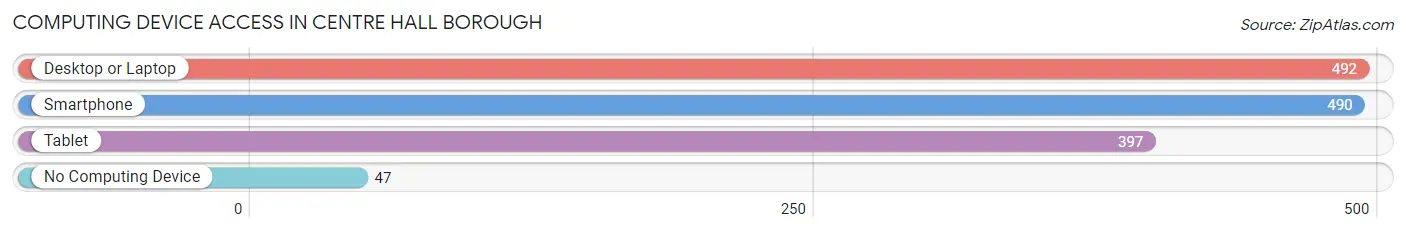
| Device Type | # Households | % Households |
| Desktop or Laptop | 492 | 80.0% |
| Smartphone | 490 | 79.7% |
| Tablet | 397 | 64.5% |
| No Computing Device | 47 | 7.6% |
| Total | 615 | 100.0% |
Internet Access in Centre Hall borough
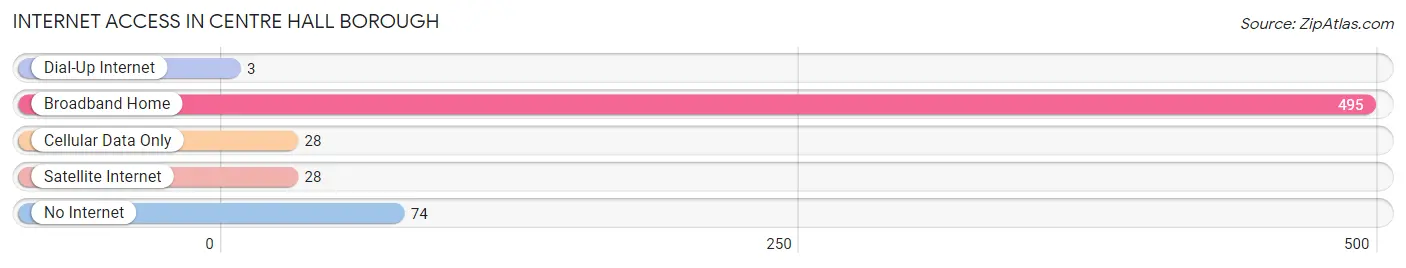
| Internet Type | # Households | % Households |
| Dial-Up Internet | 3 | 0.5% |
| Broadband Home | 495 | 80.5% |
| Cellular Data Only | 28 | 4.5% |
| Satellite Internet | 28 | 4.5% |
| No Internet | 74 | 12.0% |
| Total | 615 | 100.0% |
Centre Hall borough Summary
Centre Hall Borough is a small borough located in Centre County, Pennsylvania. It is situated in the Nittany Valley, which is part of the Ridge and Valley physiographic province of the Appalachian Mountains. The borough is located approximately 8 miles east of State College, the county seat, and is part of the State College Metropolitan Statistical Area. As of the 2010 census, the population of Centre Hall Borough was 1,092.
Geography
Centre Hall Borough is located at 40°48'45" North, 77°37'45" West (40.8125, -77.6292). It has a total area of 0.6 square miles, all of which is land. The borough is situated in the Nittany Valley, which is part of the Ridge and Valley physiographic province of the Appalachian Mountains. The terrain is generally rolling hills, with the highest point in the borough being 890 feet above sea level. The borough is drained by several small streams, including Spring Creek, which flows through the center of the borough.
Climate
Centre Hall Borough has a humid continental climate, with cold, snowy winters and warm, humid summers. The average annual temperature is 48°F, with an average high of 68°F in July and an average low of 28°F in January. The average annual precipitation is 40 inches, with an average of 4 inches of snowfall per year.
Demographics
As of the 2010 census, there were 1,092 people, 441 households, and 305 families residing in the borough. The population density was 1,817.3 people per square mile. The racial makeup of the borough was 97.3% White, 0.7% African American, 0.2% Native American, 0.2% Asian, 0.2% from other races, and 1.4% from two or more races. Hispanic or Latino of any race were 0.7% of the population.
There were 441 households, out of which 28.2% had children under the age of 18 living with them, 54.2% were married couples living together, 8.6% had a female householder with no husband present, and 32.7% were non-families. 27.2% of all households were made up of individuals, and 11.3% had someone living alone who was 65 years of age or older. The average household size was 2.47 and the average family size was 3.02.
The median age in the borough was 41.2 years. 22.7% of residents were under the age of 18; 6.7% were between the ages of 18 and 24; 25.2% were from 25 to 44; 29.2% were from 45 to 64; and 16.2% were 65 years of age or older. The gender makeup of the borough was 48.7% male and 51.3% female.
Economy
The economy of Centre Hall Borough is largely based on agriculture and tourism. The borough is home to several small farms, which produce a variety of crops, including corn, soybeans, hay, and vegetables. The borough is also home to several small businesses, including restaurants, retail stores, and service providers. Tourism is also an important part of the local economy, with visitors coming to the area to enjoy the natural beauty of the Nittany Valley and to take part in outdoor activities such as hiking, fishing, and camping.
The median household income in Centre Hall Borough was $50,938 in 2018, and the median family income was $60,938. The per capita income was $25,938. About 8.2% of families and 10.2% of the population were below the poverty line, including 14.2% of those under age 18 and 5.2% of those age 65 or over.
Conclusion
Centre Hall Borough is a small borough located in Centre County, Pennsylvania. It is situated in the Nittany Valley, which is part of the Ridge and Valley physiographic province of the Appalachian Mountains. The borough has a population of 1,092, and the economy is largely based on agriculture and tourism. The median household income in Centre Hall Borough was $50,938 in 2018, and the median family income was $60,938. The per capita income was $25,938. Centre Hall Borough is a beautiful area with a rich history and a vibrant economy.
Common Questions
What is the Total Population of Centre Hall borough?
Total Population of Centre Hall borough is 1,472.
What is the Total Male Population of Centre Hall borough?
Total Male Population of Centre Hall borough is 698.
What is the Total Female Population of Centre Hall borough?
Total Female Population of Centre Hall borough is 774.
What is the Ratio of Males per 100 Females in Centre Hall borough?
There are 90.18 Males per 100 Females in Centre Hall borough.
What is the Ratio of Females per 100 Males in Centre Hall borough?
There are 110.89 Females per 100 Males in Centre Hall borough.
What is the Median Population Age in Centre Hall borough?
Median Population Age in Centre Hall borough is 46.4 Years.
What is the Average Family Size in Centre Hall borough
Average Family Size in Centre Hall borough is 2.9 People.
What is the Average Household Size in Centre Hall borough
Average Household Size in Centre Hall borough is 2.4 People.
What is Per Capita Income in Centre Hall borough?
Per Capita income in Centre Hall borough is $30,328.
What is the Median Family Income in Centre Hall borough?
Median Family Income in Centre Hall borough is $77,143.
What is the Median Household income in Centre Hall borough?
Median Household Income in Centre Hall borough is $63,942.
What is Income or Wage Gap in Centre Hall borough?
Income or Wage Gap in Centre Hall borough is 38.8%.
Women in Centre Hall borough earn 61.2 cents for every dollar earned by a man.
What is Inequality or Gini Index in Centre Hall borough?
Inequality or Gini Index in Centre Hall borough is 0.33.
How Large is the Labor Force in Centre Hall borough?
There are 751 People in the Labor Forcein in Centre Hall borough.
What is the Percentage of People in the Labor Force in Centre Hall borough?
64.4% of People are in the Labor Force in Centre Hall borough.
What is the Unemployment Rate in Centre Hall borough?
Unemployment Rate in Centre Hall borough is 5.5%.