Zip Codes with the Highest Percentage of Population Employed in Health Diagnosing & Treating in Hazleton, PA
RELATED REPORTS & OPTIONS
Health Diagnosing & Treating
Hazleton
Compare Zip Codes
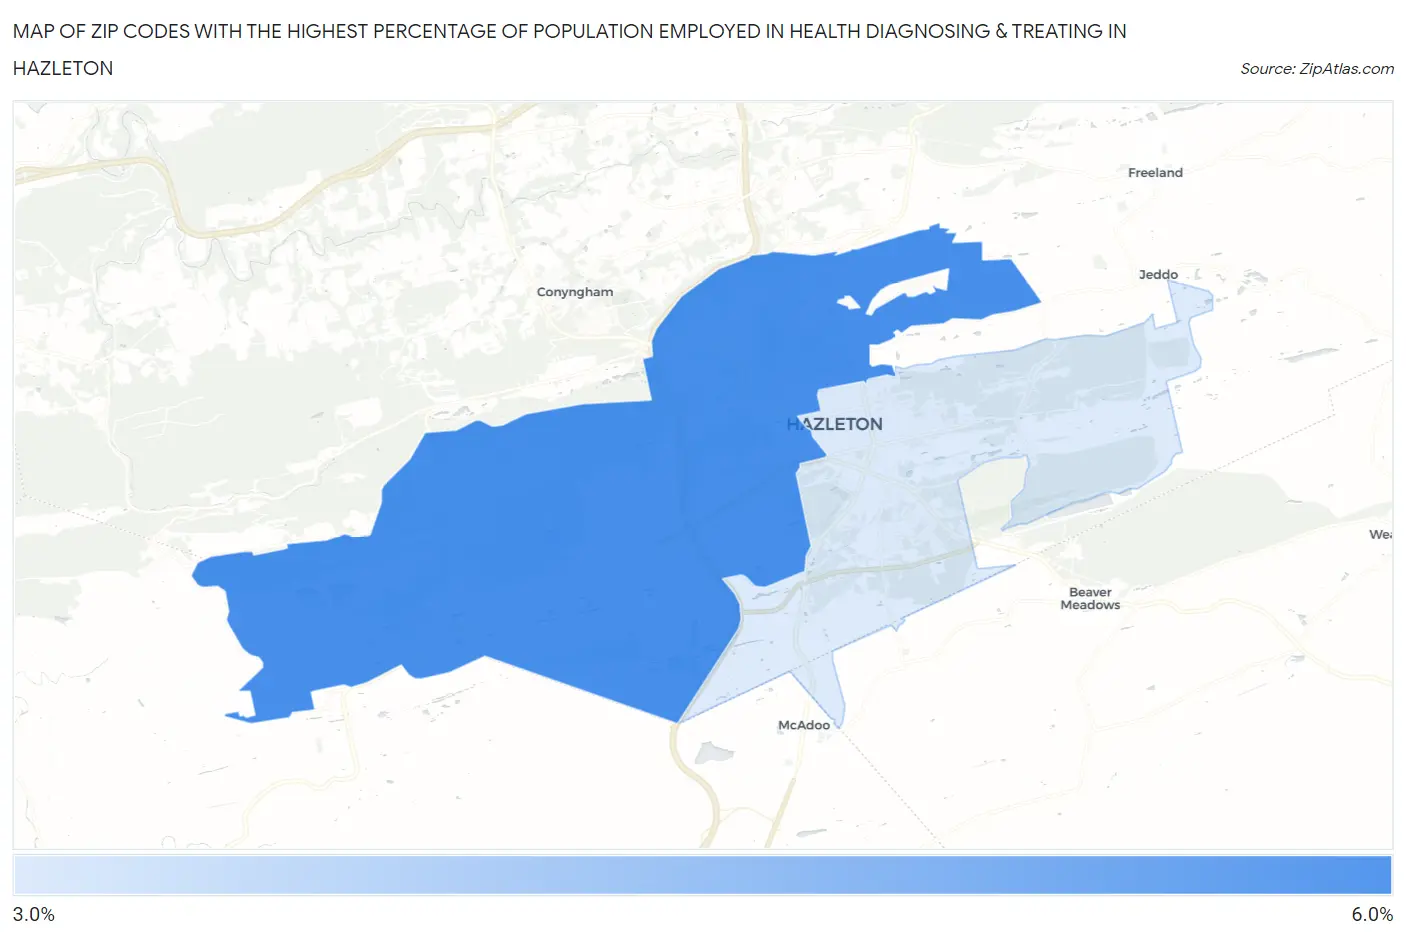
Map of Zip Codes with the Highest Percentage of Population Employed in Health Diagnosing & Treating in Hazleton
0.0%
6.0%
Zip Codes with the Highest Percentage of Population Employed in Health Diagnosing & Treating in Hazleton, PA
| Zip Code | % Employed | vs State | vs National | |
| 1. | 18202 | 5.2% | 7.4%(-2.20)#1,135 | 6.2%(-1.09)#17,119 |
| 2. | 18201 | 3.1% | 7.4%(-4.28)#1,423 | 6.2%(-3.17)#24,142 |
1
Common Questions
What are the Top Zip Codes with the Highest Percentage of Population Employed in Health Diagnosing & Treating in Hazleton, PA?
Top Zip Codes with the Highest Percentage of Population Employed in Health Diagnosing & Treating in Hazleton, PA are:
What zip code has the Highest Percentage of Population Employed in Health Diagnosing & Treating in Hazleton, PA?
18202 has the Highest Percentage of Population Employed in Health Diagnosing & Treating in Hazleton, PA with 5.2%.
What is the Percentage of Population Employed in Health Diagnosing & Treating in Hazleton, PA?
Percentage of Population Employed in Health Diagnosing & Treating in Hazleton is 2.3%.
What is the Percentage of Population Employed in Health Diagnosing & Treating in Pennsylvania?
Percentage of Population Employed in Health Diagnosing & Treating in Pennsylvania is 7.4%.
What is the Percentage of Population Employed in Health Diagnosing & Treating in the United States?
Percentage of Population Employed in Health Diagnosing & Treating in the United States is 6.2%.