Tunnelhill borough, PA
Tunnelhill borough Overview
250
TOTAL POPULATION
118
MALE POPULATION
132
FEMALE POPULATION
89.39
MALES / 100 FEMALES
111.86
FEMALES / 100 MALES
51.5
MEDIAN AGE
2.7
AVG FAMILY SIZE
2.0
AVG HOUSEHOLD SIZE
$28,797
PER CAPITA INCOME
$64,792
AVG FAMILY INCOME
$53,750
AVG HOUSEHOLD INCOME
25.1%
WAGE / INCOME GAP [ % ]
74.9¢/ $1
WAGE / INCOME GAP [ $ ]
$11,260
FAMILY INCOME DEFICIT
0.37
INEQUALITY / GINI INDEX
128
LABOR FORCE [ PEOPLE ]
55.7%
PERCENT IN LABOR FORCE
9.4%
UNEMPLOYMENT RATE
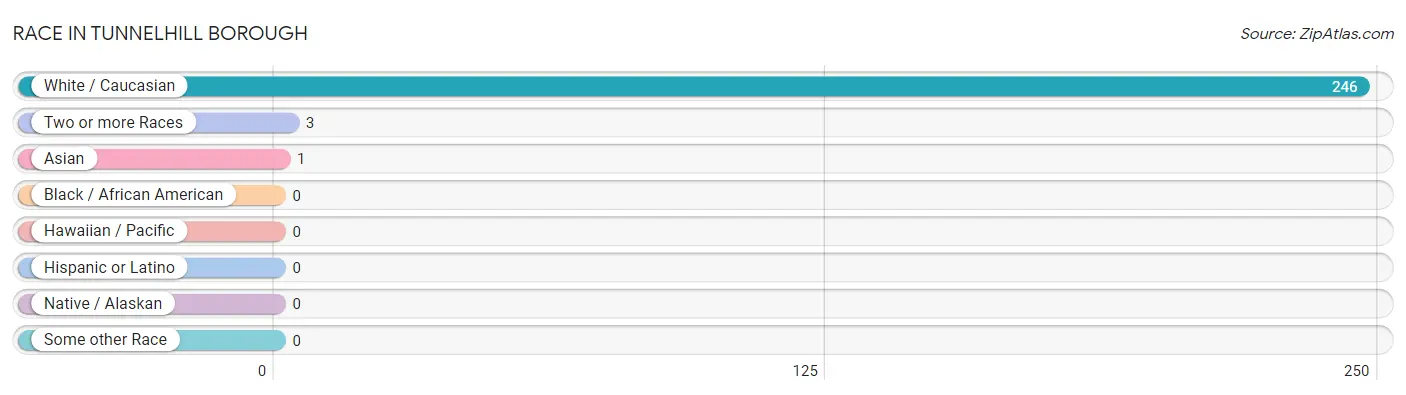
Race in Tunnelhill borough
The most populous races in Tunnelhill borough are White / Caucasian (246 | 98.4%), Two or more Races (3 | 1.2%), and Asian (1 | 0.4%).
| Race | # Population | % Population |
| Asian | 1 | 0.4% |
| Black / African American | 0 | 0.0% |
| Hawaiian / Pacific | 0 | 0.0% |
| Hispanic or Latino | 0 | 0.0% |
| Native / Alaskan | 0 | 0.0% |
| White / Caucasian | 246 | 98.4% |
| Two or more Races | 3 | 1.2% |
| Some other Race | 0 | 0.0% |
| Total | 250 | 100.0% |
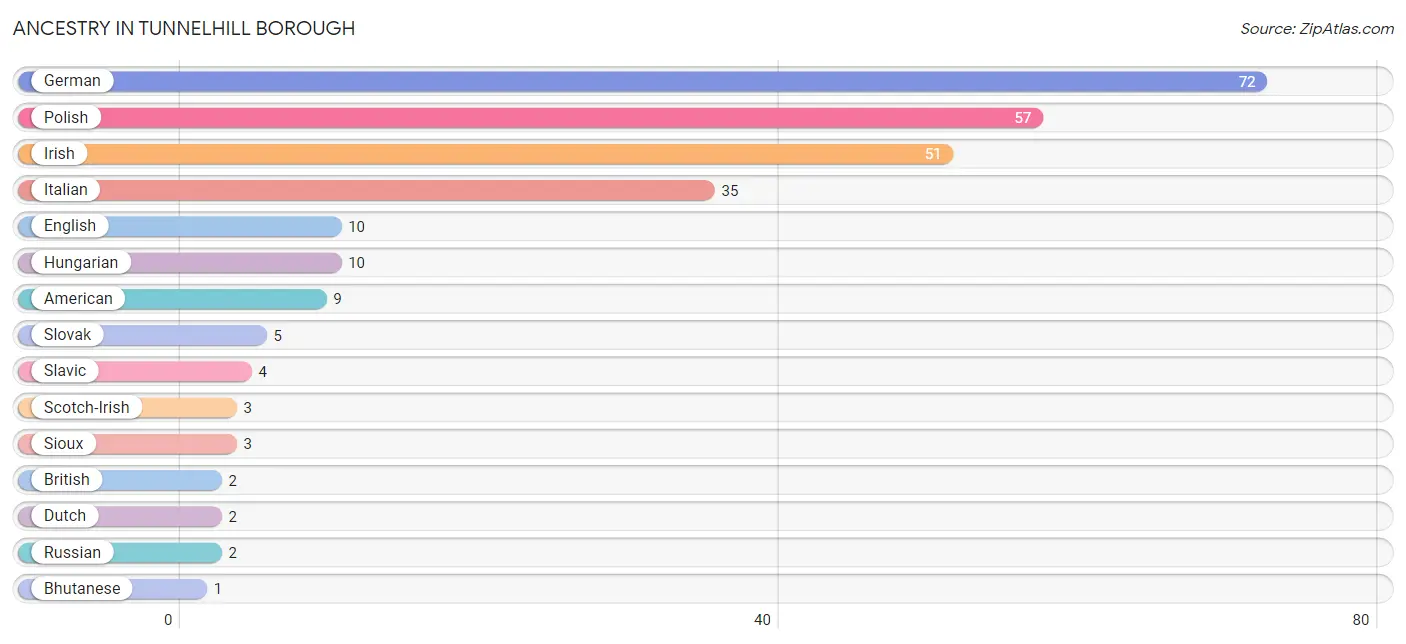
Ancestry in Tunnelhill borough
The most populous ancestries reported in Tunnelhill borough are German (72 | 28.8%), Polish (57 | 22.8%), Irish (51 | 20.4%), Italian (35 | 14.0%), and English (10 | 4.0%), together accounting for 90.0% of all Tunnelhill borough residents.
| Ancestry | # Population | % Population |
| American | 9 | 3.6% |
| Bhutanese | 1 | 0.4% |
| British | 2 | 0.8% |
| Czech | 1 | 0.4% |
| Dutch | 2 | 0.8% |
| Eastern European | 1 | 0.4% |
| English | 10 | 4.0% |
| German | 72 | 28.8% |
| Hungarian | 10 | 4.0% |
| Irish | 51 | 20.4% |
| Italian | 35 | 14.0% |
| Polish | 57 | 22.8% |
| Romanian | 1 | 0.4% |
| Russian | 2 | 0.8% |
| Scotch-Irish | 3 | 1.2% |
| Scottish | 1 | 0.4% |
| Sioux | 3 | 1.2% |
| Slavic | 4 | 1.6% |
| Slovak | 5 | 2.0% |
| Swiss | 1 | 0.4% |
| Ukrainian | 1 | 0.4% | View All 21 Rows |
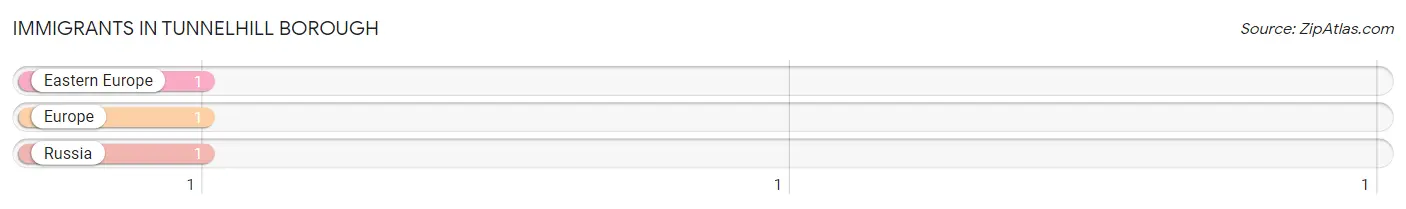
Immigrants in Tunnelhill borough
The most numerous immigrant groups reported in Tunnelhill borough came from Eastern Europe (1 | 0.4%), Europe (1 | 0.4%), and Russia (1 | 0.4%), together accounting for 1.2% of all Tunnelhill borough residents.
| Immigration Origin | # Population | % Population |
| Eastern Europe | 1 | 0.4% |
| Europe | 1 | 0.4% |
| Russia | 1 | 0.4% | View All 3 Rows |
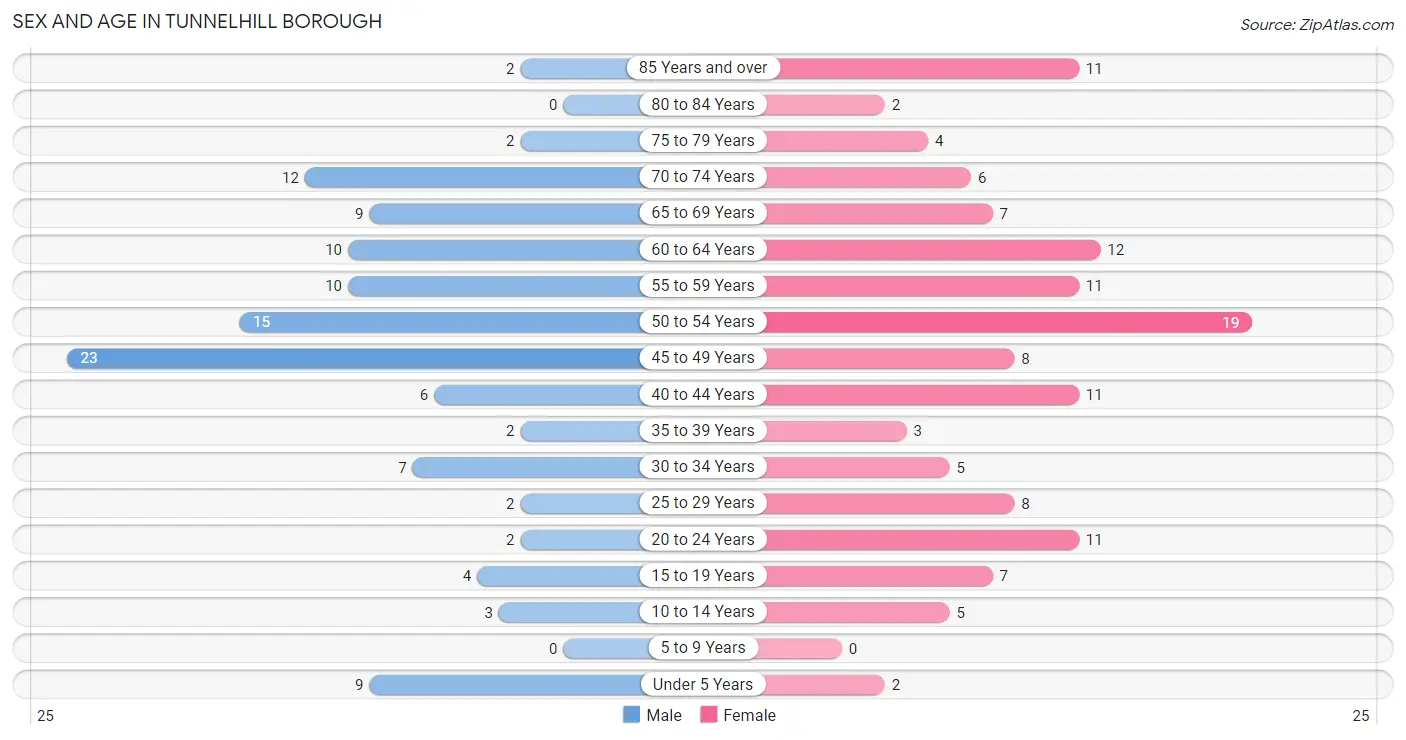
Sex and Age in Tunnelhill borough
Sex and Age in Tunnelhill borough
The most populous age groups in Tunnelhill borough are 45 to 49 Years (23 | 19.5%) for men and 50 to 54 Years (19 | 14.4%) for women.
| Age Bracket | Male | Female |
| Under 5 Years | 9 (7.6%) | 2 (1.5%) |
| 5 to 9 Years | 0 (0.0%) | 0 (0.0%) |
| 10 to 14 Years | 3 (2.5%) | 5 (3.8%) |
| 15 to 19 Years | 4 (3.4%) | 7 (5.3%) |
| 20 to 24 Years | 2 (1.7%) | 11 (8.3%) |
| 25 to 29 Years | 2 (1.7%) | 8 (6.1%) |
| 30 to 34 Years | 7 (5.9%) | 5 (3.8%) |
| 35 to 39 Years | 2 (1.7%) | 3 (2.3%) |
| 40 to 44 Years | 6 (5.1%) | 11 (8.3%) |
| 45 to 49 Years | 23 (19.5%) | 8 (6.1%) |
| 50 to 54 Years | 15 (12.7%) | 19 (14.4%) |
| 55 to 59 Years | 10 (8.5%) | 11 (8.3%) |
| 60 to 64 Years | 10 (8.5%) | 12 (9.1%) |
| 65 to 69 Years | 9 (7.6%) | 7 (5.3%) |
| 70 to 74 Years | 12 (10.2%) | 6 (4.5%) |
| 75 to 79 Years | 2 (1.7%) | 4 (3.0%) |
| 80 to 84 Years | 0 (0.0%) | 2 (1.5%) |
| 85 Years and over | 2 (1.7%) | 11 (8.3%) |
| Total | 118 (100.0%) | 132 (100.0%) |
Families and Households in Tunnelhill borough
Median Family Size in Tunnelhill borough
The median family size in Tunnelhill borough is 2.72 persons per family, with single male/father families (1 | 1.5%) accounting for the largest median family size of 3 persons per family. On the other hand, single female/mother families (6 | 9.2%) represent the smallest median family size with 2.67 persons per family.
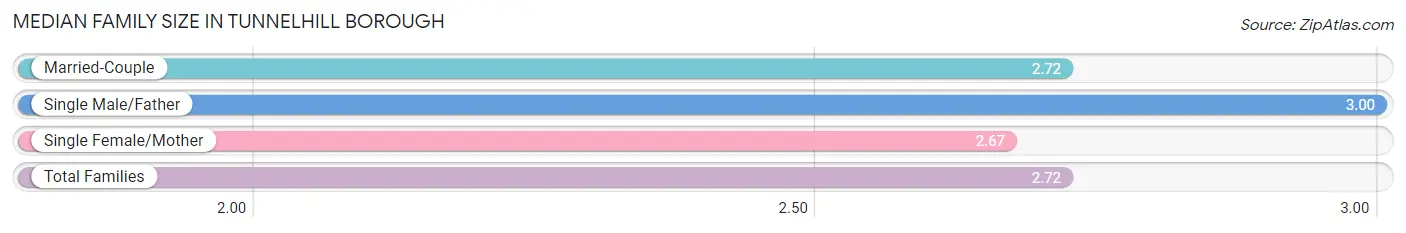
| Family Type | # Families | Family Size |
| Married-Couple | 58 (89.2%) | 2.72 |
| Single Male/Father | 1 (1.5%) | 3.00 |
| Single Female/Mother | 6 (9.2%) | 2.67 |
| Total Families | 65 (100.0%) | 2.72 |
Median Household Size in Tunnelhill borough
The median household size in Tunnelhill borough is 2.04 persons per household, with single male/father households (1 | 0.8%) accounting for the largest median household size of 3 persons per household. non-family households (55 | 45.8%) represent the smallest median household size with 1.24 persons per household.
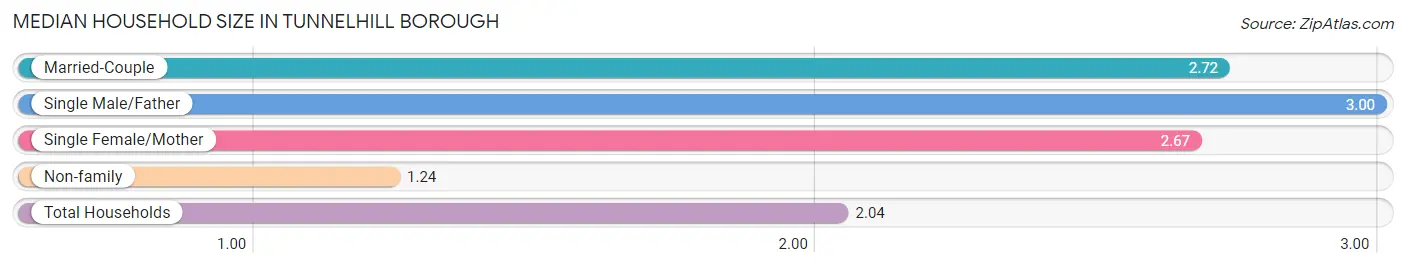
| Household Type | # Households | Household Size |
| Married-Couple | 58 (48.3%) | 2.72 |
| Single Male/Father | 1 (0.8%) | 3.00 |
| Single Female/Mother | 6 (5.0%) | 2.67 |
| Non-family | 55 (45.8%) | 1.24 |
| Total Households | 120 (100.0%) | 2.04 |
Household Size by Marriage Status in Tunnelhill borough
Out of a total of 120 households in Tunnelhill borough, 65 (54.2%) are family households, while 55 (45.8%) are nonfamily households. The most numerous type of family households are 2-person households, comprising 33, and the most common type of nonfamily households are 1-person households, comprising 44.
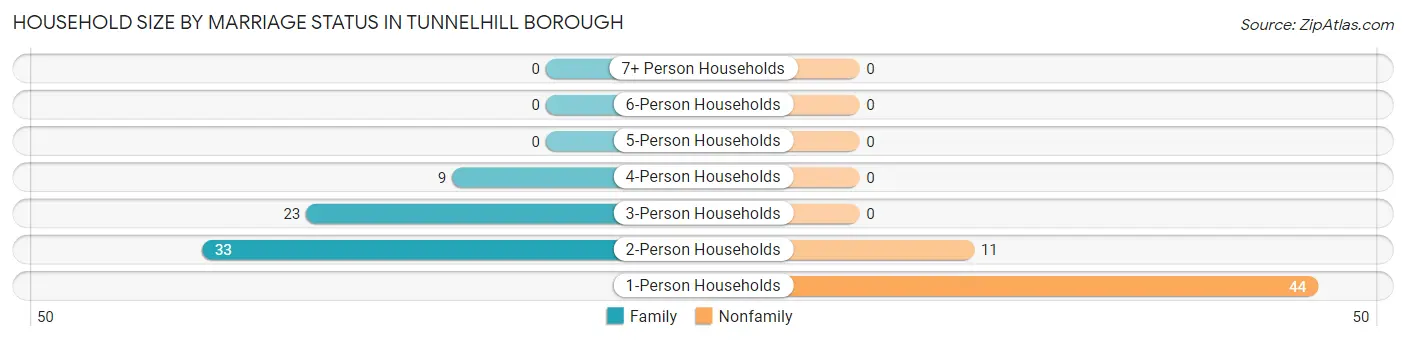
| Household Size | Family Households | Nonfamily Households |
| 1-Person Households | - | 44 (36.7%) |
| 2-Person Households | 33 (27.5%) | 11 (9.2%) |
| 3-Person Households | 23 (19.2%) | 0 (0.0%) |
| 4-Person Households | 9 (7.5%) | 0 (0.0%) |
| 5-Person Households | 0 (0.0%) | 0 (0.0%) |
| 6-Person Households | 0 (0.0%) | 0 (0.0%) |
| 7+ Person Households | 0 (0.0%) | 0 (0.0%) |
| Total | 65 (54.2%) | 55 (45.8%) |
Female Fertility in Tunnelhill borough
Fertility by Age in Tunnelhill borough
Average fertility rate in Tunnelhill borough is 37.0 births per 1,000 women. Women in the age bracket of 20 to 34 years have the highest fertility rate with 83.0 births per 1,000 women. Women in the age bracket of 20 to 34 years acount for 100.0% of all women with births.
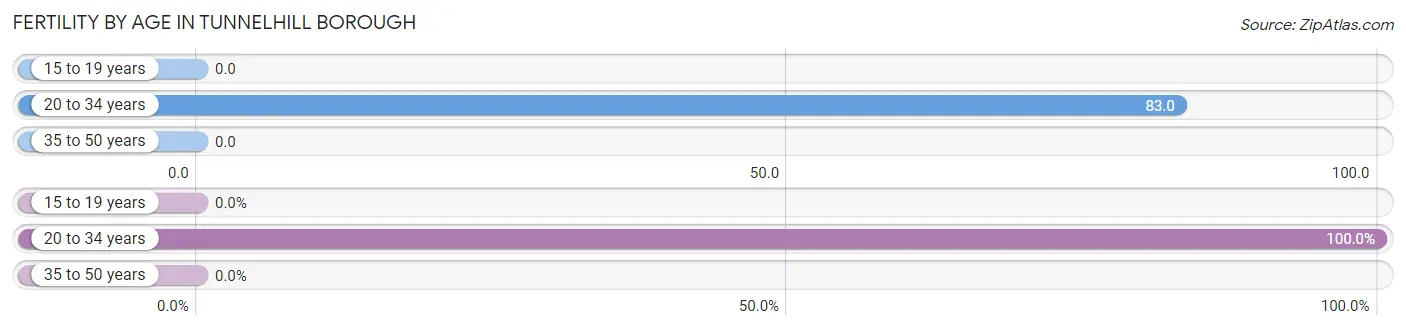
| Age Bracket | Women with Births | Births / 1,000 Women |
| 15 to 19 years | 0 (0.0%) | 0.0 |
| 20 to 34 years | 2 (100.0%) | 83.0 |
| 35 to 50 years | 0 (0.0%) | 0.0 |
| Total | 2 (100.0%) | 37.0 |
Fertility by Age by Marriage Status in Tunnelhill borough
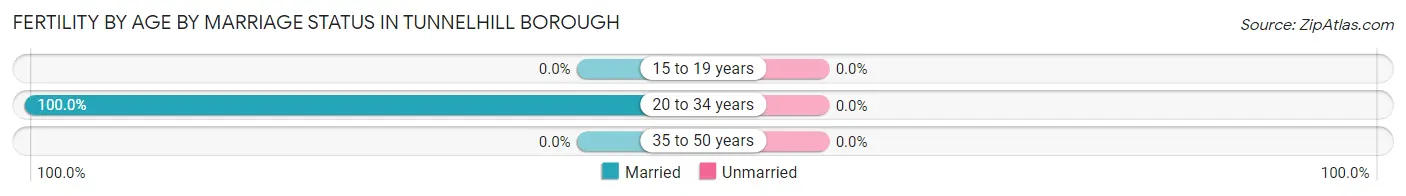
| Age Bracket | Married | Unmarried |
| 15 to 19 years | 0 (0.0%) | 0 (0.0%) |
| 20 to 34 years | 2 (100.0%) | 0 (0.0%) |
| 35 to 50 years | 0 (0.0%) | 0 (0.0%) |
| Total | 2 (100.0%) | 0 (0.0%) |
Fertility by Education in Tunnelhill borough
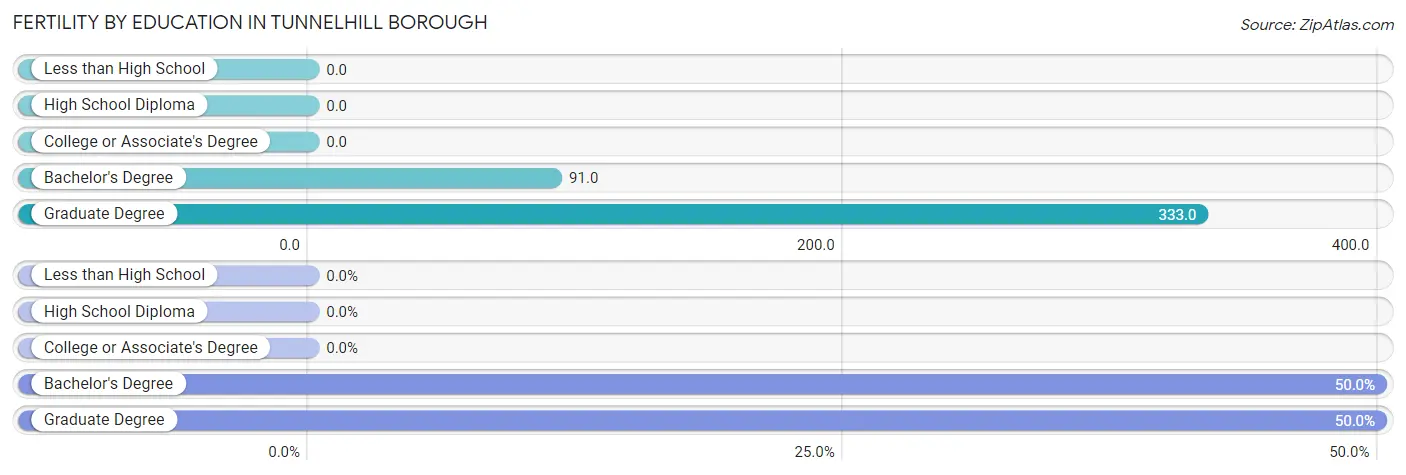
| Educational Attainment | Women with Births | Births / 1,000 Women |
| Less than High School | 0 (0.0%) | 0.0 |
| High School Diploma | 0 (0.0%) | 0.0 |
| College or Associate's Degree | 0 (0.0%) | 0.0 |
| Bachelor's Degree | 1 (50.0%) | 91.0 |
| Graduate Degree | 1 (50.0%) | 333.0 |
| Total | 2 (100.0%) | 37.0 |
Fertility by Education by Marriage Status in Tunnelhill borough
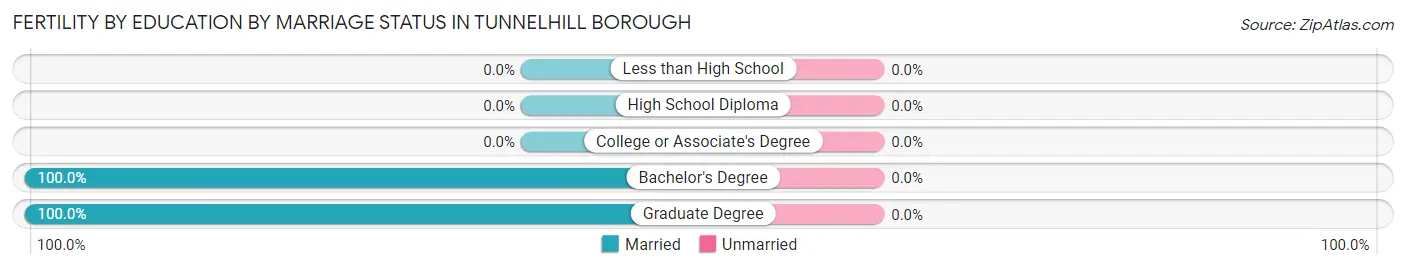
| Educational Attainment | Married | Unmarried |
| Less than High School | 0 (0.0%) | 0 (0.0%) |
| High School Diploma | 0 (0.0%) | 0 (0.0%) |
| College or Associate's Degree | 0 (0.0%) | 0 (0.0%) |
| Bachelor's Degree | 1 (100.0%) | 0 (0.0%) |
| Graduate Degree | 1 (100.0%) | 0 (0.0%) |
| Total | 2 (100.0%) | 0 (0.0%) |
Income in Tunnelhill borough
Income Overview in Tunnelhill borough
Per Capita Income in Tunnelhill borough is $28,797, while median incomes of families and households are $64,792 and $53,750 respectively.
| Characteristic | Number | Measure |
| Per Capita Income | 250 | $28,797 |
| Median Family Income | 65 | $64,792 |
| Mean Family Income | 65 | $68,838 |
| Median Household Income | 120 | $53,750 |
| Mean Household Income | 120 | $59,119 |
| Income Deficit | 65 | $11,260 |
| Wage / Income Gap (%) | 250 | 25.11% |
| Wage / Income Gap ($) | 250 | 74.89¢ per $1 |
| Gini / Inequality Index | 250 | 0.37 |
Earnings by Sex in Tunnelhill borough
Average Earnings in Tunnelhill borough are $37,266, $45,625 for men and $34,167 for women, a difference of 25.1%.
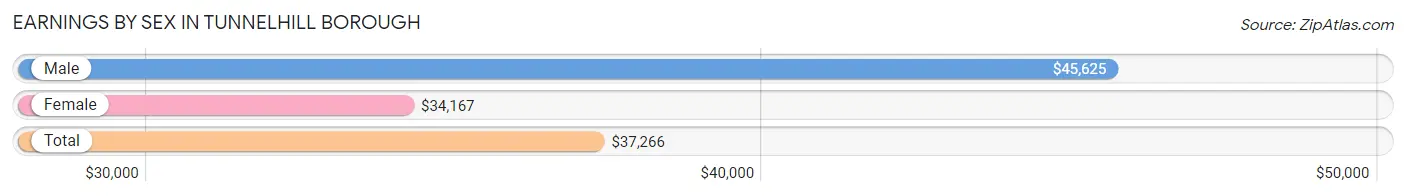
| Sex | Number | Average Earnings |
| Male | 59 (48.8%) | $45,625 |
| Female | 62 (51.2%) | $34,167 |
| Total | 121 (100.0%) | $37,266 |
Earnings by Sex by Income Bracket in Tunnelhill borough
The most common earnings brackets in Tunnelhill borough are $75,000 to $99,999 for men (12 | 20.3%) and $35,000 to $39,999 for women (16 | 25.8%).
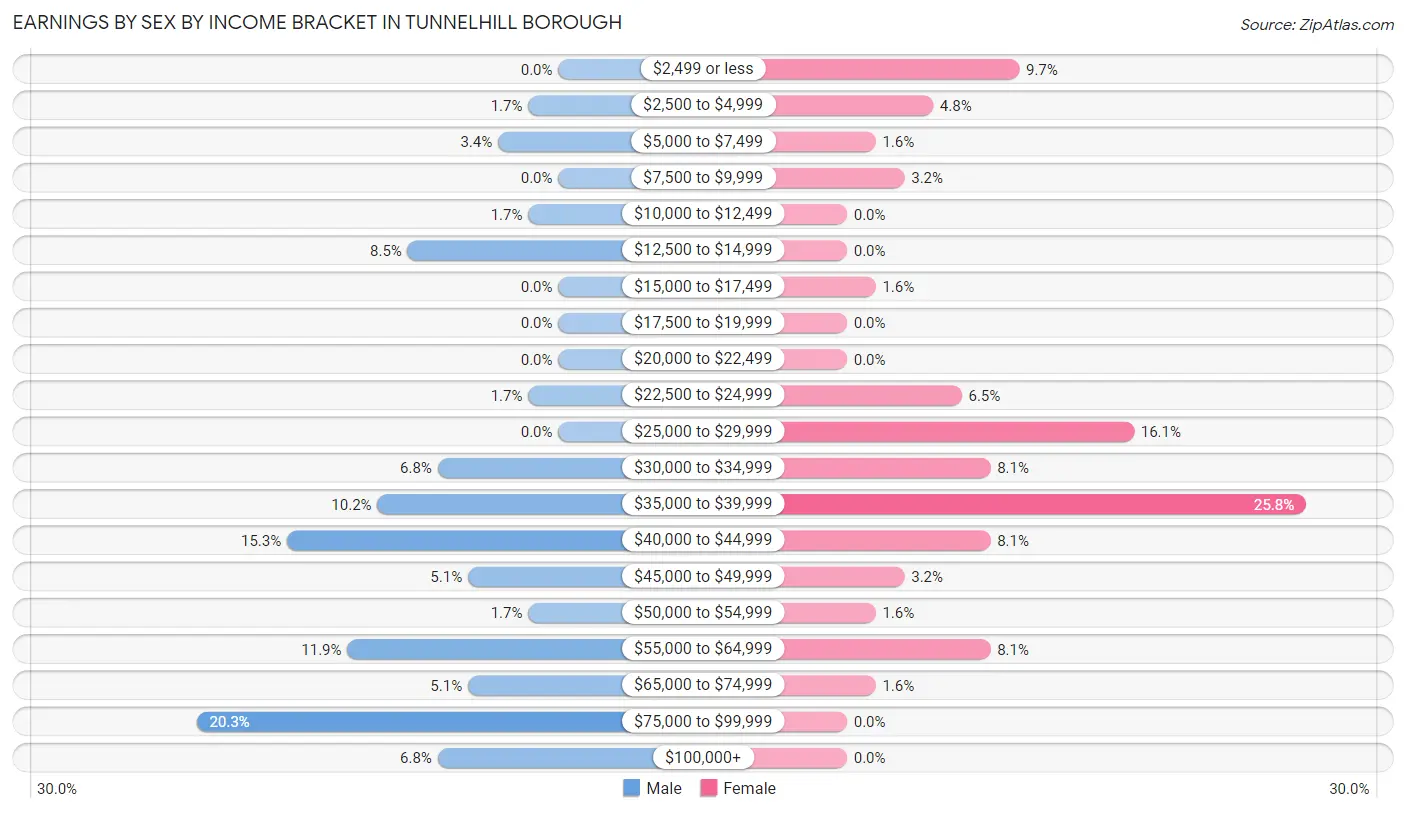
| Income | Male | Female |
| $2,499 or less | 0 (0.0%) | 6 (9.7%) |
| $2,500 to $4,999 | 1 (1.7%) | 3 (4.8%) |
| $5,000 to $7,499 | 2 (3.4%) | 1 (1.6%) |
| $7,500 to $9,999 | 0 (0.0%) | 2 (3.2%) |
| $10,000 to $12,499 | 1 (1.7%) | 0 (0.0%) |
| $12,500 to $14,999 | 5 (8.5%) | 0 (0.0%) |
| $15,000 to $17,499 | 0 (0.0%) | 1 (1.6%) |
| $17,500 to $19,999 | 0 (0.0%) | 0 (0.0%) |
| $20,000 to $22,499 | 0 (0.0%) | 0 (0.0%) |
| $22,500 to $24,999 | 1 (1.7%) | 4 (6.5%) |
| $25,000 to $29,999 | 0 (0.0%) | 10 (16.1%) |
| $30,000 to $34,999 | 4 (6.8%) | 5 (8.1%) |
| $35,000 to $39,999 | 6 (10.2%) | 16 (25.8%) |
| $40,000 to $44,999 | 9 (15.2%) | 5 (8.1%) |
| $45,000 to $49,999 | 3 (5.1%) | 2 (3.2%) |
| $50,000 to $54,999 | 1 (1.7%) | 1 (1.6%) |
| $55,000 to $64,999 | 7 (11.9%) | 5 (8.1%) |
| $65,000 to $74,999 | 3 (5.1%) | 1 (1.6%) |
| $75,000 to $99,999 | 12 (20.3%) | 0 (0.0%) |
| $100,000+ | 4 (6.8%) | 0 (0.0%) |
| Total | 59 (100.0%) | 62 (100.0%) |
Earnings by Sex by Educational Attainment in Tunnelhill borough
Average earnings in Tunnelhill borough are $44,375 for men and $35,417 for women, a difference of 20.2%. Men with an educational attainment of bachelor's degree enjoy the highest average annual earnings of $72,500, while those with high school diploma education earn the least with $43,125. Women with an educational attainment of graduate degree earn the most with the average annual earnings of $53,750, while those with high school diploma education have the smallest earnings of $28,750.
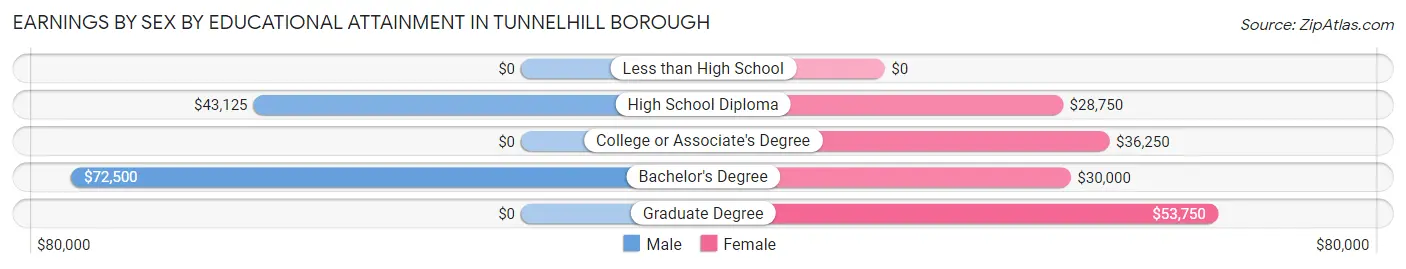
| Educational Attainment | Male Income | Female Income |
| Less than High School | - | - |
| High School Diploma | $43,125 | $28,750 |
| College or Associate's Degree | - | - |
| Bachelor's Degree | $72,500 | $30,000 |
| Graduate Degree | - | - |
| Total | $44,375 | $35,417 |
Family Income in Tunnelhill borough
Family Income Brackets in Tunnelhill borough
According to the Tunnelhill borough family income data, there are 20 families falling into the $50,000 to $74,999 income range, which is the most common income bracket and makes up 30.8% of all families.
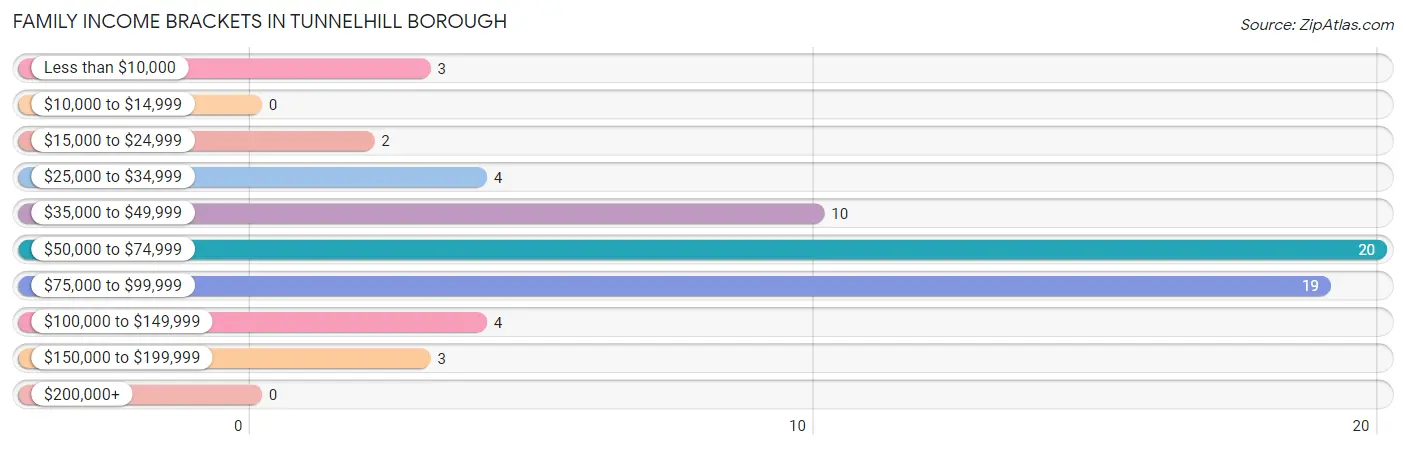
| Income Bracket | # Families | % Families |
| Less than $10,000 | 3 | 4.6% |
| $10,000 to $14,999 | 0 | 0.0% |
| $15,000 to $24,999 | 2 | 3.1% |
| $25,000 to $34,999 | 4 | 6.2% |
| $35,000 to $49,999 | 10 | 15.4% |
| $50,000 to $74,999 | 20 | 30.8% |
| $75,000 to $99,999 | 19 | 29.2% |
| $100,000 to $149,999 | 4 | 6.2% |
| $150,000 to $199,999 | 3 | 4.6% |
| $200,000+ | 0 | 0.0% |
Family Income by Famaliy Size in Tunnelhill borough
3-person families (23 | 35.4%) account for the highest median family income in Tunnelhill borough with $78,125 per family, while 3-person families (23 | 35.4%) have the highest median income of $26,042 per family member.
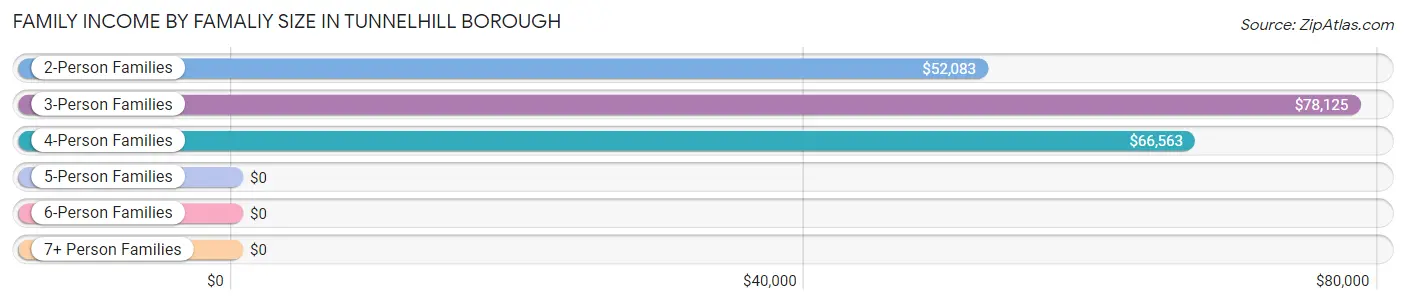
| Income Bracket | # Families | Median Income |
| 2-Person Families | 33 (50.8%) | $52,083 |
| 3-Person Families | 23 (35.4%) | $78,125 |
| 4-Person Families | 9 (13.9%) | $66,563 |
| 5-Person Families | 0 (0.0%) | $0 |
| 6-Person Families | 0 (0.0%) | $0 |
| 7+ Person Families | 0 (0.0%) | $0 |
| Total | 65 (100.0%) | $64,792 |
Family Income by Number of Earners in Tunnelhill borough
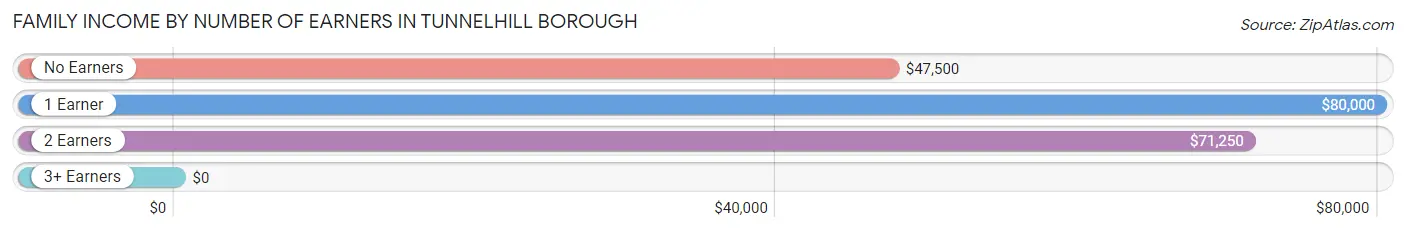
| Number of Earners | # Families | Median Income |
| No Earners | 20 (30.8%) | $47,500 |
| 1 Earner | 14 (21.5%) | $80,000 |
| 2 Earners | 27 (41.5%) | $71,250 |
| 3+ Earners | 4 (6.1%) | $0 |
| Total | 65 (100.0%) | $64,792 |
Household Income in Tunnelhill borough
Household Income Brackets in Tunnelhill borough
With 25 households falling in the category, the $50,000 to $74,999 income range is the most frequent in Tunnelhill borough, accounting for 20.8% of all households.
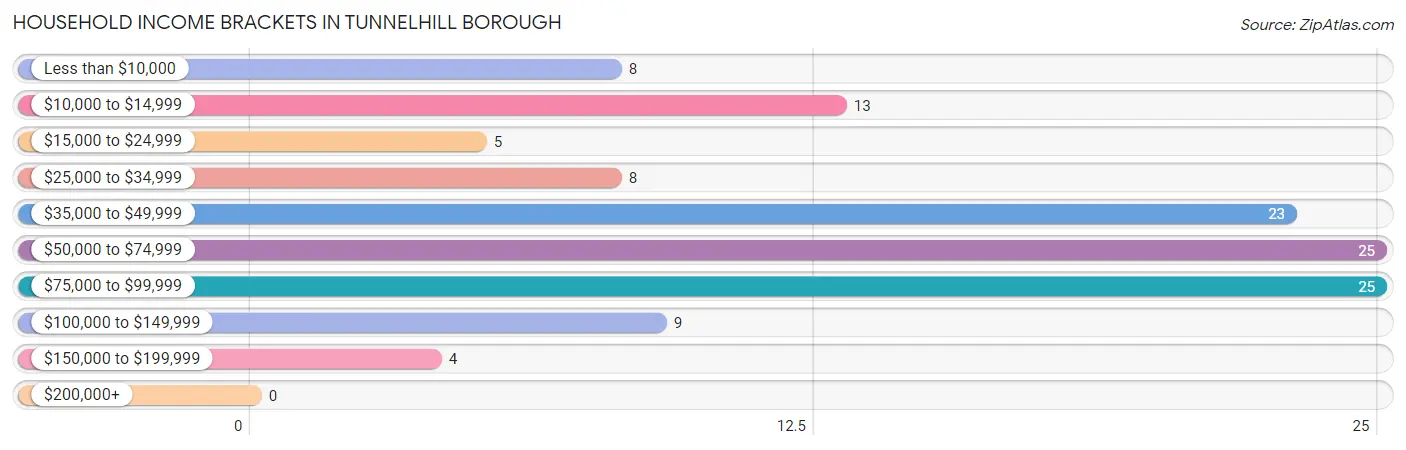
| Income Bracket | # Households | % Households |
| Less than $10,000 | 8 | 6.7% |
| $10,000 to $14,999 | 13 | 10.8% |
| $15,000 to $24,999 | 5 | 4.2% |
| $25,000 to $34,999 | 8 | 6.7% |
| $35,000 to $49,999 | 23 | 19.2% |
| $50,000 to $74,999 | 25 | 20.8% |
| $75,000 to $99,999 | 25 | 20.8% |
| $100,000 to $149,999 | 9 | 7.5% |
| $150,000 to $199,999 | 4 | 3.3% |
| $200,000+ | 0 | 0.0% |
Household Income by Householder Age in Tunnelhill borough
The median household income in Tunnelhill borough is $53,750, with the highest median household income of $63,500 found in the 25 to 44 years age bracket for the primary householder. A total of 22 households (18.3%) fall into this category. Meanwhile, the 15 to 24 years age bracket for the primary householder has the lowest median household income of $0, with 3 households (2.5%) in this group.
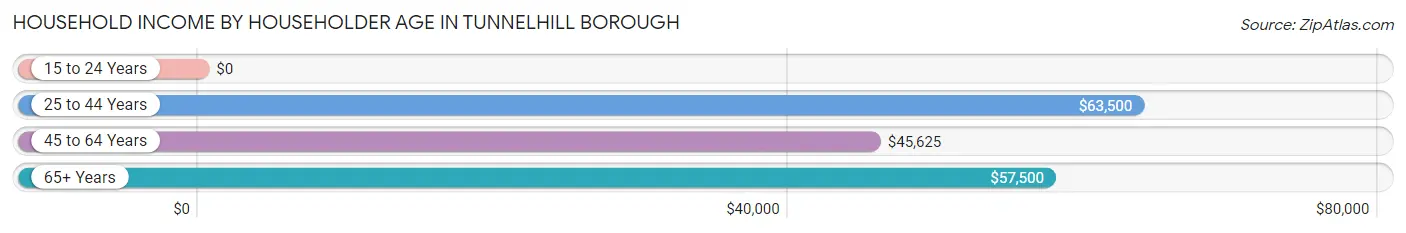
| Income Bracket | # Households | Median Income |
| 15 to 24 Years | 3 (2.5%) | $0 |
| 25 to 44 Years | 22 (18.3%) | $63,500 |
| 45 to 64 Years | 65 (54.2%) | $45,625 |
| 65+ Years | 30 (25.0%) | $57,500 |
| Total | 120 (100.0%) | $53,750 |
Poverty in Tunnelhill borough
Income Below Poverty by Sex and Age in Tunnelhill borough
With 14.4% poverty level for males and 15.3% for females among the residents of Tunnelhill borough, 35 to 44 year old males and 75 year old and over females are the most vulnerable to poverty, with 4 males (50.0%) and 7 females (41.2%) in their respective age groups living below the poverty level.
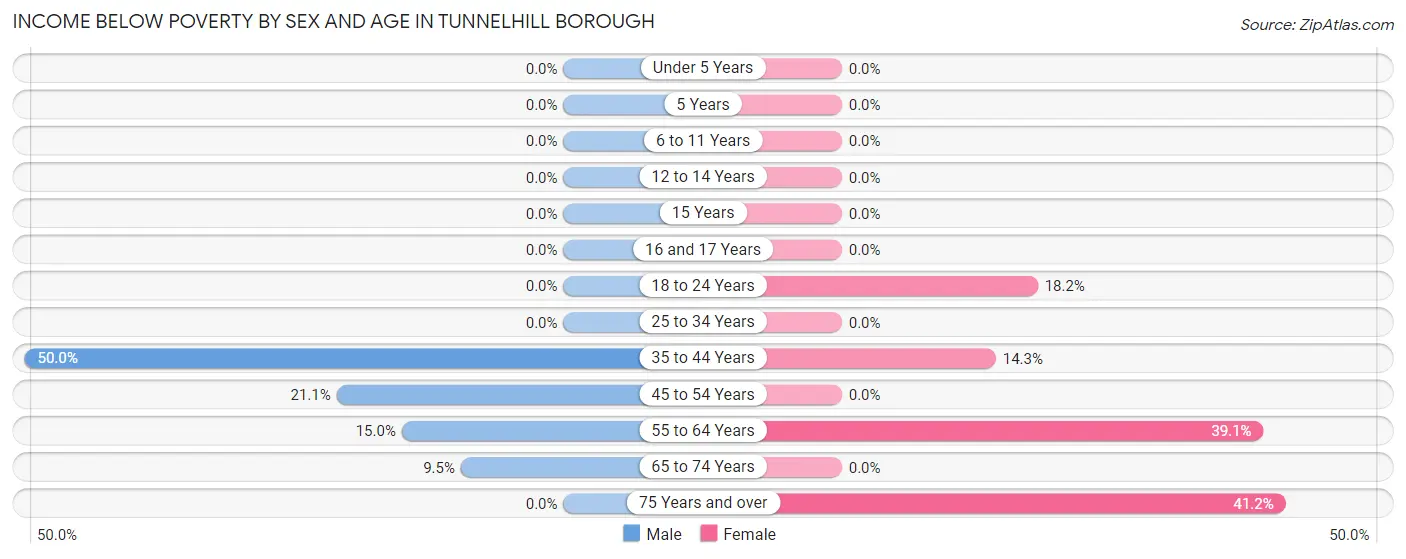
| Age Bracket | Male | Female |
| Under 5 Years | 0 (0.0%) | 0 (0.0%) |
| 5 Years | 0 (0.0%) | 0 (0.0%) |
| 6 to 11 Years | 0 (0.0%) | 0 (0.0%) |
| 12 to 14 Years | 0 (0.0%) | 0 (0.0%) |
| 15 Years | 0 (0.0%) | 0 (0.0%) |
| 16 and 17 Years | 0 (0.0%) | 0 (0.0%) |
| 18 to 24 Years | 0 (0.0%) | 2 (18.2%) |
| 25 to 34 Years | 0 (0.0%) | 0 (0.0%) |
| 35 to 44 Years | 4 (50.0%) | 2 (14.3%) |
| 45 to 54 Years | 8 (21.0%) | 0 (0.0%) |
| 55 to 64 Years | 3 (15.0%) | 9 (39.1%) |
| 65 to 74 Years | 2 (9.5%) | 0 (0.0%) |
| 75 Years and over | 0 (0.0%) | 7 (41.2%) |
| Total | 17 (14.4%) | 20 (15.3%) |
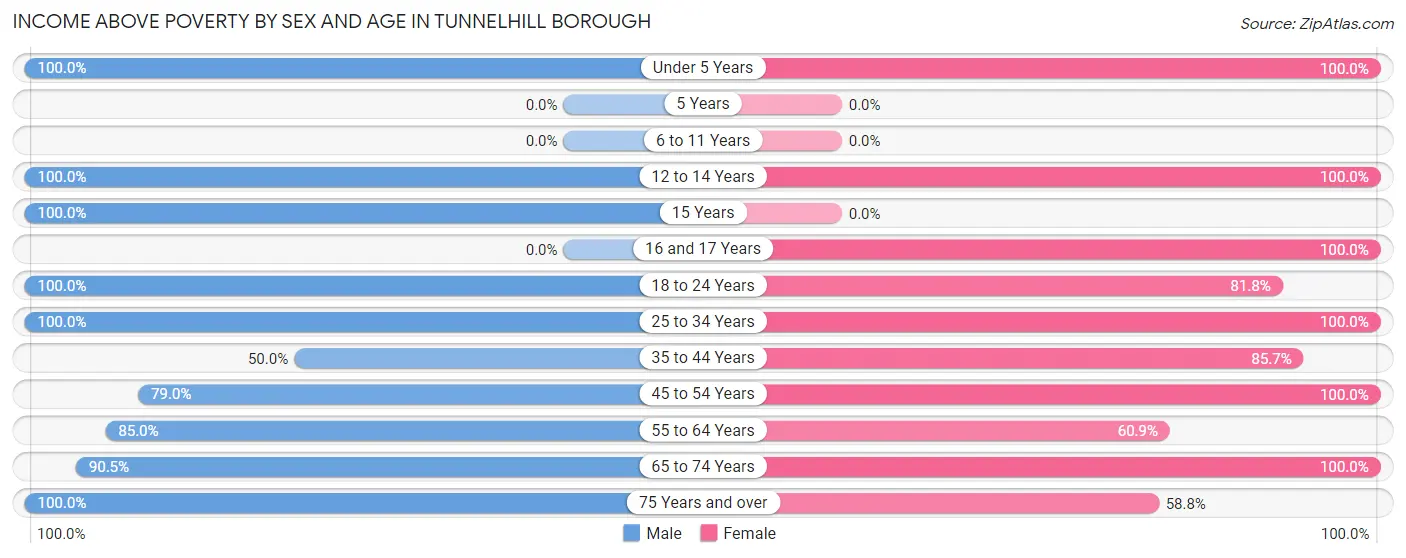
Income Above Poverty by Sex and Age in Tunnelhill borough
According to the poverty statistics in Tunnelhill borough, males aged under 5 years and females aged under 5 years are the age groups that are most secure financially, with 100.0% of males and 100.0% of females in these age groups living above the poverty line.
| Age Bracket | Male | Female |
| Under 5 Years | 9 (100.0%) | 1 (100.0%) |
| 5 Years | 0 (0.0%) | 0 (0.0%) |
| 6 to 11 Years | 0 (0.0%) | 0 (0.0%) |
| 12 to 14 Years | 3 (100.0%) | 5 (100.0%) |
| 15 Years | 1 (100.0%) | 0 (0.0%) |
| 16 and 17 Years | 0 (0.0%) | 7 (100.0%) |
| 18 to 24 Years | 5 (100.0%) | 9 (81.8%) |
| 25 to 34 Years | 9 (100.0%) | 13 (100.0%) |
| 35 to 44 Years | 4 (50.0%) | 12 (85.7%) |
| 45 to 54 Years | 30 (78.9%) | 27 (100.0%) |
| 55 to 64 Years | 17 (85.0%) | 14 (60.9%) |
| 65 to 74 Years | 19 (90.5%) | 13 (100.0%) |
| 75 Years and over | 4 (100.0%) | 10 (58.8%) |
| Total | 101 (85.6%) | 111 (84.7%) |
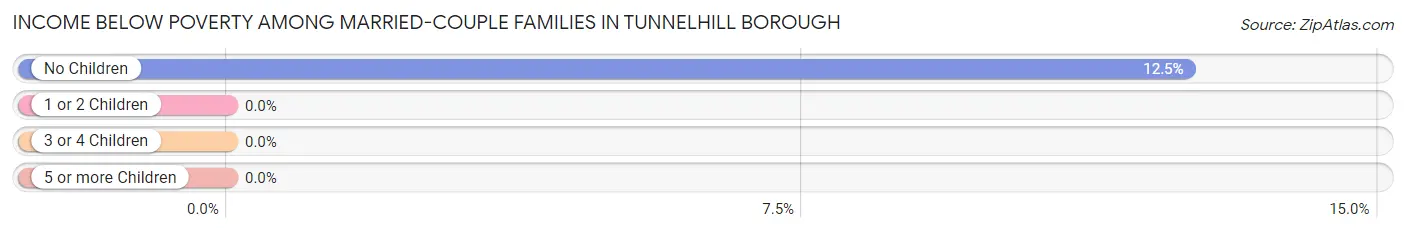
Income Below Poverty Among Married-Couple Families in Tunnelhill borough
The poverty statistics for married-couple families in Tunnelhill borough show that 8.6% or 5 of the total 58 families live below the poverty line. Families with no children have the highest poverty rate of 12.5%, comprising of 5 families. On the other hand, families with 1 or 2 children have the lowest poverty rate of 0.0%, which includes 0 families.
| Children | Above Poverty | Below Poverty |
| No Children | 35 (87.5%) | 5 (12.5%) |
| 1 or 2 Children | 18 (100.0%) | 0 (0.0%) |
| 3 or 4 Children | 0 (0.0%) | 0 (0.0%) |
| 5 or more Children | 0 (0.0%) | 0 (0.0%) |
| Total | 53 (91.4%) | 5 (8.6%) |
Income Below Poverty Among Single-Parent Households in Tunnelhill borough
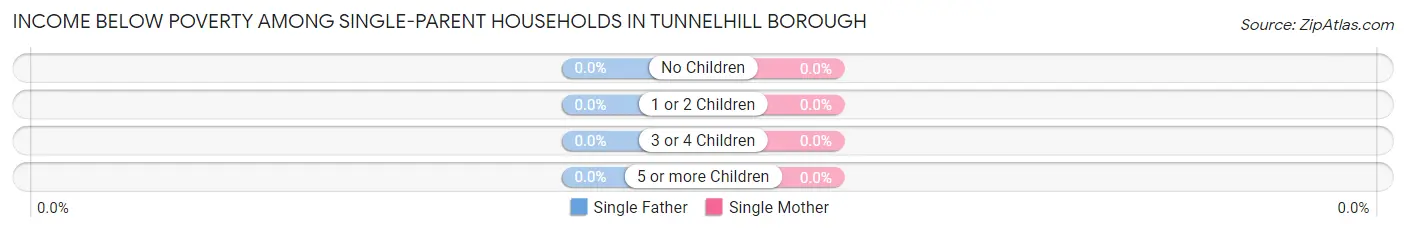
| Children | Single Father | Single Mother |
| No Children | 0 (0.0%) | 0 (0.0%) |
| 1 or 2 Children | 0 (0.0%) | 0 (0.0%) |
| 3 or 4 Children | 0 (0.0%) | 0 (0.0%) |
| 5 or more Children | 0 (0.0%) | 0 (0.0%) |
| Total | 0 (0.0%) | 0 (0.0%) |
Income Below Poverty Among Married-Couple vs Single-Parent Households in Tunnelhill borough
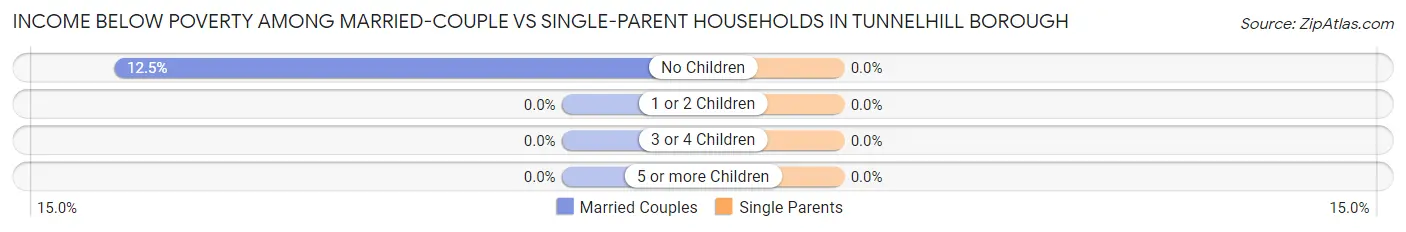
| Children | Married-Couple Families | Single-Parent Households |
| No Children | 5 (12.5%) | 0 (0.0%) |
| 1 or 2 Children | 0 (0.0%) | 0 (0.0%) |
| 3 or 4 Children | 0 (0.0%) | 0 (0.0%) |
| 5 or more Children | 0 (0.0%) | 0 (0.0%) |
| Total | 5 (8.6%) | 0 (0.0%) |
Employment Characteristics in Tunnelhill borough
Employment by Class of Employer in Tunnelhill borough
Among the 113 employed individuals in Tunnelhill borough, private company employees (72 | 63.7%), state government employees (16 | 14.2%), and not-for-profit organizations (15 | 13.3%) make up the most common classes of employment.
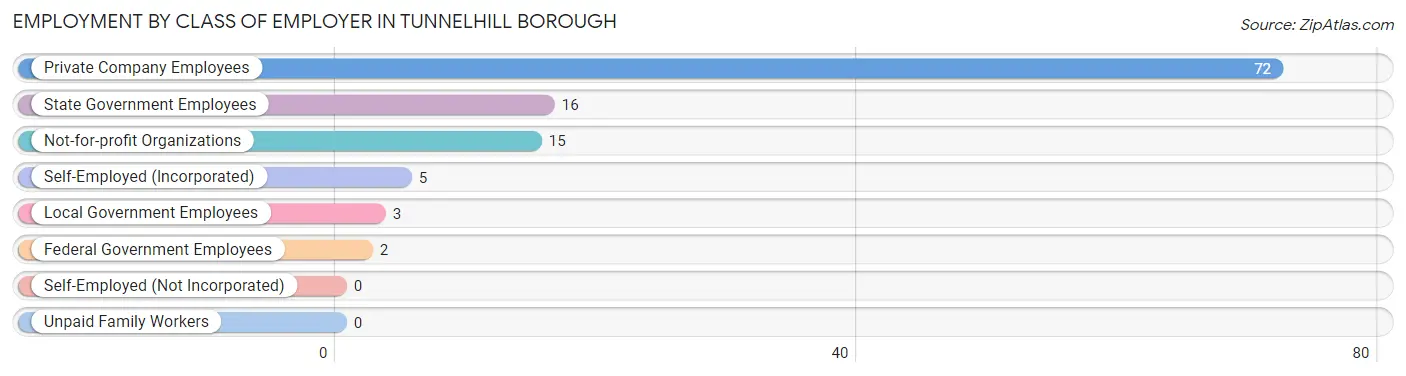
| Employer Class | # Employees | % Employees |
| Private Company Employees | 72 | 63.7% |
| Self-Employed (Incorporated) | 5 | 4.4% |
| Self-Employed (Not Incorporated) | 0 | 0.0% |
| Not-for-profit Organizations | 15 | 13.3% |
| Local Government Employees | 3 | 2.6% |
| State Government Employees | 16 | 14.2% |
| Federal Government Employees | 2 | 1.8% |
| Unpaid Family Workers | 0 | 0.0% |
| Total | 113 | 100.0% |
Employment Status by Age in Tunnelhill borough
According to the labor force statistics for Tunnelhill borough, out of the total population over 16 years of age (230), 55.7% or 128 individuals are in the labor force, with 9.4% or 12 of them unemployed. The age group with the highest labor force participation rate is 25 to 29 years, with 90.0% or 9 individuals in the labor force. Within the labor force, the 16 to 19 years age range has the highest percentage of unemployed individuals, with 100.0% or 1 of them being unemployed.
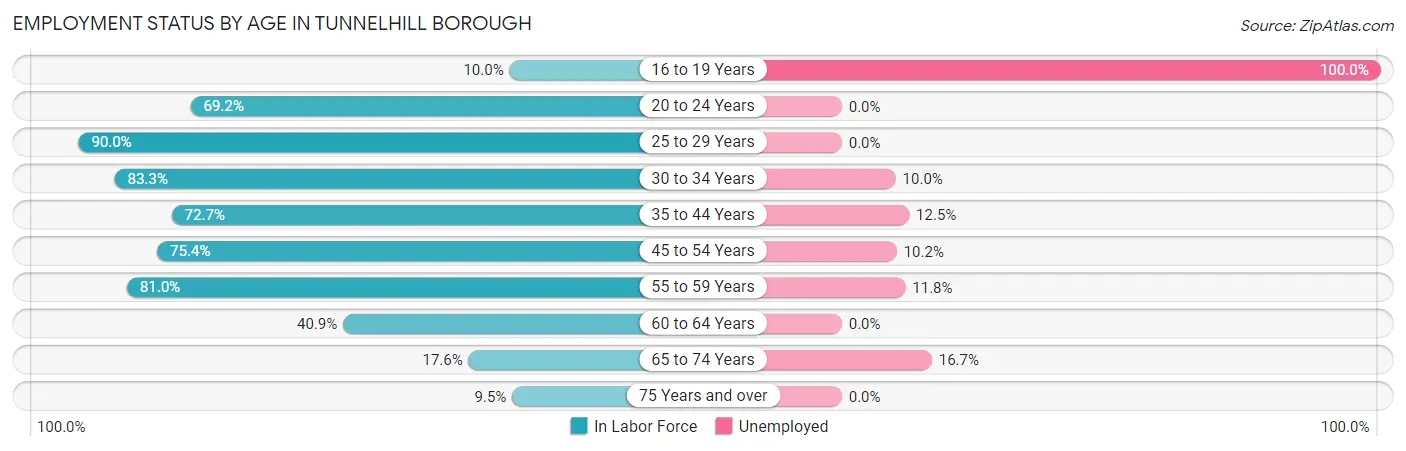
| Age Bracket | In Labor Force | Unemployed |
| 16 to 19 Years | 1 (10.0%) | 1 (100.0%) |
| 20 to 24 Years | 9 (69.2%) | 0 (0.0%) |
| 25 to 29 Years | 9 (90.0%) | 0 (0.0%) |
| 30 to 34 Years | 10 (83.3%) | 1 (10.0%) |
| 35 to 44 Years | 16 (72.7%) | 2 (12.5%) |
| 45 to 54 Years | 49 (75.4%) | 5 (10.2%) |
| 55 to 59 Years | 17 (81.0%) | 2 (11.8%) |
| 60 to 64 Years | 9 (40.9%) | 0 (0.0%) |
| 65 to 74 Years | 6 (17.6%) | 1 (16.7%) |
| 75 Years and over | 2 (9.5%) | 0 (0.0%) |
| Total | 128 (55.7%) | 12 (9.4%) |
Employment Status by Educational Attainment in Tunnelhill borough
According to labor force statistics for Tunnelhill borough, 72.4% of individuals (110) out of the total population between 25 and 64 years of age (152) are in the labor force, with 9.1% or 10 of them being unemployed. The group with the highest labor force participation rate are those with the educational attainment of bachelor's degree or higher, with 90.6% or 29 individuals in the labor force. Within the labor force, individuals with less than high school education have the highest percentage of unemployment, with 71.4% or 5 of them being unemployed.
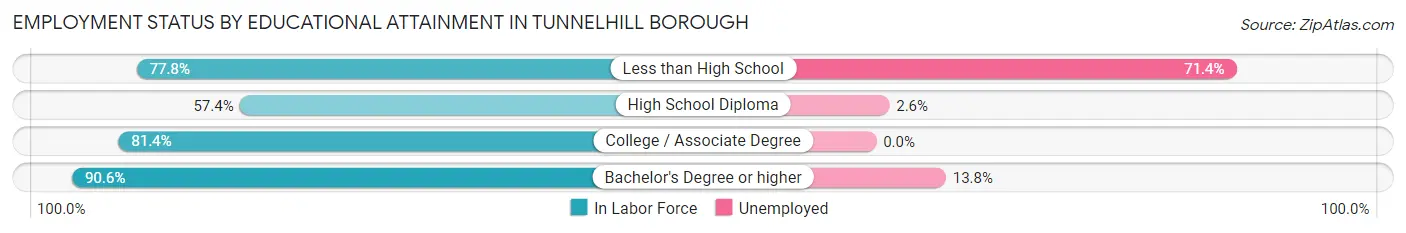
| Educational Attainment | In Labor Force | Unemployed |
| Less than High School | 7 (77.8%) | 6 (71.4%) |
| High School Diploma | 39 (57.4%) | 2 (2.6%) |
| College / Associate Degree | 35 (81.4%) | 0 (0.0%) |
| Bachelor's Degree or higher | 29 (90.6%) | 4 (13.8%) |
| Total | 110 (72.4%) | 14 (9.1%) |
Employment Occupations by Sex in Tunnelhill borough
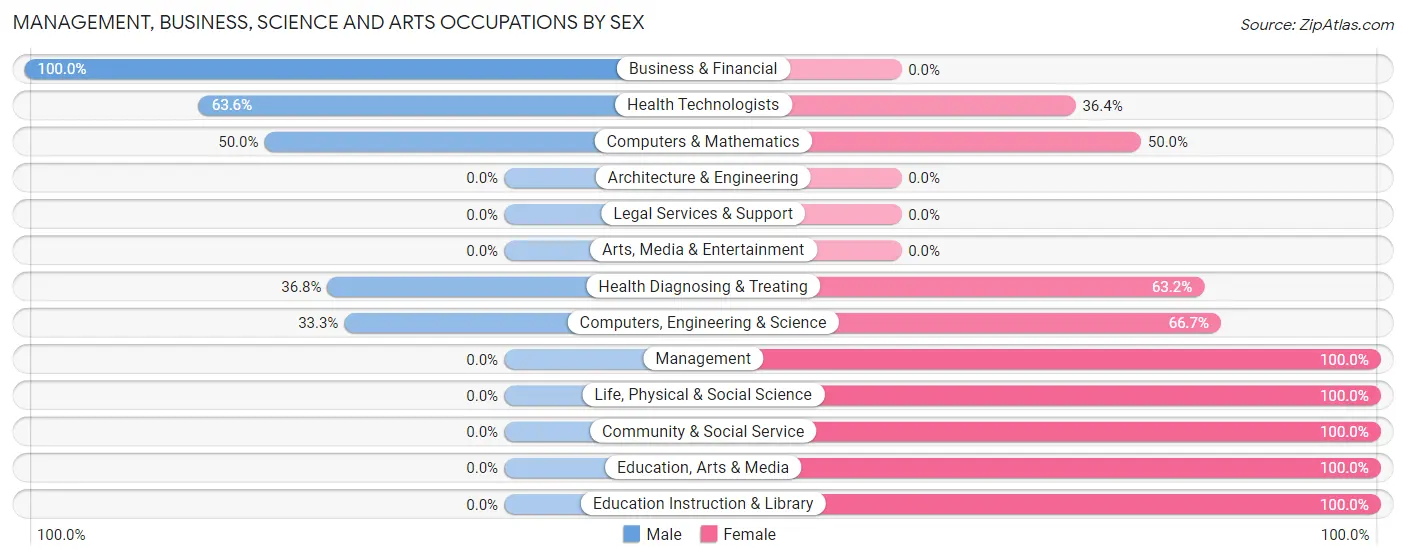
Management, Business, Science and Arts Occupations
The most common Management, Business, Science and Arts occupations in Tunnelhill borough are Health Diagnosing & Treating (19 | 16.4%), Health Technologists (11 | 9.5%), Community & Social Service (5 | 4.3%), Education, Arts & Media (4 | 3.5%), and Business & Financial (3 | 2.6%).
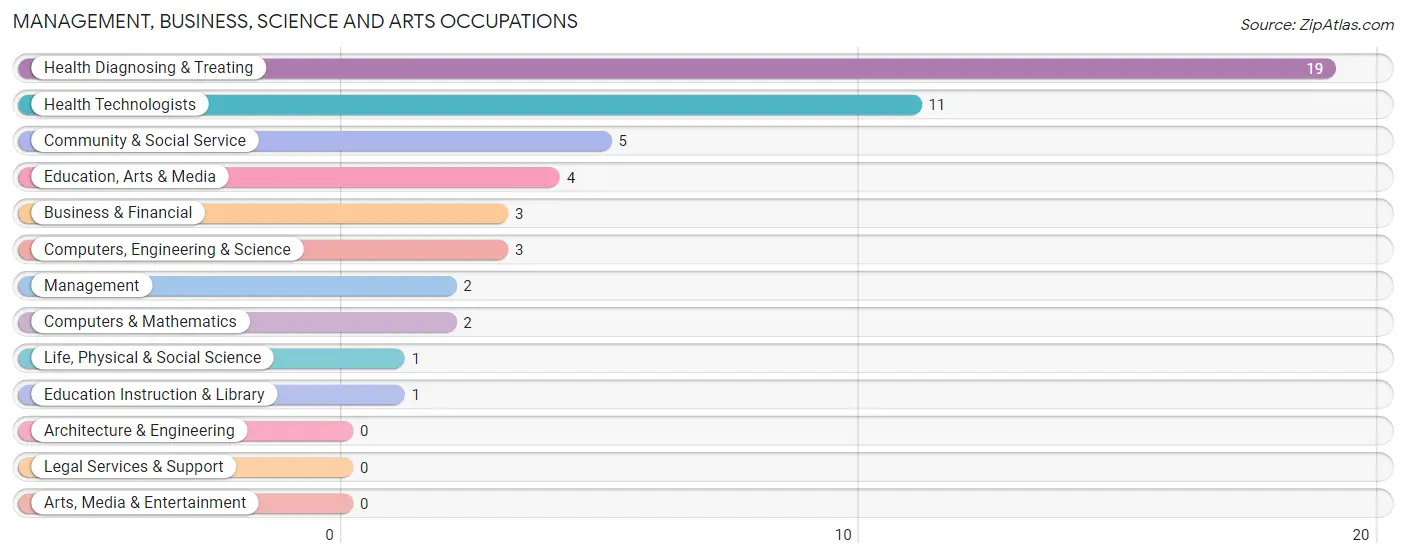
Management, Business, Science and Arts Occupations by Sex
Within the Management, Business, Science and Arts occupations in Tunnelhill borough, the most male-oriented occupations are Business & Financial (100.0%), Health Technologists (63.6%), and Computers & Mathematics (50.0%), while the most female-oriented occupations are Management (100.0%), Life, Physical & Social Science (100.0%), and Community & Social Service (100.0%).
| Occupation | Male | Female |
| Management | 0 (0.0%) | 2 (100.0%) |
| Business & Financial | 3 (100.0%) | 0 (0.0%) |
| Computers, Engineering & Science | 1 (33.3%) | 2 (66.7%) |
| Computers & Mathematics | 1 (50.0%) | 1 (50.0%) |
| Architecture & Engineering | 0 (0.0%) | 0 (0.0%) |
| Life, Physical & Social Science | 0 (0.0%) | 1 (100.0%) |
| Community & Social Service | 0 (0.0%) | 5 (100.0%) |
| Education, Arts & Media | 0 (0.0%) | 4 (100.0%) |
| Legal Services & Support | 0 (0.0%) | 0 (0.0%) |
| Education Instruction & Library | 0 (0.0%) | 1 (100.0%) |
| Arts, Media & Entertainment | 0 (0.0%) | 0 (0.0%) |
| Health Diagnosing & Treating | 7 (36.8%) | 12 (63.2%) |
| Health Technologists | 7 (63.6%) | 4 (36.4%) |
| Total (Category) | 11 (34.4%) | 21 (65.6%) |
| Total (Overall) | 57 (49.1%) | 59 (50.9%) |
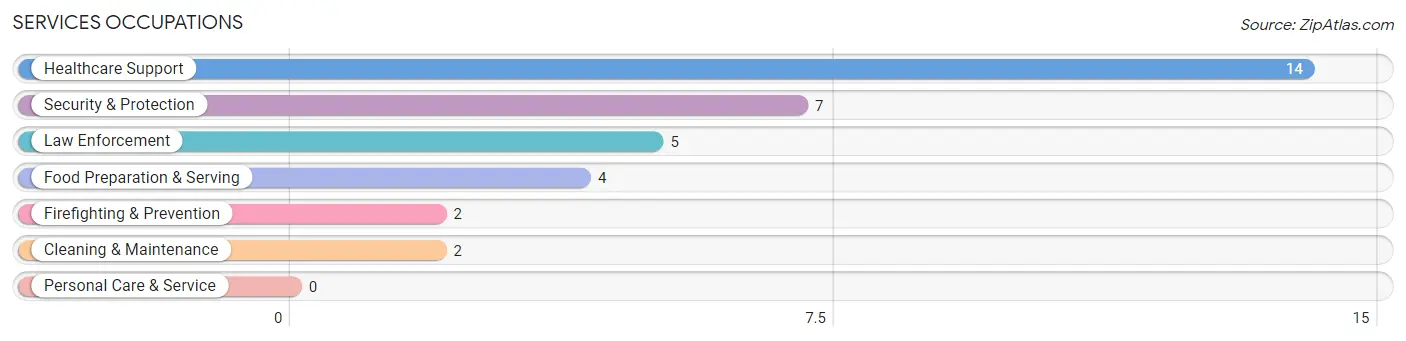
Services Occupations
The most common Services occupations in Tunnelhill borough are Healthcare Support (14 | 12.1%), Security & Protection (7 | 6.0%), Law Enforcement (5 | 4.3%), Food Preparation & Serving (4 | 3.5%), and Firefighting & Prevention (2 | 1.7%).
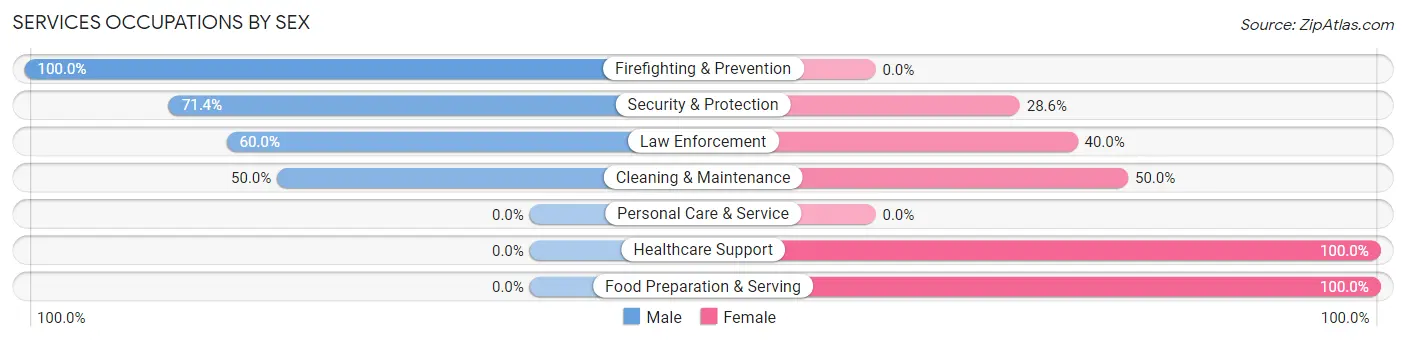
Services Occupations by Sex
Within the Services occupations in Tunnelhill borough, the most male-oriented occupations are Firefighting & Prevention (100.0%), Security & Protection (71.4%), and Law Enforcement (60.0%), while the most female-oriented occupations are Healthcare Support (100.0%), Food Preparation & Serving (100.0%), and Cleaning & Maintenance (50.0%).
| Occupation | Male | Female |
| Healthcare Support | 0 (0.0%) | 14 (100.0%) |
| Security & Protection | 5 (71.4%) | 2 (28.6%) |
| Firefighting & Prevention | 2 (100.0%) | 0 (0.0%) |
| Law Enforcement | 3 (60.0%) | 2 (40.0%) |
| Food Preparation & Serving | 0 (0.0%) | 4 (100.0%) |
| Cleaning & Maintenance | 1 (50.0%) | 1 (50.0%) |
| Personal Care & Service | 0 (0.0%) | 0 (0.0%) |
| Total (Category) | 6 (22.2%) | 21 (77.8%) |
| Total (Overall) | 57 (49.1%) | 59 (50.9%) |
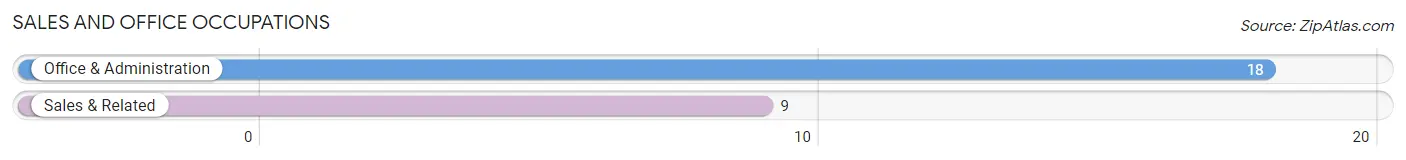
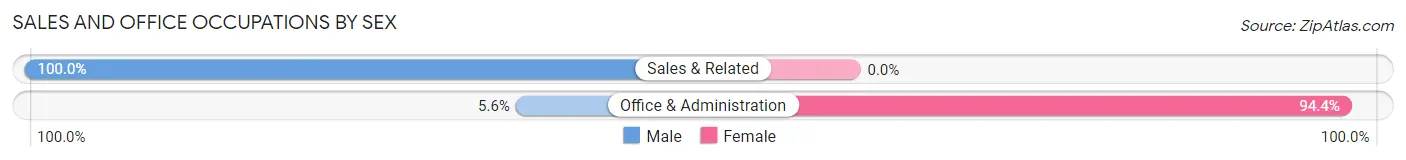
Sales and Office Occupations
The most common Sales and Office occupations in Tunnelhill borough are Office & Administration (18 | 15.5%), and Sales & Related (9 | 7.8%).
Sales and Office Occupations by Sex
| Occupation | Male | Female |
| Sales & Related | 9 (100.0%) | 0 (0.0%) |
| Office & Administration | 1 (5.6%) | 17 (94.4%) |
| Total (Category) | 10 (37.0%) | 17 (63.0%) |
| Total (Overall) | 57 (49.1%) | 59 (50.9%) |
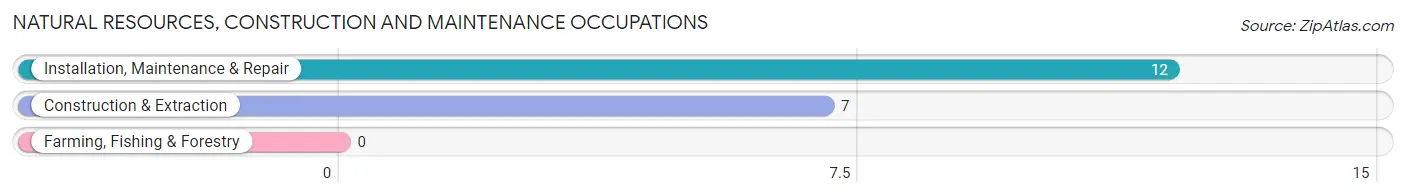
Natural Resources, Construction and Maintenance Occupations
The most common Natural Resources, Construction and Maintenance occupations in Tunnelhill borough are Installation, Maintenance & Repair (12 | 10.3%), and Construction & Extraction (7 | 6.0%).
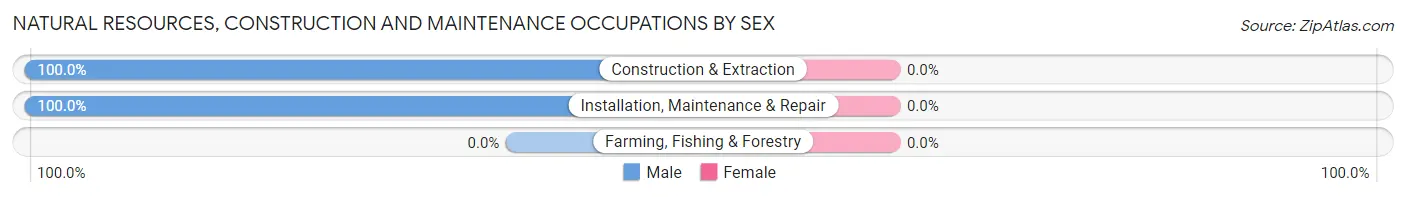
Natural Resources, Construction and Maintenance Occupations by Sex
| Occupation | Male | Female |
| Farming, Fishing & Forestry | 0 (0.0%) | 0 (0.0%) |
| Construction & Extraction | 7 (100.0%) | 0 (0.0%) |
| Installation, Maintenance & Repair | 12 (100.0%) | 0 (0.0%) |
| Total (Category) | 19 (100.0%) | 0 (0.0%) |
| Total (Overall) | 57 (49.1%) | 59 (50.9%) |
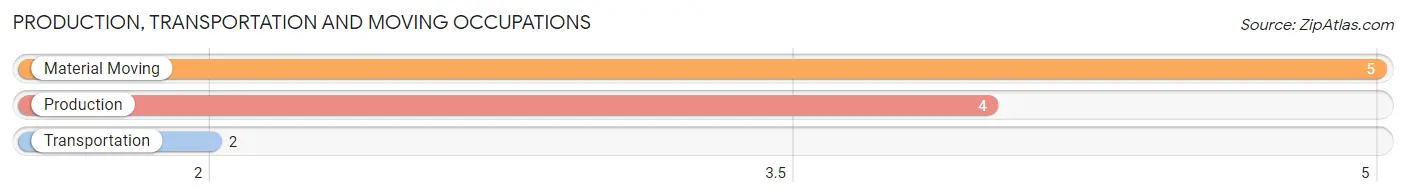
Production, Transportation and Moving Occupations
The most common Production, Transportation and Moving occupations in Tunnelhill borough are Material Moving (5 | 4.3%), Production (4 | 3.5%), and Transportation (2 | 1.7%).
Production, Transportation and Moving Occupations by Sex
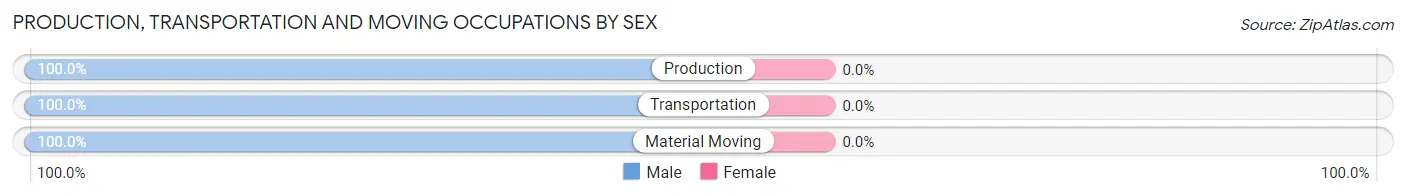
| Occupation | Male | Female |
| Production | 4 (100.0%) | 0 (0.0%) |
| Transportation | 2 (100.0%) | 0 (0.0%) |
| Material Moving | 5 (100.0%) | 0 (0.0%) |
| Total (Category) | 11 (100.0%) | 0 (0.0%) |
| Total (Overall) | 57 (49.1%) | 59 (50.9%) |
Employment Industries by Sex in Tunnelhill borough
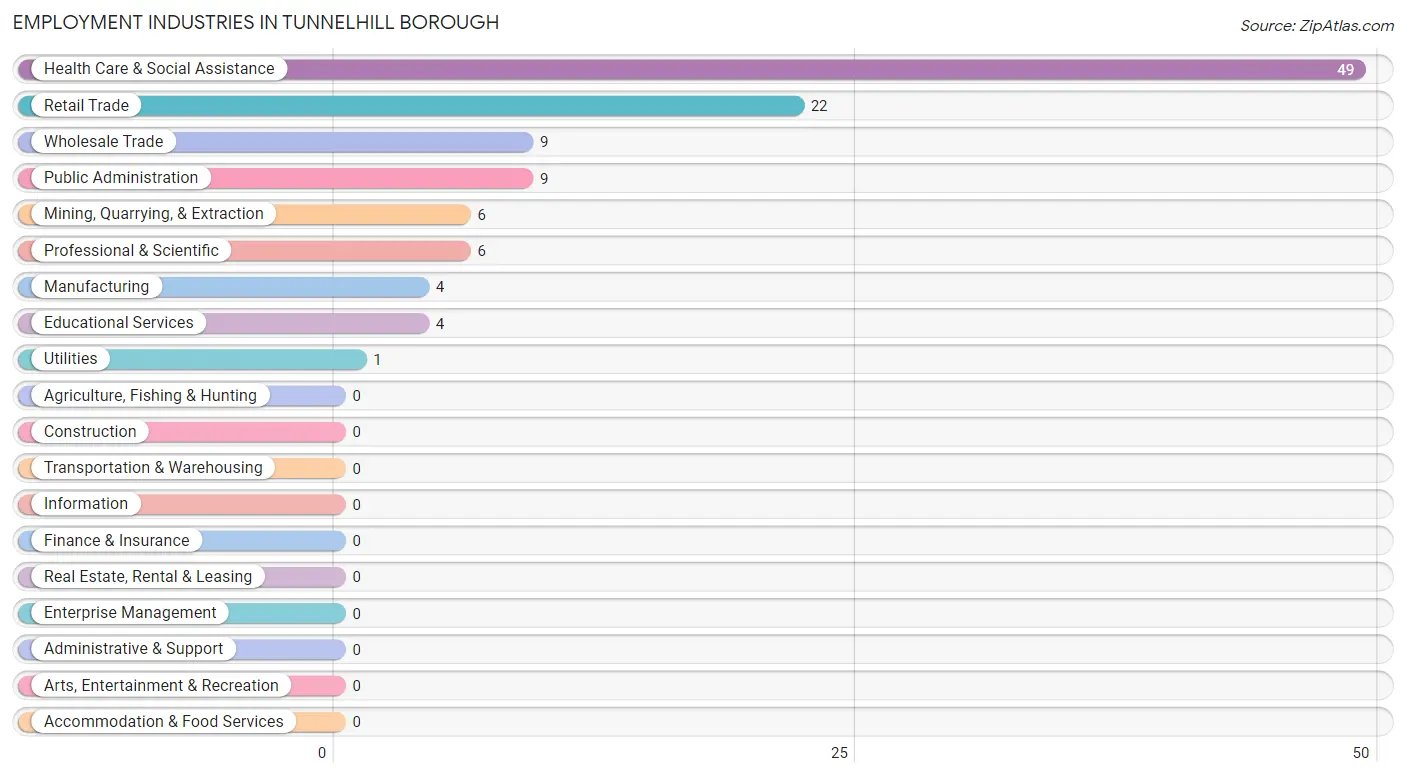
Employment Industries in Tunnelhill borough
The major employment industries in Tunnelhill borough include Health Care & Social Assistance (49 | 42.2%), Retail Trade (22 | 19.0%), Wholesale Trade (9 | 7.8%), Public Administration (9 | 7.8%), and Mining, Quarrying, & Extraction (6 | 5.2%).
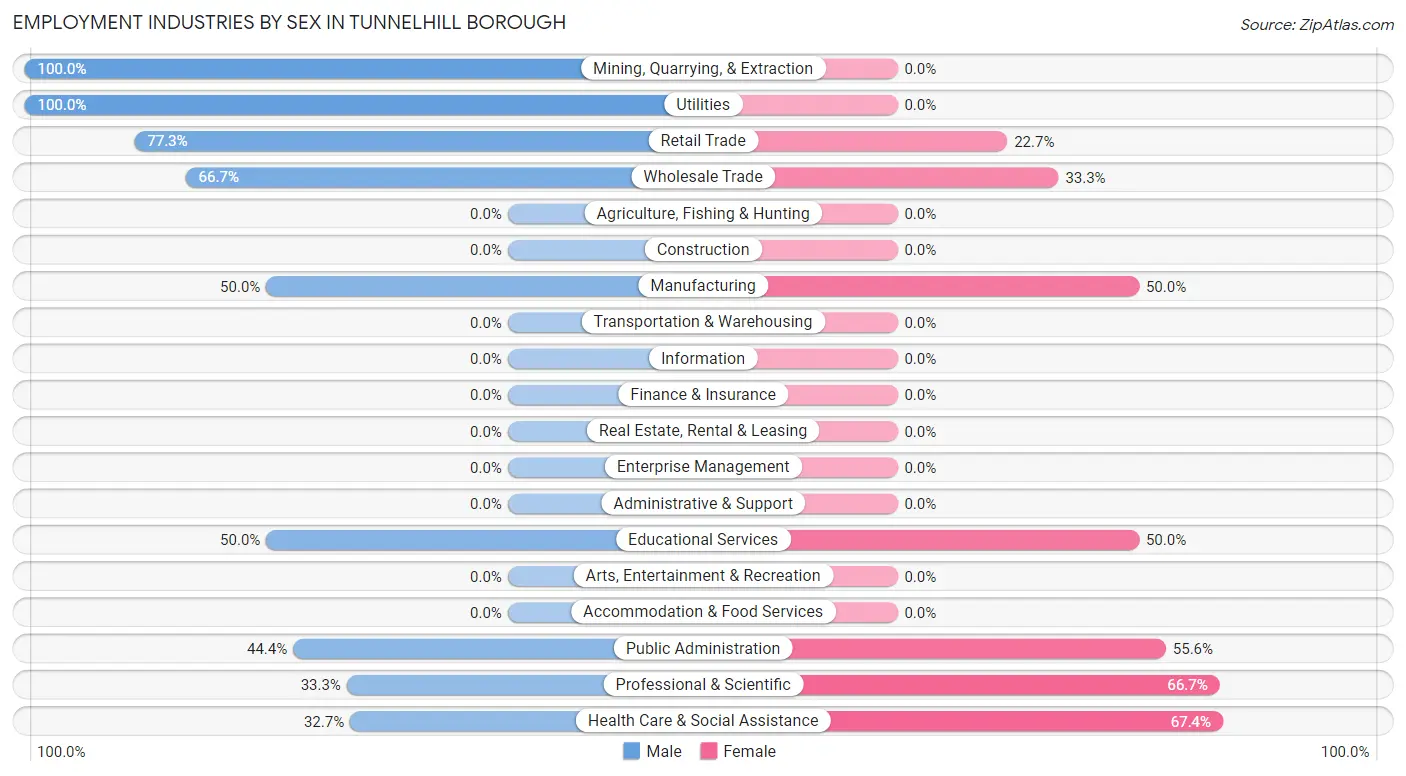
Employment Industries by Sex in Tunnelhill borough
The Tunnelhill borough industries that see more men than women are Mining, Quarrying, & Extraction (100.0%), Utilities (100.0%), and Retail Trade (77.3%), whereas the industries that tend to have a higher number of women are Health Care & Social Assistance (67.3%), Professional & Scientific (66.7%), and Public Administration (55.6%).
| Industry | Male | Female |
| Agriculture, Fishing & Hunting | 0 (0.0%) | 0 (0.0%) |
| Mining, Quarrying, & Extraction | 6 (100.0%) | 0 (0.0%) |
| Construction | 0 (0.0%) | 0 (0.0%) |
| Manufacturing | 2 (50.0%) | 2 (50.0%) |
| Wholesale Trade | 6 (66.7%) | 3 (33.3%) |
| Retail Trade | 17 (77.3%) | 5 (22.7%) |
| Transportation & Warehousing | 0 (0.0%) | 0 (0.0%) |
| Utilities | 1 (100.0%) | 0 (0.0%) |
| Information | 0 (0.0%) | 0 (0.0%) |
| Finance & Insurance | 0 (0.0%) | 0 (0.0%) |
| Real Estate, Rental & Leasing | 0 (0.0%) | 0 (0.0%) |
| Professional & Scientific | 2 (33.3%) | 4 (66.7%) |
| Enterprise Management | 0 (0.0%) | 0 (0.0%) |
| Administrative & Support | 0 (0.0%) | 0 (0.0%) |
| Educational Services | 2 (50.0%) | 2 (50.0%) |
| Health Care & Social Assistance | 16 (32.7%) | 33 (67.3%) |
| Arts, Entertainment & Recreation | 0 (0.0%) | 0 (0.0%) |
| Accommodation & Food Services | 0 (0.0%) | 0 (0.0%) |
| Public Administration | 4 (44.4%) | 5 (55.6%) |
| Total | 57 (49.1%) | 59 (50.9%) |
Education in Tunnelhill borough
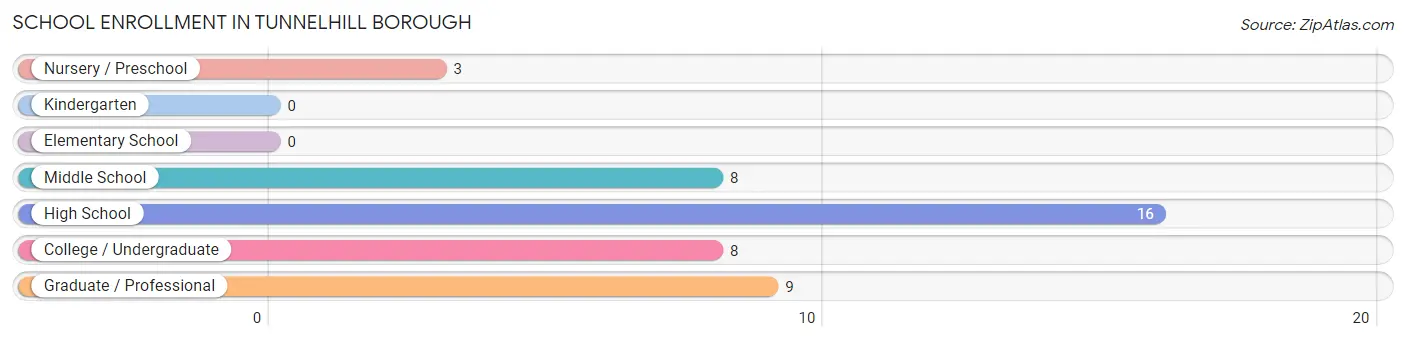
School Enrollment in Tunnelhill borough
The most common levels of schooling among the 44 students in Tunnelhill borough are high school (16 | 36.4%), graduate / professional (9 | 20.4%), and middle school (8 | 18.2%).
| School Level | # Students | % Students |
| Nursery / Preschool | 3 | 6.8% |
| Kindergarten | 0 | 0.0% |
| Elementary School | 0 | 0.0% |
| Middle School | 8 | 18.2% |
| High School | 16 | 36.4% |
| College / Undergraduate | 8 | 18.2% |
| Graduate / Professional | 9 | 20.4% |
| Total | 44 | 100.0% |
School Enrollment by Age by Funding Source in Tunnelhill borough
Out of a total of 44 students who are enrolled in schools in Tunnelhill borough, 16 (36.4%) attend a private institution, while the remaining 28 (63.6%) are enrolled in public schools. The age group of 35 years and over has the highest likelihood of being enrolled in private schools, with 3 (100.0% in the age bracket) enrolled. Conversely, the age group of 18 to 19 year olds has the lowest likelihood of being enrolled in a private school, with 2 (100.0% in the age bracket) attending a public institution.
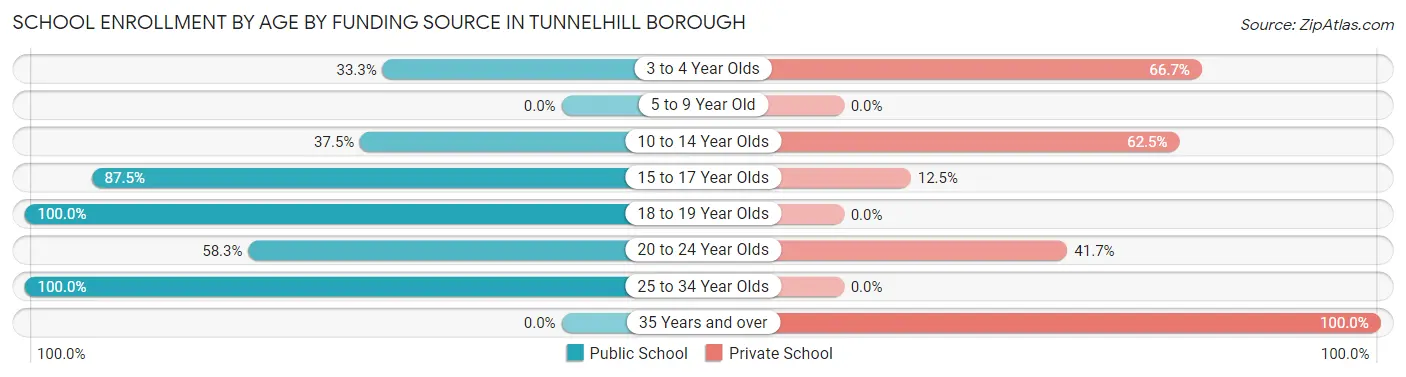
| Age Bracket | Public School | Private School |
| 3 to 4 Year Olds | 1 (33.3%) | 2 (66.7%) |
| 5 to 9 Year Old | 0 (0.0%) | 0 (0.0%) |
| 10 to 14 Year Olds | 3 (37.5%) | 5 (62.5%) |
| 15 to 17 Year Olds | 7 (87.5%) | 1 (12.5%) |
| 18 to 19 Year Olds | 2 (100.0%) | 0 (0.0%) |
| 20 to 24 Year Olds | 7 (58.3%) | 5 (41.7%) |
| 25 to 34 Year Olds | 8 (100.0%) | 0 (0.0%) |
| 35 Years and over | 0 (0.0%) | 3 (100.0%) |
| Total | 28 (63.6%) | 16 (36.4%) |
Educational Attainment by Field of Study in Tunnelhill borough
Science & technology (10 | 25.0%), business (8 | 20.0%), bio, nature & agricultural (5 | 12.5%), psychology (5 | 12.5%), and arts & humanities (4 | 10.0%) are the most common fields of study among 40 individuals in Tunnelhill borough who have obtained a bachelor's degree or higher.
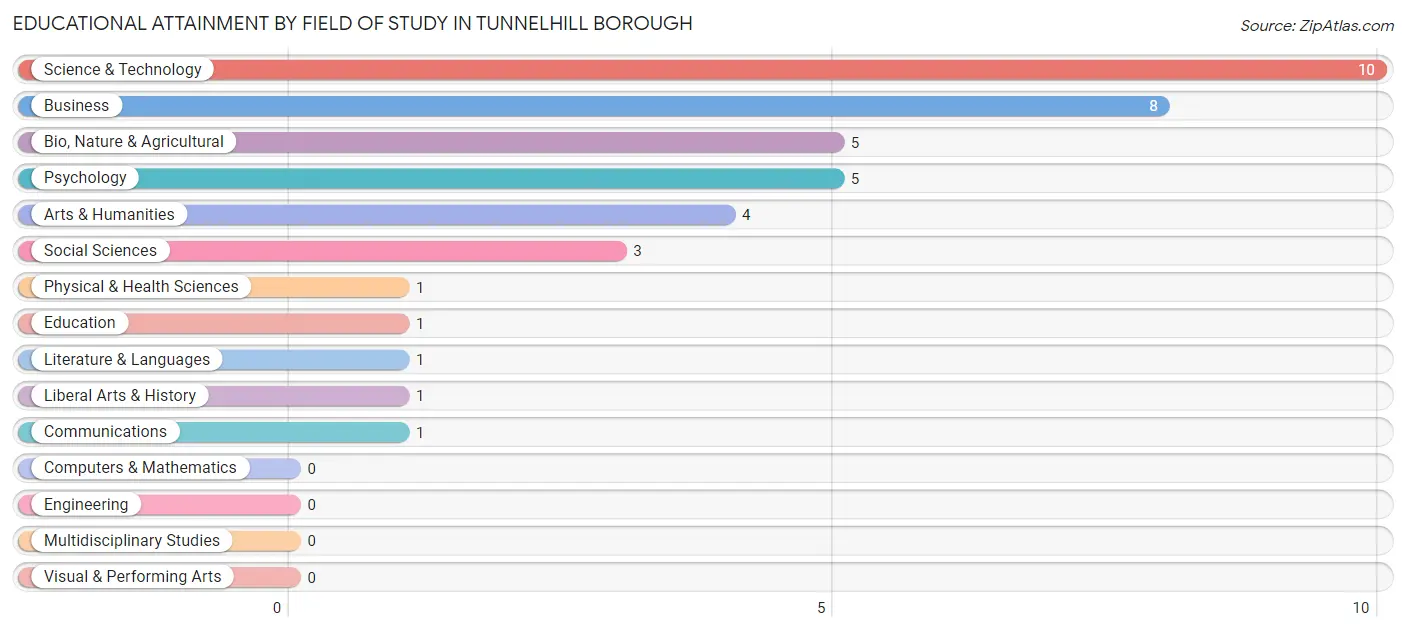
| Field of Study | # Graduates | % Graduates |
| Computers & Mathematics | 0 | 0.0% |
| Bio, Nature & Agricultural | 5 | 12.5% |
| Physical & Health Sciences | 1 | 2.5% |
| Psychology | 5 | 12.5% |
| Social Sciences | 3 | 7.5% |
| Engineering | 0 | 0.0% |
| Multidisciplinary Studies | 0 | 0.0% |
| Science & Technology | 10 | 25.0% |
| Business | 8 | 20.0% |
| Education | 1 | 2.5% |
| Literature & Languages | 1 | 2.5% |
| Liberal Arts & History | 1 | 2.5% |
| Visual & Performing Arts | 0 | 0.0% |
| Communications | 1 | 2.5% |
| Arts & Humanities | 4 | 10.0% |
| Total | 40 | 100.0% |
Transportation & Commute in Tunnelhill borough
Vehicle Availability by Sex in Tunnelhill borough
The most prevalent vehicle ownership categories in Tunnelhill borough are males with 2 vehicles (26, accounting for 48.1%) and females with 2 vehicles (20, making up 45.6%).
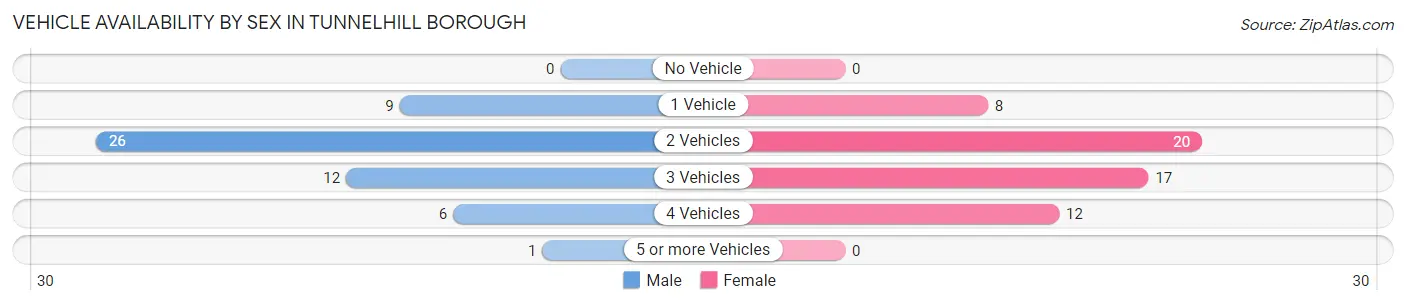
| Vehicles Available | Male | Female |
| No Vehicle | 0 (0.0%) | 0 (0.0%) |
| 1 Vehicle | 9 (16.7%) | 8 (14.0%) |
| 2 Vehicles | 26 (48.1%) | 20 (35.1%) |
| 3 Vehicles | 12 (22.2%) | 17 (29.8%) |
| 4 Vehicles | 6 (11.1%) | 12 (21.0%) |
| 5 or more Vehicles | 1 (1.8%) | 0 (0.0%) |
| Total | 54 (100.0%) | 57 (100.0%) |
Commute Time in Tunnelhill borough
The most frequently occuring commute durations in Tunnelhill borough are 15 to 19 minutes (25 commuters, 22.9%), 20 to 24 minutes (25 commuters, 22.9%), and 45 to 59 minutes (10 commuters, 9.2%).
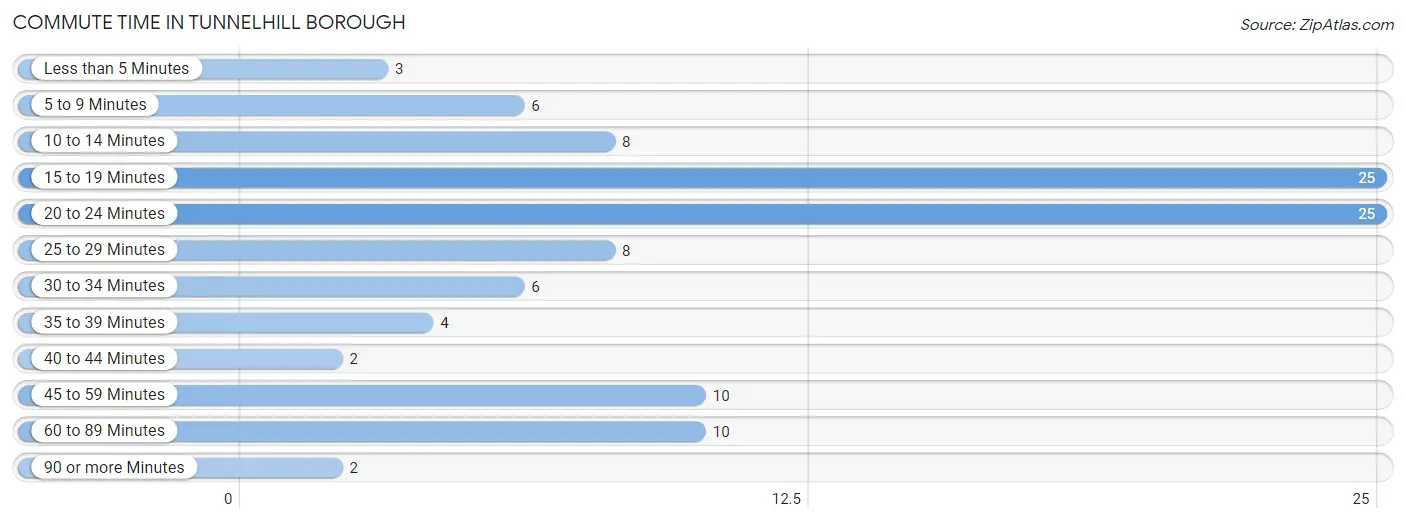
| Commute Time | # Commuters | % Commuters |
| Less than 5 Minutes | 3 | 2.8% |
| 5 to 9 Minutes | 6 | 5.5% |
| 10 to 14 Minutes | 8 | 7.3% |
| 15 to 19 Minutes | 25 | 22.9% |
| 20 to 24 Minutes | 25 | 22.9% |
| 25 to 29 Minutes | 8 | 7.3% |
| 30 to 34 Minutes | 6 | 5.5% |
| 35 to 39 Minutes | 4 | 3.7% |
| 40 to 44 Minutes | 2 | 1.8% |
| 45 to 59 Minutes | 10 | 9.2% |
| 60 to 89 Minutes | 10 | 9.2% |
| 90 or more Minutes | 2 | 1.8% |
Commute Time by Sex in Tunnelhill borough
The most common commute times in Tunnelhill borough are 20 to 24 minutes (16 commuters, 31.4%) for males and 15 to 19 minutes (23 commuters, 39.7%) for females.
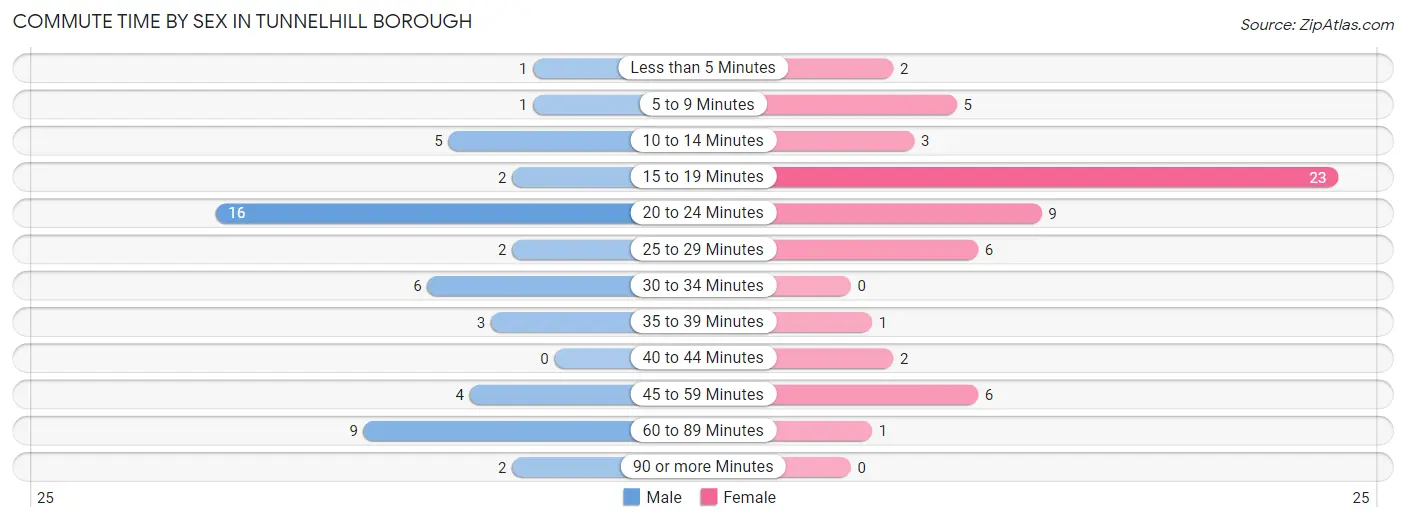
| Commute Time | Male | Female |
| Less than 5 Minutes | 1 (2.0%) | 2 (3.5%) |
| 5 to 9 Minutes | 1 (2.0%) | 5 (8.6%) |
| 10 to 14 Minutes | 5 (9.8%) | 3 (5.2%) |
| 15 to 19 Minutes | 2 (3.9%) | 23 (39.7%) |
| 20 to 24 Minutes | 16 (31.4%) | 9 (15.5%) |
| 25 to 29 Minutes | 2 (3.9%) | 6 (10.3%) |
| 30 to 34 Minutes | 6 (11.8%) | 0 (0.0%) |
| 35 to 39 Minutes | 3 (5.9%) | 1 (1.7%) |
| 40 to 44 Minutes | 0 (0.0%) | 2 (3.5%) |
| 45 to 59 Minutes | 4 (7.8%) | 6 (10.3%) |
| 60 to 89 Minutes | 9 (17.6%) | 1 (1.7%) |
| 90 or more Minutes | 2 (3.9%) | 0 (0.0%) |
Time of Departure to Work by Sex in Tunnelhill borough
The most frequent times of departure to work in Tunnelhill borough are 4:00 PM to 11:59 PM (11, 21.6%) for males and 7:00 AM to 7:29 AM (20, 34.5%) for females.
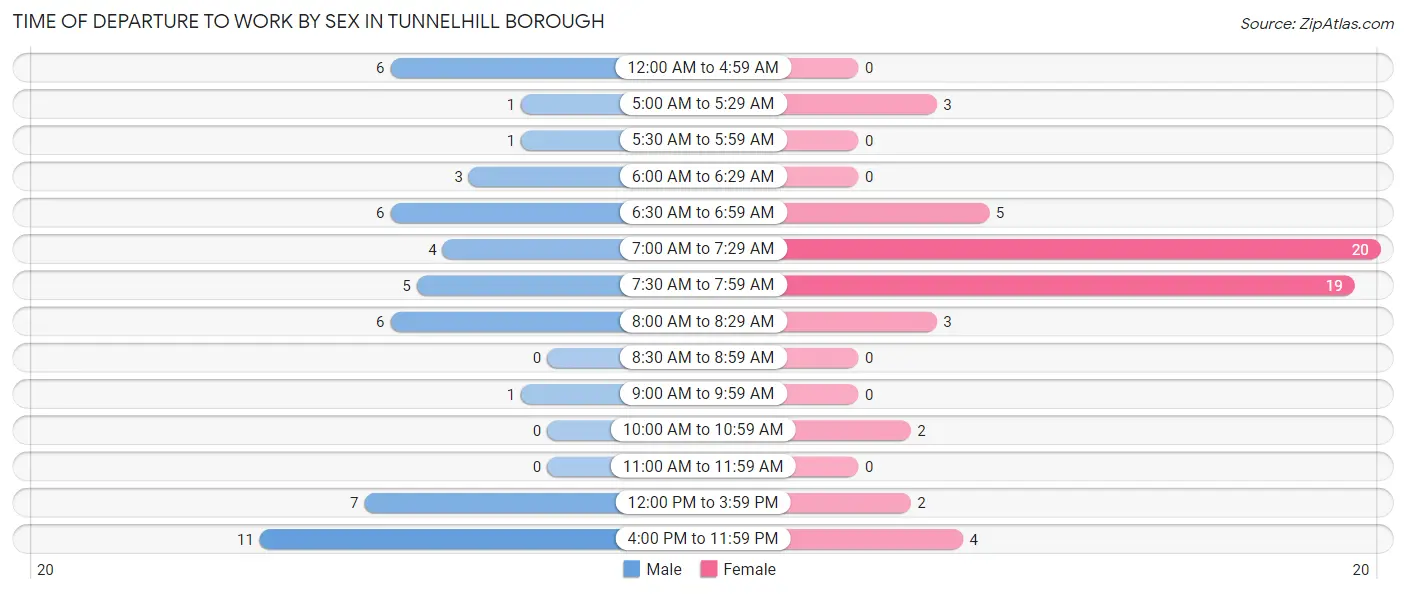
| Time of Departure | Male | Female |
| 12:00 AM to 4:59 AM | 6 (11.8%) | 0 (0.0%) |
| 5:00 AM to 5:29 AM | 1 (2.0%) | 3 (5.2%) |
| 5:30 AM to 5:59 AM | 1 (2.0%) | 0 (0.0%) |
| 6:00 AM to 6:29 AM | 3 (5.9%) | 0 (0.0%) |
| 6:30 AM to 6:59 AM | 6 (11.8%) | 5 (8.6%) |
| 7:00 AM to 7:29 AM | 4 (7.8%) | 20 (34.5%) |
| 7:30 AM to 7:59 AM | 5 (9.8%) | 19 (32.8%) |
| 8:00 AM to 8:29 AM | 6 (11.8%) | 3 (5.2%) |
| 8:30 AM to 8:59 AM | 0 (0.0%) | 0 (0.0%) |
| 9:00 AM to 9:59 AM | 1 (2.0%) | 0 (0.0%) |
| 10:00 AM to 10:59 AM | 0 (0.0%) | 2 (3.5%) |
| 11:00 AM to 11:59 AM | 0 (0.0%) | 0 (0.0%) |
| 12:00 PM to 3:59 PM | 7 (13.7%) | 2 (3.5%) |
| 4:00 PM to 11:59 PM | 11 (21.6%) | 4 (6.9%) |
| Total | 51 (100.0%) | 58 (100.0%) |
Housing Occupancy in Tunnelhill borough
Occupancy by Ownership in Tunnelhill borough
Of the total 120 dwellings in Tunnelhill borough, owner-occupied units account for 93 (77.5%), while renter-occupied units make up 27 (22.5%).
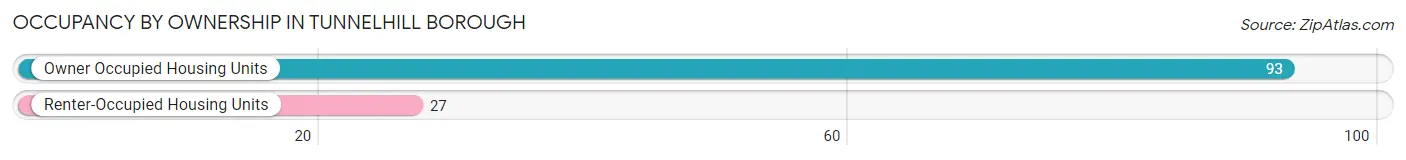
| Occupancy | # Housing Units | % Housing Units |
| Owner Occupied Housing Units | 93 | 77.5% |
| Renter-Occupied Housing Units | 27 | 22.5% |
| Total Occupied Housing Units | 120 | 100.0% |
Occupancy by Household Size in Tunnelhill borough
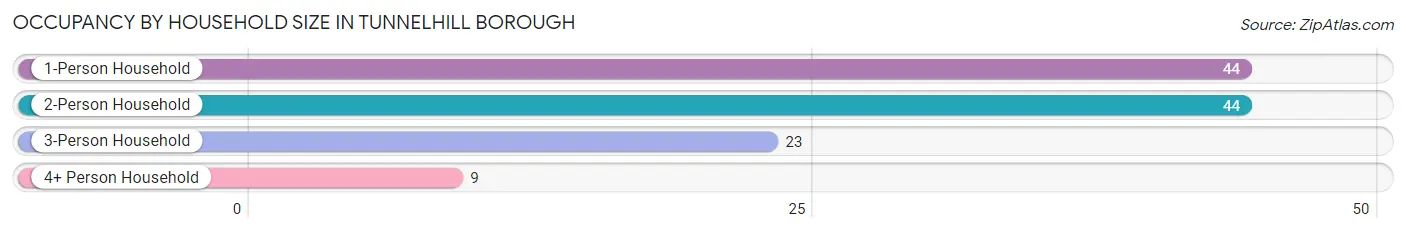
| Household Size | # Housing Units | % Housing Units |
| 1-Person Household | 44 | 36.7% |
| 2-Person Household | 44 | 36.7% |
| 3-Person Household | 23 | 19.2% |
| 4+ Person Household | 9 | 7.5% |
| Total Housing Units | 120 | 100.0% |
Occupancy by Ownership by Household Size in Tunnelhill borough
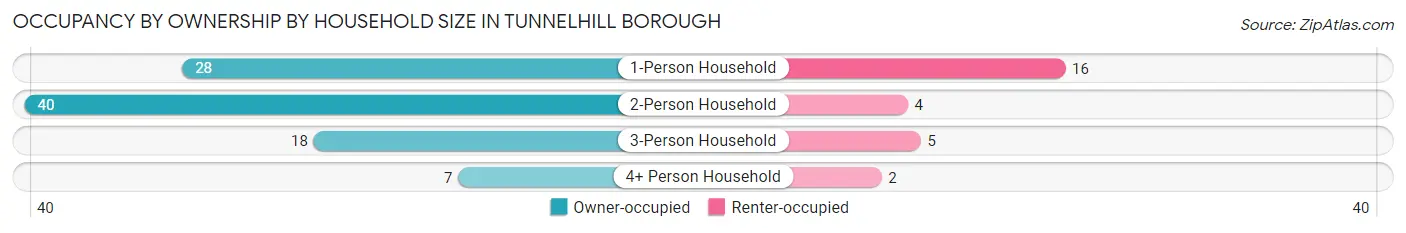
| Household Size | Owner-occupied | Renter-occupied |
| 1-Person Household | 28 (63.6%) | 16 (36.4%) |
| 2-Person Household | 40 (90.9%) | 4 (9.1%) |
| 3-Person Household | 18 (78.3%) | 5 (21.7%) |
| 4+ Person Household | 7 (77.8%) | 2 (22.2%) |
| Total Housing Units | 93 (77.5%) | 27 (22.5%) |
Occupancy by Educational Attainment in Tunnelhill borough
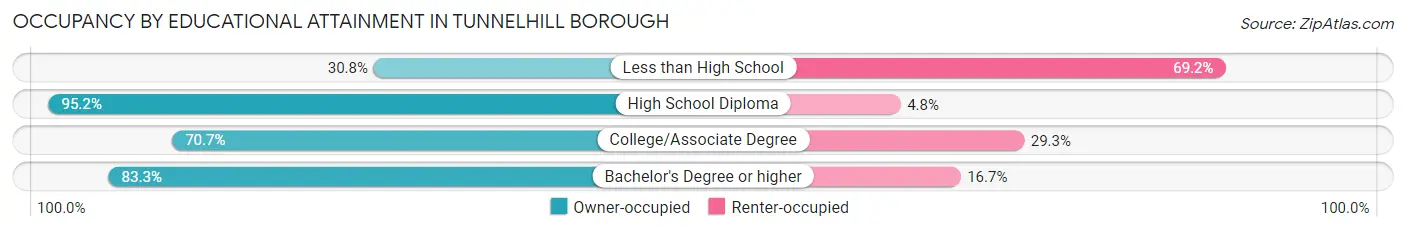
| Household Size | Owner-occupied | Renter-occupied |
| Less than High School | 4 (30.8%) | 9 (69.2%) |
| High School Diploma | 40 (95.2%) | 2 (4.8%) |
| College/Associate Degree | 29 (70.7%) | 12 (29.3%) |
| Bachelor's Degree or higher | 20 (83.3%) | 4 (16.7%) |
Occupancy by Age of Householder in Tunnelhill borough
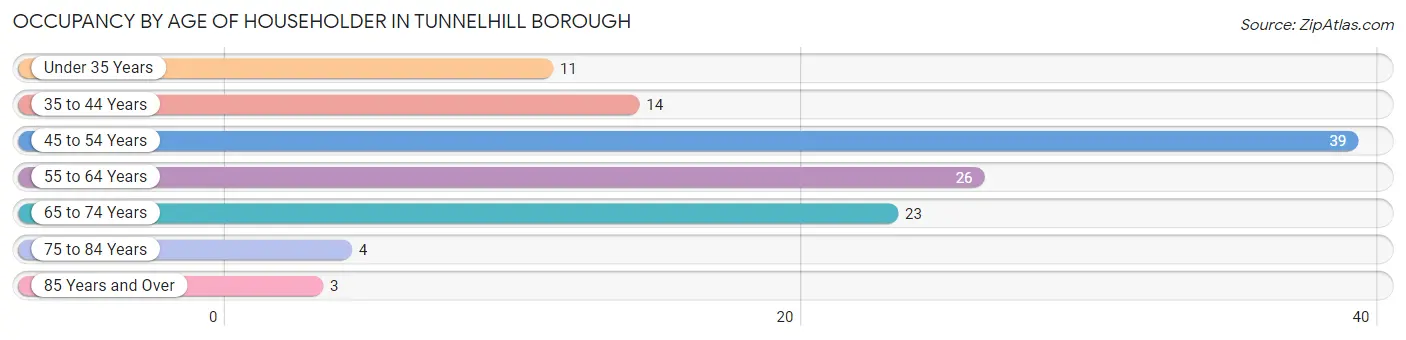
| Age Bracket | # Households | % Households |
| Under 35 Years | 11 | 9.2% |
| 35 to 44 Years | 14 | 11.7% |
| 45 to 54 Years | 39 | 32.5% |
| 55 to 64 Years | 26 | 21.7% |
| 65 to 74 Years | 23 | 19.2% |
| 75 to 84 Years | 4 | 3.3% |
| 85 Years and Over | 3 | 2.5% |
| Total | 120 | 100.0% |
Housing Finances in Tunnelhill borough
Median Income by Occupancy in Tunnelhill borough
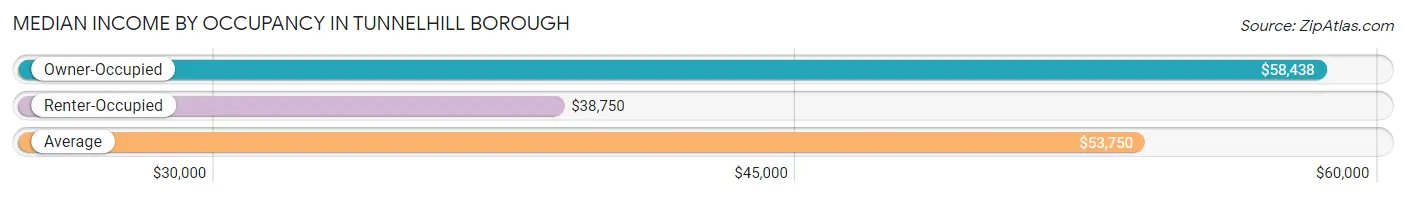
| Occupancy Type | # Households | Median Income |
| Owner-Occupied | 93 (77.5%) | $58,438 |
| Renter-Occupied | 27 (22.5%) | $38,750 |
| Average | 120 (100.0%) | $53,750 |
Occupancy by Householder Income Bracket in Tunnelhill borough
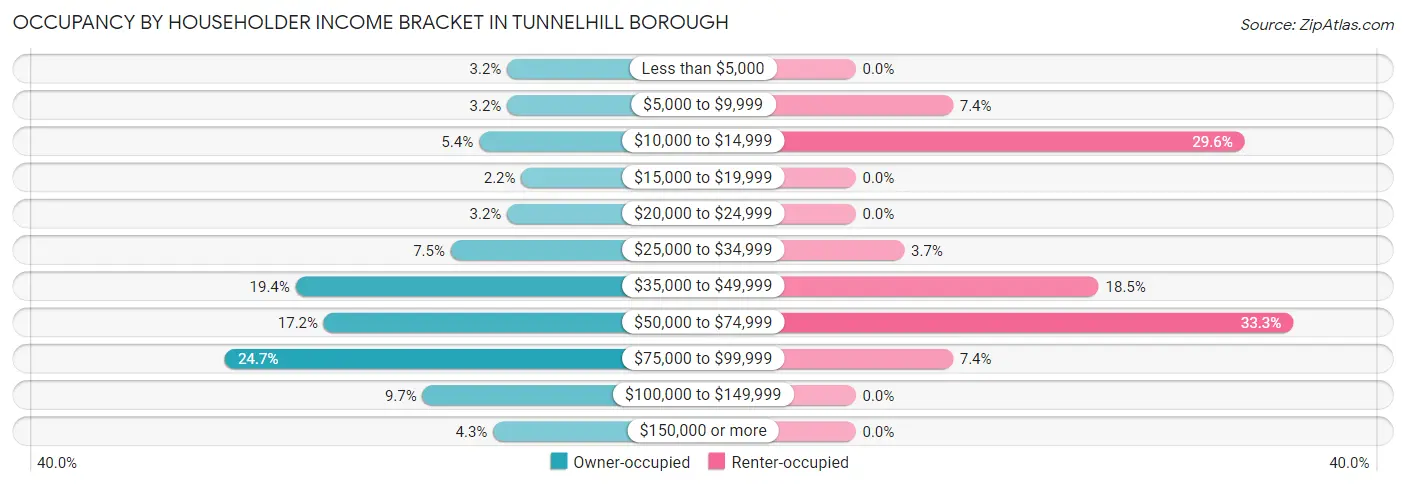
| Income Bracket | Owner-occupied | Renter-occupied |
| Less than $5,000 | 3 (3.2%) | 0 (0.0%) |
| $5,000 to $9,999 | 3 (3.2%) | 2 (7.4%) |
| $10,000 to $14,999 | 5 (5.4%) | 8 (29.6%) |
| $15,000 to $19,999 | 2 (2.1%) | 0 (0.0%) |
| $20,000 to $24,999 | 3 (3.2%) | 0 (0.0%) |
| $25,000 to $34,999 | 7 (7.5%) | 1 (3.7%) |
| $35,000 to $49,999 | 18 (19.4%) | 5 (18.5%) |
| $50,000 to $74,999 | 16 (17.2%) | 9 (33.3%) |
| $75,000 to $99,999 | 23 (24.7%) | 2 (7.4%) |
| $100,000 to $149,999 | 9 (9.7%) | 0 (0.0%) |
| $150,000 or more | 4 (4.3%) | 0 (0.0%) |
| Total | 93 (100.0%) | 27 (100.0%) |
Monthly Housing Cost Tiers in Tunnelhill borough
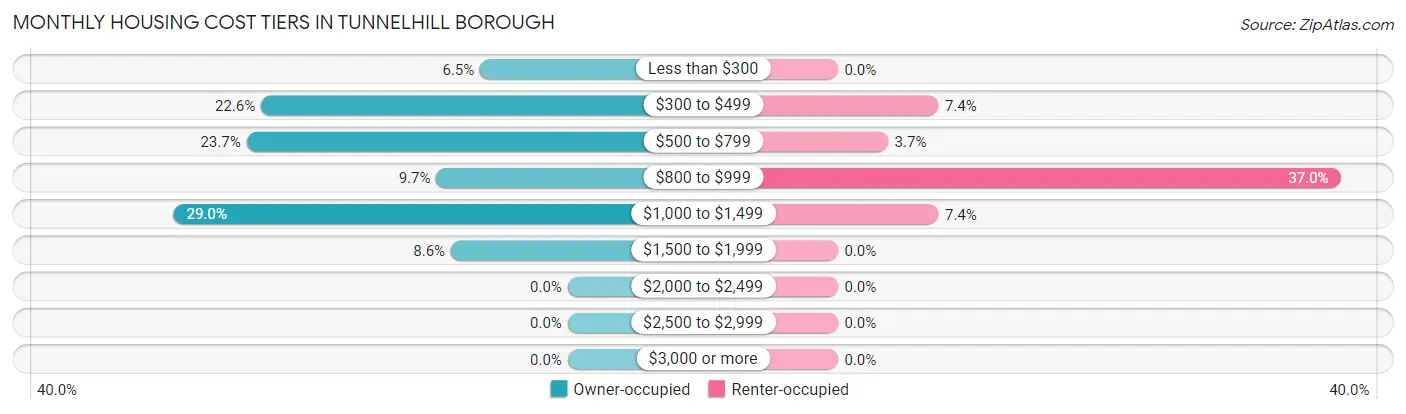
| Monthly Cost | Owner-occupied | Renter-occupied |
| Less than $300 | 6 (6.5%) | 0 (0.0%) |
| $300 to $499 | 21 (22.6%) | 2 (7.4%) |
| $500 to $799 | 22 (23.7%) | 1 (3.7%) |
| $800 to $999 | 9 (9.7%) | 10 (37.0%) |
| $1,000 to $1,499 | 27 (29.0%) | 2 (7.4%) |
| $1,500 to $1,999 | 8 (8.6%) | 0 (0.0%) |
| $2,000 to $2,499 | 0 (0.0%) | 0 (0.0%) |
| $2,500 to $2,999 | 0 (0.0%) | 0 (0.0%) |
| $3,000 or more | 0 (0.0%) | 0 (0.0%) |
| Total | 93 (100.0%) | 27 (100.0%) |
Physical Housing Characteristics in Tunnelhill borough
Housing Structures in Tunnelhill borough
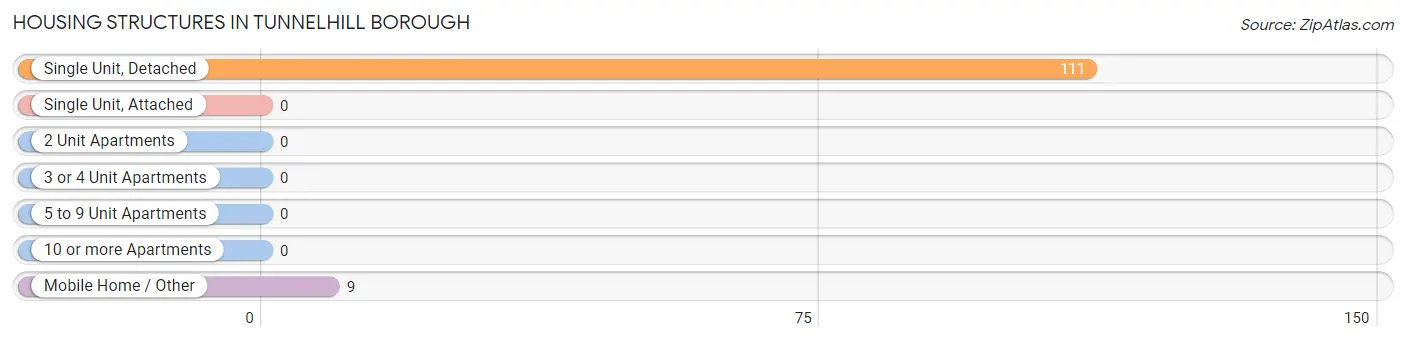
| Structure Type | # Housing Units | % Housing Units |
| Single Unit, Detached | 111 | 92.5% |
| Single Unit, Attached | 0 | 0.0% |
| 2 Unit Apartments | 0 | 0.0% |
| 3 or 4 Unit Apartments | 0 | 0.0% |
| 5 to 9 Unit Apartments | 0 | 0.0% |
| 10 or more Apartments | 0 | 0.0% |
| Mobile Home / Other | 9 | 7.5% |
| Total | 120 | 100.0% |
Housing Structures by Occupancy in Tunnelhill borough
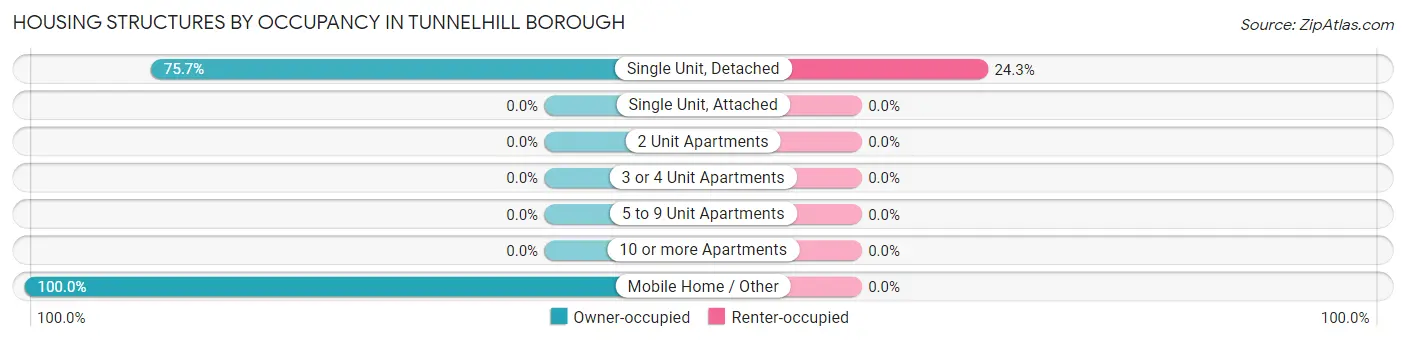
| Structure Type | Owner-occupied | Renter-occupied |
| Single Unit, Detached | 84 (75.7%) | 27 (24.3%) |
| Single Unit, Attached | 0 (0.0%) | 0 (0.0%) |
| 2 Unit Apartments | 0 (0.0%) | 0 (0.0%) |
| 3 or 4 Unit Apartments | 0 (0.0%) | 0 (0.0%) |
| 5 to 9 Unit Apartments | 0 (0.0%) | 0 (0.0%) |
| 10 or more Apartments | 0 (0.0%) | 0 (0.0%) |
| Mobile Home / Other | 9 (100.0%) | 0 (0.0%) |
| Total | 93 (77.5%) | 27 (22.5%) |
Housing Structures by Number of Rooms in Tunnelhill borough
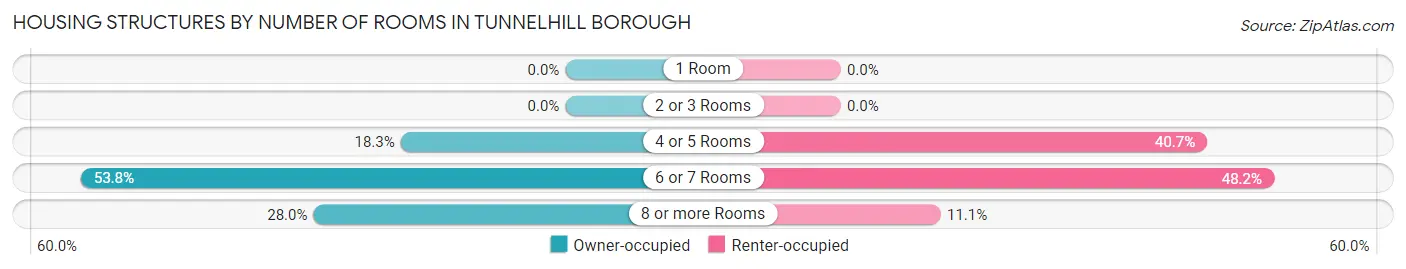
| Number of Rooms | Owner-occupied | Renter-occupied |
| 1 Room | 0 (0.0%) | 0 (0.0%) |
| 2 or 3 Rooms | 0 (0.0%) | 0 (0.0%) |
| 4 or 5 Rooms | 17 (18.3%) | 11 (40.7%) |
| 6 or 7 Rooms | 50 (53.8%) | 13 (48.1%) |
| 8 or more Rooms | 26 (28.0%) | 3 (11.1%) |
| Total | 93 (100.0%) | 27 (100.0%) |
Housing Structure by Heating Type in Tunnelhill borough
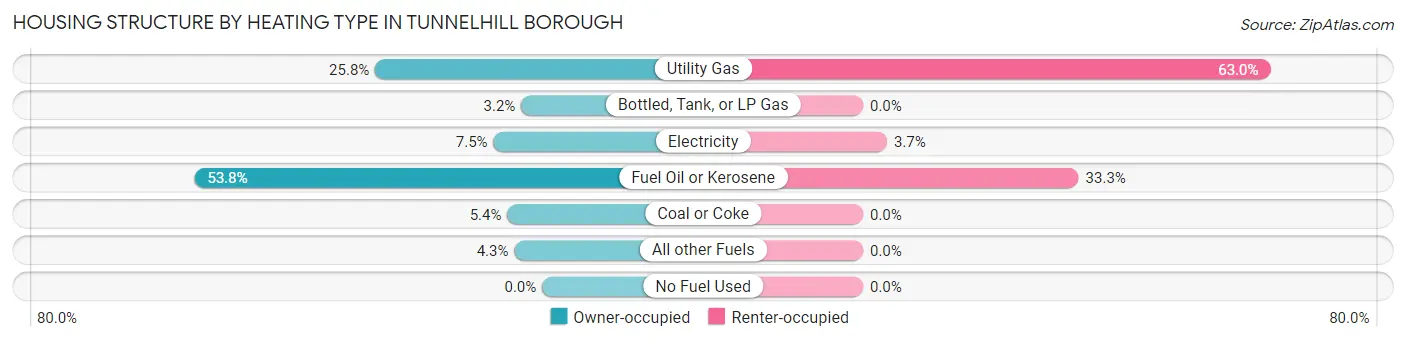
| Heating Type | Owner-occupied | Renter-occupied |
| Utility Gas | 24 (25.8%) | 17 (63.0%) |
| Bottled, Tank, or LP Gas | 3 (3.2%) | 0 (0.0%) |
| Electricity | 7 (7.5%) | 1 (3.7%) |
| Fuel Oil or Kerosene | 50 (53.8%) | 9 (33.3%) |
| Coal or Coke | 5 (5.4%) | 0 (0.0%) |
| All other Fuels | 4 (4.3%) | 0 (0.0%) |
| No Fuel Used | 0 (0.0%) | 0 (0.0%) |
| Total | 93 (100.0%) | 27 (100.0%) |
Household Vehicle Usage in Tunnelhill borough
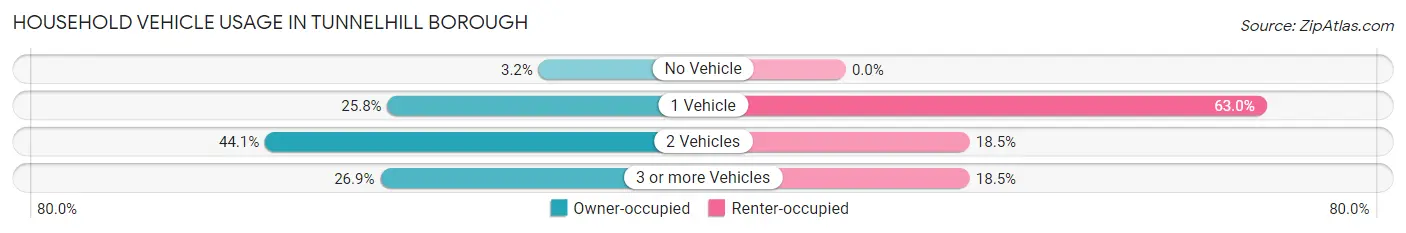
| Vehicles per Household | Owner-occupied | Renter-occupied |
| No Vehicle | 3 (3.2%) | 0 (0.0%) |
| 1 Vehicle | 24 (25.8%) | 17 (63.0%) |
| 2 Vehicles | 41 (44.1%) | 5 (18.5%) |
| 3 or more Vehicles | 25 (26.9%) | 5 (18.5%) |
| Total | 93 (100.0%) | 27 (100.0%) |
Real Estate & Mortgages in Tunnelhill borough
Real Estate and Mortgage Overview in Tunnelhill borough
| Characteristic | Without Mortgage | With Mortgage |
| Housing Units | 42 | 51 |
| Median Property Value | $116,700 | $107,800 |
| Median Household Income | $60,000 | $3 |
| Monthly Housing Costs | $464 | $0 |
| Real Estate Taxes | $1,000 | $0 |
Property Value by Mortgage Status in Tunnelhill borough
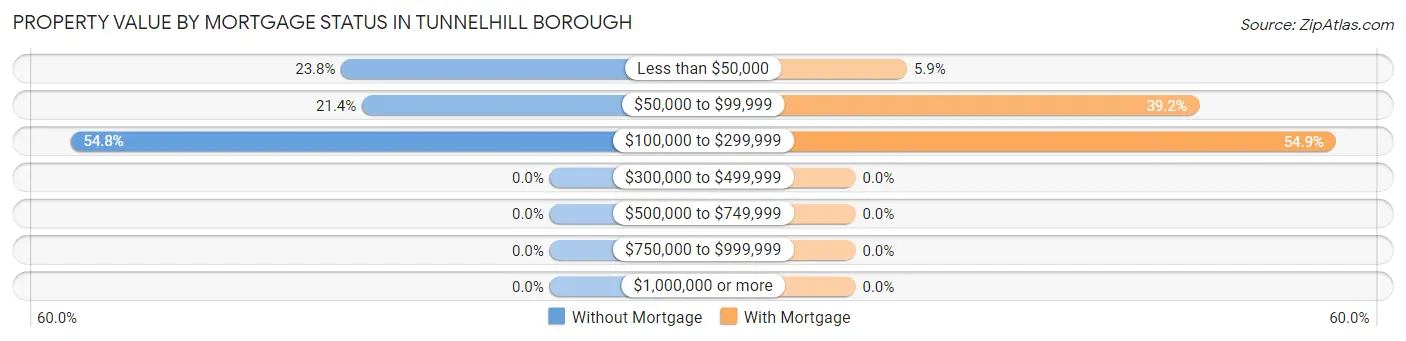
| Property Value | Without Mortgage | With Mortgage |
| Less than $50,000 | 10 (23.8%) | 3 (5.9%) |
| $50,000 to $99,999 | 9 (21.4%) | 20 (39.2%) |
| $100,000 to $299,999 | 23 (54.8%) | 28 (54.9%) |
| $300,000 to $499,999 | 0 (0.0%) | 0 (0.0%) |
| $500,000 to $749,999 | 0 (0.0%) | 0 (0.0%) |
| $750,000 to $999,999 | 0 (0.0%) | 0 (0.0%) |
| $1,000,000 or more | 0 (0.0%) | 0 (0.0%) |
| Total | 42 (100.0%) | 51 (100.0%) |
Household Income by Mortgage Status in Tunnelhill borough
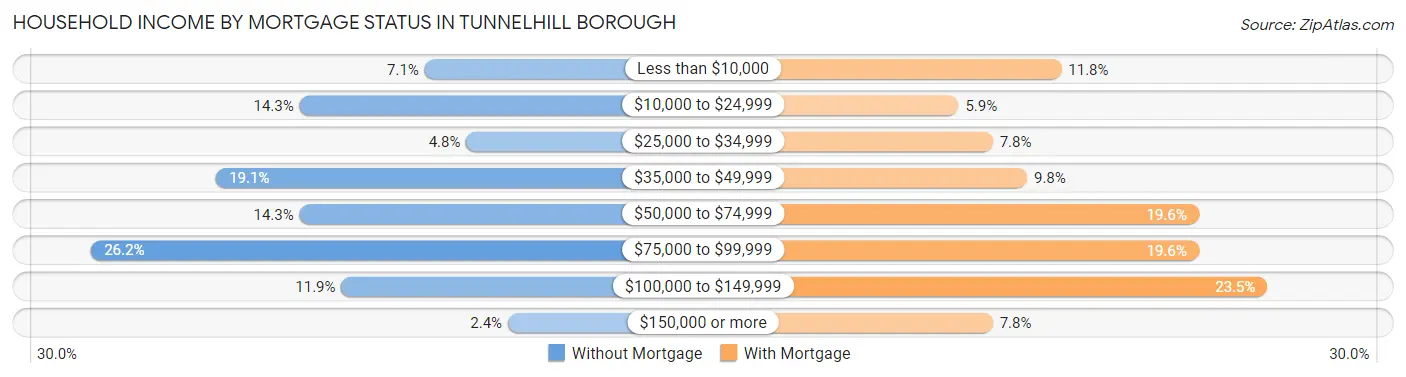
| Household Income | Without Mortgage | With Mortgage |
| Less than $10,000 | 3 (7.1%) | 6 (11.8%) |
| $10,000 to $24,999 | 6 (14.3%) | 3 (5.9%) |
| $25,000 to $34,999 | 2 (4.8%) | 4 (7.8%) |
| $35,000 to $49,999 | 8 (19.1%) | 5 (9.8%) |
| $50,000 to $74,999 | 6 (14.3%) | 10 (19.6%) |
| $75,000 to $99,999 | 11 (26.2%) | 10 (19.6%) |
| $100,000 to $149,999 | 5 (11.9%) | 12 (23.5%) |
| $150,000 or more | 1 (2.4%) | 4 (7.8%) |
| Total | 42 (100.0%) | 51 (100.0%) |
Property Value to Household Income Ratio in Tunnelhill borough
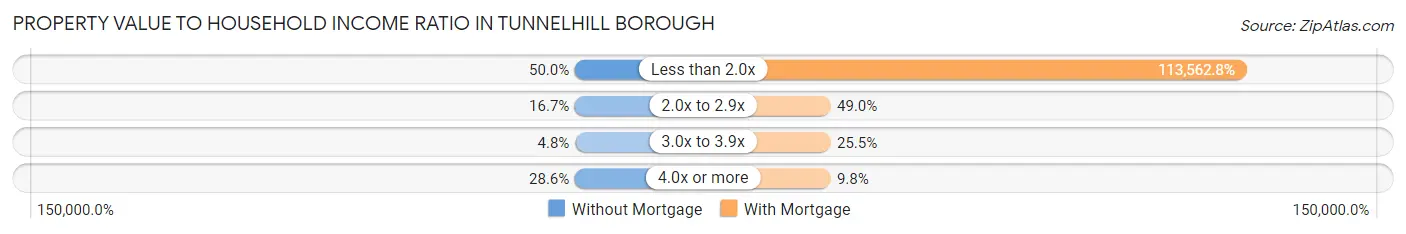
| Value-to-Income Ratio | Without Mortgage | With Mortgage |
| Less than 2.0x | 21 (50.0%) | 57,917 (113,562.8%) |
| 2.0x to 2.9x | 7 (16.7%) | 25 (49.0%) |
| 3.0x to 3.9x | 2 (4.8%) | 13 (25.5%) |
| 4.0x or more | 12 (28.6%) | 5 (9.8%) |
| Total | 42 (100.0%) | 51 (100.0%) |
Real Estate Taxes by Mortgage Status in Tunnelhill borough
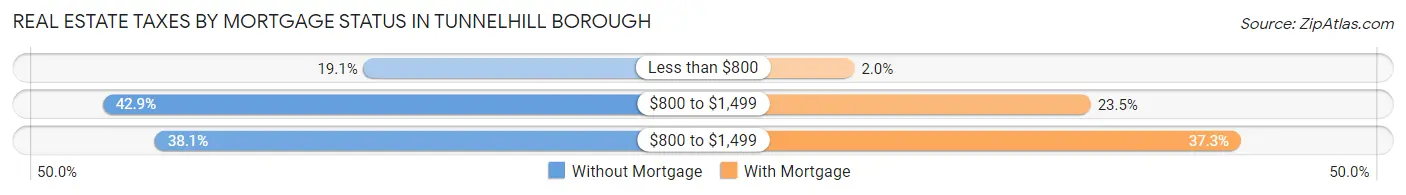
| Property Taxes | Without Mortgage | With Mortgage |
| Less than $800 | 8 (19.1%) | 1 (2.0%) |
| $800 to $1,499 | 18 (42.9%) | 12 (23.5%) |
| $800 to $1,499 | 16 (38.1%) | 19 (37.2%) |
| Total | 42 (100.0%) | 51 (100.0%) |
Health & Disability in Tunnelhill borough
Health Insurance Coverage by Age in Tunnelhill borough
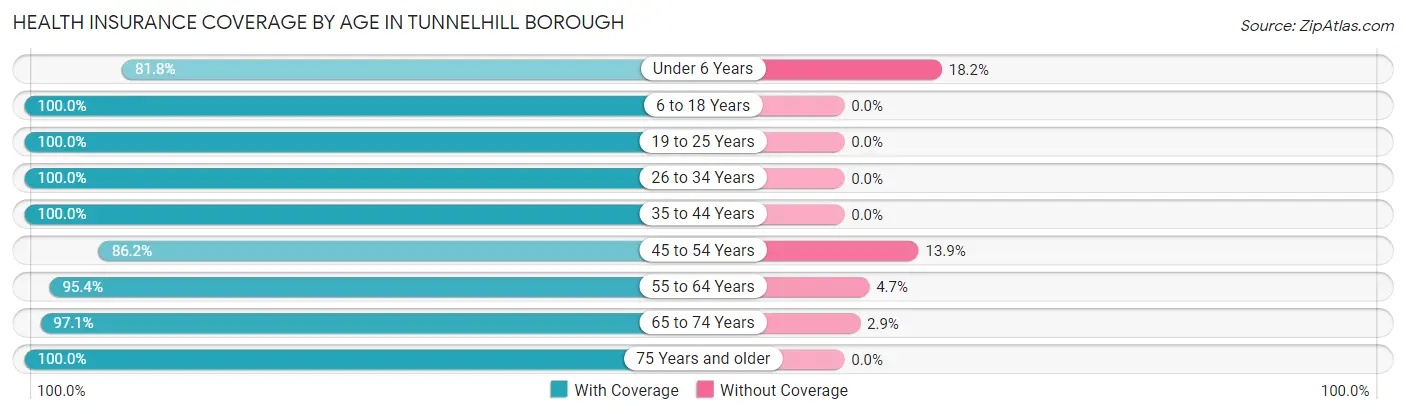
| Age Bracket | With Coverage | Without Coverage |
| Under 6 Years | 9 (81.8%) | 2 (18.2%) |
| 6 to 18 Years | 18 (100.0%) | 0 (0.0%) |
| 19 to 25 Years | 14 (100.0%) | 0 (0.0%) |
| 26 to 34 Years | 22 (100.0%) | 0 (0.0%) |
| 35 to 44 Years | 22 (100.0%) | 0 (0.0%) |
| 45 to 54 Years | 56 (86.2%) | 9 (13.9%) |
| 55 to 64 Years | 41 (95.4%) | 2 (4.6%) |
| 65 to 74 Years | 33 (97.1%) | 1 (2.9%) |
| 75 Years and older | 21 (100.0%) | 0 (0.0%) |
| Total | 236 (94.4%) | 14 (5.6%) |
Health Insurance Coverage by Citizenship Status in Tunnelhill borough
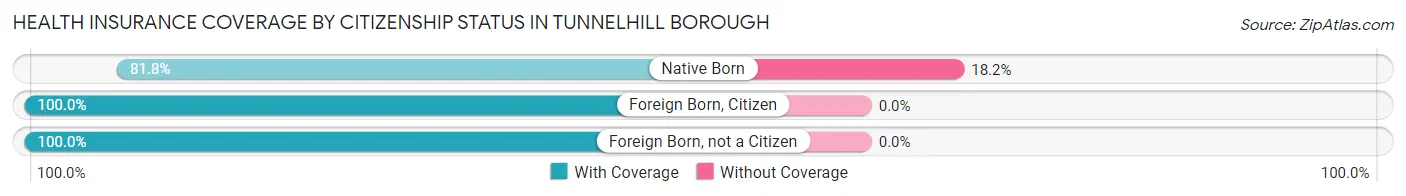
| Citizenship Status | With Coverage | Without Coverage |
| Native Born | 9 (81.8%) | 2 (18.2%) |
| Foreign Born, Citizen | 18 (100.0%) | 0 (0.0%) |
| Foreign Born, not a Citizen | 14 (100.0%) | 0 (0.0%) |
Health Insurance Coverage by Household Income in Tunnelhill borough
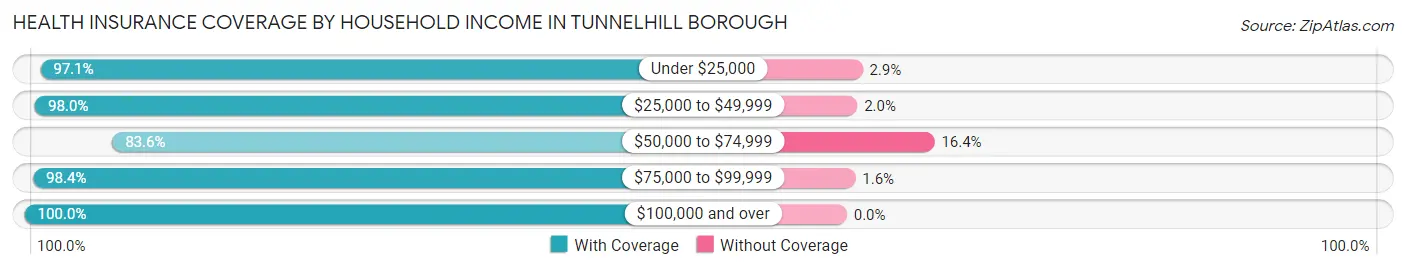
| Household Income | With Coverage | Without Coverage |
| Under $25,000 | 33 (97.1%) | 1 (2.9%) |
| $25,000 to $49,999 | 50 (98.0%) | 1 (2.0%) |
| $50,000 to $74,999 | 56 (83.6%) | 11 (16.4%) |
| $75,000 to $99,999 | 61 (98.4%) | 1 (1.6%) |
| $100,000 and over | 31 (100.0%) | 0 (0.0%) |
Public vs Private Health Insurance Coverage by Age in Tunnelhill borough
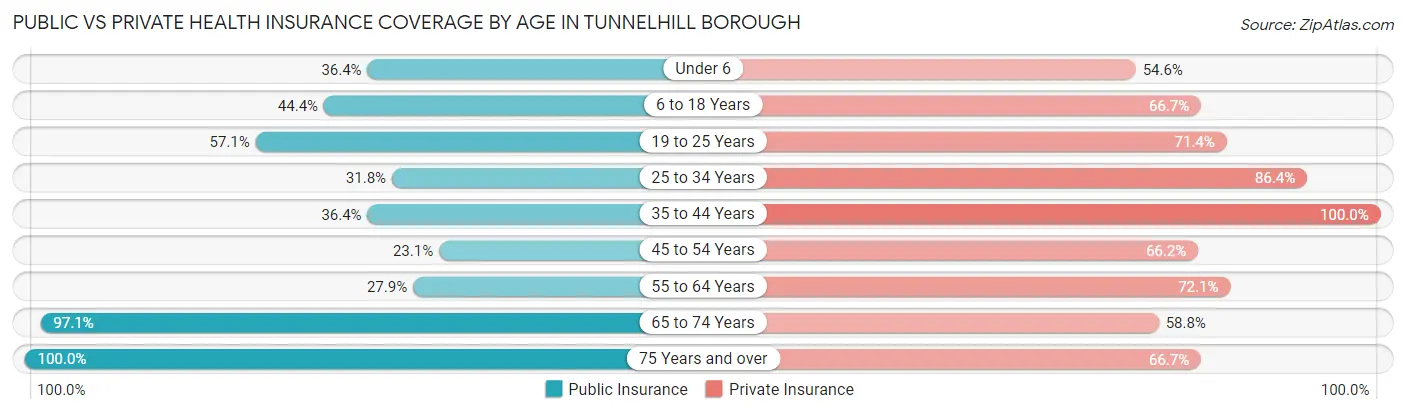
| Age Bracket | Public Insurance | Private Insurance |
| Under 6 | 4 (36.4%) | 6 (54.5%) |
| 6 to 18 Years | 8 (44.4%) | 12 (66.7%) |
| 19 to 25 Years | 8 (57.1%) | 10 (71.4%) |
| 25 to 34 Years | 7 (31.8%) | 19 (86.4%) |
| 35 to 44 Years | 8 (36.4%) | 22 (100.0%) |
| 45 to 54 Years | 15 (23.1%) | 43 (66.1%) |
| 55 to 64 Years | 12 (27.9%) | 31 (72.1%) |
| 65 to 74 Years | 33 (97.1%) | 20 (58.8%) |
| 75 Years and over | 21 (100.0%) | 14 (66.7%) |
| Total | 116 (46.4%) | 177 (70.8%) |
Disability Status by Sex by Age in Tunnelhill borough
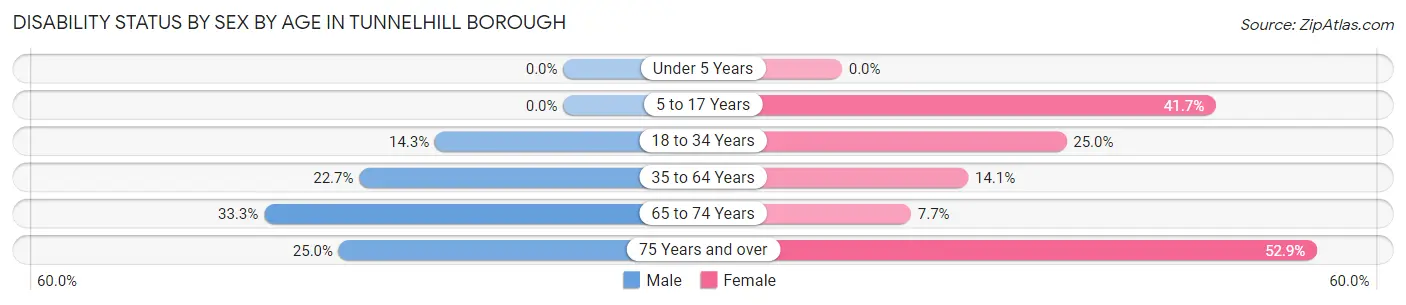
| Age Bracket | Male | Female |
| Under 5 Years | 0 (0.0%) | 0 (0.0%) |
| 5 to 17 Years | 0 (0.0%) | 5 (41.7%) |
| 18 to 34 Years | 2 (14.3%) | 6 (25.0%) |
| 35 to 64 Years | 15 (22.7%) | 9 (14.1%) |
| 65 to 74 Years | 7 (33.3%) | 1 (7.7%) |
| 75 Years and over | 1 (25.0%) | 9 (52.9%) |
Disability Class by Sex by Age in Tunnelhill borough
Disability Class: Hearing Difficulty
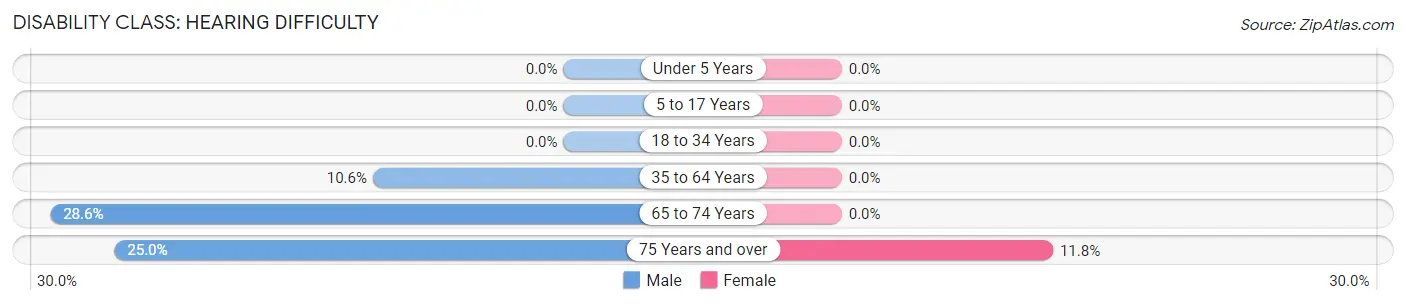
| Age Bracket | Male | Female |
| Under 5 Years | 0 (0.0%) | 0 (0.0%) |
| 5 to 17 Years | 0 (0.0%) | 0 (0.0%) |
| 18 to 34 Years | 0 (0.0%) | 0 (0.0%) |
| 35 to 64 Years | 7 (10.6%) | 0 (0.0%) |
| 65 to 74 Years | 6 (28.6%) | 0 (0.0%) |
| 75 Years and over | 1 (25.0%) | 2 (11.8%) |
Disability Class: Vision Difficulty
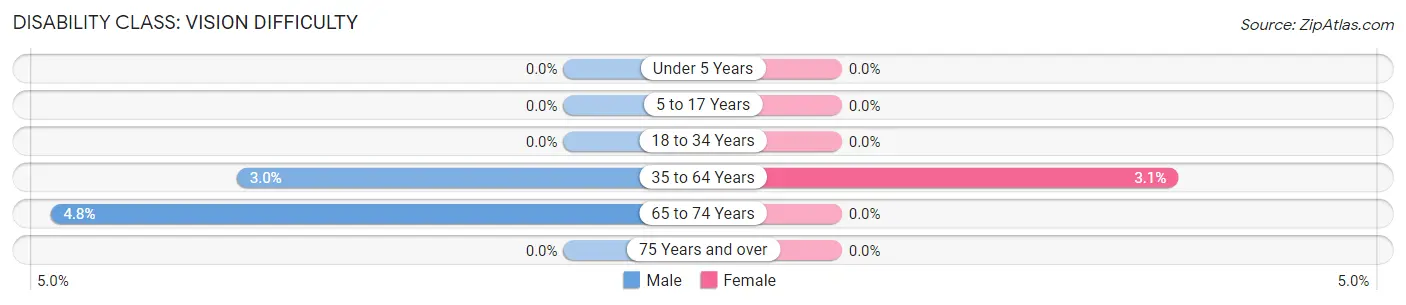
| Age Bracket | Male | Female |
| Under 5 Years | 0 (0.0%) | 0 (0.0%) |
| 5 to 17 Years | 0 (0.0%) | 0 (0.0%) |
| 18 to 34 Years | 0 (0.0%) | 0 (0.0%) |
| 35 to 64 Years | 2 (3.0%) | 2 (3.1%) |
| 65 to 74 Years | 1 (4.8%) | 0 (0.0%) |
| 75 Years and over | 0 (0.0%) | 0 (0.0%) |
Disability Class: Cognitive Difficulty
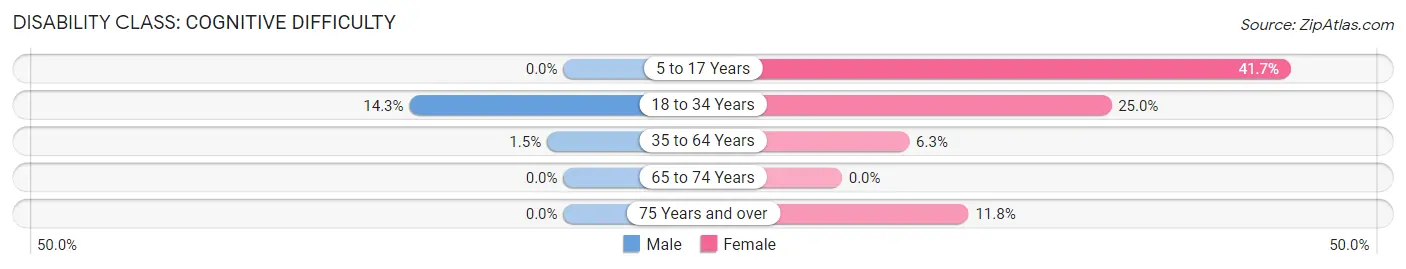
| Age Bracket | Male | Female |
| 5 to 17 Years | 0 (0.0%) | 5 (41.7%) |
| 18 to 34 Years | 2 (14.3%) | 6 (25.0%) |
| 35 to 64 Years | 1 (1.5%) | 4 (6.2%) |
| 65 to 74 Years | 0 (0.0%) | 0 (0.0%) |
| 75 Years and over | 0 (0.0%) | 2 (11.8%) |
Disability Class: Ambulatory Difficulty
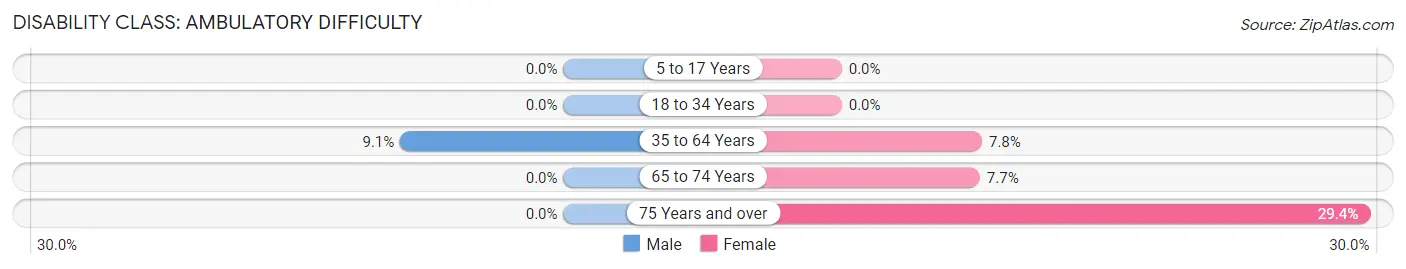
| Age Bracket | Male | Female |
| 5 to 17 Years | 0 (0.0%) | 0 (0.0%) |
| 18 to 34 Years | 0 (0.0%) | 0 (0.0%) |
| 35 to 64 Years | 6 (9.1%) | 5 (7.8%) |
| 65 to 74 Years | 0 (0.0%) | 1 (7.7%) |
| 75 Years and over | 0 (0.0%) | 5 (29.4%) |
Disability Class: Self-Care Difficulty
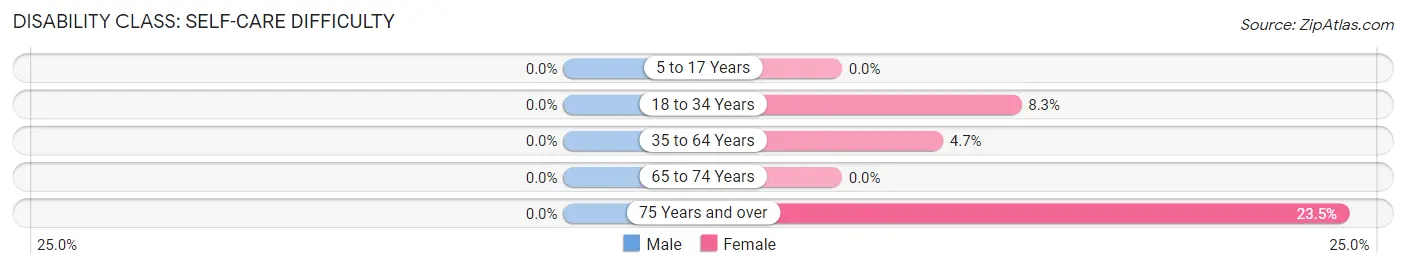
| Age Bracket | Male | Female |
| 5 to 17 Years | 0 (0.0%) | 0 (0.0%) |
| 18 to 34 Years | 0 (0.0%) | 2 (8.3%) |
| 35 to 64 Years | 0 (0.0%) | 3 (4.7%) |
| 65 to 74 Years | 0 (0.0%) | 0 (0.0%) |
| 75 Years and over | 0 (0.0%) | 4 (23.5%) |
Technology Access in Tunnelhill borough
Computing Device Access in Tunnelhill borough
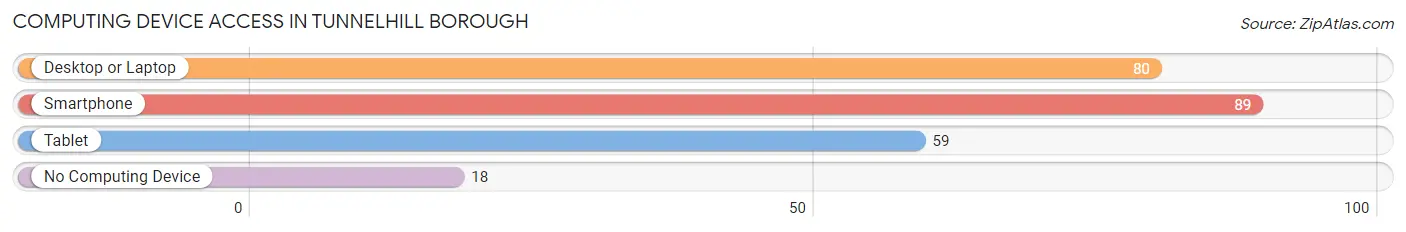
| Device Type | # Households | % Households |
| Desktop or Laptop | 80 | 66.7% |
| Smartphone | 89 | 74.2% |
| Tablet | 59 | 49.2% |
| No Computing Device | 18 | 15.0% |
| Total | 120 | 100.0% |
Internet Access in Tunnelhill borough
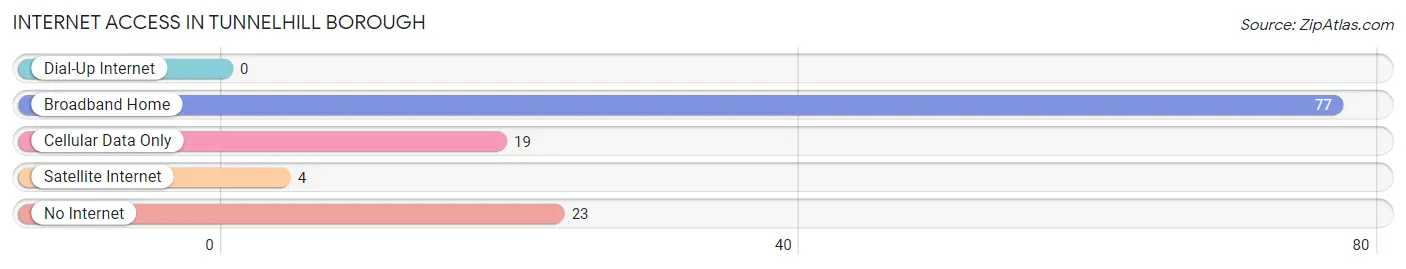
| Internet Type | # Households | % Households |
| Dial-Up Internet | 0 | 0.0% |
| Broadband Home | 77 | 64.2% |
| Cellular Data Only | 19 | 15.8% |
| Satellite Internet | 4 | 3.3% |
| No Internet | 23 | 19.2% |
| Total | 120 | 100.0% |
Tunnelhill borough Summary
Tunnelhill Borough is a small borough located in Cambria County, Pennsylvania. It is situated in the foothills of the Allegheny Mountains, approximately 10 miles east of Johnstown. The borough was incorporated in 1891 and has a population of approximately 500 people.
History
The area that is now Tunnelhill Borough was first settled in the late 1700s by German immigrants. The area was originally known as “Tunnel Hill” due to the presence of a tunnel that was built in the area in 1854. The tunnel was part of the Allegheny Portage Railroad, which was the first railroad to cross the Allegheny Mountains. The railroad was used to transport coal and other goods from the eastern side of the mountains to the western side.
The borough was officially incorporated in 1891 and was named after the tunnel. The town quickly grew and by the early 1900s, it had become a thriving coal mining community. The coal industry was the main source of employment for the residents of Tunnelhill Borough.
Geography
Tunnelhill Borough is located in the foothills of the Allegheny Mountains in Cambria County, Pennsylvania. The borough is situated approximately 10 miles east of Johnstown and is bordered by the towns of Ebensburg, Carrolltown, and Portage. The borough is located at an elevation of 1,400 feet and covers an area of 0.6 square miles.
The terrain of the borough is mostly hilly and is covered with forests and small farms. The borough is home to several creeks, including the Little Conemaugh River, which flows through the borough.
Economy
The economy of Tunnelhill Borough is largely based on agriculture and tourism. The borough is home to several small farms, which produce a variety of crops, including corn, soybeans, and hay. The borough is also home to several small businesses, including restaurants, stores, and a few bed and breakfasts.
The borough is also a popular tourist destination due to its proximity to the Allegheny Mountains. The borough is home to several hiking trails, as well as a few campgrounds. The borough is also home to the Allegheny Portage Railroad National Historic Site, which is a popular tourist attraction.
Demographics
As of the 2010 census, the population of Tunnelhill Borough was 498 people. The racial makeup of the borough was 97.2% White, 0.6% African American, 0.2% Native American, 0.2% Asian, and 1.8% from other races. The median household income in the borough was $37,500 and the median age was 44.5 years.
Conclusion
Tunnelhill Borough is a small borough located in Cambria County, Pennsylvania. The borough was incorporated in 1891 and has a population of approximately 500 people. The economy of the borough is largely based on agriculture and tourism, and the borough is home to several small businesses and farms. The borough is also a popular tourist destination due to its proximity to the Allegheny Mountains. As of the 2010 census, the population of Tunnelhill Borough was 498 people.
Common Questions
What is the Total Population of Tunnelhill borough?
Total Population of Tunnelhill borough is 250.
What is the Total Male Population of Tunnelhill borough?
Total Male Population of Tunnelhill borough is 118.
What is the Total Female Population of Tunnelhill borough?
Total Female Population of Tunnelhill borough is 132.
What is the Ratio of Males per 100 Females in Tunnelhill borough?
There are 89.39 Males per 100 Females in Tunnelhill borough.
What is the Ratio of Females per 100 Males in Tunnelhill borough?
There are 111.86 Females per 100 Males in Tunnelhill borough.
What is the Median Population Age in Tunnelhill borough?
Median Population Age in Tunnelhill borough is 51.5 Years.
What is the Average Family Size in Tunnelhill borough
Average Family Size in Tunnelhill borough is 2.7 People.
What is the Average Household Size in Tunnelhill borough
Average Household Size in Tunnelhill borough is 2.0 People.
What is Per Capita Income in Tunnelhill borough?
Per Capita income in Tunnelhill borough is $28,797.
What is the Median Family Income in Tunnelhill borough?
Median Family Income in Tunnelhill borough is $64,792.
What is the Median Household income in Tunnelhill borough?
Median Household Income in Tunnelhill borough is $53,750.
What is Income or Wage Gap in Tunnelhill borough?
Income or Wage Gap in Tunnelhill borough is 25.1%.
Women in Tunnelhill borough earn 74.9 cents for every dollar earned by a man.
What is Family Income Deficit in Tunnelhill borough?
Family Income Deficit in Tunnelhill borough is $11,260.
Families that are below poverty line in Tunnelhill borough earn $11,260 less on average than the poverty threshold level.
What is Inequality or Gini Index in Tunnelhill borough?
Inequality or Gini Index in Tunnelhill borough is 0.37.
How Large is the Labor Force in Tunnelhill borough?
There are 128 People in the Labor Forcein in Tunnelhill borough.
What is the Percentage of People in the Labor Force in Tunnelhill borough?
55.7% of People are in the Labor Force in Tunnelhill borough.
What is the Unemployment Rate in Tunnelhill borough?
Unemployment Rate in Tunnelhill borough is 9.4%.