Zip Codes with the Highest Percentage of Population Employed in Health Diagnosing & Treating in Pittston, PA
RELATED REPORTS & OPTIONS
Health Diagnosing & Treating
Pittston
Compare Zip Codes
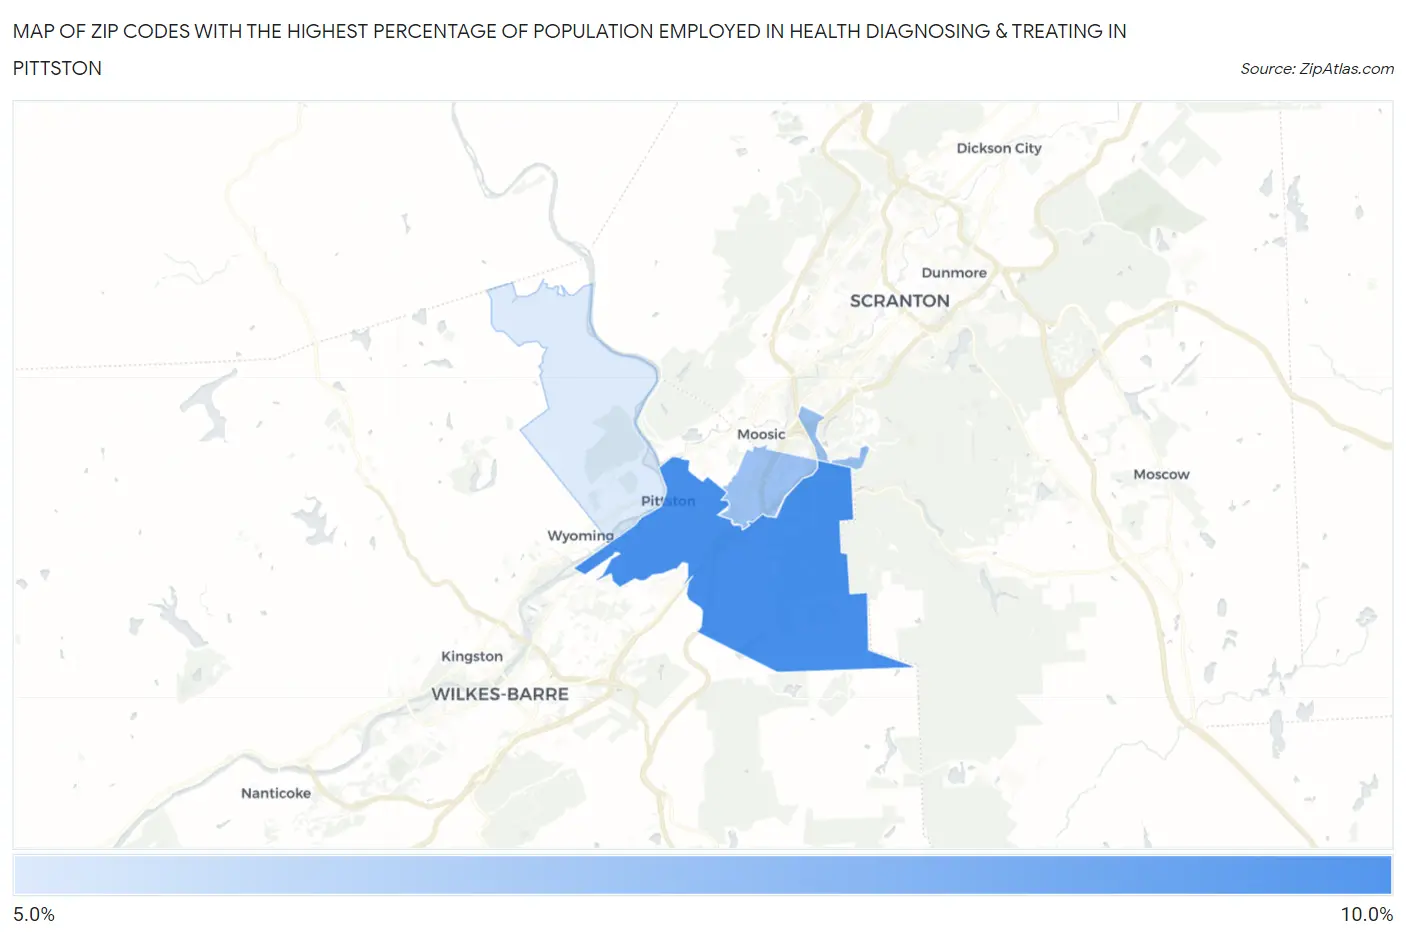
Map of Zip Codes with the Highest Percentage of Population Employed in Health Diagnosing & Treating in Pittston
0.0%
10.0%
Zip Codes with the Highest Percentage of Population Employed in Health Diagnosing & Treating in Pittston, PA
| Zip Code | % Employed | vs State | vs National | |
| 1. | 18640 | 8.3% | 7.4%(+0.956)#500 | 6.2%(+2.06)#6,756 |
| 2. | 18641 | 6.5% | 7.4%(-0.844)#847 | 6.2%(+0.262)#12,000 |
| 3. | 18643 | 5.1% | 7.4%(-2.23)#1,144 | 6.2%(-1.13)#17,259 |
1
Common Questions
What are the Top Zip Codes with the Highest Percentage of Population Employed in Health Diagnosing & Treating in Pittston, PA?
Top Zip Codes with the Highest Percentage of Population Employed in Health Diagnosing & Treating in Pittston, PA are:
What zip code has the Highest Percentage of Population Employed in Health Diagnosing & Treating in Pittston, PA?
18640 has the Highest Percentage of Population Employed in Health Diagnosing & Treating in Pittston, PA with 8.3%.
What is the Percentage of Population Employed in Health Diagnosing & Treating in Pittston, PA?
Percentage of Population Employed in Health Diagnosing & Treating in Pittston is 8.9%.
What is the Percentage of Population Employed in Health Diagnosing & Treating in Pennsylvania?
Percentage of Population Employed in Health Diagnosing & Treating in Pennsylvania is 7.4%.
What is the Percentage of Population Employed in Health Diagnosing & Treating in the United States?
Percentage of Population Employed in Health Diagnosing & Treating in the United States is 6.2%.