Laflin borough, PA
Laflin borough Overview
1,427
TOTAL POPULATION
712
MALE POPULATION
715
FEMALE POPULATION
99.58
MALES / 100 FEMALES
100.42
FEMALES / 100 MALES
48.4
MEDIAN AGE
2.8
AVG FAMILY SIZE
2.5
AVG HOUSEHOLD SIZE
$49,070
PER CAPITA INCOME
$119,063
AVG FAMILY INCOME
$104,286
AVG HOUSEHOLD INCOME
17.3%
WAGE / INCOME GAP [ % ]
82.7¢/ $1
WAGE / INCOME GAP [ $ ]
0.37
INEQUALITY / GINI INDEX
771
LABOR FORCE [ PEOPLE ]
65.1%
PERCENT IN LABOR FORCE
4.7%
UNEMPLOYMENT RATE
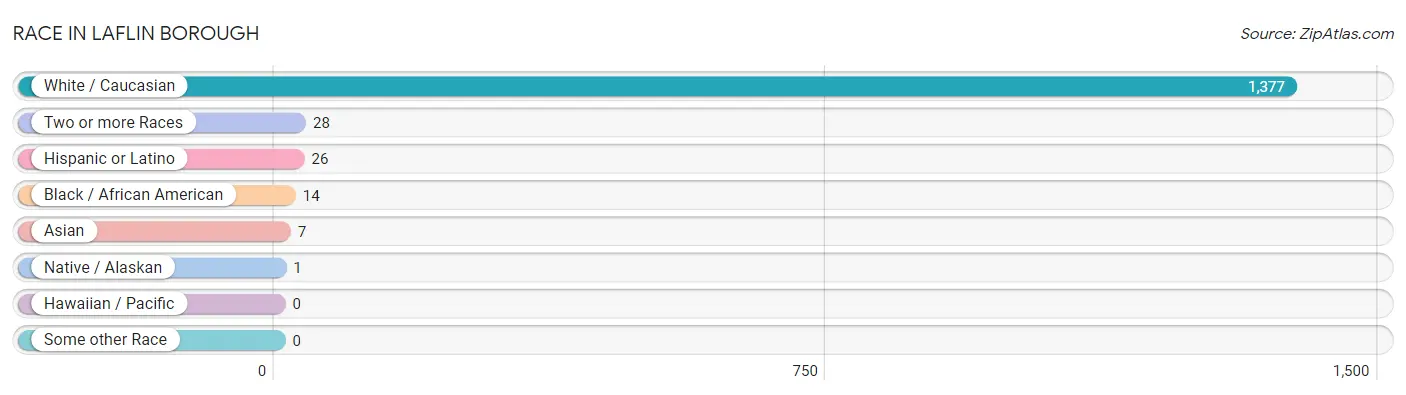
Race in Laflin borough
The most populous races in Laflin borough are White / Caucasian (1,377 | 96.5%), Two or more Races (28 | 2.0%), and Hispanic or Latino (26 | 1.8%).
| Race | # Population | % Population |
| Asian | 7 | 0.5% |
| Black / African American | 14 | 1.0% |
| Hawaiian / Pacific | 0 | 0.0% |
| Hispanic or Latino | 26 | 1.8% |
| Native / Alaskan | 1 | 0.1% |
| White / Caucasian | 1,377 | 96.5% |
| Two or more Races | 28 | 2.0% |
| Some other Race | 0 | 0.0% |
| Total | 1,427 | 100.0% |
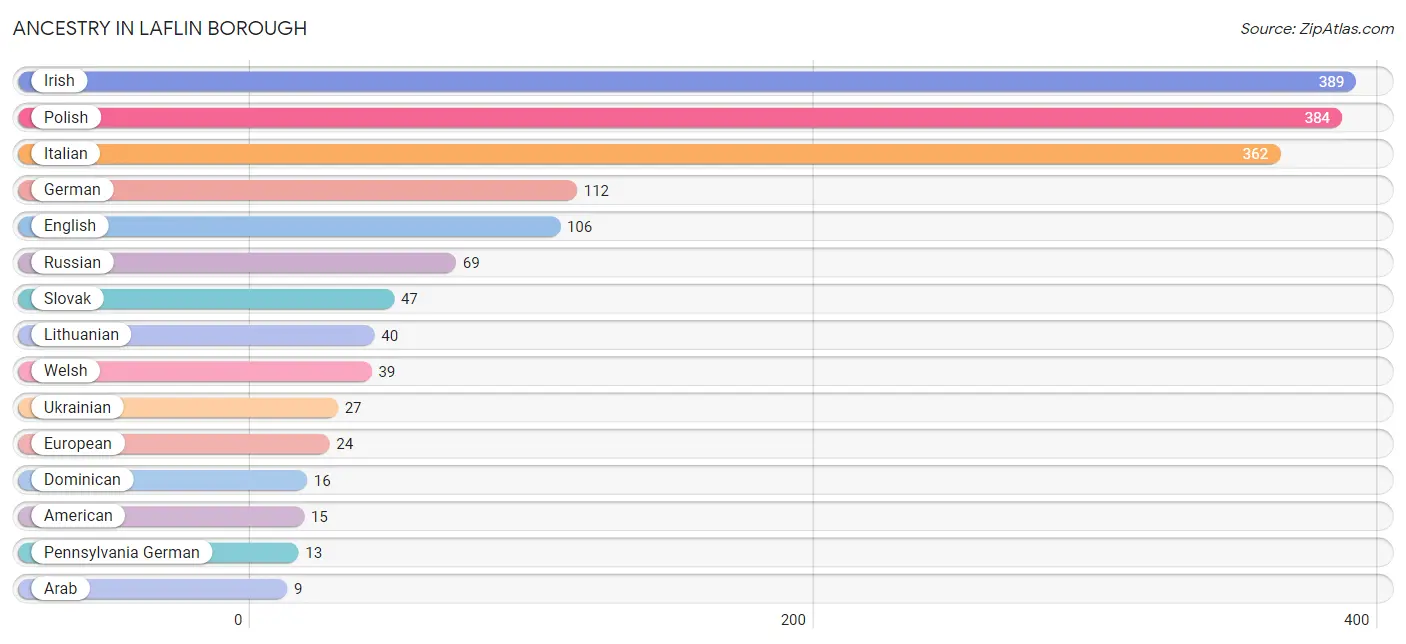
Ancestry in Laflin borough
The most populous ancestries reported in Laflin borough are Irish (389 | 27.3%), Polish (384 | 26.9%), Italian (362 | 25.4%), German (112 | 7.9%), and English (106 | 7.4%), together accounting for 94.8% of all Laflin borough residents.
| Ancestry | # Population | % Population |
| American | 15 | 1.1% |
| Arab | 9 | 0.6% |
| Brazilian | 7 | 0.5% |
| Burmese | 5 | 0.4% |
| Dominican | 16 | 1.1% |
| Dutch | 2 | 0.1% |
| Eastern European | 6 | 0.4% |
| English | 106 | 7.4% |
| European | 24 | 1.7% |
| French | 9 | 0.6% |
| German | 112 | 7.9% |
| Haitian | 1 | 0.1% |
| Irish | 389 | 27.3% |
| Italian | 362 | 25.4% |
| Lebanese | 9 | 0.6% |
| Lithuanian | 40 | 2.8% |
| Mexican | 4 | 0.3% |
| Pennsylvania German | 13 | 0.9% |
| Polish | 384 | 26.9% |
| Portuguese | 2 | 0.1% |
| Puerto Rican | 6 | 0.4% |
| Russian | 69 | 4.8% |
| Scotch-Irish | 3 | 0.2% |
| Scottish | 5 | 0.4% |
| Slavic | 3 | 0.2% |
| Slovak | 47 | 3.3% |
| Swedish | 3 | 0.2% |
| Syrian | 3 | 0.2% |
| Thai | 4 | 0.3% |
| Ukrainian | 27 | 1.9% |
| Welsh | 39 | 2.7% | View All 31 Rows |
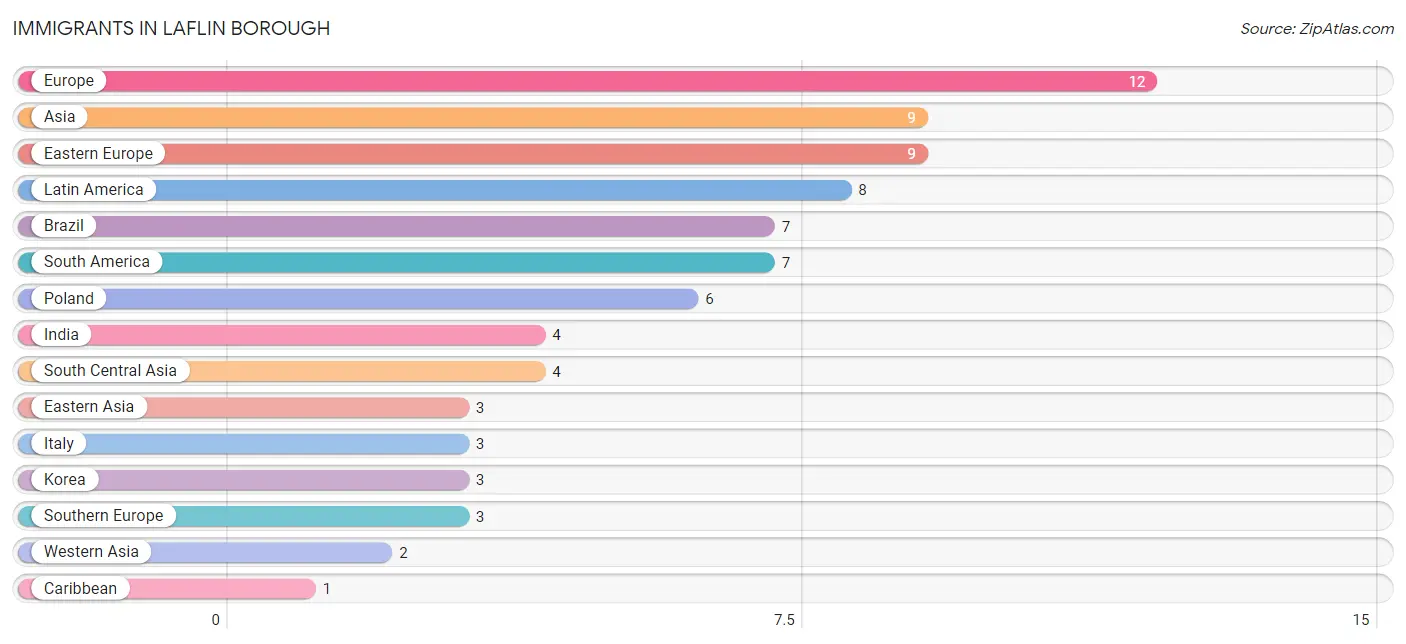
Immigrants in Laflin borough
The most numerous immigrant groups reported in Laflin borough came from Europe (12 | 0.8%), Asia (9 | 0.6%), Eastern Europe (9 | 0.6%), Latin America (8 | 0.6%), and Brazil (7 | 0.5%), together accounting for 3.2% of all Laflin borough residents.
| Immigration Origin | # Population | % Population |
| Asia | 9 | 0.6% |
| Brazil | 7 | 0.5% |
| Caribbean | 1 | 0.1% |
| Eastern Asia | 3 | 0.2% |
| Eastern Europe | 9 | 0.6% |
| Europe | 12 | 0.8% |
| Haiti | 1 | 0.1% |
| India | 4 | 0.3% |
| Italy | 3 | 0.2% |
| Korea | 3 | 0.2% |
| Latin America | 8 | 0.6% |
| Poland | 6 | 0.4% |
| South America | 7 | 0.5% |
| South Central Asia | 4 | 0.3% |
| Southern Europe | 3 | 0.2% |
| Western Asia | 2 | 0.1% | View All 16 Rows |
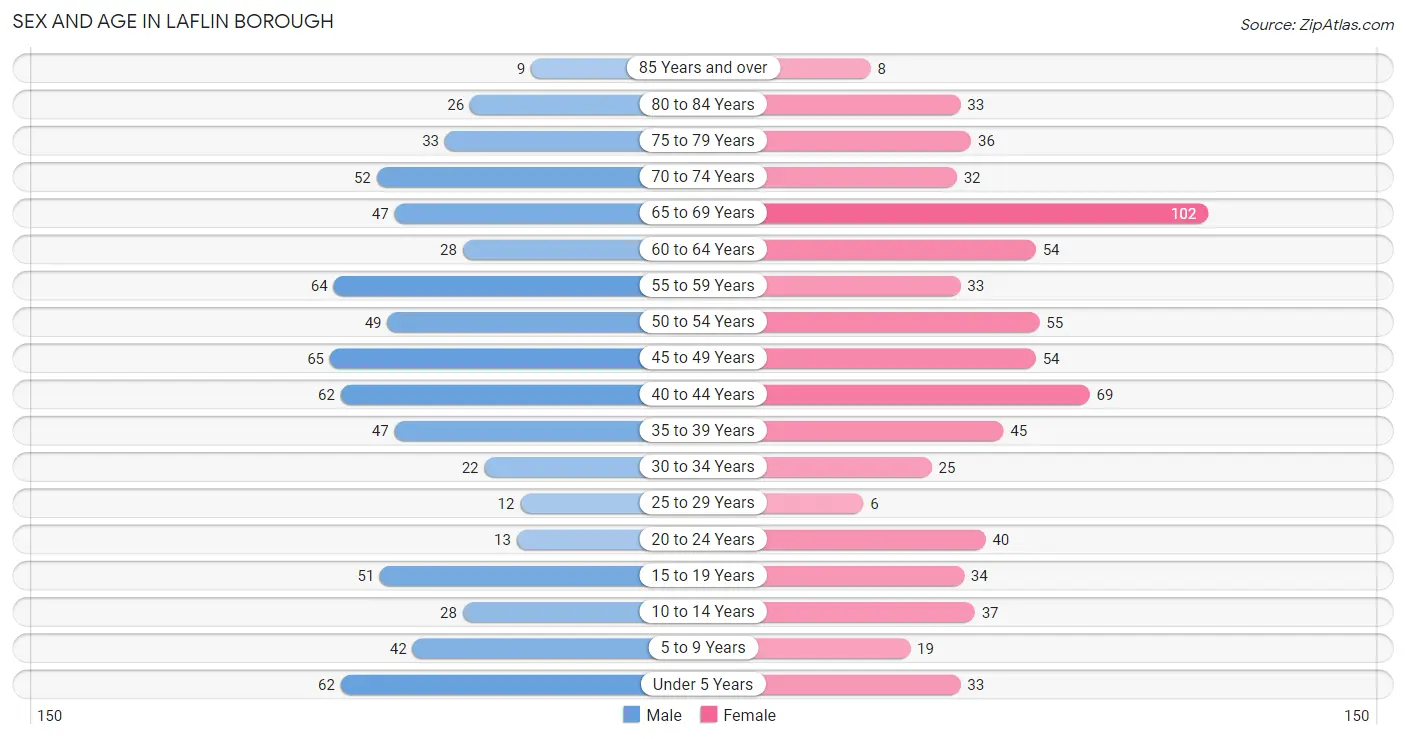
Sex and Age in Laflin borough
Sex and Age in Laflin borough
The most populous age groups in Laflin borough are 45 to 49 Years (65 | 9.1%) for men and 65 to 69 Years (102 | 14.3%) for women.
| Age Bracket | Male | Female |
| Under 5 Years | 62 (8.7%) | 33 (4.6%) |
| 5 to 9 Years | 42 (5.9%) | 19 (2.7%) |
| 10 to 14 Years | 28 (3.9%) | 37 (5.2%) |
| 15 to 19 Years | 51 (7.2%) | 34 (4.8%) |
| 20 to 24 Years | 13 (1.8%) | 40 (5.6%) |
| 25 to 29 Years | 12 (1.7%) | 6 (0.8%) |
| 30 to 34 Years | 22 (3.1%) | 25 (3.5%) |
| 35 to 39 Years | 47 (6.6%) | 45 (6.3%) |
| 40 to 44 Years | 62 (8.7%) | 69 (9.7%) |
| 45 to 49 Years | 65 (9.1%) | 54 (7.5%) |
| 50 to 54 Years | 49 (6.9%) | 55 (7.7%) |
| 55 to 59 Years | 64 (9.0%) | 33 (4.6%) |
| 60 to 64 Years | 28 (3.9%) | 54 (7.5%) |
| 65 to 69 Years | 47 (6.6%) | 102 (14.3%) |
| 70 to 74 Years | 52 (7.3%) | 32 (4.5%) |
| 75 to 79 Years | 33 (4.6%) | 36 (5.0%) |
| 80 to 84 Years | 26 (3.6%) | 33 (4.6%) |
| 85 Years and over | 9 (1.3%) | 8 (1.1%) |
| Total | 712 (100.0%) | 715 (100.0%) |
Families and Households in Laflin borough
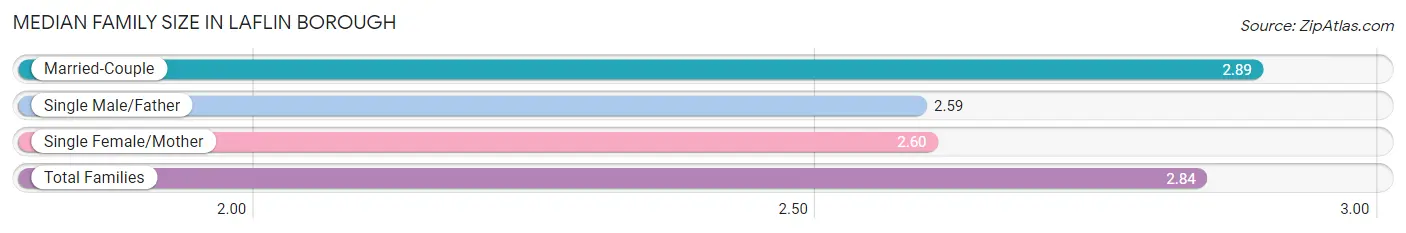
Median Family Size in Laflin borough
The median family size in Laflin borough is 2.84 persons per family, with married-couple families (371 | 83.0%) accounting for the largest median family size of 2.89 persons per family. On the other hand, single male/father families (34 | 7.6%) represent the smallest median family size with 2.59 persons per family.
| Family Type | # Families | Family Size |
| Married-Couple | 371 (83.0%) | 2.89 |
| Single Male/Father | 34 (7.6%) | 2.59 |
| Single Female/Mother | 42 (9.4%) | 2.60 |
| Total Families | 447 (100.0%) | 2.84 |
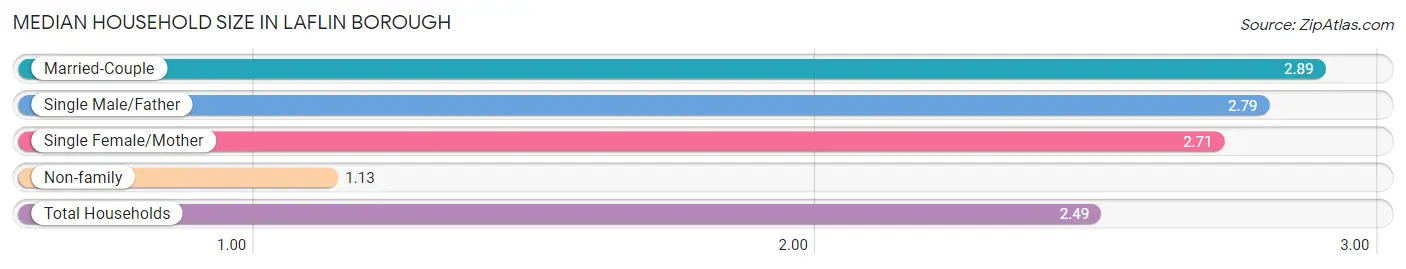
Median Household Size in Laflin borough
The median household size in Laflin borough is 2.49 persons per household, with married-couple households (371 | 65.1%) accounting for the largest median household size of 2.89 persons per household. non-family households (123 | 21.6%) represent the smallest median household size with 1.13 persons per household.
| Household Type | # Households | Household Size |
| Married-Couple | 371 (65.1%) | 2.89 |
| Single Male/Father | 34 (6.0%) | 2.79 |
| Single Female/Mother | 42 (7.4%) | 2.71 |
| Non-family | 123 (21.6%) | 1.13 |
| Total Households | 570 (100.0%) | 2.49 |
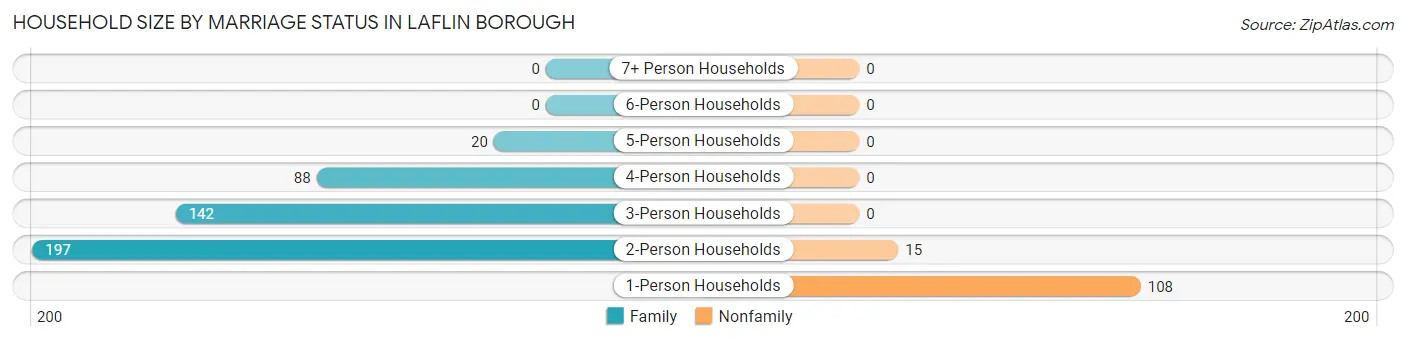
Household Size by Marriage Status in Laflin borough
Out of a total of 570 households in Laflin borough, 447 (78.4%) are family households, while 123 (21.6%) are nonfamily households. The most numerous type of family households are 2-person households, comprising 197, and the most common type of nonfamily households are 1-person households, comprising 108.
| Household Size | Family Households | Nonfamily Households |
| 1-Person Households | - | 108 (19.0%) |
| 2-Person Households | 197 (34.6%) | 15 (2.6%) |
| 3-Person Households | 142 (24.9%) | 0 (0.0%) |
| 4-Person Households | 88 (15.4%) | 0 (0.0%) |
| 5-Person Households | 20 (3.5%) | 0 (0.0%) |
| 6-Person Households | 0 (0.0%) | 0 (0.0%) |
| 7+ Person Households | 0 (0.0%) | 0 (0.0%) |
| Total | 447 (78.4%) | 123 (21.6%) |
Female Fertility in Laflin borough
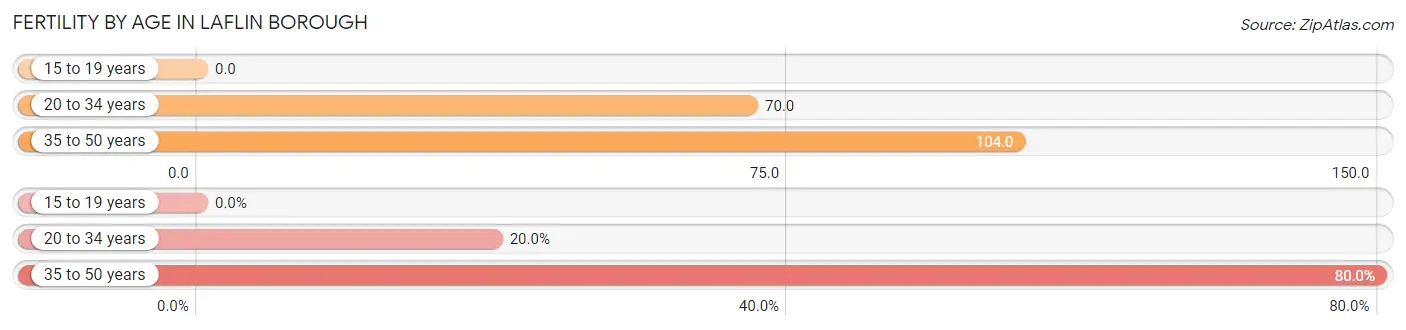
Fertility by Age in Laflin borough
Average fertility rate in Laflin borough is 84.0 births per 1,000 women. Women in the age bracket of 35 to 50 years have the highest fertility rate with 104.0 births per 1,000 women. Women in the age bracket of 35 to 50 years acount for 80.0% of all women with births.
| Age Bracket | Women with Births | Births / 1,000 Women |
| 15 to 19 years | 0 (0.0%) | 0.0 |
| 20 to 34 years | 5 (20.0%) | 70.0 |
| 35 to 50 years | 20 (80.0%) | 104.0 |
| Total | 25 (100.0%) | 84.0 |
Fertility by Age by Marriage Status in Laflin borough
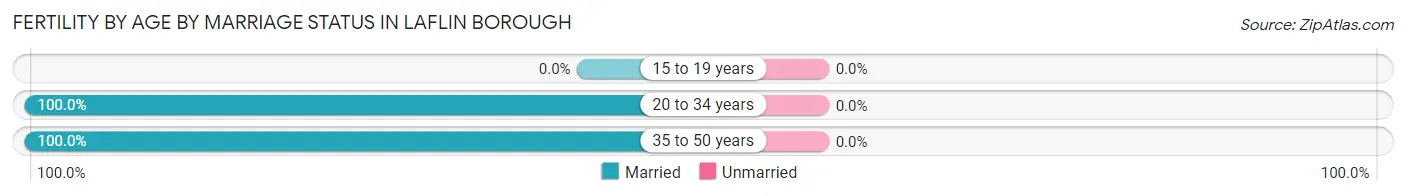
| Age Bracket | Married | Unmarried |
| 15 to 19 years | 0 (0.0%) | 0 (0.0%) |
| 20 to 34 years | 5 (100.0%) | 0 (0.0%) |
| 35 to 50 years | 20 (100.0%) | 0 (0.0%) |
| Total | 25 (100.0%) | 0 (0.0%) |
Fertility by Education in Laflin borough
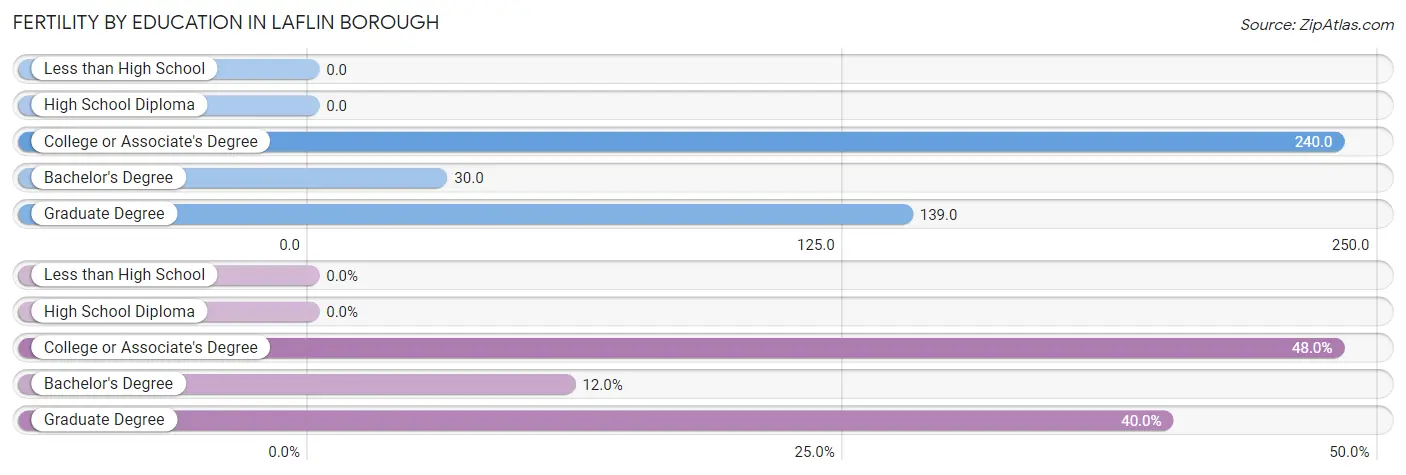
| Educational Attainment | Women with Births | Births / 1,000 Women |
| Less than High School | 0 (0.0%) | 0.0 |
| High School Diploma | 0 (0.0%) | 0.0 |
| College or Associate's Degree | 12 (48.0%) | 240.0 |
| Bachelor's Degree | 3 (12.0%) | 30.0 |
| Graduate Degree | 10 (40.0%) | 139.0 |
| Total | 25 (100.0%) | 84.0 |
Fertility by Education by Marriage Status in Laflin borough
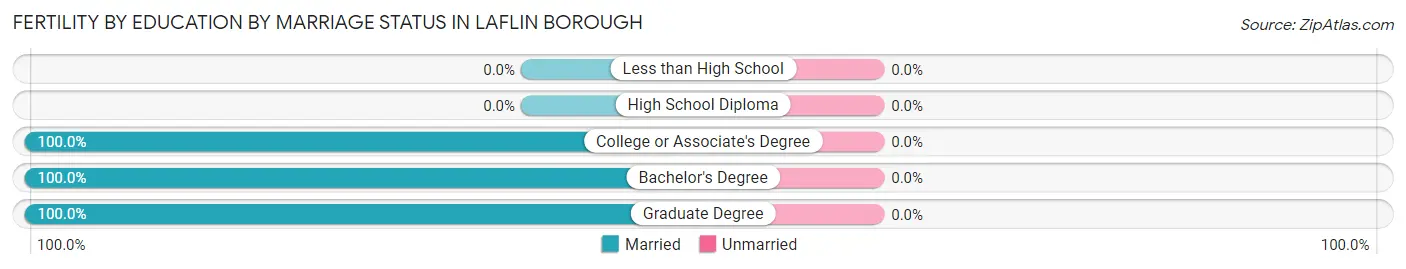
| Educational Attainment | Married | Unmarried |
| Less than High School | 0 (0.0%) | 0 (0.0%) |
| High School Diploma | 0 (0.0%) | 0 (0.0%) |
| College or Associate's Degree | 12 (100.0%) | 0 (0.0%) |
| Bachelor's Degree | 3 (100.0%) | 0 (0.0%) |
| Graduate Degree | 10 (100.0%) | 0 (0.0%) |
| Total | 25 (100.0%) | 0 (0.0%) |
Income in Laflin borough
Income Overview in Laflin borough
Per Capita Income in Laflin borough is $49,070, while median incomes of families and households are $119,063 and $104,286 respectively.
| Characteristic | Number | Measure |
| Per Capita Income | 1,427 | $49,070 |
| Median Family Income | 447 | $119,063 |
| Mean Family Income | 447 | $137,675 |
| Median Household Income | 570 | $104,286 |
| Mean Household Income | 570 | $122,476 |
| Income Deficit | 447 | $0 |
| Wage / Income Gap (%) | 1,427 | 17.30% |
| Wage / Income Gap ($) | 1,427 | 82.70¢ per $1 |
| Gini / Inequality Index | 1,427 | 0.37 |
Earnings by Sex in Laflin borough
Average Earnings in Laflin borough are $60,625, $66,250 for men and $54,792 for women, a difference of 17.3%.
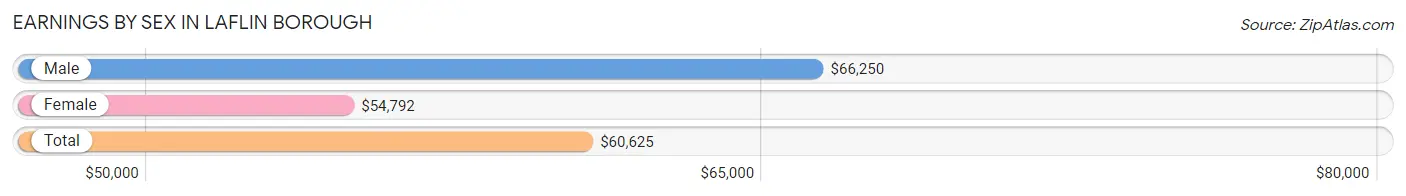
| Sex | Number | Average Earnings |
| Male | 394 (49.6%) | $66,250 |
| Female | 401 (50.4%) | $54,792 |
| Total | 795 (100.0%) | $60,625 |
Earnings by Sex by Income Bracket in Laflin borough
The most common earnings brackets in Laflin borough are $100,000+ for men (120 | 30.5%) and $100,000+ for women (64 | 16.0%).
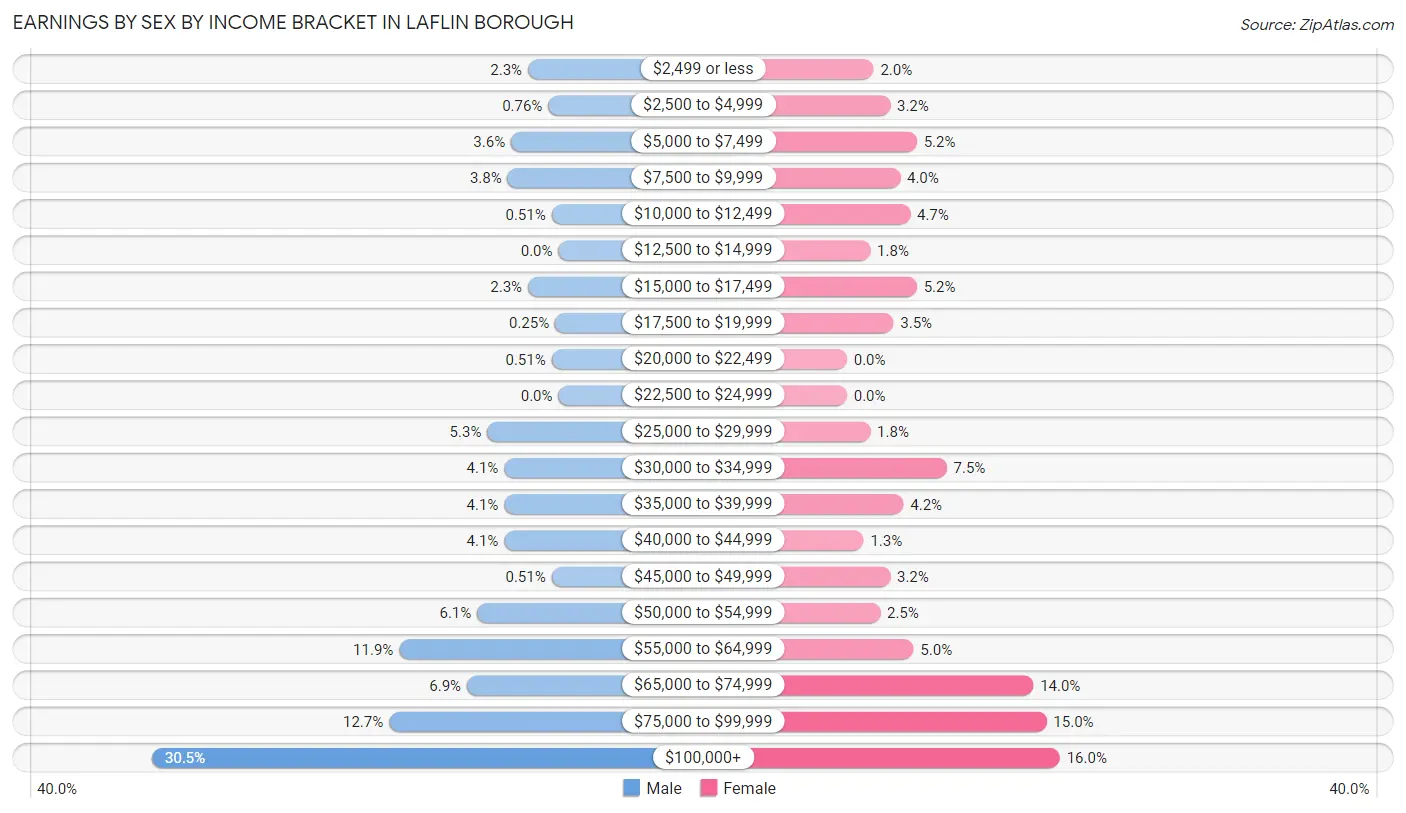
| Income | Male | Female |
| $2,499 or less | 9 (2.3%) | 8 (2.0%) |
| $2,500 to $4,999 | 3 (0.8%) | 13 (3.2%) |
| $5,000 to $7,499 | 14 (3.5%) | 21 (5.2%) |
| $7,500 to $9,999 | 15 (3.8%) | 16 (4.0%) |
| $10,000 to $12,499 | 2 (0.5%) | 19 (4.7%) |
| $12,500 to $14,999 | 0 (0.0%) | 7 (1.8%) |
| $15,000 to $17,499 | 9 (2.3%) | 21 (5.2%) |
| $17,500 to $19,999 | 1 (0.3%) | 14 (3.5%) |
| $20,000 to $22,499 | 2 (0.5%) | 0 (0.0%) |
| $22,500 to $24,999 | 0 (0.0%) | 0 (0.0%) |
| $25,000 to $29,999 | 21 (5.3%) | 7 (1.8%) |
| $30,000 to $34,999 | 16 (4.1%) | 30 (7.5%) |
| $35,000 to $39,999 | 16 (4.1%) | 17 (4.2%) |
| $40,000 to $44,999 | 16 (4.1%) | 5 (1.3%) |
| $45,000 to $49,999 | 2 (0.5%) | 13 (3.2%) |
| $50,000 to $54,999 | 24 (6.1%) | 10 (2.5%) |
| $55,000 to $64,999 | 47 (11.9%) | 20 (5.0%) |
| $65,000 to $74,999 | 27 (6.9%) | 56 (14.0%) |
| $75,000 to $99,999 | 50 (12.7%) | 60 (15.0%) |
| $100,000+ | 120 (30.5%) | 64 (16.0%) |
| Total | 394 (100.0%) | 401 (100.0%) |
Earnings by Sex by Educational Attainment in Laflin borough
Average earnings in Laflin borough are $68,988 for men and $65,486 for women, a difference of 5.1%. Men with an educational attainment of graduate degree enjoy the highest average annual earnings of $102,857, while those with college or associate's degree education earn the least with $51,833. Women with an educational attainment of graduate degree earn the most with the average annual earnings of $85,000, while those with less than high school education have the smallest earnings of $13,438.
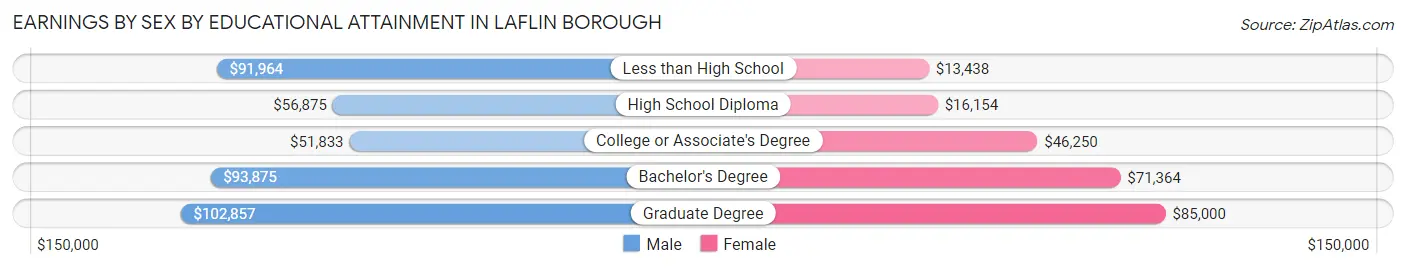
| Educational Attainment | Male Income | Female Income |
| Less than High School | $91,964 | $13,438 |
| High School Diploma | $56,875 | $16,154 |
| College or Associate's Degree | $51,833 | $46,250 |
| Bachelor's Degree | $93,875 | $71,364 |
| Graduate Degree | $102,857 | $85,000 |
| Total | $68,988 | $65,486 |
Family Income in Laflin borough
Family Income Brackets in Laflin borough
According to the Laflin borough family income data, there are 141 families falling into the $100,000 to $149,999 income range, which is the most common income bracket and makes up 31.5% of all families.
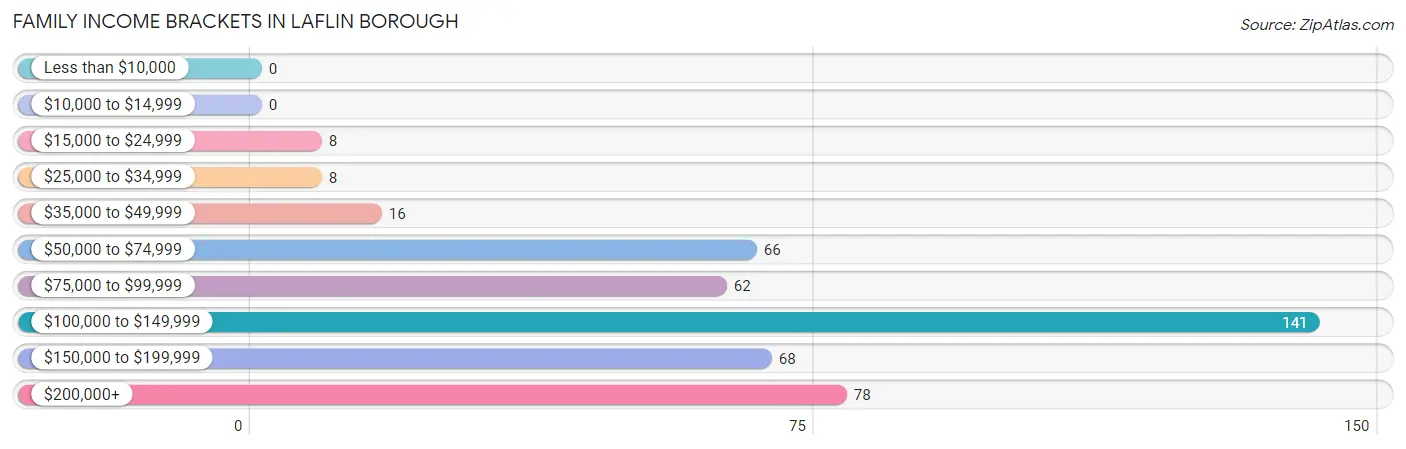
| Income Bracket | # Families | % Families |
| Less than $10,000 | 0 | 0.0% |
| $10,000 to $14,999 | 0 | 0.0% |
| $15,000 to $24,999 | 8 | 1.8% |
| $25,000 to $34,999 | 8 | 1.8% |
| $35,000 to $49,999 | 16 | 3.6% |
| $50,000 to $74,999 | 66 | 14.8% |
| $75,000 to $99,999 | 62 | 13.9% |
| $100,000 to $149,999 | 141 | 31.5% |
| $150,000 to $199,999 | 68 | 15.2% |
| $200,000+ | 78 | 17.4% |
Family Income by Famaliy Size in Laflin borough
4-person families (83 | 18.6%) account for the highest median family income in Laflin borough with $168,875 per family, while 3-person families (139 | 31.1%) have the highest median income of $44,583 per family member.
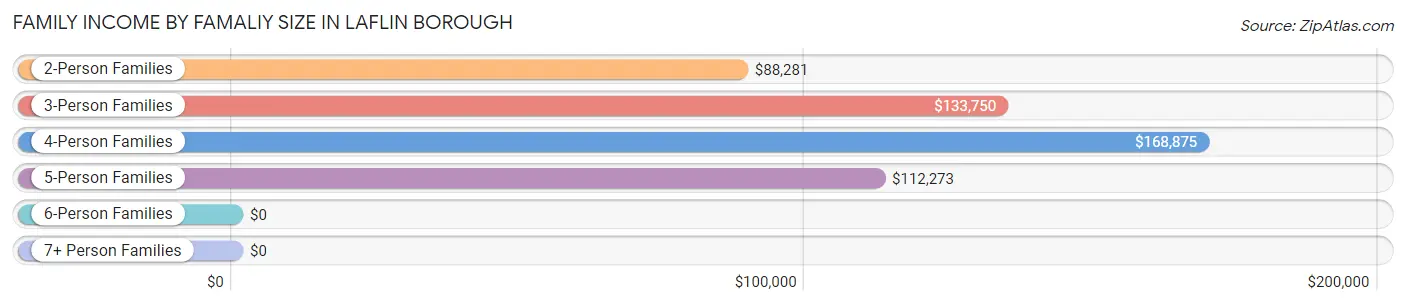
| Income Bracket | # Families | Median Income |
| 2-Person Families | 205 (45.9%) | $88,281 |
| 3-Person Families | 139 (31.1%) | $133,750 |
| 4-Person Families | 83 (18.6%) | $168,875 |
| 5-Person Families | 20 (4.5%) | $112,273 |
| 6-Person Families | 0 (0.0%) | $0 |
| 7+ Person Families | 0 (0.0%) | $0 |
| Total | 447 (100.0%) | $119,063 |
Family Income by Number of Earners in Laflin borough
The median family income in Laflin borough is $119,063, with families comprising 3+ earners (64) having the highest median family income of $162,000, while families with no earners (58) have the lowest median family income of $64,167, accounting for 14.3% and 13.0% of families, respectively.
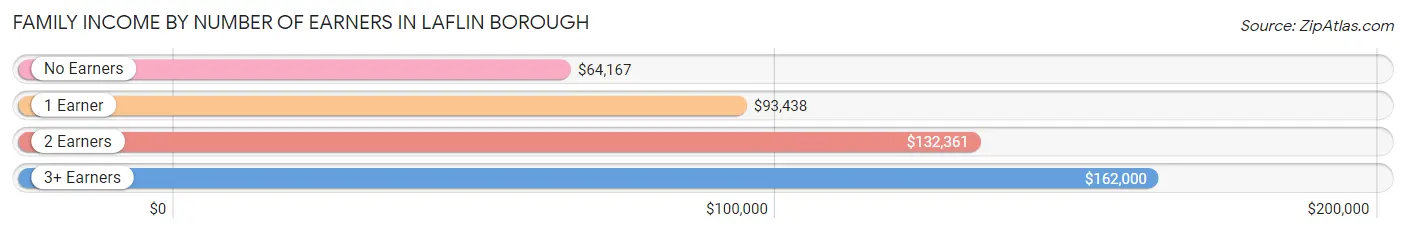
| Number of Earners | # Families | Median Income |
| No Earners | 58 (13.0%) | $64,167 |
| 1 Earner | 133 (29.7%) | $93,438 |
| 2 Earners | 192 (42.9%) | $132,361 |
| 3+ Earners | 64 (14.3%) | $162,000 |
| Total | 447 (100.0%) | $119,063 |
Household Income in Laflin borough
Household Income Brackets in Laflin borough
With 148 households falling in the category, the $100,000 to $149,999 income range is the most frequent in Laflin borough, accounting for 26.0% of all households.
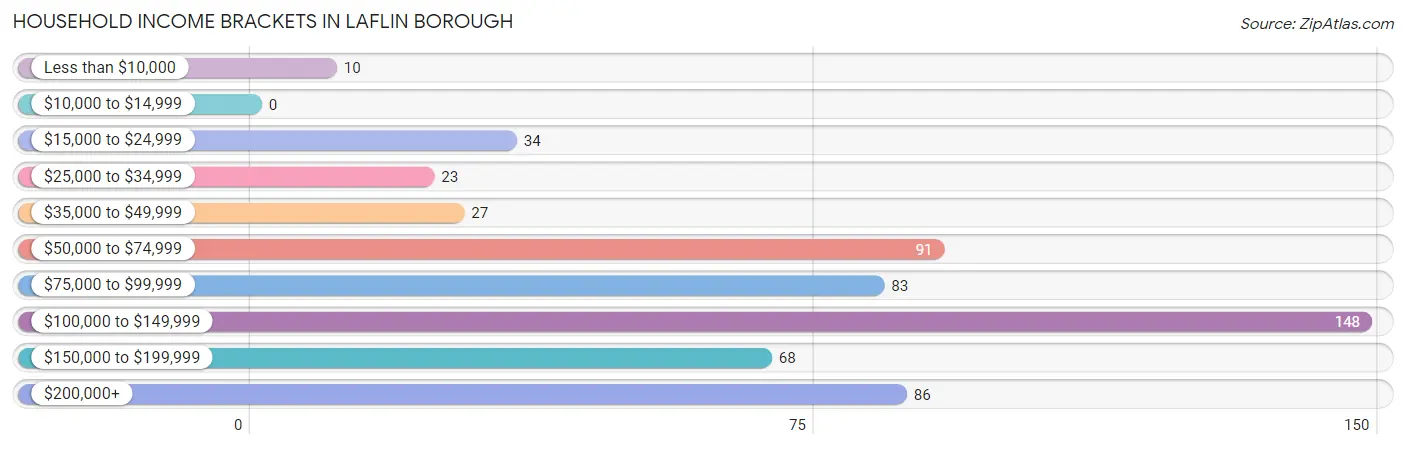
| Income Bracket | # Households | % Households |
| Less than $10,000 | 10 | 1.8% |
| $10,000 to $14,999 | 0 | 0.0% |
| $15,000 to $24,999 | 34 | 6.0% |
| $25,000 to $34,999 | 23 | 4.0% |
| $35,000 to $49,999 | 27 | 4.7% |
| $50,000 to $74,999 | 91 | 16.0% |
| $75,000 to $99,999 | 83 | 14.6% |
| $100,000 to $149,999 | 148 | 26.0% |
| $150,000 to $199,999 | 68 | 11.9% |
| $200,000+ | 86 | 15.1% |
Household Income by Householder Age in Laflin borough
The median household income in Laflin borough is $104,286, with the highest median household income of $138,636 found in the 45 to 64 years age bracket for the primary householder. A total of 222 households (39.0%) fall into this category.
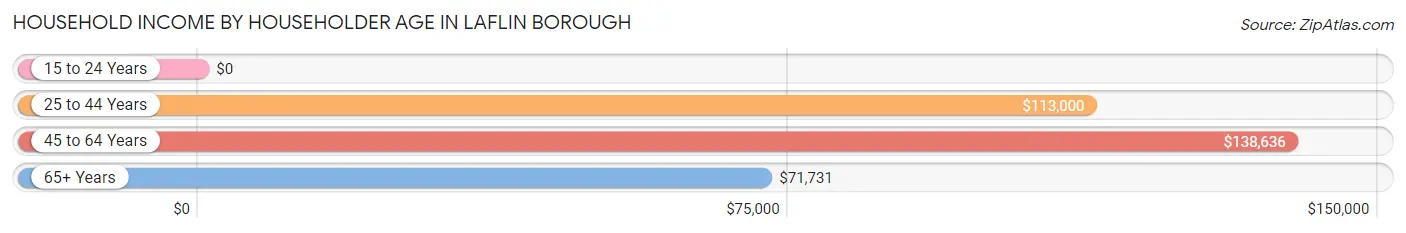
| Income Bracket | # Households | Median Income |
| 15 to 24 Years | 0 (0.0%) | $0 |
| 25 to 44 Years | 128 (22.5%) | $113,000 |
| 45 to 64 Years | 222 (39.0%) | $138,636 |
| 65+ Years | 220 (38.6%) | $71,731 |
| Total | 570 (100.0%) | $104,286 |
Poverty in Laflin borough
Income Below Poverty by Sex and Age in Laflin borough
With 2.8% poverty level for males and 1.4% for females among the residents of Laflin borough, 55 to 64 year old males and 75 year old and over females are the most vulnerable to poverty, with 11 males (12.0%) and 7 females (9.1%) in their respective age groups living below the poverty level.
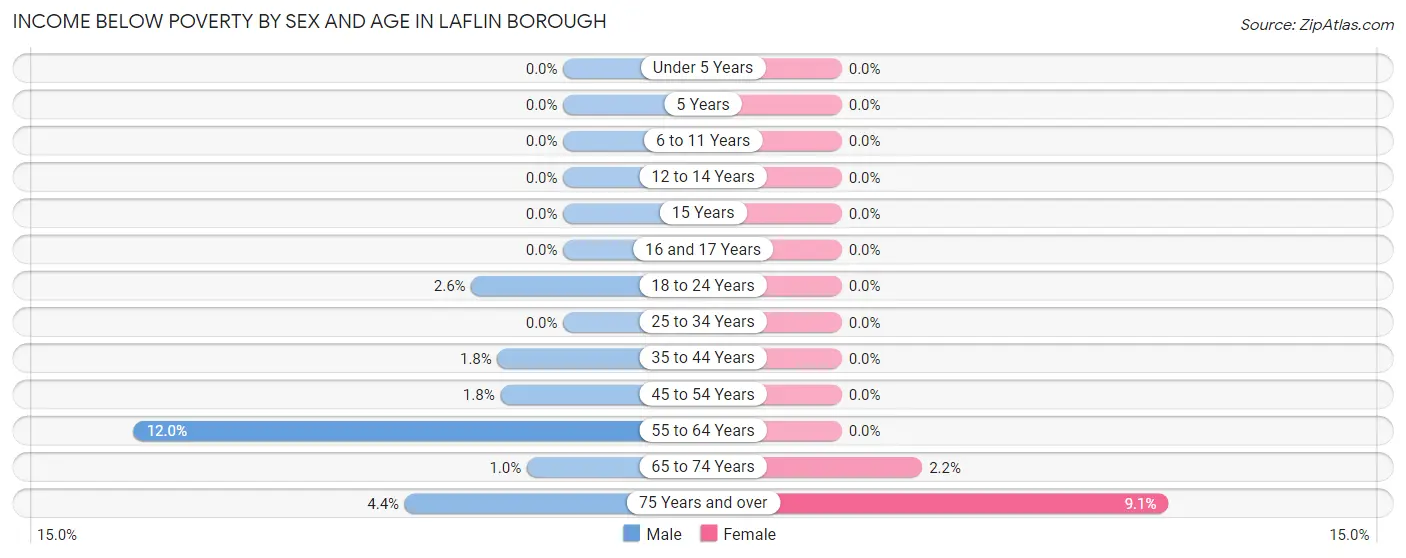
| Age Bracket | Male | Female |
| Under 5 Years | 0 (0.0%) | 0 (0.0%) |
| 5 Years | 0 (0.0%) | 0 (0.0%) |
| 6 to 11 Years | 0 (0.0%) | 0 (0.0%) |
| 12 to 14 Years | 0 (0.0%) | 0 (0.0%) |
| 15 Years | 0 (0.0%) | 0 (0.0%) |
| 16 and 17 Years | 0 (0.0%) | 0 (0.0%) |
| 18 to 24 Years | 1 (2.6%) | 0 (0.0%) |
| 25 to 34 Years | 0 (0.0%) | 0 (0.0%) |
| 35 to 44 Years | 2 (1.8%) | 0 (0.0%) |
| 45 to 54 Years | 2 (1.8%) | 0 (0.0%) |
| 55 to 64 Years | 11 (12.0%) | 0 (0.0%) |
| 65 to 74 Years | 1 (1.0%) | 3 (2.2%) |
| 75 Years and over | 3 (4.4%) | 7 (9.1%) |
| Total | 20 (2.8%) | 10 (1.4%) |
Income Above Poverty by Sex and Age in Laflin borough
According to the poverty statistics in Laflin borough, males aged under 5 years and females aged under 5 years are the age groups that are most secure financially, with 100.0% of males and 100.0% of females in these age groups living above the poverty line.
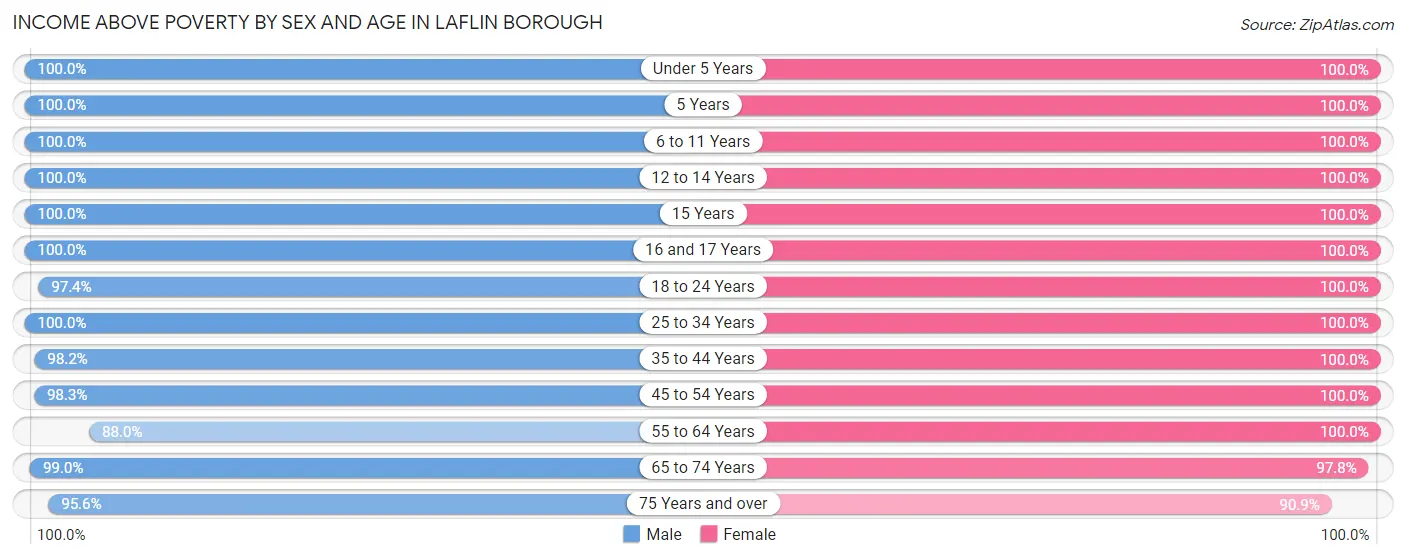
| Age Bracket | Male | Female |
| Under 5 Years | 62 (100.0%) | 33 (100.0%) |
| 5 Years | 14 (100.0%) | 7 (100.0%) |
| 6 to 11 Years | 48 (100.0%) | 30 (100.0%) |
| 12 to 14 Years | 8 (100.0%) | 19 (100.0%) |
| 15 Years | 17 (100.0%) | 4 (100.0%) |
| 16 and 17 Years | 8 (100.0%) | 22 (100.0%) |
| 18 to 24 Years | 38 (97.4%) | 48 (100.0%) |
| 25 to 34 Years | 34 (100.0%) | 31 (100.0%) |
| 35 to 44 Years | 107 (98.2%) | 114 (100.0%) |
| 45 to 54 Years | 112 (98.3%) | 109 (100.0%) |
| 55 to 64 Years | 81 (88.0%) | 87 (100.0%) |
| 65 to 74 Years | 98 (99.0%) | 131 (97.8%) |
| 75 Years and over | 65 (95.6%) | 70 (90.9%) |
| Total | 692 (97.2%) | 705 (98.6%) |
Income Below Poverty Among Married-Couple Families in Laflin borough
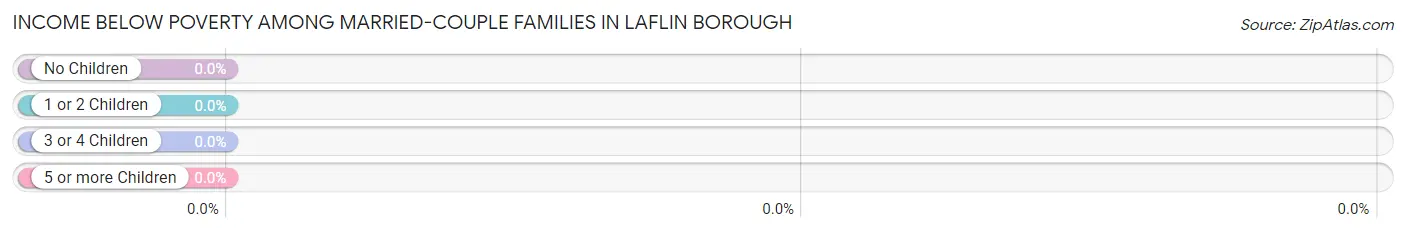
| Children | Above Poverty | Below Poverty |
| No Children | 224 (100.0%) | 0 (0.0%) |
| 1 or 2 Children | 135 (100.0%) | 0 (0.0%) |
| 3 or 4 Children | 12 (100.0%) | 0 (0.0%) |
| 5 or more Children | 0 (0.0%) | 0 (0.0%) |
| Total | 371 (100.0%) | 0 (0.0%) |
Income Below Poverty Among Single-Parent Households in Laflin borough
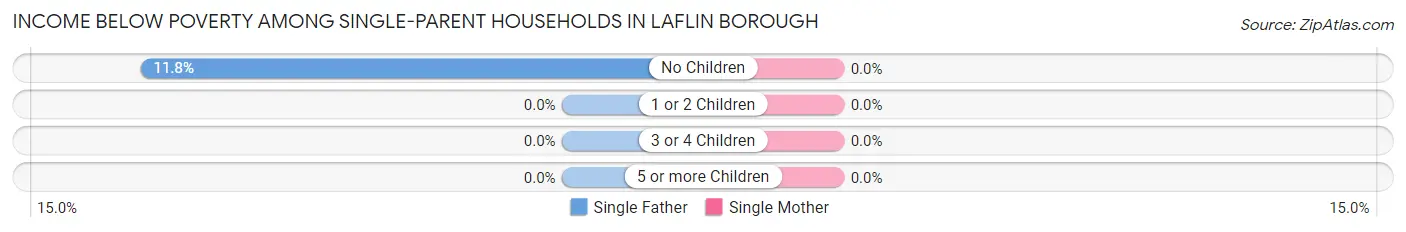
| Children | Single Father | Single Mother |
| No Children | 2 (11.8%) | 0 (0.0%) |
| 1 or 2 Children | 0 (0.0%) | 0 (0.0%) |
| 3 or 4 Children | 0 (0.0%) | 0 (0.0%) |
| 5 or more Children | 0 (0.0%) | 0 (0.0%) |
| Total | 2 (5.9%) | 0 (0.0%) |
Income Below Poverty Among Married-Couple vs Single-Parent Households in Laflin borough
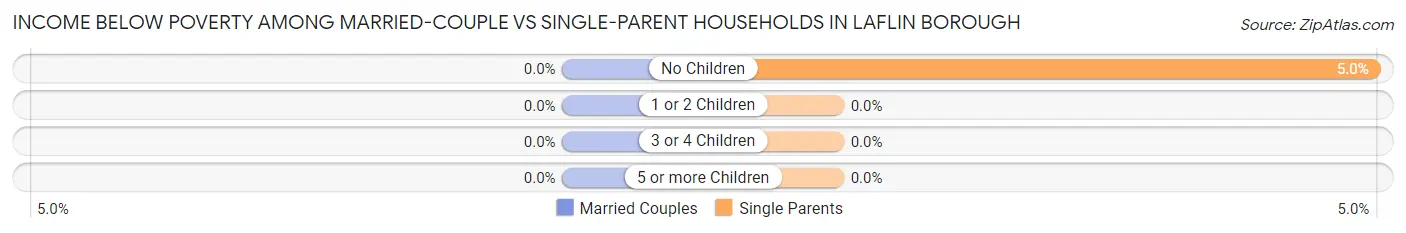
| Children | Married-Couple Families | Single-Parent Households |
| No Children | 0 (0.0%) | 2 (5.0%) |
| 1 or 2 Children | 0 (0.0%) | 0 (0.0%) |
| 3 or 4 Children | 0 (0.0%) | 0 (0.0%) |
| 5 or more Children | 0 (0.0%) | 0 (0.0%) |
| Total | 0 (0.0%) | 2 (2.6%) |
Employment Characteristics in Laflin borough
Employment by Class of Employer in Laflin borough
Among the 732 employed individuals in Laflin borough, private company employees (399 | 54.5%), not-for-profit organizations (137 | 18.7%), and local government employees (51 | 7.0%) make up the most common classes of employment.
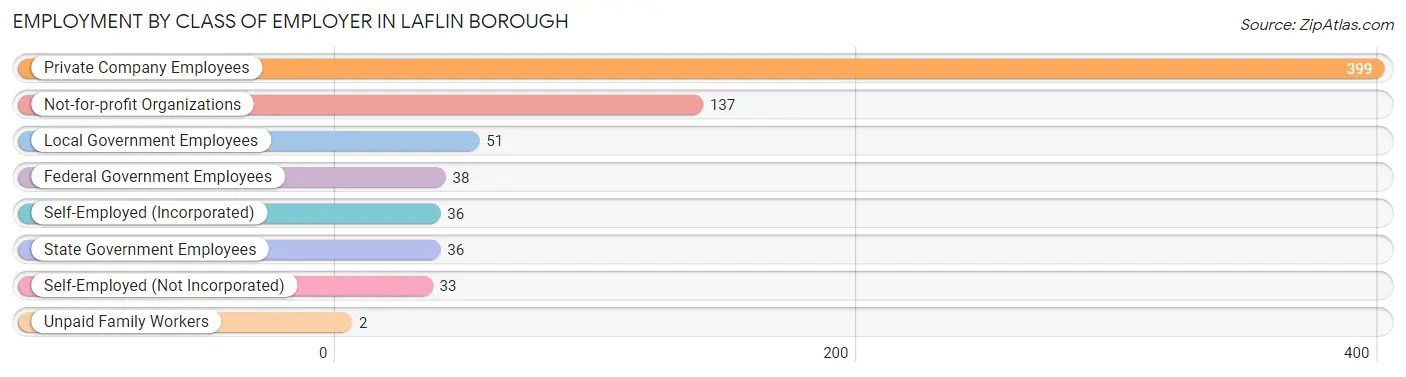
| Employer Class | # Employees | % Employees |
| Private Company Employees | 399 | 54.5% |
| Self-Employed (Incorporated) | 36 | 4.9% |
| Self-Employed (Not Incorporated) | 33 | 4.5% |
| Not-for-profit Organizations | 137 | 18.7% |
| Local Government Employees | 51 | 7.0% |
| State Government Employees | 36 | 4.9% |
| Federal Government Employees | 38 | 5.2% |
| Unpaid Family Workers | 2 | 0.3% |
| Total | 732 | 100.0% |
Employment Status by Age in Laflin borough
According to the labor force statistics for Laflin borough, out of the total population over 16 years of age (1,185), 65.1% or 771 individuals are in the labor force, with 4.7% or 36 of them unemployed. The age group with the highest labor force participation rate is 45 to 54 years, with 98.2% or 219 individuals in the labor force. Within the labor force, the 16 to 19 years age range has the highest percentage of unemployed individuals, with 34.5% or 10 of them being unemployed.
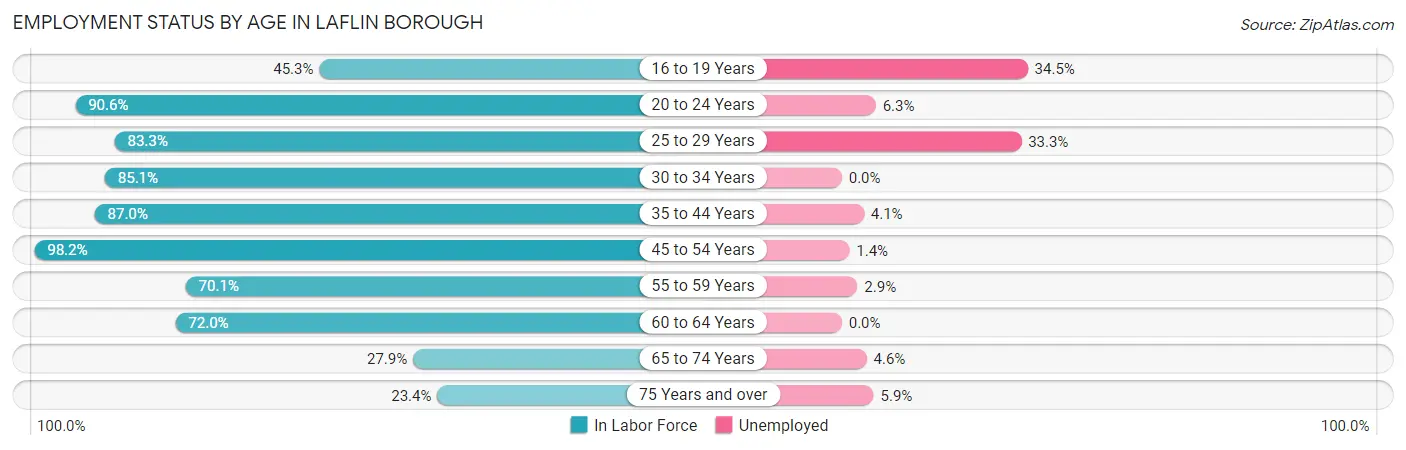
| Age Bracket | In Labor Force | Unemployed |
| 16 to 19 Years | 29 (45.3%) | 10 (34.5%) |
| 20 to 24 Years | 48 (90.6%) | 3 (6.3%) |
| 25 to 29 Years | 15 (83.3%) | 5 (33.3%) |
| 30 to 34 Years | 40 (85.1%) | 0 (0.0%) |
| 35 to 44 Years | 194 (87.0%) | 8 (4.1%) |
| 45 to 54 Years | 219 (98.2%) | 3 (1.4%) |
| 55 to 59 Years | 68 (70.1%) | 2 (2.9%) |
| 60 to 64 Years | 59 (72.0%) | 0 (0.0%) |
| 65 to 74 Years | 65 (27.9%) | 3 (4.6%) |
| 75 Years and over | 34 (23.4%) | 2 (5.9%) |
| Total | 771 (65.1%) | 36 (4.7%) |
Employment Status by Educational Attainment in Laflin borough
According to labor force statistics for Laflin borough, 86.2% of individuals (595) out of the total population between 25 and 64 years of age (690) are in the labor force, with 3.0% or 18 of them being unemployed. The group with the highest labor force participation rate are those with the educational attainment of bachelor's degree or higher, with 90.0% or 333 individuals in the labor force. Within the labor force, individuals with college / associate degree education have the highest percentage of unemployment, with 9.1% or 13 of them being unemployed.
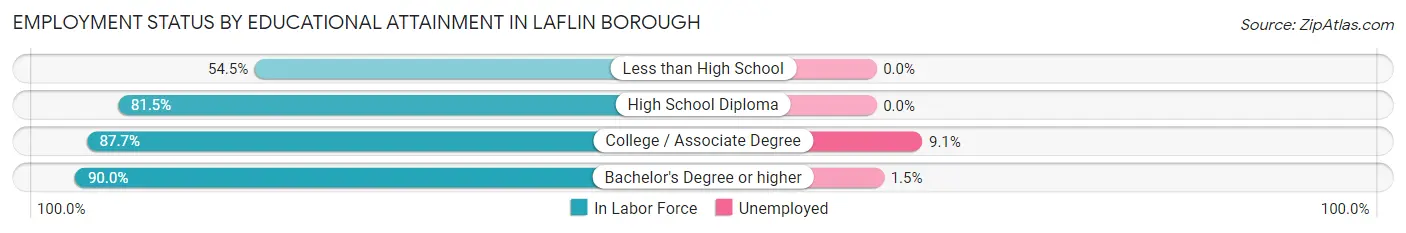
| Educational Attainment | In Labor Force | Unemployed |
| Less than High School | 18 (54.5%) | 0 (0.0%) |
| High School Diploma | 101 (81.5%) | 0 (0.0%) |
| College / Associate Degree | 143 (87.7%) | 15 (9.1%) |
| Bachelor's Degree or higher | 333 (90.0%) | 6 (1.5%) |
| Total | 595 (86.2%) | 21 (3.0%) |
Employment Occupations by Sex in Laflin borough
Management, Business, Science and Arts Occupations
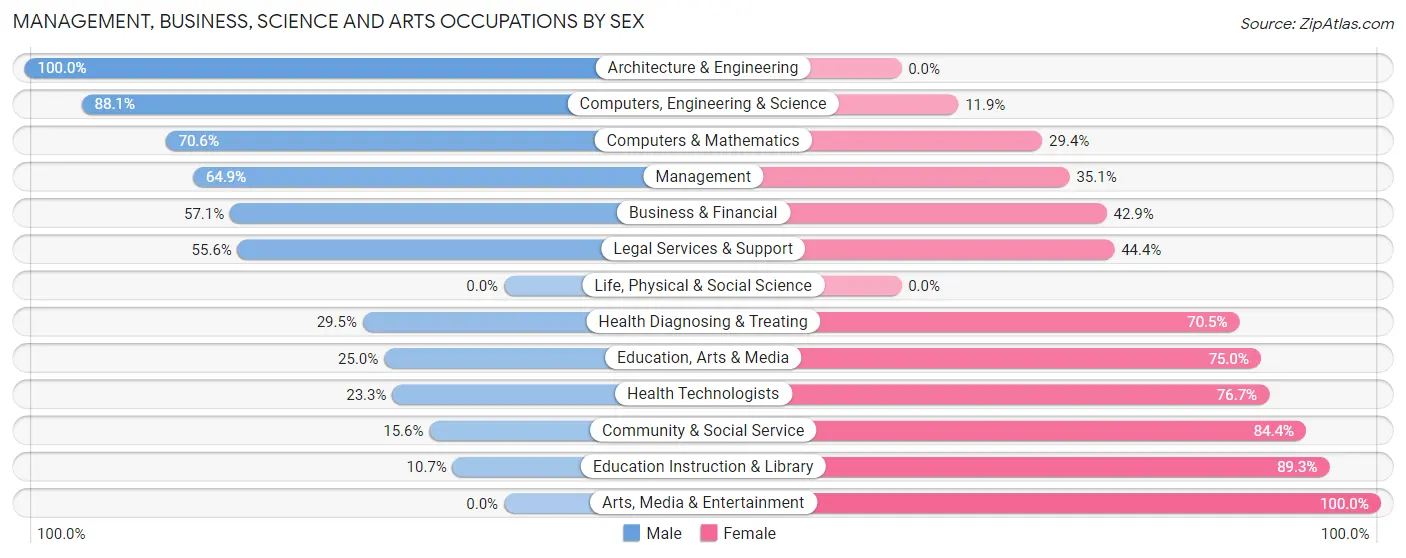
The most common Management, Business, Science and Arts occupations in Laflin borough are Health Diagnosing & Treating (129 | 17.5%), Health Technologists (103 | 14.0%), Management (94 | 12.8%), Community & Social Service (77 | 10.5%), and Education Instruction & Library (56 | 7.6%).
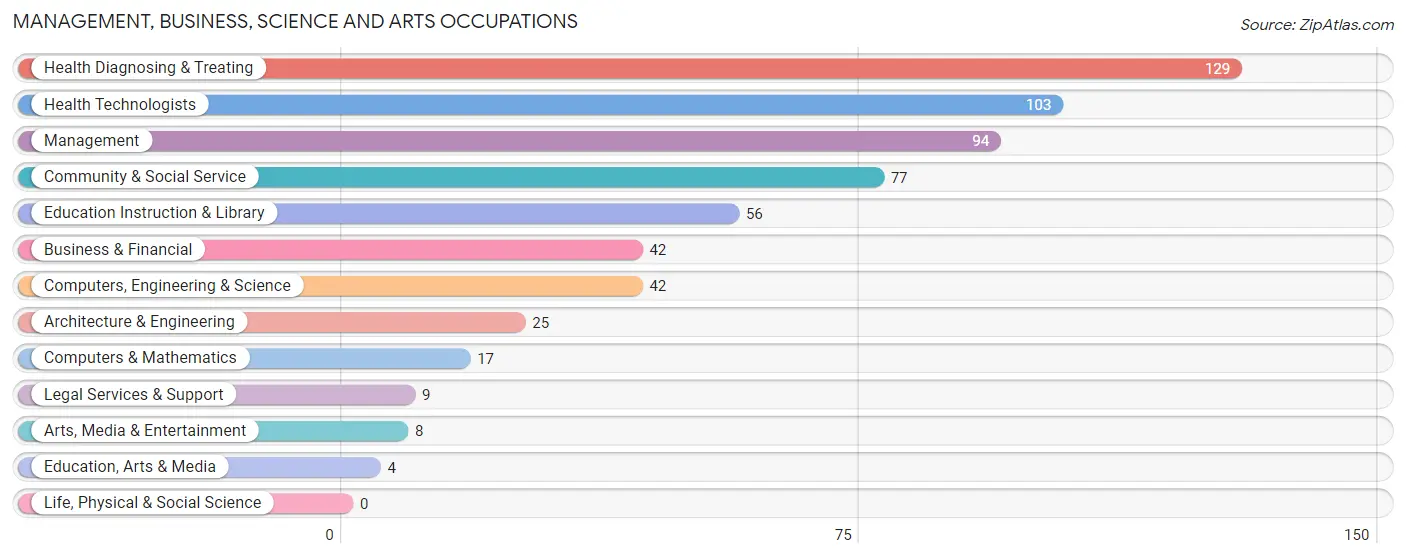
Management, Business, Science and Arts Occupations by Sex
Within the Management, Business, Science and Arts occupations in Laflin borough, the most male-oriented occupations are Architecture & Engineering (100.0%), Computers, Engineering & Science (88.1%), and Computers & Mathematics (70.6%), while the most female-oriented occupations are Arts, Media & Entertainment (100.0%), Education Instruction & Library (89.3%), and Community & Social Service (84.4%).
| Occupation | Male | Female |
| Management | 61 (64.9%) | 33 (35.1%) |
| Business & Financial | 24 (57.1%) | 18 (42.9%) |
| Computers, Engineering & Science | 37 (88.1%) | 5 (11.9%) |
| Computers & Mathematics | 12 (70.6%) | 5 (29.4%) |
| Architecture & Engineering | 25 (100.0%) | 0 (0.0%) |
| Life, Physical & Social Science | 0 (0.0%) | 0 (0.0%) |
| Community & Social Service | 12 (15.6%) | 65 (84.4%) |
| Education, Arts & Media | 1 (25.0%) | 3 (75.0%) |
| Legal Services & Support | 5 (55.6%) | 4 (44.4%) |
| Education Instruction & Library | 6 (10.7%) | 50 (89.3%) |
| Arts, Media & Entertainment | 0 (0.0%) | 8 (100.0%) |
| Health Diagnosing & Treating | 38 (29.5%) | 91 (70.5%) |
| Health Technologists | 24 (23.3%) | 79 (76.7%) |
| Total (Category) | 172 (44.8%) | 212 (55.2%) |
| Total (Overall) | 354 (48.2%) | 381 (51.8%) |
Services Occupations
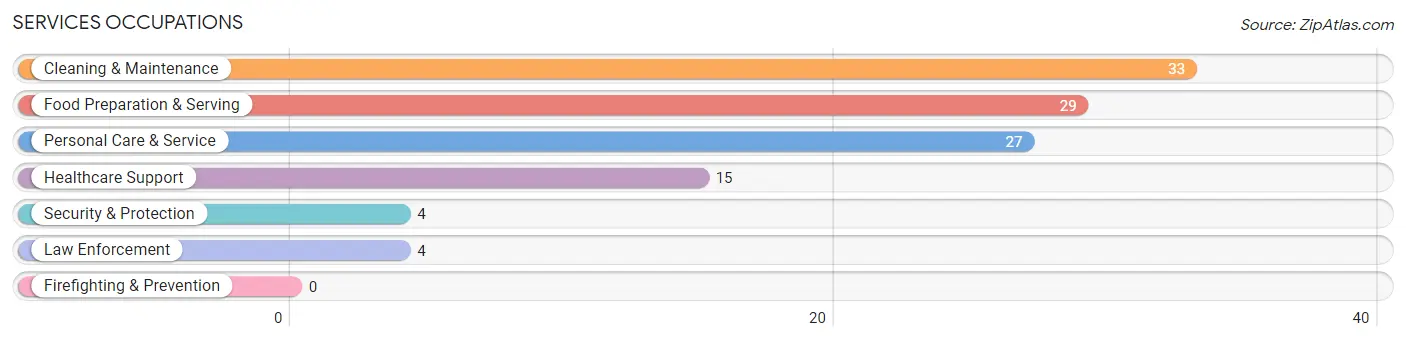
The most common Services occupations in Laflin borough are Cleaning & Maintenance (33 | 4.5%), Food Preparation & Serving (29 | 4.0%), Personal Care & Service (27 | 3.7%), Healthcare Support (15 | 2.0%), and Security & Protection (4 | 0.5%).
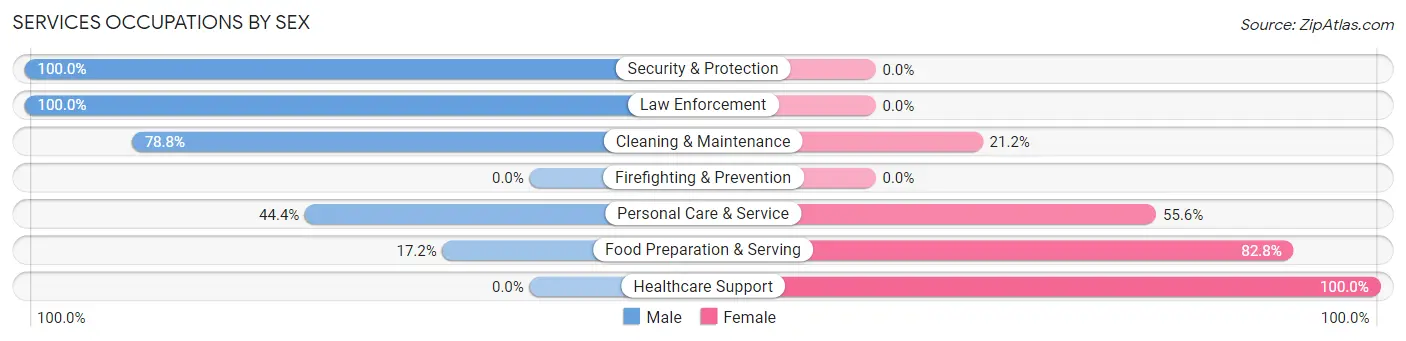
Services Occupations by Sex
Within the Services occupations in Laflin borough, the most male-oriented occupations are Security & Protection (100.0%), Law Enforcement (100.0%), and Cleaning & Maintenance (78.8%), while the most female-oriented occupations are Healthcare Support (100.0%), Food Preparation & Serving (82.8%), and Personal Care & Service (55.6%).
| Occupation | Male | Female |
| Healthcare Support | 0 (0.0%) | 15 (100.0%) |
| Security & Protection | 4 (100.0%) | 0 (0.0%) |
| Firefighting & Prevention | 0 (0.0%) | 0 (0.0%) |
| Law Enforcement | 4 (100.0%) | 0 (0.0%) |
| Food Preparation & Serving | 5 (17.2%) | 24 (82.8%) |
| Cleaning & Maintenance | 26 (78.8%) | 7 (21.2%) |
| Personal Care & Service | 12 (44.4%) | 15 (55.6%) |
| Total (Category) | 47 (43.5%) | 61 (56.5%) |
| Total (Overall) | 354 (48.2%) | 381 (51.8%) |
Sales and Office Occupations
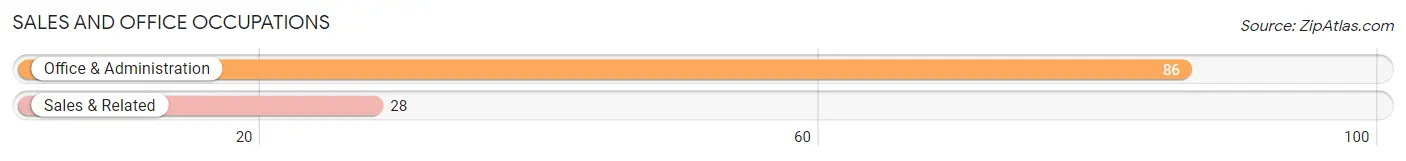
The most common Sales and Office occupations in Laflin borough are Office & Administration (86 | 11.7%), and Sales & Related (28 | 3.8%).
Sales and Office Occupations by Sex
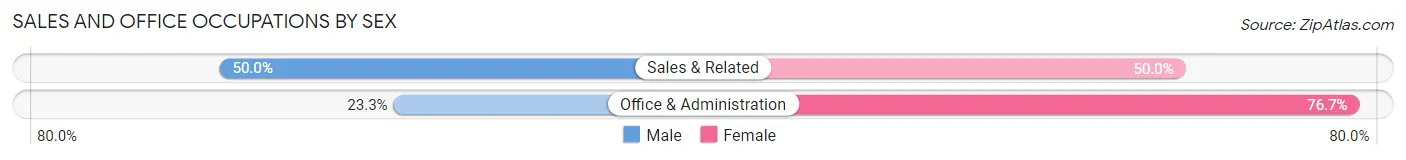
| Occupation | Male | Female |
| Sales & Related | 14 (50.0%) | 14 (50.0%) |
| Office & Administration | 20 (23.3%) | 66 (76.7%) |
| Total (Category) | 34 (29.8%) | 80 (70.2%) |
| Total (Overall) | 354 (48.2%) | 381 (51.8%) |
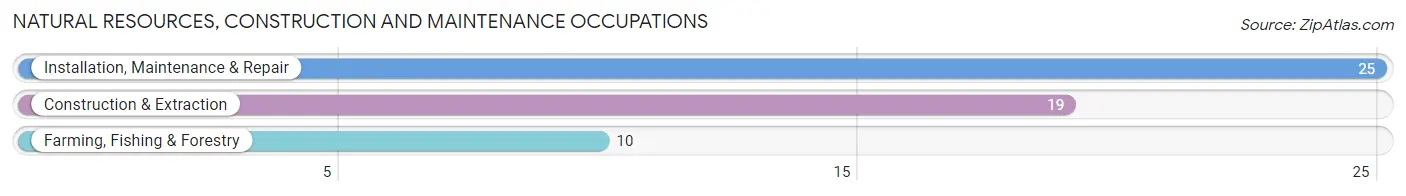
Natural Resources, Construction and Maintenance Occupations
The most common Natural Resources, Construction and Maintenance occupations in Laflin borough are Installation, Maintenance & Repair (25 | 3.4%), Construction & Extraction (19 | 2.6%), and Farming, Fishing & Forestry (10 | 1.4%).
Natural Resources, Construction and Maintenance Occupations by Sex
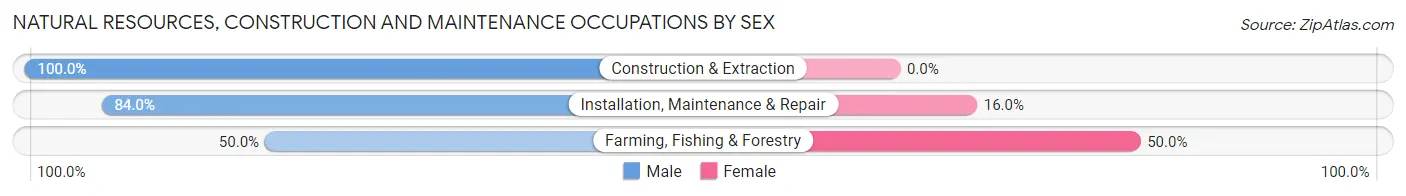
| Occupation | Male | Female |
| Farming, Fishing & Forestry | 5 (50.0%) | 5 (50.0%) |
| Construction & Extraction | 19 (100.0%) | 0 (0.0%) |
| Installation, Maintenance & Repair | 21 (84.0%) | 4 (16.0%) |
| Total (Category) | 45 (83.3%) | 9 (16.7%) |
| Total (Overall) | 354 (48.2%) | 381 (51.8%) |
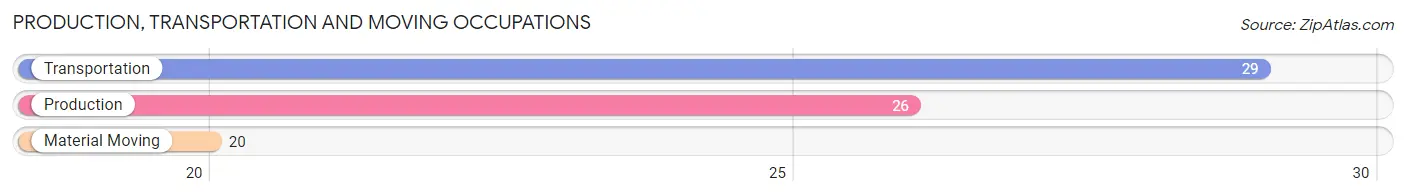
Production, Transportation and Moving Occupations
The most common Production, Transportation and Moving occupations in Laflin borough are Transportation (29 | 4.0%), Production (26 | 3.5%), and Material Moving (20 | 2.7%).
Production, Transportation and Moving Occupations by Sex
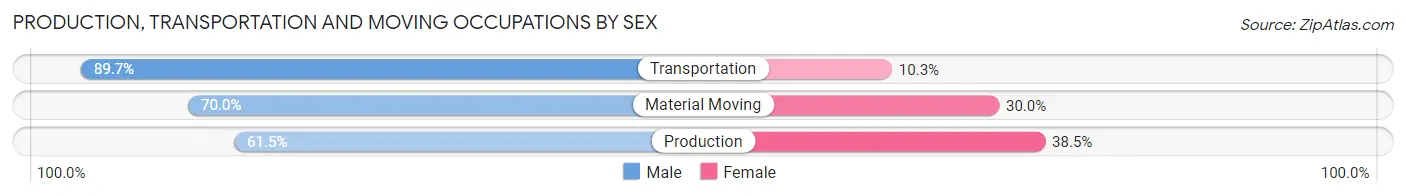
| Occupation | Male | Female |
| Production | 16 (61.5%) | 10 (38.5%) |
| Transportation | 26 (89.7%) | 3 (10.3%) |
| Material Moving | 14 (70.0%) | 6 (30.0%) |
| Total (Category) | 56 (74.7%) | 19 (25.3%) |
| Total (Overall) | 354 (48.2%) | 381 (51.8%) |
Employment Industries by Sex in Laflin borough
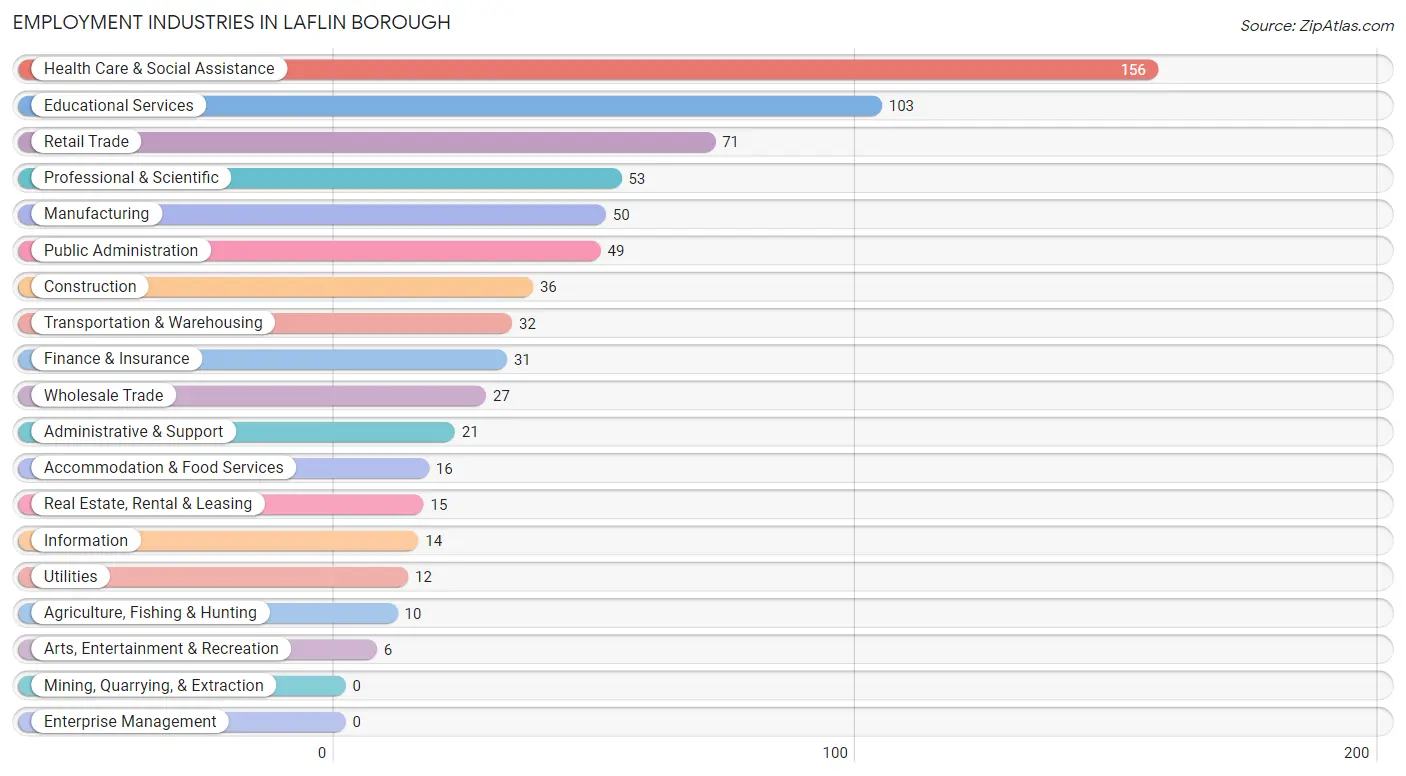
Employment Industries in Laflin borough
The major employment industries in Laflin borough include Health Care & Social Assistance (156 | 21.2%), Educational Services (103 | 14.0%), Retail Trade (71 | 9.7%), Professional & Scientific (53 | 7.2%), and Manufacturing (50 | 6.8%).
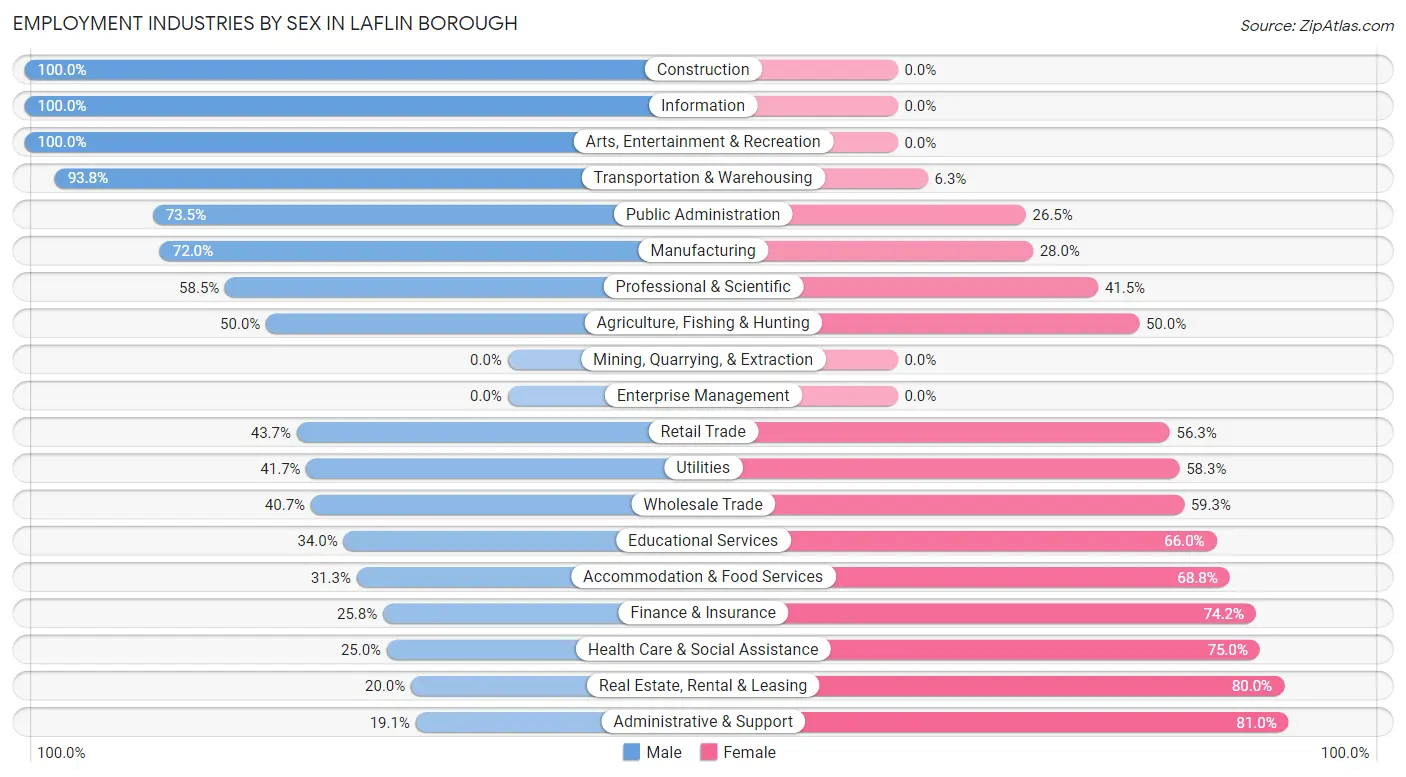
Employment Industries by Sex in Laflin borough
The Laflin borough industries that see more men than women are Construction (100.0%), Information (100.0%), and Arts, Entertainment & Recreation (100.0%), whereas the industries that tend to have a higher number of women are Administrative & Support (80.9%), Real Estate, Rental & Leasing (80.0%), and Health Care & Social Assistance (75.0%).
| Industry | Male | Female |
| Agriculture, Fishing & Hunting | 5 (50.0%) | 5 (50.0%) |
| Mining, Quarrying, & Extraction | 0 (0.0%) | 0 (0.0%) |
| Construction | 36 (100.0%) | 0 (0.0%) |
| Manufacturing | 36 (72.0%) | 14 (28.0%) |
| Wholesale Trade | 11 (40.7%) | 16 (59.3%) |
| Retail Trade | 31 (43.7%) | 40 (56.3%) |
| Transportation & Warehousing | 30 (93.8%) | 2 (6.2%) |
| Utilities | 5 (41.7%) | 7 (58.3%) |
| Information | 14 (100.0%) | 0 (0.0%) |
| Finance & Insurance | 8 (25.8%) | 23 (74.2%) |
| Real Estate, Rental & Leasing | 3 (20.0%) | 12 (80.0%) |
| Professional & Scientific | 31 (58.5%) | 22 (41.5%) |
| Enterprise Management | 0 (0.0%) | 0 (0.0%) |
| Administrative & Support | 4 (19.1%) | 17 (80.9%) |
| Educational Services | 35 (34.0%) | 68 (66.0%) |
| Health Care & Social Assistance | 39 (25.0%) | 117 (75.0%) |
| Arts, Entertainment & Recreation | 6 (100.0%) | 0 (0.0%) |
| Accommodation & Food Services | 5 (31.2%) | 11 (68.8%) |
| Public Administration | 36 (73.5%) | 13 (26.5%) |
| Total | 354 (48.2%) | 381 (51.8%) |
Education in Laflin borough
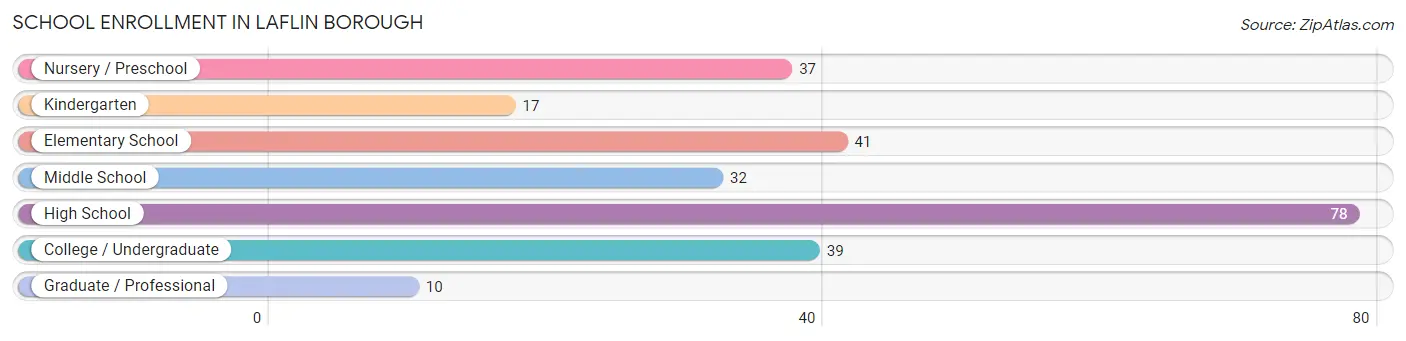
School Enrollment in Laflin borough
The most common levels of schooling among the 254 students in Laflin borough are high school (78 | 30.7%), elementary school (41 | 16.1%), and college / undergraduate (39 | 15.3%).
| School Level | # Students | % Students |
| Nursery / Preschool | 37 | 14.6% |
| Kindergarten | 17 | 6.7% |
| Elementary School | 41 | 16.1% |
| Middle School | 32 | 12.6% |
| High School | 78 | 30.7% |
| College / Undergraduate | 39 | 15.3% |
| Graduate / Professional | 10 | 3.9% |
| Total | 254 | 100.0% |
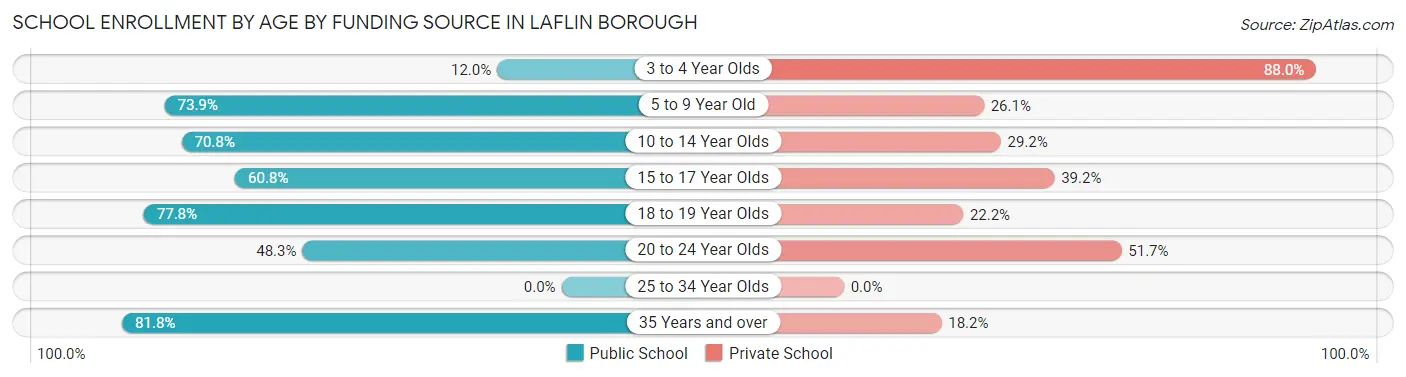
School Enrollment by Age by Funding Source in Laflin borough
Out of a total of 254 students who are enrolled in schools in Laflin borough, 96 (37.8%) attend a private institution, while the remaining 158 (62.2%) are enrolled in public schools. The age group of 3 to 4 year olds has the highest likelihood of being enrolled in private schools, with 22 (88.0% in the age bracket) enrolled. Conversely, the age group of 35 years and over has the lowest likelihood of being enrolled in a private school, with 9 (81.8% in the age bracket) attending a public institution.
| Age Bracket | Public School | Private School |
| 3 to 4 Year Olds | 3 (12.0%) | 22 (88.0%) |
| 5 to 9 Year Old | 34 (73.9%) | 12 (26.1%) |
| 10 to 14 Year Olds | 46 (70.8%) | 19 (29.2%) |
| 15 to 17 Year Olds | 31 (60.8%) | 20 (39.2%) |
| 18 to 19 Year Olds | 21 (77.8%) | 6 (22.2%) |
| 20 to 24 Year Olds | 14 (48.3%) | 15 (51.7%) |
| 25 to 34 Year Olds | 0 (0.0%) | 0 (0.0%) |
| 35 Years and over | 9 (81.8%) | 2 (18.2%) |
| Total | 158 (62.2%) | 96 (37.8%) |
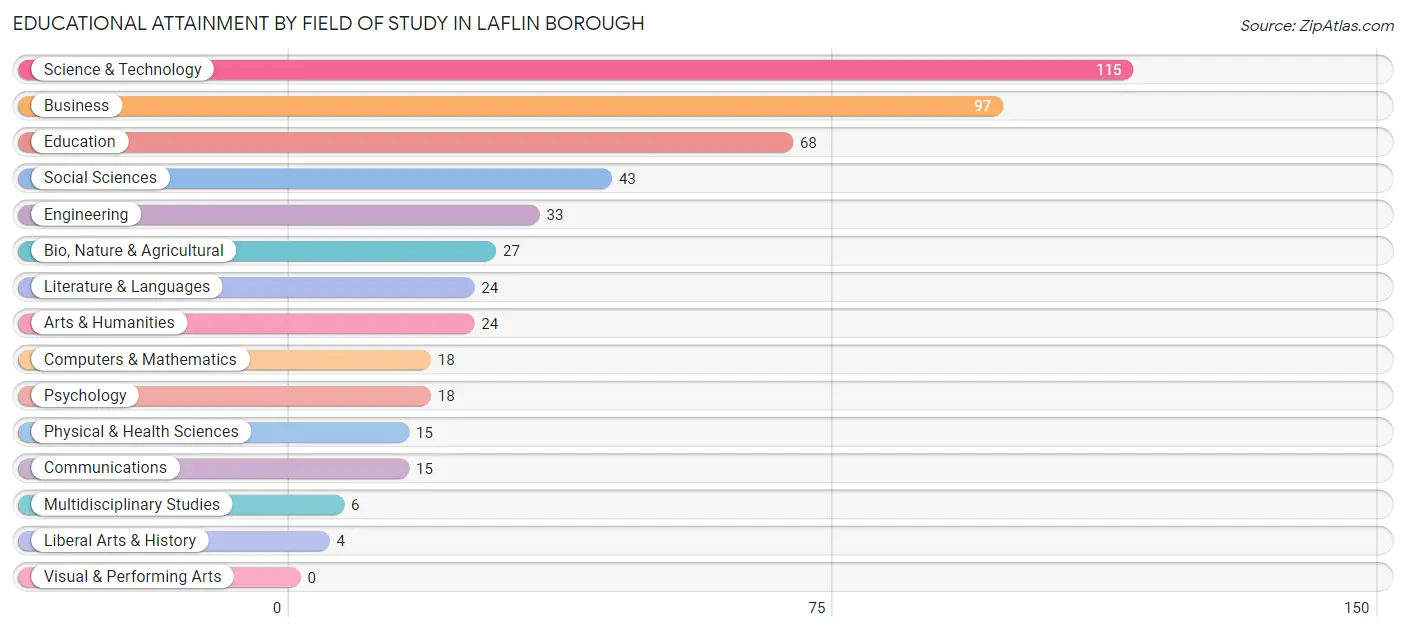
Educational Attainment by Field of Study in Laflin borough
Science & technology (115 | 22.7%), business (97 | 19.1%), education (68 | 13.4%), social sciences (43 | 8.5%), and engineering (33 | 6.5%) are the most common fields of study among 507 individuals in Laflin borough who have obtained a bachelor's degree or higher.
| Field of Study | # Graduates | % Graduates |
| Computers & Mathematics | 18 | 3.5% |
| Bio, Nature & Agricultural | 27 | 5.3% |
| Physical & Health Sciences | 15 | 3.0% |
| Psychology | 18 | 3.5% |
| Social Sciences | 43 | 8.5% |
| Engineering | 33 | 6.5% |
| Multidisciplinary Studies | 6 | 1.2% |
| Science & Technology | 115 | 22.7% |
| Business | 97 | 19.1% |
| Education | 68 | 13.4% |
| Literature & Languages | 24 | 4.7% |
| Liberal Arts & History | 4 | 0.8% |
| Visual & Performing Arts | 0 | 0.0% |
| Communications | 15 | 3.0% |
| Arts & Humanities | 24 | 4.7% |
| Total | 507 | 100.0% |
Transportation & Commute in Laflin borough
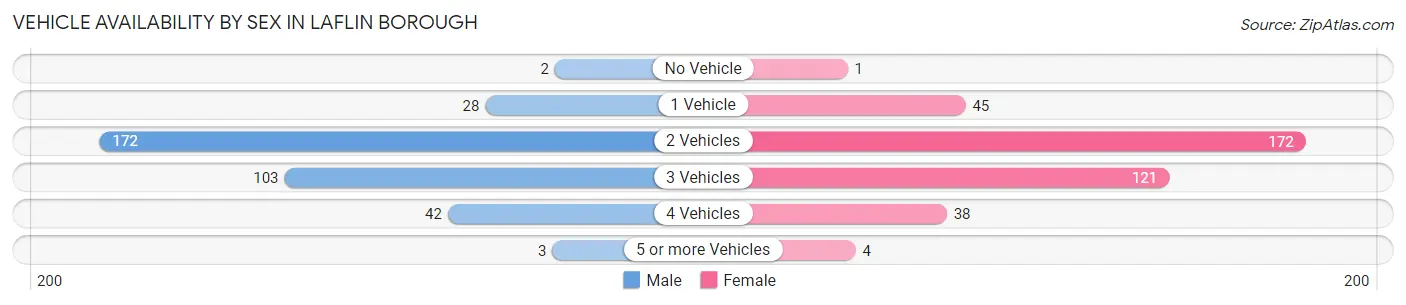
Vehicle Availability by Sex in Laflin borough
The most prevalent vehicle ownership categories in Laflin borough are males with 2 vehicles (172, accounting for 49.1%) and females with 2 vehicles (172, making up 45.1%).
| Vehicles Available | Male | Female |
| No Vehicle | 2 (0.6%) | 1 (0.3%) |
| 1 Vehicle | 28 (8.0%) | 45 (11.8%) |
| 2 Vehicles | 172 (49.1%) | 172 (45.1%) |
| 3 Vehicles | 103 (29.4%) | 121 (31.8%) |
| 4 Vehicles | 42 (12.0%) | 38 (10.0%) |
| 5 or more Vehicles | 3 (0.9%) | 4 (1.1%) |
| Total | 350 (100.0%) | 381 (100.0%) |
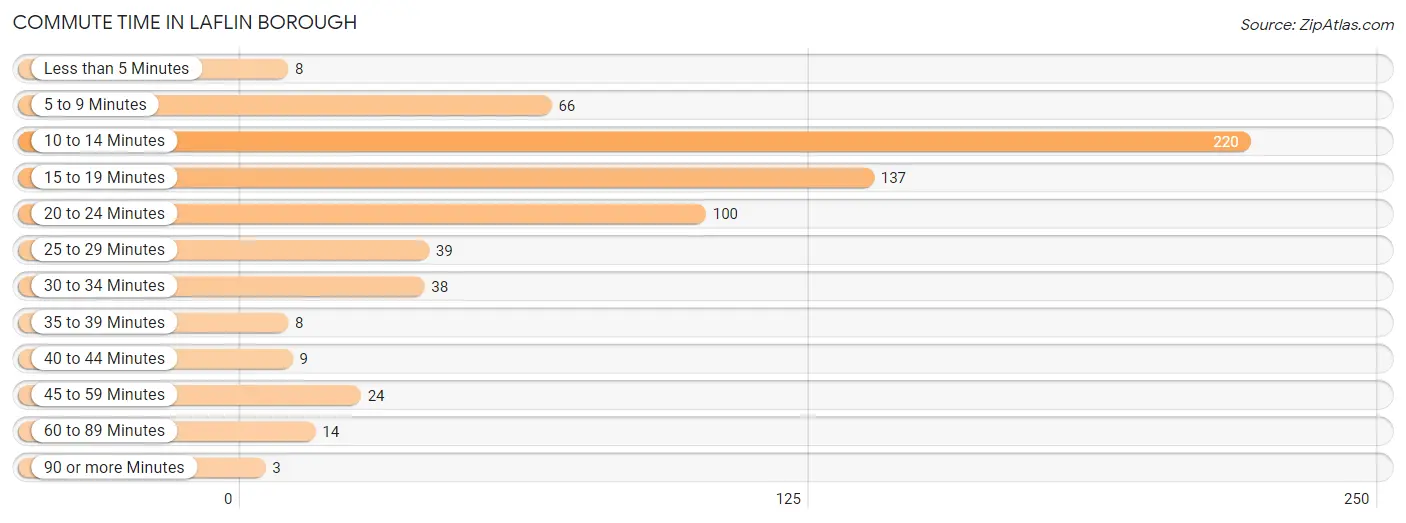
Commute Time in Laflin borough
The most frequently occuring commute durations in Laflin borough are 10 to 14 minutes (220 commuters, 33.0%), 15 to 19 minutes (137 commuters, 20.6%), and 20 to 24 minutes (100 commuters, 15.0%).
| Commute Time | # Commuters | % Commuters |
| Less than 5 Minutes | 8 | 1.2% |
| 5 to 9 Minutes | 66 | 9.9% |
| 10 to 14 Minutes | 220 | 33.0% |
| 15 to 19 Minutes | 137 | 20.6% |
| 20 to 24 Minutes | 100 | 15.0% |
| 25 to 29 Minutes | 39 | 5.9% |
| 30 to 34 Minutes | 38 | 5.7% |
| 35 to 39 Minutes | 8 | 1.2% |
| 40 to 44 Minutes | 9 | 1.3% |
| 45 to 59 Minutes | 24 | 3.6% |
| 60 to 89 Minutes | 14 | 2.1% |
| 90 or more Minutes | 3 | 0.4% |
Commute Time by Sex in Laflin borough
The most common commute times in Laflin borough are 10 to 14 minutes (114 commuters, 35.4%) for males and 10 to 14 minutes (106 commuters, 30.8%) for females.
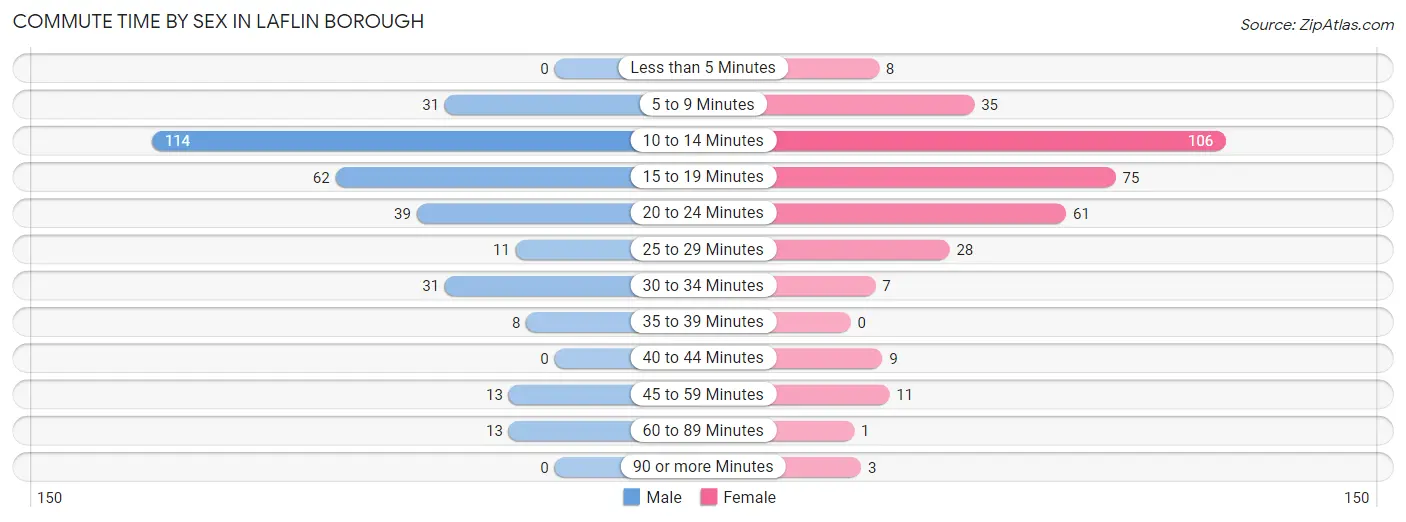
| Commute Time | Male | Female |
| Less than 5 Minutes | 0 (0.0%) | 8 (2.3%) |
| 5 to 9 Minutes | 31 (9.6%) | 35 (10.2%) |
| 10 to 14 Minutes | 114 (35.4%) | 106 (30.8%) |
| 15 to 19 Minutes | 62 (19.3%) | 75 (21.8%) |
| 20 to 24 Minutes | 39 (12.1%) | 61 (17.7%) |
| 25 to 29 Minutes | 11 (3.4%) | 28 (8.1%) |
| 30 to 34 Minutes | 31 (9.6%) | 7 (2.0%) |
| 35 to 39 Minutes | 8 (2.5%) | 0 (0.0%) |
| 40 to 44 Minutes | 0 (0.0%) | 9 (2.6%) |
| 45 to 59 Minutes | 13 (4.0%) | 11 (3.2%) |
| 60 to 89 Minutes | 13 (4.0%) | 1 (0.3%) |
| 90 or more Minutes | 0 (0.0%) | 3 (0.9%) |
Time of Departure to Work by Sex in Laflin borough
The most frequent times of departure to work in Laflin borough are 6:00 AM to 6:29 AM (74, 23.0%) for males and 8:00 AM to 8:29 AM (66, 19.2%) for females.
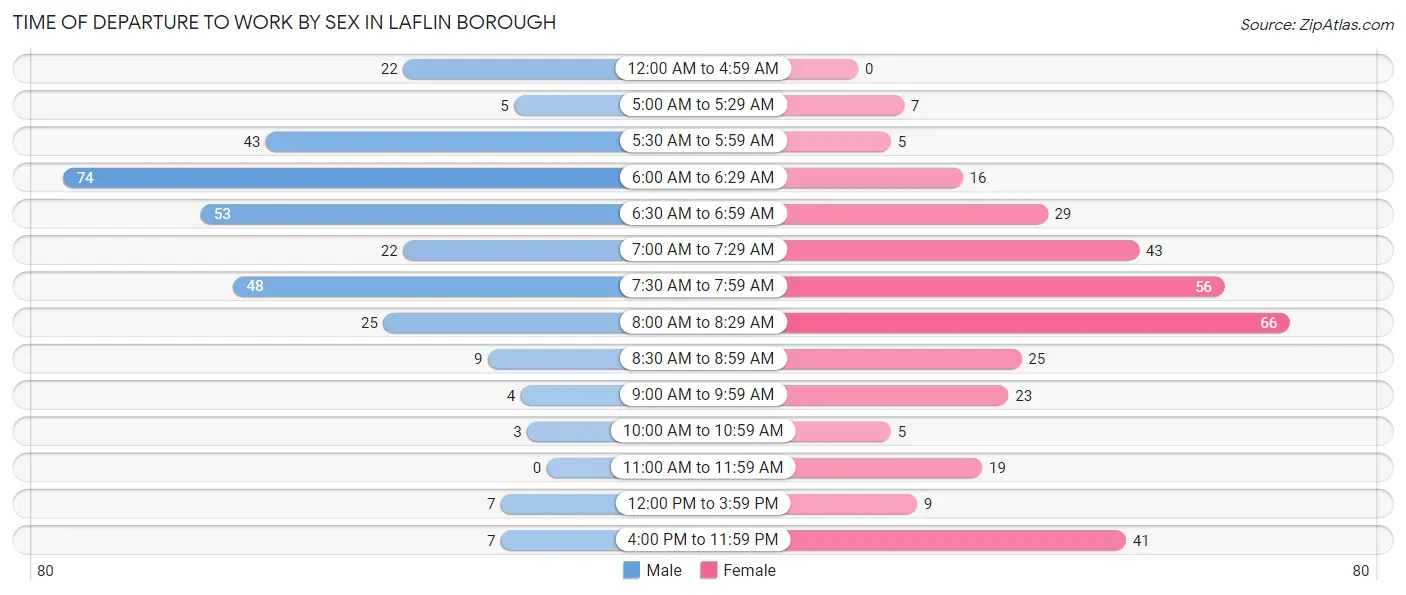
| Time of Departure | Male | Female |
| 12:00 AM to 4:59 AM | 22 (6.8%) | 0 (0.0%) |
| 5:00 AM to 5:29 AM | 5 (1.5%) | 7 (2.0%) |
| 5:30 AM to 5:59 AM | 43 (13.4%) | 5 (1.5%) |
| 6:00 AM to 6:29 AM | 74 (23.0%) | 16 (4.6%) |
| 6:30 AM to 6:59 AM | 53 (16.5%) | 29 (8.4%) |
| 7:00 AM to 7:29 AM | 22 (6.8%) | 43 (12.5%) |
| 7:30 AM to 7:59 AM | 48 (14.9%) | 56 (16.3%) |
| 8:00 AM to 8:29 AM | 25 (7.8%) | 66 (19.2%) |
| 8:30 AM to 8:59 AM | 9 (2.8%) | 25 (7.3%) |
| 9:00 AM to 9:59 AM | 4 (1.2%) | 23 (6.7%) |
| 10:00 AM to 10:59 AM | 3 (0.9%) | 5 (1.5%) |
| 11:00 AM to 11:59 AM | 0 (0.0%) | 19 (5.5%) |
| 12:00 PM to 3:59 PM | 7 (2.2%) | 9 (2.6%) |
| 4:00 PM to 11:59 PM | 7 (2.2%) | 41 (11.9%) |
| Total | 322 (100.0%) | 344 (100.0%) |
Housing Occupancy in Laflin borough
Occupancy by Ownership in Laflin borough
Of the total 570 dwellings in Laflin borough, owner-occupied units account for 534 (93.7%), while renter-occupied units make up 36 (6.3%).
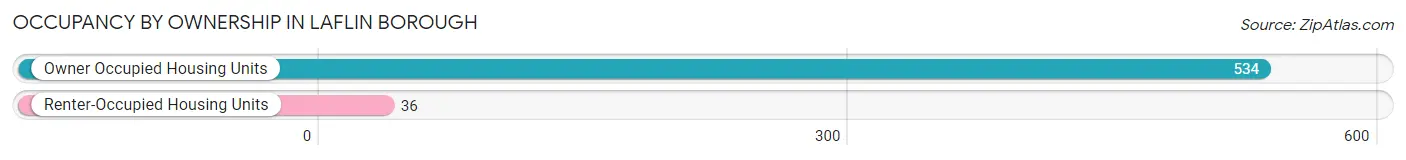
| Occupancy | # Housing Units | % Housing Units |
| Owner Occupied Housing Units | 534 | 93.7% |
| Renter-Occupied Housing Units | 36 | 6.3% |
| Total Occupied Housing Units | 570 | 100.0% |
Occupancy by Household Size in Laflin borough
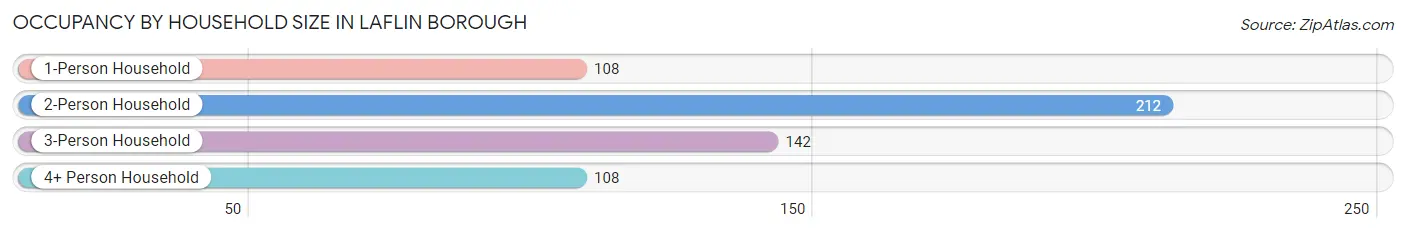
| Household Size | # Housing Units | % Housing Units |
| 1-Person Household | 108 | 19.0% |
| 2-Person Household | 212 | 37.2% |
| 3-Person Household | 142 | 24.9% |
| 4+ Person Household | 108 | 19.0% |
| Total Housing Units | 570 | 100.0% |
Occupancy by Ownership by Household Size in Laflin borough
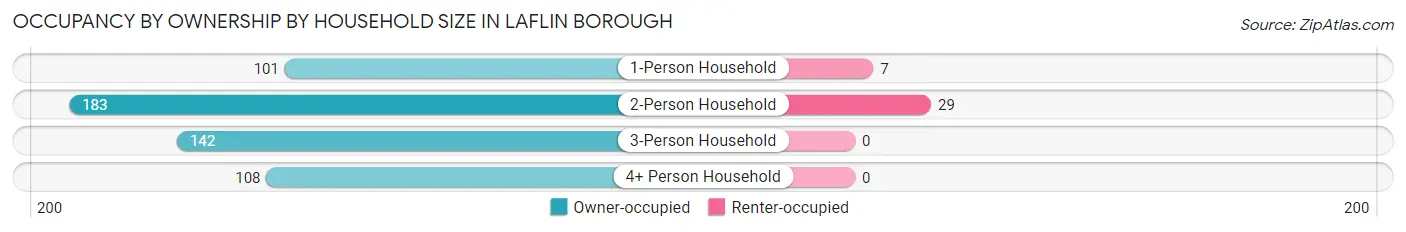
| Household Size | Owner-occupied | Renter-occupied |
| 1-Person Household | 101 (93.5%) | 7 (6.5%) |
| 2-Person Household | 183 (86.3%) | 29 (13.7%) |
| 3-Person Household | 142 (100.0%) | 0 (0.0%) |
| 4+ Person Household | 108 (100.0%) | 0 (0.0%) |
| Total Housing Units | 534 (93.7%) | 36 (6.3%) |
Occupancy by Educational Attainment in Laflin borough
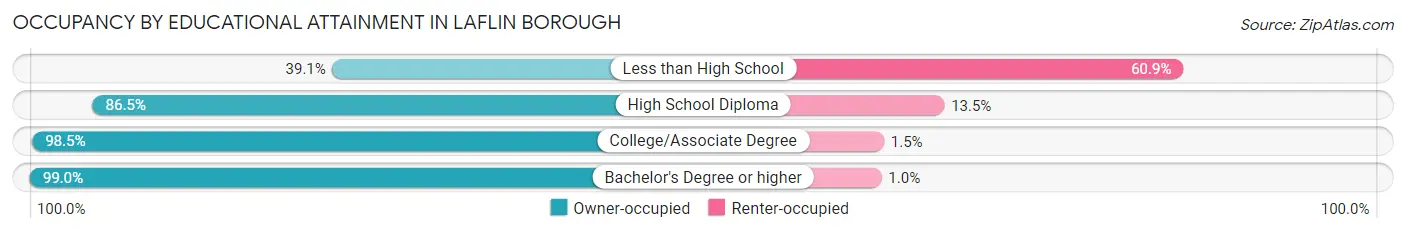
| Household Size | Owner-occupied | Renter-occupied |
| Less than High School | 9 (39.1%) | 14 (60.9%) |
| High School Diploma | 109 (86.5%) | 17 (13.5%) |
| College/Associate Degree | 130 (98.5%) | 2 (1.5%) |
| Bachelor's Degree or higher | 286 (99.0%) | 3 (1.0%) |
Occupancy by Age of Householder in Laflin borough
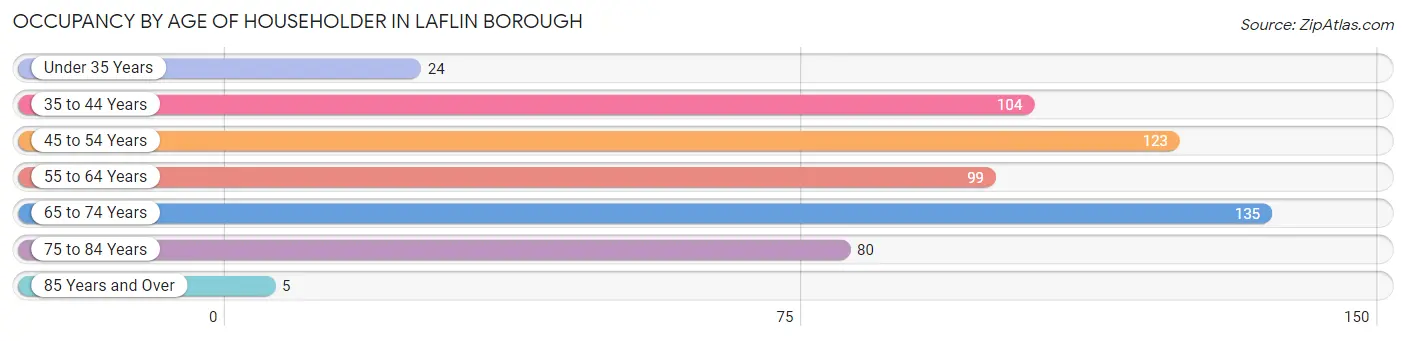
| Age Bracket | # Households | % Households |
| Under 35 Years | 24 | 4.2% |
| 35 to 44 Years | 104 | 18.2% |
| 45 to 54 Years | 123 | 21.6% |
| 55 to 64 Years | 99 | 17.4% |
| 65 to 74 Years | 135 | 23.7% |
| 75 to 84 Years | 80 | 14.0% |
| 85 Years and Over | 5 | 0.9% |
| Total | 570 | 100.0% |
Housing Finances in Laflin borough
Median Income by Occupancy in Laflin borough
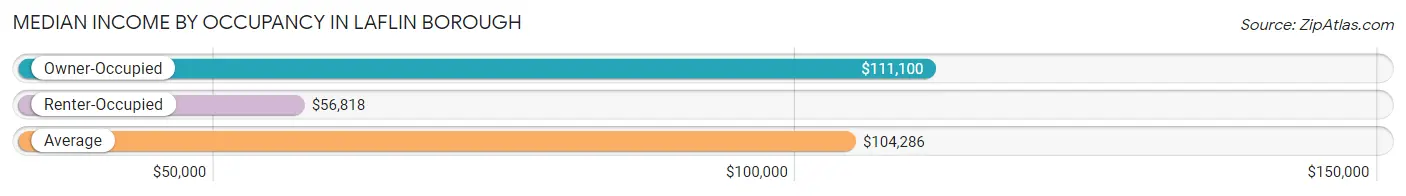
| Occupancy Type | # Households | Median Income |
| Owner-Occupied | 534 (93.7%) | $111,100 |
| Renter-Occupied | 36 (6.3%) | $56,818 |
| Average | 570 (100.0%) | $104,286 |
Occupancy by Householder Income Bracket in Laflin borough
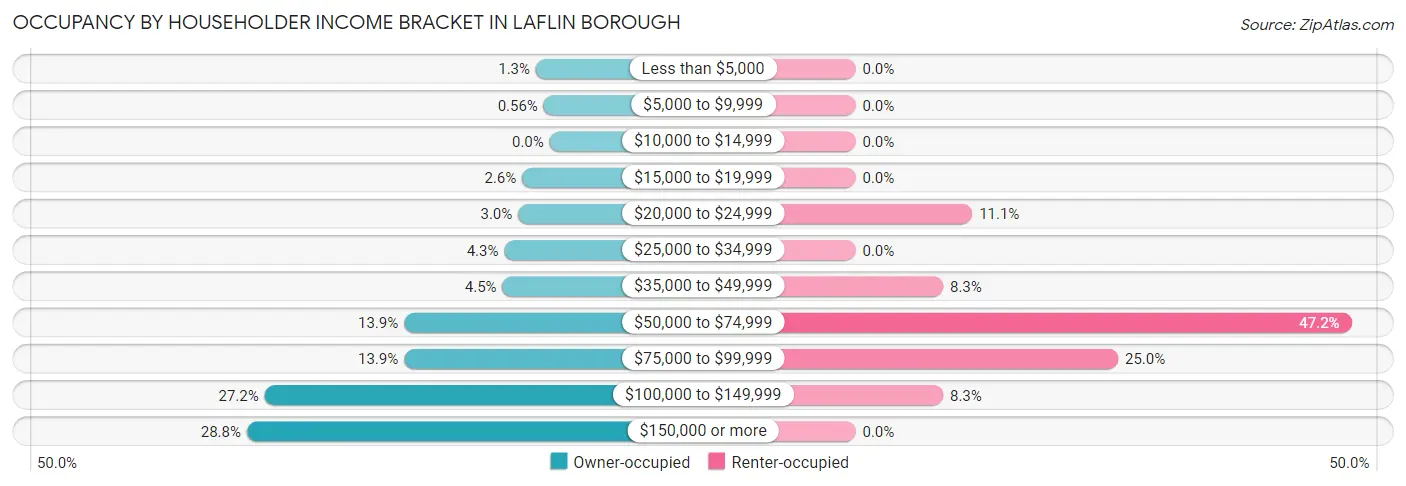
| Income Bracket | Owner-occupied | Renter-occupied |
| Less than $5,000 | 7 (1.3%) | 0 (0.0%) |
| $5,000 to $9,999 | 3 (0.6%) | 0 (0.0%) |
| $10,000 to $14,999 | 0 (0.0%) | 0 (0.0%) |
| $15,000 to $19,999 | 14 (2.6%) | 0 (0.0%) |
| $20,000 to $24,999 | 16 (3.0%) | 4 (11.1%) |
| $25,000 to $34,999 | 23 (4.3%) | 0 (0.0%) |
| $35,000 to $49,999 | 24 (4.5%) | 3 (8.3%) |
| $50,000 to $74,999 | 74 (13.9%) | 17 (47.2%) |
| $75,000 to $99,999 | 74 (13.9%) | 9 (25.0%) |
| $100,000 to $149,999 | 145 (27.2%) | 3 (8.3%) |
| $150,000 or more | 154 (28.8%) | 0 (0.0%) |
| Total | 534 (100.0%) | 36 (100.0%) |
Monthly Housing Cost Tiers in Laflin borough
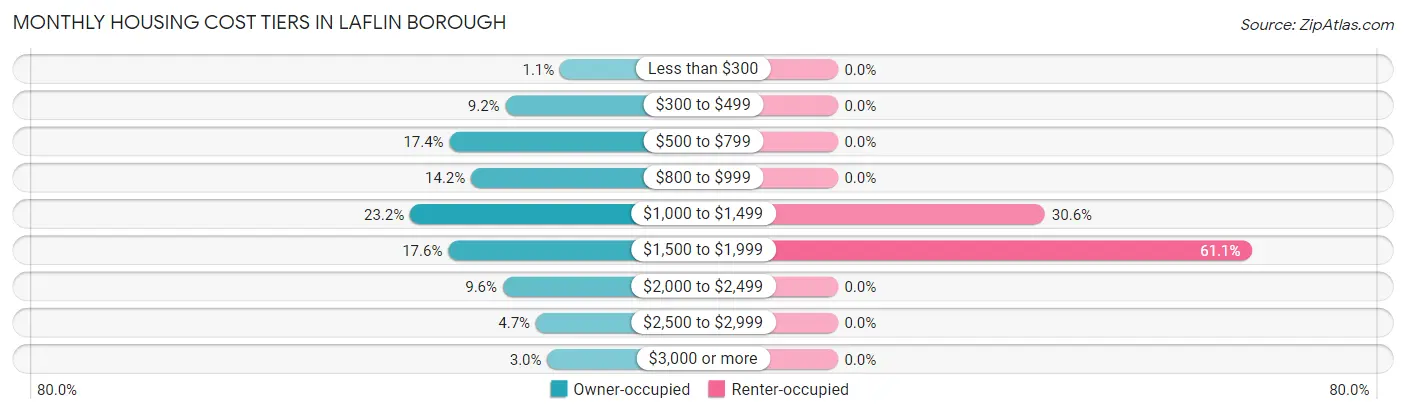
| Monthly Cost | Owner-occupied | Renter-occupied |
| Less than $300 | 6 (1.1%) | 0 (0.0%) |
| $300 to $499 | 49 (9.2%) | 0 (0.0%) |
| $500 to $799 | 93 (17.4%) | 0 (0.0%) |
| $800 to $999 | 76 (14.2%) | 0 (0.0%) |
| $1,000 to $1,499 | 124 (23.2%) | 11 (30.6%) |
| $1,500 to $1,999 | 94 (17.6%) | 22 (61.1%) |
| $2,000 to $2,499 | 51 (9.6%) | 0 (0.0%) |
| $2,500 to $2,999 | 25 (4.7%) | 0 (0.0%) |
| $3,000 or more | 16 (3.0%) | 0 (0.0%) |
| Total | 534 (100.0%) | 36 (100.0%) |
Physical Housing Characteristics in Laflin borough
Housing Structures in Laflin borough
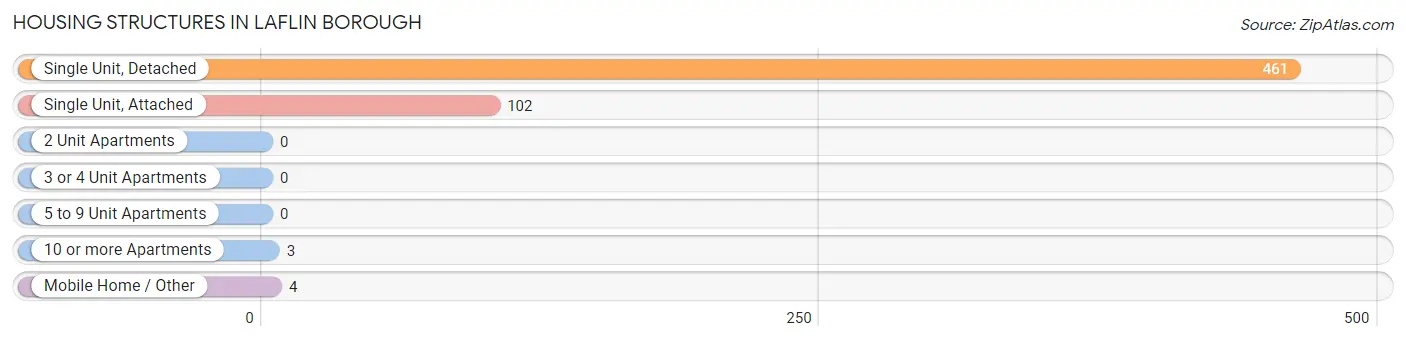
| Structure Type | # Housing Units | % Housing Units |
| Single Unit, Detached | 461 | 80.9% |
| Single Unit, Attached | 102 | 17.9% |
| 2 Unit Apartments | 0 | 0.0% |
| 3 or 4 Unit Apartments | 0 | 0.0% |
| 5 to 9 Unit Apartments | 0 | 0.0% |
| 10 or more Apartments | 3 | 0.5% |
| Mobile Home / Other | 4 | 0.7% |
| Total | 570 | 100.0% |
Housing Structures by Occupancy in Laflin borough
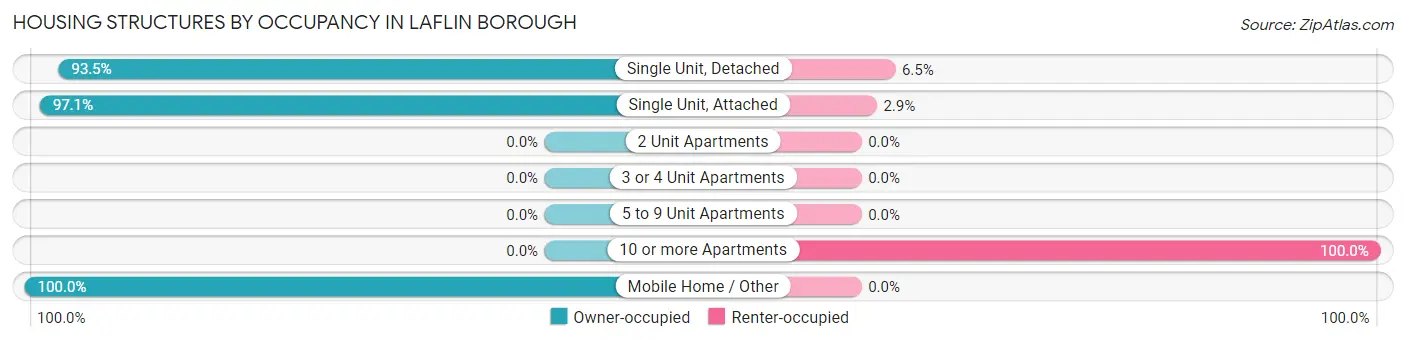
| Structure Type | Owner-occupied | Renter-occupied |
| Single Unit, Detached | 431 (93.5%) | 30 (6.5%) |
| Single Unit, Attached | 99 (97.1%) | 3 (2.9%) |
| 2 Unit Apartments | 0 (0.0%) | 0 (0.0%) |
| 3 or 4 Unit Apartments | 0 (0.0%) | 0 (0.0%) |
| 5 to 9 Unit Apartments | 0 (0.0%) | 0 (0.0%) |
| 10 or more Apartments | 0 (0.0%) | 3 (100.0%) |
| Mobile Home / Other | 4 (100.0%) | 0 (0.0%) |
| Total | 534 (93.7%) | 36 (6.3%) |
Housing Structures by Number of Rooms in Laflin borough
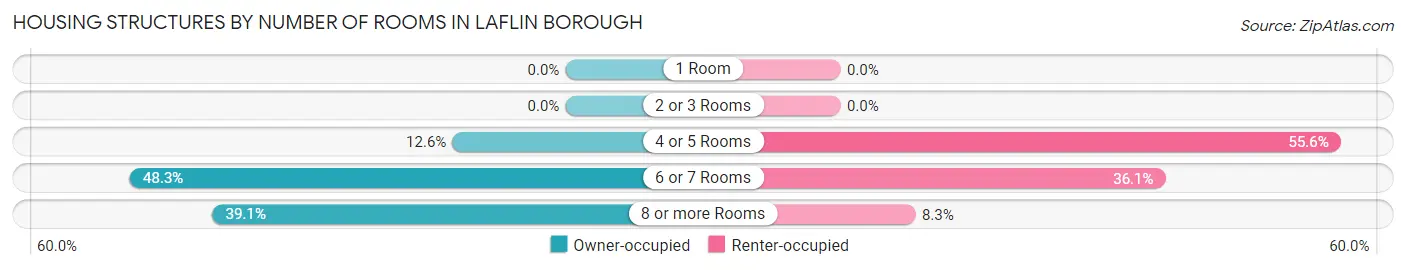
| Number of Rooms | Owner-occupied | Renter-occupied |
| 1 Room | 0 (0.0%) | 0 (0.0%) |
| 2 or 3 Rooms | 0 (0.0%) | 0 (0.0%) |
| 4 or 5 Rooms | 67 (12.6%) | 20 (55.6%) |
| 6 or 7 Rooms | 258 (48.3%) | 13 (36.1%) |
| 8 or more Rooms | 209 (39.1%) | 3 (8.3%) |
| Total | 534 (100.0%) | 36 (100.0%) |
Housing Structure by Heating Type in Laflin borough
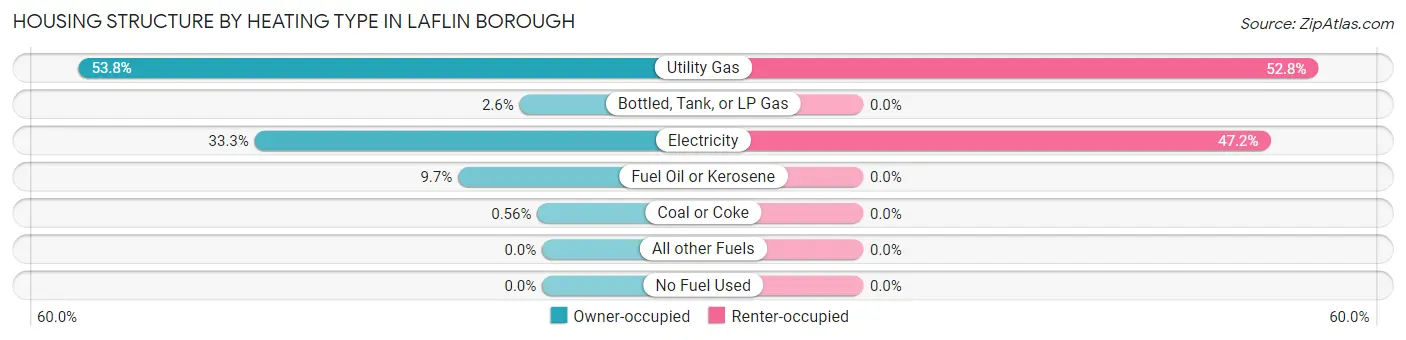
| Heating Type | Owner-occupied | Renter-occupied |
| Utility Gas | 287 (53.7%) | 19 (52.8%) |
| Bottled, Tank, or LP Gas | 14 (2.6%) | 0 (0.0%) |
| Electricity | 178 (33.3%) | 17 (47.2%) |
| Fuel Oil or Kerosene | 52 (9.7%) | 0 (0.0%) |
| Coal or Coke | 3 (0.6%) | 0 (0.0%) |
| All other Fuels | 0 (0.0%) | 0 (0.0%) |
| No Fuel Used | 0 (0.0%) | 0 (0.0%) |
| Total | 534 (100.0%) | 36 (100.0%) |
Household Vehicle Usage in Laflin borough
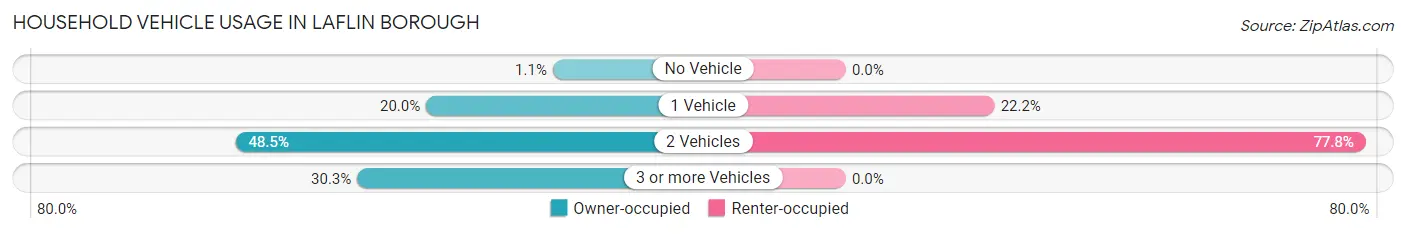
| Vehicles per Household | Owner-occupied | Renter-occupied |
| No Vehicle | 6 (1.1%) | 0 (0.0%) |
| 1 Vehicle | 107 (20.0%) | 8 (22.2%) |
| 2 Vehicles | 259 (48.5%) | 28 (77.8%) |
| 3 or more Vehicles | 162 (30.3%) | 0 (0.0%) |
| Total | 534 (100.0%) | 36 (100.0%) |
Real Estate & Mortgages in Laflin borough
Real Estate and Mortgage Overview in Laflin borough
| Characteristic | Without Mortgage | With Mortgage |
| Housing Units | 228 | 306 |
| Median Property Value | $209,000 | $212,500 |
| Median Household Income | $98,269 | $103 |
| Monthly Housing Costs | $697 | $16 |
| Real Estate Taxes | $3,694 | $3 |
Property Value by Mortgage Status in Laflin borough
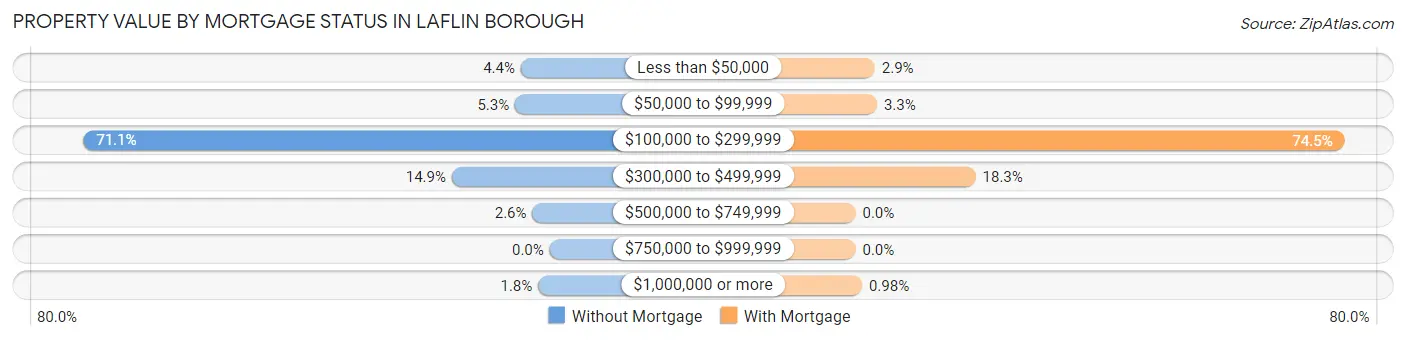
| Property Value | Without Mortgage | With Mortgage |
| Less than $50,000 | 10 (4.4%) | 9 (2.9%) |
| $50,000 to $99,999 | 12 (5.3%) | 10 (3.3%) |
| $100,000 to $299,999 | 162 (71.1%) | 228 (74.5%) |
| $300,000 to $499,999 | 34 (14.9%) | 56 (18.3%) |
| $500,000 to $749,999 | 6 (2.6%) | 0 (0.0%) |
| $750,000 to $999,999 | 0 (0.0%) | 0 (0.0%) |
| $1,000,000 or more | 4 (1.8%) | 3 (1.0%) |
| Total | 228 (100.0%) | 306 (100.0%) |
Household Income by Mortgage Status in Laflin borough
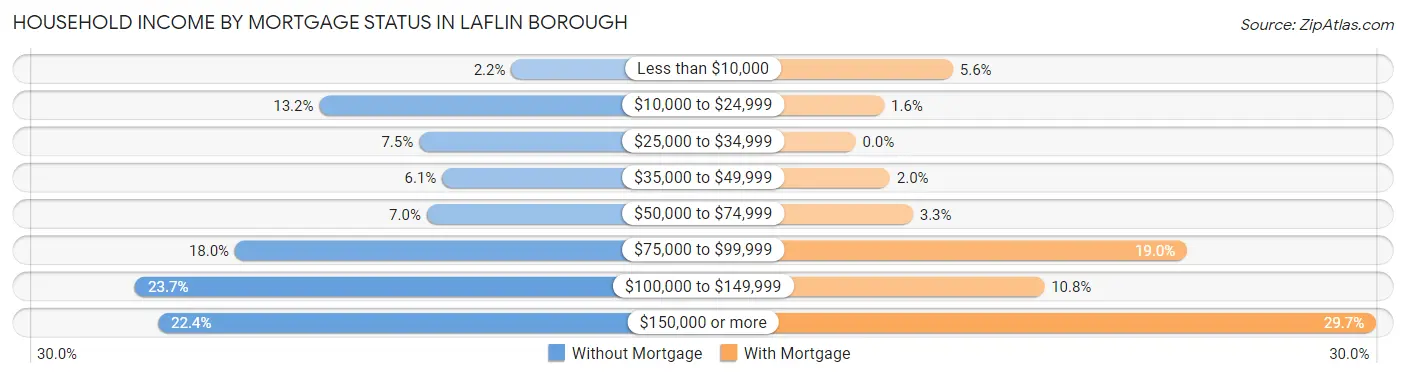
| Household Income | Without Mortgage | With Mortgage |
| Less than $10,000 | 5 (2.2%) | 17 (5.6%) |
| $10,000 to $24,999 | 30 (13.2%) | 5 (1.6%) |
| $25,000 to $34,999 | 17 (7.5%) | 0 (0.0%) |
| $35,000 to $49,999 | 14 (6.1%) | 6 (2.0%) |
| $50,000 to $74,999 | 16 (7.0%) | 10 (3.3%) |
| $75,000 to $99,999 | 41 (18.0%) | 58 (19.0%) |
| $100,000 to $149,999 | 54 (23.7%) | 33 (10.8%) |
| $150,000 or more | 51 (22.4%) | 91 (29.7%) |
| Total | 228 (100.0%) | 306 (100.0%) |
Property Value to Household Income Ratio in Laflin borough
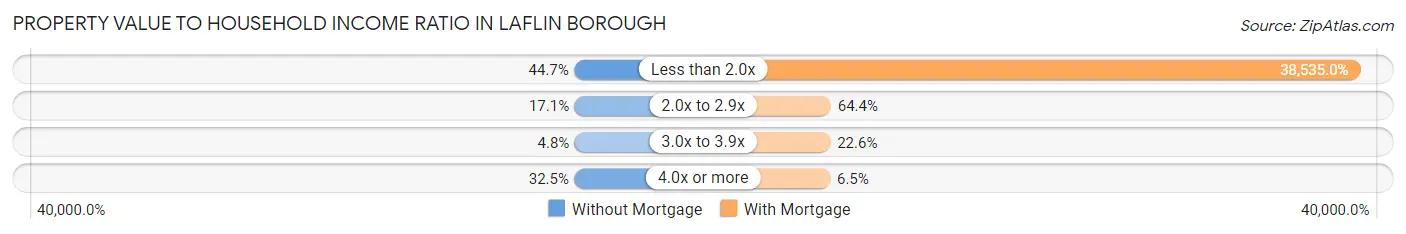
| Value-to-Income Ratio | Without Mortgage | With Mortgage |
| Less than 2.0x | 102 (44.7%) | 117,917 (38,535.0%) |
| 2.0x to 2.9x | 39 (17.1%) | 197 (64.4%) |
| 3.0x to 3.9x | 11 (4.8%) | 69 (22.6%) |
| 4.0x or more | 74 (32.5%) | 20 (6.5%) |
| Total | 228 (100.0%) | 306 (100.0%) |
Real Estate Taxes by Mortgage Status in Laflin borough
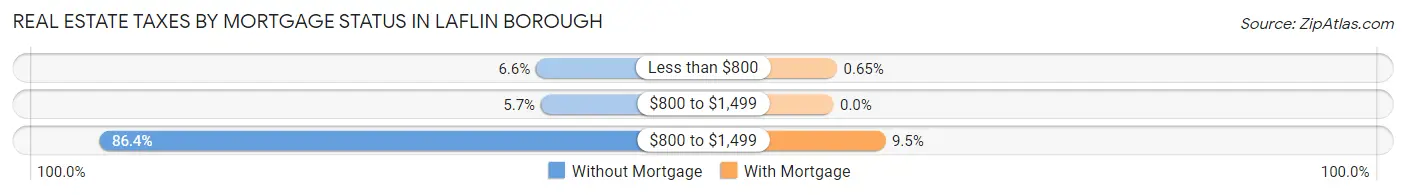
| Property Taxes | Without Mortgage | With Mortgage |
| Less than $800 | 15 (6.6%) | 2 (0.6%) |
| $800 to $1,499 | 13 (5.7%) | 0 (0.0%) |
| $800 to $1,499 | 197 (86.4%) | 29 (9.5%) |
| Total | 228 (100.0%) | 306 (100.0%) |
Health & Disability in Laflin borough
Health Insurance Coverage by Age in Laflin borough
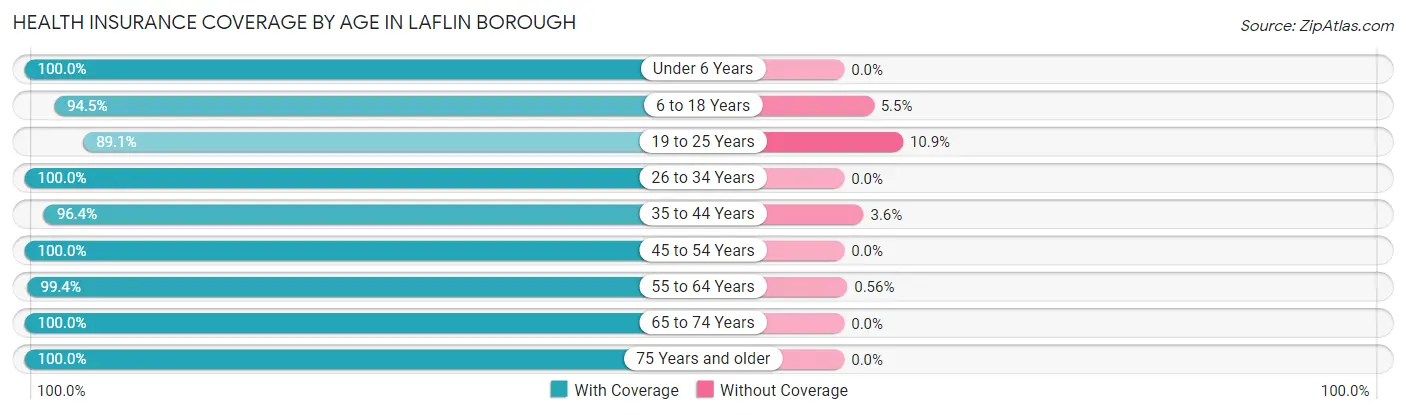
| Age Bracket | With Coverage | Without Coverage |
| Under 6 Years | 116 (100.0%) | 0 (0.0%) |
| 6 to 18 Years | 172 (94.5%) | 10 (5.5%) |
| 19 to 25 Years | 57 (89.1%) | 7 (10.9%) |
| 26 to 34 Years | 62 (100.0%) | 0 (0.0%) |
| 35 to 44 Years | 215 (96.4%) | 8 (3.6%) |
| 45 to 54 Years | 223 (100.0%) | 0 (0.0%) |
| 55 to 64 Years | 178 (99.4%) | 1 (0.6%) |
| 65 to 74 Years | 233 (100.0%) | 0 (0.0%) |
| 75 Years and older | 145 (100.0%) | 0 (0.0%) |
| Total | 1,401 (98.2%) | 26 (1.8%) |
Health Insurance Coverage by Citizenship Status in Laflin borough
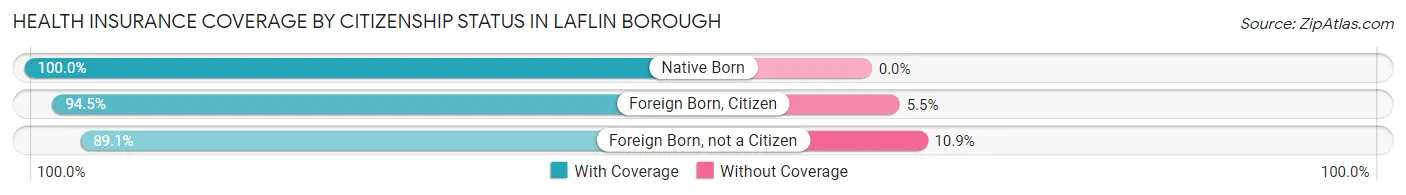
| Citizenship Status | With Coverage | Without Coverage |
| Native Born | 116 (100.0%) | 0 (0.0%) |
| Foreign Born, Citizen | 172 (94.5%) | 10 (5.5%) |
| Foreign Born, not a Citizen | 57 (89.1%) | 7 (10.9%) |
Health Insurance Coverage by Household Income in Laflin borough
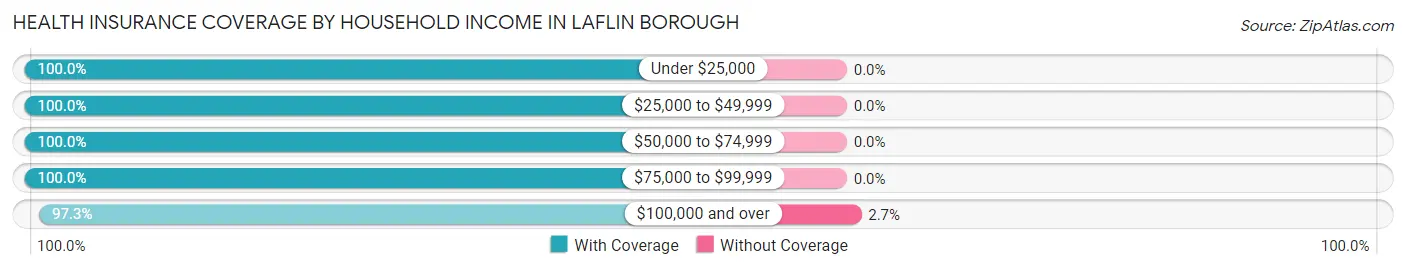
| Household Income | With Coverage | Without Coverage |
| Under $25,000 | 64 (100.0%) | 0 (0.0%) |
| $25,000 to $49,999 | 64 (100.0%) | 0 (0.0%) |
| $50,000 to $74,999 | 201 (100.0%) | 0 (0.0%) |
| $75,000 to $99,999 | 171 (100.0%) | 0 (0.0%) |
| $100,000 and over | 897 (97.3%) | 25 (2.7%) |
Public vs Private Health Insurance Coverage by Age in Laflin borough
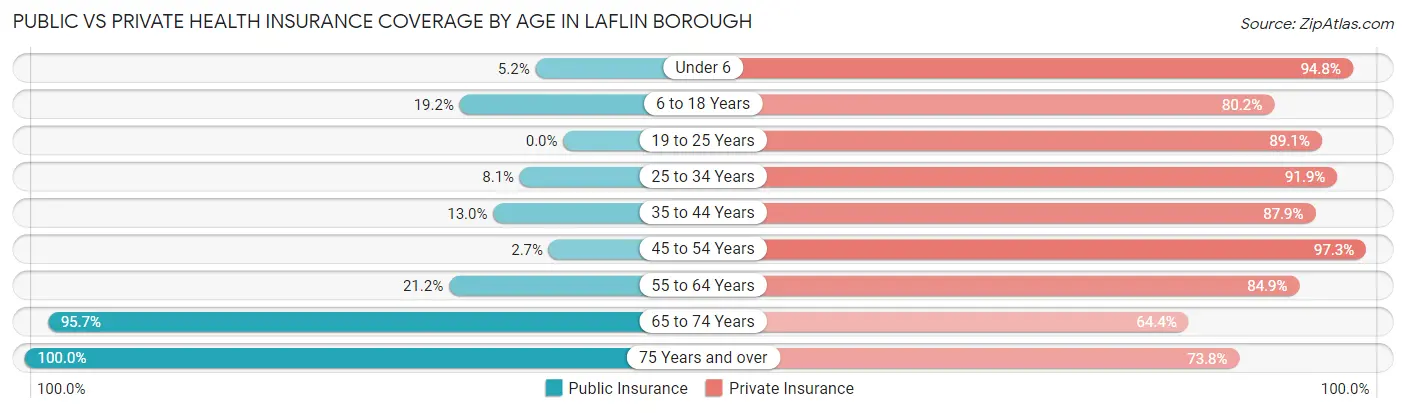
| Age Bracket | Public Insurance | Private Insurance |
| Under 6 | 6 (5.2%) | 110 (94.8%) |
| 6 to 18 Years | 35 (19.2%) | 146 (80.2%) |
| 19 to 25 Years | 0 (0.0%) | 57 (89.1%) |
| 25 to 34 Years | 5 (8.1%) | 57 (91.9%) |
| 35 to 44 Years | 29 (13.0%) | 196 (87.9%) |
| 45 to 54 Years | 6 (2.7%) | 217 (97.3%) |
| 55 to 64 Years | 38 (21.2%) | 152 (84.9%) |
| 65 to 74 Years | 223 (95.7%) | 150 (64.4%) |
| 75 Years and over | 145 (100.0%) | 107 (73.8%) |
| Total | 487 (34.1%) | 1,192 (83.5%) |
Disability Status by Sex by Age in Laflin borough
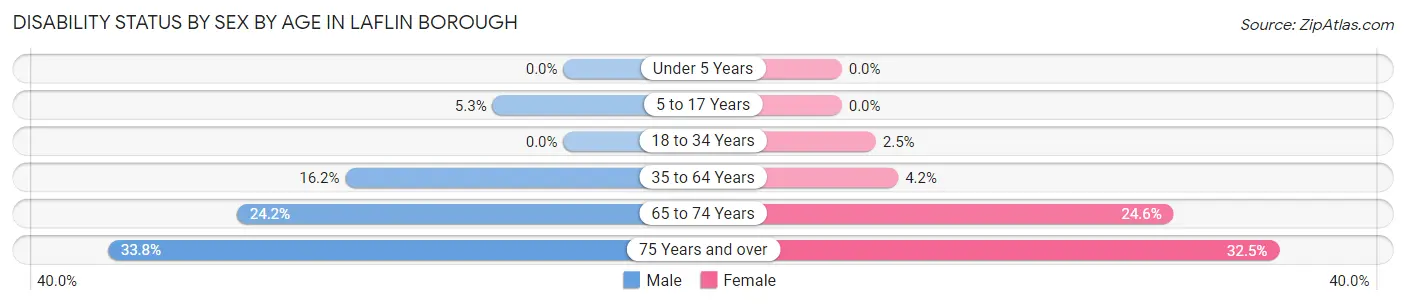
| Age Bracket | Male | Female |
| Under 5 Years | 0 (0.0%) | 0 (0.0%) |
| 5 to 17 Years | 5 (5.3%) | 0 (0.0%) |
| 18 to 34 Years | 0 (0.0%) | 2 (2.5%) |
| 35 to 64 Years | 51 (16.2%) | 13 (4.2%) |
| 65 to 74 Years | 24 (24.2%) | 33 (24.6%) |
| 75 Years and over | 23 (33.8%) | 25 (32.5%) |
Disability Class by Sex by Age in Laflin borough
Disability Class: Hearing Difficulty
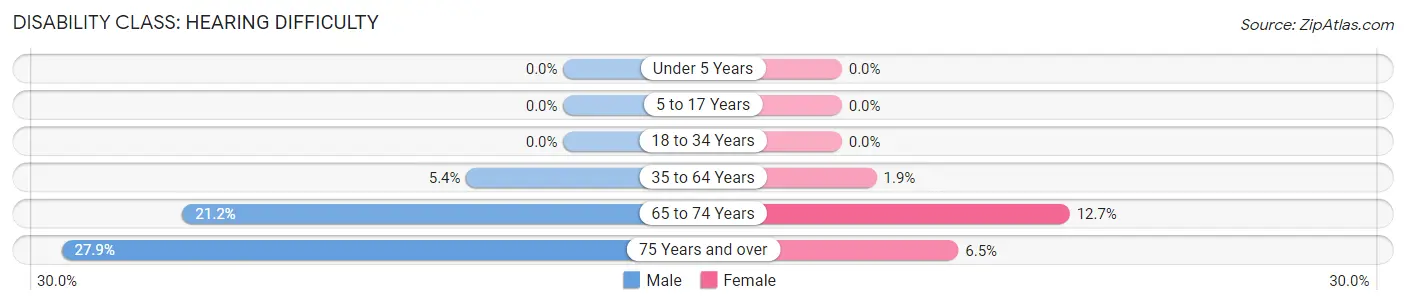
| Age Bracket | Male | Female |
| Under 5 Years | 0 (0.0%) | 0 (0.0%) |
| 5 to 17 Years | 0 (0.0%) | 0 (0.0%) |
| 18 to 34 Years | 0 (0.0%) | 0 (0.0%) |
| 35 to 64 Years | 17 (5.4%) | 6 (1.9%) |
| 65 to 74 Years | 21 (21.2%) | 17 (12.7%) |
| 75 Years and over | 19 (27.9%) | 5 (6.5%) |
Disability Class: Vision Difficulty
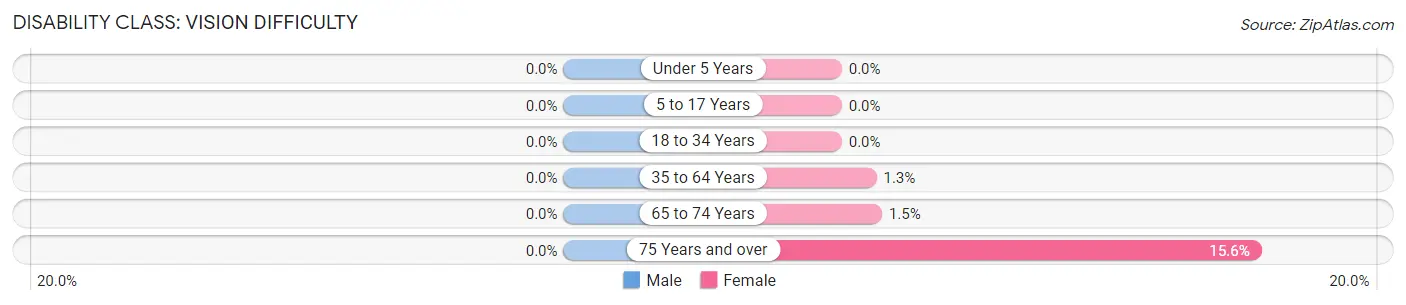
| Age Bracket | Male | Female |
| Under 5 Years | 0 (0.0%) | 0 (0.0%) |
| 5 to 17 Years | 0 (0.0%) | 0 (0.0%) |
| 18 to 34 Years | 0 (0.0%) | 0 (0.0%) |
| 35 to 64 Years | 0 (0.0%) | 4 (1.3%) |
| 65 to 74 Years | 0 (0.0%) | 2 (1.5%) |
| 75 Years and over | 0 (0.0%) | 12 (15.6%) |
Disability Class: Cognitive Difficulty
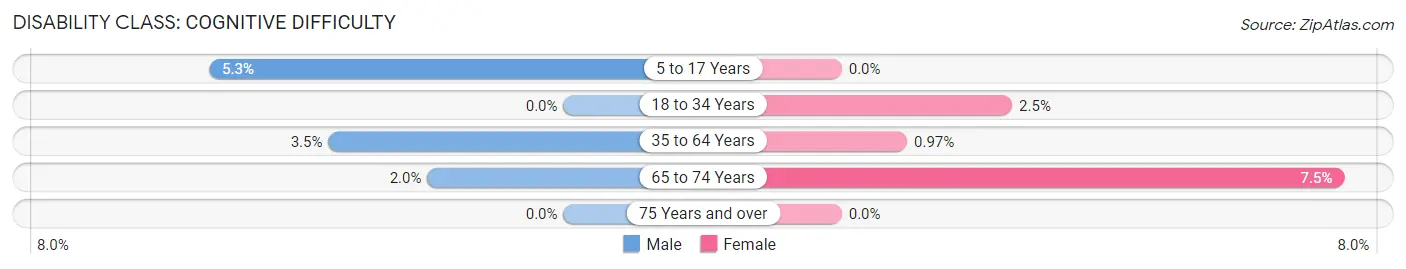
| Age Bracket | Male | Female |
| 5 to 17 Years | 5 (5.3%) | 0 (0.0%) |
| 18 to 34 Years | 0 (0.0%) | 2 (2.5%) |
| 35 to 64 Years | 11 (3.5%) | 3 (1.0%) |
| 65 to 74 Years | 2 (2.0%) | 10 (7.5%) |
| 75 Years and over | 0 (0.0%) | 0 (0.0%) |
Disability Class: Ambulatory Difficulty
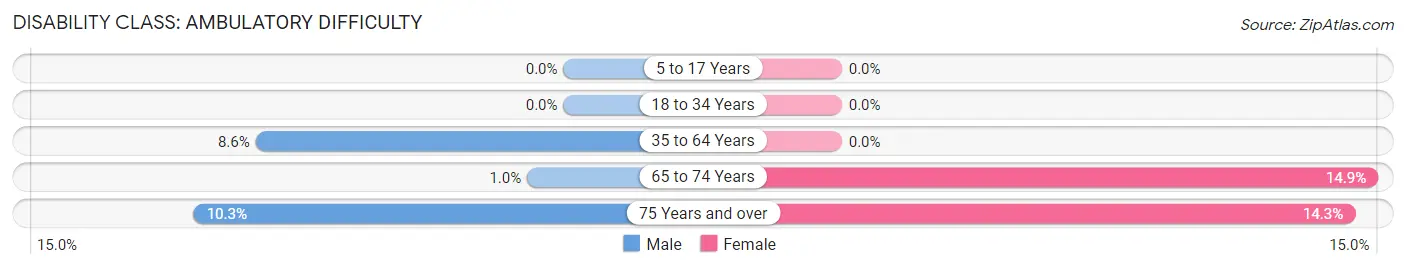
| Age Bracket | Male | Female |
| 5 to 17 Years | 0 (0.0%) | 0 (0.0%) |
| 18 to 34 Years | 0 (0.0%) | 0 (0.0%) |
| 35 to 64 Years | 27 (8.6%) | 0 (0.0%) |
| 65 to 74 Years | 1 (1.0%) | 20 (14.9%) |
| 75 Years and over | 7 (10.3%) | 11 (14.3%) |
Disability Class: Self-Care Difficulty
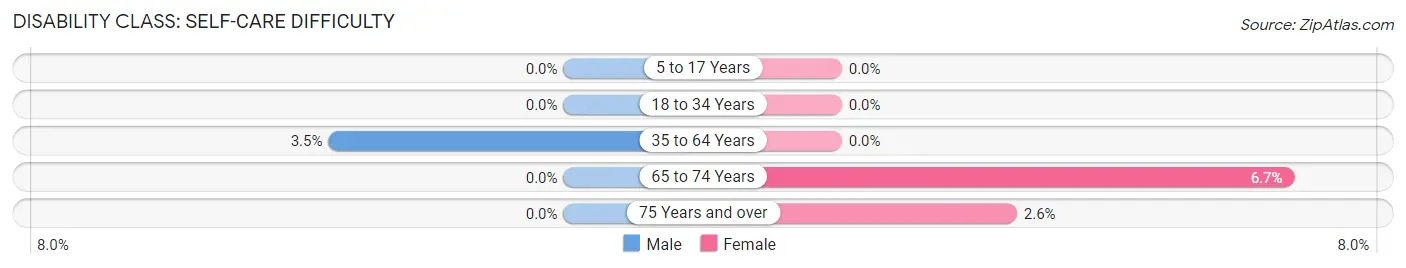
| Age Bracket | Male | Female |
| 5 to 17 Years | 0 (0.0%) | 0 (0.0%) |
| 18 to 34 Years | 0 (0.0%) | 0 (0.0%) |
| 35 to 64 Years | 11 (3.5%) | 0 (0.0%) |
| 65 to 74 Years | 0 (0.0%) | 9 (6.7%) |
| 75 Years and over | 0 (0.0%) | 2 (2.6%) |
Technology Access in Laflin borough
Computing Device Access in Laflin borough
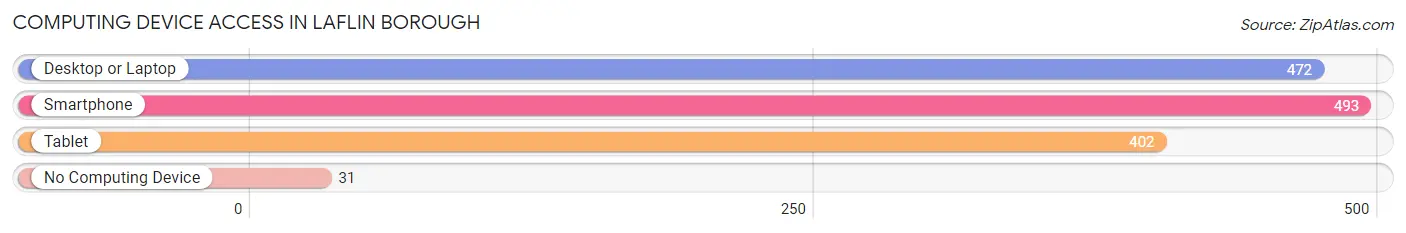
| Device Type | # Households | % Households |
| Desktop or Laptop | 472 | 82.8% |
| Smartphone | 493 | 86.5% |
| Tablet | 402 | 70.5% |
| No Computing Device | 31 | 5.4% |
| Total | 570 | 100.0% |
Internet Access in Laflin borough
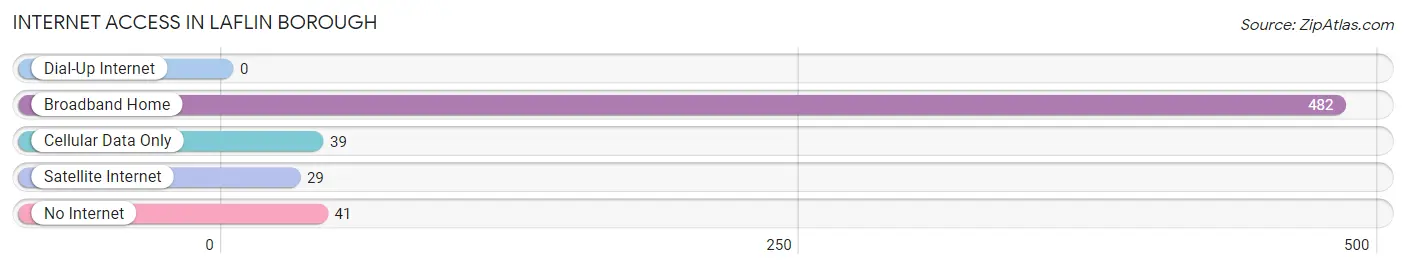
| Internet Type | # Households | % Households |
| Dial-Up Internet | 0 | 0.0% |
| Broadband Home | 482 | 84.6% |
| Cellular Data Only | 39 | 6.8% |
| Satellite Internet | 29 | 5.1% |
| No Internet | 41 | 7.2% |
| Total | 570 | 100.0% |
Laflin borough Summary
Laflin Borough is a small borough located in Luzerne County, Pennsylvania. It is situated in the Wyoming Valley, a region of the Northeastern United States. The borough is located approximately 8 miles south of Wilkes-Barre, the county seat. The population of Laflin Borough was 1,845 at the 2010 census.
History
Laflin Borough was founded in 1845 by William Laflin, a local businessman. The borough was named after him. The area was originally part of Pittston Township, but was incorporated as a separate borough in 1845. The borough was originally a small farming community, but grew rapidly in the late 19th and early 20th centuries due to the coal mining industry. The borough was home to several coal mines, including the Laflin Mine, which was in operation from 1845 to 1891.
Geography
Laflin Borough is located in the Wyoming Valley of Northeastern Pennsylvania. The borough is situated in the foothills of the Pocono Mountains, and is bordered by Pittston Township to the north, Jenkins Township to the east, and Plains Township to the south. The borough is located approximately 8 miles south of Wilkes-Barre, the county seat.
The borough has a total area of 1.2 square miles, all of which is land. The borough is located in the Susquehanna River watershed. The borough is located in the Eastern Standard Time Zone.
Economy
The economy of Laflin Borough is largely based on the coal mining industry. The borough was home to several coal mines, including the Laflin Mine, which was in operation from 1845 to 1891. The borough is also home to several small businesses, including restaurants, retail stores, and service providers.
Demographics
As of the 2010 census, the population of Laflin Borough was 1,845. The racial makeup of the borough was 97.3% White, 0.9% African American, 0.2% Native American, 0.2% Asian, 0.2% from other races, and 1.2% from two or more races. Hispanic or Latino of any race were 1.2% of the population.
The median income for a household in the borough was $41,250, and the median income for a family was $48,750. The per capita income for the borough was $19,945. About 8.2% of families and 10.2% of the population were below the poverty line, including 14.2% of those under age 18 and 8.2% of those age 65 or over.
Common Questions
What is the Total Population of Laflin borough?
Total Population of Laflin borough is 1,427.
What is the Total Male Population of Laflin borough?
Total Male Population of Laflin borough is 712.
What is the Total Female Population of Laflin borough?
Total Female Population of Laflin borough is 715.
What is the Ratio of Males per 100 Females in Laflin borough?
There are 99.58 Males per 100 Females in Laflin borough.
What is the Ratio of Females per 100 Males in Laflin borough?
There are 100.42 Females per 100 Males in Laflin borough.
What is the Median Population Age in Laflin borough?
Median Population Age in Laflin borough is 48.4 Years.
What is the Average Family Size in Laflin borough
Average Family Size in Laflin borough is 2.8 People.
What is the Average Household Size in Laflin borough
Average Household Size in Laflin borough is 2.5 People.
What is Per Capita Income in Laflin borough?
Per Capita income in Laflin borough is $49,070.
What is the Median Family Income in Laflin borough?
Median Family Income in Laflin borough is $119,063.
What is the Median Household income in Laflin borough?
Median Household Income in Laflin borough is $104,286.
What is Income or Wage Gap in Laflin borough?
Income or Wage Gap in Laflin borough is 17.3%.
Women in Laflin borough earn 82.7 cents for every dollar earned by a man.
What is Inequality or Gini Index in Laflin borough?
Inequality or Gini Index in Laflin borough is 0.37.
How Large is the Labor Force in Laflin borough?
There are 771 People in the Labor Forcein in Laflin borough.
What is the Percentage of People in the Labor Force in Laflin borough?
65.1% of People are in the Labor Force in Laflin borough.
What is the Unemployment Rate in Laflin borough?
Unemployment Rate in Laflin borough is 4.7%.