Jennerstown borough, PA
Jennerstown borough Overview
1,182
TOTAL POPULATION
643
MALE POPULATION
539
FEMALE POPULATION
119.29
MALES / 100 FEMALES
83.83
FEMALES / 100 MALES
43.5
MEDIAN AGE
3.6
AVG FAMILY SIZE
3.5
AVG HOUSEHOLD SIZE
$39,768
PER CAPITA INCOME
$59,460
AVG FAMILY INCOME
$59,049
AVG HOUSEHOLD INCOME
25.8%
WAGE / INCOME GAP [ % ]
74.2¢/ $1
WAGE / INCOME GAP [ $ ]
0.48
INEQUALITY / GINI INDEX
667
LABOR FORCE [ PEOPLE ]
63.6%
PERCENT IN LABOR FORCE
5.4%
UNEMPLOYMENT RATE
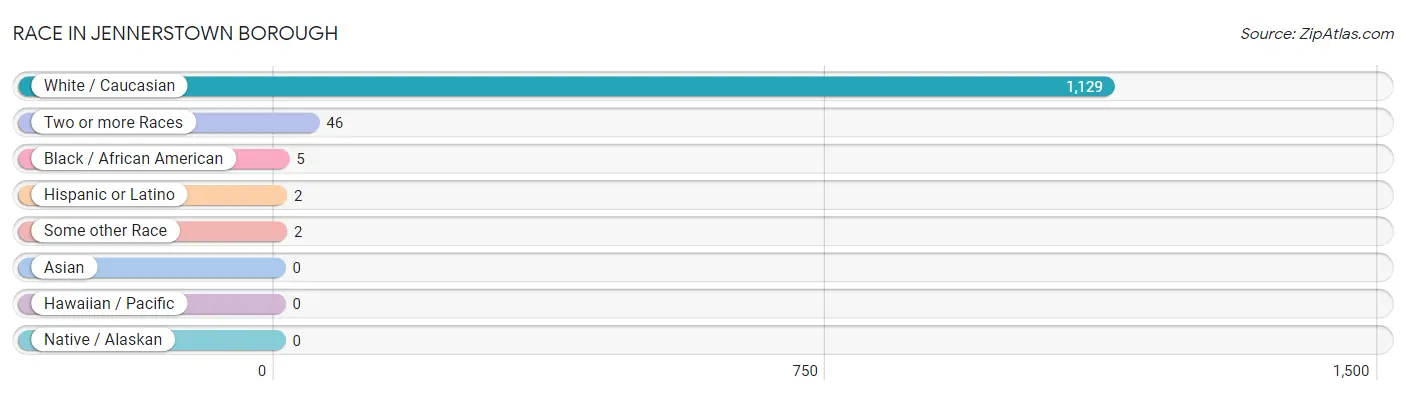
Race in Jennerstown borough
The most populous races in Jennerstown borough are White / Caucasian (1,129 | 95.5%), Two or more Races (46 | 3.9%), and Black / African American (5 | 0.4%).
| Race | # Population | % Population |
| Asian | 0 | 0.0% |
| Black / African American | 5 | 0.4% |
| Hawaiian / Pacific | 0 | 0.0% |
| Hispanic or Latino | 2 | 0.2% |
| Native / Alaskan | 0 | 0.0% |
| White / Caucasian | 1,129 | 95.5% |
| Two or more Races | 46 | 3.9% |
| Some other Race | 2 | 0.2% |
| Total | 1,182 | 100.0% |
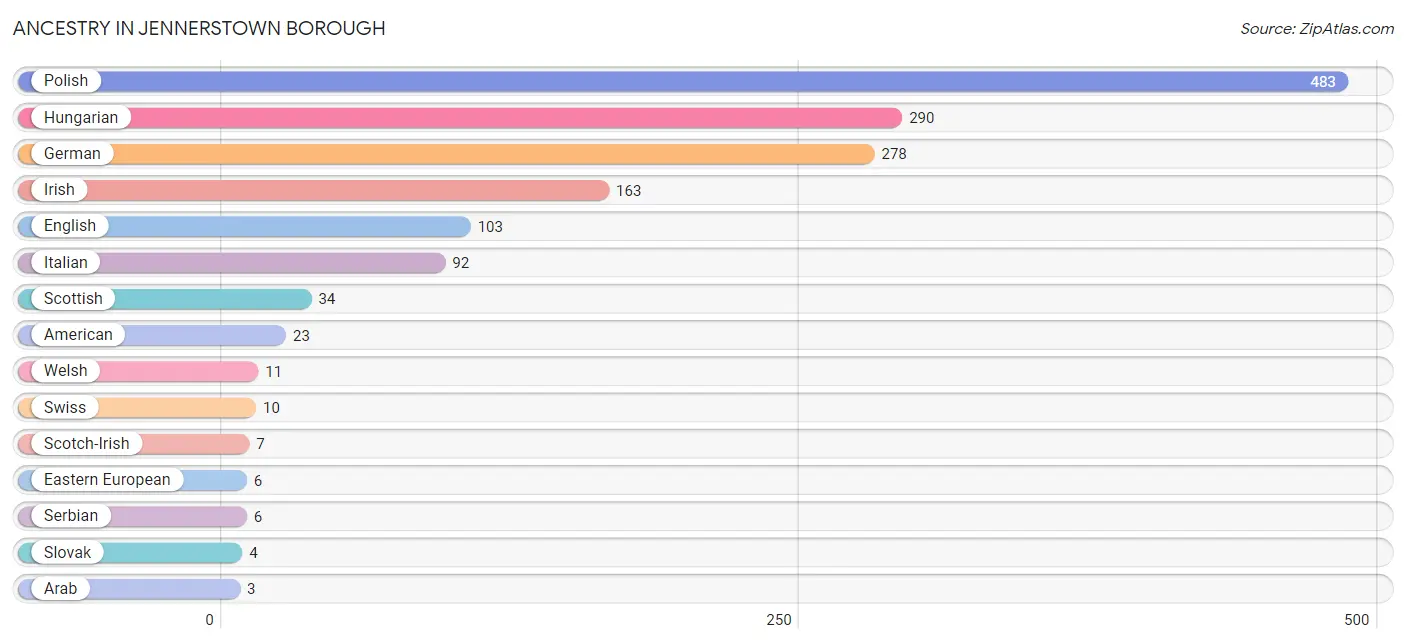
Ancestry in Jennerstown borough
The most populous ancestries reported in Jennerstown borough are Polish (483 | 40.9%), Hungarian (290 | 24.5%), German (278 | 23.5%), Irish (163 | 13.8%), and English (103 | 8.7%), together accounting for 111.4% of all Jennerstown borough residents.
| Ancestry | # Population | % Population |
| American | 23 | 1.9% |
| Arab | 3 | 0.3% |
| Austrian | 2 | 0.2% |
| Cuban | 2 | 0.2% |
| Czechoslovakian | 2 | 0.2% |
| Dutch | 2 | 0.2% |
| Eastern European | 6 | 0.5% |
| English | 103 | 8.7% |
| European | 2 | 0.2% |
| French | 2 | 0.2% |
| German | 278 | 23.5% |
| Hungarian | 290 | 24.5% |
| Irish | 163 | 13.8% |
| Italian | 92 | 7.8% |
| Lithuanian | 2 | 0.2% |
| Pennsylvania German | 3 | 0.3% |
| Polish | 483 | 40.9% |
| Scotch-Irish | 7 | 0.6% |
| Scottish | 34 | 2.9% |
| Serbian | 6 | 0.5% |
| Slovak | 4 | 0.3% |
| Swiss | 10 | 0.9% |
| Syrian | 3 | 0.3% |
| Welsh | 11 | 0.9% | View All 24 Rows |
Immigrants in Jennerstown borough

| Immigration Origin | # Population | % Population | View All 0 Rows |
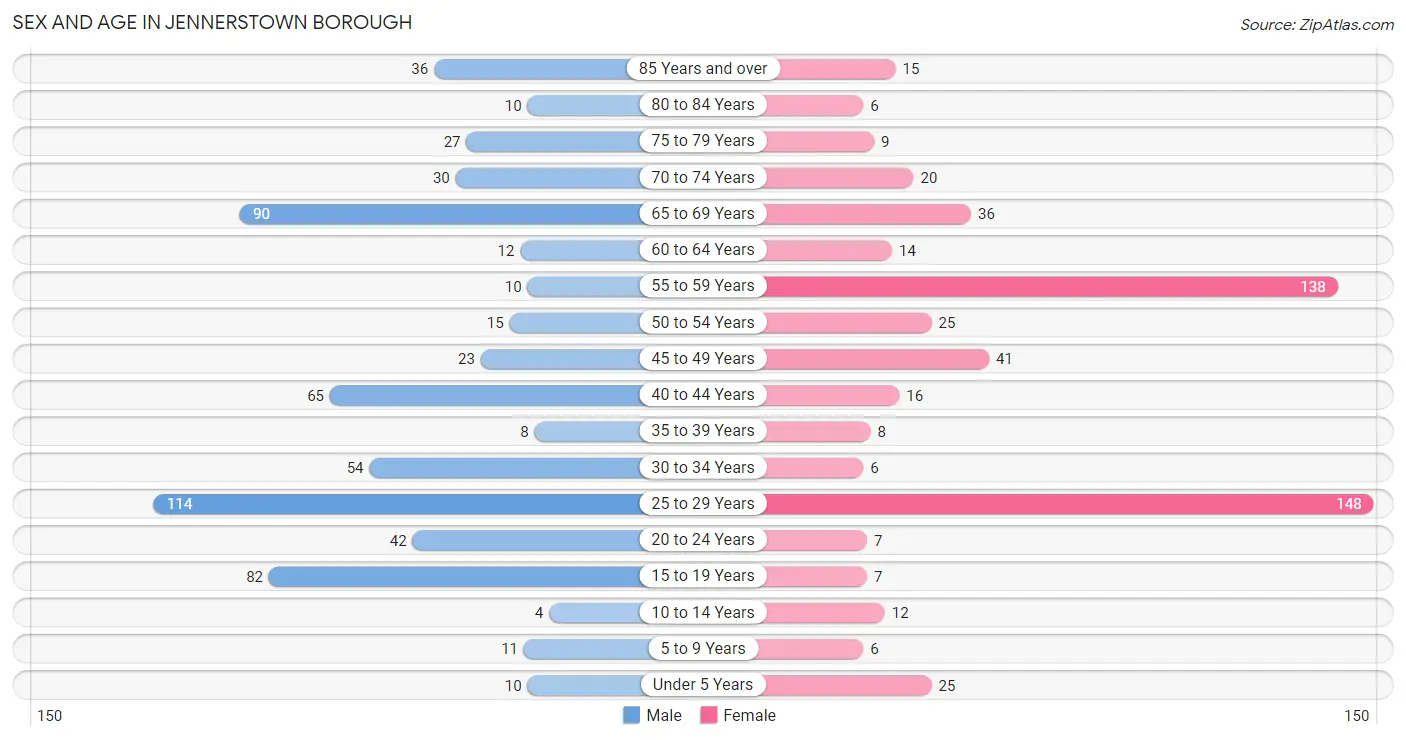
Sex and Age in Jennerstown borough
Sex and Age in Jennerstown borough
The most populous age groups in Jennerstown borough are 25 to 29 Years (114 | 17.7%) for men and 25 to 29 Years (148 | 27.5%) for women.
| Age Bracket | Male | Female |
| Under 5 Years | 10 (1.6%) | 25 (4.6%) |
| 5 to 9 Years | 11 (1.7%) | 6 (1.1%) |
| 10 to 14 Years | 4 (0.6%) | 12 (2.2%) |
| 15 to 19 Years | 82 (12.8%) | 7 (1.3%) |
| 20 to 24 Years | 42 (6.5%) | 7 (1.3%) |
| 25 to 29 Years | 114 (17.7%) | 148 (27.5%) |
| 30 to 34 Years | 54 (8.4%) | 6 (1.1%) |
| 35 to 39 Years | 8 (1.2%) | 8 (1.5%) |
| 40 to 44 Years | 65 (10.1%) | 16 (3.0%) |
| 45 to 49 Years | 23 (3.6%) | 41 (7.6%) |
| 50 to 54 Years | 15 (2.3%) | 25 (4.6%) |
| 55 to 59 Years | 10 (1.6%) | 138 (25.6%) |
| 60 to 64 Years | 12 (1.9%) | 14 (2.6%) |
| 65 to 69 Years | 90 (14.0%) | 36 (6.7%) |
| 70 to 74 Years | 30 (4.7%) | 20 (3.7%) |
| 75 to 79 Years | 27 (4.2%) | 9 (1.7%) |
| 80 to 84 Years | 10 (1.6%) | 6 (1.1%) |
| 85 Years and over | 36 (5.6%) | 15 (2.8%) |
| Total | 643 (100.0%) | 539 (100.0%) |
Families and Households in Jennerstown borough
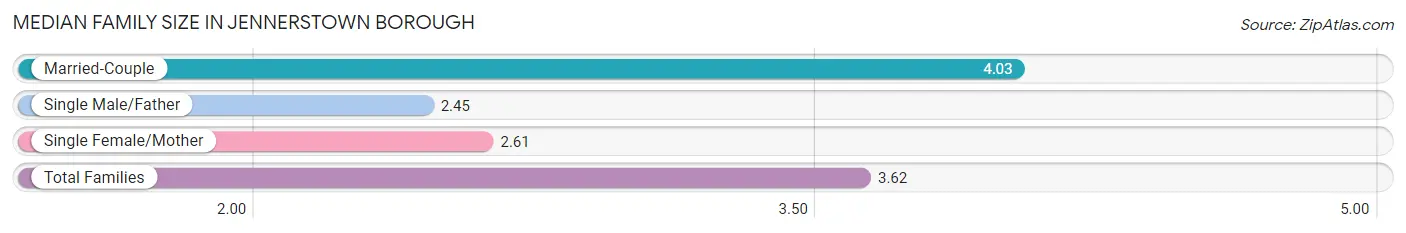
Median Family Size in Jennerstown borough
The median family size in Jennerstown borough is 3.62 persons per family, with married-couple families (192 | 73.0%) accounting for the largest median family size of 4.03 persons per family. On the other hand, single male/father families (53 | 20.2%) represent the smallest median family size with 2.45 persons per family.
| Family Type | # Families | Family Size |
| Married-Couple | 192 (73.0%) | 4.03 |
| Single Male/Father | 53 (20.2%) | 2.45 |
| Single Female/Mother | 18 (6.8%) | 2.61 |
| Total Families | 263 (100.0%) | 3.62 |
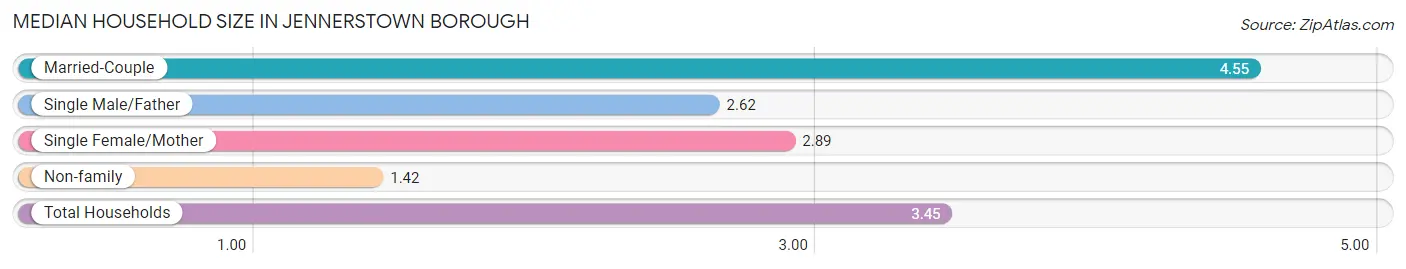
Median Household Size in Jennerstown borough
The median household size in Jennerstown borough is 3.45 persons per household, with married-couple households (192 | 56.3%) accounting for the largest median household size of 4.55 persons per household. non-family households (78 | 22.9%) represent the smallest median household size with 1.42 persons per household.
| Household Type | # Households | Household Size |
| Married-Couple | 192 (56.3%) | 4.55 |
| Single Male/Father | 53 (15.5%) | 2.62 |
| Single Female/Mother | 18 (5.3%) | 2.89 |
| Non-family | 78 (22.9%) | 1.42 |
| Total Households | 341 (100.0%) | 3.45 |
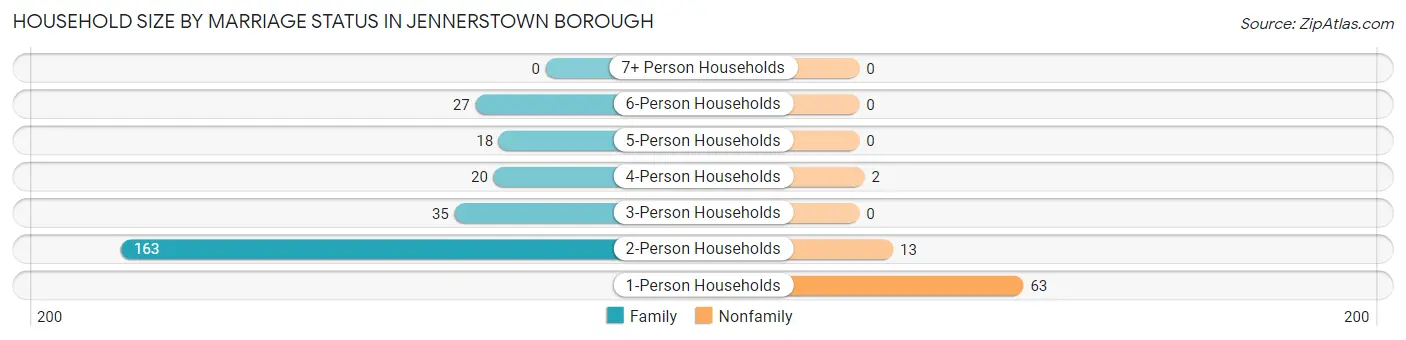
Household Size by Marriage Status in Jennerstown borough
Out of a total of 341 households in Jennerstown borough, 263 (77.1%) are family households, while 78 (22.9%) are nonfamily households. The most numerous type of family households are 2-person households, comprising 163, and the most common type of nonfamily households are 1-person households, comprising 63.
| Household Size | Family Households | Nonfamily Households |
| 1-Person Households | - | 63 (18.5%) |
| 2-Person Households | 163 (47.8%) | 13 (3.8%) |
| 3-Person Households | 35 (10.3%) | 0 (0.0%) |
| 4-Person Households | 20 (5.9%) | 2 (0.6%) |
| 5-Person Households | 18 (5.3%) | 0 (0.0%) |
| 6-Person Households | 27 (7.9%) | 0 (0.0%) |
| 7+ Person Households | 0 (0.0%) | 0 (0.0%) |
| Total | 263 (77.1%) | 78 (22.9%) |
Female Fertility in Jennerstown borough
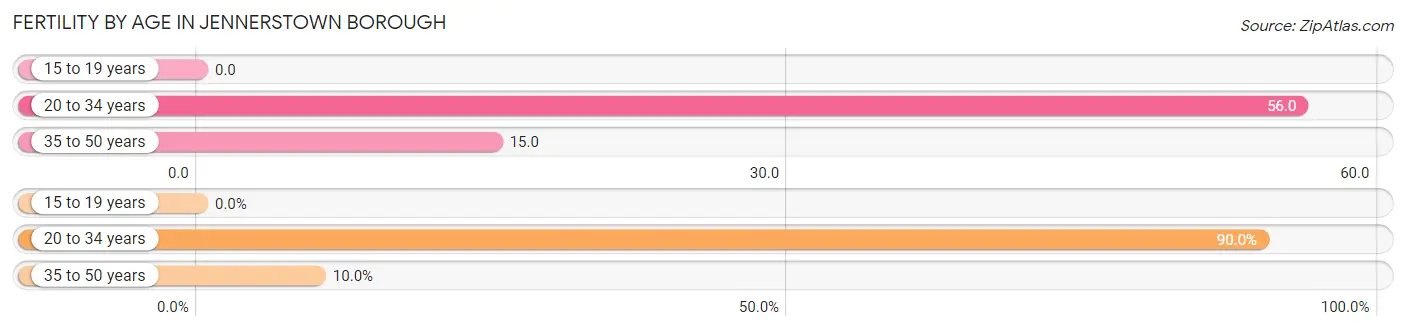
Fertility by Age in Jennerstown borough
Average fertility rate in Jennerstown borough is 43.0 births per 1,000 women. Women in the age bracket of 20 to 34 years have the highest fertility rate with 56.0 births per 1,000 women. Women in the age bracket of 20 to 34 years acount for 90.0% of all women with births.
| Age Bracket | Women with Births | Births / 1,000 Women |
| 15 to 19 years | 0 (0.0%) | 0.0 |
| 20 to 34 years | 9 (90.0%) | 56.0 |
| 35 to 50 years | 1 (10.0%) | 15.0 |
| Total | 10 (100.0%) | 43.0 |
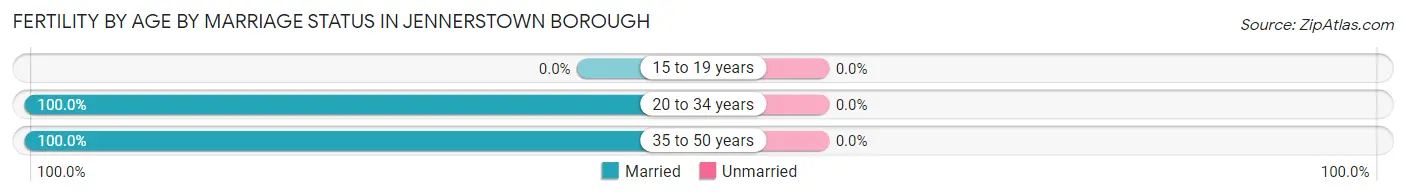
Fertility by Age by Marriage Status in Jennerstown borough
| Age Bracket | Married | Unmarried |
| 15 to 19 years | 0 (0.0%) | 0 (0.0%) |
| 20 to 34 years | 9 (100.0%) | 0 (0.0%) |
| 35 to 50 years | 1 (100.0%) | 0 (0.0%) |
| Total | 10 (100.0%) | 0 (0.0%) |
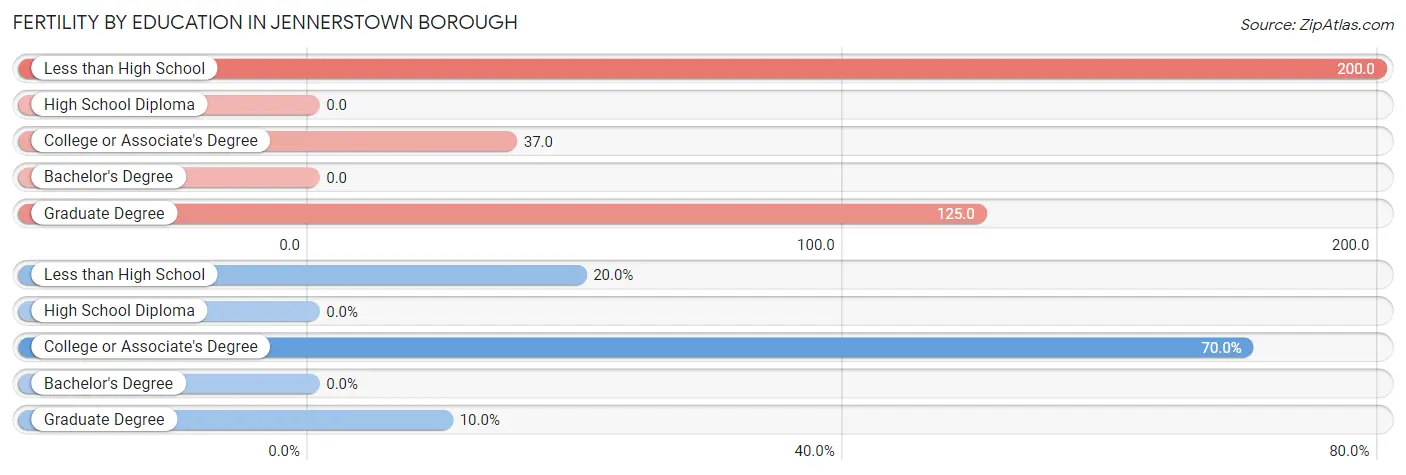
Fertility by Education in Jennerstown borough
| Educational Attainment | Women with Births | Births / 1,000 Women |
| Less than High School | 2 (20.0%) | 200.0 |
| High School Diploma | 0 (0.0%) | 0.0 |
| College or Associate's Degree | 7 (70.0%) | 37.0 |
| Bachelor's Degree | 0 (0.0%) | 0.0 |
| Graduate Degree | 1 (10.0%) | 125.0 |
| Total | 10 (100.0%) | 43.0 |
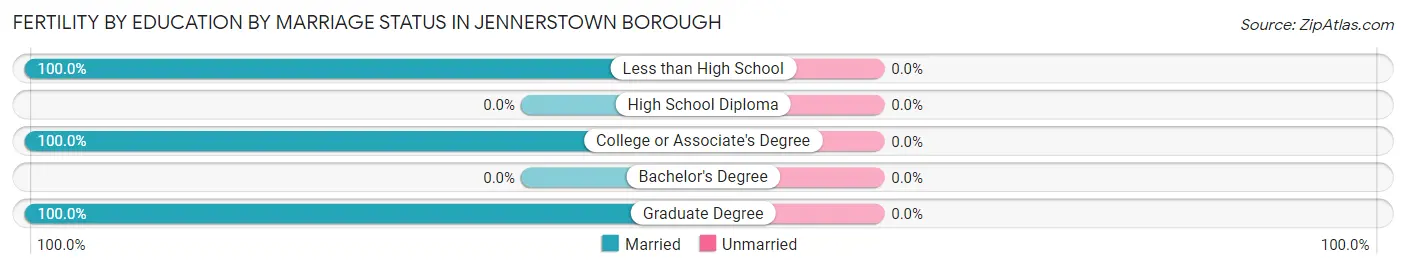
Fertility by Education by Marriage Status in Jennerstown borough
| Educational Attainment | Married | Unmarried |
| Less than High School | 2 (100.0%) | 0 (0.0%) |
| High School Diploma | 0 (0.0%) | 0 (0.0%) |
| College or Associate's Degree | 7 (100.0%) | 0 (0.0%) |
| Bachelor's Degree | 0 (0.0%) | 0 (0.0%) |
| Graduate Degree | 1 (100.0%) | 0 (0.0%) |
| Total | 10 (100.0%) | 0 (0.0%) |
Income in Jennerstown borough
Income Overview in Jennerstown borough
Per Capita Income in Jennerstown borough is $39,768, while median incomes of families and households are $59,460 and $59,049 respectively.
| Characteristic | Number | Measure |
| Per Capita Income | 1,182 | $39,768 |
| Median Family Income | 263 | $59,460 |
| Mean Family Income | 263 | $93,120 |
| Median Household Income | 341 | $59,049 |
| Mean Household Income | 341 | $96,360 |
| Income Deficit | 263 | $0 |
| Wage / Income Gap (%) | 1,182 | 25.78% |
| Wage / Income Gap ($) | 1,182 | 74.22¢ per $1 |
| Gini / Inequality Index | 1,182 | 0.48 |
Earnings by Sex in Jennerstown borough
Average Earnings in Jennerstown borough are $45,505, $46,436 for men and $34,463 for women, a difference of 25.8%.
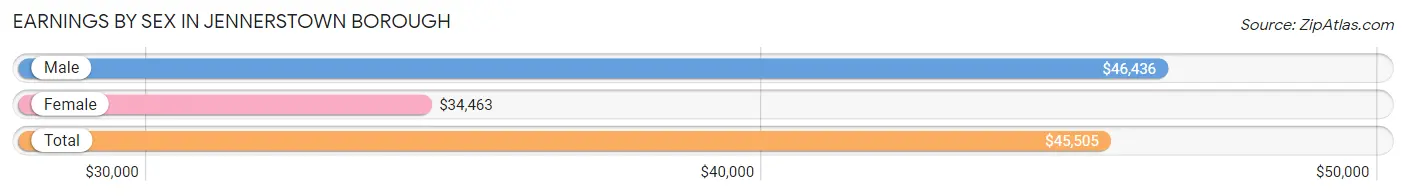
| Sex | Number | Average Earnings |
| Male | 336 (48.5%) | $46,436 |
| Female | 356 (51.4%) | $34,463 |
| Total | 692 (100.0%) | $45,505 |
Earnings by Sex by Income Bracket in Jennerstown borough
The most common earnings brackets in Jennerstown borough are $45,000 to $49,999 for men (110 | 32.7%) and $30,000 to $34,999 for women (107 | 30.1%).
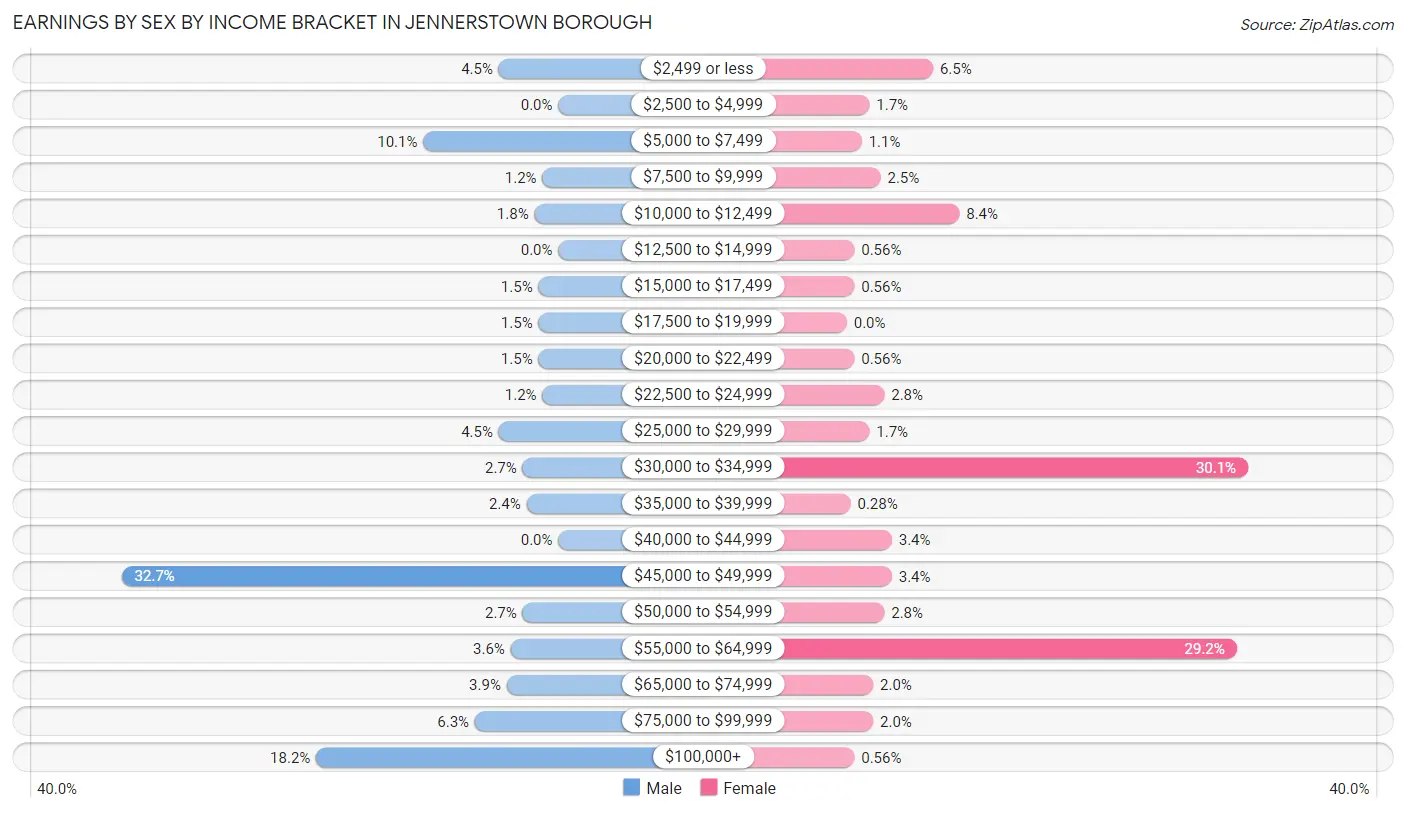
| Income | Male | Female |
| $2,499 or less | 15 (4.5%) | 23 (6.5%) |
| $2,500 to $4,999 | 0 (0.0%) | 6 (1.7%) |
| $5,000 to $7,499 | 34 (10.1%) | 4 (1.1%) |
| $7,500 to $9,999 | 4 (1.2%) | 9 (2.5%) |
| $10,000 to $12,499 | 6 (1.8%) | 30 (8.4%) |
| $12,500 to $14,999 | 0 (0.0%) | 2 (0.6%) |
| $15,000 to $17,499 | 5 (1.5%) | 2 (0.6%) |
| $17,500 to $19,999 | 5 (1.5%) | 0 (0.0%) |
| $20,000 to $22,499 | 5 (1.5%) | 2 (0.6%) |
| $22,500 to $24,999 | 4 (1.2%) | 10 (2.8%) |
| $25,000 to $29,999 | 15 (4.5%) | 6 (1.7%) |
| $30,000 to $34,999 | 9 (2.7%) | 107 (30.1%) |
| $35,000 to $39,999 | 8 (2.4%) | 1 (0.3%) |
| $40,000 to $44,999 | 0 (0.0%) | 12 (3.4%) |
| $45,000 to $49,999 | 110 (32.7%) | 12 (3.4%) |
| $50,000 to $54,999 | 9 (2.7%) | 10 (2.8%) |
| $55,000 to $64,999 | 12 (3.6%) | 104 (29.2%) |
| $65,000 to $74,999 | 13 (3.9%) | 7 (2.0%) |
| $75,000 to $99,999 | 21 (6.2%) | 7 (2.0%) |
| $100,000+ | 61 (18.1%) | 2 (0.6%) |
| Total | 336 (100.0%) | 356 (100.0%) |
Earnings by Sex by Educational Attainment in Jennerstown borough
Average earnings in Jennerstown borough are $47,030 for men and $34,509 for women, a difference of 26.6%. Men with an educational attainment of bachelor's degree enjoy the highest average annual earnings of $49,000, while those with high school diploma education earn the least with $46,970. Women with an educational attainment of college or associate's degree earn the most with the average annual earnings of $60,168, while those with high school diploma education have the smallest earnings of $33,738.
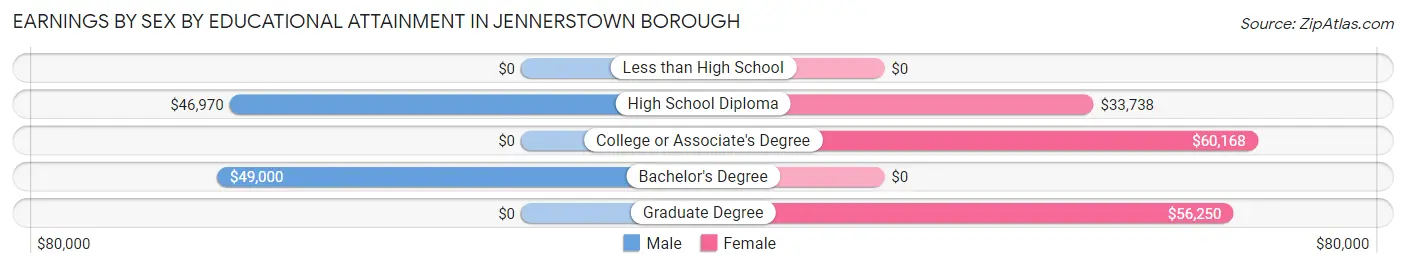
| Educational Attainment | Male Income | Female Income |
| Less than High School | - | - |
| High School Diploma | $46,970 | $33,738 |
| College or Associate's Degree | - | - |
| Bachelor's Degree | $49,000 | $0 |
| Graduate Degree | - | - |
| Total | $47,030 | $34,509 |
Family Income in Jennerstown borough
Family Income Brackets in Jennerstown borough
According to the Jennerstown borough family income data, there are 72 families falling into the $50,000 to $74,999 income range, which is the most common income bracket and makes up 27.4% of all families.
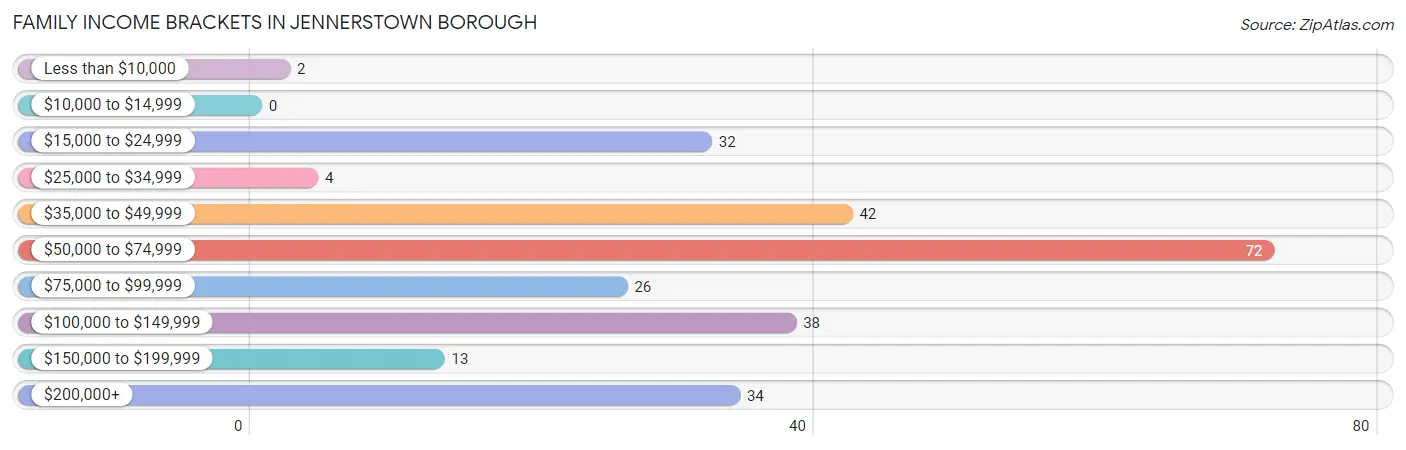
| Income Bracket | # Families | % Families |
| Less than $10,000 | 2 | 0.8% |
| $10,000 to $14,999 | 0 | 0.0% |
| $15,000 to $24,999 | 32 | 12.2% |
| $25,000 to $34,999 | 4 | 1.5% |
| $35,000 to $49,999 | 42 | 16.0% |
| $50,000 to $74,999 | 72 | 27.4% |
| $75,000 to $99,999 | 26 | 9.9% |
| $100,000 to $149,999 | 38 | 14.4% |
| $150,000 to $199,999 | 13 | 4.9% |
| $200,000+ | 34 | 12.9% |
Family Income by Famaliy Size in Jennerstown borough
5-person families (38 | 14.4%) account for the highest median family income in Jennerstown borough with $250,001 per family, while 5-person families (38 | 14.4%) have the highest median income of $50,000 per family member.
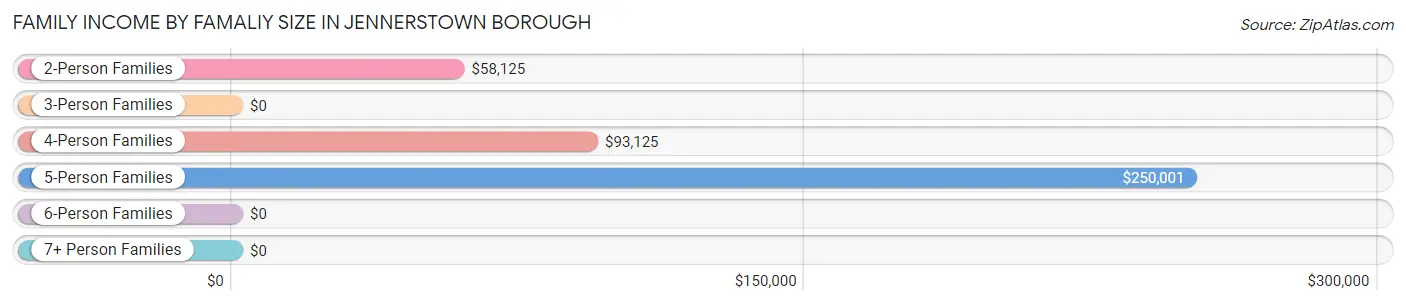
| Income Bracket | # Families | Median Income |
| 2-Person Families | 169 (64.3%) | $58,125 |
| 3-Person Families | 31 (11.8%) | $0 |
| 4-Person Families | 25 (9.5%) | $93,125 |
| 5-Person Families | 38 (14.4%) | $250,001 |
| 6-Person Families | 0 (0.0%) | $0 |
| 7+ Person Families | 0 (0.0%) | $0 |
| Total | 263 (100.0%) | $59,460 |
Family Income by Number of Earners in Jennerstown borough
The median family income in Jennerstown borough is $59,460, with families comprising 3+ earners (54) having the highest median family income of $250,001, while families with 1 earner (81) have the lowest median family income of $44,821, accounting for 20.5% and 30.8% of families, respectively.
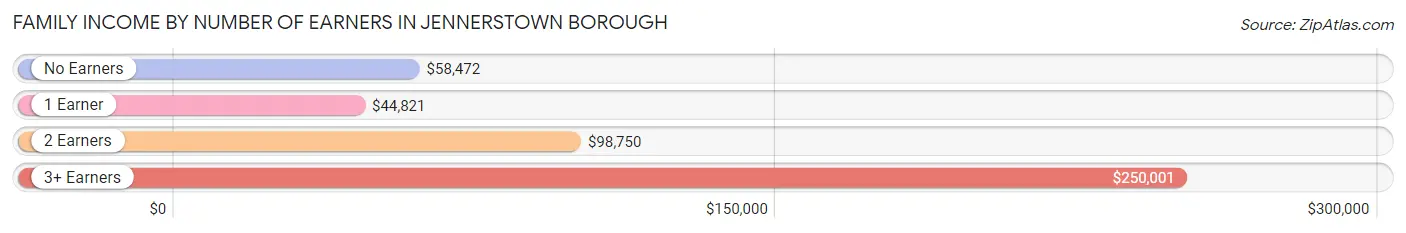
| Number of Earners | # Families | Median Income |
| No Earners | 68 (25.9%) | $58,472 |
| 1 Earner | 81 (30.8%) | $44,821 |
| 2 Earners | 60 (22.8%) | $98,750 |
| 3+ Earners | 54 (20.5%) | $250,001 |
| Total | 263 (100.0%) | $59,460 |
Household Income in Jennerstown borough
Household Income Brackets in Jennerstown borough
With 90 households falling in the category, the $50,000 to $74,999 income range is the most frequent in Jennerstown borough, accounting for 26.4% of all households.
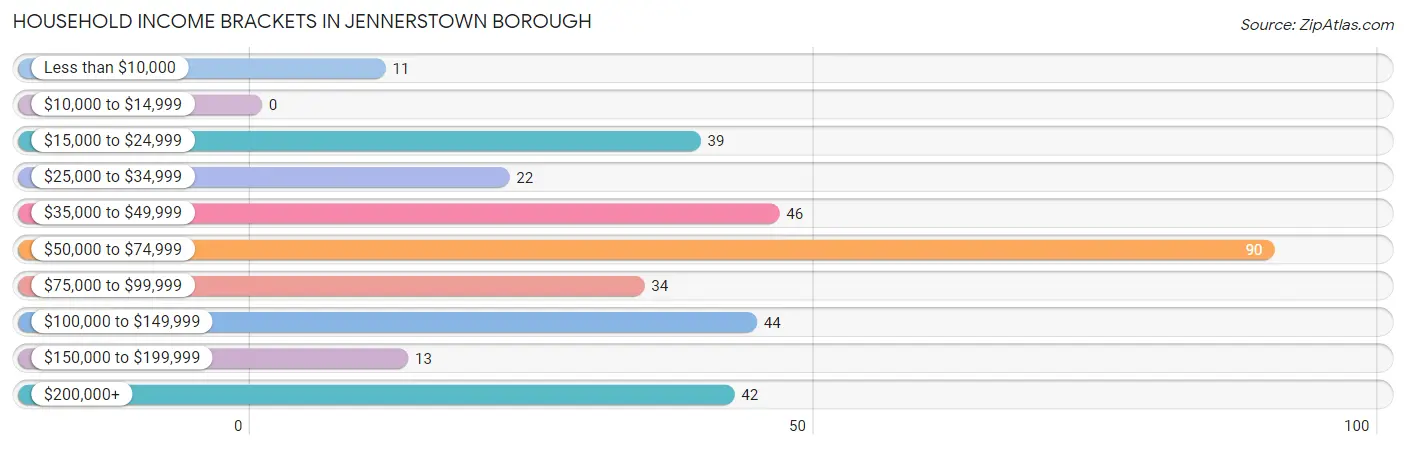
| Income Bracket | # Households | % Households |
| Less than $10,000 | 11 | 3.2% |
| $10,000 to $14,999 | 0 | 0.0% |
| $15,000 to $24,999 | 39 | 11.4% |
| $25,000 to $34,999 | 22 | 6.5% |
| $35,000 to $49,999 | 46 | 13.5% |
| $50,000 to $74,999 | 90 | 26.4% |
| $75,000 to $99,999 | 34 | 10.0% |
| $100,000 to $149,999 | 44 | 12.9% |
| $150,000 to $199,999 | 13 | 3.8% |
| $200,000+ | 42 | 12.3% |
Household Income by Householder Age in Jennerstown borough
The median household income in Jennerstown borough is $59,049, with the highest median household income of $107,188 found in the 45 to 64 years age bracket for the primary householder. A total of 89 households (26.1%) fall into this category. Meanwhile, the 15 to 24 years age bracket for the primary householder has the lowest median household income of $0, with 8 households (2.4%) in this group.
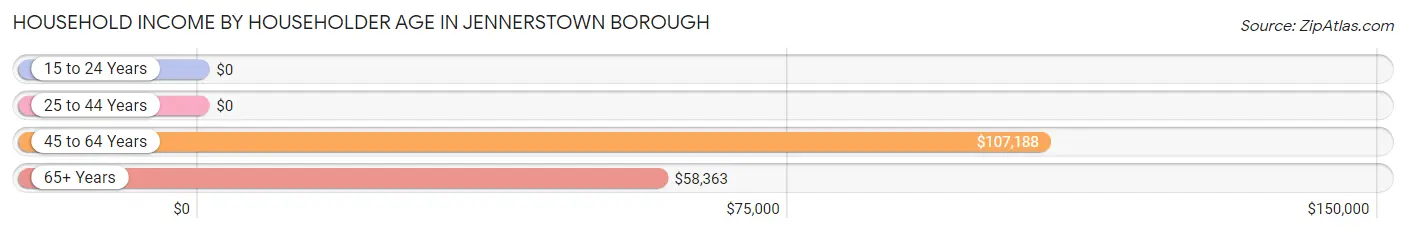
| Income Bracket | # Households | Median Income |
| 15 to 24 Years | 8 (2.4%) | $0 |
| 25 to 44 Years | 85 (24.9%) | $0 |
| 45 to 64 Years | 89 (26.1%) | $107,188 |
| 65+ Years | 159 (46.6%) | $58,363 |
| Total | 341 (100.0%) | $59,049 |
Poverty in Jennerstown borough
Income Below Poverty by Sex and Age in Jennerstown borough
With 5.9% poverty level for males and 12.9% for females among the residents of Jennerstown borough, 25 to 34 year old males and 25 to 34 year old females are the most vulnerable to poverty, with 29 males (17.3%) and 39 females (25.3%) in their respective age groups living below the poverty level.
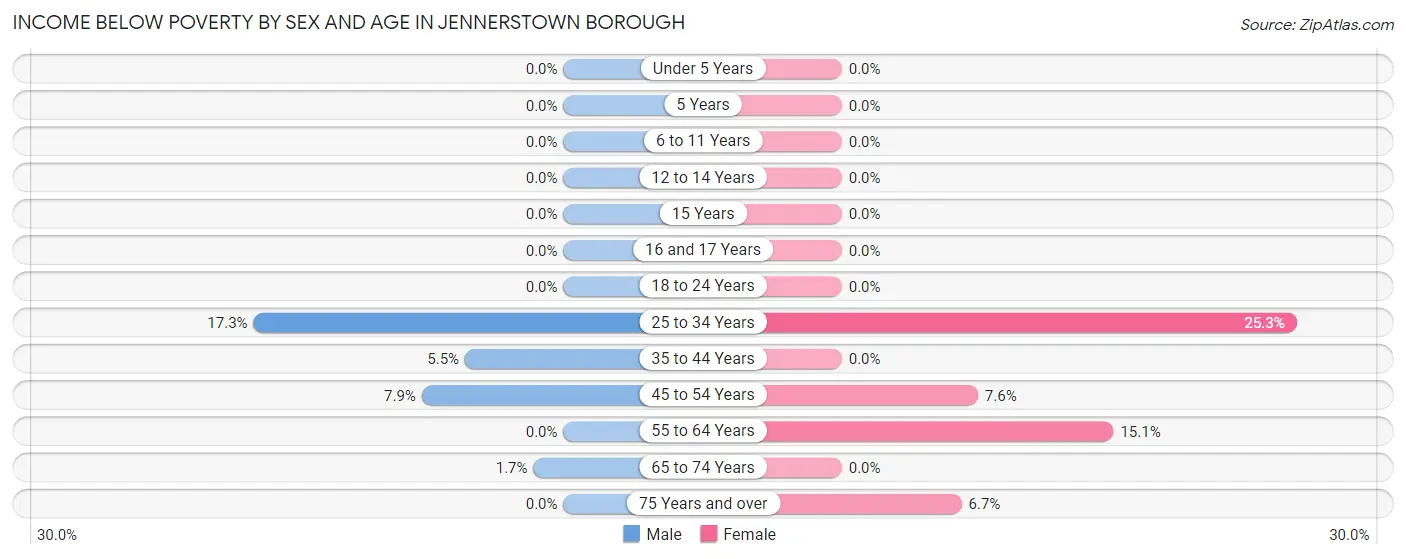
| Age Bracket | Male | Female |
| Under 5 Years | 0 (0.0%) | 0 (0.0%) |
| 5 Years | 0 (0.0%) | 0 (0.0%) |
| 6 to 11 Years | 0 (0.0%) | 0 (0.0%) |
| 12 to 14 Years | 0 (0.0%) | 0 (0.0%) |
| 15 Years | 0 (0.0%) | 0 (0.0%) |
| 16 and 17 Years | 0 (0.0%) | 0 (0.0%) |
| 18 to 24 Years | 0 (0.0%) | 0 (0.0%) |
| 25 to 34 Years | 29 (17.3%) | 39 (25.3%) |
| 35 to 44 Years | 4 (5.5%) | 0 (0.0%) |
| 45 to 54 Years | 3 (7.9%) | 5 (7.6%) |
| 55 to 64 Years | 0 (0.0%) | 23 (15.1%) |
| 65 to 74 Years | 2 (1.7%) | 0 (0.0%) |
| 75 Years and over | 0 (0.0%) | 2 (6.7%) |
| Total | 38 (5.9%) | 69 (12.9%) |
Income Above Poverty by Sex and Age in Jennerstown borough
According to the poverty statistics in Jennerstown borough, males aged under 5 years and females aged under 5 years are the age groups that are most secure financially, with 100.0% of males and 100.0% of females in these age groups living above the poverty line.
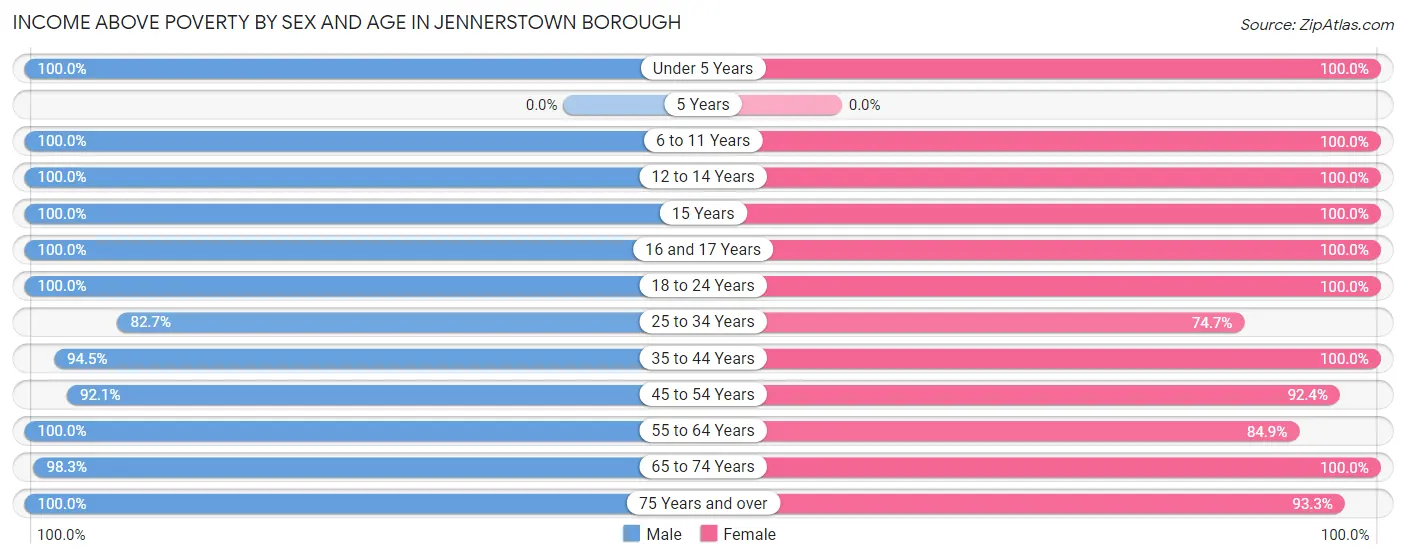
| Age Bracket | Male | Female |
| Under 5 Years | 10 (100.0%) | 25 (100.0%) |
| 5 Years | 0 (0.0%) | 0 (0.0%) |
| 6 to 11 Years | 13 (100.0%) | 9 (100.0%) |
| 12 to 14 Years | 2 (100.0%) | 7 (100.0%) |
| 15 Years | 60 (100.0%) | 5 (100.0%) |
| 16 and 17 Years | 16 (100.0%) | 2 (100.0%) |
| 18 to 24 Years | 48 (100.0%) | 7 (100.0%) |
| 25 to 34 Years | 139 (82.7%) | 115 (74.7%) |
| 35 to 44 Years | 69 (94.5%) | 24 (100.0%) |
| 45 to 54 Years | 35 (92.1%) | 61 (92.4%) |
| 55 to 64 Years | 22 (100.0%) | 129 (84.9%) |
| 65 to 74 Years | 118 (98.3%) | 56 (100.0%) |
| 75 Years and over | 73 (100.0%) | 28 (93.3%) |
| Total | 605 (94.1%) | 468 (87.2%) |
Income Below Poverty Among Married-Couple Families in Jennerstown borough
The poverty statistics for married-couple families in Jennerstown borough show that 16.7% or 32 of the total 192 families live below the poverty line. Families with no children have the highest poverty rate of 24.8%, comprising of 32 families. On the other hand, families with 1 or 2 children have the lowest poverty rate of 0.0%, which includes 0 families.
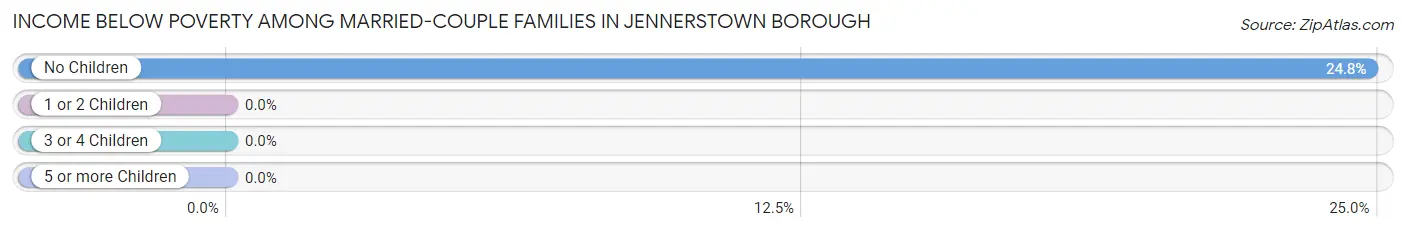
| Children | Above Poverty | Below Poverty |
| No Children | 97 (75.2%) | 32 (24.8%) |
| 1 or 2 Children | 58 (100.0%) | 0 (0.0%) |
| 3 or 4 Children | 5 (100.0%) | 0 (0.0%) |
| 5 or more Children | 0 (0.0%) | 0 (0.0%) |
| Total | 160 (83.3%) | 32 (16.7%) |
Income Below Poverty Among Single-Parent Households in Jennerstown borough
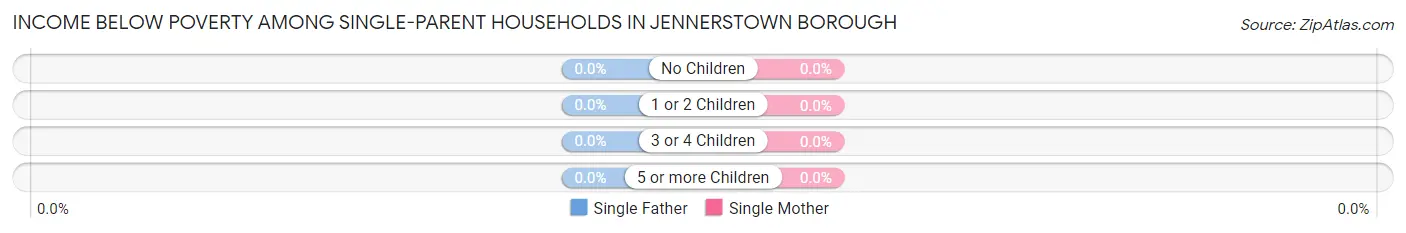
| Children | Single Father | Single Mother |
| No Children | 0 (0.0%) | 0 (0.0%) |
| 1 or 2 Children | 0 (0.0%) | 0 (0.0%) |
| 3 or 4 Children | 0 (0.0%) | 0 (0.0%) |
| 5 or more Children | 0 (0.0%) | 0 (0.0%) |
| Total | 0 (0.0%) | 0 (0.0%) |
Income Below Poverty Among Married-Couple vs Single-Parent Households in Jennerstown borough
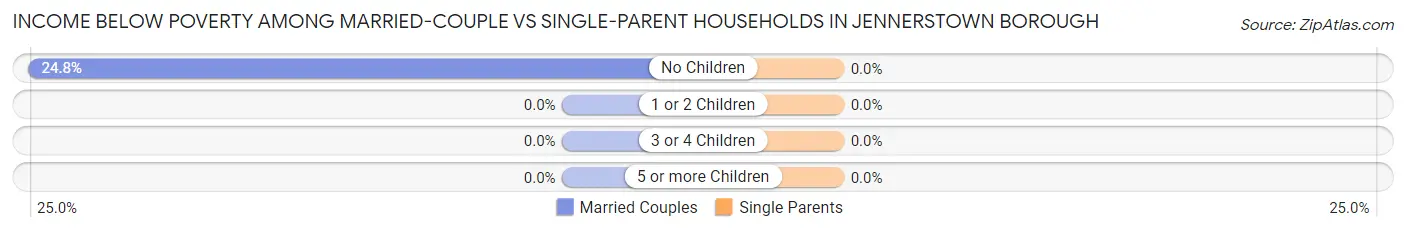
| Children | Married-Couple Families | Single-Parent Households |
| No Children | 32 (24.8%) | 0 (0.0%) |
| 1 or 2 Children | 0 (0.0%) | 0 (0.0%) |
| 3 or 4 Children | 0 (0.0%) | 0 (0.0%) |
| 5 or more Children | 0 (0.0%) | 0 (0.0%) |
| Total | 32 (16.7%) | 0 (0.0%) |
Employment Characteristics in Jennerstown borough
Employment by Class of Employer in Jennerstown borough
Among the 622 employed individuals in Jennerstown borough, private company employees (446 | 71.7%), not-for-profit organizations (115 | 18.5%), and self-employed (not incorporated) (26 | 4.2%) make up the most common classes of employment.
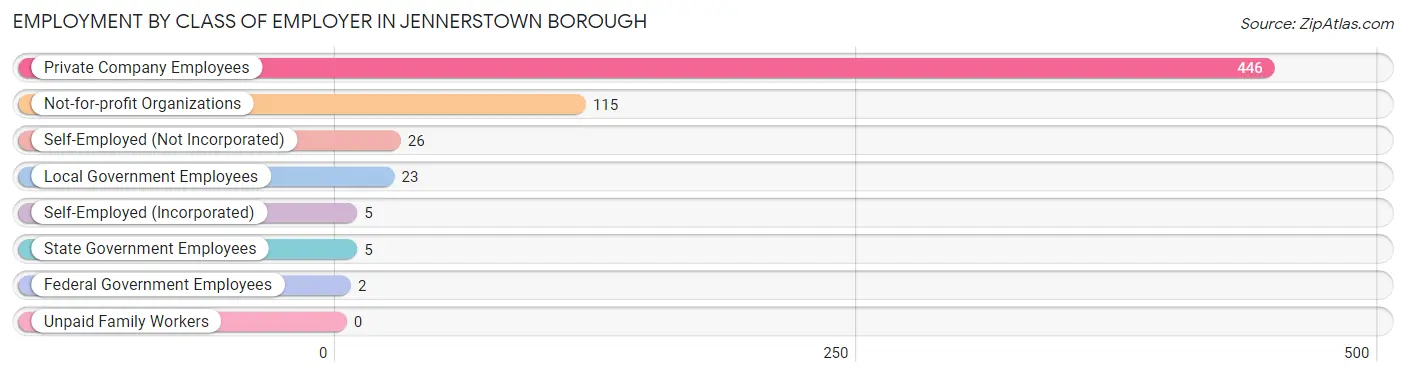
| Employer Class | # Employees | % Employees |
| Private Company Employees | 446 | 71.7% |
| Self-Employed (Incorporated) | 5 | 0.8% |
| Self-Employed (Not Incorporated) | 26 | 4.2% |
| Not-for-profit Organizations | 115 | 18.5% |
| Local Government Employees | 23 | 3.7% |
| State Government Employees | 5 | 0.8% |
| Federal Government Employees | 2 | 0.3% |
| Unpaid Family Workers | 0 | 0.0% |
| Total | 622 | 100.0% |
Employment Status by Age in Jennerstown borough
According to the labor force statistics for Jennerstown borough, out of the total population over 16 years of age (1,049), 63.6% or 667 individuals are in the labor force, with 5.4% or 36 of them unemployed. The age group with the highest labor force participation rate is 35 to 44 years, with 96.9% or 94 individuals in the labor force. Within the labor force, the 30 to 34 years age range has the highest percentage of unemployed individuals, with 60.4% or 29 of them being unemployed.
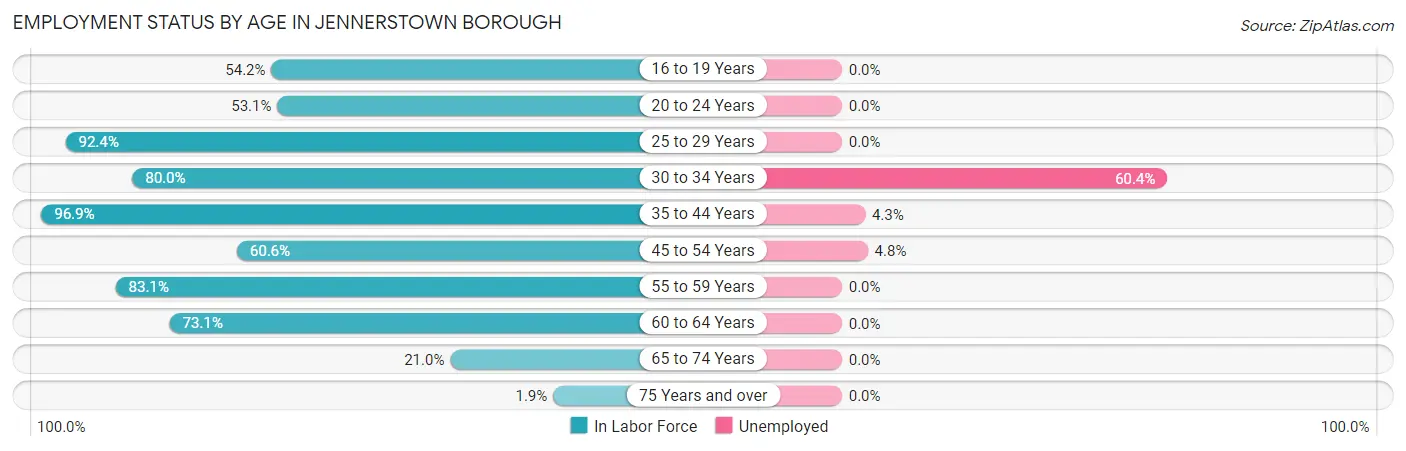
| Age Bracket | In Labor Force | Unemployed |
| 16 to 19 Years | 13 (54.2%) | 0 (0.0%) |
| 20 to 24 Years | 26 (53.1%) | 0 (0.0%) |
| 25 to 29 Years | 242 (92.4%) | 0 (0.0%) |
| 30 to 34 Years | 48 (80.0%) | 29 (60.4%) |
| 35 to 44 Years | 94 (96.9%) | 4 (4.3%) |
| 45 to 54 Years | 63 (60.6%) | 3 (4.8%) |
| 55 to 59 Years | 123 (83.1%) | 0 (0.0%) |
| 60 to 64 Years | 19 (73.1%) | 0 (0.0%) |
| 65 to 74 Years | 37 (21.0%) | 0 (0.0%) |
| 75 Years and over | 2 (1.9%) | 0 (0.0%) |
| Total | 667 (63.6%) | 36 (5.4%) |
Employment Status by Educational Attainment in Jennerstown borough
According to labor force statistics for Jennerstown borough, 84.5% of individuals (589) out of the total population between 25 and 64 years of age (697) are in the labor force, with 6.1% or 36 of them being unemployed. The group with the highest labor force participation rate are those with the educational attainment of less than high school, with 100.0% or 19 individuals in the labor force. Within the labor force, individuals with less than high school education have the highest percentage of unemployment, with 21.1% or 4 of them being unemployed.
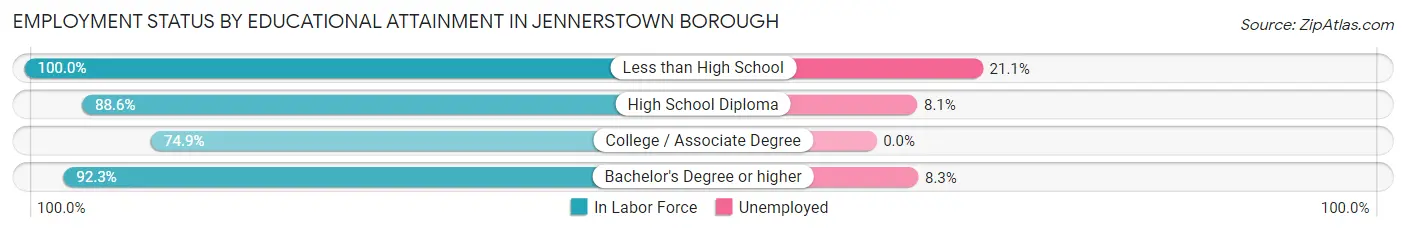
| Educational Attainment | In Labor Force | Unemployed |
| Less than High School | 19 (100.0%) | 4 (21.1%) |
| High School Diploma | 358 (88.6%) | 33 (8.1%) |
| College / Associate Degree | 176 (74.9%) | 0 (0.0%) |
| Bachelor's Degree or higher | 36 (92.3%) | 3 (8.3%) |
| Total | 589 (84.5%) | 43 (6.1%) |
Employment Occupations by Sex in Jennerstown borough
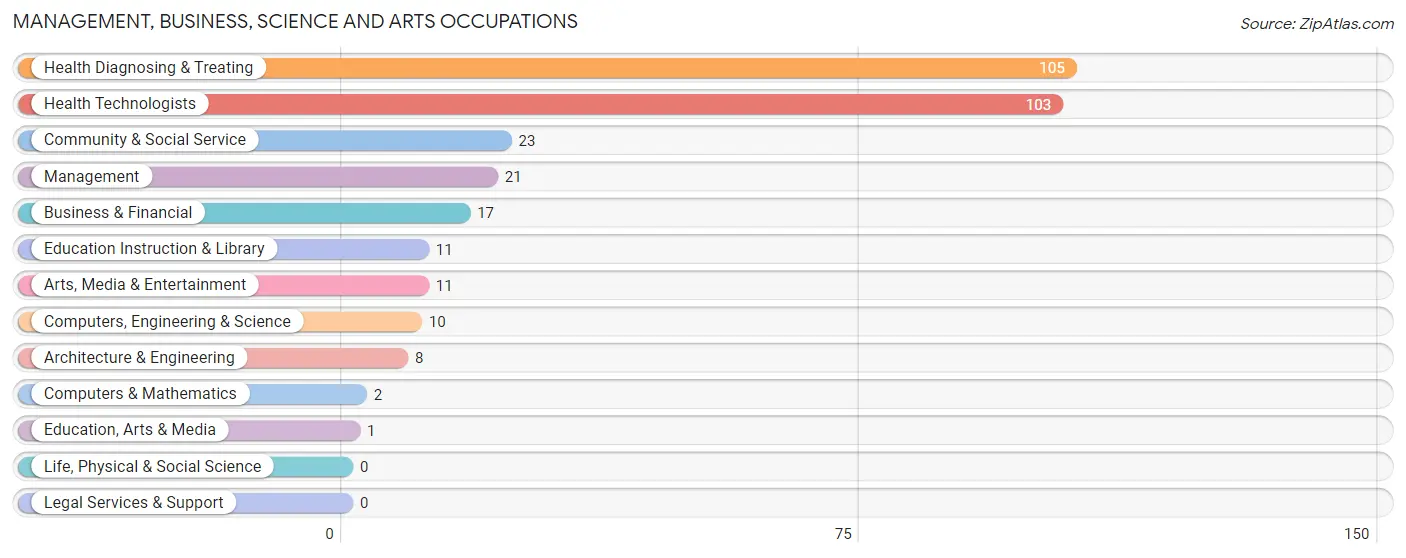
Management, Business, Science and Arts Occupations
The most common Management, Business, Science and Arts occupations in Jennerstown borough are Health Diagnosing & Treating (105 | 16.6%), Health Technologists (103 | 16.3%), Community & Social Service (23 | 3.6%), Management (21 | 3.3%), and Business & Financial (17 | 2.7%).
Management, Business, Science and Arts Occupations by Sex
Within the Management, Business, Science and Arts occupations in Jennerstown borough, the most male-oriented occupations are Computers, Engineering & Science (100.0%), Computers & Mathematics (100.0%), and Architecture & Engineering (100.0%), while the most female-oriented occupations are Education, Arts & Media (100.0%), Education Instruction & Library (100.0%), and Health Diagnosing & Treating (98.1%).
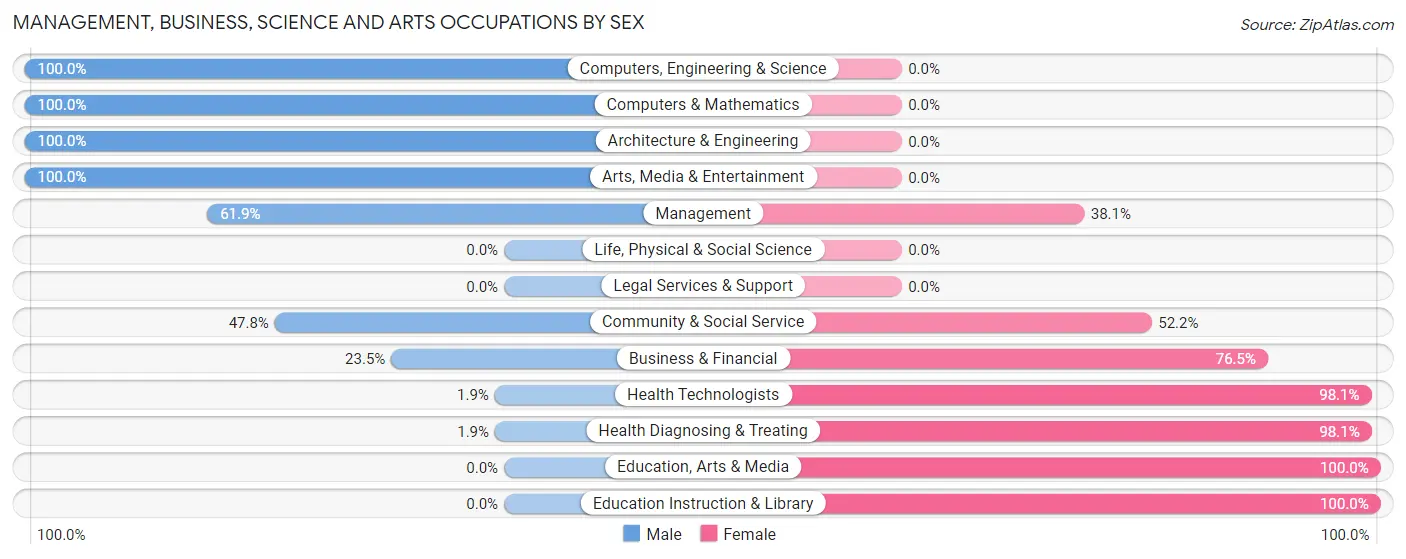
| Occupation | Male | Female |
| Management | 13 (61.9%) | 8 (38.1%) |
| Business & Financial | 4 (23.5%) | 13 (76.5%) |
| Computers, Engineering & Science | 10 (100.0%) | 0 (0.0%) |
| Computers & Mathematics | 2 (100.0%) | 0 (0.0%) |
| Architecture & Engineering | 8 (100.0%) | 0 (0.0%) |
| Life, Physical & Social Science | 0 (0.0%) | 0 (0.0%) |
| Community & Social Service | 11 (47.8%) | 12 (52.2%) |
| Education, Arts & Media | 0 (0.0%) | 1 (100.0%) |
| Legal Services & Support | 0 (0.0%) | 0 (0.0%) |
| Education Instruction & Library | 0 (0.0%) | 11 (100.0%) |
| Arts, Media & Entertainment | 11 (100.0%) | 0 (0.0%) |
| Health Diagnosing & Treating | 2 (1.9%) | 103 (98.1%) |
| Health Technologists | 2 (1.9%) | 101 (98.1%) |
| Total (Category) | 40 (22.7%) | 136 (77.3%) |
| Total (Overall) | 294 (46.6%) | 337 (53.4%) |
Services Occupations
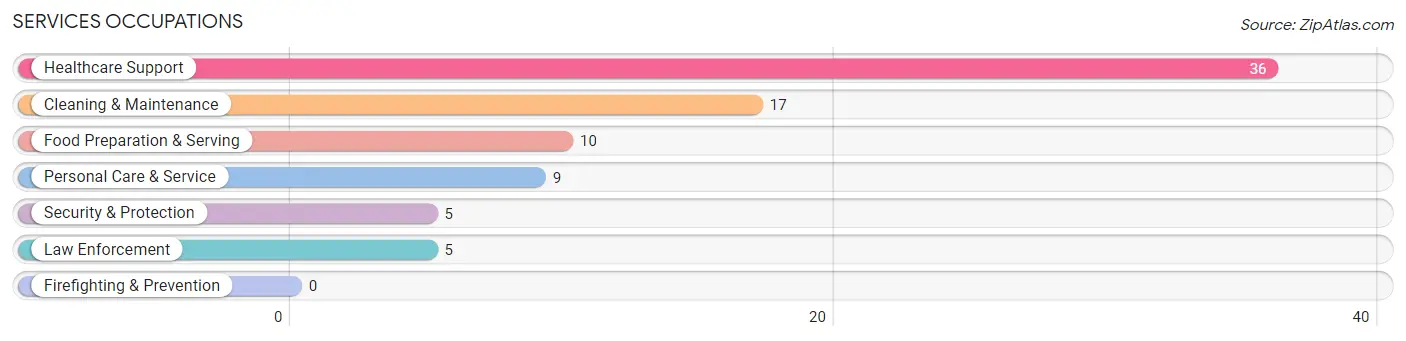
The most common Services occupations in Jennerstown borough are Healthcare Support (36 | 5.7%), Cleaning & Maintenance (17 | 2.7%), Food Preparation & Serving (10 | 1.6%), Personal Care & Service (9 | 1.4%), and Security & Protection (5 | 0.8%).
Services Occupations by Sex
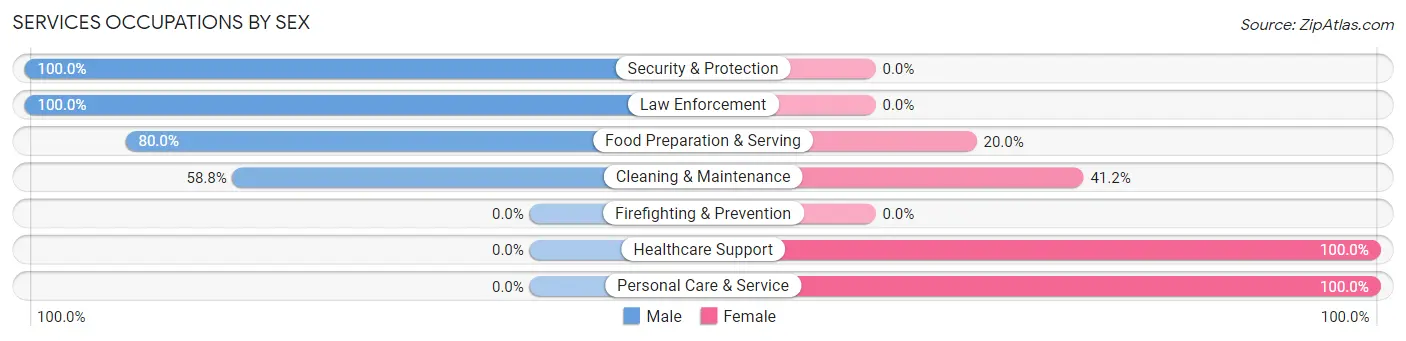
Within the Services occupations in Jennerstown borough, the most male-oriented occupations are Security & Protection (100.0%), Law Enforcement (100.0%), and Food Preparation & Serving (80.0%), while the most female-oriented occupations are Healthcare Support (100.0%), Personal Care & Service (100.0%), and Cleaning & Maintenance (41.2%).
| Occupation | Male | Female |
| Healthcare Support | 0 (0.0%) | 36 (100.0%) |
| Security & Protection | 5 (100.0%) | 0 (0.0%) |
| Firefighting & Prevention | 0 (0.0%) | 0 (0.0%) |
| Law Enforcement | 5 (100.0%) | 0 (0.0%) |
| Food Preparation & Serving | 8 (80.0%) | 2 (20.0%) |
| Cleaning & Maintenance | 10 (58.8%) | 7 (41.2%) |
| Personal Care & Service | 0 (0.0%) | 9 (100.0%) |
| Total (Category) | 23 (29.9%) | 54 (70.1%) |
| Total (Overall) | 294 (46.6%) | 337 (53.4%) |
Sales and Office Occupations
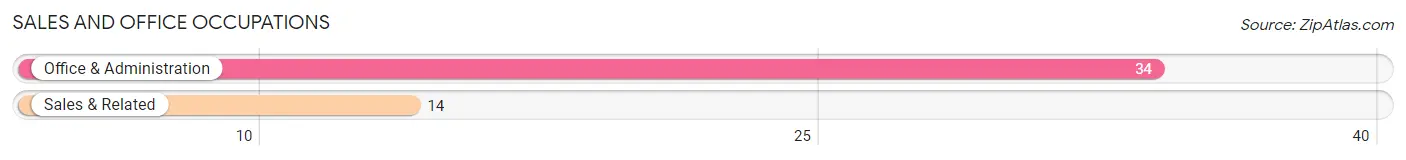
The most common Sales and Office occupations in Jennerstown borough are Office & Administration (34 | 5.4%), and Sales & Related (14 | 2.2%).
Sales and Office Occupations by Sex
| Occupation | Male | Female |
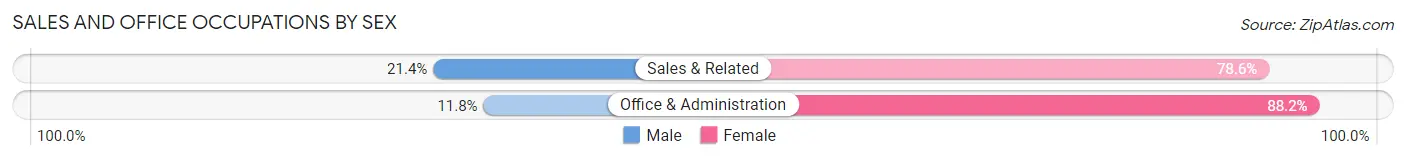
| Sales & Related | 3 (21.4%) | 11 (78.6%) |
| Office & Administration | 4 (11.8%) | 30 (88.2%) |
| Total (Category) | 7 (14.6%) | 41 (85.4%) |
| Total (Overall) | 294 (46.6%) | 337 (53.4%) |
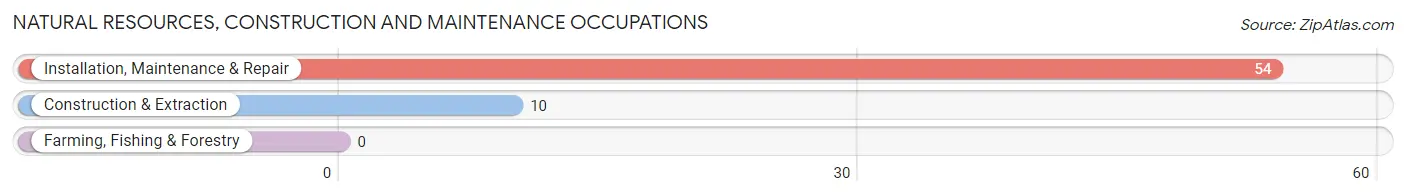
Natural Resources, Construction and Maintenance Occupations
The most common Natural Resources, Construction and Maintenance occupations in Jennerstown borough are Installation, Maintenance & Repair (54 | 8.6%), and Construction & Extraction (10 | 1.6%).
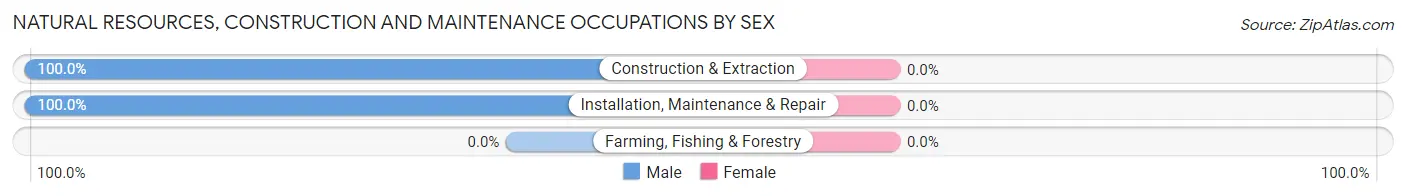
Natural Resources, Construction and Maintenance Occupations by Sex
| Occupation | Male | Female |
| Farming, Fishing & Forestry | 0 (0.0%) | 0 (0.0%) |
| Construction & Extraction | 10 (100.0%) | 0 (0.0%) |
| Installation, Maintenance & Repair | 54 (100.0%) | 0 (0.0%) |
| Total (Category) | 64 (100.0%) | 0 (0.0%) |
| Total (Overall) | 294 (46.6%) | 337 (53.4%) |
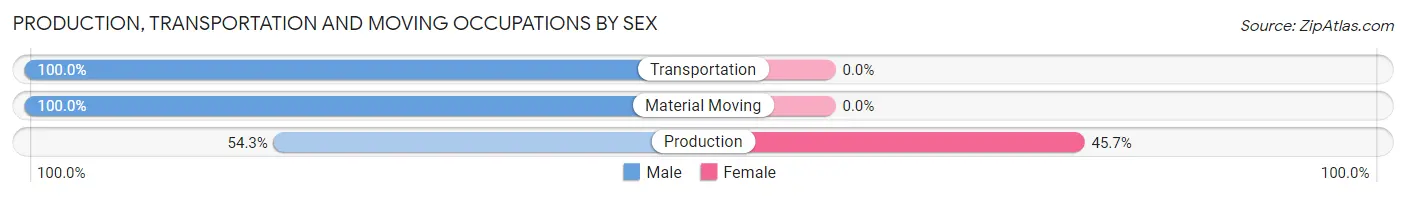
Production, Transportation and Moving Occupations
The most common Production, Transportation and Moving occupations in Jennerstown borough are Production (232 | 36.8%), Transportation (22 | 3.5%), and Material Moving (12 | 1.9%).

Production, Transportation and Moving Occupations by Sex
| Occupation | Male | Female |
| Production | 126 (54.3%) | 106 (45.7%) |
| Transportation | 22 (100.0%) | 0 (0.0%) |
| Material Moving | 12 (100.0%) | 0 (0.0%) |
| Total (Category) | 160 (60.2%) | 106 (39.9%) |
| Total (Overall) | 294 (46.6%) | 337 (53.4%) |
Employment Industries by Sex in Jennerstown borough
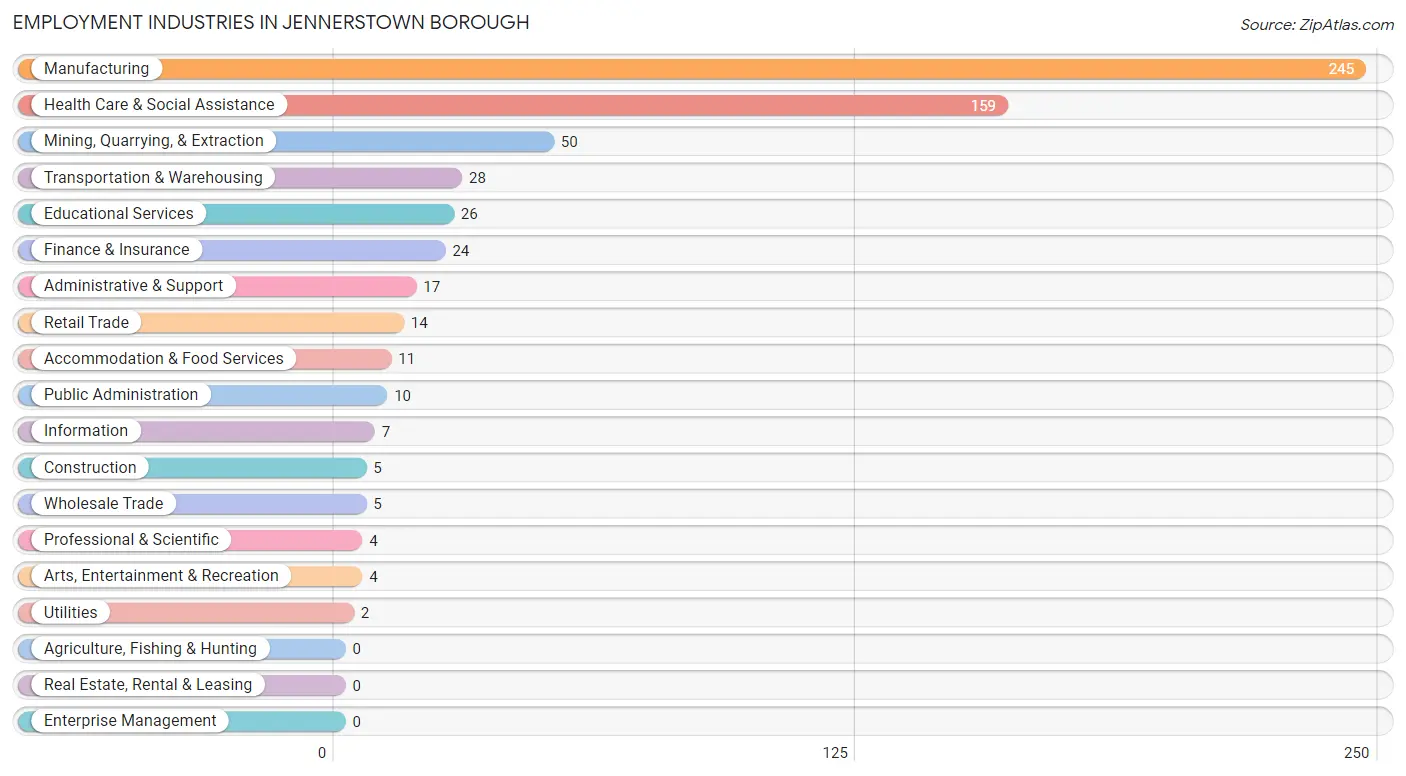
Employment Industries in Jennerstown borough
The major employment industries in Jennerstown borough include Manufacturing (245 | 38.8%), Health Care & Social Assistance (159 | 25.2%), Mining, Quarrying, & Extraction (50 | 7.9%), Transportation & Warehousing (28 | 4.4%), and Educational Services (26 | 4.1%).
Employment Industries by Sex in Jennerstown borough
The Jennerstown borough industries that see more men than women are Mining, Quarrying, & Extraction (100.0%), Construction (100.0%), and Utilities (100.0%), whereas the industries that tend to have a higher number of women are Health Care & Social Assistance (97.5%), Finance & Insurance (75.0%), and Public Administration (70.0%).
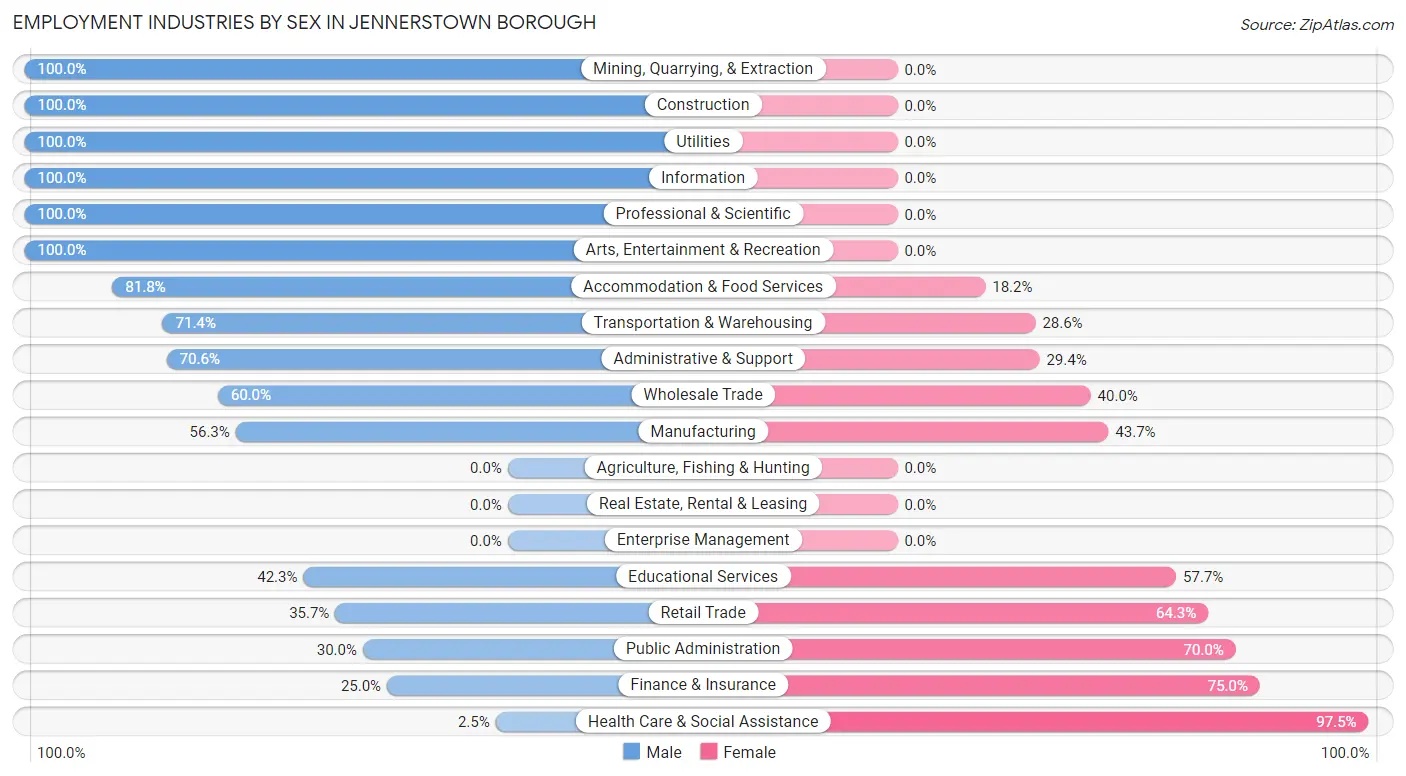
| Industry | Male | Female |
| Agriculture, Fishing & Hunting | 0 (0.0%) | 0 (0.0%) |
| Mining, Quarrying, & Extraction | 50 (100.0%) | 0 (0.0%) |
| Construction | 5 (100.0%) | 0 (0.0%) |
| Manufacturing | 138 (56.3%) | 107 (43.7%) |
| Wholesale Trade | 3 (60.0%) | 2 (40.0%) |
| Retail Trade | 5 (35.7%) | 9 (64.3%) |
| Transportation & Warehousing | 20 (71.4%) | 8 (28.6%) |
| Utilities | 2 (100.0%) | 0 (0.0%) |
| Information | 7 (100.0%) | 0 (0.0%) |
| Finance & Insurance | 6 (25.0%) | 18 (75.0%) |
| Real Estate, Rental & Leasing | 0 (0.0%) | 0 (0.0%) |
| Professional & Scientific | 4 (100.0%) | 0 (0.0%) |
| Enterprise Management | 0 (0.0%) | 0 (0.0%) |
| Administrative & Support | 12 (70.6%) | 5 (29.4%) |
| Educational Services | 11 (42.3%) | 15 (57.7%) |
| Health Care & Social Assistance | 4 (2.5%) | 155 (97.5%) |
| Arts, Entertainment & Recreation | 4 (100.0%) | 0 (0.0%) |
| Accommodation & Food Services | 9 (81.8%) | 2 (18.2%) |
| Public Administration | 3 (30.0%) | 7 (70.0%) |
| Total | 294 (46.6%) | 337 (53.4%) |
Education in Jennerstown borough
School Enrollment in Jennerstown borough
The most common levels of schooling among the 142 students in Jennerstown borough are high school (83 | 58.5%), college / undergraduate (22 | 15.5%), and elementary school (17 | 12.0%).
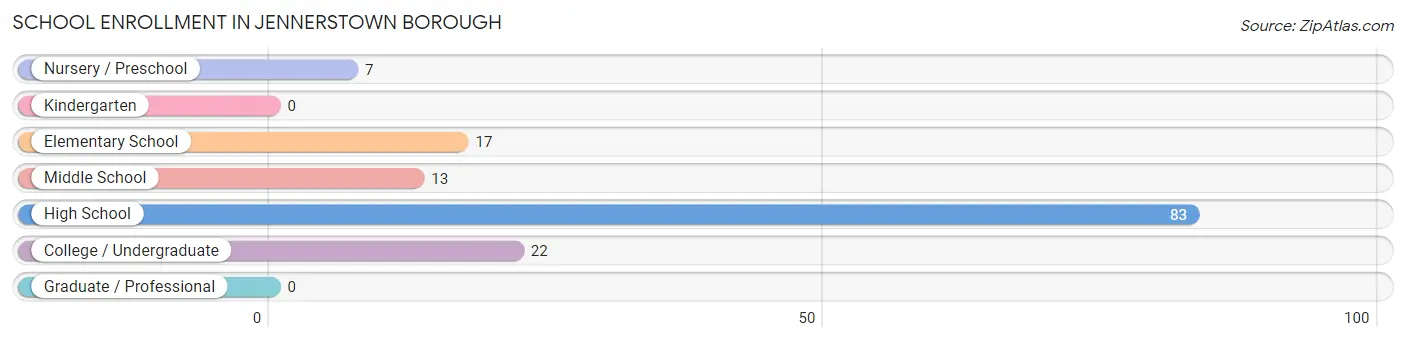
| School Level | # Students | % Students |
| Nursery / Preschool | 7 | 4.9% |
| Kindergarten | 0 | 0.0% |
| Elementary School | 17 | 12.0% |
| Middle School | 13 | 9.1% |
| High School | 83 | 58.5% |
| College / Undergraduate | 22 | 15.5% |
| Graduate / Professional | 0 | 0.0% |
| Total | 142 | 100.0% |
School Enrollment by Age by Funding Source in Jennerstown borough
Out of a total of 142 students who are enrolled in schools in Jennerstown borough, 17 (12.0%) attend a private institution, while the remaining 125 (88.0%) are enrolled in public schools. The age group of 3 to 4 year olds has the highest likelihood of being enrolled in private schools, with 7 (100.0% in the age bracket) enrolled. Conversely, the age group of 10 to 14 year olds has the lowest likelihood of being enrolled in a private school, with 16 (100.0% in the age bracket) attending a public institution.
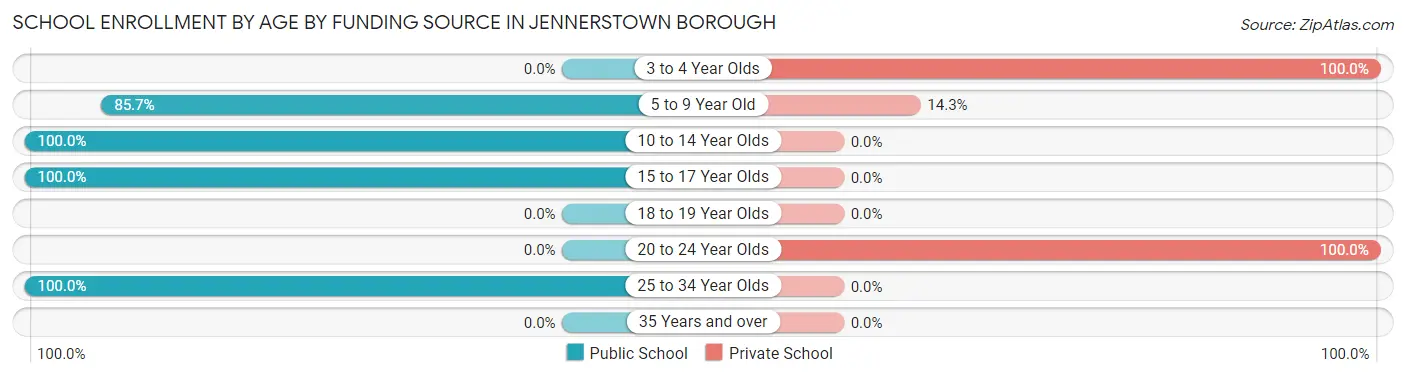
| Age Bracket | Public School | Private School |
| 3 to 4 Year Olds | 0 (0.0%) | 7 (100.0%) |
| 5 to 9 Year Old | 12 (85.7%) | 2 (14.3%) |
| 10 to 14 Year Olds | 16 (100.0%) | 0 (0.0%) |
| 15 to 17 Year Olds | 83 (100.0%) | 0 (0.0%) |
| 18 to 19 Year Olds | 0 (0.0%) | 0 (0.0%) |
| 20 to 24 Year Olds | 0 (0.0%) | 8 (100.0%) |
| 25 to 34 Year Olds | 14 (100.0%) | 0 (0.0%) |
| 35 Years and over | 0 (0.0%) | 0 (0.0%) |
| Total | 125 (88.0%) | 17 (12.0%) |
Educational Attainment by Field of Study in Jennerstown borough
Education (25 | 26.3%), science & technology (24 | 25.3%), business (9 | 9.5%), psychology (8 | 8.4%), and physical & health sciences (6 | 6.3%) are the most common fields of study among 95 individuals in Jennerstown borough who have obtained a bachelor's degree or higher.
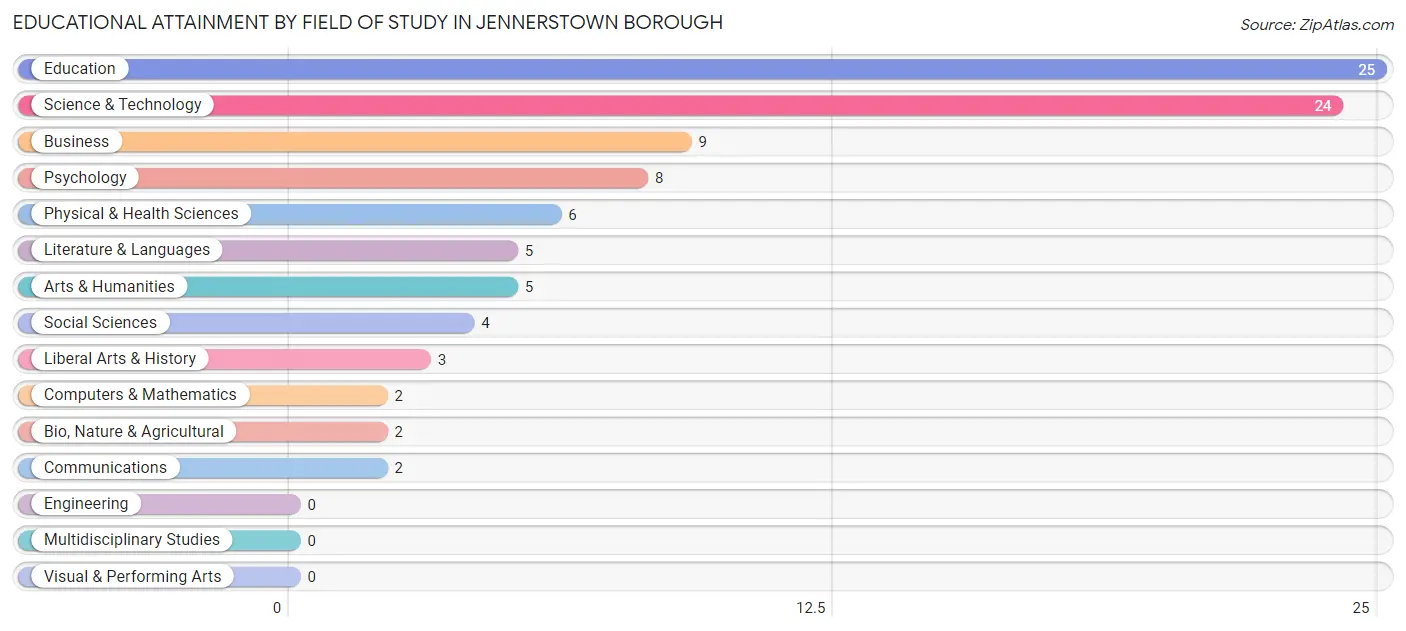
| Field of Study | # Graduates | % Graduates |
| Computers & Mathematics | 2 | 2.1% |
| Bio, Nature & Agricultural | 2 | 2.1% |
| Physical & Health Sciences | 6 | 6.3% |
| Psychology | 8 | 8.4% |
| Social Sciences | 4 | 4.2% |
| Engineering | 0 | 0.0% |
| Multidisciplinary Studies | 0 | 0.0% |
| Science & Technology | 24 | 25.3% |
| Business | 9 | 9.5% |
| Education | 25 | 26.3% |
| Literature & Languages | 5 | 5.3% |
| Liberal Arts & History | 3 | 3.2% |
| Visual & Performing Arts | 0 | 0.0% |
| Communications | 2 | 2.1% |
| Arts & Humanities | 5 | 5.3% |
| Total | 95 | 100.0% |
Transportation & Commute in Jennerstown borough
Vehicle Availability by Sex in Jennerstown borough
The most prevalent vehicle ownership categories in Jennerstown borough are males with 5 or more vehicles (172, accounting for 59.7%) and females with 5 or more vehicles (210, making up 51.5%).
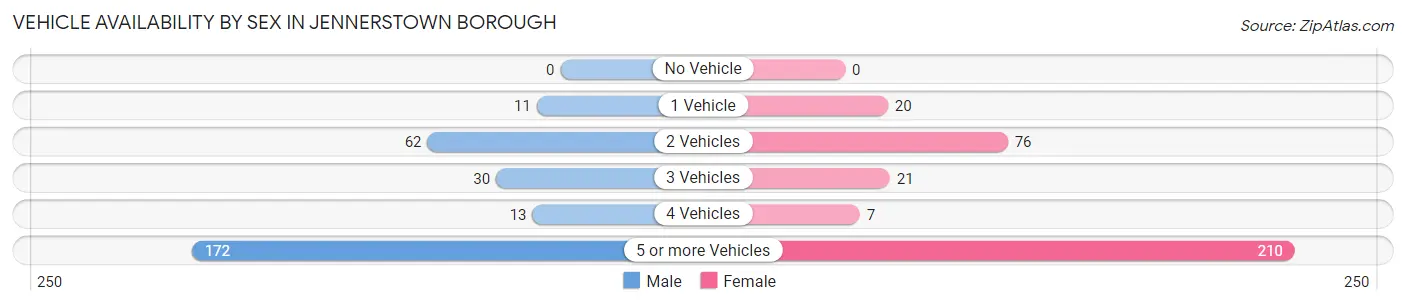
| Vehicles Available | Male | Female |
| No Vehicle | 0 (0.0%) | 0 (0.0%) |
| 1 Vehicle | 11 (3.8%) | 20 (6.0%) |
| 2 Vehicles | 62 (21.5%) | 76 (22.8%) |
| 3 Vehicles | 30 (10.4%) | 21 (6.3%) |
| 4 Vehicles | 13 (4.5%) | 7 (2.1%) |
| 5 or more Vehicles | 172 (59.7%) | 210 (62.9%) |
| Total | 288 (100.0%) | 334 (100.0%) |
Commute Time in Jennerstown borough
The most frequently occuring commute durations in Jennerstown borough are 30 to 34 minutes (176 commuters, 29.6%), 20 to 24 minutes (143 commuters, 24.0%), and 15 to 19 minutes (142 commuters, 23.9%).
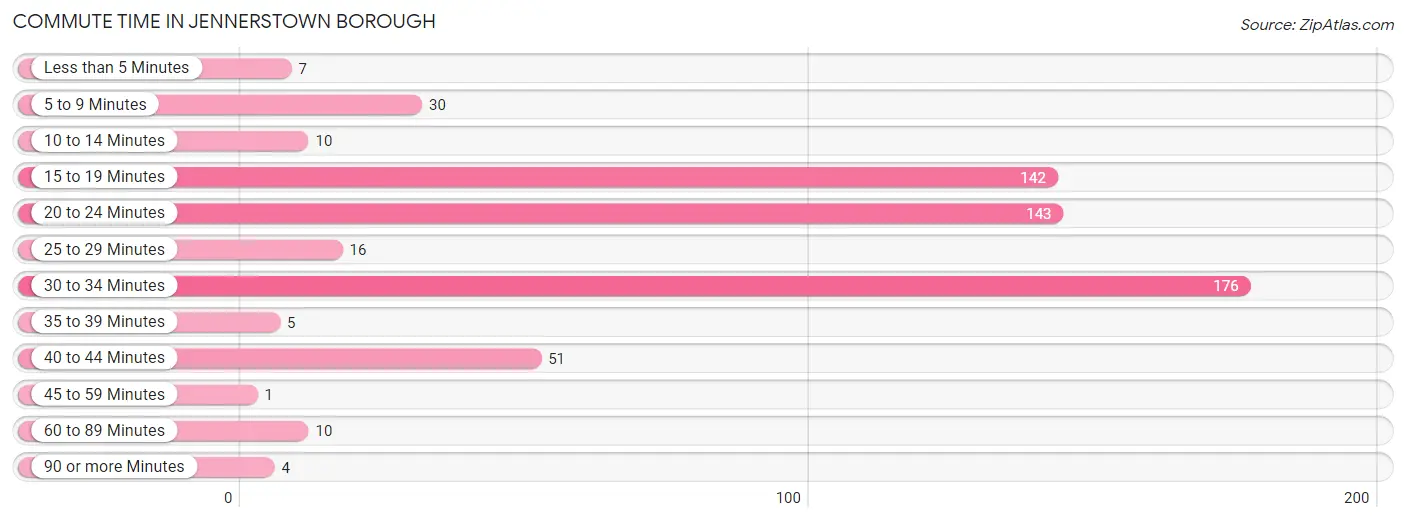
| Commute Time | # Commuters | % Commuters |
| Less than 5 Minutes | 7 | 1.2% |
| 5 to 9 Minutes | 30 | 5.0% |
| 10 to 14 Minutes | 10 | 1.7% |
| 15 to 19 Minutes | 142 | 23.9% |
| 20 to 24 Minutes | 143 | 24.0% |
| 25 to 29 Minutes | 16 | 2.7% |
| 30 to 34 Minutes | 176 | 29.6% |
| 35 to 39 Minutes | 5 | 0.8% |
| 40 to 44 Minutes | 51 | 8.6% |
| 45 to 59 Minutes | 1 | 0.2% |
| 60 to 89 Minutes | 10 | 1.7% |
| 90 or more Minutes | 4 | 0.7% |
Commute Time by Sex in Jennerstown borough
The most common commute times in Jennerstown borough are 15 to 19 minutes (128 commuters, 45.6%) for males and 30 to 34 minutes (154 commuters, 49.0%) for females.
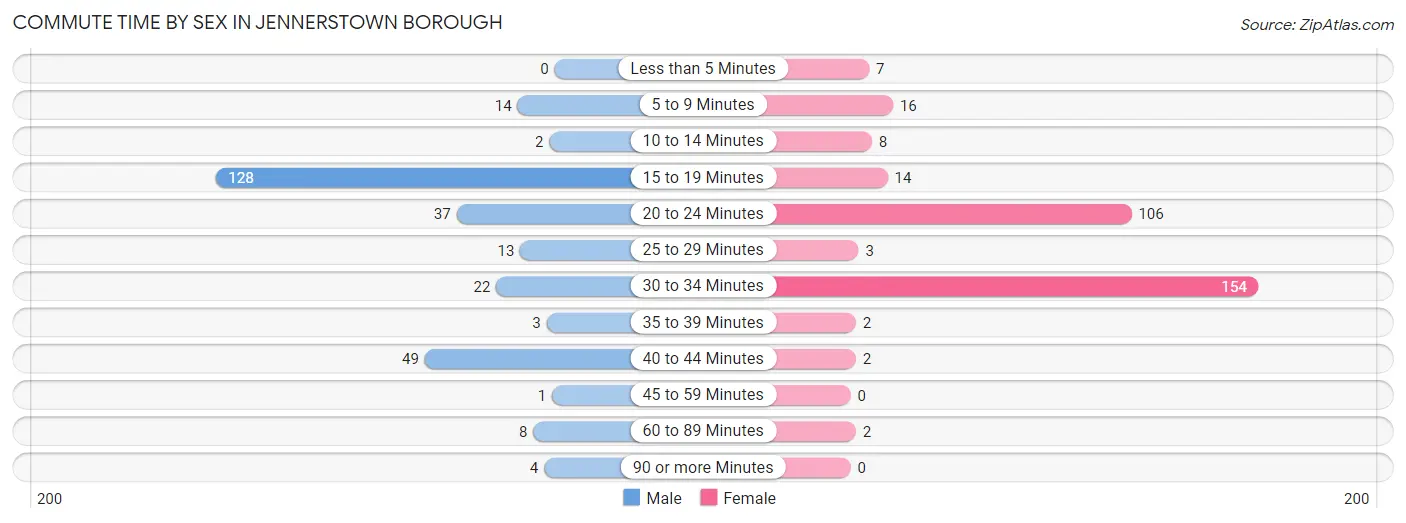
| Commute Time | Male | Female |
| Less than 5 Minutes | 0 (0.0%) | 7 (2.2%) |
| 5 to 9 Minutes | 14 (5.0%) | 16 (5.1%) |
| 10 to 14 Minutes | 2 (0.7%) | 8 (2.5%) |
| 15 to 19 Minutes | 128 (45.6%) | 14 (4.5%) |
| 20 to 24 Minutes | 37 (13.2%) | 106 (33.8%) |
| 25 to 29 Minutes | 13 (4.6%) | 3 (1.0%) |
| 30 to 34 Minutes | 22 (7.8%) | 154 (49.0%) |
| 35 to 39 Minutes | 3 (1.1%) | 2 (0.6%) |
| 40 to 44 Minutes | 49 (17.4%) | 2 (0.6%) |
| 45 to 59 Minutes | 1 (0.4%) | 0 (0.0%) |
| 60 to 89 Minutes | 8 (2.9%) | 2 (0.6%) |
| 90 or more Minutes | 4 (1.4%) | 0 (0.0%) |
Time of Departure to Work by Sex in Jennerstown borough
The most frequent times of departure to work in Jennerstown borough are 12:00 PM to 3:59 PM (158, 56.2%) for males and 12:00 PM to 3:59 PM (133, 42.4%) for females.
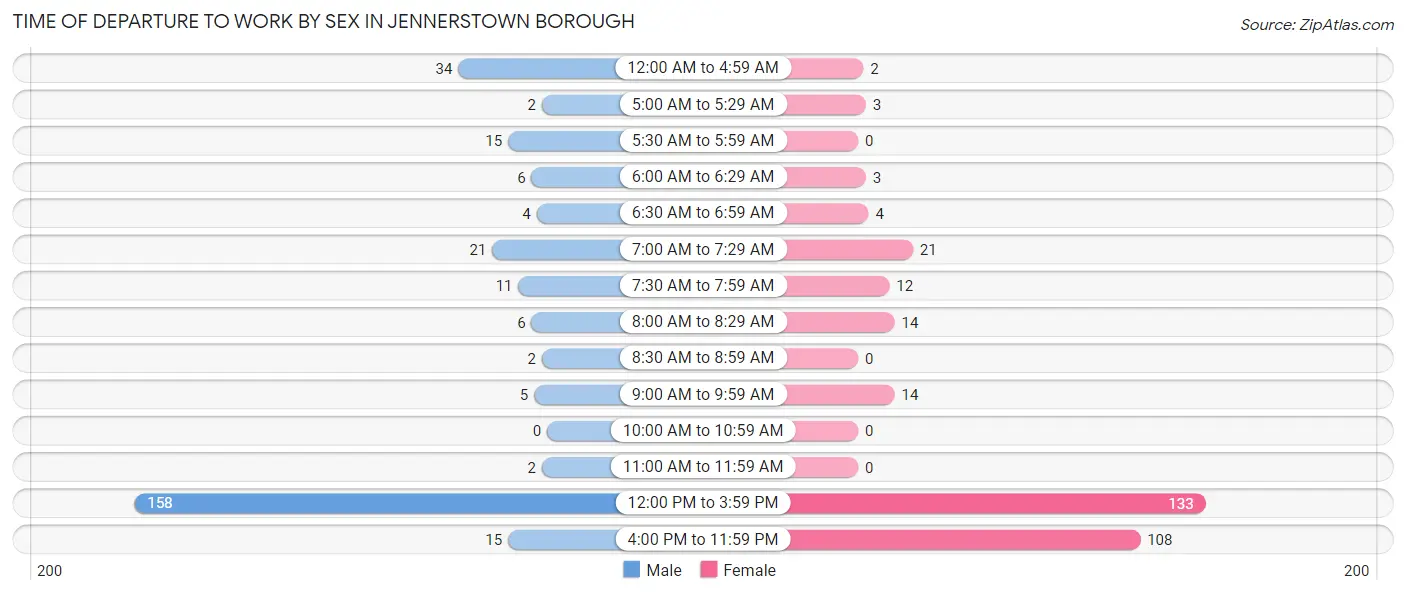
| Time of Departure | Male | Female |
| 12:00 AM to 4:59 AM | 34 (12.1%) | 2 (0.6%) |
| 5:00 AM to 5:29 AM | 2 (0.7%) | 3 (1.0%) |
| 5:30 AM to 5:59 AM | 15 (5.3%) | 0 (0.0%) |
| 6:00 AM to 6:29 AM | 6 (2.1%) | 3 (1.0%) |
| 6:30 AM to 6:59 AM | 4 (1.4%) | 4 (1.3%) |
| 7:00 AM to 7:29 AM | 21 (7.5%) | 21 (6.7%) |
| 7:30 AM to 7:59 AM | 11 (3.9%) | 12 (3.8%) |
| 8:00 AM to 8:29 AM | 6 (2.1%) | 14 (4.5%) |
| 8:30 AM to 8:59 AM | 2 (0.7%) | 0 (0.0%) |
| 9:00 AM to 9:59 AM | 5 (1.8%) | 14 (4.5%) |
| 10:00 AM to 10:59 AM | 0 (0.0%) | 0 (0.0%) |
| 11:00 AM to 11:59 AM | 2 (0.7%) | 0 (0.0%) |
| 12:00 PM to 3:59 PM | 158 (56.2%) | 133 (42.4%) |
| 4:00 PM to 11:59 PM | 15 (5.3%) | 108 (34.4%) |
| Total | 281 (100.0%) | 314 (100.0%) |
Housing Occupancy in Jennerstown borough
Occupancy by Ownership in Jennerstown borough
Of the total 341 dwellings in Jennerstown borough, owner-occupied units account for 285 (83.6%), while renter-occupied units make up 56 (16.4%).
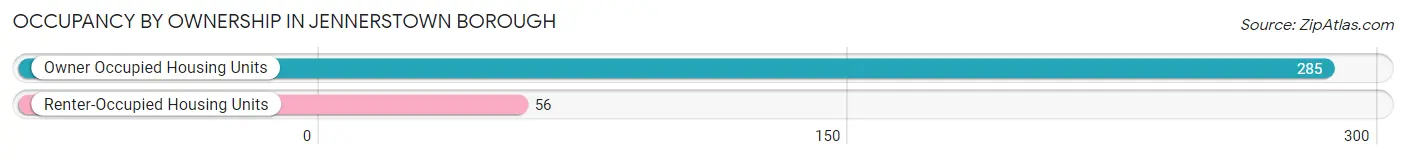
| Occupancy | # Housing Units | % Housing Units |
| Owner Occupied Housing Units | 285 | 83.6% |
| Renter-Occupied Housing Units | 56 | 16.4% |
| Total Occupied Housing Units | 341 | 100.0% |
Occupancy by Household Size in Jennerstown borough
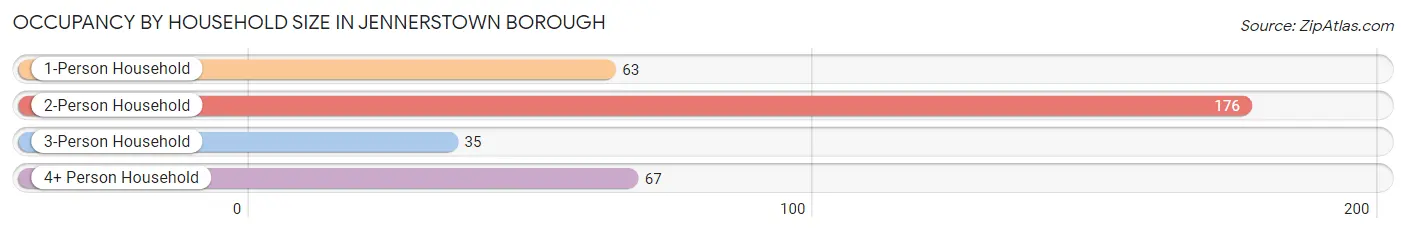
| Household Size | # Housing Units | % Housing Units |
| 1-Person Household | 63 | 18.5% |
| 2-Person Household | 176 | 51.6% |
| 3-Person Household | 35 | 10.3% |
| 4+ Person Household | 67 | 19.7% |
| Total Housing Units | 341 | 100.0% |
Occupancy by Ownership by Household Size in Jennerstown borough
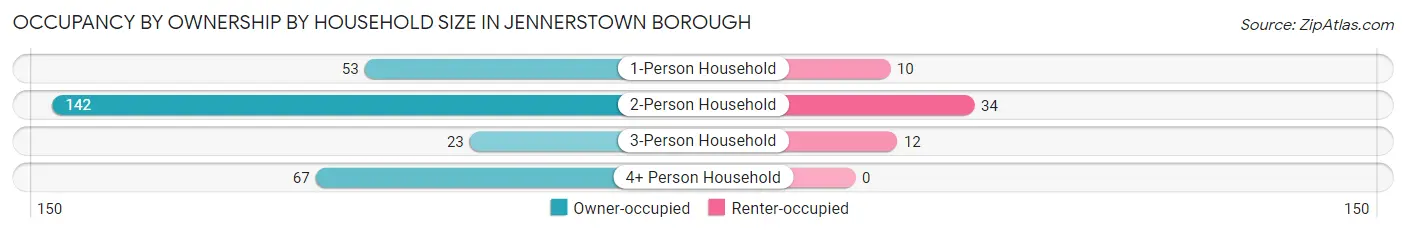
| Household Size | Owner-occupied | Renter-occupied |
| 1-Person Household | 53 (84.1%) | 10 (15.9%) |
| 2-Person Household | 142 (80.7%) | 34 (19.3%) |
| 3-Person Household | 23 (65.7%) | 12 (34.3%) |
| 4+ Person Household | 67 (100.0%) | 0 (0.0%) |
| Total Housing Units | 285 (83.6%) | 56 (16.4%) |
Occupancy by Educational Attainment in Jennerstown borough
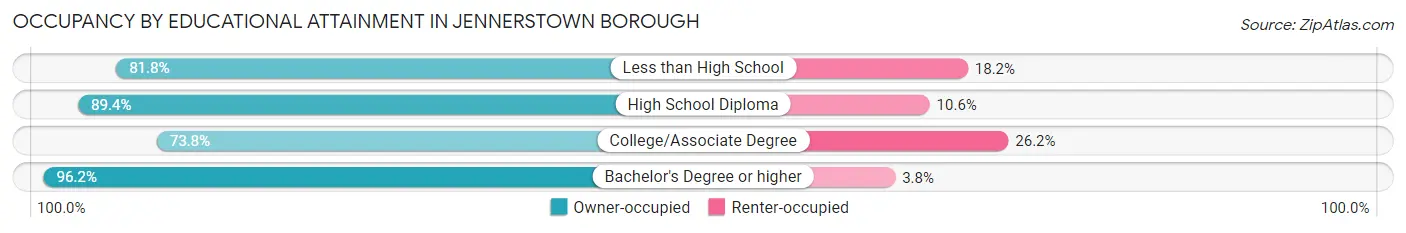
| Household Size | Owner-occupied | Renter-occupied |
| Less than High School | 9 (81.8%) | 2 (18.2%) |
| High School Diploma | 118 (89.4%) | 14 (10.6%) |
| College/Associate Degree | 107 (73.8%) | 38 (26.2%) |
| Bachelor's Degree or higher | 51 (96.2%) | 2 (3.8%) |
Occupancy by Age of Householder in Jennerstown borough
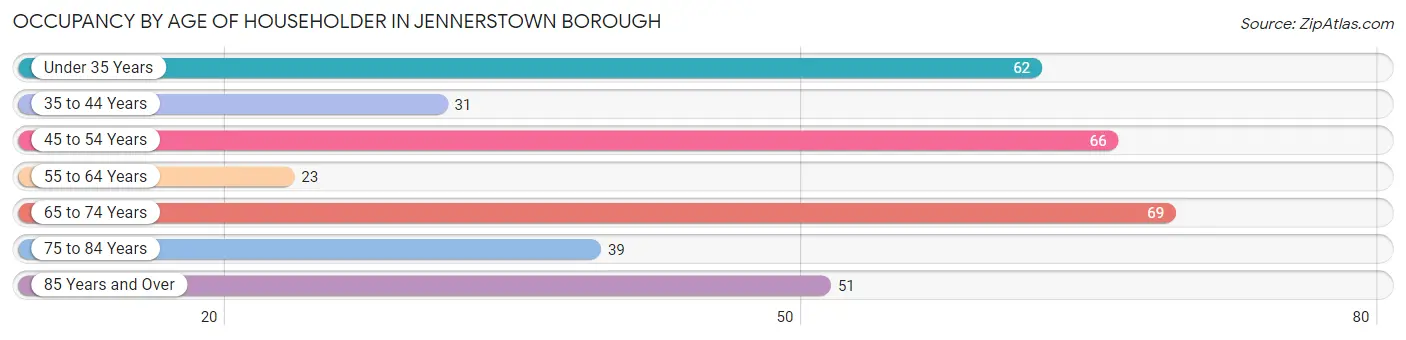
| Age Bracket | # Households | % Households |
| Under 35 Years | 62 | 18.2% |
| 35 to 44 Years | 31 | 9.1% |
| 45 to 54 Years | 66 | 19.4% |
| 55 to 64 Years | 23 | 6.7% |
| 65 to 74 Years | 69 | 20.2% |
| 75 to 84 Years | 39 | 11.4% |
| 85 Years and Over | 51 | 15.0% |
| Total | 341 | 100.0% |
Housing Finances in Jennerstown borough
Median Income by Occupancy in Jennerstown borough
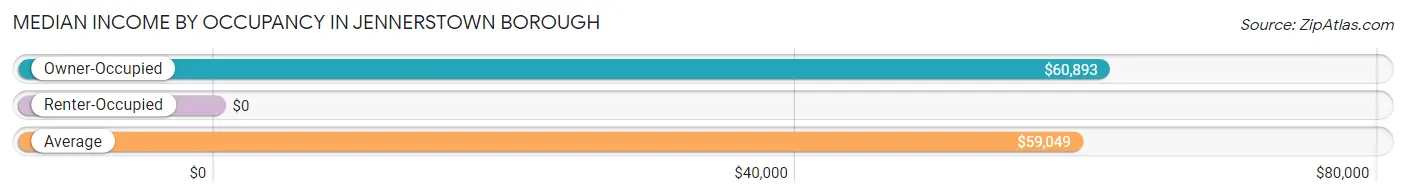
| Occupancy Type | # Households | Median Income |
| Owner-Occupied | 285 (83.6%) | $60,893 |
| Renter-Occupied | 56 (16.4%) | $0 |
| Average | 341 (100.0%) | $59,049 |
Occupancy by Householder Income Bracket in Jennerstown borough
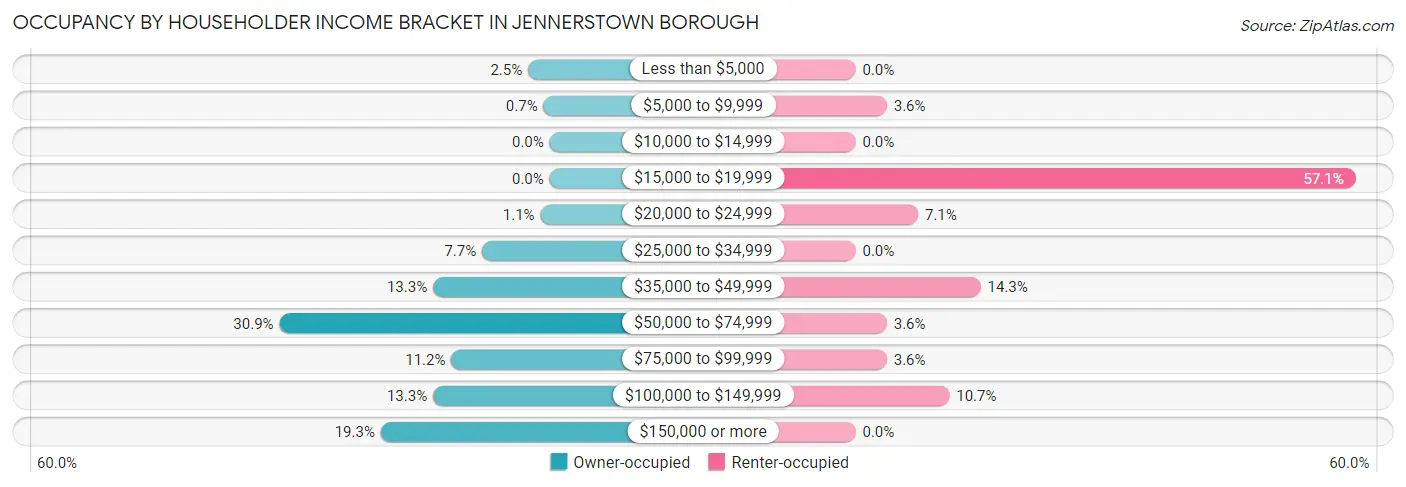
| Income Bracket | Owner-occupied | Renter-occupied |
| Less than $5,000 | 7 (2.5%) | 0 (0.0%) |
| $5,000 to $9,999 | 2 (0.7%) | 2 (3.6%) |
| $10,000 to $14,999 | 0 (0.0%) | 0 (0.0%) |
| $15,000 to $19,999 | 0 (0.0%) | 32 (57.1%) |
| $20,000 to $24,999 | 3 (1.1%) | 4 (7.1%) |
| $25,000 to $34,999 | 22 (7.7%) | 0 (0.0%) |
| $35,000 to $49,999 | 38 (13.3%) | 8 (14.3%) |
| $50,000 to $74,999 | 88 (30.9%) | 2 (3.6%) |
| $75,000 to $99,999 | 32 (11.2%) | 2 (3.6%) |
| $100,000 to $149,999 | 38 (13.3%) | 6 (10.7%) |
| $150,000 or more | 55 (19.3%) | 0 (0.0%) |
| Total | 285 (100.0%) | 56 (100.0%) |
Monthly Housing Cost Tiers in Jennerstown borough
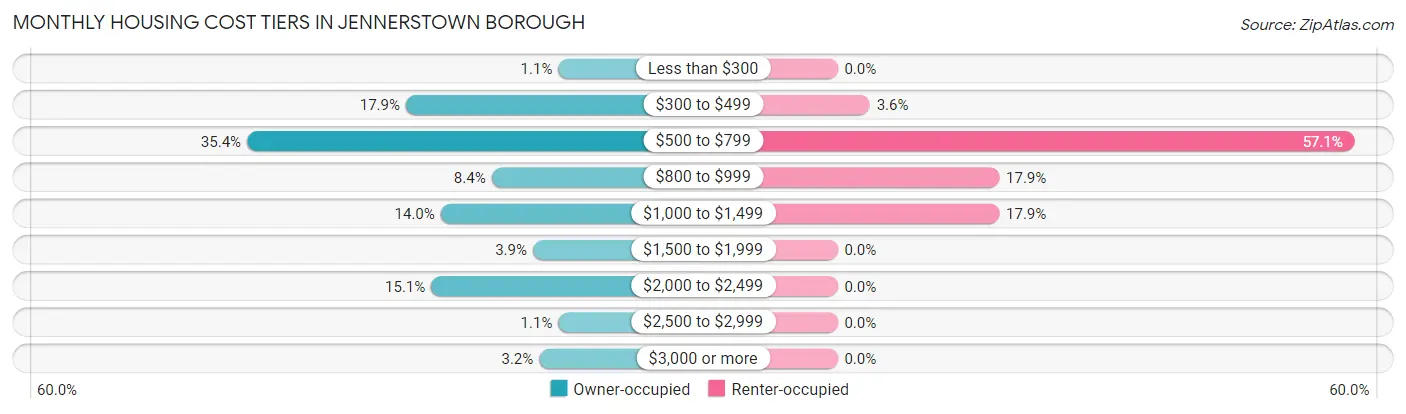
| Monthly Cost | Owner-occupied | Renter-occupied |
| Less than $300 | 3 (1.1%) | 0 (0.0%) |
| $300 to $499 | 51 (17.9%) | 2 (3.6%) |
| $500 to $799 | 101 (35.4%) | 32 (57.1%) |
| $800 to $999 | 24 (8.4%) | 10 (17.9%) |
| $1,000 to $1,499 | 40 (14.0%) | 10 (17.9%) |
| $1,500 to $1,999 | 11 (3.9%) | 0 (0.0%) |
| $2,000 to $2,499 | 43 (15.1%) | 0 (0.0%) |
| $2,500 to $2,999 | 3 (1.1%) | 0 (0.0%) |
| $3,000 or more | 9 (3.2%) | 0 (0.0%) |
| Total | 285 (100.0%) | 56 (100.0%) |
Physical Housing Characteristics in Jennerstown borough
Housing Structures in Jennerstown borough
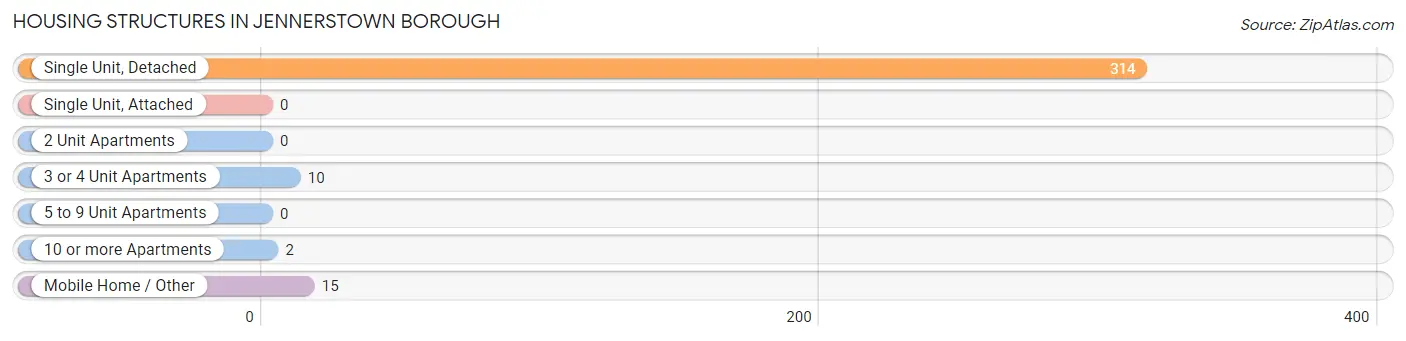
| Structure Type | # Housing Units | % Housing Units |
| Single Unit, Detached | 314 | 92.1% |
| Single Unit, Attached | 0 | 0.0% |
| 2 Unit Apartments | 0 | 0.0% |
| 3 or 4 Unit Apartments | 10 | 2.9% |
| 5 to 9 Unit Apartments | 0 | 0.0% |
| 10 or more Apartments | 2 | 0.6% |
| Mobile Home / Other | 15 | 4.4% |
| Total | 341 | 100.0% |
Housing Structures by Occupancy in Jennerstown borough
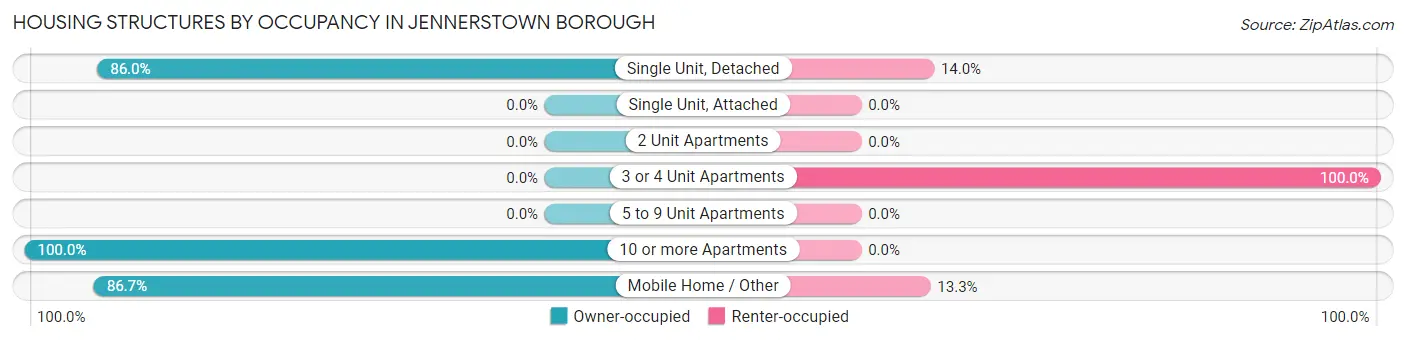
| Structure Type | Owner-occupied | Renter-occupied |
| Single Unit, Detached | 270 (86.0%) | 44 (14.0%) |
| Single Unit, Attached | 0 (0.0%) | 0 (0.0%) |
| 2 Unit Apartments | 0 (0.0%) | 0 (0.0%) |
| 3 or 4 Unit Apartments | 0 (0.0%) | 10 (100.0%) |
| 5 to 9 Unit Apartments | 0 (0.0%) | 0 (0.0%) |
| 10 or more Apartments | 2 (100.0%) | 0 (0.0%) |
| Mobile Home / Other | 13 (86.7%) | 2 (13.3%) |
| Total | 285 (83.6%) | 56 (16.4%) |
Housing Structures by Number of Rooms in Jennerstown borough
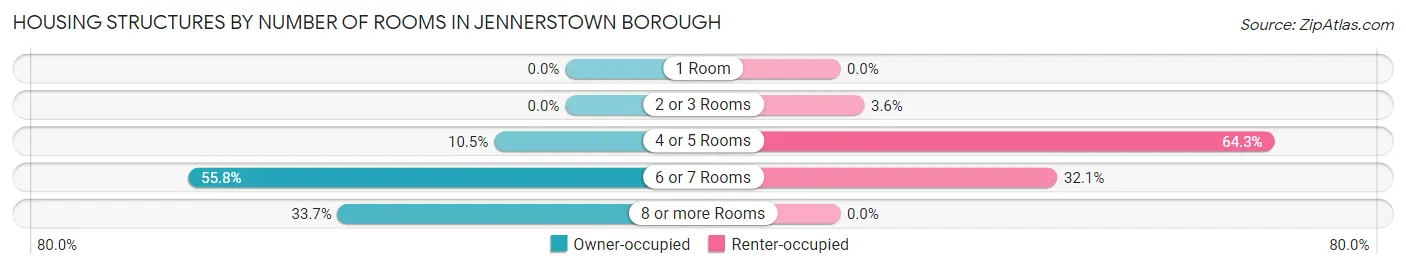
| Number of Rooms | Owner-occupied | Renter-occupied |
| 1 Room | 0 (0.0%) | 0 (0.0%) |
| 2 or 3 Rooms | 0 (0.0%) | 2 (3.6%) |
| 4 or 5 Rooms | 30 (10.5%) | 36 (64.3%) |
| 6 or 7 Rooms | 159 (55.8%) | 18 (32.1%) |
| 8 or more Rooms | 96 (33.7%) | 0 (0.0%) |
| Total | 285 (100.0%) | 56 (100.0%) |
Housing Structure by Heating Type in Jennerstown borough
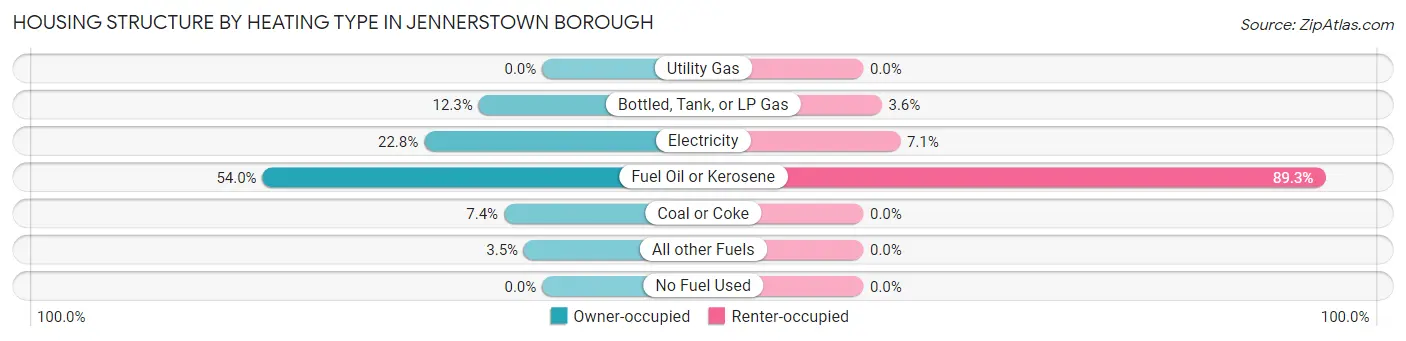
| Heating Type | Owner-occupied | Renter-occupied |
| Utility Gas | 0 (0.0%) | 0 (0.0%) |
| Bottled, Tank, or LP Gas | 35 (12.3%) | 2 (3.6%) |
| Electricity | 65 (22.8%) | 4 (7.1%) |
| Fuel Oil or Kerosene | 154 (54.0%) | 50 (89.3%) |
| Coal or Coke | 21 (7.4%) | 0 (0.0%) |
| All other Fuels | 10 (3.5%) | 0 (0.0%) |
| No Fuel Used | 0 (0.0%) | 0 (0.0%) |
| Total | 285 (100.0%) | 56 (100.0%) |
Household Vehicle Usage in Jennerstown borough
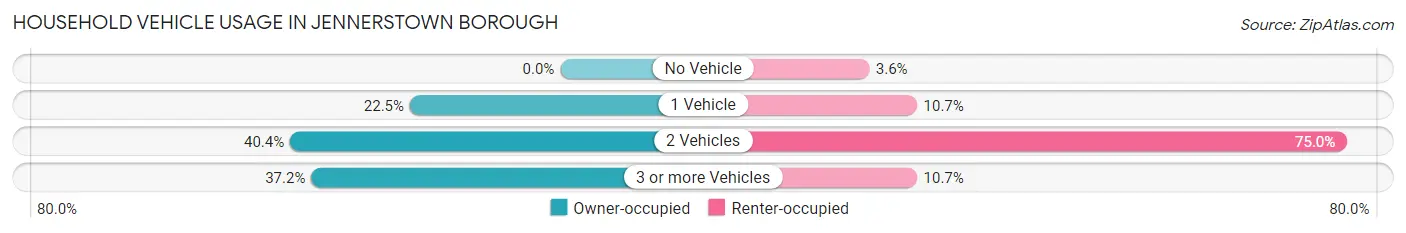
| Vehicles per Household | Owner-occupied | Renter-occupied |
| No Vehicle | 0 (0.0%) | 2 (3.6%) |
| 1 Vehicle | 64 (22.5%) | 6 (10.7%) |
| 2 Vehicles | 115 (40.4%) | 42 (75.0%) |
| 3 or more Vehicles | 106 (37.2%) | 6 (10.7%) |
| Total | 285 (100.0%) | 56 (100.0%) |
Real Estate & Mortgages in Jennerstown borough
Real Estate and Mortgage Overview in Jennerstown borough
| Characteristic | Without Mortgage | With Mortgage |
| Housing Units | 158 | 127 |
| Median Property Value | $176,400 | $204,300 |
| Median Household Income | $58,274 | $42 |
| Monthly Housing Costs | $609 | $9 |
| Real Estate Taxes | $1,733 | $2 |
Property Value by Mortgage Status in Jennerstown borough
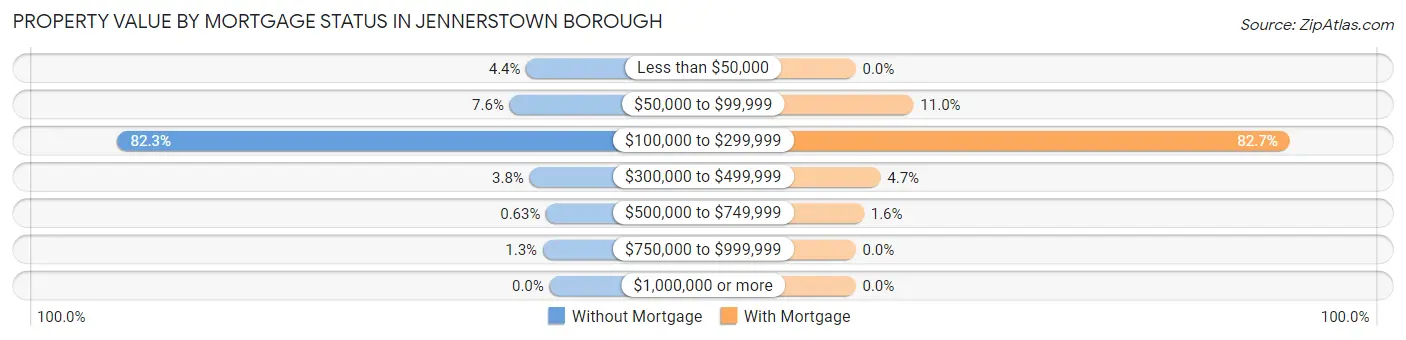
| Property Value | Without Mortgage | With Mortgage |
| Less than $50,000 | 7 (4.4%) | 0 (0.0%) |
| $50,000 to $99,999 | 12 (7.6%) | 14 (11.0%) |
| $100,000 to $299,999 | 130 (82.3%) | 105 (82.7%) |
| $300,000 to $499,999 | 6 (3.8%) | 6 (4.7%) |
| $500,000 to $749,999 | 1 (0.6%) | 2 (1.6%) |
| $750,000 to $999,999 | 2 (1.3%) | 0 (0.0%) |
| $1,000,000 or more | 0 (0.0%) | 0 (0.0%) |
| Total | 158 (100.0%) | 127 (100.0%) |
Household Income by Mortgage Status in Jennerstown borough
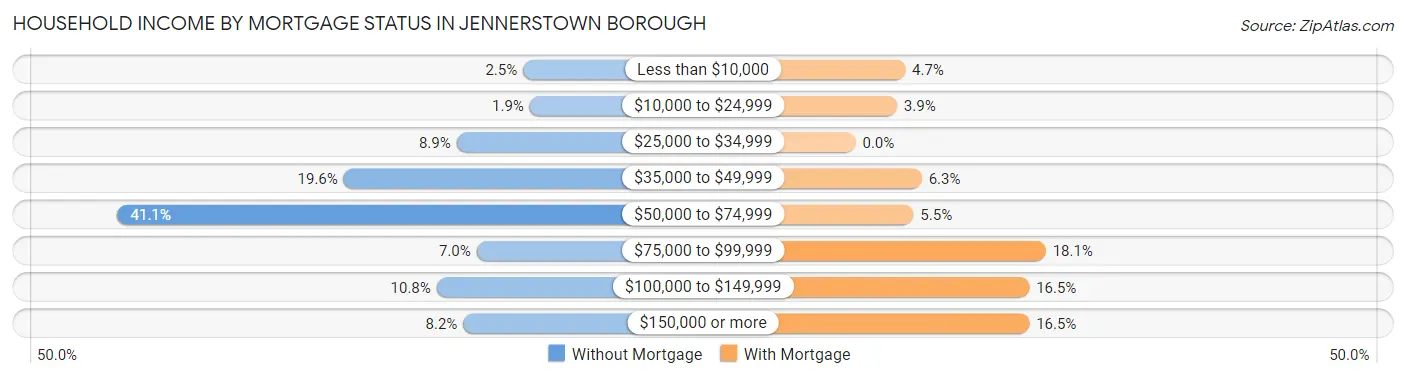
| Household Income | Without Mortgage | With Mortgage |
| Less than $10,000 | 4 (2.5%) | 6 (4.7%) |
| $10,000 to $24,999 | 3 (1.9%) | 5 (3.9%) |
| $25,000 to $34,999 | 14 (8.9%) | 0 (0.0%) |
| $35,000 to $49,999 | 31 (19.6%) | 8 (6.3%) |
| $50,000 to $74,999 | 65 (41.1%) | 7 (5.5%) |
| $75,000 to $99,999 | 11 (7.0%) | 23 (18.1%) |
| $100,000 to $149,999 | 17 (10.8%) | 21 (16.5%) |
| $150,000 or more | 13 (8.2%) | 21 (16.5%) |
| Total | 158 (100.0%) | 127 (100.0%) |
Property Value to Household Income Ratio in Jennerstown borough
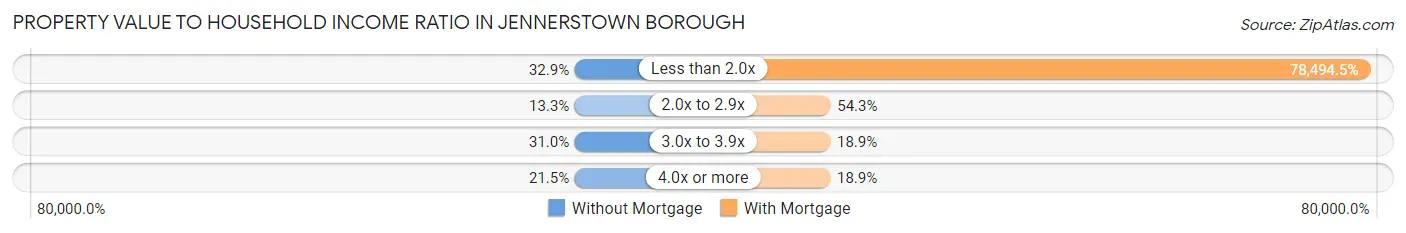
| Value-to-Income Ratio | Without Mortgage | With Mortgage |
| Less than 2.0x | 52 (32.9%) | 99,688 (78,494.5%) |
| 2.0x to 2.9x | 21 (13.3%) | 69 (54.3%) |
| 3.0x to 3.9x | 49 (31.0%) | 24 (18.9%) |
| 4.0x or more | 34 (21.5%) | 24 (18.9%) |
| Total | 158 (100.0%) | 127 (100.0%) |
Real Estate Taxes by Mortgage Status in Jennerstown borough
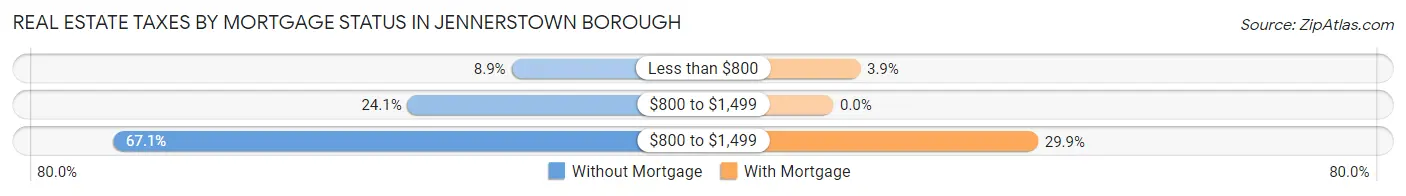
| Property Taxes | Without Mortgage | With Mortgage |
| Less than $800 | 14 (8.9%) | 5 (3.9%) |
| $800 to $1,499 | 38 (24.0%) | 0 (0.0%) |
| $800 to $1,499 | 106 (67.1%) | 38 (29.9%) |
| Total | 158 (100.0%) | 127 (100.0%) |
Health & Disability in Jennerstown borough
Health Insurance Coverage by Age in Jennerstown borough
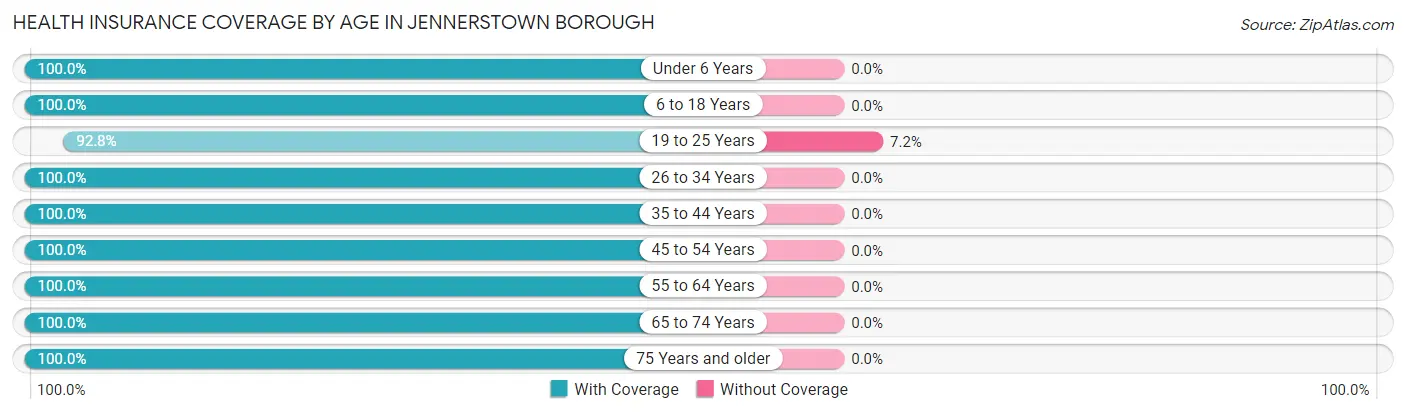
| Age Bracket | With Coverage | Without Coverage |
| Under 6 Years | 35 (100.0%) | 0 (0.0%) |
| 6 to 18 Years | 122 (100.0%) | 0 (0.0%) |
| 19 to 25 Years | 77 (92.8%) | 6 (7.2%) |
| 26 to 34 Years | 288 (100.0%) | 0 (0.0%) |
| 35 to 44 Years | 97 (100.0%) | 0 (0.0%) |
| 45 to 54 Years | 104 (100.0%) | 0 (0.0%) |
| 55 to 64 Years | 174 (100.0%) | 0 (0.0%) |
| 65 to 74 Years | 176 (100.0%) | 0 (0.0%) |
| 75 Years and older | 103 (100.0%) | 0 (0.0%) |
| Total | 1,176 (99.5%) | 6 (0.5%) |
Health Insurance Coverage by Citizenship Status in Jennerstown borough
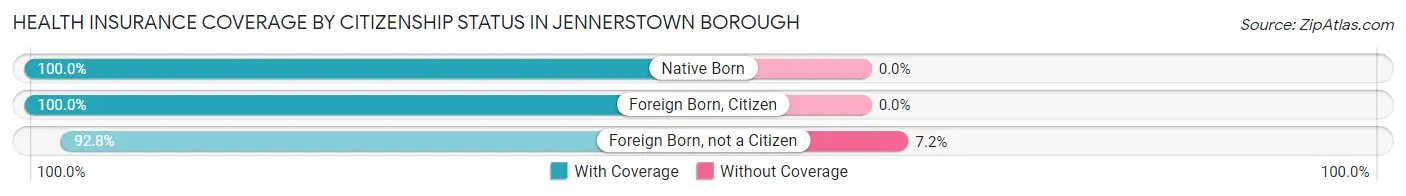
| Citizenship Status | With Coverage | Without Coverage |
| Native Born | 35 (100.0%) | 0 (0.0%) |
| Foreign Born, Citizen | 122 (100.0%) | 0 (0.0%) |
| Foreign Born, not a Citizen | 77 (92.8%) | 6 (7.2%) |
Health Insurance Coverage by Household Income in Jennerstown borough
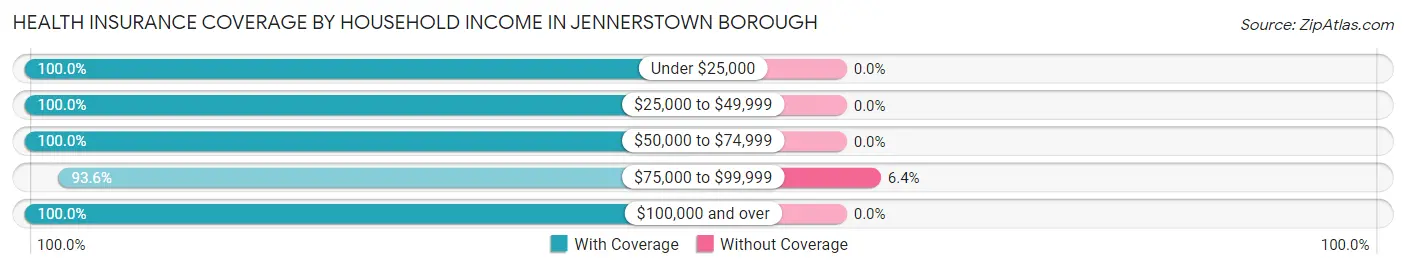
| Household Income | With Coverage | Without Coverage |
| Under $25,000 | 83 (100.0%) | 0 (0.0%) |
| $25,000 to $49,999 | 165 (100.0%) | 0 (0.0%) |
| $50,000 to $74,999 | 204 (100.0%) | 0 (0.0%) |
| $75,000 to $99,999 | 88 (93.6%) | 6 (6.4%) |
| $100,000 and over | 629 (100.0%) | 0 (0.0%) |
Public vs Private Health Insurance Coverage by Age in Jennerstown borough
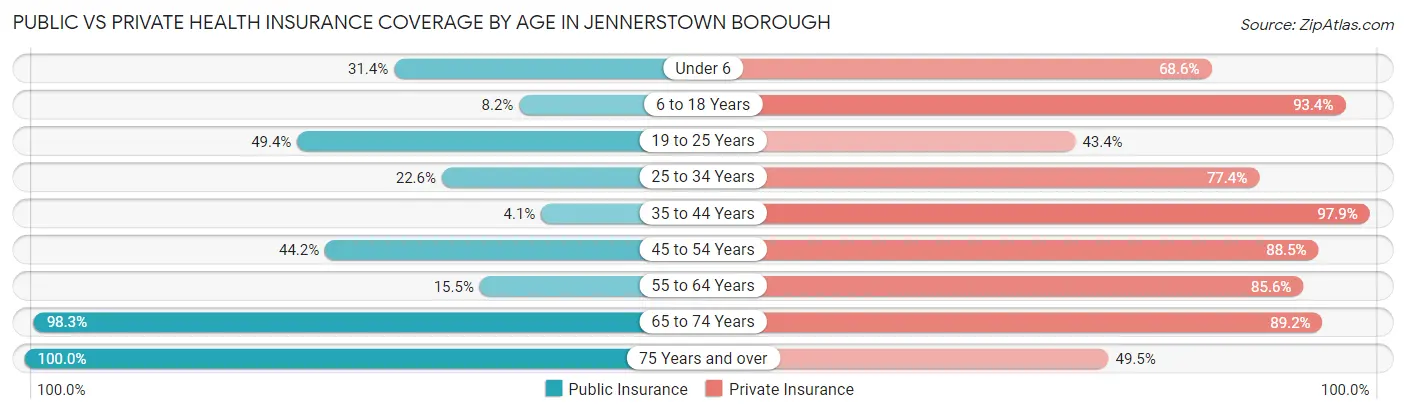
| Age Bracket | Public Insurance | Private Insurance |
| Under 6 | 11 (31.4%) | 24 (68.6%) |
| 6 to 18 Years | 10 (8.2%) | 114 (93.4%) |
| 19 to 25 Years | 41 (49.4%) | 36 (43.4%) |
| 25 to 34 Years | 65 (22.6%) | 223 (77.4%) |
| 35 to 44 Years | 4 (4.1%) | 95 (97.9%) |
| 45 to 54 Years | 46 (44.2%) | 92 (88.5%) |
| 55 to 64 Years | 27 (15.5%) | 149 (85.6%) |
| 65 to 74 Years | 173 (98.3%) | 157 (89.2%) |
| 75 Years and over | 103 (100.0%) | 51 (49.5%) |
| Total | 480 (40.6%) | 941 (79.6%) |
Disability Status by Sex by Age in Jennerstown borough
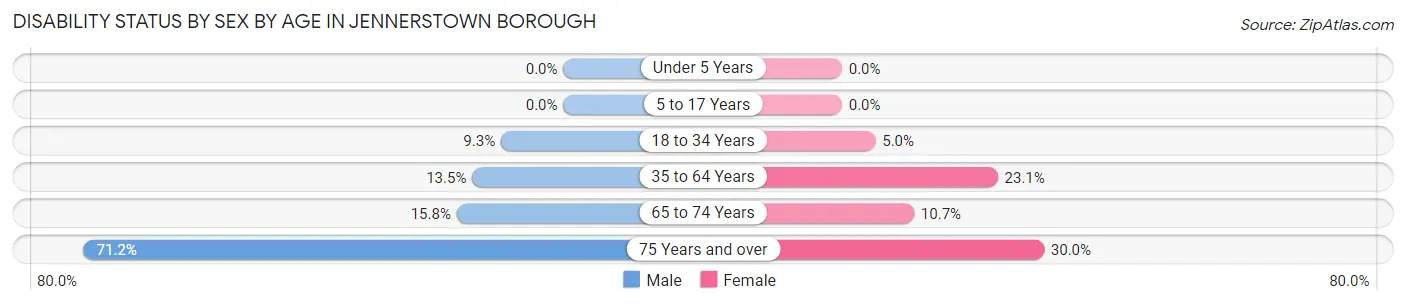
| Age Bracket | Male | Female |
| Under 5 Years | 0 (0.0%) | 0 (0.0%) |
| 5 to 17 Years | 0 (0.0%) | 0 (0.0%) |
| 18 to 34 Years | 20 (9.3%) | 8 (5.0%) |
| 35 to 64 Years | 18 (13.5%) | 56 (23.1%) |
| 65 to 74 Years | 19 (15.8%) | 6 (10.7%) |
| 75 Years and over | 52 (71.2%) | 9 (30.0%) |
Disability Class by Sex by Age in Jennerstown borough
Disability Class: Hearing Difficulty
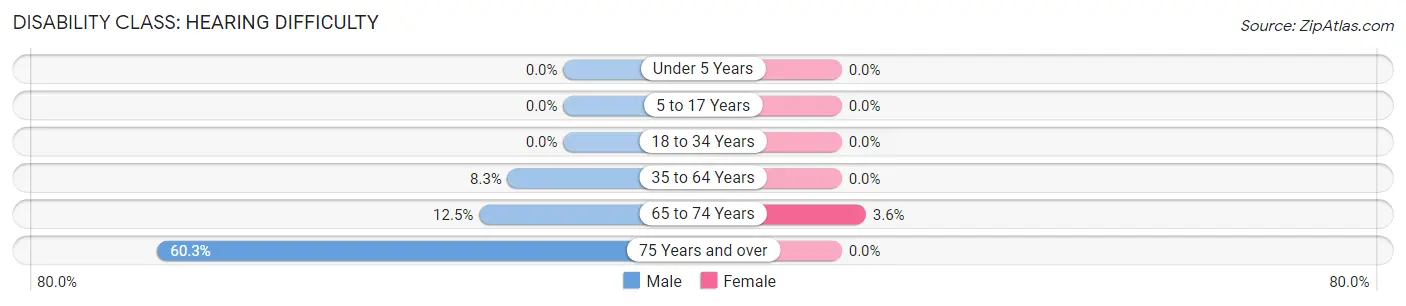
| Age Bracket | Male | Female |
| Under 5 Years | 0 (0.0%) | 0 (0.0%) |
| 5 to 17 Years | 0 (0.0%) | 0 (0.0%) |
| 18 to 34 Years | 0 (0.0%) | 0 (0.0%) |
| 35 to 64 Years | 11 (8.3%) | 0 (0.0%) |
| 65 to 74 Years | 15 (12.5%) | 2 (3.6%) |
| 75 Years and over | 44 (60.3%) | 0 (0.0%) |
Disability Class: Vision Difficulty
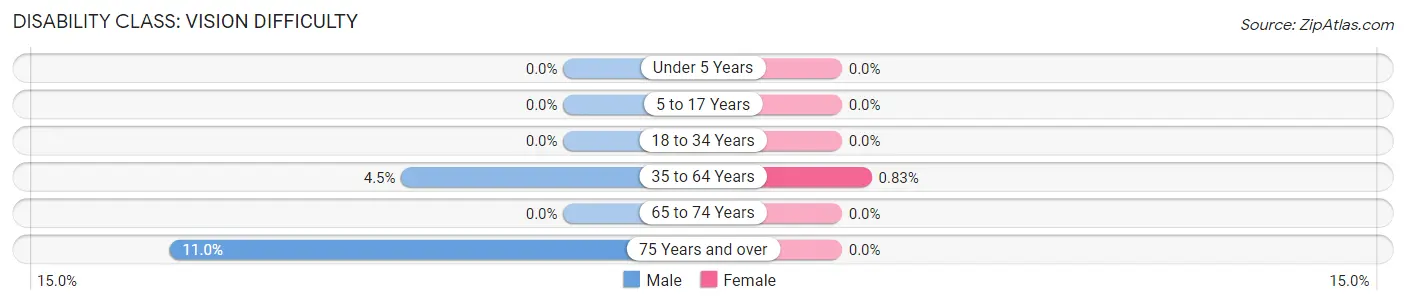
| Age Bracket | Male | Female |
| Under 5 Years | 0 (0.0%) | 0 (0.0%) |
| 5 to 17 Years | 0 (0.0%) | 0 (0.0%) |
| 18 to 34 Years | 0 (0.0%) | 0 (0.0%) |
| 35 to 64 Years | 6 (4.5%) | 2 (0.8%) |
| 65 to 74 Years | 0 (0.0%) | 0 (0.0%) |
| 75 Years and over | 8 (11.0%) | 0 (0.0%) |
Disability Class: Cognitive Difficulty
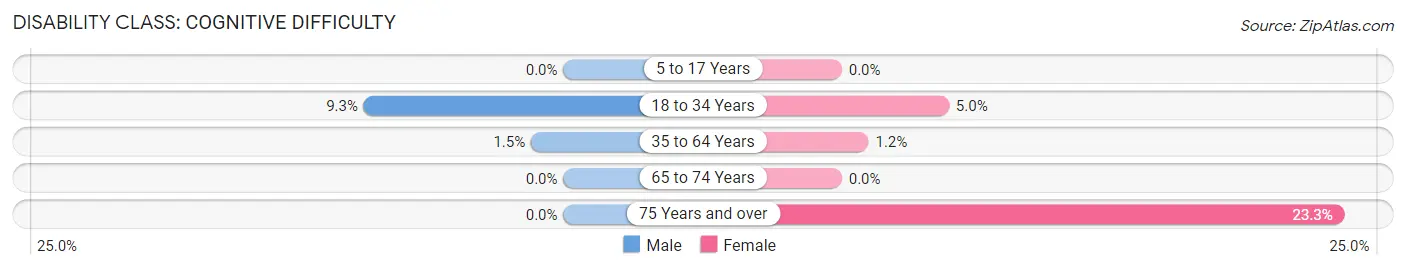
| Age Bracket | Male | Female |
| 5 to 17 Years | 0 (0.0%) | 0 (0.0%) |
| 18 to 34 Years | 20 (9.3%) | 8 (5.0%) |
| 35 to 64 Years | 2 (1.5%) | 3 (1.2%) |
| 65 to 74 Years | 0 (0.0%) | 0 (0.0%) |
| 75 Years and over | 0 (0.0%) | 7 (23.3%) |
Disability Class: Ambulatory Difficulty
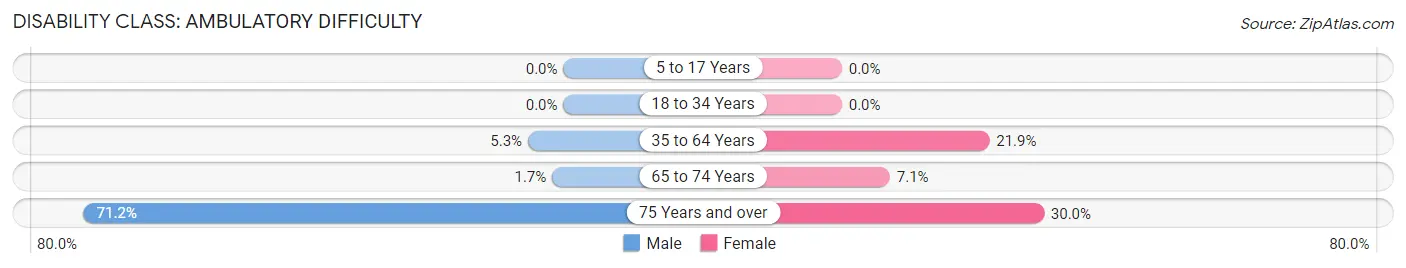
| Age Bracket | Male | Female |
| 5 to 17 Years | 0 (0.0%) | 0 (0.0%) |
| 18 to 34 Years | 0 (0.0%) | 0 (0.0%) |
| 35 to 64 Years | 7 (5.3%) | 53 (21.9%) |
| 65 to 74 Years | 2 (1.7%) | 4 (7.1%) |
| 75 Years and over | 52 (71.2%) | 9 (30.0%) |
Disability Class: Self-Care Difficulty
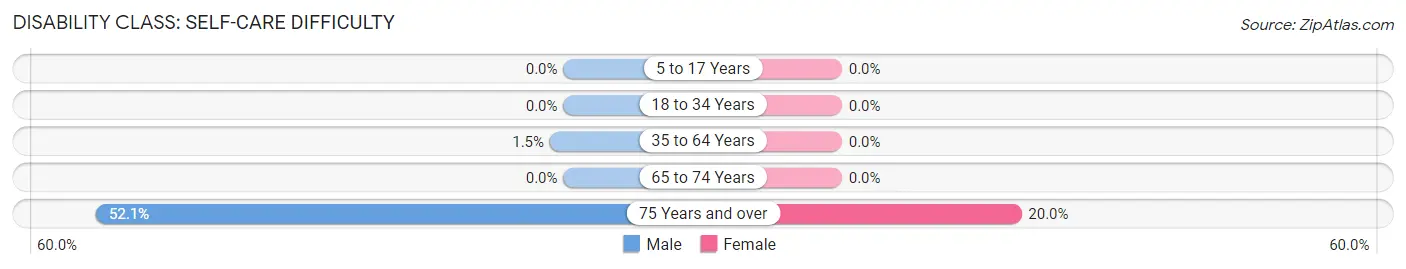
| Age Bracket | Male | Female |
| 5 to 17 Years | 0 (0.0%) | 0 (0.0%) |
| 18 to 34 Years | 0 (0.0%) | 0 (0.0%) |
| 35 to 64 Years | 2 (1.5%) | 0 (0.0%) |
| 65 to 74 Years | 0 (0.0%) | 0 (0.0%) |
| 75 Years and over | 38 (52.0%) | 6 (20.0%) |
Technology Access in Jennerstown borough
Computing Device Access in Jennerstown borough
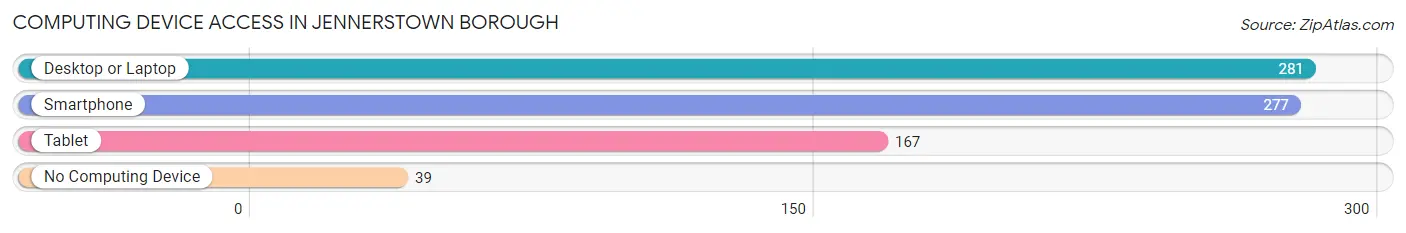
| Device Type | # Households | % Households |
| Desktop or Laptop | 281 | 82.4% |
| Smartphone | 277 | 81.2% |
| Tablet | 167 | 49.0% |
| No Computing Device | 39 | 11.4% |
| Total | 341 | 100.0% |
Internet Access in Jennerstown borough
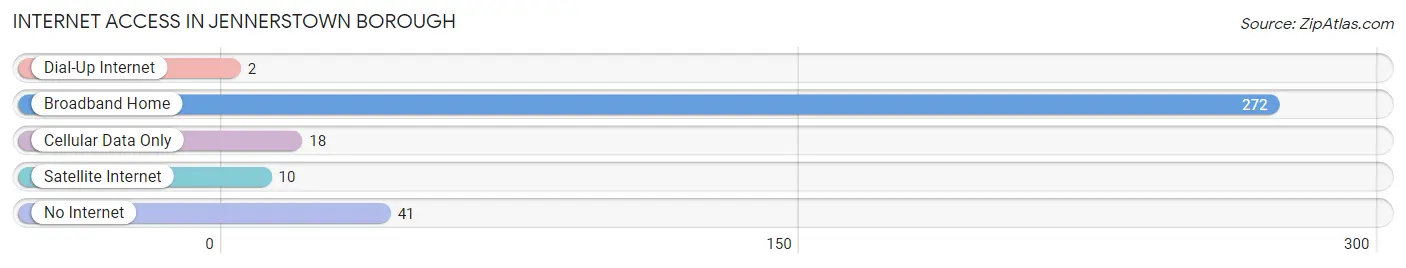
| Internet Type | # Households | % Households |
| Dial-Up Internet | 2 | 0.6% |
| Broadband Home | 272 | 79.8% |
| Cellular Data Only | 18 | 5.3% |
| Satellite Internet | 10 | 2.9% |
| No Internet | 41 | 12.0% |
| Total | 341 | 100.0% |
Jennerstown borough Summary
Jennerstown Borough is a small borough located in Somerset County, Pennsylvania. It is situated in the Laurel Highlands region of the state, and is part of the Johnstown Metropolitan Statistical Area. The borough has a population of approximately 500 people, and is home to a variety of businesses, including a grocery store, a hardware store, and a few restaurants.
Geography
Jennerstown Borough is located in the Laurel Highlands region of Pennsylvania, in the southwestern corner of Somerset County. It is situated in the foothills of the Allegheny Mountains, and is bordered by the towns of Stoystown, Boswell, and Jenner Crossroads. The borough is located approximately 50 miles southeast of Pittsburgh, and is part of the Johnstown Metropolitan Statistical Area.
The borough is situated at an elevation of 1,400 feet above sea level, and is located in a valley surrounded by hills. The terrain is mostly hilly, with some flat areas. The climate is humid continental, with cold winters and warm summers.
Demographics
As of the 2010 census, the population of Jennerstown Borough was 498 people. The racial makeup of the borough was 97.2% White, 0.6% African American, 0.2% Native American, 0.4% Asian, 0.2% from other races, and 1.4% from two or more races. Hispanic or Latino of any race were 0.8% of the population.
The median household income in Jennerstown Borough was $37,500, and the median family income was $45,000. The per capita income was $19,000. About 8.3% of families and 10.2% of the population were below the poverty line, including 14.3% of those under age 18 and none of those age 65 or over.
Economy
Jennerstown Borough is home to a variety of businesses, including a grocery store, a hardware store, and a few restaurants. The borough is also home to a number of small manufacturing companies, including a furniture manufacturer, a metal fabrication company, and a plastics manufacturer.
The borough is served by the Somerset County Airport, which is located just outside of town. The airport offers general aviation services, as well as charter flights.
History
Jennerstown Borough was founded in 1845 by John Jenner, who purchased the land from the local Native American tribes. The borough was incorporated in 1872, and was named after John Jenner.
In the late 19th century, Jennerstown Borough was a thriving industrial center, with several factories producing furniture, metal products, and textiles. The borough was also home to a number of coal mines, which provided employment for many of the residents.
In the early 20th century, Jennerstown Borough began to decline, as the factories and coal mines closed. The borough has since become a quiet, rural community, with a focus on small businesses and tourism.
Common Questions
What is the Total Population of Jennerstown borough?
Total Population of Jennerstown borough is 1,182.
What is the Total Male Population of Jennerstown borough?
Total Male Population of Jennerstown borough is 643.
What is the Total Female Population of Jennerstown borough?
Total Female Population of Jennerstown borough is 539.
What is the Ratio of Males per 100 Females in Jennerstown borough?
There are 119.29 Males per 100 Females in Jennerstown borough.
What is the Ratio of Females per 100 Males in Jennerstown borough?
There are 83.83 Females per 100 Males in Jennerstown borough.
What is the Median Population Age in Jennerstown borough?
Median Population Age in Jennerstown borough is 43.5 Years.
What is the Average Family Size in Jennerstown borough
Average Family Size in Jennerstown borough is 3.6 People.
What is the Average Household Size in Jennerstown borough
Average Household Size in Jennerstown borough is 3.5 People.
What is Per Capita Income in Jennerstown borough?
Per Capita income in Jennerstown borough is $39,768.
What is the Median Family Income in Jennerstown borough?
Median Family Income in Jennerstown borough is $59,460.
What is the Median Household income in Jennerstown borough?
Median Household Income in Jennerstown borough is $59,049.
What is Income or Wage Gap in Jennerstown borough?
Income or Wage Gap in Jennerstown borough is 25.8%.
Women in Jennerstown borough earn 74.2 cents for every dollar earned by a man.
What is Inequality or Gini Index in Jennerstown borough?
Inequality or Gini Index in Jennerstown borough is 0.48.
How Large is the Labor Force in Jennerstown borough?
There are 667 People in the Labor Forcein in Jennerstown borough.
What is the Percentage of People in the Labor Force in Jennerstown borough?
63.6% of People are in the Labor Force in Jennerstown borough.
What is the Unemployment Rate in Jennerstown borough?
Unemployment Rate in Jennerstown borough is 5.4%.