Zip Codes with the Highest Percentage of Population Employed in Health Diagnosing & Treating in West Chester, PA
RELATED REPORTS & OPTIONS
Health Diagnosing & Treating
West Chester
Compare Zip Codes
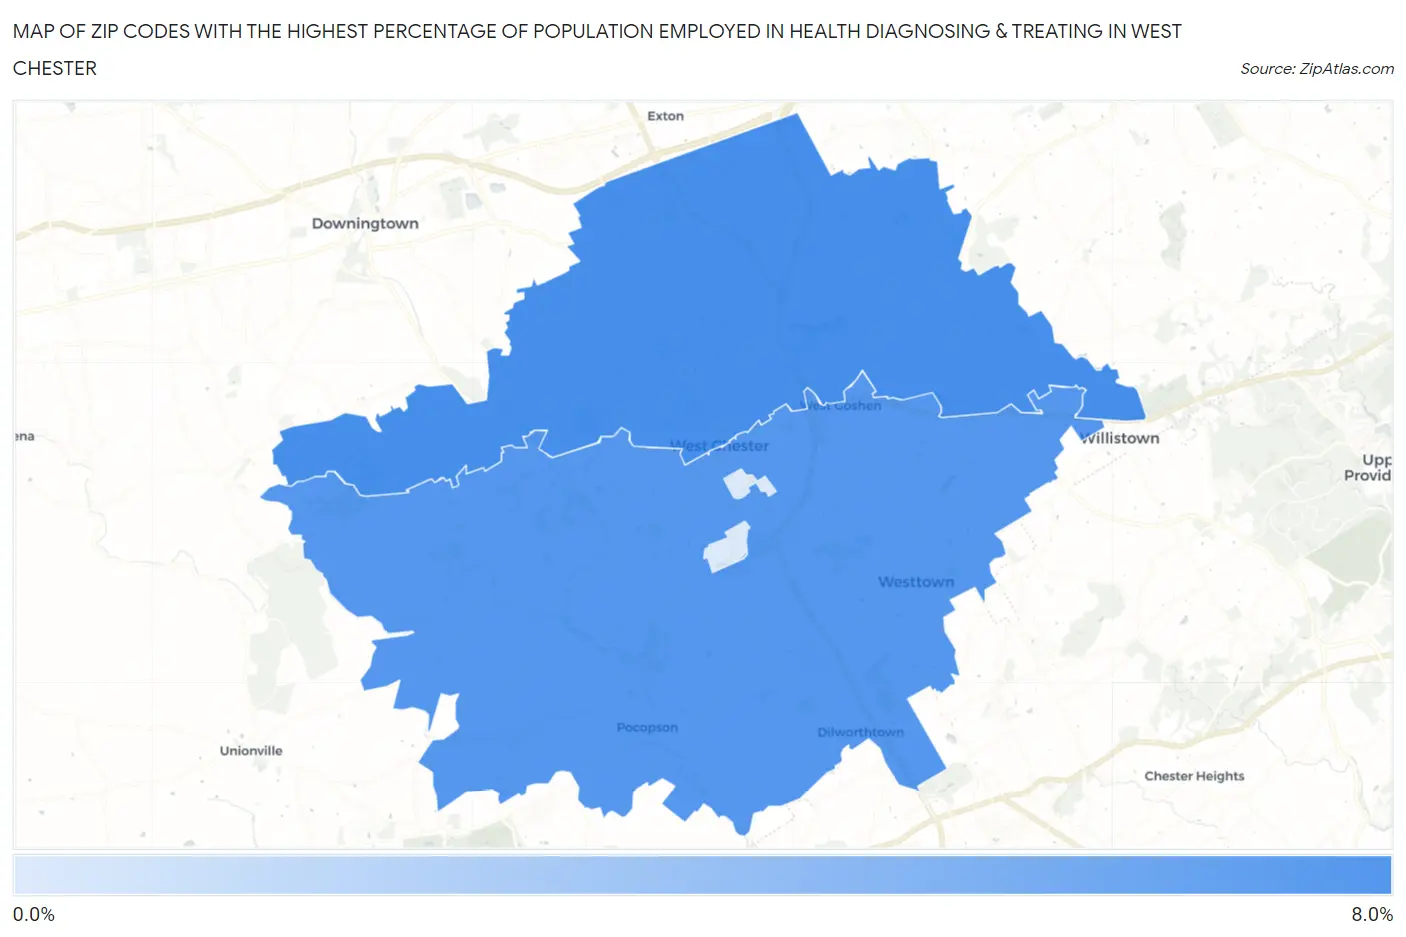
Map of Zip Codes with the Highest Percentage of Population Employed in Health Diagnosing & Treating in West Chester
0.0%
8.0%
Zip Codes with the Highest Percentage of Population Employed in Health Diagnosing & Treating in West Chester, PA
| Zip Code | % Employed | vs State | vs National | |
| 1. | 19380 | 7.2% | 7.4%(-0.161)#697 | 6.2%(+0.945)#9,753 |
| 2. | 19382 | 6.7% | 7.4%(-0.674)#803 | 6.2%(+0.432)#11,390 |
| 3. | 19383 | 1.4% | 7.4%(-5.98)#1,536 | 6.2%(-4.88)#27,370 |
1
Common Questions
What are the Top Zip Codes with the Highest Percentage of Population Employed in Health Diagnosing & Treating in West Chester, PA?
Top Zip Codes with the Highest Percentage of Population Employed in Health Diagnosing & Treating in West Chester, PA are:
What zip code has the Highest Percentage of Population Employed in Health Diagnosing & Treating in West Chester, PA?
19380 has the Highest Percentage of Population Employed in Health Diagnosing & Treating in West Chester, PA with 7.2%.
What is the Percentage of Population Employed in Health Diagnosing & Treating in Pennsylvania?
Percentage of Population Employed in Health Diagnosing & Treating in Pennsylvania is 7.4%.
What is the Percentage of Population Employed in Health Diagnosing & Treating in the United States?
Percentage of Population Employed in Health Diagnosing & Treating in the United States is 6.2%.