Zanesville, OH
Zanesville Map
Zanesville Overview
24,772
TOTAL POPULATION
11,746
MALE POPULATION
13,026
FEMALE POPULATION
90.17
MALES / 100 FEMALES
110.90
FEMALES / 100 MALES
38.1
MEDIAN AGE
3.0
AVG FAMILY SIZE
2.3
AVG HOUSEHOLD SIZE
$26,900
PER CAPITA INCOME
$45,730
AVG FAMILY INCOME
$40,927
AVG HOUSEHOLD INCOME
27.6%
WAGE / INCOME GAP [ % ]
72.4¢/ $1
WAGE / INCOME GAP [ $ ]
$11,008
FAMILY INCOME DEFICIT
0.50
INEQUALITY / GINI INDEX
11,041
LABOR FORCE [ PEOPLE ]
55.9%
PERCENT IN LABOR FORCE
8.5%
UNEMPLOYMENT RATE
Zanesville Zip Codes
Zanesville Area Codes
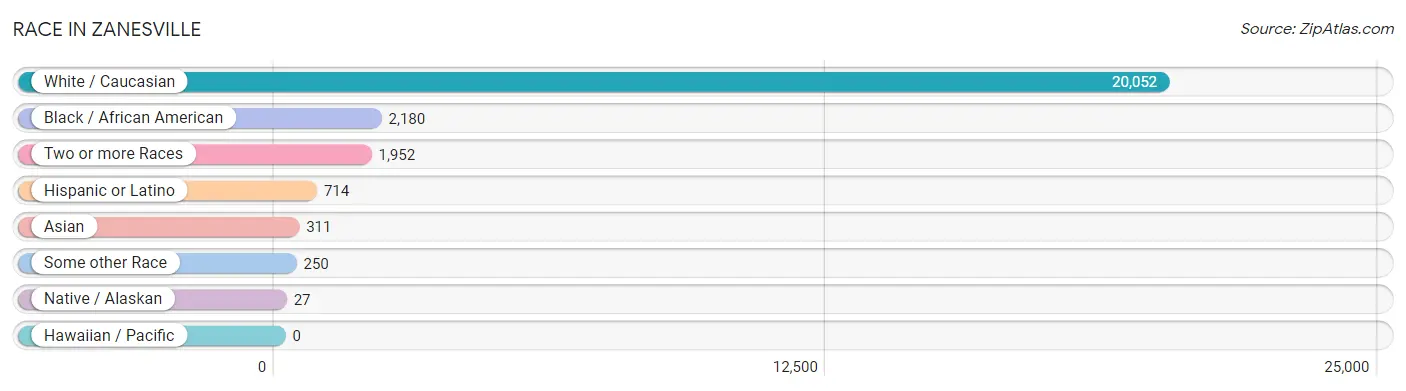
Race in Zanesville
The most populous races in Zanesville are White / Caucasian (20,052 | 80.9%), Black / African American (2,180 | 8.8%), and Two or more Races (1,952 | 7.9%).
| Race | # Population | % Population |
| Asian | 311 | 1.3% |
| Black / African American | 2,180 | 8.8% |
| Hawaiian / Pacific | 0 | 0.0% |
| Hispanic or Latino | 714 | 2.9% |
| Native / Alaskan | 27 | 0.1% |
| White / Caucasian | 20,052 | 80.9% |
| Two or more Races | 1,952 | 7.9% |
| Some other Race | 250 | 1.0% |
| Total | 24,772 | 100.0% |
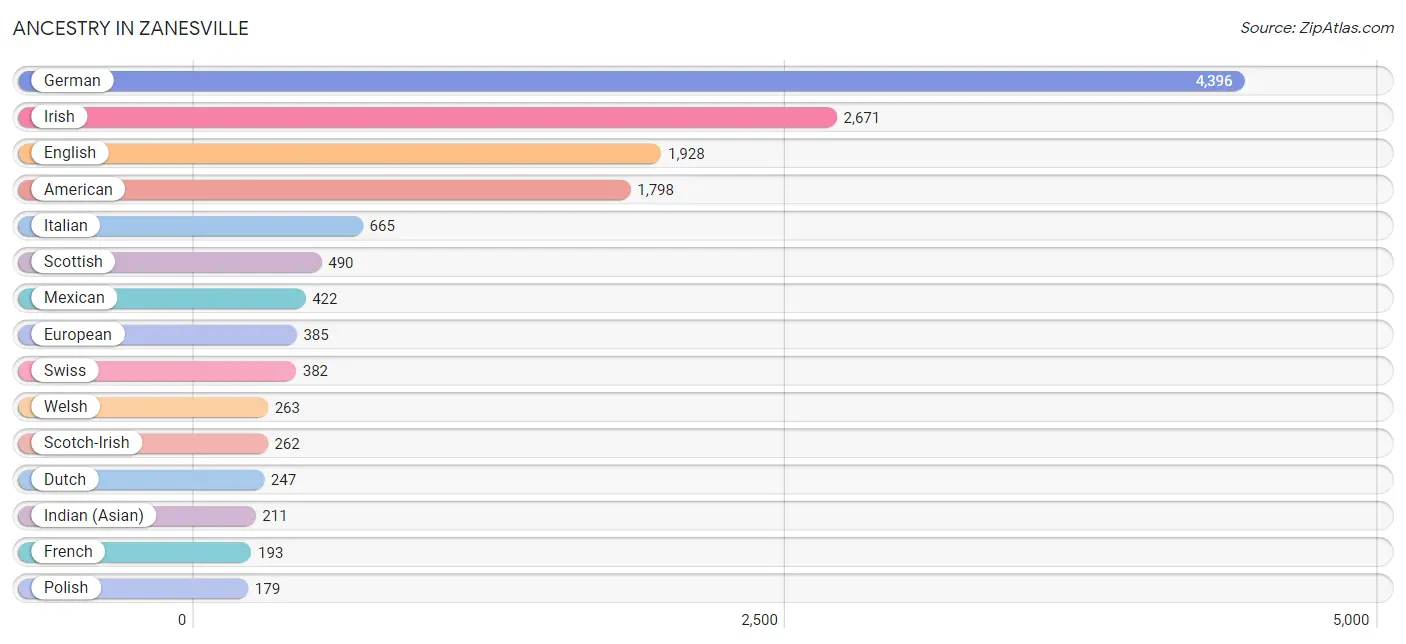
Ancestry in Zanesville
The most populous ancestries reported in Zanesville are German (4,396 | 17.7%), Irish (2,671 | 10.8%), English (1,928 | 7.8%), American (1,798 | 7.3%), and Italian (665 | 2.7%), together accounting for 46.2% of all Zanesville residents.
| Ancestry | # Population | % Population |
| African | 36 | 0.2% |
| American | 1,798 | 7.3% |
| Apache | 13 | 0.1% |
| Arab | 111 | 0.4% |
| Austrian | 9 | 0.0% |
| Blackfeet | 72 | 0.3% |
| British | 76 | 0.3% |
| Canadian | 8 | 0.0% |
| Central American | 7 | 0.0% |
| Cherokee | 72 | 0.3% |
| Choctaw | 8 | 0.0% |
| Croatian | 15 | 0.1% |
| Crow | 13 | 0.1% |
| Cuban | 13 | 0.1% |
| Czech | 32 | 0.1% |
| Czechoslovakian | 21 | 0.1% |
| Danish | 14 | 0.1% |
| Dutch | 247 | 1.0% |
| Eastern European | 20 | 0.1% |
| English | 1,928 | 7.8% |
| European | 385 | 1.5% |
| French | 193 | 0.8% |
| French Canadian | 20 | 0.1% |
| German | 4,396 | 17.7% |
| Greek | 48 | 0.2% |
| Guamanian / Chamorro | 40 | 0.2% |
| Hungarian | 36 | 0.2% |
| Indian (Asian) | 211 | 0.9% |
| Iranian | 21 | 0.1% |
| Irish | 2,671 | 10.8% |
| Italian | 665 | 2.7% |
| Korean | 133 | 0.5% |
| Lebanese | 87 | 0.4% |
| Malaysian | 112 | 0.4% |
| Mexican | 422 | 1.7% |
| Moroccan | 24 | 0.1% |
| Native Hawaiian | 40 | 0.2% |
| Nigerian | 7 | 0.0% |
| Northern European | 51 | 0.2% |
| Norwegian | 87 | 0.4% |
| Panamanian | 7 | 0.0% |
| Peruvian | 102 | 0.4% |
| Polish | 179 | 0.7% |
| Puerto Rican | 170 | 0.7% |
| Romanian | 22 | 0.1% |
| Russian | 88 | 0.4% |
| Scandinavian | 25 | 0.1% |
| Scotch-Irish | 262 | 1.1% |
| Scottish | 490 | 2.0% |
| Slovak | 62 | 0.3% |
| South American | 102 | 0.4% |
| Sri Lankan | 1 | 0.0% |
| Subsaharan African | 43 | 0.2% |
| Swiss | 382 | 1.5% |
| Thai | 13 | 0.1% |
| Ukrainian | 13 | 0.1% |
| Welsh | 263 | 1.1% | View All 57 Rows |
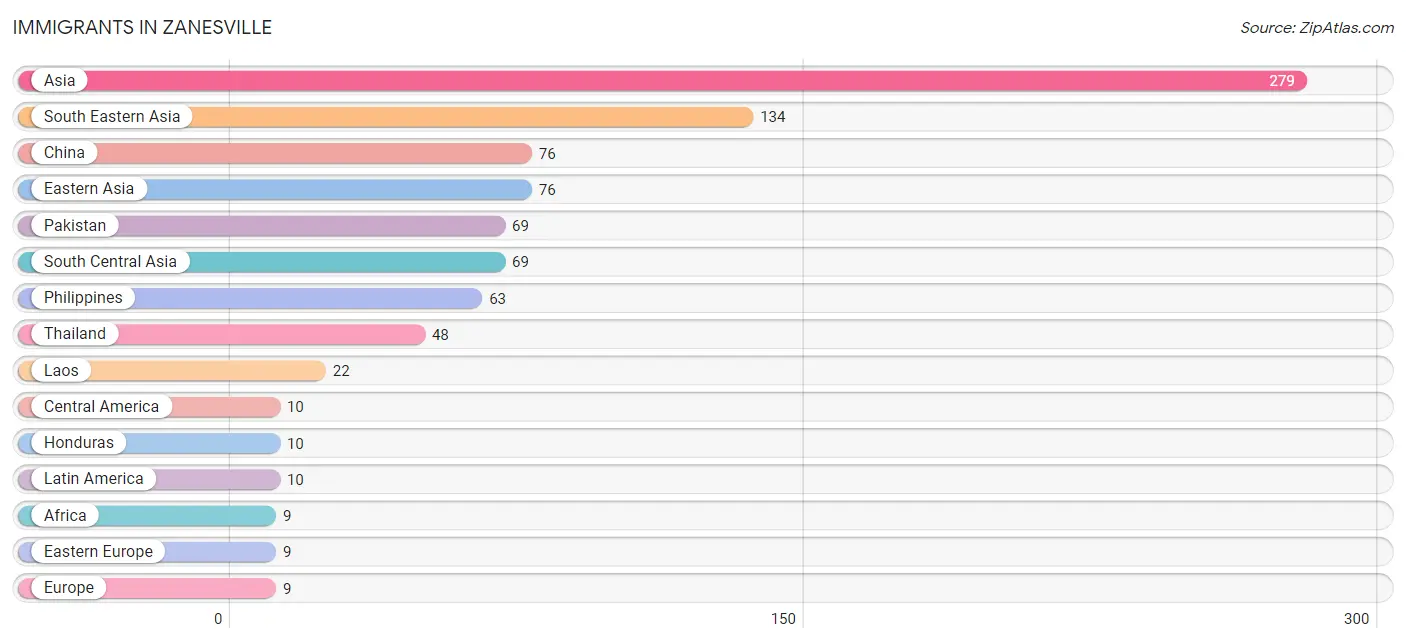
Immigrants in Zanesville
The most numerous immigrant groups reported in Zanesville came from Asia (279 | 1.1%), South Eastern Asia (134 | 0.5%), China (76 | 0.3%), Eastern Asia (76 | 0.3%), and Pakistan (69 | 0.3%), together accounting for 2.6% of all Zanesville residents.
| Immigration Origin | # Population | % Population |
| Africa | 9 | 0.0% |
| Asia | 279 | 1.1% |
| Central America | 10 | 0.0% |
| China | 76 | 0.3% |
| Eastern Asia | 76 | 0.3% |
| Eastern Europe | 9 | 0.0% |
| Europe | 9 | 0.0% |
| Honduras | 10 | 0.0% |
| Hungary | 9 | 0.0% |
| Laos | 22 | 0.1% |
| Latin America | 10 | 0.0% |
| Morocco | 9 | 0.0% |
| Northern Africa | 9 | 0.0% |
| Pakistan | 69 | 0.3% |
| Philippines | 63 | 0.3% |
| South Central Asia | 69 | 0.3% |
| South Eastern Asia | 134 | 0.5% |
| Thailand | 48 | 0.2% |
| Vietnam | 1 | 0.0% | View All 19 Rows |
Sex and Age in Zanesville
Sex and Age in Zanesville
The most populous age groups in Zanesville are 25 to 29 Years (1,131 | 9.6%) for men and 25 to 29 Years (1,077 | 8.3%) for women.
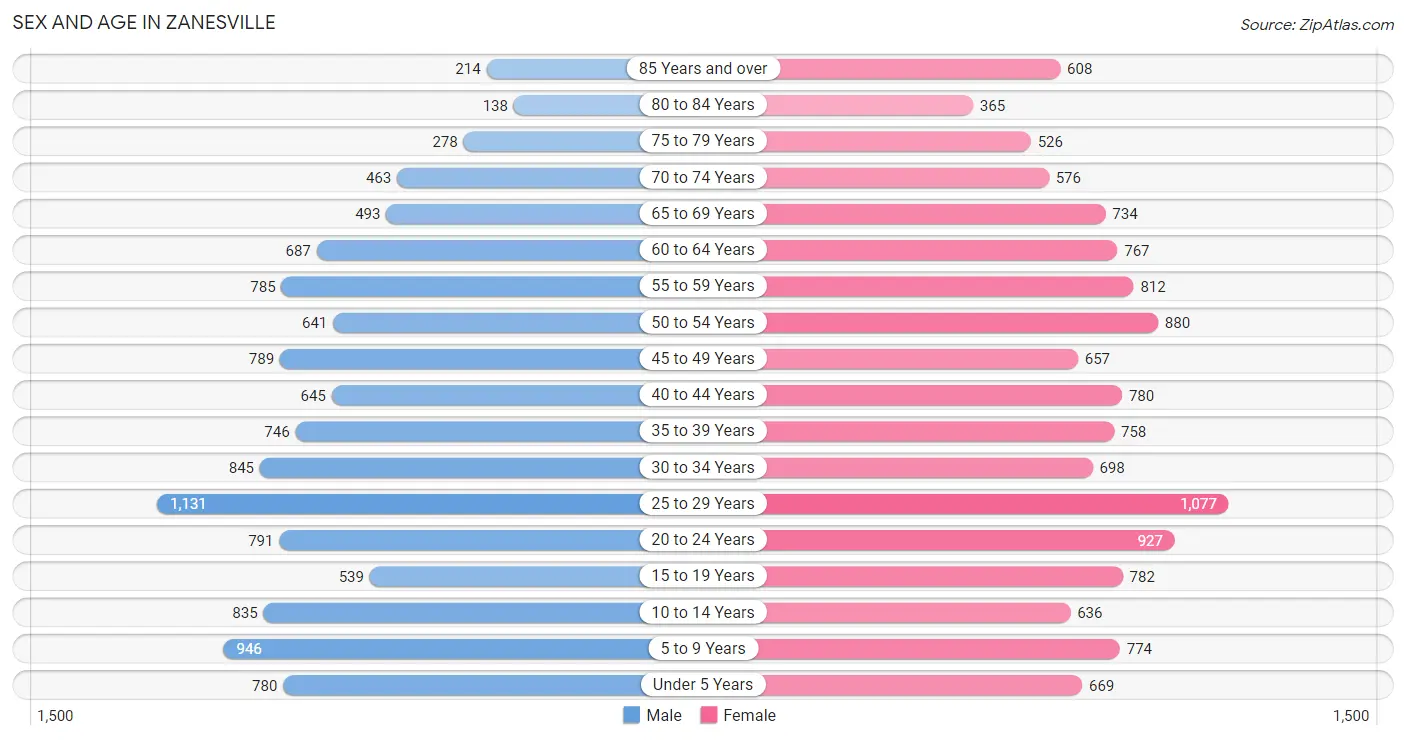
| Age Bracket | Male | Female |
| Under 5 Years | 780 (6.6%) | 669 (5.1%) |
| 5 to 9 Years | 946 (8.1%) | 774 (5.9%) |
| 10 to 14 Years | 835 (7.1%) | 636 (4.9%) |
| 15 to 19 Years | 539 (4.6%) | 782 (6.0%) |
| 20 to 24 Years | 791 (6.7%) | 927 (7.1%) |
| 25 to 29 Years | 1,131 (9.6%) | 1,077 (8.3%) |
| 30 to 34 Years | 845 (7.2%) | 698 (5.4%) |
| 35 to 39 Years | 746 (6.4%) | 758 (5.8%) |
| 40 to 44 Years | 645 (5.5%) | 780 (6.0%) |
| 45 to 49 Years | 789 (6.7%) | 657 (5.0%) |
| 50 to 54 Years | 641 (5.5%) | 880 (6.8%) |
| 55 to 59 Years | 785 (6.7%) | 812 (6.2%) |
| 60 to 64 Years | 687 (5.9%) | 767 (5.9%) |
| 65 to 69 Years | 493 (4.2%) | 734 (5.6%) |
| 70 to 74 Years | 463 (3.9%) | 576 (4.4%) |
| 75 to 79 Years | 278 (2.4%) | 526 (4.0%) |
| 80 to 84 Years | 138 (1.2%) | 365 (2.8%) |
| 85 Years and over | 214 (1.8%) | 608 (4.7%) |
| Total | 11,746 (100.0%) | 13,026 (100.0%) |
Families and Households in Zanesville
Median Family Size in Zanesville
The median family size in Zanesville is 2.95 persons per family, with married-couple families (2,771 | 48.5%) accounting for the largest median family size of 3.08 persons per family. On the other hand, single male/father families (701 | 12.3%) represent the smallest median family size with 2.79 persons per family.
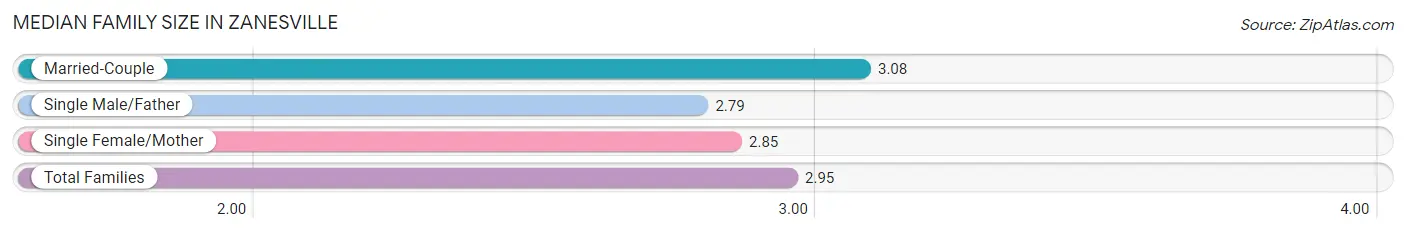
| Family Type | # Families | Family Size |
| Married-Couple | 2,771 (48.5%) | 3.08 |
| Single Male/Father | 701 (12.3%) | 2.79 |
| Single Female/Mother | 2,242 (39.2%) | 2.85 |
| Total Families | 5,714 (100.0%) | 2.95 |
Median Household Size in Zanesville
The median household size in Zanesville is 2.27 persons per household, with single male/father households (701 | 6.6%) accounting for the largest median household size of 3.77 persons per household. non-family households (4,948 | 46.4%) represent the smallest median household size with 1.19 persons per household.
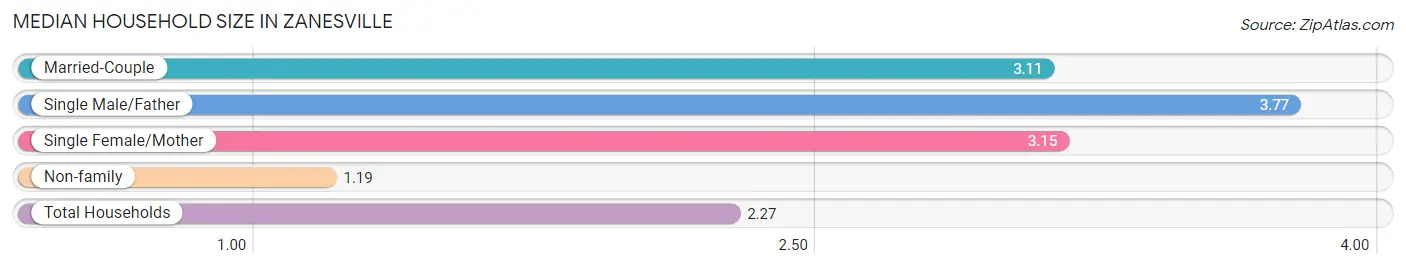
| Household Type | # Households | Household Size |
| Married-Couple | 2,771 (26.0%) | 3.11 |
| Single Male/Father | 701 (6.6%) | 3.77 |
| Single Female/Mother | 2,242 (21.0%) | 3.15 |
| Non-family | 4,948 (46.4%) | 1.19 |
| Total Households | 10,662 (100.0%) | 2.27 |
Household Size by Marriage Status in Zanesville
Out of a total of 10,662 households in Zanesville, 5,714 (53.6%) are family households, while 4,948 (46.4%) are nonfamily households. The most numerous type of family households are 2-person households, comprising 2,474, and the most common type of nonfamily households are 1-person households, comprising 4,109.
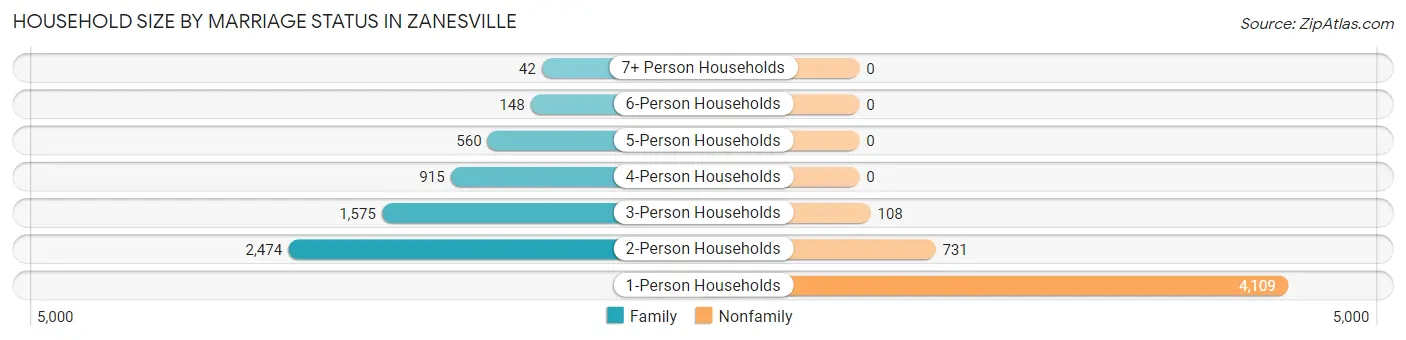
| Household Size | Family Households | Nonfamily Households |
| 1-Person Households | - | 4,109 (38.5%) |
| 2-Person Households | 2,474 (23.2%) | 731 (6.9%) |
| 3-Person Households | 1,575 (14.8%) | 108 (1.0%) |
| 4-Person Households | 915 (8.6%) | 0 (0.0%) |
| 5-Person Households | 560 (5.2%) | 0 (0.0%) |
| 6-Person Households | 148 (1.4%) | 0 (0.0%) |
| 7+ Person Households | 42 (0.4%) | 0 (0.0%) |
| Total | 5,714 (53.6%) | 4,948 (46.4%) |
Female Fertility in Zanesville
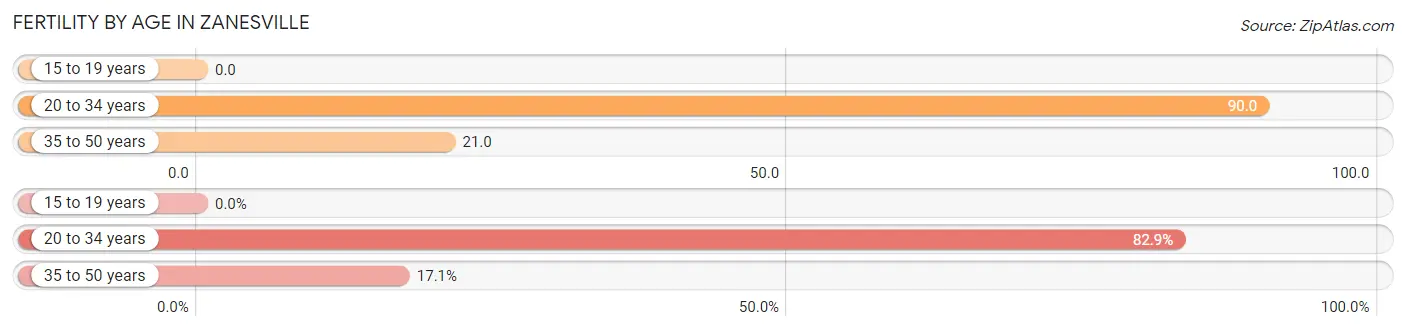
Fertility by Age in Zanesville
Average fertility rate in Zanesville is 50.0 births per 1,000 women. Women in the age bracket of 20 to 34 years have the highest fertility rate with 90.0 births per 1,000 women. Women in the age bracket of 20 to 34 years acount for 82.9% of all women with births.
| Age Bracket | Women with Births | Births / 1,000 Women |
| 15 to 19 years | 0 (0.0%) | 0.0 |
| 20 to 34 years | 242 (82.9%) | 90.0 |
| 35 to 50 years | 50 (17.1%) | 21.0 |
| Total | 292 (100.0%) | 50.0 |
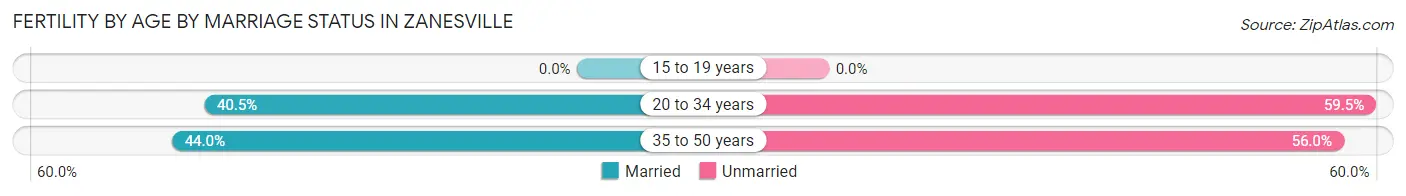
Fertility by Age by Marriage Status in Zanesville
41.1% of women with births (292) in Zanesville are married. The highest percentage of unmarried women with births falls into 20 to 34 years age bracket with 59.5% of them unmarried at the time of birth, while the lowest percentage of unmarried women with births belong to 35 to 50 years age bracket with 56.0% of them unmarried.
| Age Bracket | Married | Unmarried |
| 15 to 19 years | 0 (0.0%) | 0 (0.0%) |
| 20 to 34 years | 98 (40.5%) | 144 (59.5%) |
| 35 to 50 years | 22 (44.0%) | 28 (56.0%) |
| Total | 120 (41.1%) | 172 (58.9%) |
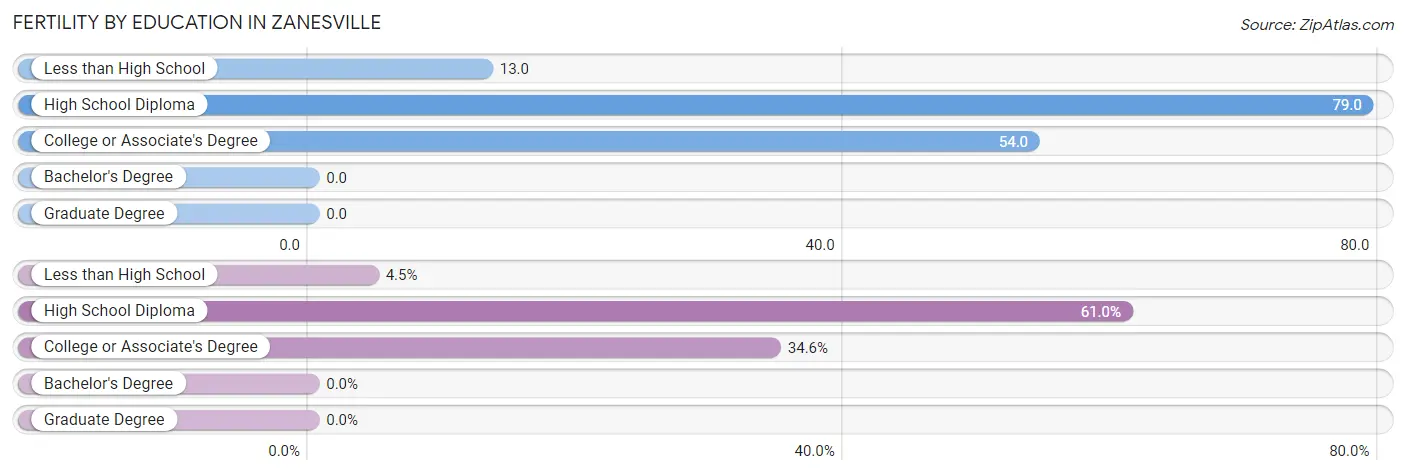
Fertility by Education in Zanesville
| Educational Attainment | Women with Births | Births / 1,000 Women |
| Less than High School | 13 (4.4%) | 13.0 |
| High School Diploma | 178 (61.0%) | 79.0 |
| College or Associate's Degree | 101 (34.6%) | 54.0 |
| Bachelor's Degree | 0 (0.0%) | 0.0 |
| Graduate Degree | 0 (0.0%) | 0.0 |
| Total | 292 (100.0%) | 50.0 |
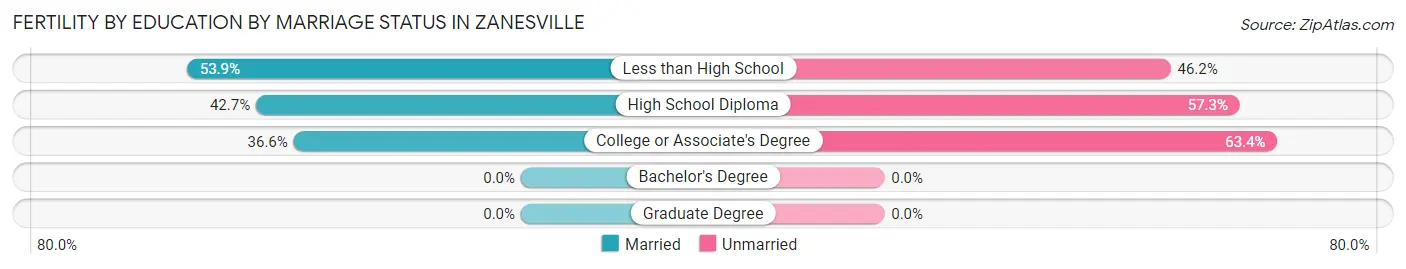
Fertility by Education by Marriage Status in Zanesville
58.9% of women with births in Zanesville are unmarried. Women with the educational attainment of less than high school are most likely to be married with 53.8% of them married at childbirth, while women with the educational attainment of college or associate's degree are least likely to be married with 63.4% of them unmarried at childbirth.
| Educational Attainment | Married | Unmarried |
| Less than High School | 7 (53.8%) | 6 (46.2%) |
| High School Diploma | 76 (42.7%) | 102 (57.3%) |
| College or Associate's Degree | 37 (36.6%) | 64 (63.4%) |
| Bachelor's Degree | 0 (0.0%) | 0 (0.0%) |
| Graduate Degree | 0 (0.0%) | 0 (0.0%) |
| Total | 120 (41.1%) | 172 (58.9%) |
Income in Zanesville
Income Overview in Zanesville
Per Capita Income in Zanesville is $26,900, while median incomes of families and households are $45,730 and $40,927 respectively.
| Characteristic | Number | Measure |
| Per Capita Income | 24,772 | $26,900 |
| Median Family Income | 5,714 | $45,730 |
| Mean Family Income | 5,714 | $63,774 |
| Median Household Income | 10,662 | $40,927 |
| Mean Household Income | 10,662 | $59,661 |
| Income Deficit | 5,714 | $11,008 |
| Wage / Income Gap (%) | 24,772 | 27.61% |
| Wage / Income Gap ($) | 24,772 | 72.39¢ per $1 |
| Gini / Inequality Index | 24,772 | 0.50 |
Earnings by Sex in Zanesville
Average Earnings in Zanesville are $29,963, $34,041 for men and $24,641 for women, a difference of 27.6%.
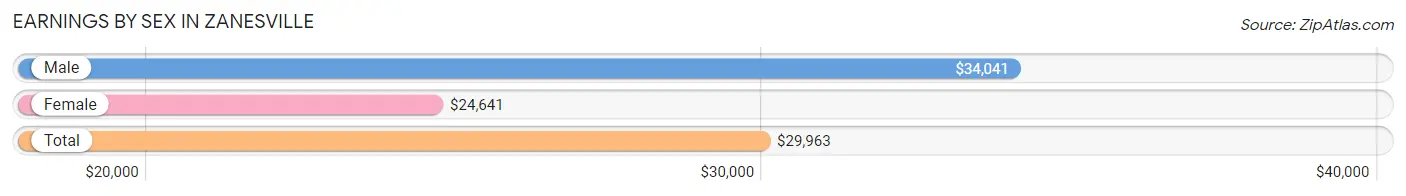
| Sex | Number | Average Earnings |
| Male | 5,836 (49.9%) | $34,041 |
| Female | 5,864 (50.1%) | $24,641 |
| Total | 11,700 (100.0%) | $29,963 |
Earnings by Sex by Income Bracket in Zanesville
The most common earnings brackets in Zanesville are $30,000 to $34,999 for men (681 | 11.7%) and $30,000 to $34,999 for women (522 | 8.9%).
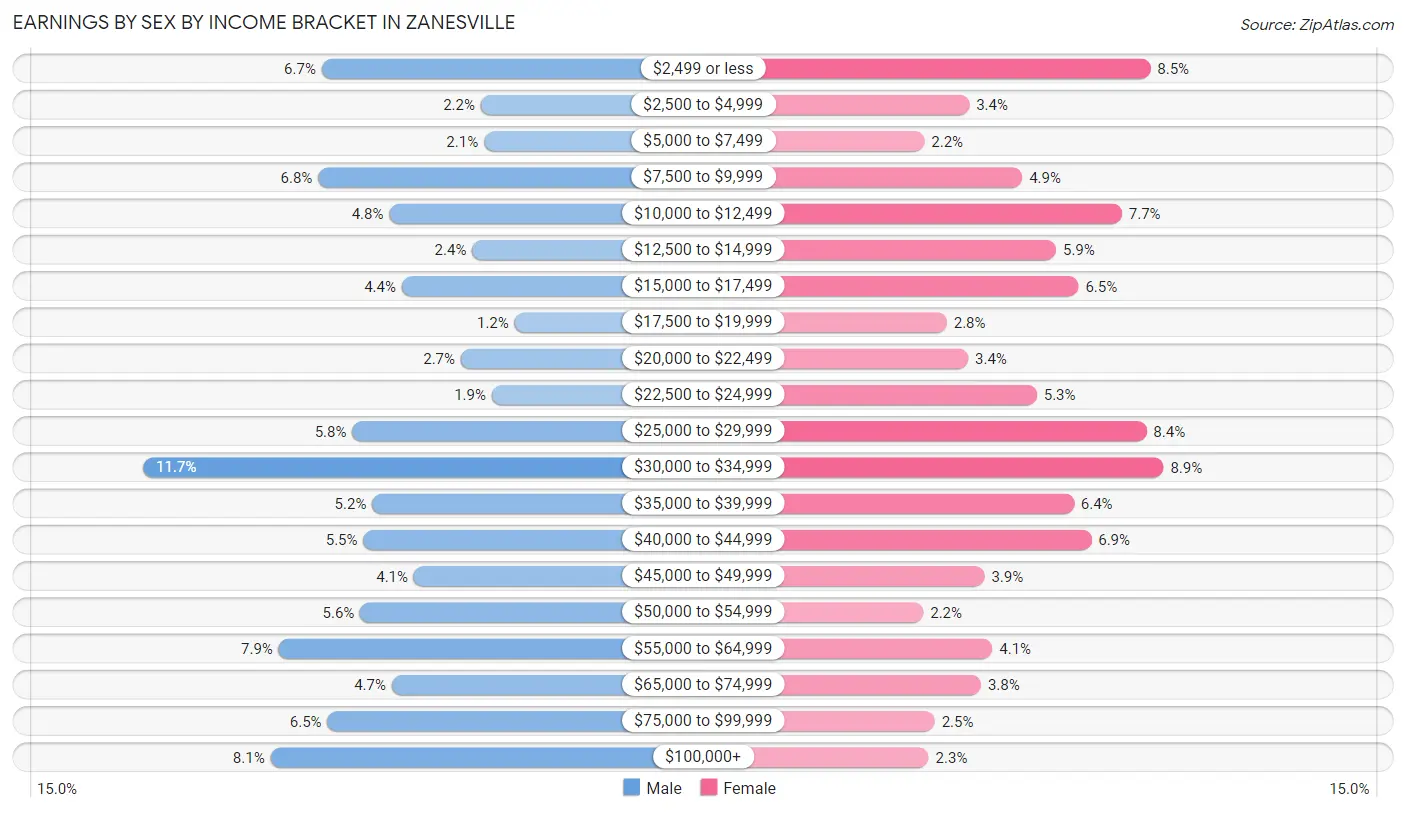
| Income | Male | Female |
| $2,499 or less | 388 (6.7%) | 500 (8.5%) |
| $2,500 to $4,999 | 127 (2.2%) | 202 (3.4%) |
| $5,000 to $7,499 | 122 (2.1%) | 128 (2.2%) |
| $7,500 to $9,999 | 394 (6.8%) | 289 (4.9%) |
| $10,000 to $12,499 | 277 (4.8%) | 453 (7.7%) |
| $12,500 to $14,999 | 141 (2.4%) | 345 (5.9%) |
| $15,000 to $17,499 | 257 (4.4%) | 382 (6.5%) |
| $17,500 to $19,999 | 72 (1.2%) | 165 (2.8%) |
| $20,000 to $22,499 | 160 (2.7%) | 200 (3.4%) |
| $22,500 to $24,999 | 109 (1.9%) | 313 (5.3%) |
| $25,000 to $29,999 | 338 (5.8%) | 494 (8.4%) |
| $30,000 to $34,999 | 681 (11.7%) | 522 (8.9%) |
| $35,000 to $39,999 | 305 (5.2%) | 374 (6.4%) |
| $40,000 to $44,999 | 320 (5.5%) | 403 (6.9%) |
| $45,000 to $49,999 | 237 (4.1%) | 227 (3.9%) |
| $50,000 to $54,999 | 325 (5.6%) | 126 (2.1%) |
| $55,000 to $64,999 | 459 (7.9%) | 240 (4.1%) |
| $65,000 to $74,999 | 273 (4.7%) | 221 (3.8%) |
| $75,000 to $99,999 | 379 (6.5%) | 145 (2.5%) |
| $100,000+ | 472 (8.1%) | 135 (2.3%) |
| Total | 5,836 (100.0%) | 5,864 (100.0%) |
Earnings by Sex by Educational Attainment in Zanesville
Average earnings in Zanesville are $37,893 for men and $26,904 for women, a difference of 29.0%. Men with an educational attainment of graduate degree enjoy the highest average annual earnings of $112,500, while those with less than high school education earn the least with $28,375. Women with an educational attainment of graduate degree earn the most with the average annual earnings of $61,576, while those with less than high school education have the smallest earnings of $15,500.
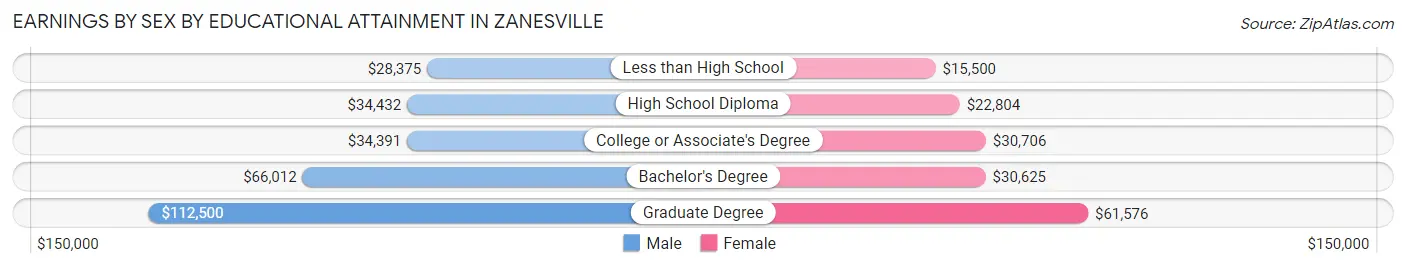
| Educational Attainment | Male Income | Female Income |
| Less than High School | $28,375 | $15,500 |
| High School Diploma | $34,432 | $22,804 |
| College or Associate's Degree | $34,391 | $30,706 |
| Bachelor's Degree | $66,012 | $30,625 |
| Graduate Degree | $112,500 | $61,576 |
| Total | $37,893 | $26,904 |
Family Income in Zanesville
Family Income Brackets in Zanesville
According to the Zanesville family income data, there are 1,149 families falling into the $35,000 to $49,999 income range, which is the most common income bracket and makes up 20.1% of all families. Conversely, the $200,000+ income bracket is the least frequent group with only 183 families (3.2%) belonging to this category.
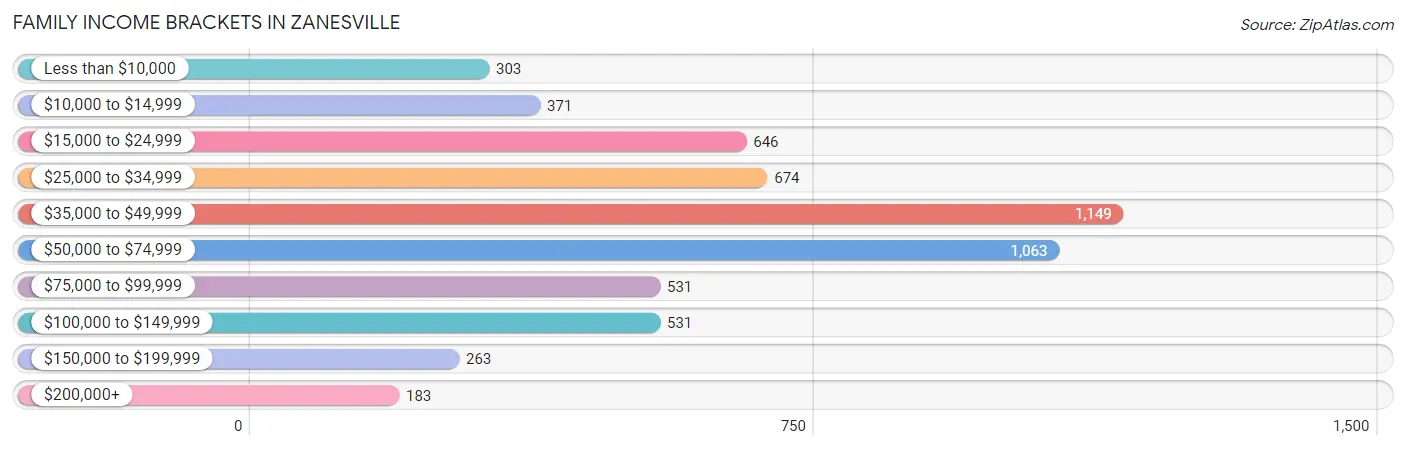
| Income Bracket | # Families | % Families |
| Less than $10,000 | 303 | 5.3% |
| $10,000 to $14,999 | 371 | 6.5% |
| $15,000 to $24,999 | 646 | 11.3% |
| $25,000 to $34,999 | 674 | 11.8% |
| $35,000 to $49,999 | 1,149 | 20.1% |
| $50,000 to $74,999 | 1,063 | 18.6% |
| $75,000 to $99,999 | 531 | 9.3% |
| $100,000 to $149,999 | 531 | 9.3% |
| $150,000 to $199,999 | 263 | 4.6% |
| $200,000+ | 183 | 3.2% |
Family Income by Famaliy Size in Zanesville
4-person families (862 | 15.1%) account for the highest median family income in Zanesville with $64,000 per family, while 2-person families (3,127 | 54.7%) have the highest median income of $22,213 per family member.
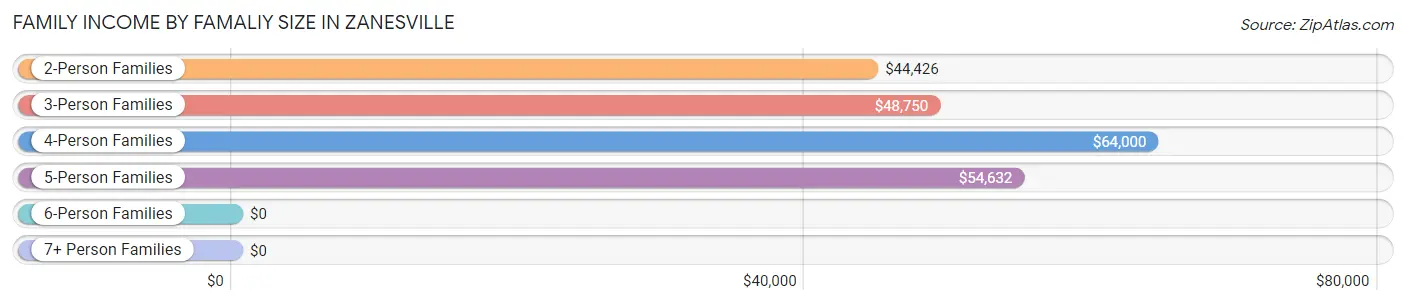
| Income Bracket | # Families | Median Income |
| 2-Person Families | 3,127 (54.7%) | $44,426 |
| 3-Person Families | 1,267 (22.2%) | $48,750 |
| 4-Person Families | 862 (15.1%) | $64,000 |
| 5-Person Families | 319 (5.6%) | $54,632 |
| 6-Person Families | 116 (2.0%) | $0 |
| 7+ Person Families | 23 (0.4%) | $0 |
| Total | 5,714 (100.0%) | $45,730 |
Family Income by Number of Earners in Zanesville
The median family income in Zanesville is $45,730, with families comprising 3+ earners (428) having the highest median family income of $108,125, while families with no earners (1,384) have the lowest median family income of $33,706, accounting for 7.5% and 24.2% of families, respectively.
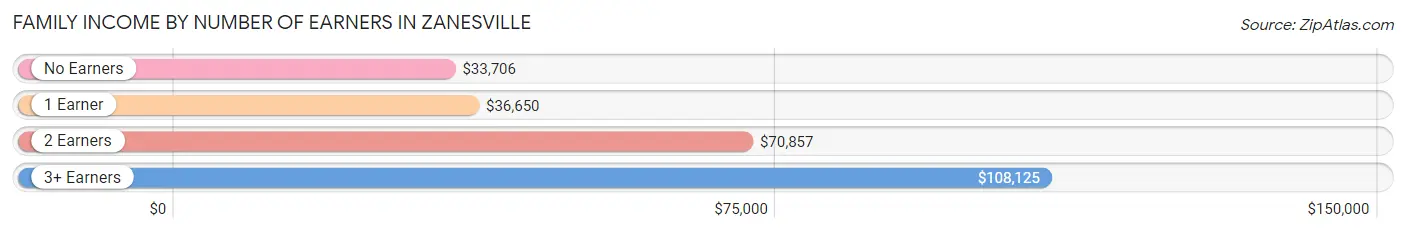
| Number of Earners | # Families | Median Income |
| No Earners | 1,384 (24.2%) | $33,706 |
| 1 Earner | 2,286 (40.0%) | $36,650 |
| 2 Earners | 1,616 (28.3%) | $70,857 |
| 3+ Earners | 428 (7.5%) | $108,125 |
| Total | 5,714 (100.0%) | $45,730 |
Household Income in Zanesville
Household Income Brackets in Zanesville
With 1,759 households falling in the category, the $50,000 to $74,999 income range is the most frequent in Zanesville, accounting for 16.5% of all households. In contrast, only 309 households (2.9%) fall into the $200,000+ income bracket, making it the least populous group.
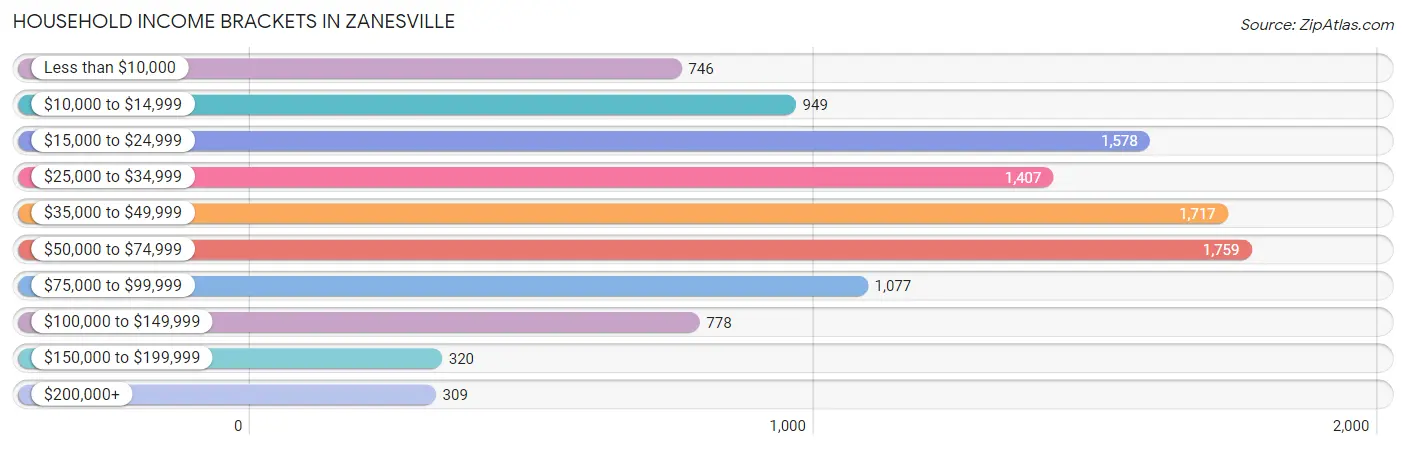
| Income Bracket | # Households | % Households |
| Less than $10,000 | 746 | 7.0% |
| $10,000 to $14,999 | 949 | 8.9% |
| $15,000 to $24,999 | 1,578 | 14.8% |
| $25,000 to $34,999 | 1,407 | 13.2% |
| $35,000 to $49,999 | 1,717 | 16.1% |
| $50,000 to $74,999 | 1,759 | 16.5% |
| $75,000 to $99,999 | 1,077 | 10.1% |
| $100,000 to $149,999 | 778 | 7.3% |
| $150,000 to $199,999 | 320 | 3.0% |
| $200,000+ | 309 | 2.9% |
Household Income by Householder Age in Zanesville
The median household income in Zanesville is $40,927, with the highest median household income of $44,296 found in the 45 to 64 years age bracket for the primary householder. A total of 3,769 households (35.3%) fall into this category. Meanwhile, the 65+ years age bracket for the primary householder has the lowest median household income of $36,727, with 2,934 households (27.5%) in this group.
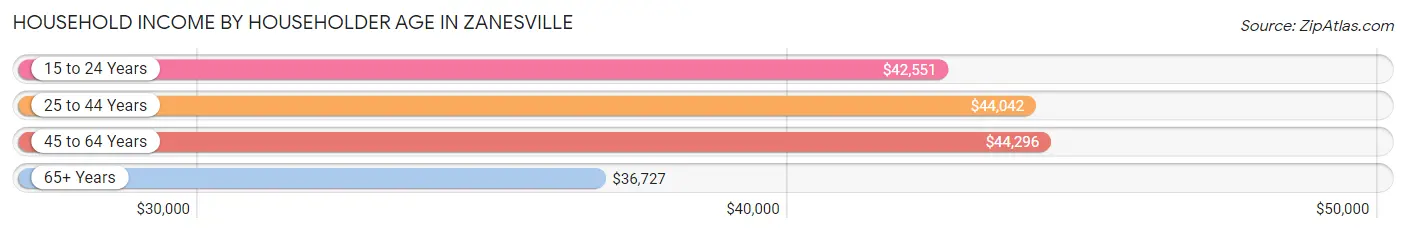
| Income Bracket | # Households | Median Income |
| 15 to 24 Years | 714 (6.7%) | $42,551 |
| 25 to 44 Years | 3,245 (30.4%) | $44,042 |
| 45 to 64 Years | 3,769 (35.3%) | $44,296 |
| 65+ Years | 2,934 (27.5%) | $36,727 |
| Total | 10,662 (100.0%) | $40,927 |
Poverty in Zanesville
Income Below Poverty by Sex and Age in Zanesville
With 27.0% poverty level for males and 23.7% for females among the residents of Zanesville, under 5 year old males and 6 to 11 year old females are the most vulnerable to poverty, with 457 males (59.5%) and 285 females (38.6%) in their respective age groups living below the poverty level.
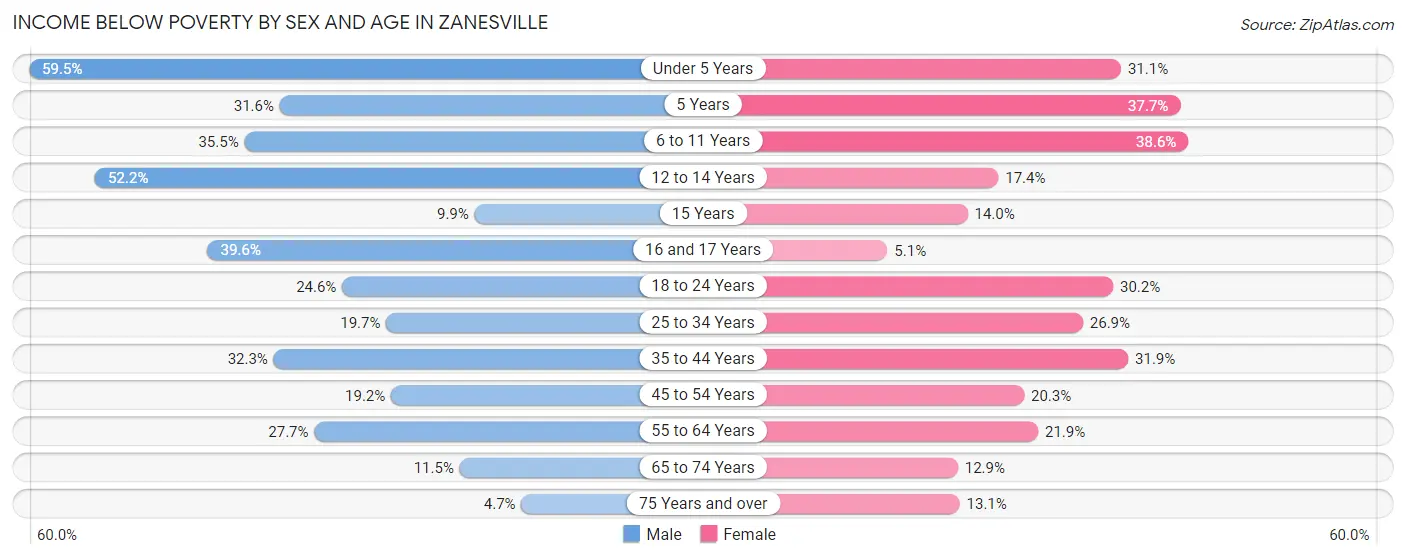
| Age Bracket | Male | Female |
| Under 5 Years | 457 (59.5%) | 208 (31.1%) |
| 5 Years | 48 (31.6%) | 78 (37.7%) |
| 6 to 11 Years | 392 (35.5%) | 285 (38.6%) |
| 12 to 14 Years | 217 (52.2%) | 61 (17.4%) |
| 15 Years | 8 (9.9%) | 42 (14.0%) |
| 16 and 17 Years | 84 (39.6%) | 10 (5.1%) |
| 18 to 24 Years | 249 (24.6%) | 364 (30.2%) |
| 25 to 34 Years | 377 (19.7%) | 471 (26.9%) |
| 35 to 44 Years | 429 (32.3%) | 485 (31.9%) |
| 45 to 54 Years | 268 (19.2%) | 312 (20.3%) |
| 55 to 64 Years | 393 (27.7%) | 343 (21.9%) |
| 65 to 74 Years | 110 (11.5%) | 167 (12.9%) |
| 75 Years and over | 28 (4.7%) | 177 (13.1%) |
| Total | 3,060 (27.0%) | 3,003 (23.7%) |
Income Above Poverty by Sex and Age in Zanesville
According to the poverty statistics in Zanesville, males aged 75 years and over and females aged 16 and 17 years are the age groups that are most secure financially, with 95.3% of males and 94.9% of females in these age groups living above the poverty line.
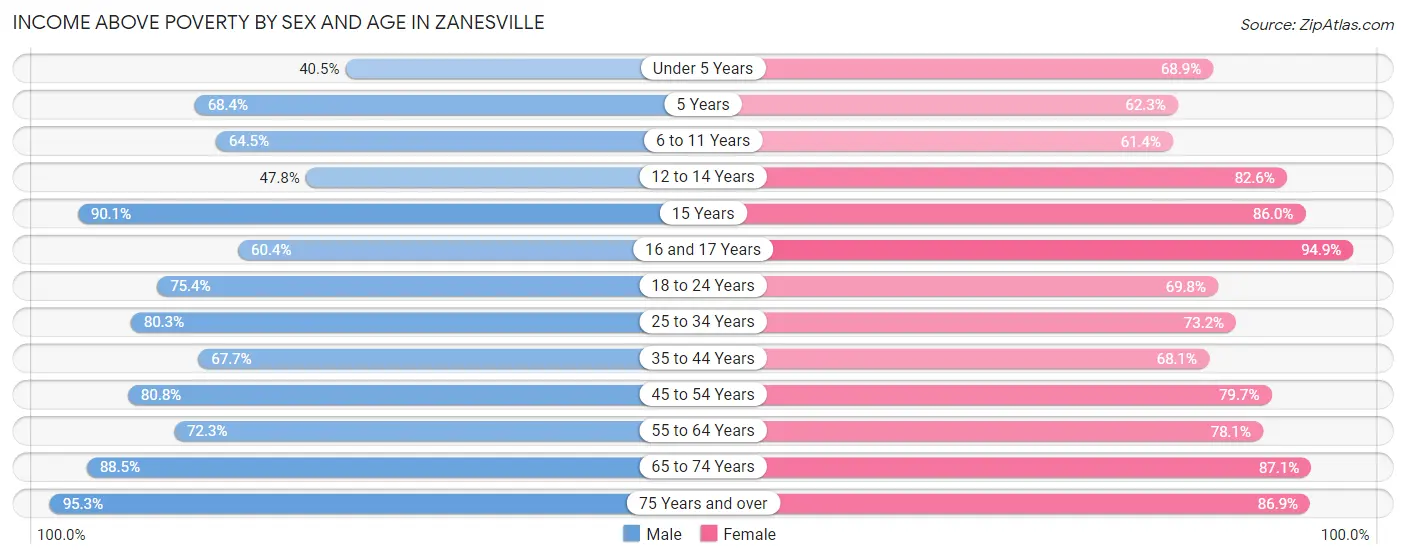
| Age Bracket | Male | Female |
| Under 5 Years | 311 (40.5%) | 461 (68.9%) |
| 5 Years | 104 (68.4%) | 129 (62.3%) |
| 6 to 11 Years | 712 (64.5%) | 454 (61.4%) |
| 12 to 14 Years | 199 (47.8%) | 289 (82.6%) |
| 15 Years | 73 (90.1%) | 258 (86.0%) |
| 16 and 17 Years | 128 (60.4%) | 187 (94.9%) |
| 18 to 24 Years | 762 (75.4%) | 841 (69.8%) |
| 25 to 34 Years | 1,535 (80.3%) | 1,283 (73.2%) |
| 35 to 44 Years | 901 (67.7%) | 1,036 (68.1%) |
| 45 to 54 Years | 1,129 (80.8%) | 1,225 (79.7%) |
| 55 to 64 Years | 1,024 (72.3%) | 1,226 (78.1%) |
| 65 to 74 Years | 843 (88.5%) | 1,126 (87.1%) |
| 75 Years and over | 571 (95.3%) | 1,172 (86.9%) |
| Total | 8,292 (73.0%) | 9,687 (76.3%) |
Income Below Poverty Among Married-Couple Families in Zanesville
The poverty statistics for married-couple families in Zanesville show that 9.4% or 260 of the total 2,771 families live below the poverty line. Families with 3 or 4 children have the highest poverty rate of 31.8%, comprising of 41 families. On the other hand, families with 5 or more children have the lowest poverty rate of 0.0%, which includes 0 families.
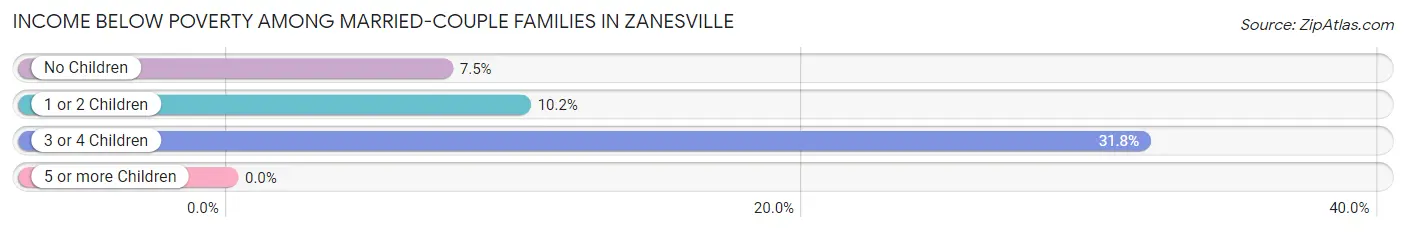
| Children | Above Poverty | Below Poverty |
| No Children | 1,694 (92.5%) | 137 (7.5%) |
| 1 or 2 Children | 723 (89.8%) | 82 (10.2%) |
| 3 or 4 Children | 88 (68.2%) | 41 (31.8%) |
| 5 or more Children | 6 (100.0%) | 0 (0.0%) |
| Total | 2,511 (90.6%) | 260 (9.4%) |
Income Below Poverty Among Single-Parent Households in Zanesville
According to the poverty data in Zanesville, 12.4% or 87 single-father households and 35.2% or 789 single-mother households are living below the poverty line. Among single-father households, those with 1 or 2 children have the highest poverty rate, with 75 households (20.6%) experiencing poverty. Likewise, among single-mother households, those with 5 or more children have the highest poverty rate, with 57 households (100.0%) falling below the poverty line.
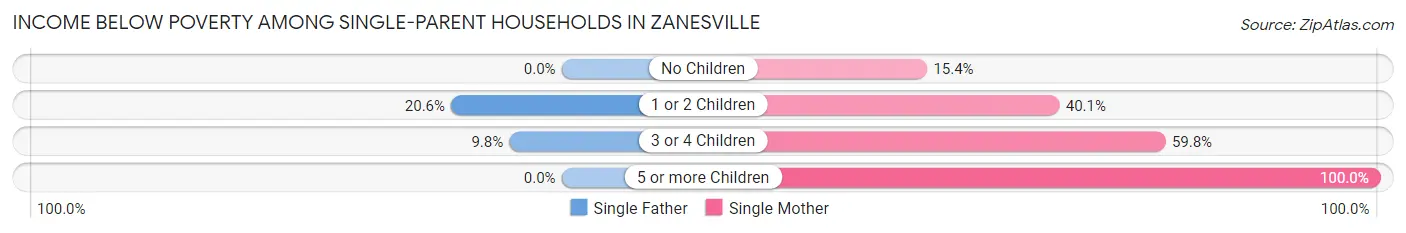
| Children | Single Father | Single Mother |
| No Children | 0 (0.0%) | 120 (15.4%) |
| 1 or 2 Children | 75 (20.6%) | 466 (40.1%) |
| 3 or 4 Children | 12 (9.8%) | 146 (59.8%) |
| 5 or more Children | 0 (0.0%) | 57 (100.0%) |
| Total | 87 (12.4%) | 789 (35.2%) |
Income Below Poverty Among Married-Couple vs Single-Parent Households in Zanesville
The poverty data for Zanesville shows that 260 of the married-couple family households (9.4%) and 876 of the single-parent households (29.8%) are living below the poverty level. Within the married-couple family households, those with 3 or 4 children have the highest poverty rate, with 41 households (31.8%) falling below the poverty line. Among the single-parent households, those with 5 or more children have the highest poverty rate, with 57 household (100.0%) living below poverty.
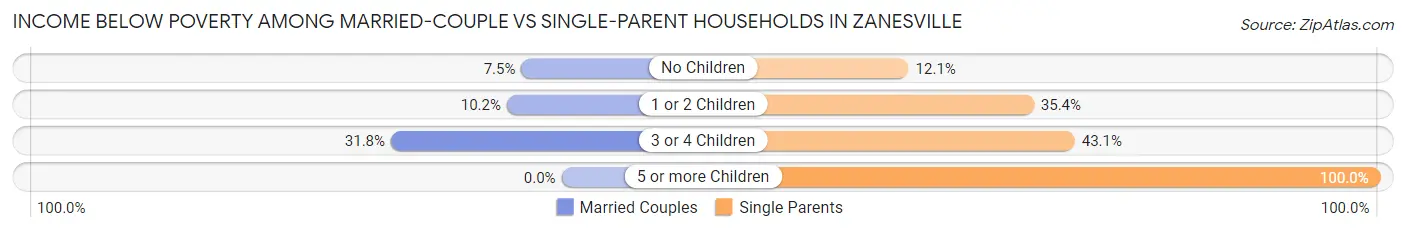
| Children | Married-Couple Families | Single-Parent Households |
| No Children | 137 (7.5%) | 120 (12.1%) |
| 1 or 2 Children | 82 (10.2%) | 541 (35.4%) |
| 3 or 4 Children | 41 (31.8%) | 158 (43.0%) |
| 5 or more Children | 0 (0.0%) | 57 (100.0%) |
| Total | 260 (9.4%) | 876 (29.8%) |
Employment Characteristics in Zanesville
Employment by Class of Employer in Zanesville
Among the 9,929 employed individuals in Zanesville, private company employees (7,302 | 73.5%), not-for-profit organizations (1,122 | 11.3%), and self-employed (not incorporated) (638 | 6.4%) make up the most common classes of employment.
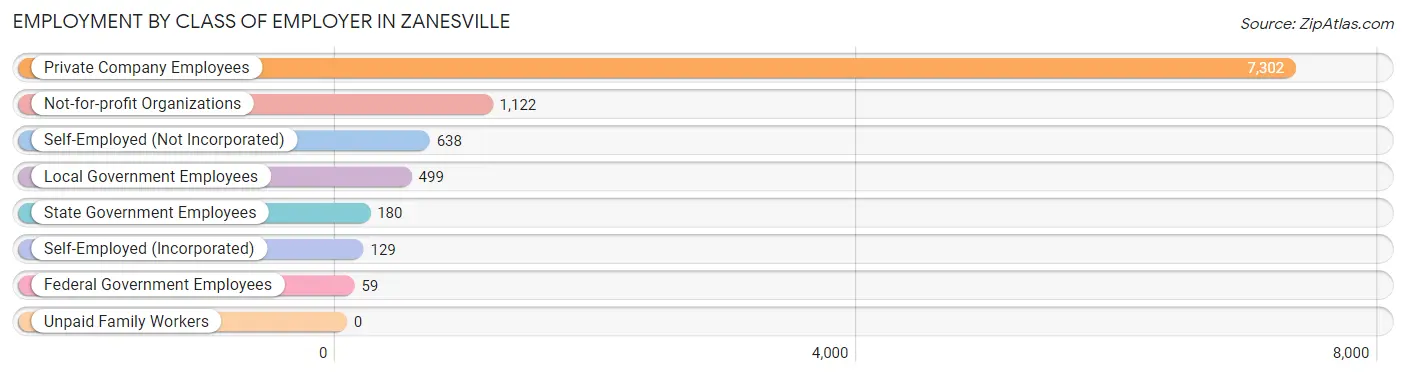
| Employer Class | # Employees | % Employees |
| Private Company Employees | 7,302 | 73.5% |
| Self-Employed (Incorporated) | 129 | 1.3% |
| Self-Employed (Not Incorporated) | 638 | 6.4% |
| Not-for-profit Organizations | 1,122 | 11.3% |
| Local Government Employees | 499 | 5.0% |
| State Government Employees | 180 | 1.8% |
| Federal Government Employees | 59 | 0.6% |
| Unpaid Family Workers | 0 | 0.0% |
| Total | 9,929 | 100.0% |
Employment Status by Age in Zanesville
According to the labor force statistics for Zanesville, out of the total population over 16 years of age (19,751), 55.9% or 11,041 individuals are in the labor force, with 8.5% or 938 of them unemployed. The age group with the highest labor force participation rate is 25 to 29 years, with 80.9% or 1,786 individuals in the labor force. Within the labor force, the 16 to 19 years age range has the highest percentage of unemployed individuals, with 18.2% or 94 of them being unemployed.
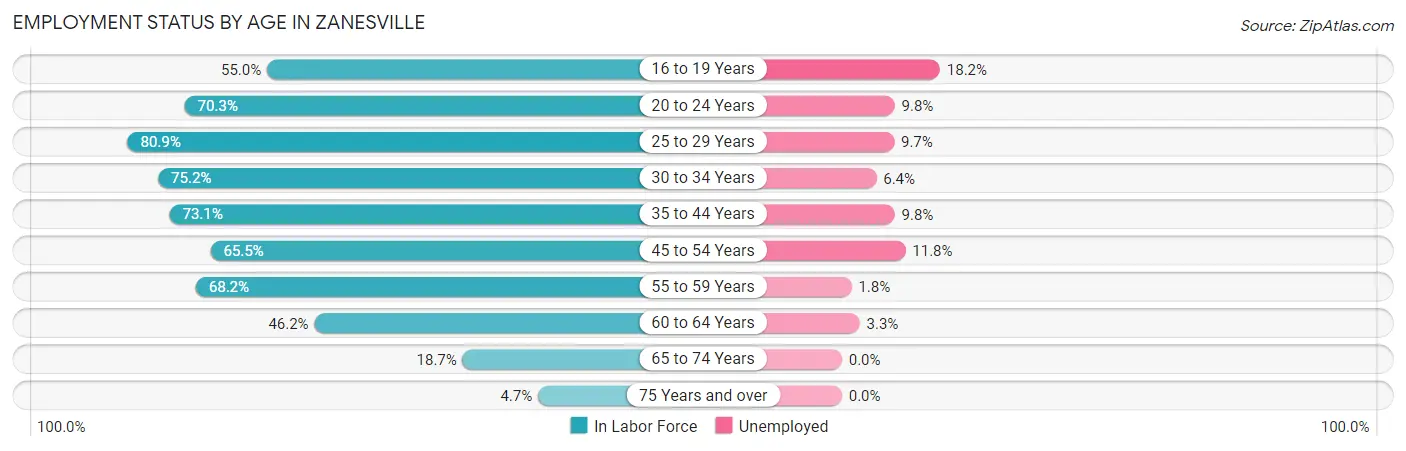
| Age Bracket | In Labor Force | Unemployed |
| 16 to 19 Years | 517 (55.0%) | 94 (18.2%) |
| 20 to 24 Years | 1,208 (70.3%) | 118 (9.8%) |
| 25 to 29 Years | 1,786 (80.9%) | 173 (9.7%) |
| 30 to 34 Years | 1,160 (75.2%) | 74 (6.4%) |
| 35 to 44 Years | 2,141 (73.1%) | 210 (9.8%) |
| 45 to 54 Years | 1,943 (65.5%) | 229 (11.8%) |
| 55 to 59 Years | 1,089 (68.2%) | 20 (1.8%) |
| 60 to 64 Years | 672 (46.2%) | 22 (3.3%) |
| 65 to 74 Years | 424 (18.7%) | 0 (0.0%) |
| 75 Years and over | 100 (4.7%) | 0 (0.0%) |
| Total | 11,041 (55.9%) | 938 (8.5%) |
Employment Status by Educational Attainment in Zanesville
According to labor force statistics for Zanesville, 69.2% of individuals (8,787) out of the total population between 25 and 64 years of age (12,698) are in the labor force, with 8.3% or 729 of them being unemployed. The group with the highest labor force participation rate are those with the educational attainment of bachelor's degree or higher, with 86.3% or 1,380 individuals in the labor force. Within the labor force, individuals with less than high school education have the highest percentage of unemployment, with 18.8% or 149 of them being unemployed.
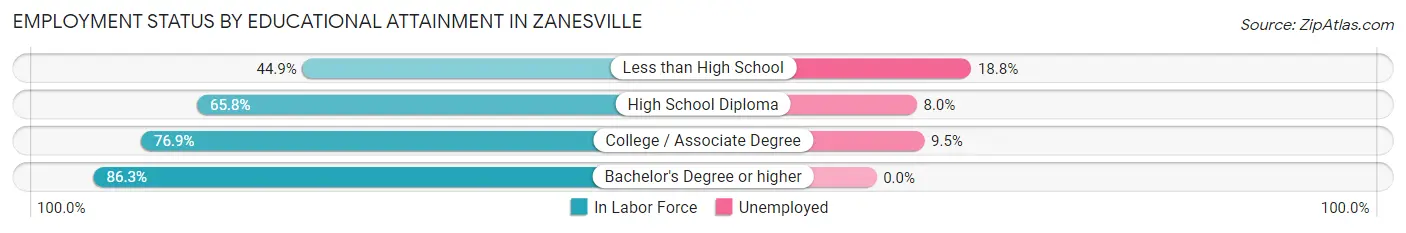
| Educational Attainment | In Labor Force | Unemployed |
| Less than High School | 792 (44.9%) | 332 (18.8%) |
| High School Diploma | 3,317 (65.8%) | 403 (8.0%) |
| College / Associate Degree | 3,302 (76.9%) | 408 (9.5%) |
| Bachelor's Degree or higher | 1,380 (86.3%) | 0 (0.0%) |
| Total | 8,787 (69.2%) | 1,054 (8.3%) |
Employment Occupations by Sex in Zanesville
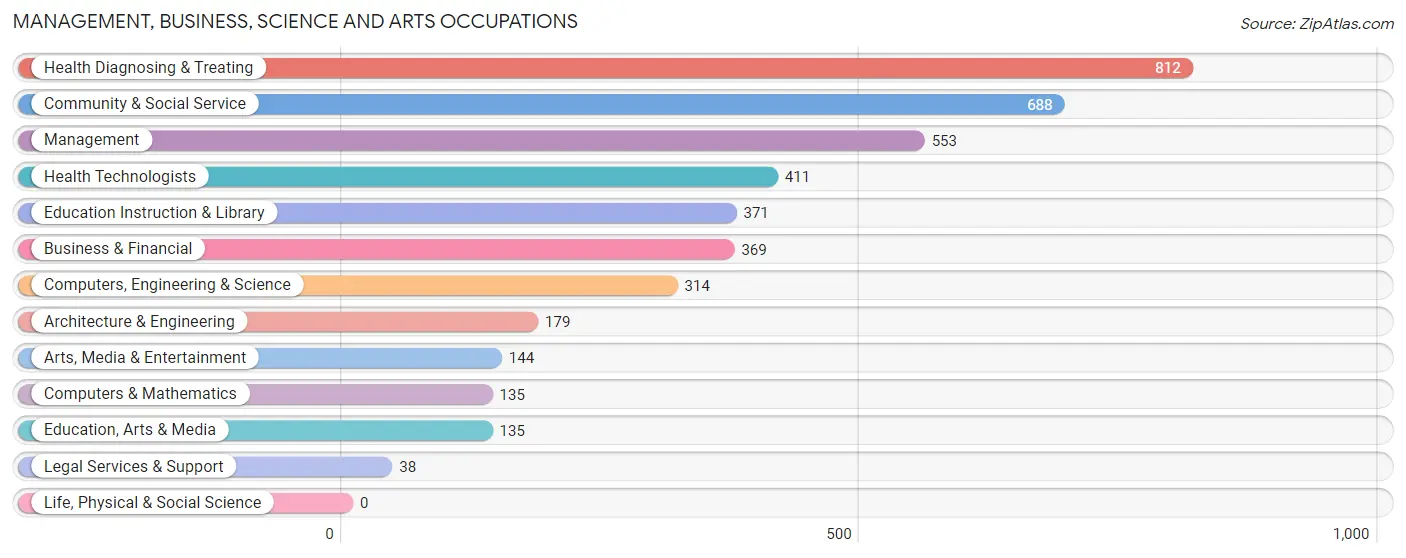
Management, Business, Science and Arts Occupations
The most common Management, Business, Science and Arts occupations in Zanesville are Health Diagnosing & Treating (812 | 8.1%), Community & Social Service (688 | 6.8%), Management (553 | 5.5%), Health Technologists (411 | 4.1%), and Education Instruction & Library (371 | 3.7%).
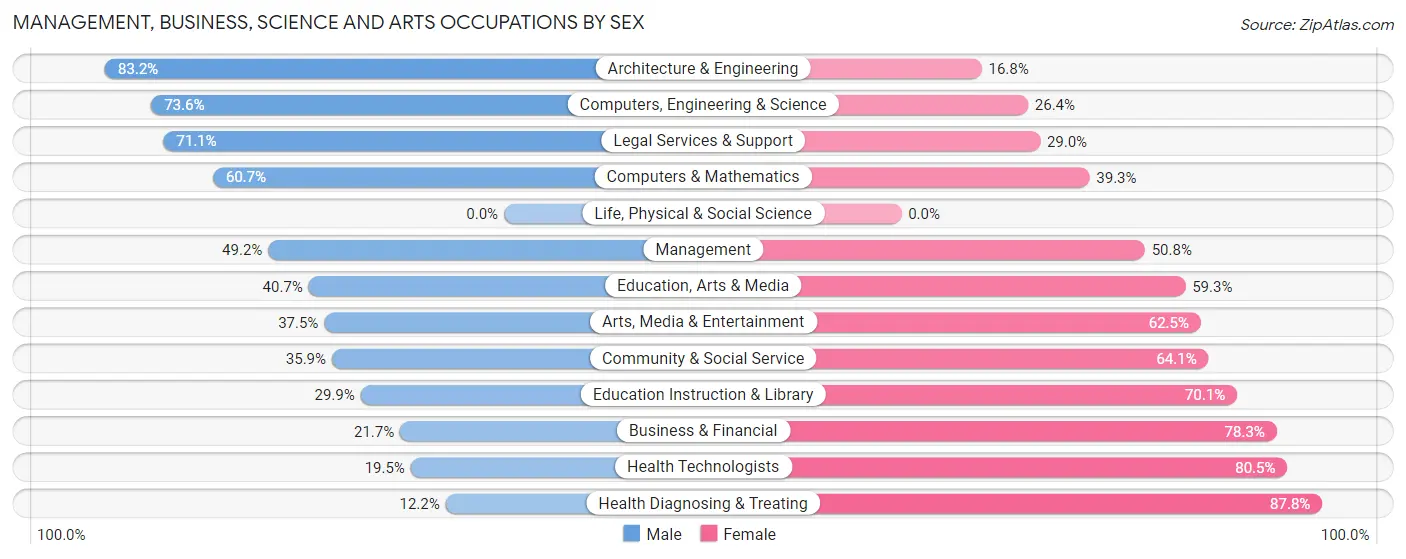
Management, Business, Science and Arts Occupations by Sex
Within the Management, Business, Science and Arts occupations in Zanesville, the most male-oriented occupations are Architecture & Engineering (83.2%), Computers, Engineering & Science (73.6%), and Legal Services & Support (71.1%), while the most female-oriented occupations are Health Diagnosing & Treating (87.8%), Health Technologists (80.5%), and Business & Financial (78.3%).
| Occupation | Male | Female |
| Management | 272 (49.2%) | 281 (50.8%) |
| Business & Financial | 80 (21.7%) | 289 (78.3%) |
| Computers, Engineering & Science | 231 (73.6%) | 83 (26.4%) |
| Computers & Mathematics | 82 (60.7%) | 53 (39.3%) |
| Architecture & Engineering | 149 (83.2%) | 30 (16.8%) |
| Life, Physical & Social Science | 0 (0.0%) | 0 (0.0%) |
| Community & Social Service | 247 (35.9%) | 441 (64.1%) |
| Education, Arts & Media | 55 (40.7%) | 80 (59.3%) |
| Legal Services & Support | 27 (71.1%) | 11 (28.9%) |
| Education Instruction & Library | 111 (29.9%) | 260 (70.1%) |
| Arts, Media & Entertainment | 54 (37.5%) | 90 (62.5%) |
| Health Diagnosing & Treating | 99 (12.2%) | 713 (87.8%) |
| Health Technologists | 80 (19.5%) | 331 (80.5%) |
| Total (Category) | 929 (34.0%) | 1,807 (66.0%) |
| Total (Overall) | 4,988 (49.5%) | 5,087 (50.5%) |
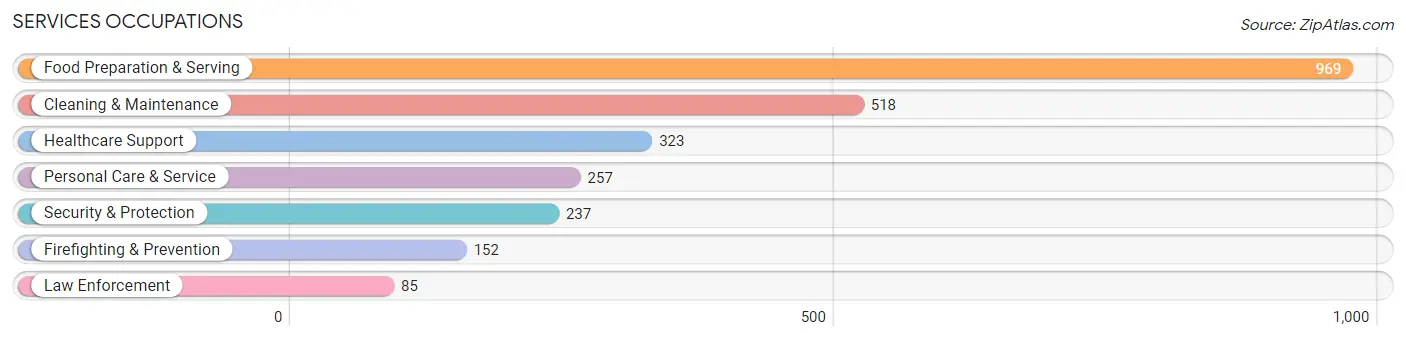
Services Occupations
The most common Services occupations in Zanesville are Food Preparation & Serving (969 | 9.6%), Cleaning & Maintenance (518 | 5.1%), Healthcare Support (323 | 3.2%), Personal Care & Service (257 | 2.5%), and Security & Protection (237 | 2.4%).
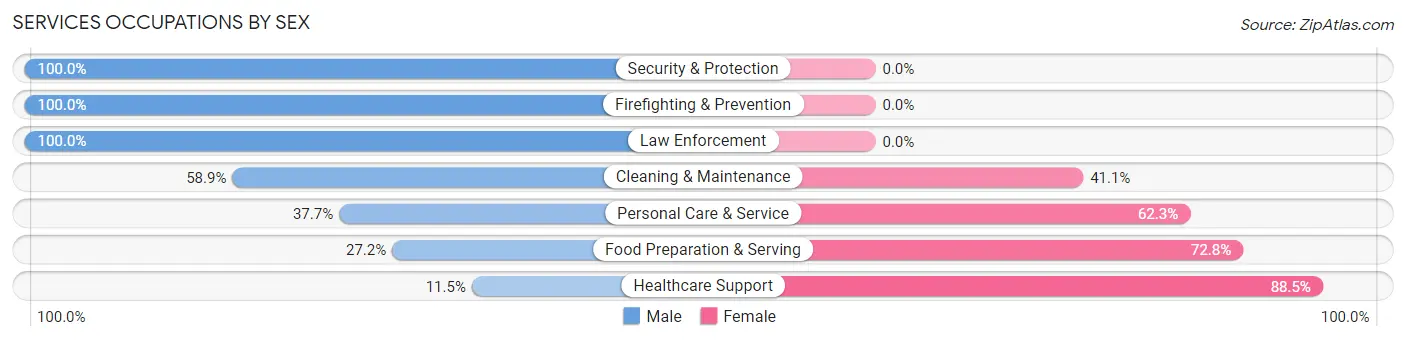
Services Occupations by Sex
Within the Services occupations in Zanesville, the most male-oriented occupations are Security & Protection (100.0%), Firefighting & Prevention (100.0%), and Law Enforcement (100.0%), while the most female-oriented occupations are Healthcare Support (88.5%), Food Preparation & Serving (72.8%), and Personal Care & Service (62.3%).
| Occupation | Male | Female |
| Healthcare Support | 37 (11.5%) | 286 (88.5%) |
| Security & Protection | 237 (100.0%) | 0 (0.0%) |
| Firefighting & Prevention | 152 (100.0%) | 0 (0.0%) |
| Law Enforcement | 85 (100.0%) | 0 (0.0%) |
| Food Preparation & Serving | 264 (27.2%) | 705 (72.8%) |
| Cleaning & Maintenance | 305 (58.9%) | 213 (41.1%) |
| Personal Care & Service | 97 (37.7%) | 160 (62.3%) |
| Total (Category) | 940 (40.8%) | 1,364 (59.2%) |
| Total (Overall) | 4,988 (49.5%) | 5,087 (50.5%) |
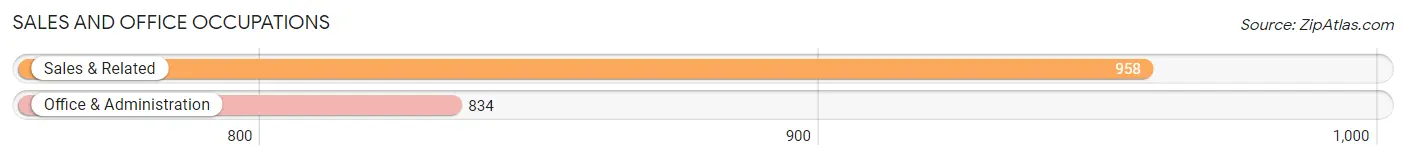
Sales and Office Occupations
The most common Sales and Office occupations in Zanesville are Sales & Related (958 | 9.5%), and Office & Administration (834 | 8.3%).
Sales and Office Occupations by Sex
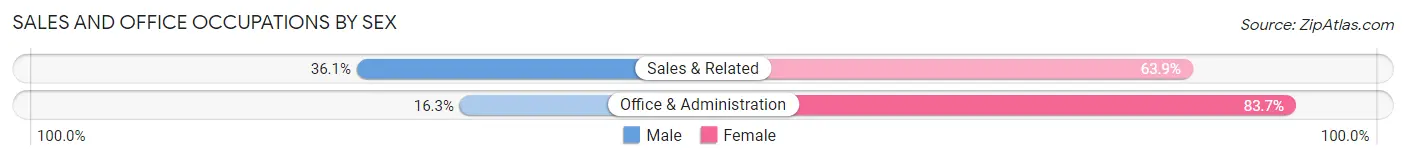
| Occupation | Male | Female |
| Sales & Related | 346 (36.1%) | 612 (63.9%) |
| Office & Administration | 136 (16.3%) | 698 (83.7%) |
| Total (Category) | 482 (26.9%) | 1,310 (73.1%) |
| Total (Overall) | 4,988 (49.5%) | 5,087 (50.5%) |
Natural Resources, Construction and Maintenance Occupations
The most common Natural Resources, Construction and Maintenance occupations in Zanesville are Construction & Extraction (819 | 8.1%), Installation, Maintenance & Repair (343 | 3.4%), and Farming, Fishing & Forestry (10 | 0.1%).

Natural Resources, Construction and Maintenance Occupations by Sex

| Occupation | Male | Female |
| Farming, Fishing & Forestry | 10 (100.0%) | 0 (0.0%) |
| Construction & Extraction | 775 (94.6%) | 44 (5.4%) |
| Installation, Maintenance & Repair | 343 (100.0%) | 0 (0.0%) |
| Total (Category) | 1,128 (96.3%) | 44 (3.7%) |
| Total (Overall) | 4,988 (49.5%) | 5,087 (50.5%) |
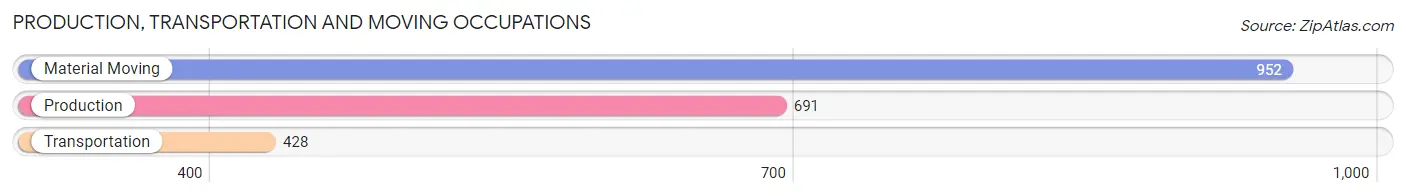
Production, Transportation and Moving Occupations
The most common Production, Transportation and Moving occupations in Zanesville are Material Moving (952 | 9.5%), Production (691 | 6.9%), and Transportation (428 | 4.3%).
Production, Transportation and Moving Occupations by Sex
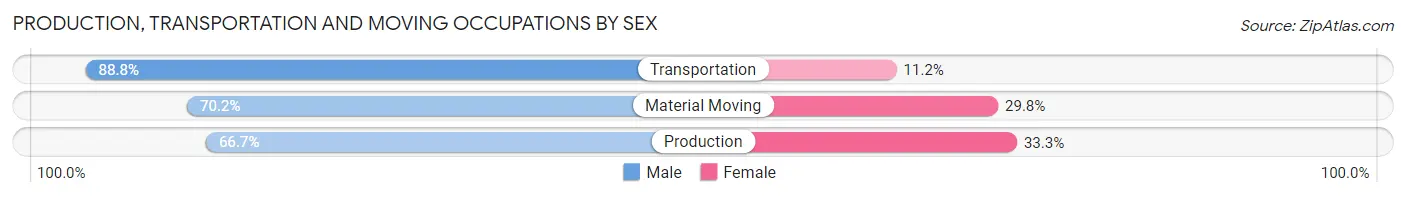
| Occupation | Male | Female |
| Production | 461 (66.7%) | 230 (33.3%) |
| Transportation | 380 (88.8%) | 48 (11.2%) |
| Material Moving | 668 (70.2%) | 284 (29.8%) |
| Total (Category) | 1,509 (72.9%) | 562 (27.1%) |
| Total (Overall) | 4,988 (49.5%) | 5,087 (50.5%) |
Employment Industries by Sex in Zanesville
Employment Industries in Zanesville
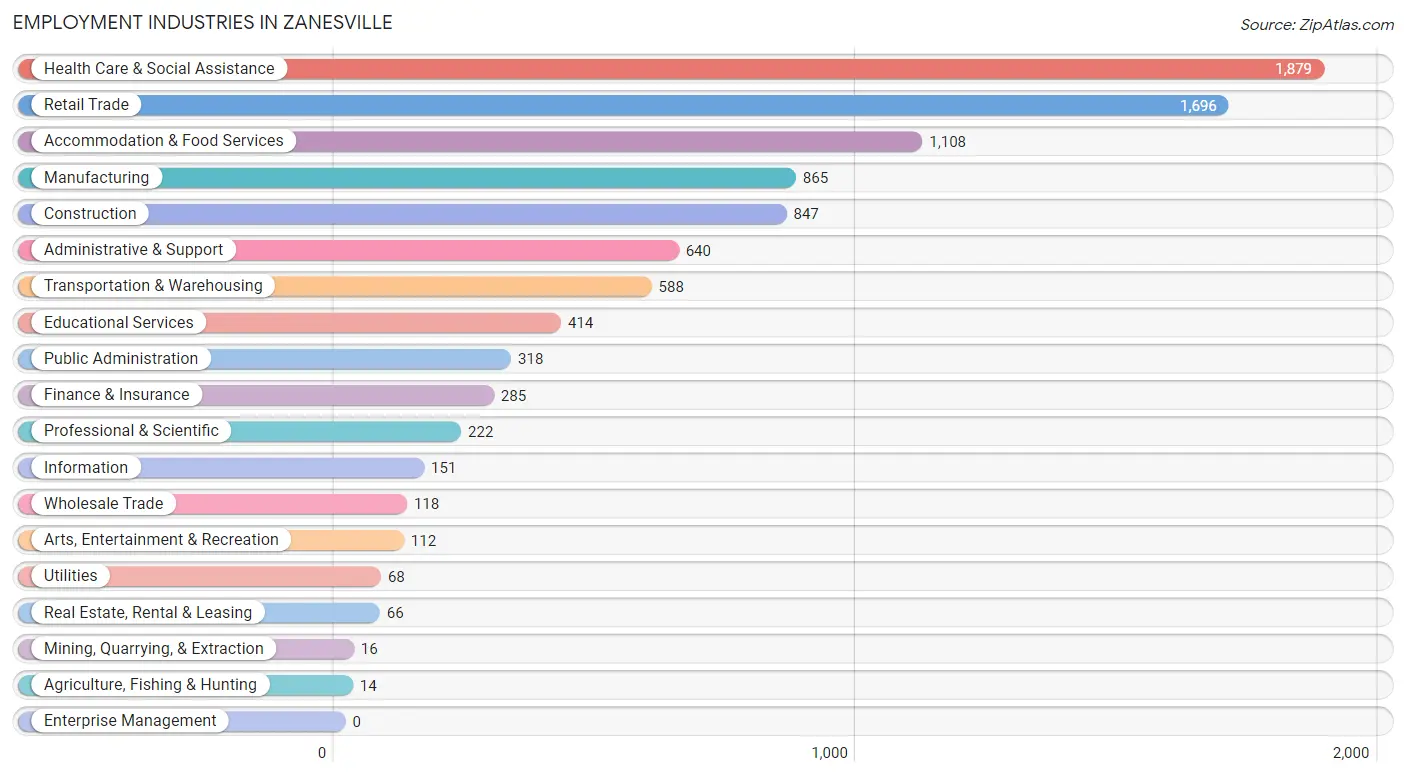
The major employment industries in Zanesville include Health Care & Social Assistance (1,879 | 18.6%), Retail Trade (1,696 | 16.8%), Accommodation & Food Services (1,108 | 11.0%), Manufacturing (865 | 8.6%), and Construction (847 | 8.4%).
Employment Industries by Sex in Zanesville
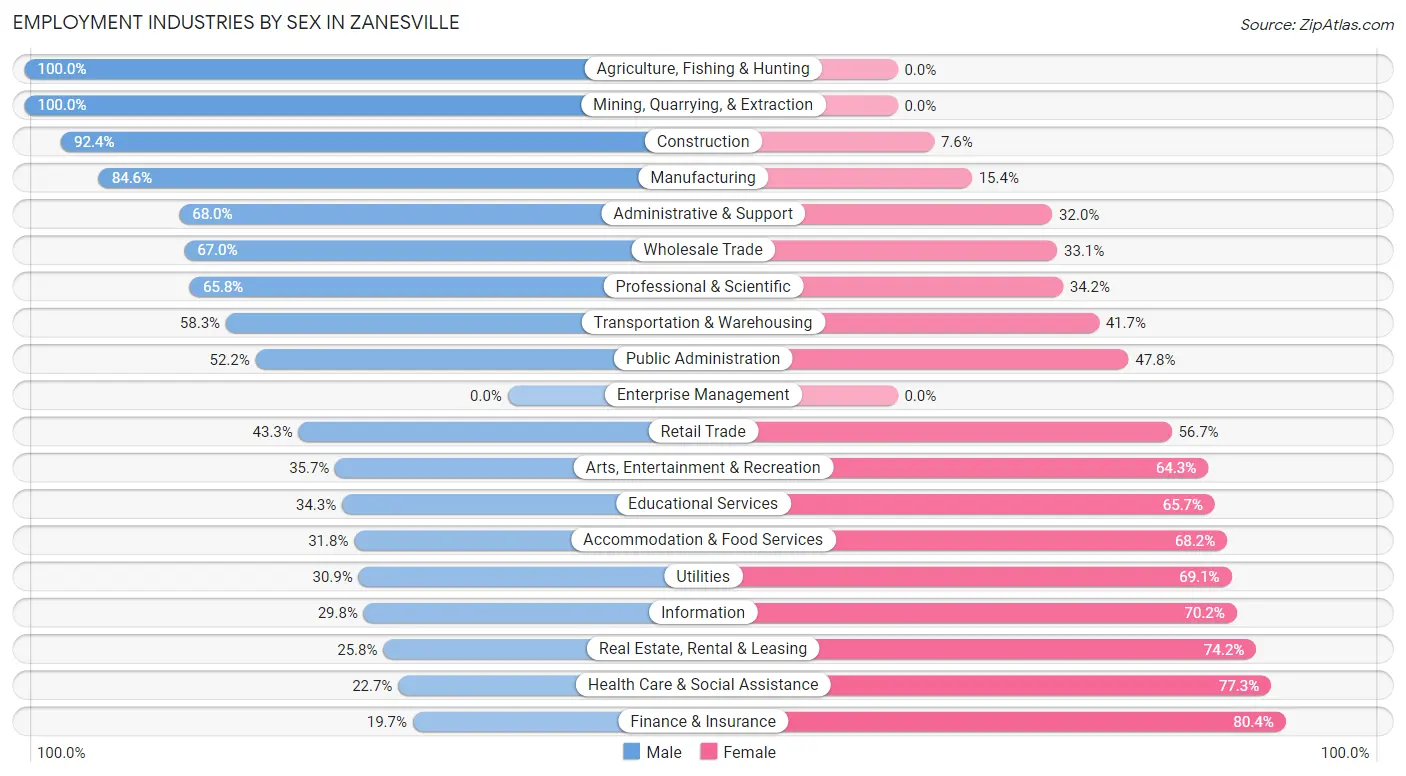
The Zanesville industries that see more men than women are Agriculture, Fishing & Hunting (100.0%), Mining, Quarrying, & Extraction (100.0%), and Construction (92.4%), whereas the industries that tend to have a higher number of women are Finance & Insurance (80.3%), Health Care & Social Assistance (77.3%), and Real Estate, Rental & Leasing (74.2%).
| Industry | Male | Female |
| Agriculture, Fishing & Hunting | 14 (100.0%) | 0 (0.0%) |
| Mining, Quarrying, & Extraction | 16 (100.0%) | 0 (0.0%) |
| Construction | 783 (92.4%) | 64 (7.6%) |
| Manufacturing | 732 (84.6%) | 133 (15.4%) |
| Wholesale Trade | 79 (66.9%) | 39 (33.1%) |
| Retail Trade | 734 (43.3%) | 962 (56.7%) |
| Transportation & Warehousing | 343 (58.3%) | 245 (41.7%) |
| Utilities | 21 (30.9%) | 47 (69.1%) |
| Information | 45 (29.8%) | 106 (70.2%) |
| Finance & Insurance | 56 (19.7%) | 229 (80.3%) |
| Real Estate, Rental & Leasing | 17 (25.8%) | 49 (74.2%) |
| Professional & Scientific | 146 (65.8%) | 76 (34.2%) |
| Enterprise Management | 0 (0.0%) | 0 (0.0%) |
| Administrative & Support | 435 (68.0%) | 205 (32.0%) |
| Educational Services | 142 (34.3%) | 272 (65.7%) |
| Health Care & Social Assistance | 426 (22.7%) | 1,453 (77.3%) |
| Arts, Entertainment & Recreation | 40 (35.7%) | 72 (64.3%) |
| Accommodation & Food Services | 352 (31.8%) | 756 (68.2%) |
| Public Administration | 166 (52.2%) | 152 (47.8%) |
| Total | 4,988 (49.5%) | 5,087 (50.5%) |
Education in Zanesville
School Enrollment in Zanesville
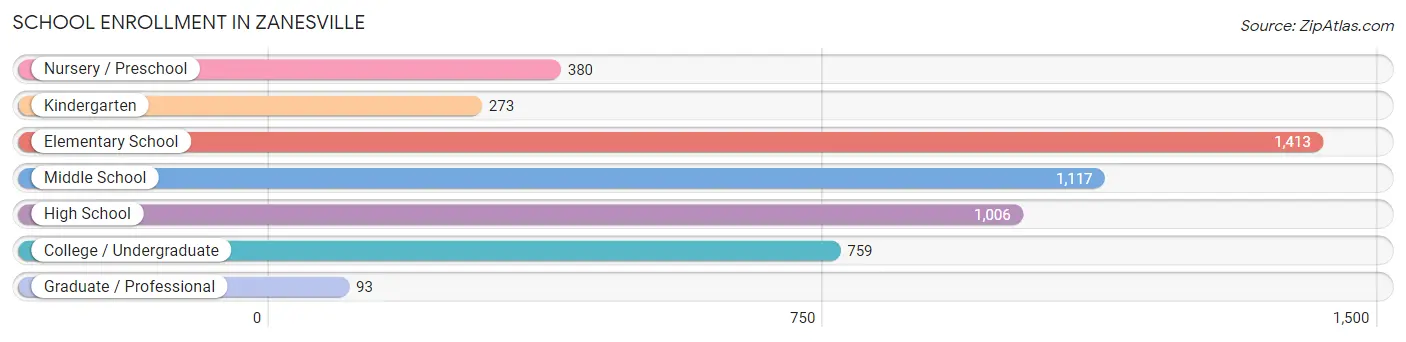
The most common levels of schooling among the 5,041 students in Zanesville are elementary school (1,413 | 28.0%), middle school (1,117 | 22.2%), and high school (1,006 | 20.0%).
| School Level | # Students | % Students |
| Nursery / Preschool | 380 | 7.5% |
| Kindergarten | 273 | 5.4% |
| Elementary School | 1,413 | 28.0% |
| Middle School | 1,117 | 22.2% |
| High School | 1,006 | 20.0% |
| College / Undergraduate | 759 | 15.1% |
| Graduate / Professional | 93 | 1.8% |
| Total | 5,041 | 100.0% |
School Enrollment by Age by Funding Source in Zanesville
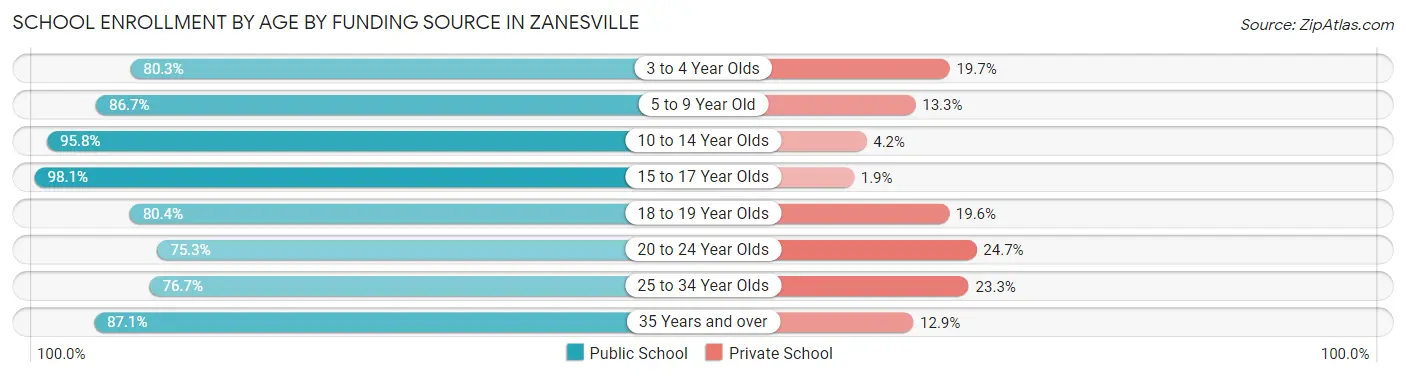
Out of a total of 5,041 students who are enrolled in schools in Zanesville, 539 (10.7%) attend a private institution, while the remaining 4,502 (89.3%) are enrolled in public schools. The age group of 20 to 24 year olds has the highest likelihood of being enrolled in private schools, with 88 (24.7% in the age bracket) enrolled. Conversely, the age group of 15 to 17 year olds has the lowest likelihood of being enrolled in a private school, with 782 (98.1% in the age bracket) attending a public institution.
| Age Bracket | Public School | Private School |
| 3 to 4 Year Olds | 167 (80.3%) | 41 (19.7%) |
| 5 to 9 Year Old | 1,436 (86.7%) | 221 (13.3%) |
| 10 to 14 Year Olds | 1,389 (95.8%) | 61 (4.2%) |
| 15 to 17 Year Olds | 782 (98.1%) | 15 (1.9%) |
| 18 to 19 Year Olds | 156 (80.4%) | 38 (19.6%) |
| 20 to 24 Year Olds | 268 (75.3%) | 88 (24.7%) |
| 25 to 34 Year Olds | 178 (76.7%) | 54 (23.3%) |
| 35 Years and over | 128 (87.1%) | 19 (12.9%) |
| Total | 4,502 (89.3%) | 539 (10.7%) |
Educational Attainment by Field of Study in Zanesville
Business (544 | 22.8%), education (449 | 18.8%), science & technology (333 | 14.0%), visual & performing arts (201 | 8.4%), and engineering (186 | 7.8%) are the most common fields of study among 2,386 individuals in Zanesville who have obtained a bachelor's degree or higher.
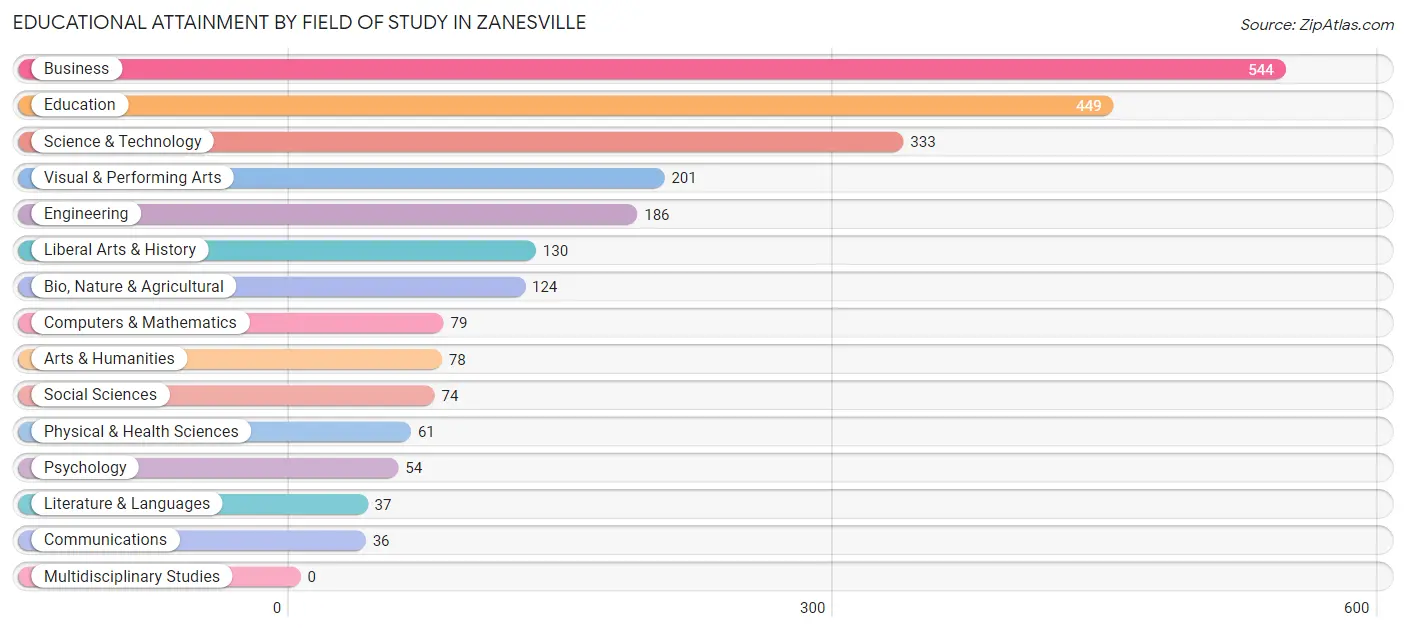
| Field of Study | # Graduates | % Graduates |
| Computers & Mathematics | 79 | 3.3% |
| Bio, Nature & Agricultural | 124 | 5.2% |
| Physical & Health Sciences | 61 | 2.6% |
| Psychology | 54 | 2.3% |
| Social Sciences | 74 | 3.1% |
| Engineering | 186 | 7.8% |
| Multidisciplinary Studies | 0 | 0.0% |
| Science & Technology | 333 | 14.0% |
| Business | 544 | 22.8% |
| Education | 449 | 18.8% |
| Literature & Languages | 37 | 1.5% |
| Liberal Arts & History | 130 | 5.4% |
| Visual & Performing Arts | 201 | 8.4% |
| Communications | 36 | 1.5% |
| Arts & Humanities | 78 | 3.3% |
| Total | 2,386 | 100.0% |
Transportation & Commute in Zanesville
Vehicle Availability by Sex in Zanesville
The most prevalent vehicle ownership categories in Zanesville are males with 2 vehicles (2,300, accounting for 46.7%) and females with 2 vehicles (2,018, making up 46.0%).
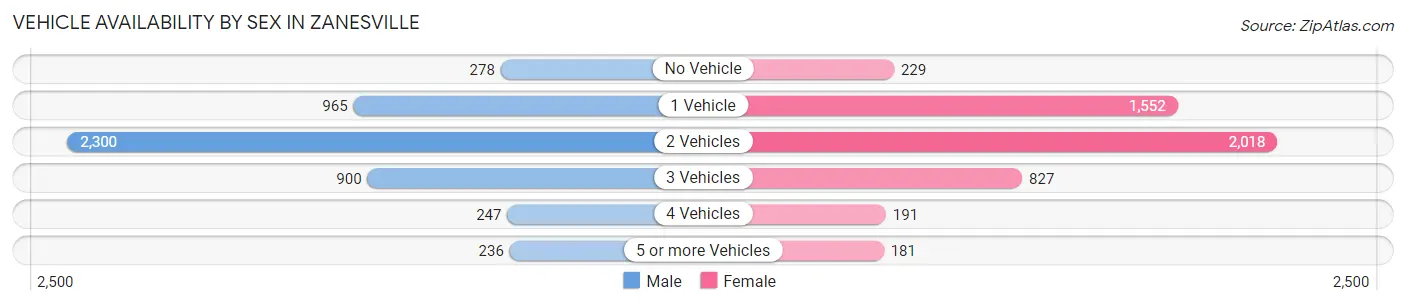
| Vehicles Available | Male | Female |
| No Vehicle | 278 (5.6%) | 229 (4.6%) |
| 1 Vehicle | 965 (19.6%) | 1,552 (31.0%) |
| 2 Vehicles | 2,300 (46.7%) | 2,018 (40.4%) |
| 3 Vehicles | 900 (18.3%) | 827 (16.6%) |
| 4 Vehicles | 247 (5.0%) | 191 (3.8%) |
| 5 or more Vehicles | 236 (4.8%) | 181 (3.6%) |
| Total | 4,926 (100.0%) | 4,998 (100.0%) |
Commute Time in Zanesville
The most frequently occuring commute durations in Zanesville are 10 to 14 minutes (2,489 commuters, 26.4%), 5 to 9 minutes (1,647 commuters, 17.4%), and 15 to 19 minutes (1,377 commuters, 14.6%).
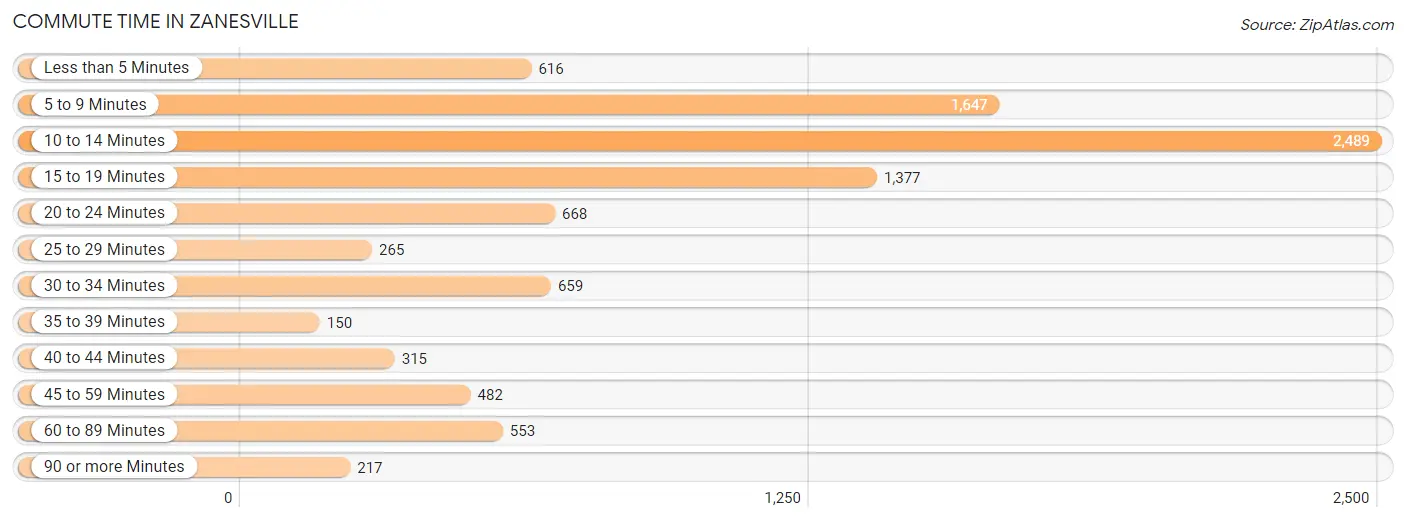
| Commute Time | # Commuters | % Commuters |
| Less than 5 Minutes | 616 | 6.5% |
| 5 to 9 Minutes | 1,647 | 17.4% |
| 10 to 14 Minutes | 2,489 | 26.4% |
| 15 to 19 Minutes | 1,377 | 14.6% |
| 20 to 24 Minutes | 668 | 7.1% |
| 25 to 29 Minutes | 265 | 2.8% |
| 30 to 34 Minutes | 659 | 7.0% |
| 35 to 39 Minutes | 150 | 1.6% |
| 40 to 44 Minutes | 315 | 3.3% |
| 45 to 59 Minutes | 482 | 5.1% |
| 60 to 89 Minutes | 553 | 5.9% |
| 90 or more Minutes | 217 | 2.3% |
Commute Time by Sex in Zanesville
The most common commute times in Zanesville are 10 to 14 minutes (1,068 commuters, 22.3%) for males and 10 to 14 minutes (1,421 commuters, 30.5%) for females.
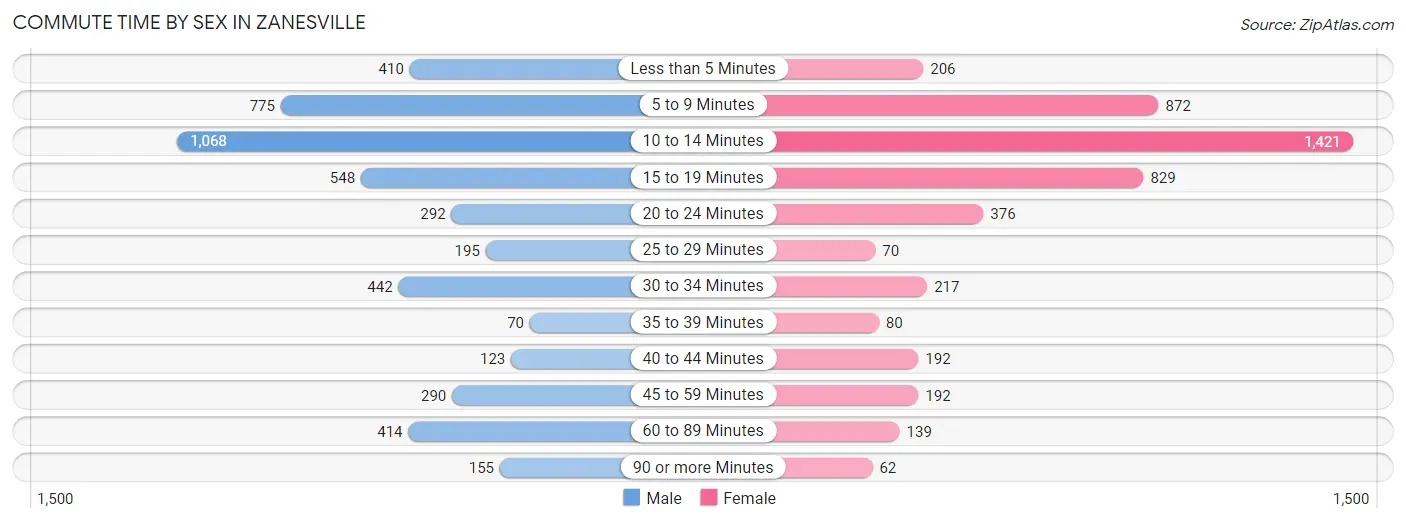
| Commute Time | Male | Female |
| Less than 5 Minutes | 410 (8.6%) | 206 (4.4%) |
| 5 to 9 Minutes | 775 (16.2%) | 872 (18.7%) |
| 10 to 14 Minutes | 1,068 (22.3%) | 1,421 (30.5%) |
| 15 to 19 Minutes | 548 (11.5%) | 829 (17.8%) |
| 20 to 24 Minutes | 292 (6.1%) | 376 (8.1%) |
| 25 to 29 Minutes | 195 (4.1%) | 70 (1.5%) |
| 30 to 34 Minutes | 442 (9.2%) | 217 (4.7%) |
| 35 to 39 Minutes | 70 (1.5%) | 80 (1.7%) |
| 40 to 44 Minutes | 123 (2.6%) | 192 (4.1%) |
| 45 to 59 Minutes | 290 (6.1%) | 192 (4.1%) |
| 60 to 89 Minutes | 414 (8.7%) | 139 (3.0%) |
| 90 or more Minutes | 155 (3.2%) | 62 (1.3%) |
Time of Departure to Work by Sex in Zanesville
The most frequent times of departure to work in Zanesville are 7:30 AM to 7:59 AM (639, 13.4%) for males and 7:00 AM to 7:29 AM (554, 11.9%) for females.
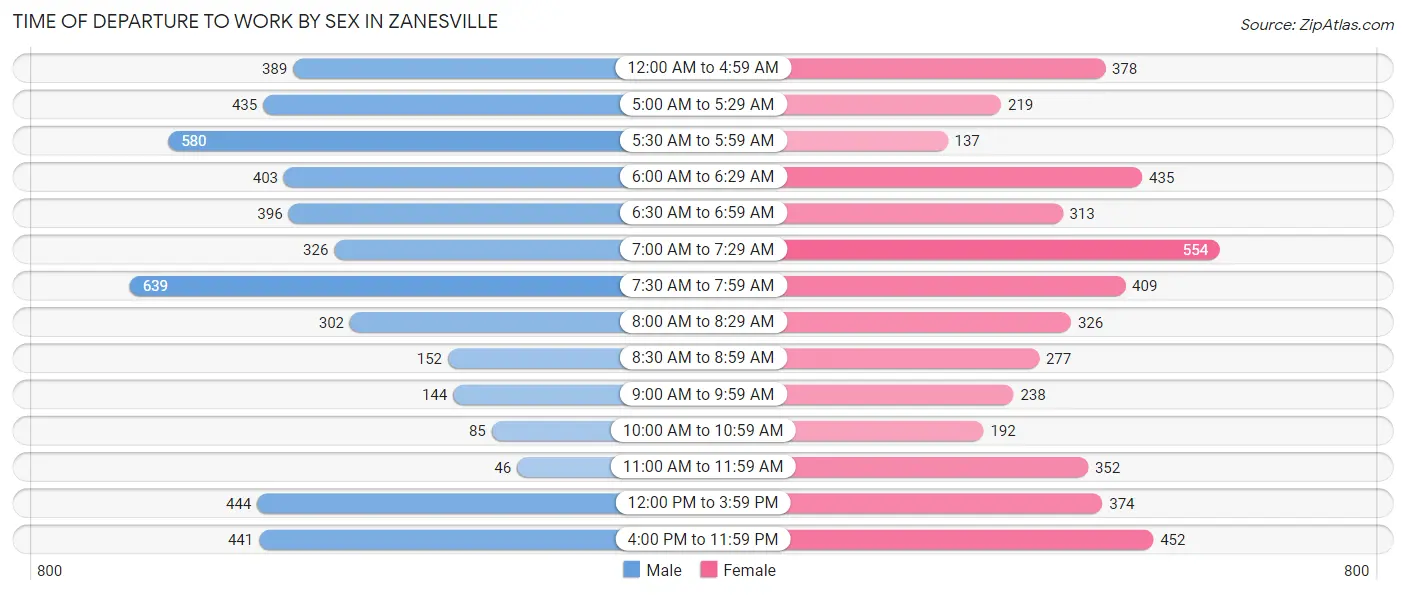
| Time of Departure | Male | Female |
| 12:00 AM to 4:59 AM | 389 (8.1%) | 378 (8.1%) |
| 5:00 AM to 5:29 AM | 435 (9.1%) | 219 (4.7%) |
| 5:30 AM to 5:59 AM | 580 (12.1%) | 137 (2.9%) |
| 6:00 AM to 6:29 AM | 403 (8.4%) | 435 (9.3%) |
| 6:30 AM to 6:59 AM | 396 (8.3%) | 313 (6.7%) |
| 7:00 AM to 7:29 AM | 326 (6.8%) | 554 (11.9%) |
| 7:30 AM to 7:59 AM | 639 (13.4%) | 409 (8.8%) |
| 8:00 AM to 8:29 AM | 302 (6.3%) | 326 (7.0%) |
| 8:30 AM to 8:59 AM | 152 (3.2%) | 277 (5.9%) |
| 9:00 AM to 9:59 AM | 144 (3.0%) | 238 (5.1%) |
| 10:00 AM to 10:59 AM | 85 (1.8%) | 192 (4.1%) |
| 11:00 AM to 11:59 AM | 46 (1.0%) | 352 (7.6%) |
| 12:00 PM to 3:59 PM | 444 (9.3%) | 374 (8.0%) |
| 4:00 PM to 11:59 PM | 441 (9.2%) | 452 (9.7%) |
| Total | 4,782 (100.0%) | 4,656 (100.0%) |
Housing Occupancy in Zanesville
Occupancy by Ownership in Zanesville
Of the total 10,662 dwellings in Zanesville, owner-occupied units account for 4,493 (42.1%), while renter-occupied units make up 6,169 (57.9%).
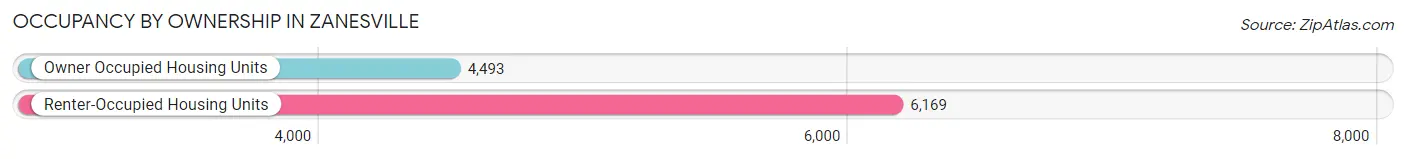
| Occupancy | # Housing Units | % Housing Units |
| Owner Occupied Housing Units | 4,493 | 42.1% |
| Renter-Occupied Housing Units | 6,169 | 57.9% |
| Total Occupied Housing Units | 10,662 | 100.0% |
Occupancy by Household Size in Zanesville
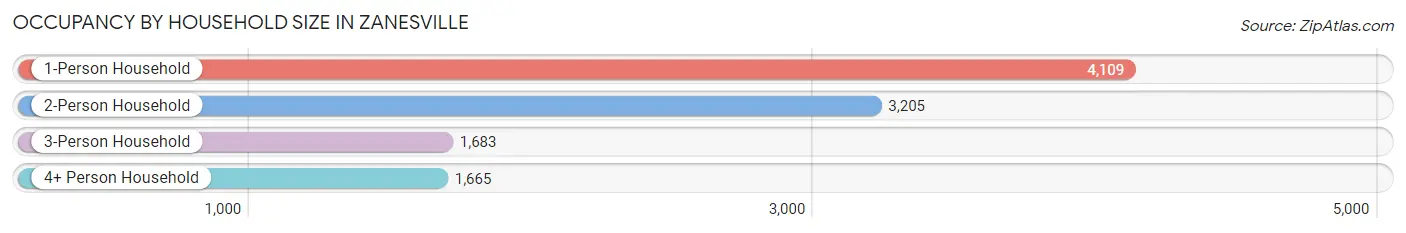
| Household Size | # Housing Units | % Housing Units |
| 1-Person Household | 4,109 | 38.5% |
| 2-Person Household | 3,205 | 30.1% |
| 3-Person Household | 1,683 | 15.8% |
| 4+ Person Household | 1,665 | 15.6% |
| Total Housing Units | 10,662 | 100.0% |
Occupancy by Ownership by Household Size in Zanesville
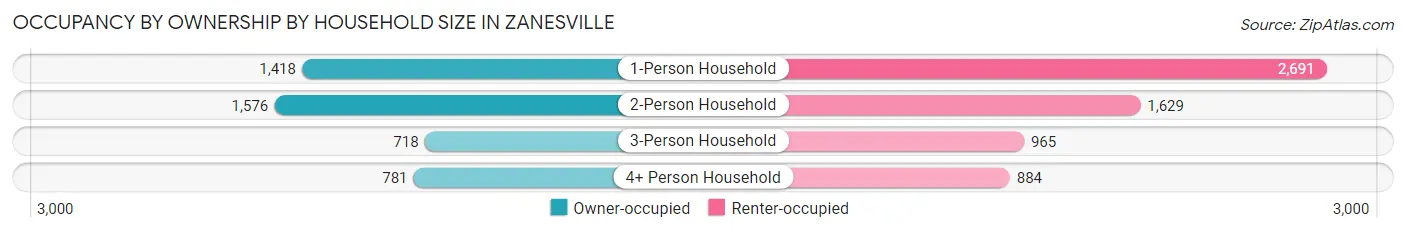
| Household Size | Owner-occupied | Renter-occupied |
| 1-Person Household | 1,418 (34.5%) | 2,691 (65.5%) |
| 2-Person Household | 1,576 (49.2%) | 1,629 (50.8%) |
| 3-Person Household | 718 (42.7%) | 965 (57.3%) |
| 4+ Person Household | 781 (46.9%) | 884 (53.1%) |
| Total Housing Units | 4,493 (42.1%) | 6,169 (57.9%) |
Occupancy by Educational Attainment in Zanesville
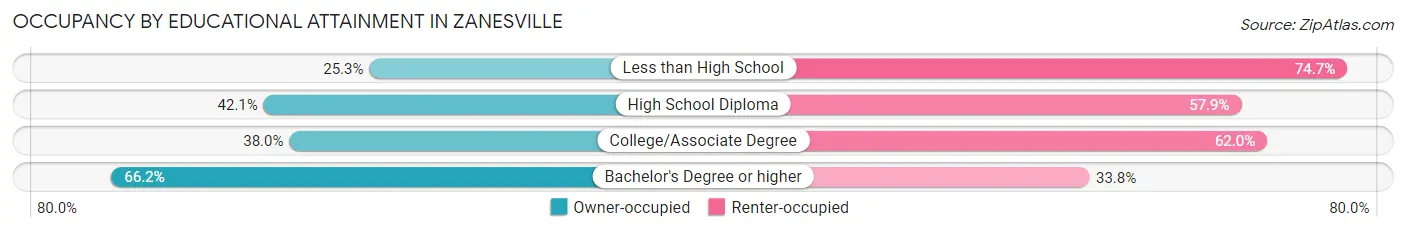
| Household Size | Owner-occupied | Renter-occupied |
| Less than High School | 330 (25.3%) | 973 (74.7%) |
| High School Diploma | 1,751 (42.1%) | 2,409 (57.9%) |
| College/Associate Degree | 1,390 (38.0%) | 2,266 (62.0%) |
| Bachelor's Degree or higher | 1,022 (66.2%) | 521 (33.8%) |
Occupancy by Age of Householder in Zanesville
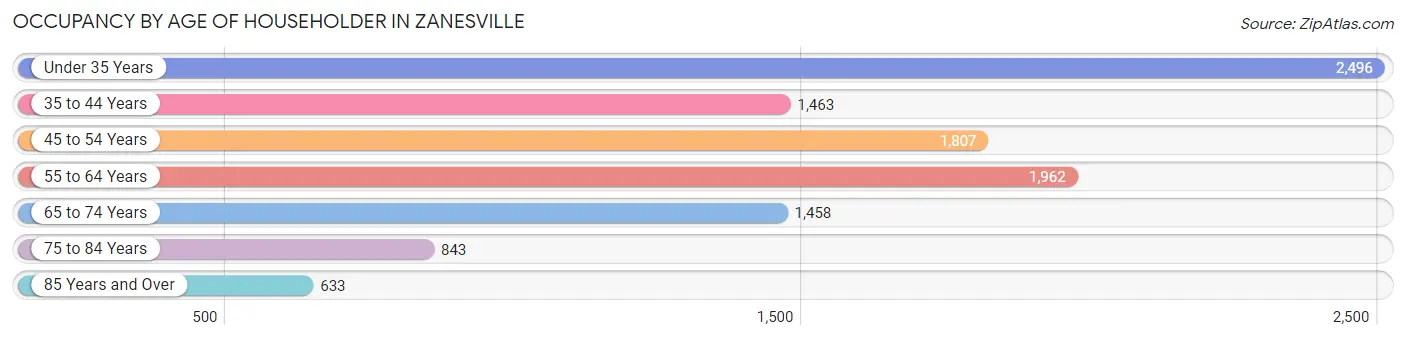
| Age Bracket | # Households | % Households |
| Under 35 Years | 2,496 | 23.4% |
| 35 to 44 Years | 1,463 | 13.7% |
| 45 to 54 Years | 1,807 | 17.0% |
| 55 to 64 Years | 1,962 | 18.4% |
| 65 to 74 Years | 1,458 | 13.7% |
| 75 to 84 Years | 843 | 7.9% |
| 85 Years and Over | 633 | 5.9% |
| Total | 10,662 | 100.0% |
Housing Finances in Zanesville
Median Income by Occupancy in Zanesville
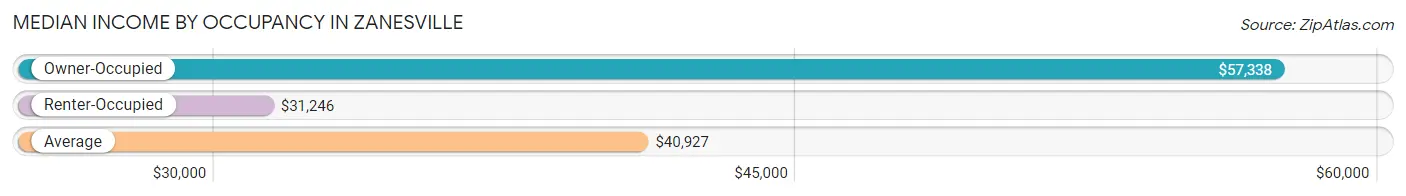
| Occupancy Type | # Households | Median Income |
| Owner-Occupied | 4,493 (42.1%) | $57,338 |
| Renter-Occupied | 6,169 (57.9%) | $31,246 |
| Average | 10,662 (100.0%) | $40,927 |
Occupancy by Householder Income Bracket in Zanesville
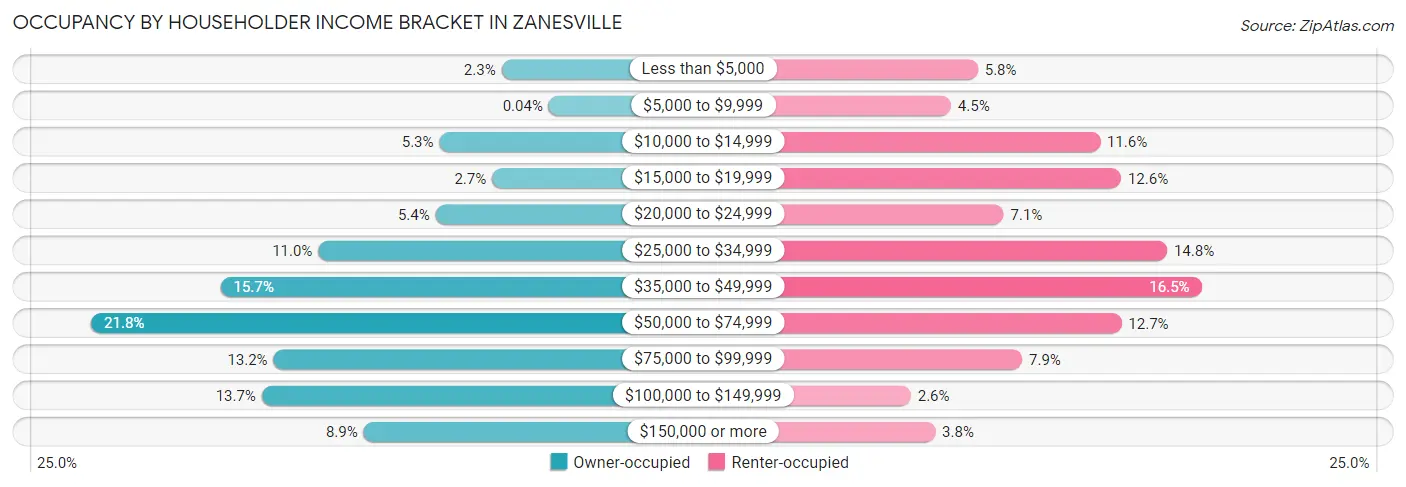
| Income Bracket | Owner-occupied | Renter-occupied |
| Less than $5,000 | 103 (2.3%) | 359 (5.8%) |
| $5,000 to $9,999 | 2 (0.0%) | 280 (4.5%) |
| $10,000 to $14,999 | 236 (5.2%) | 718 (11.6%) |
| $15,000 to $19,999 | 123 (2.7%) | 780 (12.6%) |
| $20,000 to $24,999 | 244 (5.4%) | 435 (7.0%) |
| $25,000 to $34,999 | 495 (11.0%) | 915 (14.8%) |
| $35,000 to $49,999 | 704 (15.7%) | 1,016 (16.5%) |
| $50,000 to $74,999 | 981 (21.8%) | 781 (12.7%) |
| $75,000 to $99,999 | 591 (13.2%) | 489 (7.9%) |
| $100,000 to $149,999 | 616 (13.7%) | 162 (2.6%) |
| $150,000 or more | 398 (8.9%) | 234 (3.8%) |
| Total | 4,493 (100.0%) | 6,169 (100.0%) |
Monthly Housing Cost Tiers in Zanesville
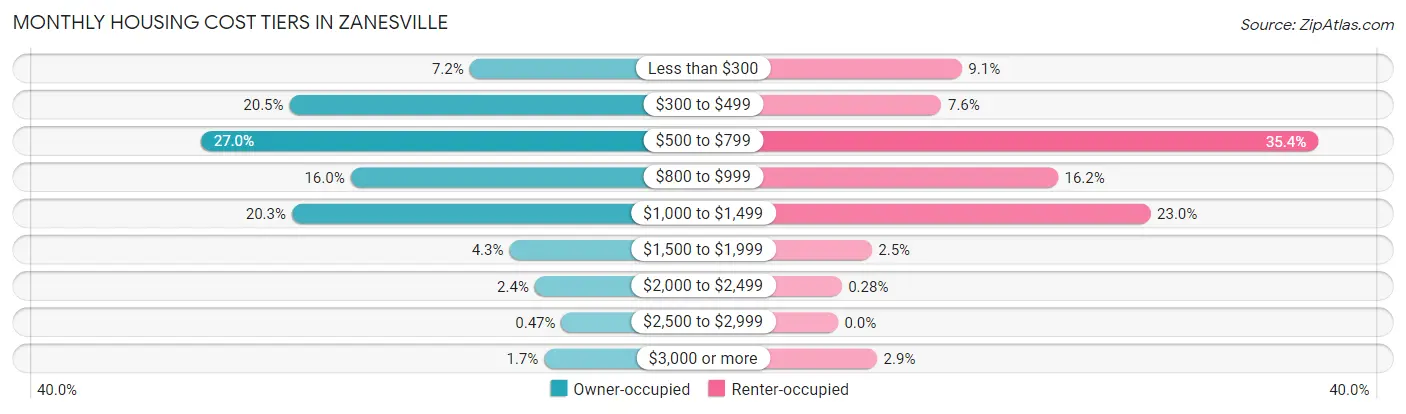
| Monthly Cost | Owner-occupied | Renter-occupied |
| Less than $300 | 325 (7.2%) | 563 (9.1%) |
| $300 to $499 | 921 (20.5%) | 471 (7.6%) |
| $500 to $799 | 1,214 (27.0%) | 2,183 (35.4%) |
| $800 to $999 | 719 (16.0%) | 1,000 (16.2%) |
| $1,000 to $1,499 | 913 (20.3%) | 1,421 (23.0%) |
| $1,500 to $1,999 | 193 (4.3%) | 154 (2.5%) |
| $2,000 to $2,499 | 109 (2.4%) | 17 (0.3%) |
| $2,500 to $2,999 | 21 (0.5%) | 0 (0.0%) |
| $3,000 or more | 78 (1.7%) | 178 (2.9%) |
| Total | 4,493 (100.0%) | 6,169 (100.0%) |
Physical Housing Characteristics in Zanesville
Housing Structures in Zanesville
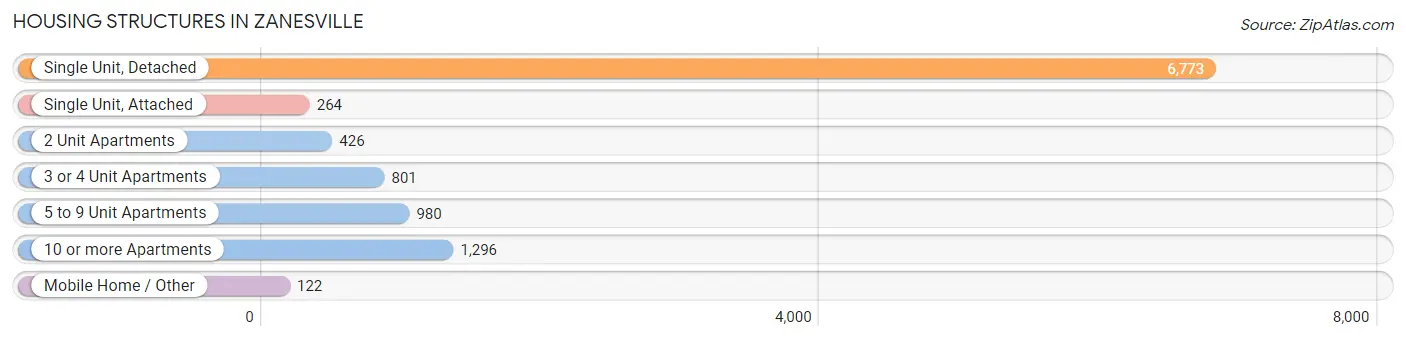
| Structure Type | # Housing Units | % Housing Units |
| Single Unit, Detached | 6,773 | 63.5% |
| Single Unit, Attached | 264 | 2.5% |
| 2 Unit Apartments | 426 | 4.0% |
| 3 or 4 Unit Apartments | 801 | 7.5% |
| 5 to 9 Unit Apartments | 980 | 9.2% |
| 10 or more Apartments | 1,296 | 12.2% |
| Mobile Home / Other | 122 | 1.1% |
| Total | 10,662 | 100.0% |
Housing Structures by Occupancy in Zanesville
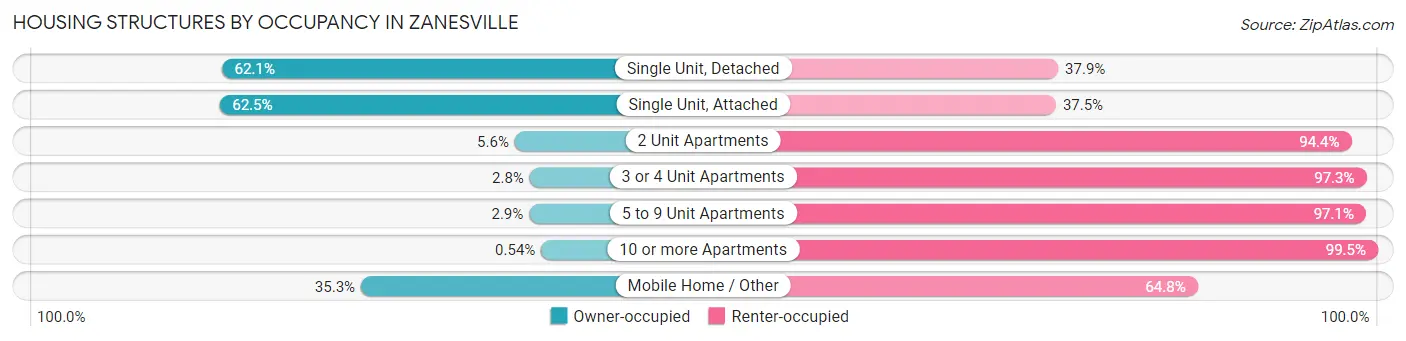
| Structure Type | Owner-occupied | Renter-occupied |
| Single Unit, Detached | 4,204 (62.1%) | 2,569 (37.9%) |
| Single Unit, Attached | 165 (62.5%) | 99 (37.5%) |
| 2 Unit Apartments | 24 (5.6%) | 402 (94.4%) |
| 3 or 4 Unit Apartments | 22 (2.8%) | 779 (97.3%) |
| 5 to 9 Unit Apartments | 28 (2.9%) | 952 (97.1%) |
| 10 or more Apartments | 7 (0.5%) | 1,289 (99.5%) |
| Mobile Home / Other | 43 (35.2%) | 79 (64.7%) |
| Total | 4,493 (42.1%) | 6,169 (57.9%) |
Housing Structures by Number of Rooms in Zanesville
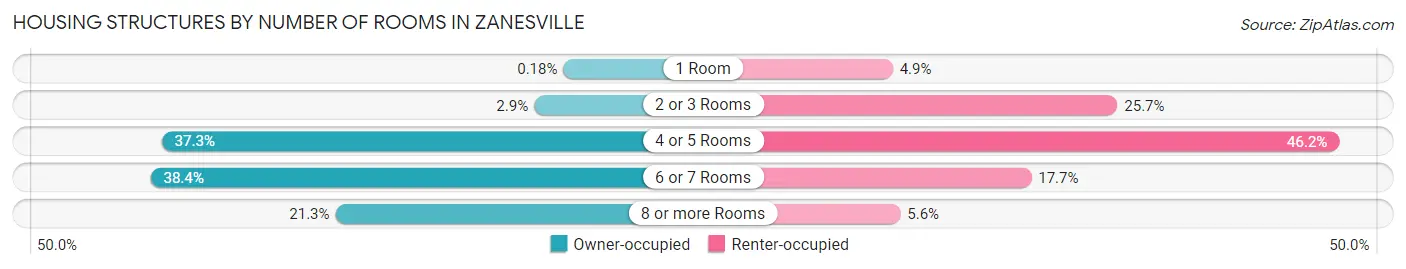
| Number of Rooms | Owner-occupied | Renter-occupied |
| 1 Room | 8 (0.2%) | 301 (4.9%) |
| 2 or 3 Rooms | 130 (2.9%) | 1,583 (25.7%) |
| 4 or 5 Rooms | 1,677 (37.3%) | 2,848 (46.2%) |
| 6 or 7 Rooms | 1,723 (38.4%) | 1,092 (17.7%) |
| 8 or more Rooms | 955 (21.3%) | 345 (5.6%) |
| Total | 4,493 (100.0%) | 6,169 (100.0%) |
Housing Structure by Heating Type in Zanesville
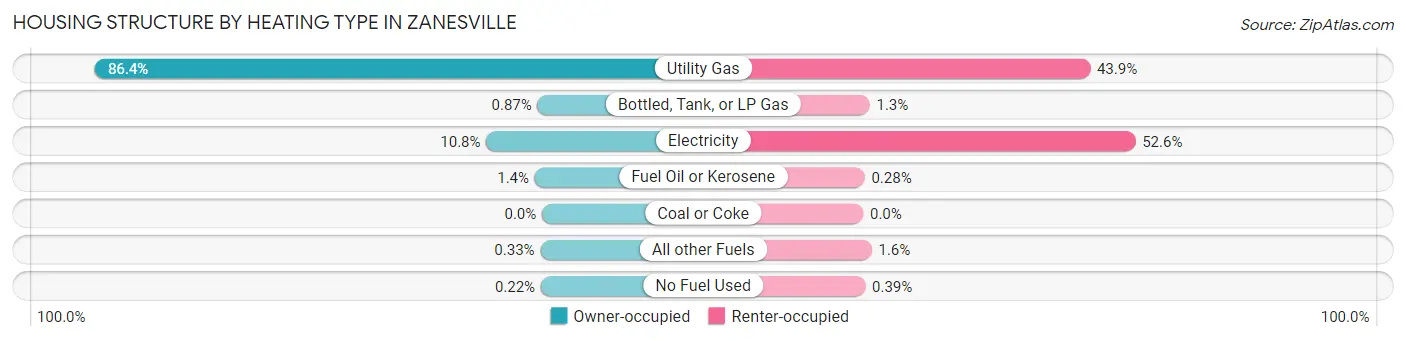
| Heating Type | Owner-occupied | Renter-occupied |
| Utility Gas | 3,882 (86.4%) | 2,705 (43.9%) |
| Bottled, Tank, or LP Gas | 39 (0.9%) | 77 (1.3%) |
| Electricity | 484 (10.8%) | 3,245 (52.6%) |
| Fuel Oil or Kerosene | 63 (1.4%) | 17 (0.3%) |
| Coal or Coke | 0 (0.0%) | 0 (0.0%) |
| All other Fuels | 15 (0.3%) | 101 (1.6%) |
| No Fuel Used | 10 (0.2%) | 24 (0.4%) |
| Total | 4,493 (100.0%) | 6,169 (100.0%) |
Household Vehicle Usage in Zanesville
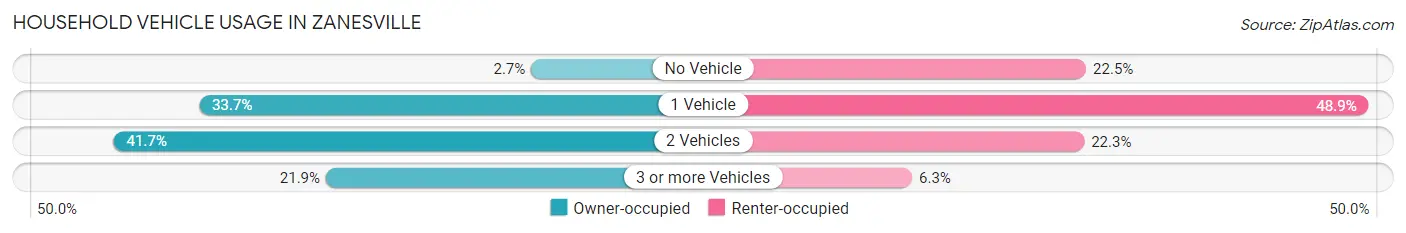
| Vehicles per Household | Owner-occupied | Renter-occupied |
| No Vehicle | 122 (2.7%) | 1,389 (22.5%) |
| 1 Vehicle | 1,515 (33.7%) | 3,015 (48.9%) |
| 2 Vehicles | 1,873 (41.7%) | 1,378 (22.3%) |
| 3 or more Vehicles | 983 (21.9%) | 387 (6.3%) |
| Total | 4,493 (100.0%) | 6,169 (100.0%) |
Real Estate & Mortgages in Zanesville
Real Estate and Mortgage Overview in Zanesville
| Characteristic | Without Mortgage | With Mortgage |
| Housing Units | 1,731 | 2,762 |
| Median Property Value | $78,200 | $112,600 |
| Median Household Income | $42,813 | $259 |
| Monthly Housing Costs | $428 | $78 |
| Real Estate Taxes | $917 | $66 |
Property Value by Mortgage Status in Zanesville
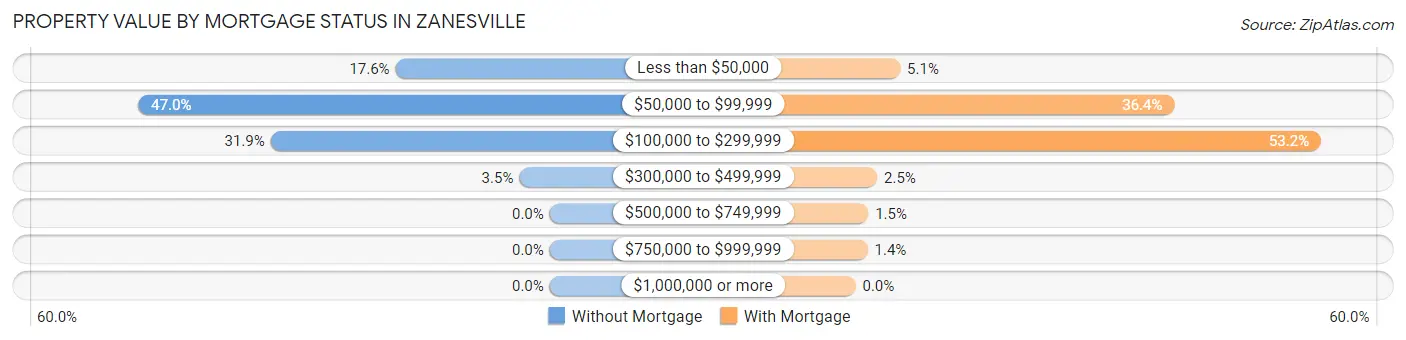
| Property Value | Without Mortgage | With Mortgage |
| Less than $50,000 | 305 (17.6%) | 141 (5.1%) |
| $50,000 to $99,999 | 814 (47.0%) | 1,006 (36.4%) |
| $100,000 to $299,999 | 552 (31.9%) | 1,469 (53.2%) |
| $300,000 to $499,999 | 60 (3.5%) | 68 (2.5%) |
| $500,000 to $749,999 | 0 (0.0%) | 40 (1.5%) |
| $750,000 to $999,999 | 0 (0.0%) | 38 (1.4%) |
| $1,000,000 or more | 0 (0.0%) | 0 (0.0%) |
| Total | 1,731 (100.0%) | 2,762 (100.0%) |
Household Income by Mortgage Status in Zanesville
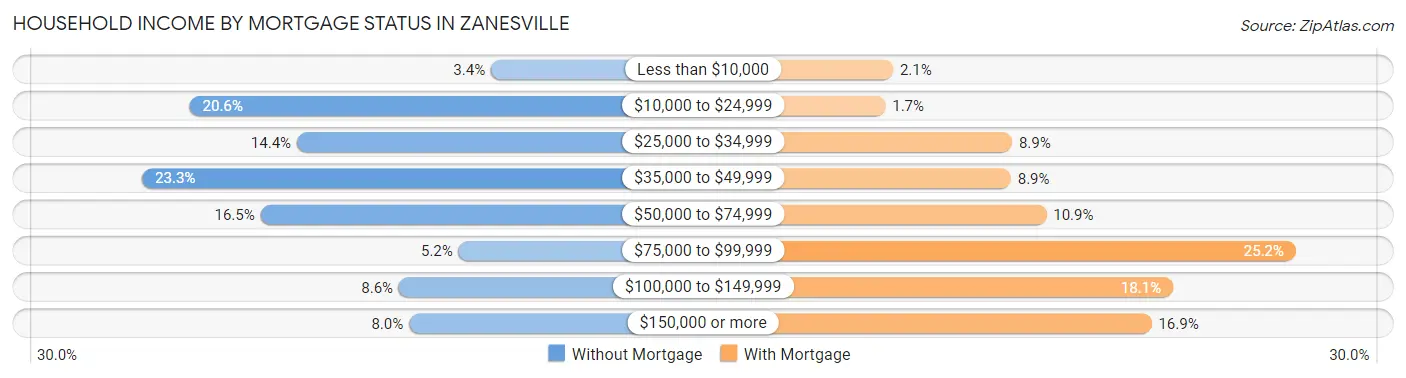
| Household Income | Without Mortgage | With Mortgage |
| Less than $10,000 | 58 (3.4%) | 59 (2.1%) |
| $10,000 to $24,999 | 356 (20.6%) | 47 (1.7%) |
| $25,000 to $34,999 | 250 (14.4%) | 247 (8.9%) |
| $35,000 to $49,999 | 403 (23.3%) | 245 (8.9%) |
| $50,000 to $74,999 | 286 (16.5%) | 301 (10.9%) |
| $75,000 to $99,999 | 90 (5.2%) | 695 (25.2%) |
| $100,000 to $149,999 | 149 (8.6%) | 501 (18.1%) |
| $150,000 or more | 139 (8.0%) | 467 (16.9%) |
| Total | 1,731 (100.0%) | 2,762 (100.0%) |
Property Value to Household Income Ratio in Zanesville
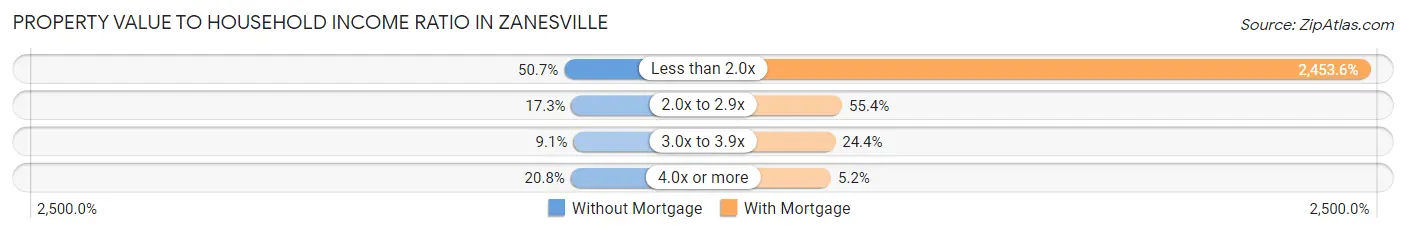
| Value-to-Income Ratio | Without Mortgage | With Mortgage |
| Less than 2.0x | 878 (50.7%) | 67,769 (2,453.6%) |
| 2.0x to 2.9x | 299 (17.3%) | 1,530 (55.4%) |
| 3.0x to 3.9x | 157 (9.1%) | 675 (24.4%) |
| 4.0x or more | 360 (20.8%) | 144 (5.2%) |
| Total | 1,731 (100.0%) | 2,762 (100.0%) |
Real Estate Taxes by Mortgage Status in Zanesville
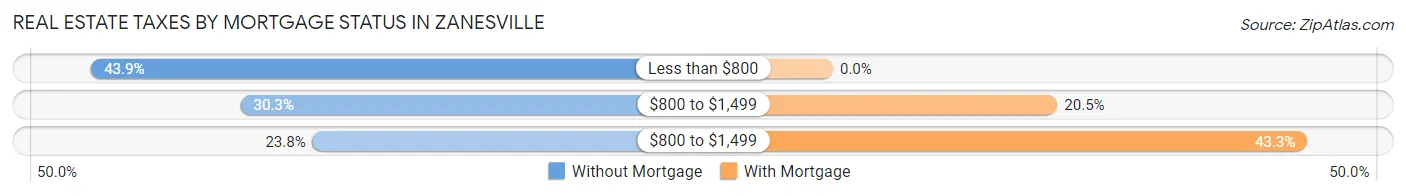
| Property Taxes | Without Mortgage | With Mortgage |
| Less than $800 | 760 (43.9%) | 0 (0.0%) |
| $800 to $1,499 | 524 (30.3%) | 566 (20.5%) |
| $800 to $1,499 | 412 (23.8%) | 1,196 (43.3%) |
| Total | 1,731 (100.0%) | 2,762 (100.0%) |
Health & Disability in Zanesville
Health Insurance Coverage by Age in Zanesville
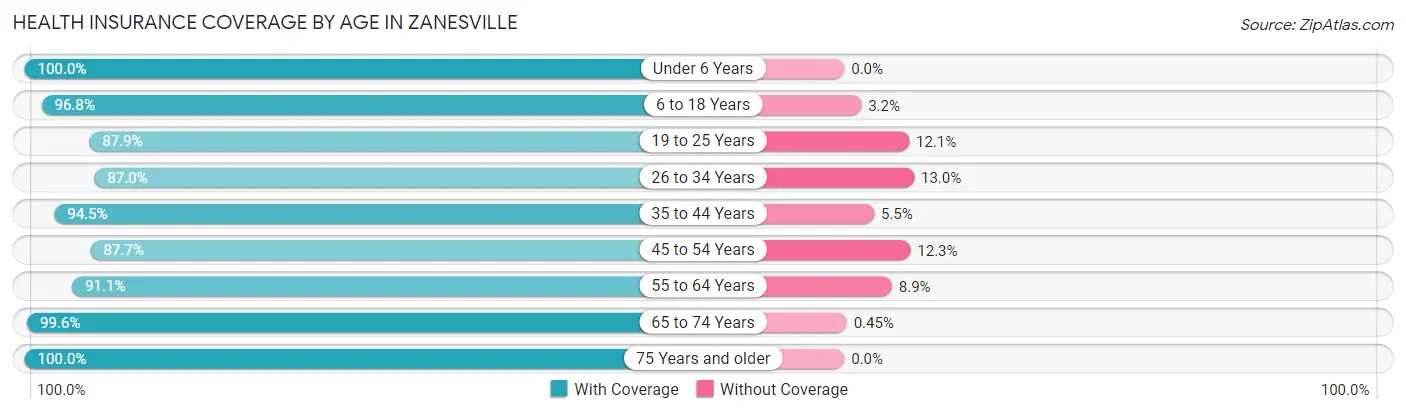
| Age Bracket | With Coverage | Without Coverage |
| Under 6 Years | 1,819 (100.0%) | 0 (0.0%) |
| 6 to 18 Years | 3,736 (96.8%) | 122 (3.2%) |
| 19 to 25 Years | 2,281 (87.9%) | 313 (12.1%) |
| 26 to 34 Years | 2,642 (87.0%) | 395 (13.0%) |
| 35 to 44 Years | 2,693 (94.5%) | 158 (5.5%) |
| 45 to 54 Years | 2,547 (87.7%) | 358 (12.3%) |
| 55 to 64 Years | 2,721 (91.1%) | 265 (8.9%) |
| 65 to 74 Years | 2,236 (99.6%) | 10 (0.4%) |
| 75 Years and older | 1,948 (100.0%) | 0 (0.0%) |
| Total | 22,623 (93.3%) | 1,621 (6.7%) |
Health Insurance Coverage by Citizenship Status in Zanesville

| Citizenship Status | With Coverage | Without Coverage |
| Native Born | 1,819 (100.0%) | 0 (0.0%) |
| Foreign Born, Citizen | 3,736 (96.8%) | 122 (3.2%) |
| Foreign Born, not a Citizen | 2,281 (87.9%) | 313 (12.1%) |
Health Insurance Coverage by Household Income in Zanesville
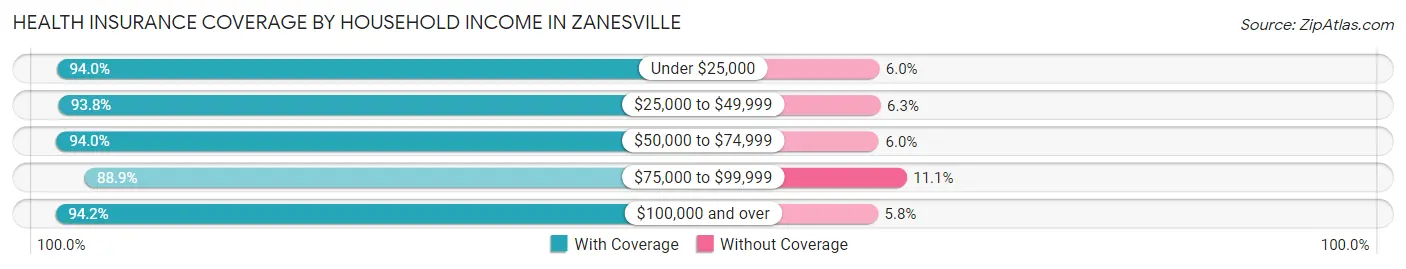
| Household Income | With Coverage | Without Coverage |
| Under $25,000 | 5,451 (94.0%) | 348 (6.0%) |
| $25,000 to $49,999 | 6,451 (93.8%) | 430 (6.2%) |
| $50,000 to $74,999 | 3,784 (94.0%) | 240 (6.0%) |
| $75,000 to $99,999 | 2,807 (88.9%) | 352 (11.1%) |
| $100,000 and over | 4,067 (94.2%) | 249 (5.8%) |
Public vs Private Health Insurance Coverage by Age in Zanesville
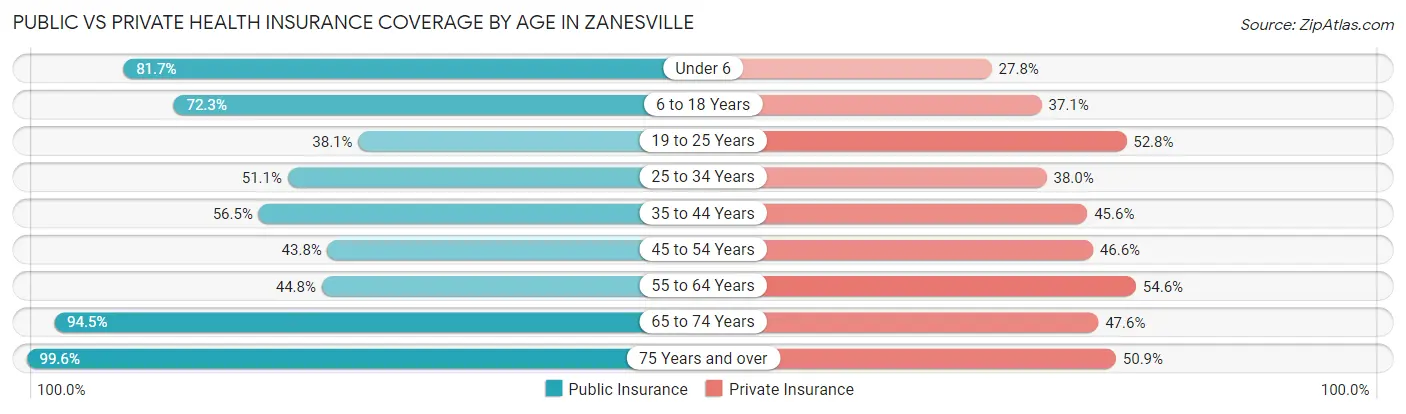
| Age Bracket | Public Insurance | Private Insurance |
| Under 6 | 1,486 (81.7%) | 506 (27.8%) |
| 6 to 18 Years | 2,791 (72.3%) | 1,431 (37.1%) |
| 19 to 25 Years | 987 (38.1%) | 1,370 (52.8%) |
| 25 to 34 Years | 1,553 (51.1%) | 1,154 (38.0%) |
| 35 to 44 Years | 1,612 (56.5%) | 1,299 (45.6%) |
| 45 to 54 Years | 1,271 (43.8%) | 1,354 (46.6%) |
| 55 to 64 Years | 1,339 (44.8%) | 1,630 (54.6%) |
| 65 to 74 Years | 2,123 (94.5%) | 1,069 (47.6%) |
| 75 Years and over | 1,941 (99.6%) | 991 (50.9%) |
| Total | 15,103 (62.3%) | 10,804 (44.6%) |
Disability Status by Sex by Age in Zanesville
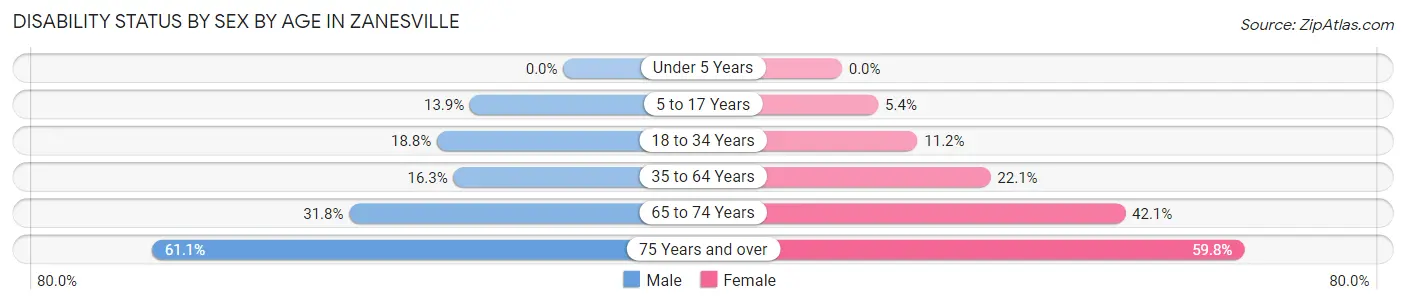
| Age Bracket | Male | Female |
| Under 5 Years | 0 (0.0%) | 0 (0.0%) |
| 5 to 17 Years | 287 (13.9%) | 103 (5.4%) |
| 18 to 34 Years | 548 (18.8%) | 332 (11.2%) |
| 35 to 64 Years | 671 (16.3%) | 1,021 (22.1%) |
| 65 to 74 Years | 303 (31.8%) | 544 (42.1%) |
| 75 Years and over | 366 (61.1%) | 806 (59.8%) |
Disability Class by Sex by Age in Zanesville
Disability Class: Hearing Difficulty
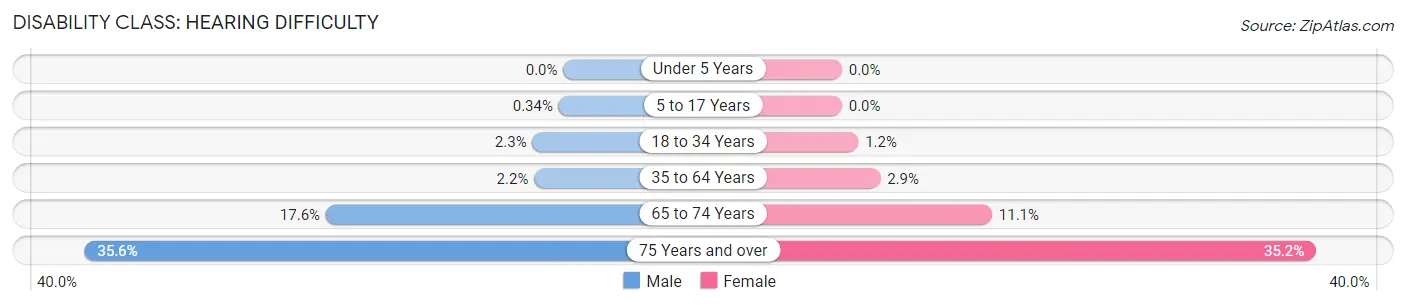
| Age Bracket | Male | Female |
| Under 5 Years | 0 (0.0%) | 0 (0.0%) |
| 5 to 17 Years | 7 (0.3%) | 0 (0.0%) |
| 18 to 34 Years | 67 (2.3%) | 36 (1.2%) |
| 35 to 64 Years | 89 (2.2%) | 132 (2.9%) |
| 65 to 74 Years | 168 (17.6%) | 144 (11.1%) |
| 75 Years and over | 213 (35.6%) | 475 (35.2%) |
Disability Class: Vision Difficulty
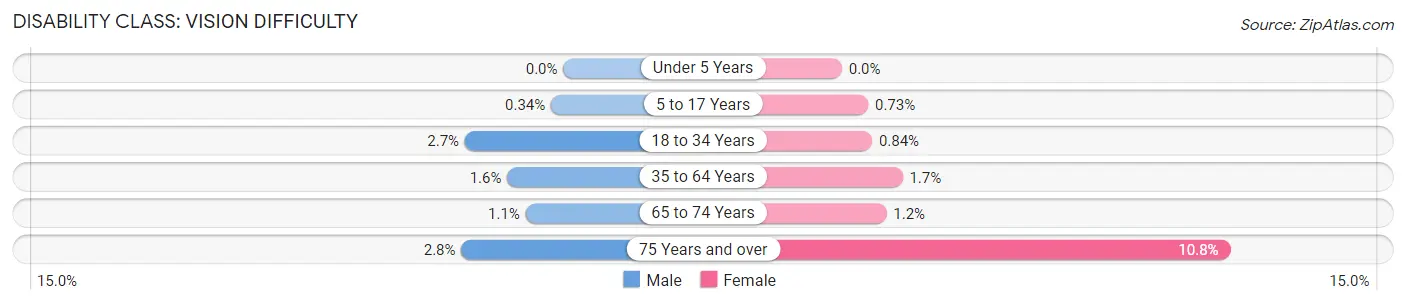
| Age Bracket | Male | Female |
| Under 5 Years | 0 (0.0%) | 0 (0.0%) |
| 5 to 17 Years | 7 (0.3%) | 14 (0.7%) |
| 18 to 34 Years | 80 (2.7%) | 25 (0.8%) |
| 35 to 64 Years | 64 (1.6%) | 78 (1.7%) |
| 65 to 74 Years | 10 (1.1%) | 16 (1.2%) |
| 75 Years and over | 17 (2.8%) | 146 (10.8%) |
Disability Class: Cognitive Difficulty
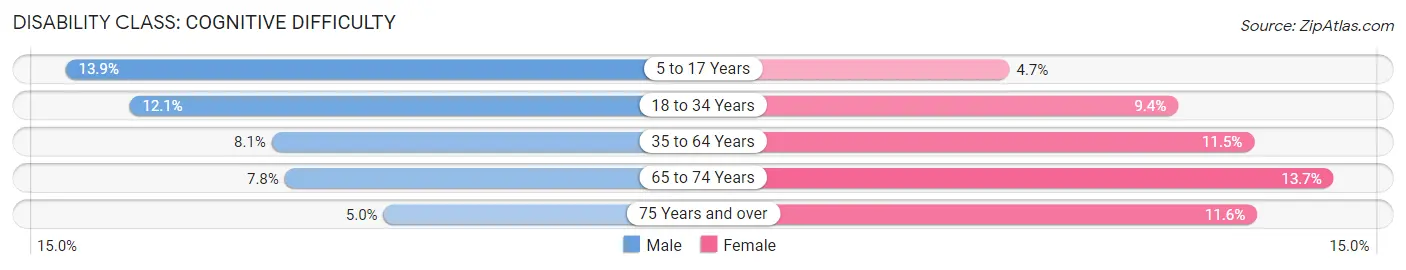
| Age Bracket | Male | Female |
| 5 to 17 Years | 287 (13.9%) | 89 (4.7%) |
| 18 to 34 Years | 353 (12.1%) | 277 (9.4%) |
| 35 to 64 Years | 334 (8.1%) | 531 (11.5%) |
| 65 to 74 Years | 74 (7.8%) | 177 (13.7%) |
| 75 Years and over | 30 (5.0%) | 156 (11.6%) |
Disability Class: Ambulatory Difficulty
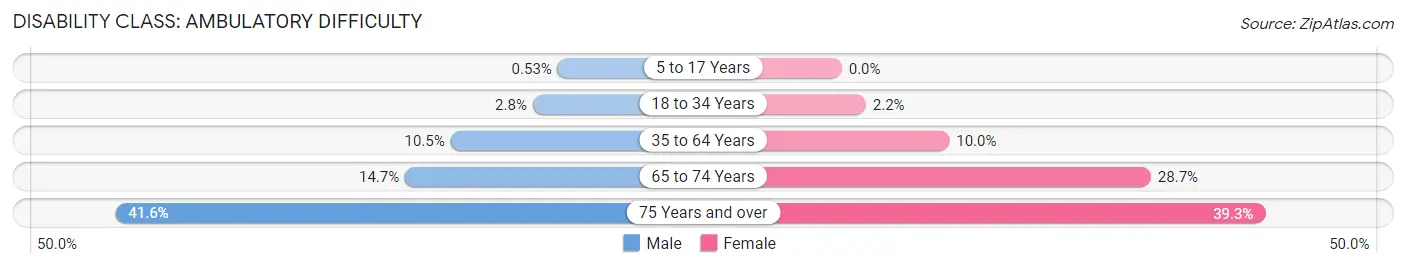
| Age Bracket | Male | Female |
| 5 to 17 Years | 11 (0.5%) | 0 (0.0%) |
| 18 to 34 Years | 83 (2.8%) | 66 (2.2%) |
| 35 to 64 Years | 431 (10.5%) | 462 (10.0%) |
| 65 to 74 Years | 140 (14.7%) | 371 (28.7%) |
| 75 Years and over | 249 (41.6%) | 530 (39.3%) |
Disability Class: Self-Care Difficulty
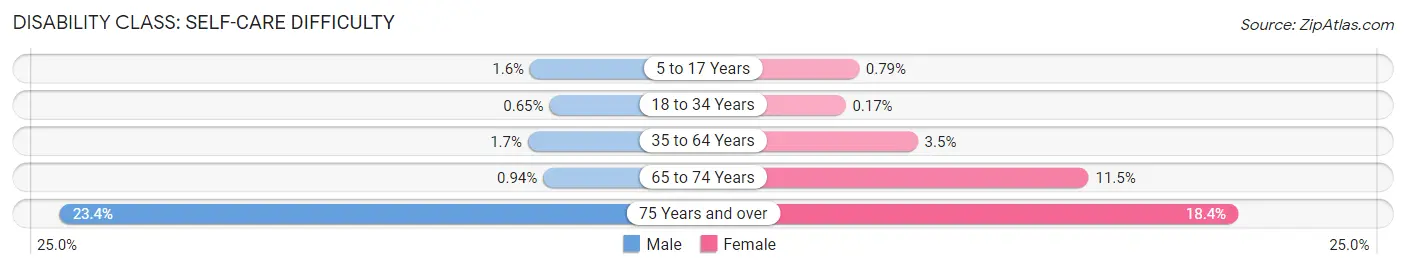
| Age Bracket | Male | Female |
| 5 to 17 Years | 32 (1.5%) | 15 (0.8%) |
| 18 to 34 Years | 19 (0.6%) | 5 (0.2%) |
| 35 to 64 Years | 68 (1.7%) | 163 (3.5%) |
| 65 to 74 Years | 9 (0.9%) | 148 (11.5%) |
| 75 Years and over | 140 (23.4%) | 248 (18.4%) |
Technology Access in Zanesville
Computing Device Access in Zanesville
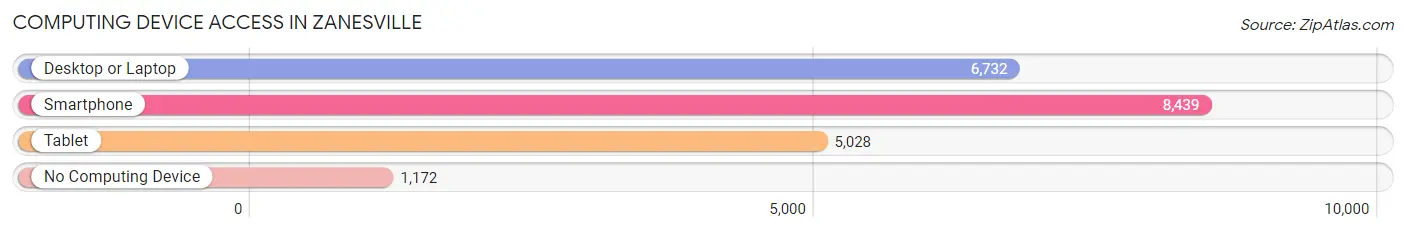
| Device Type | # Households | % Households |
| Desktop or Laptop | 6,732 | 63.1% |
| Smartphone | 8,439 | 79.1% |
| Tablet | 5,028 | 47.2% |
| No Computing Device | 1,172 | 11.0% |
| Total | 10,662 | 100.0% |
Internet Access in Zanesville
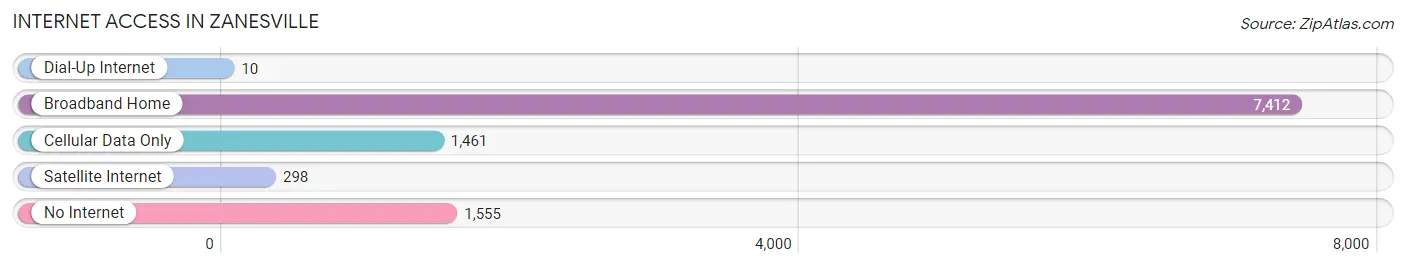
| Internet Type | # Households | % Households |
| Dial-Up Internet | 10 | 0.1% |
| Broadband Home | 7,412 | 69.5% |
| Cellular Data Only | 1,461 | 13.7% |
| Satellite Internet | 298 | 2.8% |
| No Internet | 1,555 | 14.6% |
| Total | 10,662 | 100.0% |
Zanesville Summary
Zanesville, Ohio is a city located in Muskingum County in the state of Ohio. It is located along the Muskingum River, approximately 50 miles east of Columbus. The city has a population of 25,487 as of the 2010 census, making it the largest city in Muskingum County.
History
The area that is now Zanesville was first settled in 1797 by Ebenezer Zane, who had been granted a large tract of land by the United States government. Zane named the settlement after himself and it quickly grew into a thriving community. In 1803, Zanesville was officially incorporated as a village and in 1835 it was incorporated as a city.
During the 19th century, Zanesville was an important center for manufacturing and transportation. The city was home to several factories, including a pottery factory, a glass factory, and a paper mill. The city was also an important stop on the National Road, which connected the East Coast to the Midwest.
Geography
Zanesville is located in east-central Ohio, approximately 50 miles east of Columbus. The city is situated along the Muskingum River, which flows through the city and is a major source of recreation for the area. The city is located in a hilly region of the state, with the highest point in the city being the intersection of Main Street and Putnam Avenue, which is 890 feet above sea level.
The city has a total area of 11.2 square miles, of which 11.1 square miles is land and 0.1 square miles is water. The city is located in the Appalachian Plateau region of Ohio, which is characterized by rolling hills and valleys.
Economy
Zanesville’s economy is largely based on manufacturing and services. The city is home to several factories, including a pottery factory, a glass factory, and a paper mill. The city is also home to several retail stores, restaurants, and other businesses.
The city is also home to several educational institutions, including Zane State College, Ohio University-Zanesville, and Zane Trace High School. The city is also home to several healthcare facilities, including Genesis HealthCare System and Zanesville Community Hospital.
Demographics
As of the 2010 census, the city had a population of 25,487. The racial makeup of the city was 90.2% White, 6.2% African American, 0.4% Native American, 0.7% Asian, 0.1% Pacific Islander, 0.7% from other races, and 1.7% from two or more races. Hispanic or Latino of any race were 2.2% of the population.
The median income for a household in the city was $30,945, and the median income for a family was $38,945. The per capita income for the city was $17,845. About 17.2% of families and 20.3% of the population were below the poverty line, including 28.2% of those under age 18 and 11.2% of those age 65 or over.
Common Questions
What is the Total Population of Zanesville?
Total Population of Zanesville is 24,772.
What is the Total Male Population of Zanesville?
Total Male Population of Zanesville is 11,746.
What is the Total Female Population of Zanesville?
Total Female Population of Zanesville is 13,026.
What is the Ratio of Males per 100 Females in Zanesville?
There are 90.17 Males per 100 Females in Zanesville.
What is the Ratio of Females per 100 Males in Zanesville?
There are 110.90 Females per 100 Males in Zanesville.
What is the Median Population Age in Zanesville?
Median Population Age in Zanesville is 38.1 Years.
What is the Average Family Size in Zanesville
Average Family Size in Zanesville is 3.0 People.
What is the Average Household Size in Zanesville
Average Household Size in Zanesville is 2.3 People.
What is Per Capita Income in Zanesville?
Per Capita income in Zanesville is $26,900.
What is the Median Family Income in Zanesville?
Median Family Income in Zanesville is $45,730.
What is the Median Household income in Zanesville?
Median Household Income in Zanesville is $40,927.
What is Income or Wage Gap in Zanesville?
Income or Wage Gap in Zanesville is 27.6%.
Women in Zanesville earn 72.4 cents for every dollar earned by a man.
What is Family Income Deficit in Zanesville?
Family Income Deficit in Zanesville is $11,008.
Families that are below poverty line in Zanesville earn $11,008 less on average than the poverty threshold level.
What is Inequality or Gini Index in Zanesville?
Inequality or Gini Index in Zanesville is 0.50.
How Large is the Labor Force in Zanesville?
There are 11,041 People in the Labor Forcein in Zanesville.
What is the Percentage of People in the Labor Force in Zanesville?
55.9% of People are in the Labor Force in Zanesville.
What is the Unemployment Rate in Zanesville?
Unemployment Rate in Zanesville is 8.5%.