New Franklin, OH
New Franklin Map
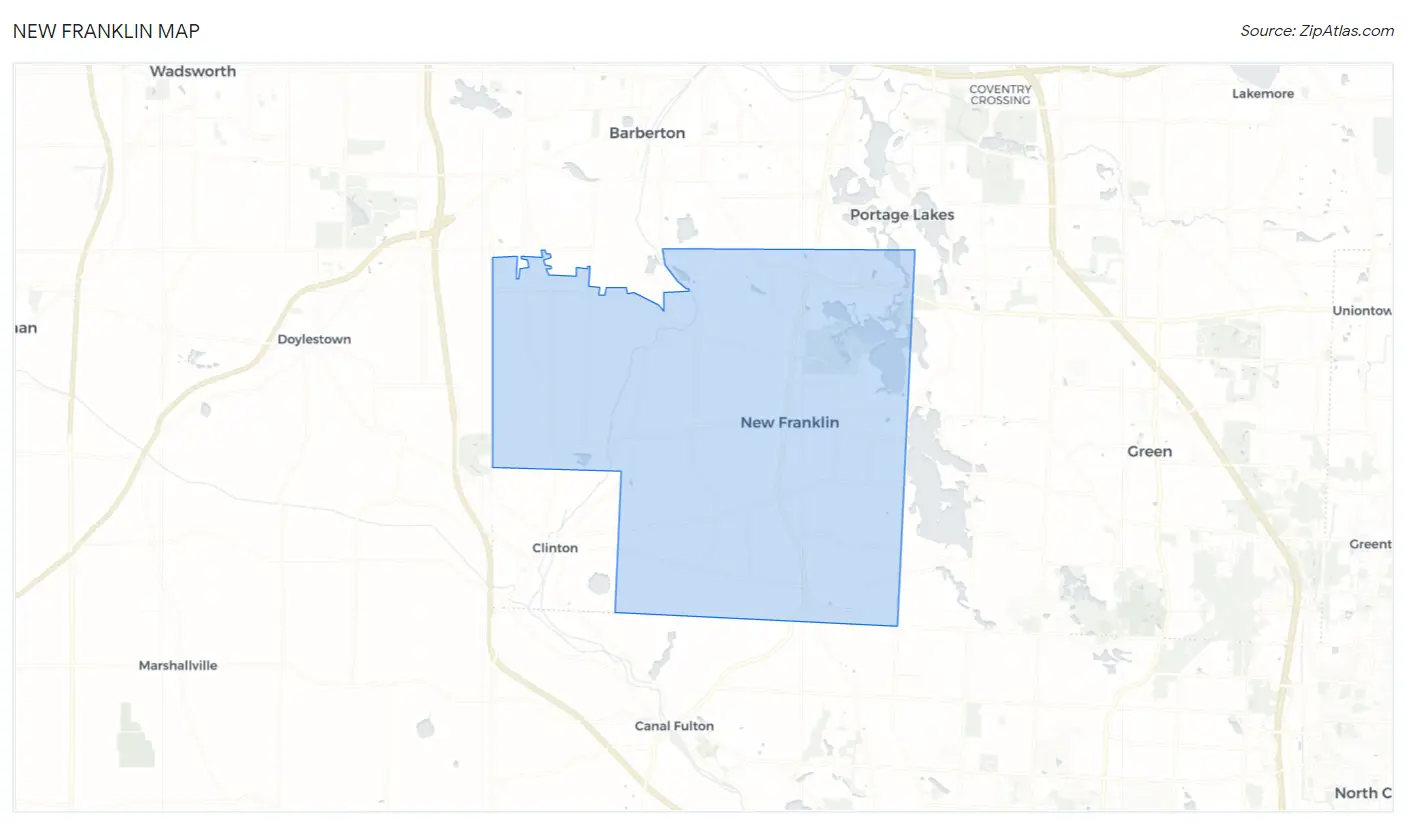
New Franklin Overview
13,874
TOTAL POPULATION
6,830
MALE POPULATION
7,044
FEMALE POPULATION
96.96
MALES / 100 FEMALES
103.13
FEMALES / 100 MALES
48.4
MEDIAN AGE
2.8
AVG FAMILY SIZE
2.4
AVG HOUSEHOLD SIZE
$40,498
PER CAPITA INCOME
$98,903
AVG FAMILY INCOME
$87,032
AVG HOUSEHOLD INCOME
37.0%
WAGE / INCOME GAP [ % ]
63.0¢/ $1
WAGE / INCOME GAP [ $ ]
$7,977
FAMILY INCOME DEFICIT
0.35
INEQUALITY / GINI INDEX
7,832
LABOR FORCE [ PEOPLE ]
66.6%
PERCENT IN LABOR FORCE
4.5%
UNEMPLOYMENT RATE
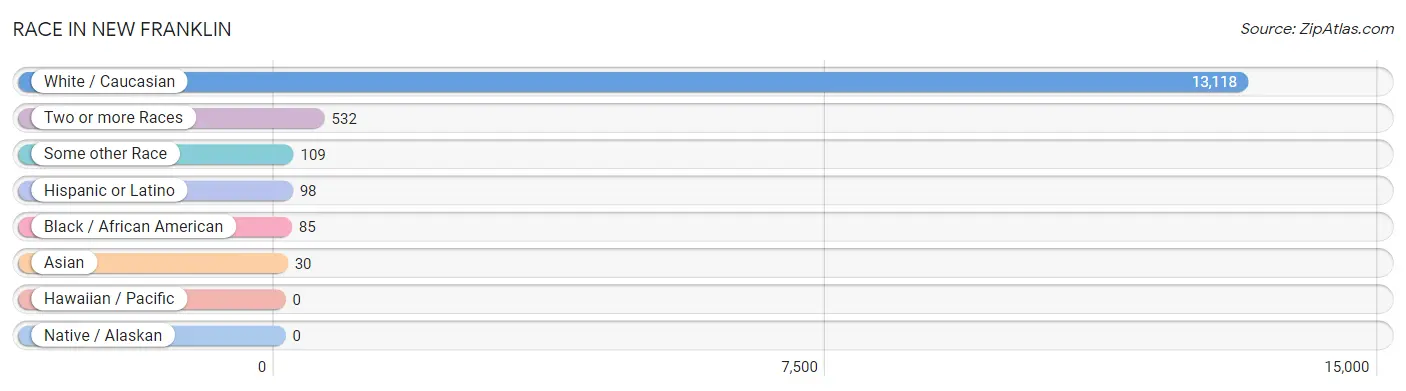
Race in New Franklin
The most populous races in New Franklin are White / Caucasian (13,118 | 94.6%), Two or more Races (532 | 3.8%), and Some other Race (109 | 0.8%).
| Race | # Population | % Population |
| Asian | 30 | 0.2% |
| Black / African American | 85 | 0.6% |
| Hawaiian / Pacific | 0 | 0.0% |
| Hispanic or Latino | 98 | 0.7% |
| Native / Alaskan | 0 | 0.0% |
| White / Caucasian | 13,118 | 94.6% |
| Two or more Races | 532 | 3.8% |
| Some other Race | 109 | 0.8% |
| Total | 13,874 | 100.0% |
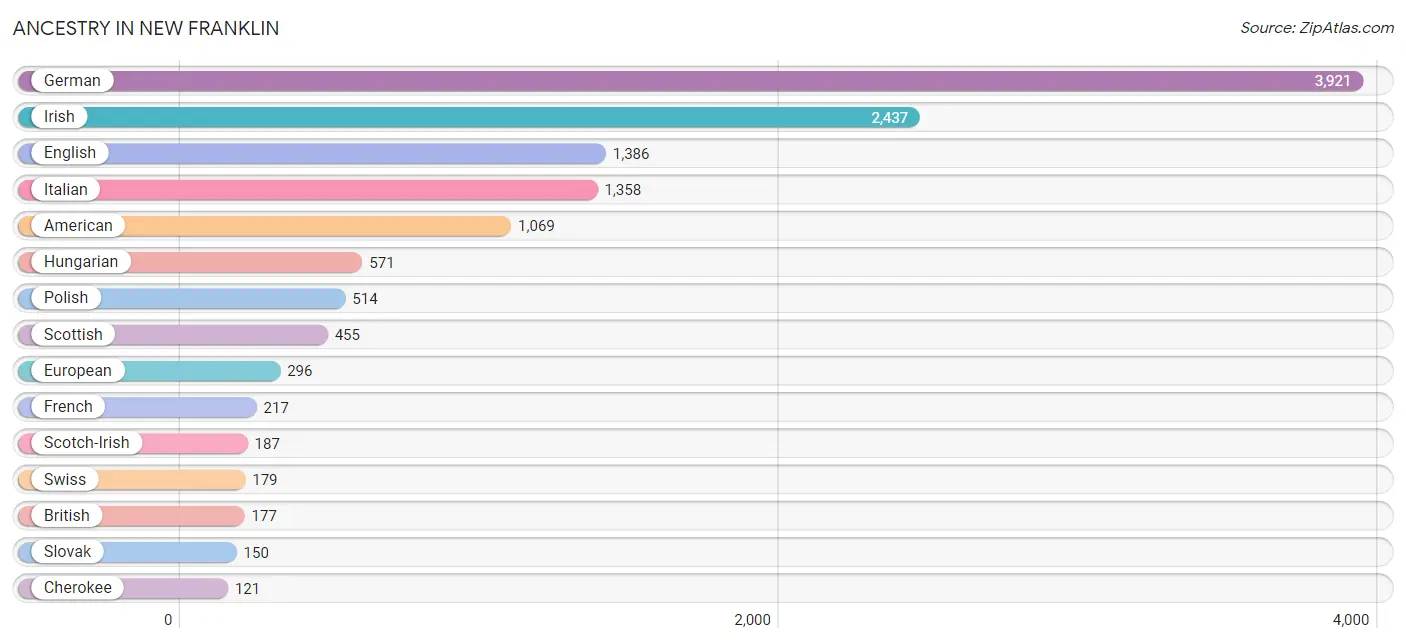
Ancestry in New Franklin
The most populous ancestries reported in New Franklin are German (3,921 | 28.3%), Irish (2,437 | 17.6%), English (1,386 | 10.0%), Italian (1,358 | 9.8%), and American (1,069 | 7.7%), together accounting for 73.3% of all New Franklin residents.
| Ancestry | # Population | % Population |
| African | 44 | 0.3% |
| American | 1,069 | 7.7% |
| Arab | 59 | 0.4% |
| Armenian | 6 | 0.0% |
| Austrian | 44 | 0.3% |
| Bhutanese | 56 | 0.4% |
| Blackfeet | 5 | 0.0% |
| British | 177 | 1.3% |
| Burmese | 12 | 0.1% |
| Canadian | 10 | 0.1% |
| Celtic | 9 | 0.1% |
| Central American | 25 | 0.2% |
| Cherokee | 121 | 0.9% |
| Costa Rican | 25 | 0.2% |
| Croatian | 79 | 0.6% |
| Cuban | 24 | 0.2% |
| Czech | 89 | 0.6% |
| Czechoslovakian | 22 | 0.2% |
| Danish | 64 | 0.5% |
| Dutch | 64 | 0.5% |
| Eastern European | 9 | 0.1% |
| English | 1,386 | 10.0% |
| European | 296 | 2.1% |
| Finnish | 9 | 0.1% |
| French | 217 | 1.6% |
| French Canadian | 41 | 0.3% |
| German | 3,921 | 28.3% |
| Greek | 64 | 0.5% |
| Hungarian | 571 | 4.1% |
| Iranian | 1 | 0.0% |
| Irish | 2,437 | 17.6% |
| Italian | 1,358 | 9.8% |
| Korean | 49 | 0.4% |
| Lebanese | 50 | 0.4% |
| Lithuanian | 12 | 0.1% |
| Macedonian | 37 | 0.3% |
| Mexican | 35 | 0.3% |
| Native Hawaiian | 28 | 0.2% |
| Norwegian | 9 | 0.1% |
| Pennsylvania German | 68 | 0.5% |
| Polish | 514 | 3.7% |
| Portuguese | 35 | 0.3% |
| Puerto Rican | 1 | 0.0% |
| Romanian | 45 | 0.3% |
| Russian | 110 | 0.8% |
| Scandinavian | 13 | 0.1% |
| Scotch-Irish | 187 | 1.3% |
| Scottish | 455 | 3.3% |
| Serbian | 73 | 0.5% |
| Slovak | 150 | 1.1% |
| Slovene | 39 | 0.3% |
| Spaniard | 13 | 0.1% |
| Subsaharan African | 44 | 0.3% |
| Swedish | 83 | 0.6% |
| Swiss | 179 | 1.3% |
| Syrian | 9 | 0.1% |
| Ukrainian | 11 | 0.1% |
| Welsh | 113 | 0.8% |
| Yugoslavian | 32 | 0.2% | View All 59 Rows |
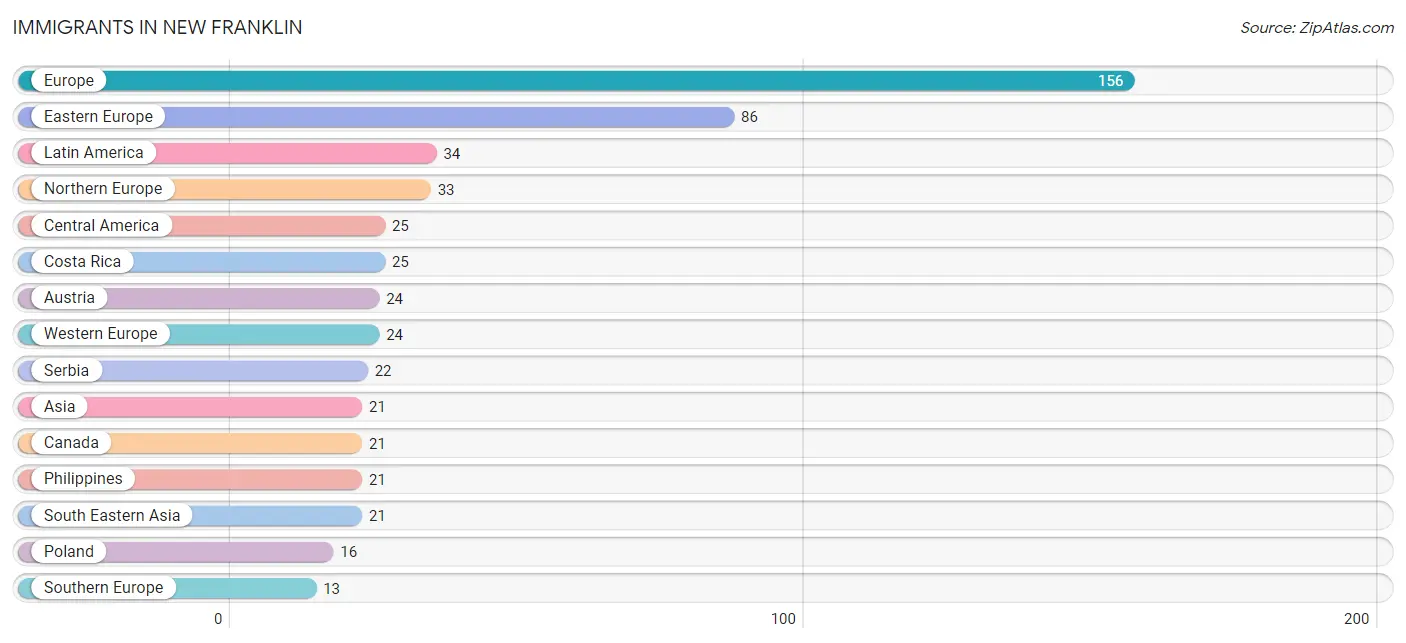
Immigrants in New Franklin
The most numerous immigrant groups reported in New Franklin came from Europe (156 | 1.1%), Eastern Europe (86 | 0.6%), Latin America (34 | 0.3%), Northern Europe (33 | 0.2%), and Central America (25 | 0.2%), together accounting for 2.4% of all New Franklin residents.
| Immigration Origin | # Population | % Population |
| Asia | 21 | 0.2% |
| Austria | 24 | 0.2% |
| Brazil | 9 | 0.1% |
| Canada | 21 | 0.2% |
| Central America | 25 | 0.2% |
| Costa Rica | 25 | 0.2% |
| Eastern Europe | 86 | 0.6% |
| Europe | 156 | 1.1% |
| Latin America | 34 | 0.3% |
| North Macedonia | 9 | 0.1% |
| Northern Europe | 33 | 0.2% |
| Philippines | 21 | 0.2% |
| Poland | 16 | 0.1% |
| Romania | 6 | 0.0% |
| Russia | 9 | 0.1% |
| Scotland | 7 | 0.1% |
| Serbia | 22 | 0.2% |
| South America | 9 | 0.1% |
| South Eastern Asia | 21 | 0.2% |
| Southern Europe | 13 | 0.1% |
| Spain | 13 | 0.1% |
| Western Europe | 24 | 0.2% | View All 22 Rows |
Sex and Age in New Franklin
Sex and Age in New Franklin
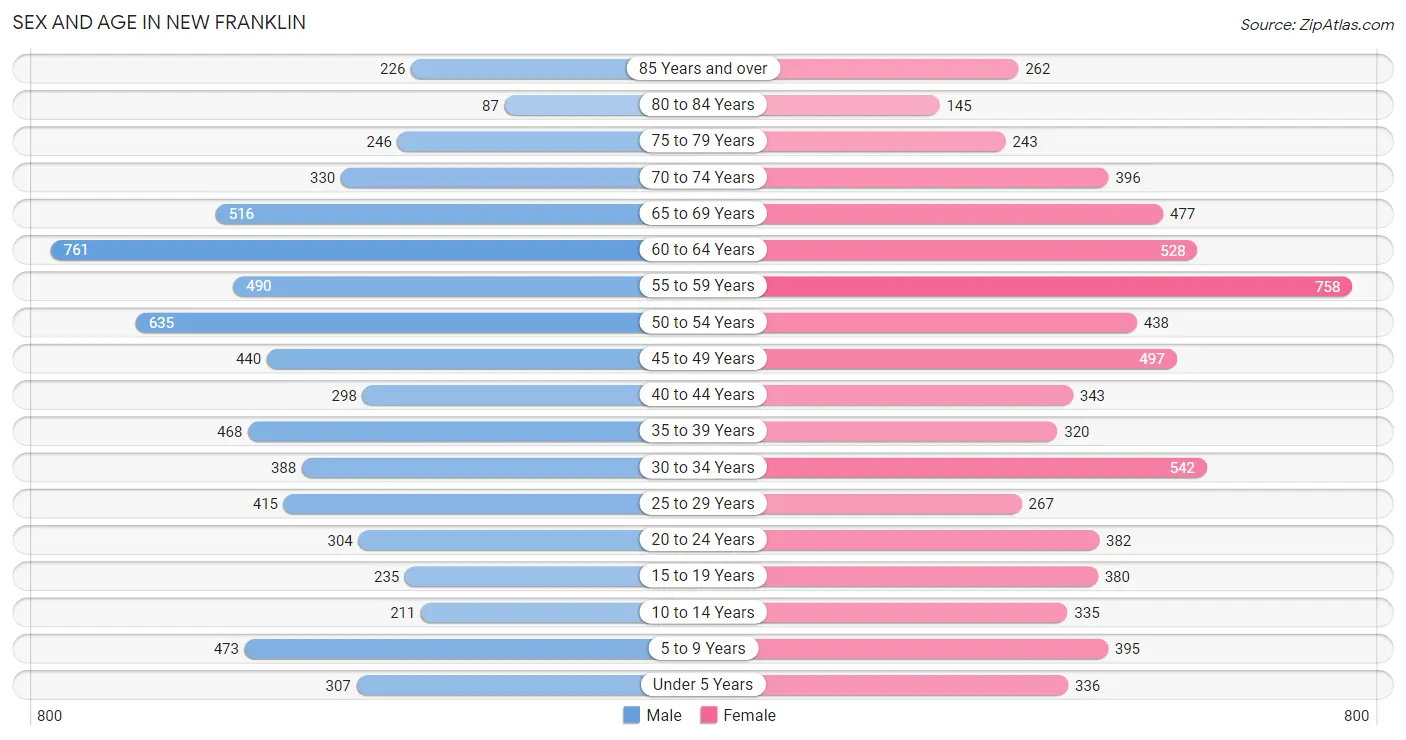
The most populous age groups in New Franklin are 60 to 64 Years (761 | 11.1%) for men and 55 to 59 Years (758 | 10.8%) for women.
| Age Bracket | Male | Female |
| Under 5 Years | 307 (4.5%) | 336 (4.8%) |
| 5 to 9 Years | 473 (6.9%) | 395 (5.6%) |
| 10 to 14 Years | 211 (3.1%) | 335 (4.8%) |
| 15 to 19 Years | 235 (3.4%) | 380 (5.4%) |
| 20 to 24 Years | 304 (4.4%) | 382 (5.4%) |
| 25 to 29 Years | 415 (6.1%) | 267 (3.8%) |
| 30 to 34 Years | 388 (5.7%) | 542 (7.7%) |
| 35 to 39 Years | 468 (6.9%) | 320 (4.5%) |
| 40 to 44 Years | 298 (4.4%) | 343 (4.9%) |
| 45 to 49 Years | 440 (6.4%) | 497 (7.1%) |
| 50 to 54 Years | 635 (9.3%) | 438 (6.2%) |
| 55 to 59 Years | 490 (7.2%) | 758 (10.8%) |
| 60 to 64 Years | 761 (11.1%) | 528 (7.5%) |
| 65 to 69 Years | 516 (7.5%) | 477 (6.8%) |
| 70 to 74 Years | 330 (4.8%) | 396 (5.6%) |
| 75 to 79 Years | 246 (3.6%) | 243 (3.5%) |
| 80 to 84 Years | 87 (1.3%) | 145 (2.1%) |
| 85 Years and over | 226 (3.3%) | 262 (3.7%) |
| Total | 6,830 (100.0%) | 7,044 (100.0%) |
Families and Households in New Franklin
Median Family Size in New Franklin
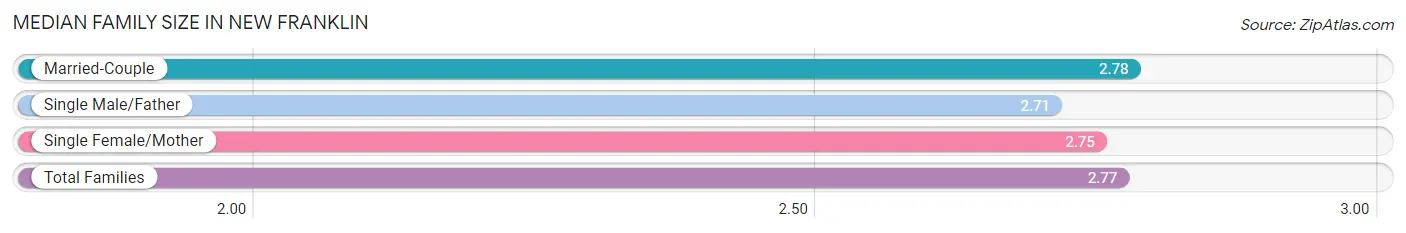
The median family size in New Franklin is 2.77 persons per family, with married-couple families (3,349 | 80.3%) accounting for the largest median family size of 2.78 persons per family. On the other hand, single male/father families (277 | 6.6%) represent the smallest median family size with 2.71 persons per family.
| Family Type | # Families | Family Size |
| Married-Couple | 3,349 (80.3%) | 2.78 |
| Single Male/Father | 277 (6.6%) | 2.71 |
| Single Female/Mother | 543 (13.0%) | 2.75 |
| Total Families | 4,169 (100.0%) | 2.77 |
Median Household Size in New Franklin
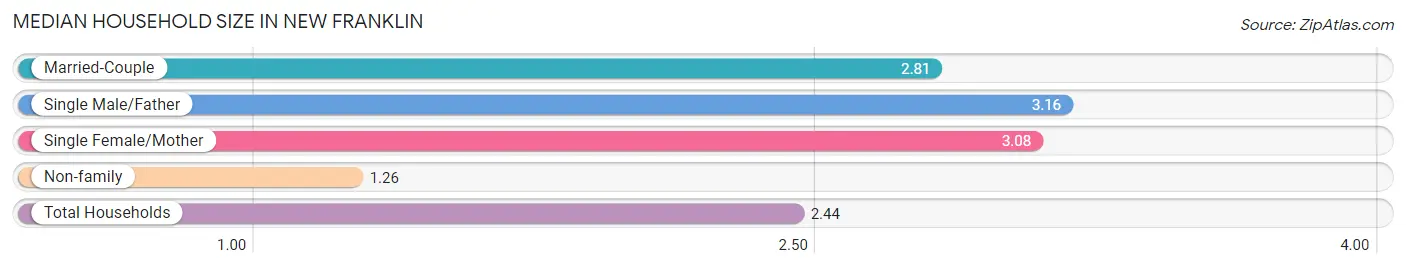
The median household size in New Franklin is 2.44 persons per household, with single male/father households (277 | 4.9%) accounting for the largest median household size of 3.16 persons per household. non-family households (1,474 | 26.1%) represent the smallest median household size with 1.26 persons per household.
| Household Type | # Households | Household Size |
| Married-Couple | 3,349 (59.4%) | 2.81 |
| Single Male/Father | 277 (4.9%) | 3.16 |
| Single Female/Mother | 543 (9.6%) | 3.08 |
| Non-family | 1,474 (26.1%) | 1.26 |
| Total Households | 5,643 (100.0%) | 2.44 |
Household Size by Marriage Status in New Franklin
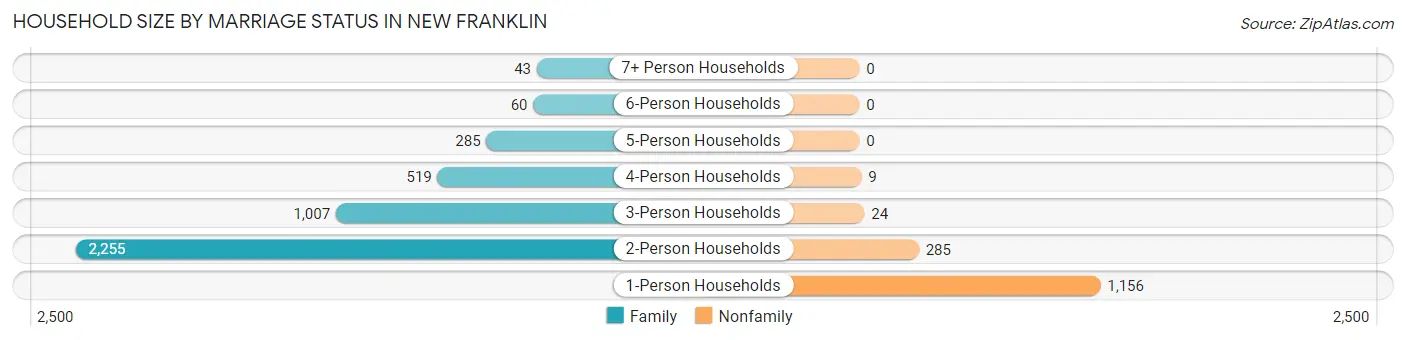
Out of a total of 5,643 households in New Franklin, 4,169 (73.9%) are family households, while 1,474 (26.1%) are nonfamily households. The most numerous type of family households are 2-person households, comprising 2,255, and the most common type of nonfamily households are 1-person households, comprising 1,156.
| Household Size | Family Households | Nonfamily Households |
| 1-Person Households | - | 1,156 (20.5%) |
| 2-Person Households | 2,255 (40.0%) | 285 (5.1%) |
| 3-Person Households | 1,007 (17.8%) | 24 (0.4%) |
| 4-Person Households | 519 (9.2%) | 9 (0.2%) |
| 5-Person Households | 285 (5.1%) | 0 (0.0%) |
| 6-Person Households | 60 (1.1%) | 0 (0.0%) |
| 7+ Person Households | 43 (0.8%) | 0 (0.0%) |
| Total | 4,169 (73.9%) | 1,474 (26.1%) |
Female Fertility in New Franklin
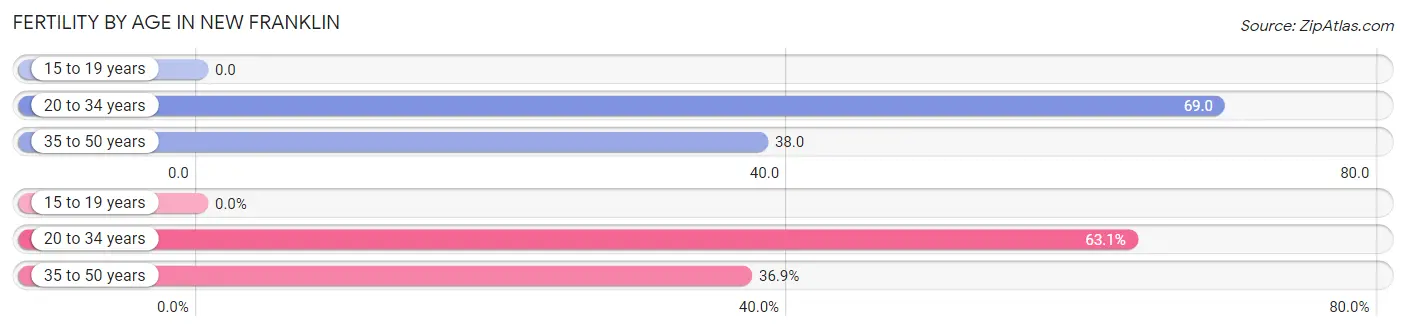
Fertility by Age in New Franklin
Average fertility rate in New Franklin is 46.0 births per 1,000 women. Women in the age bracket of 20 to 34 years have the highest fertility rate with 69.0 births per 1,000 women. Women in the age bracket of 20 to 34 years acount for 63.1% of all women with births.
| Age Bracket | Women with Births | Births / 1,000 Women |
| 15 to 19 years | 0 (0.0%) | 0.0 |
| 20 to 34 years | 82 (63.1%) | 69.0 |
| 35 to 50 years | 48 (36.9%) | 38.0 |
| Total | 130 (100.0%) | 46.0 |
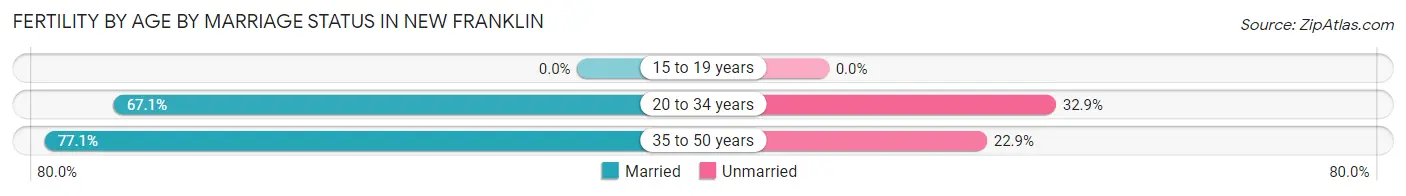
Fertility by Age by Marriage Status in New Franklin
70.8% of women with births (130) in New Franklin are married. The highest percentage of unmarried women with births falls into 20 to 34 years age bracket with 32.9% of them unmarried at the time of birth, while the lowest percentage of unmarried women with births belong to 35 to 50 years age bracket with 22.9% of them unmarried.
| Age Bracket | Married | Unmarried |
| 15 to 19 years | 0 (0.0%) | 0 (0.0%) |
| 20 to 34 years | 55 (67.1%) | 27 (32.9%) |
| 35 to 50 years | 37 (77.1%) | 11 (22.9%) |
| Total | 92 (70.8%) | 38 (29.2%) |
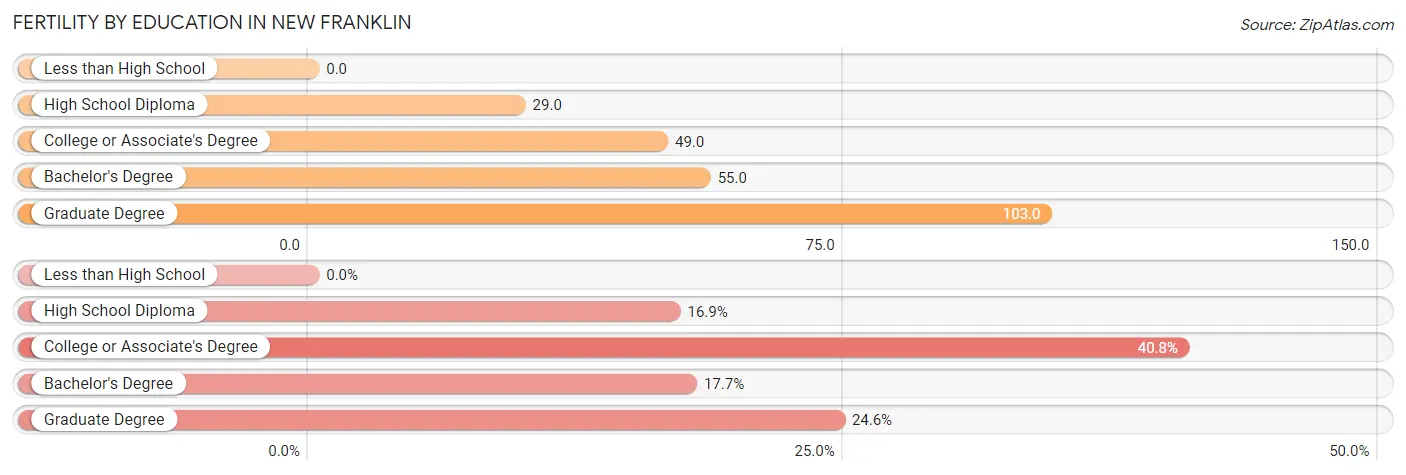
Fertility by Education in New Franklin
| Educational Attainment | Women with Births | Births / 1,000 Women |
| Less than High School | 0 (0.0%) | 0.0 |
| High School Diploma | 22 (16.9%) | 29.0 |
| College or Associate's Degree | 53 (40.8%) | 49.0 |
| Bachelor's Degree | 23 (17.7%) | 55.0 |
| Graduate Degree | 32 (24.6%) | 103.0 |
| Total | 130 (100.0%) | 46.0 |
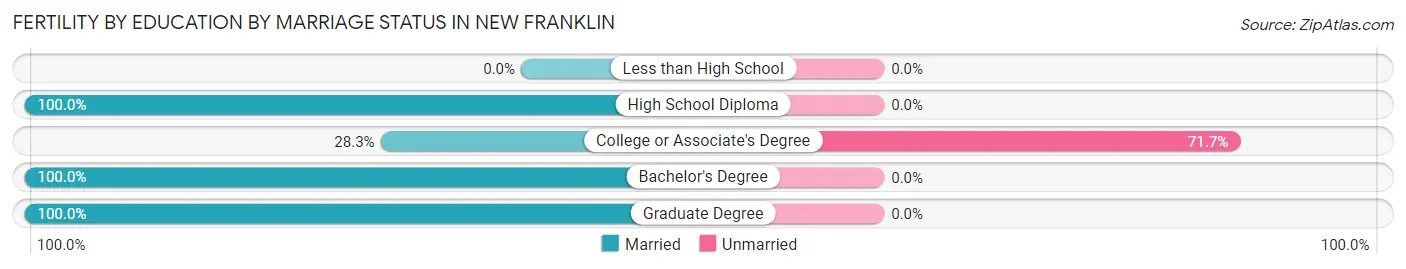
Fertility by Education by Marriage Status in New Franklin
29.2% of women with births in New Franklin are unmarried. Women with the educational attainment of high school diploma are most likely to be married with 100.0% of them married at childbirth, while women with the educational attainment of college or associate's degree are least likely to be married with 71.7% of them unmarried at childbirth.
| Educational Attainment | Married | Unmarried |
| Less than High School | 0 (0.0%) | 0 (0.0%) |
| High School Diploma | 22 (100.0%) | 0 (0.0%) |
| College or Associate's Degree | 15 (28.3%) | 38 (71.7%) |
| Bachelor's Degree | 23 (100.0%) | 0 (0.0%) |
| Graduate Degree | 32 (100.0%) | 0 (0.0%) |
| Total | 92 (70.8%) | 38 (29.2%) |
Income in New Franklin
Income Overview in New Franklin
Per Capita Income in New Franklin is $40,498, while median incomes of families and households are $98,903 and $87,032 respectively.
| Characteristic | Number | Measure |
| Per Capita Income | 13,874 | $40,498 |
| Median Family Income | 4,169 | $98,903 |
| Mean Family Income | 4,169 | $108,669 |
| Median Household Income | 5,643 | $87,032 |
| Mean Household Income | 5,643 | $98,552 |
| Income Deficit | 4,169 | $7,977 |
| Wage / Income Gap (%) | 13,874 | 36.98% |
| Wage / Income Gap ($) | 13,874 | 63.02¢ per $1 |
| Gini / Inequality Index | 13,874 | 0.35 |
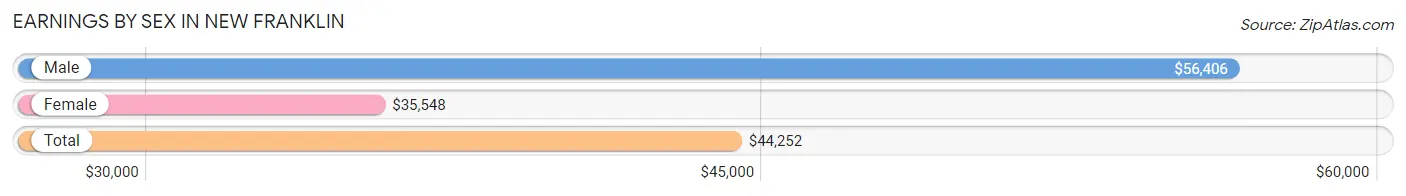
Earnings by Sex in New Franklin
Average Earnings in New Franklin are $44,252, $56,406 for men and $35,548 for women, a difference of 37.0%.
| Sex | Number | Average Earnings |
| Male | 4,172 (51.5%) | $56,406 |
| Female | 3,933 (48.5%) | $35,548 |
| Total | 8,105 (100.0%) | $44,252 |
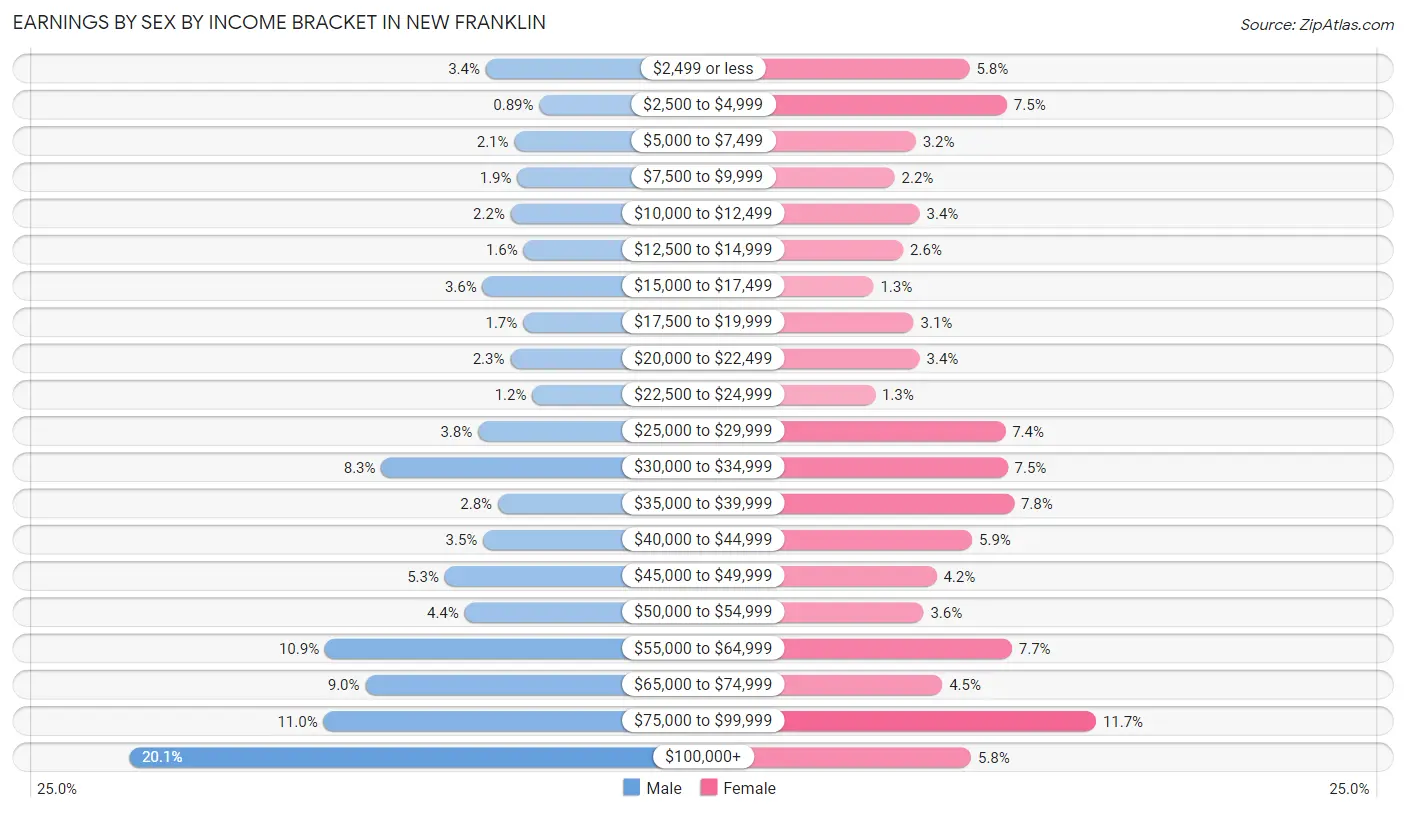
Earnings by Sex by Income Bracket in New Franklin
The most common earnings brackets in New Franklin are $100,000+ for men (839 | 20.1%) and $75,000 to $99,999 for women (459 | 11.7%).
| Income | Male | Female |
| $2,499 or less | 142 (3.4%) | 226 (5.8%) |
| $2,500 to $4,999 | 37 (0.9%) | 295 (7.5%) |
| $5,000 to $7,499 | 86 (2.1%) | 127 (3.2%) |
| $7,500 to $9,999 | 80 (1.9%) | 88 (2.2%) |
| $10,000 to $12,499 | 93 (2.2%) | 134 (3.4%) |
| $12,500 to $14,999 | 68 (1.6%) | 104 (2.6%) |
| $15,000 to $17,499 | 148 (3.5%) | 49 (1.3%) |
| $17,500 to $19,999 | 69 (1.7%) | 123 (3.1%) |
| $20,000 to $22,499 | 94 (2.2%) | 134 (3.4%) |
| $22,500 to $24,999 | 51 (1.2%) | 52 (1.3%) |
| $25,000 to $29,999 | 157 (3.8%) | 292 (7.4%) |
| $30,000 to $34,999 | 346 (8.3%) | 296 (7.5%) |
| $35,000 to $39,999 | 118 (2.8%) | 308 (7.8%) |
| $40,000 to $44,999 | 147 (3.5%) | 231 (5.9%) |
| $45,000 to $49,999 | 222 (5.3%) | 165 (4.2%) |
| $50,000 to $54,999 | 183 (4.4%) | 141 (3.6%) |
| $55,000 to $64,999 | 456 (10.9%) | 304 (7.7%) |
| $65,000 to $74,999 | 377 (9.0%) | 176 (4.5%) |
| $75,000 to $99,999 | 459 (11.0%) | 459 (11.7%) |
| $100,000+ | 839 (20.1%) | 229 (5.8%) |
| Total | 4,172 (100.0%) | 3,933 (100.0%) |
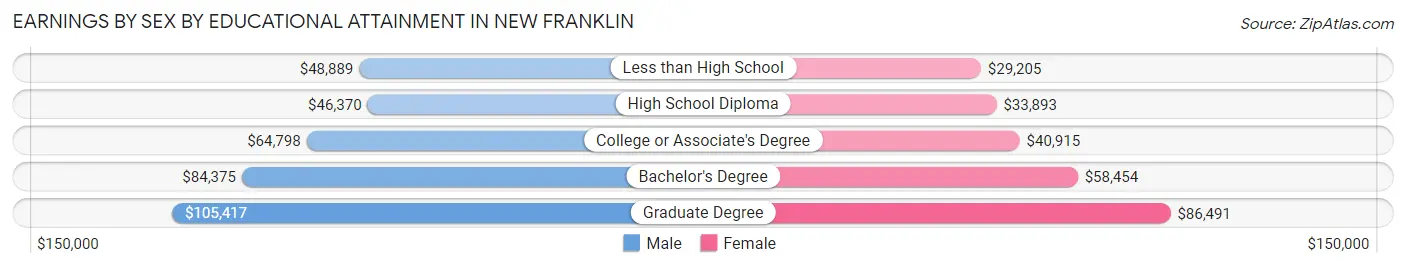
Earnings by Sex by Educational Attainment in New Franklin
Average earnings in New Franklin are $61,349 for men and $40,998 for women, a difference of 33.2%. Men with an educational attainment of graduate degree enjoy the highest average annual earnings of $105,417, while those with high school diploma education earn the least with $46,370. Women with an educational attainment of graduate degree earn the most with the average annual earnings of $86,491, while those with less than high school education have the smallest earnings of $29,205.
| Educational Attainment | Male Income | Female Income |
| Less than High School | $48,889 | $29,205 |
| High School Diploma | $46,370 | $33,893 |
| College or Associate's Degree | $64,798 | $40,915 |
| Bachelor's Degree | $84,375 | $58,454 |
| Graduate Degree | $105,417 | $86,491 |
| Total | $61,349 | $40,998 |
Family Income in New Franklin
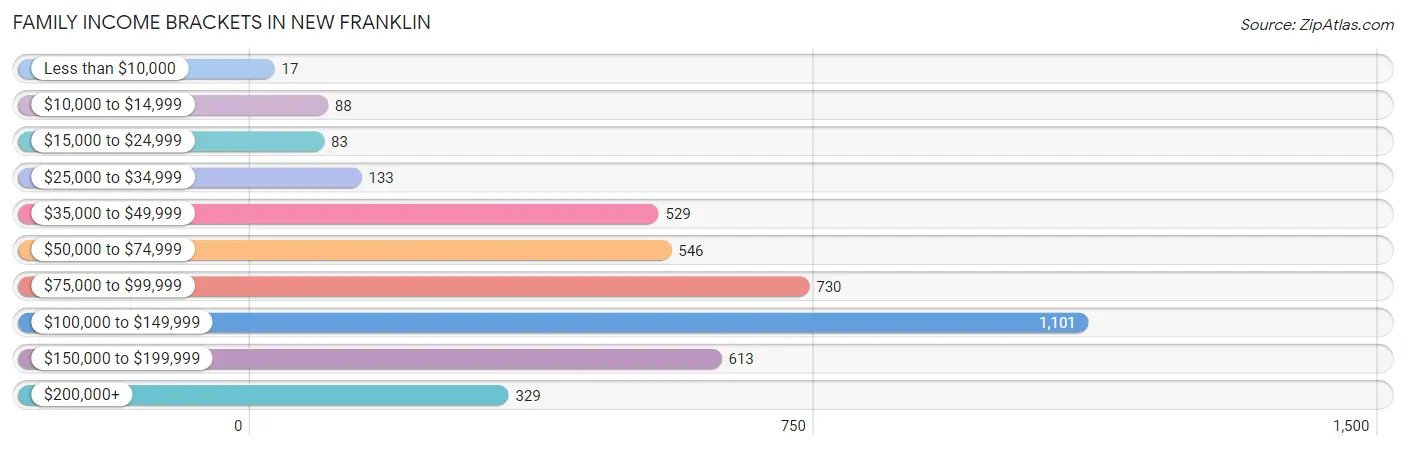
Family Income Brackets in New Franklin
According to the New Franklin family income data, there are 1,101 families falling into the $100,000 to $149,999 income range, which is the most common income bracket and makes up 26.4% of all families. Conversely, the less than $10,000 income bracket is the least frequent group with only 17 families (0.4%) belonging to this category.
| Income Bracket | # Families | % Families |
| Less than $10,000 | 17 | 0.4% |
| $10,000 to $14,999 | 88 | 2.1% |
| $15,000 to $24,999 | 83 | 2.0% |
| $25,000 to $34,999 | 133 | 3.2% |
| $35,000 to $49,999 | 529 | 12.7% |
| $50,000 to $74,999 | 546 | 13.1% |
| $75,000 to $99,999 | 730 | 17.5% |
| $100,000 to $149,999 | 1,101 | 26.4% |
| $150,000 to $199,999 | 613 | 14.7% |
| $200,000+ | 329 | 7.9% |
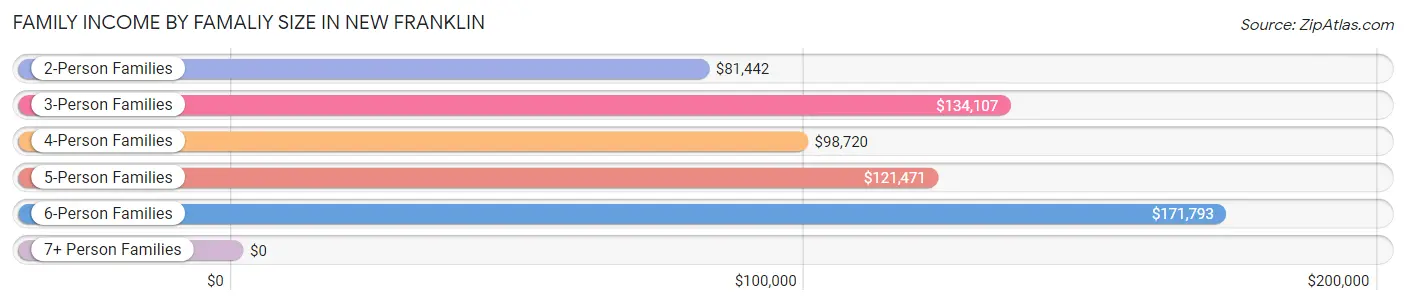
Family Income by Famaliy Size in New Franklin
6-person families (83 | 2.0%) account for the highest median family income in New Franklin with $171,793 per family, while 3-person families (926 | 22.2%) have the highest median income of $44,702 per family member.
| Income Bracket | # Families | Median Income |
| 2-Person Families | 2,451 (58.8%) | $81,442 |
| 3-Person Families | 926 (22.2%) | $134,107 |
| 4-Person Families | 429 (10.3%) | $98,720 |
| 5-Person Families | 260 (6.2%) | $121,471 |
| 6-Person Families | 83 (2.0%) | $171,793 |
| 7+ Person Families | 20 (0.5%) | $0 |
| Total | 4,169 (100.0%) | $98,903 |
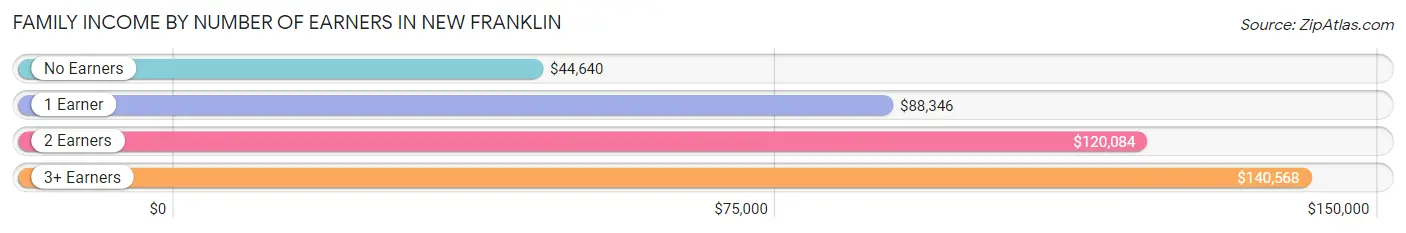
Family Income by Number of Earners in New Franklin
The median family income in New Franklin is $98,903, with families comprising 3+ earners (665) having the highest median family income of $140,568, while families with no earners (852) have the lowest median family income of $44,640, accounting for 16.0% and 20.4% of families, respectively.
| Number of Earners | # Families | Median Income |
| No Earners | 852 (20.4%) | $44,640 |
| 1 Earner | 1,021 (24.5%) | $88,346 |
| 2 Earners | 1,631 (39.1%) | $120,084 |
| 3+ Earners | 665 (16.0%) | $140,568 |
| Total | 4,169 (100.0%) | $98,903 |
Household Income in New Franklin
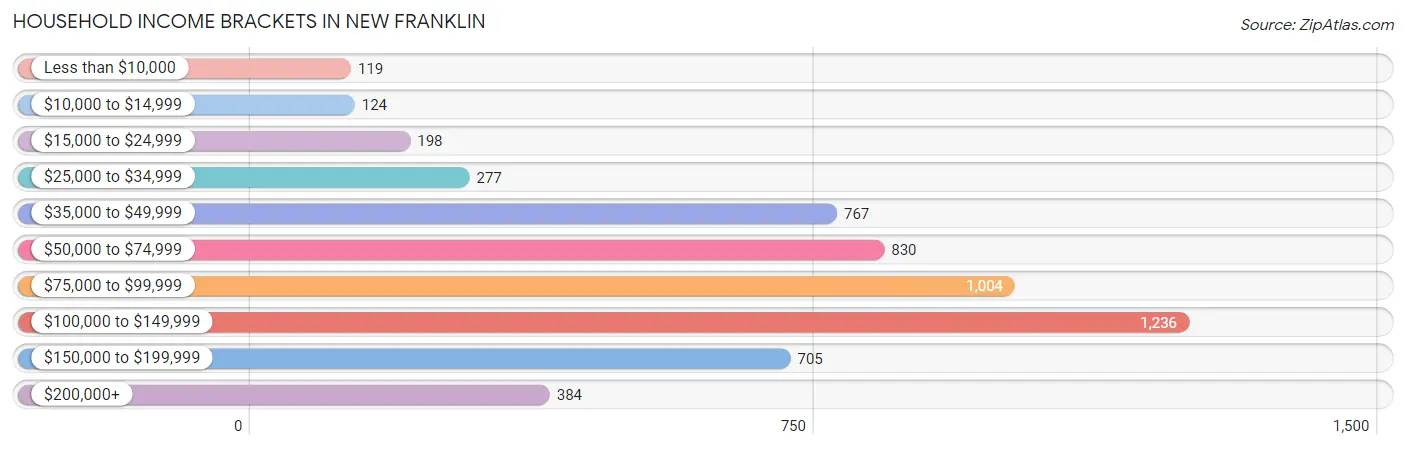
Household Income Brackets in New Franklin
With 1,236 households falling in the category, the $100,000 to $149,999 income range is the most frequent in New Franklin, accounting for 21.9% of all households. In contrast, only 119 households (2.1%) fall into the less than $10,000 income bracket, making it the least populous group.
| Income Bracket | # Households | % Households |
| Less than $10,000 | 119 | 2.1% |
| $10,000 to $14,999 | 124 | 2.2% |
| $15,000 to $24,999 | 198 | 3.5% |
| $25,000 to $34,999 | 277 | 4.9% |
| $35,000 to $49,999 | 767 | 13.6% |
| $50,000 to $74,999 | 830 | 14.7% |
| $75,000 to $99,999 | 1,004 | 17.8% |
| $100,000 to $149,999 | 1,236 | 21.9% |
| $150,000 to $199,999 | 705 | 12.5% |
| $200,000+ | 384 | 6.8% |
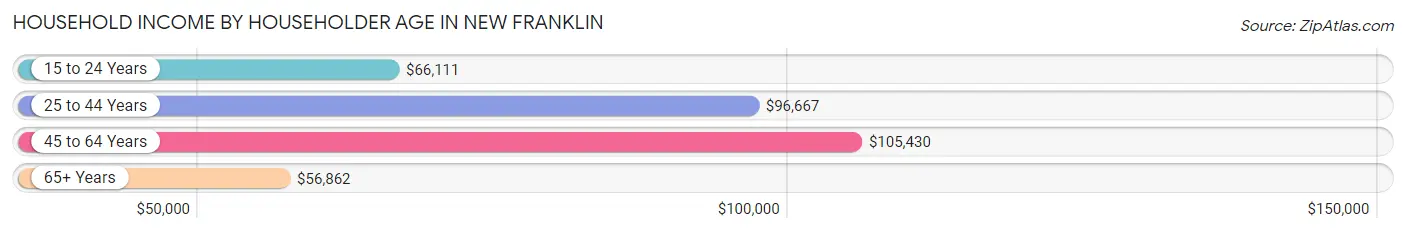
Household Income by Householder Age in New Franklin
The median household income in New Franklin is $87,032, with the highest median household income of $105,430 found in the 45 to 64 years age bracket for the primary householder. A total of 2,549 households (45.2%) fall into this category. Meanwhile, the 65+ years age bracket for the primary householder has the lowest median household income of $56,862, with 1,642 households (29.1%) in this group.
| Income Bracket | # Households | Median Income |
| 15 to 24 Years | 22 (0.4%) | $66,111 |
| 25 to 44 Years | 1,430 (25.3%) | $96,667 |
| 45 to 64 Years | 2,549 (45.2%) | $105,430 |
| 65+ Years | 1,642 (29.1%) | $56,862 |
| Total | 5,643 (100.0%) | $87,032 |
Poverty in New Franklin
Income Below Poverty by Sex and Age in New Franklin
With 2.8% poverty level for males and 6.5% for females among the residents of New Franklin, 16 and 17 year old males and 15 year old females are the most vulnerable to poverty, with 31 males (22.8%) and 16 females (76.2%) in their respective age groups living below the poverty level.
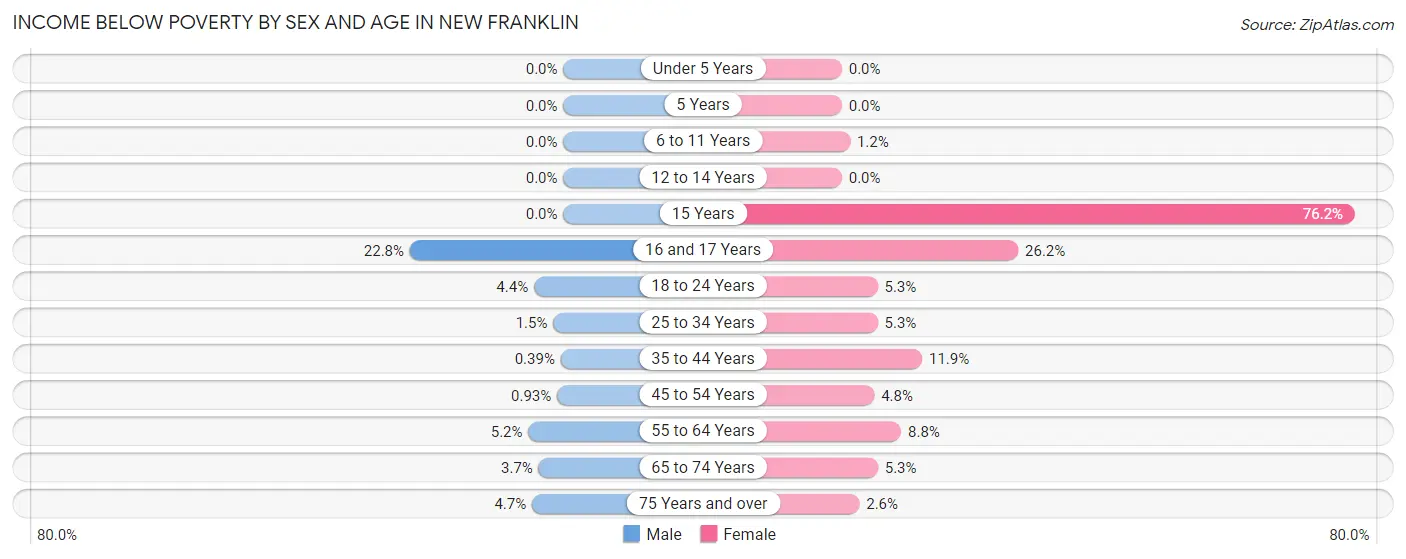
| Age Bracket | Male | Female |
| Under 5 Years | 0 (0.0%) | 0 (0.0%) |
| 5 Years | 0 (0.0%) | 0 (0.0%) |
| 6 to 11 Years | 0 (0.0%) | 6 (1.2%) |
| 12 to 14 Years | 0 (0.0%) | 0 (0.0%) |
| 15 Years | 0 (0.0%) | 16 (76.2%) |
| 16 and 17 Years | 31 (22.8%) | 61 (26.2%) |
| 18 to 24 Years | 16 (4.4%) | 27 (5.3%) |
| 25 to 34 Years | 12 (1.5%) | 43 (5.3%) |
| 35 to 44 Years | 3 (0.4%) | 79 (11.9%) |
| 45 to 54 Years | 10 (0.9%) | 45 (4.8%) |
| 55 to 64 Years | 65 (5.2%) | 113 (8.8%) |
| 65 to 74 Years | 31 (3.7%) | 46 (5.3%) |
| 75 Years and over | 26 (4.6%) | 16 (2.6%) |
| Total | 194 (2.8%) | 452 (6.5%) |
Income Above Poverty by Sex and Age in New Franklin
According to the poverty statistics in New Franklin, males aged under 5 years and females aged under 5 years are the age groups that are most secure financially, with 100.0% of males and 100.0% of females in these age groups living above the poverty line.
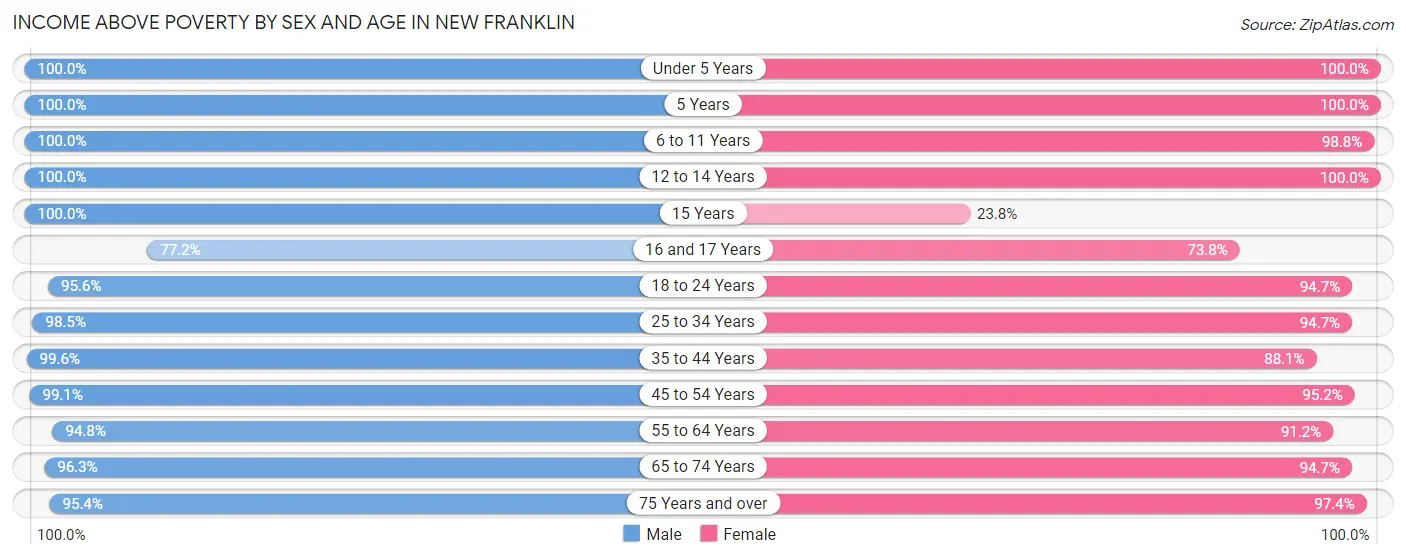
| Age Bracket | Male | Female |
| Under 5 Years | 307 (100.0%) | 336 (100.0%) |
| 5 Years | 30 (100.0%) | 45 (100.0%) |
| 6 to 11 Years | 489 (100.0%) | 490 (98.8%) |
| 12 to 14 Years | 165 (100.0%) | 183 (100.0%) |
| 15 Years | 36 (100.0%) | 5 (23.8%) |
| 16 and 17 Years | 105 (77.2%) | 172 (73.8%) |
| 18 to 24 Years | 351 (95.6%) | 481 (94.7%) |
| 25 to 34 Years | 791 (98.5%) | 766 (94.7%) |
| 35 to 44 Years | 763 (99.6%) | 584 (88.1%) |
| 45 to 54 Years | 1,061 (99.1%) | 890 (95.2%) |
| 55 to 64 Years | 1,186 (94.8%) | 1,169 (91.2%) |
| 65 to 74 Years | 815 (96.3%) | 815 (94.7%) |
| 75 Years and over | 533 (95.4%) | 600 (97.4%) |
| Total | 6,632 (97.2%) | 6,536 (93.5%) |
Income Below Poverty Among Married-Couple Families in New Franklin
The poverty statistics for married-couple families in New Franklin show that 2.1% or 69 of the total 3,349 families live below the poverty line. Families with no children have the highest poverty rate of 2.8%, comprising of 69 families. On the other hand, families with 1 or 2 children have the lowest poverty rate of 0.0%, which includes 0 families.
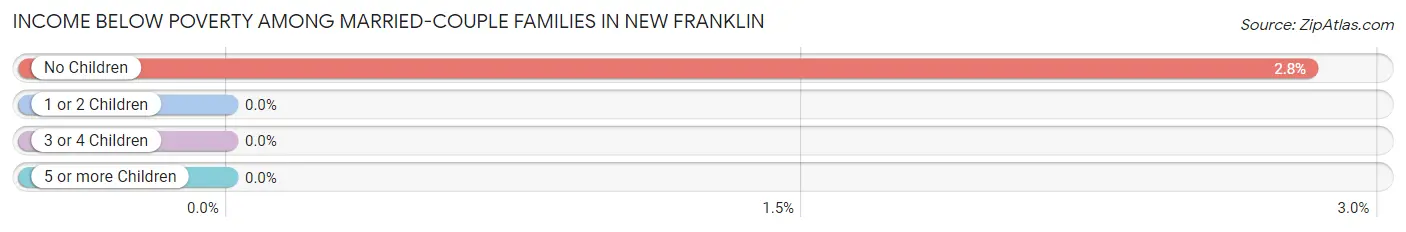
| Children | Above Poverty | Below Poverty |
| No Children | 2,379 (97.2%) | 69 (2.8%) |
| 1 or 2 Children | 654 (100.0%) | 0 (0.0%) |
| 3 or 4 Children | 227 (100.0%) | 0 (0.0%) |
| 5 or more Children | 20 (100.0%) | 0 (0.0%) |
| Total | 3,280 (97.9%) | 69 (2.1%) |
Income Below Poverty Among Single-Parent Households in New Franklin
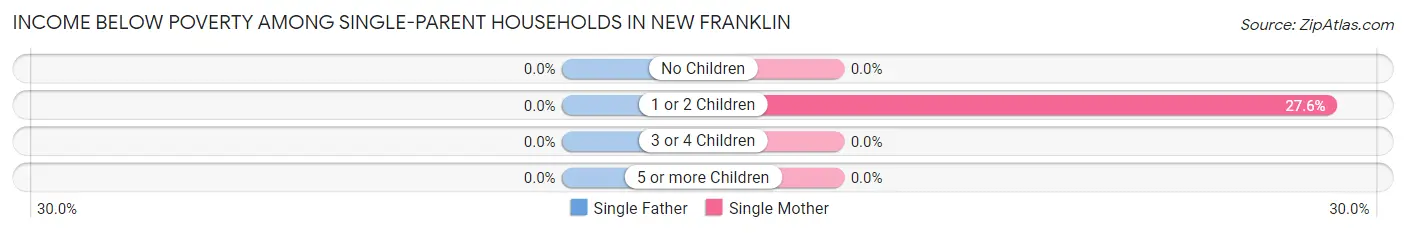
| Children | Single Father | Single Mother |
| No Children | 0 (0.0%) | 0 (0.0%) |
| 1 or 2 Children | 0 (0.0%) | 40 (27.6%) |
| 3 or 4 Children | 0 (0.0%) | 0 (0.0%) |
| 5 or more Children | 0 (0.0%) | 0 (0.0%) |
| Total | 0 (0.0%) | 40 (7.4%) |
Income Below Poverty Among Married-Couple vs Single-Parent Households in New Franklin
The poverty data for New Franklin shows that 69 of the married-couple family households (2.1%) and 40 of the single-parent households (4.9%) are living below the poverty level. Within the married-couple family households, those with no children have the highest poverty rate, with 69 households (2.8%) falling below the poverty line. Among the single-parent households, those with 1 or 2 children have the highest poverty rate, with 40 household (12.3%) living below poverty.
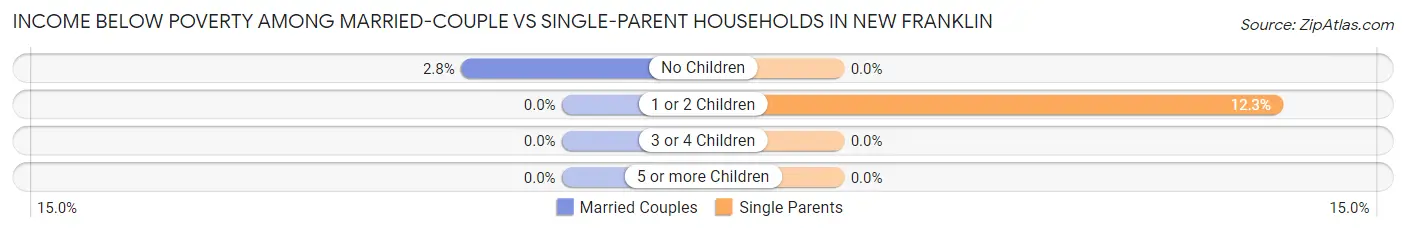
| Children | Married-Couple Families | Single-Parent Households |
| No Children | 69 (2.8%) | 0 (0.0%) |
| 1 or 2 Children | 0 (0.0%) | 40 (12.3%) |
| 3 or 4 Children | 0 (0.0%) | 0 (0.0%) |
| 5 or more Children | 0 (0.0%) | 0 (0.0%) |
| Total | 69 (2.1%) | 40 (4.9%) |
Employment Characteristics in New Franklin
Employment by Class of Employer in New Franklin
Among the 7,332 employed individuals in New Franklin, private company employees (5,411 | 73.8%), not-for-profit organizations (771 | 10.5%), and local government employees (593 | 8.1%) make up the most common classes of employment.
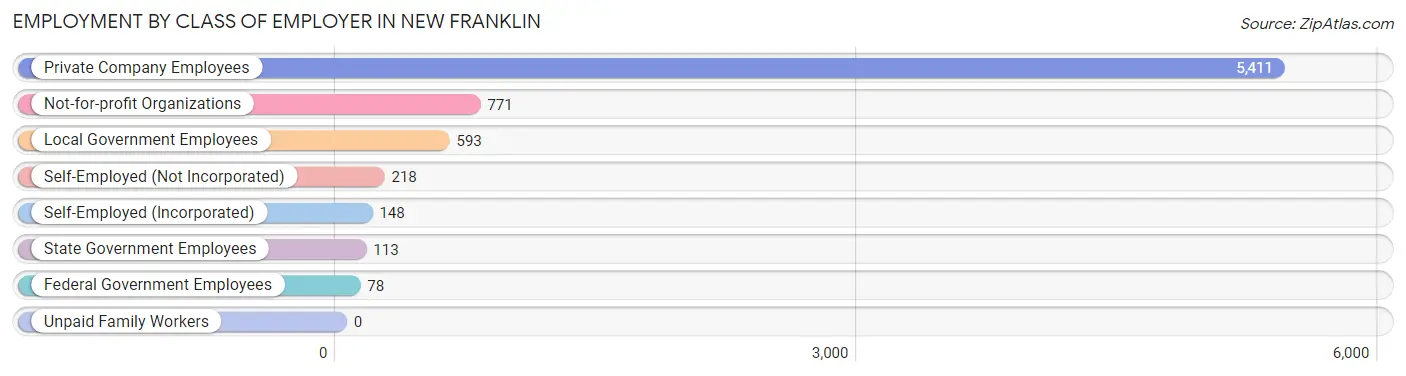
| Employer Class | # Employees | % Employees |
| Private Company Employees | 5,411 | 73.8% |
| Self-Employed (Incorporated) | 148 | 2.0% |
| Self-Employed (Not Incorporated) | 218 | 3.0% |
| Not-for-profit Organizations | 771 | 10.5% |
| Local Government Employees | 593 | 8.1% |
| State Government Employees | 113 | 1.5% |
| Federal Government Employees | 78 | 1.1% |
| Unpaid Family Workers | 0 | 0.0% |
| Total | 7,332 | 100.0% |
Employment Status by Age in New Franklin
According to the labor force statistics for New Franklin, out of the total population over 16 years of age (11,760), 66.6% or 7,832 individuals are in the labor force, with 4.5% or 352 of them unemployed. The age group with the highest labor force participation rate is 45 to 54 years, with 92.5% or 1,859 individuals in the labor force. Within the labor force, the 60 to 64 years age range has the highest percentage of unemployed individuals, with 20.1% or 144 of them being unemployed.
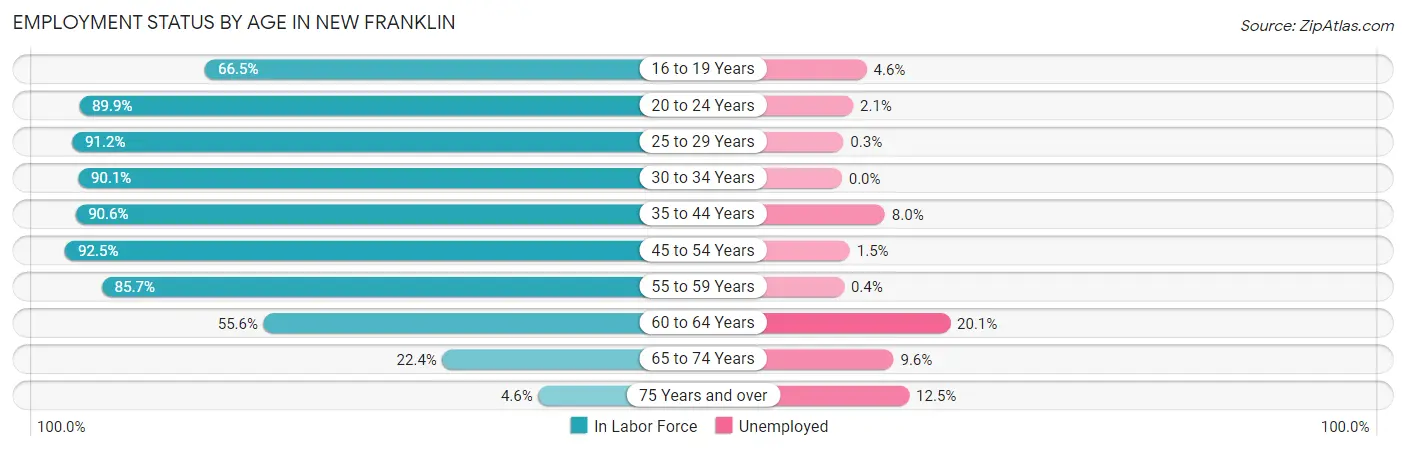
| Age Bracket | In Labor Force | Unemployed |
| 16 to 19 Years | 371 (66.5%) | 17 (4.6%) |
| 20 to 24 Years | 617 (89.9%) | 13 (2.1%) |
| 25 to 29 Years | 622 (91.2%) | 2 (0.3%) |
| 30 to 34 Years | 838 (90.1%) | 0 (0.0%) |
| 35 to 44 Years | 1,295 (90.6%) | 104 (8.0%) |
| 45 to 54 Years | 1,859 (92.5%) | 28 (1.5%) |
| 55 to 59 Years | 1,070 (85.7%) | 4 (0.4%) |
| 60 to 64 Years | 717 (55.6%) | 144 (20.1%) |
| 65 to 74 Years | 385 (22.4%) | 37 (9.6%) |
| 75 Years and over | 56 (4.6%) | 7 (12.5%) |
| Total | 7,832 (66.6%) | 352 (4.5%) |
Employment Status by Educational Attainment in New Franklin
According to labor force statistics for New Franklin, 84.3% of individuals (6,397) out of the total population between 25 and 64 years of age (7,588) are in the labor force, with 4.4% or 281 of them being unemployed. The group with the highest labor force participation rate are those with the educational attainment of bachelor's degree or higher, with 88.4% or 1,612 individuals in the labor force. Within the labor force, individuals with college / associate degree education have the highest percentage of unemployment, with 6.8% or 187 of them being unemployed.
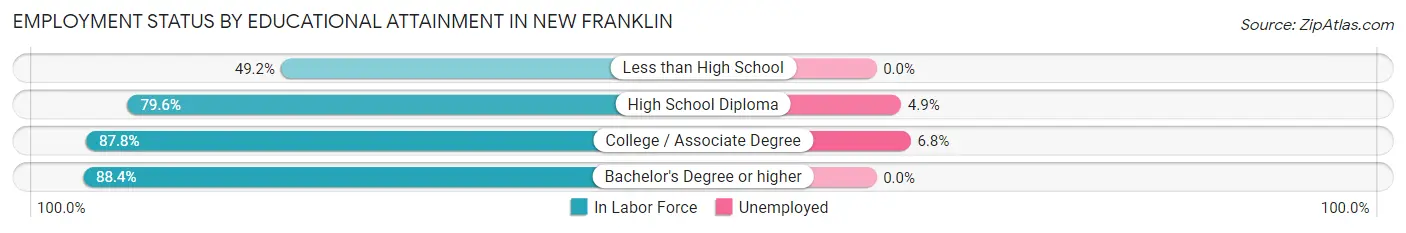
| Educational Attainment | In Labor Force | Unemployed |
| Less than High School | 93 (49.2%) | 0 (0.0%) |
| High School Diploma | 1,949 (79.6%) | 120 (4.9%) |
| College / Associate Degree | 2,746 (87.8%) | 213 (6.8%) |
| Bachelor's Degree or higher | 1,612 (88.4%) | 0 (0.0%) |
| Total | 6,397 (84.3%) | 334 (4.4%) |
Employment Occupations by Sex in New Franklin
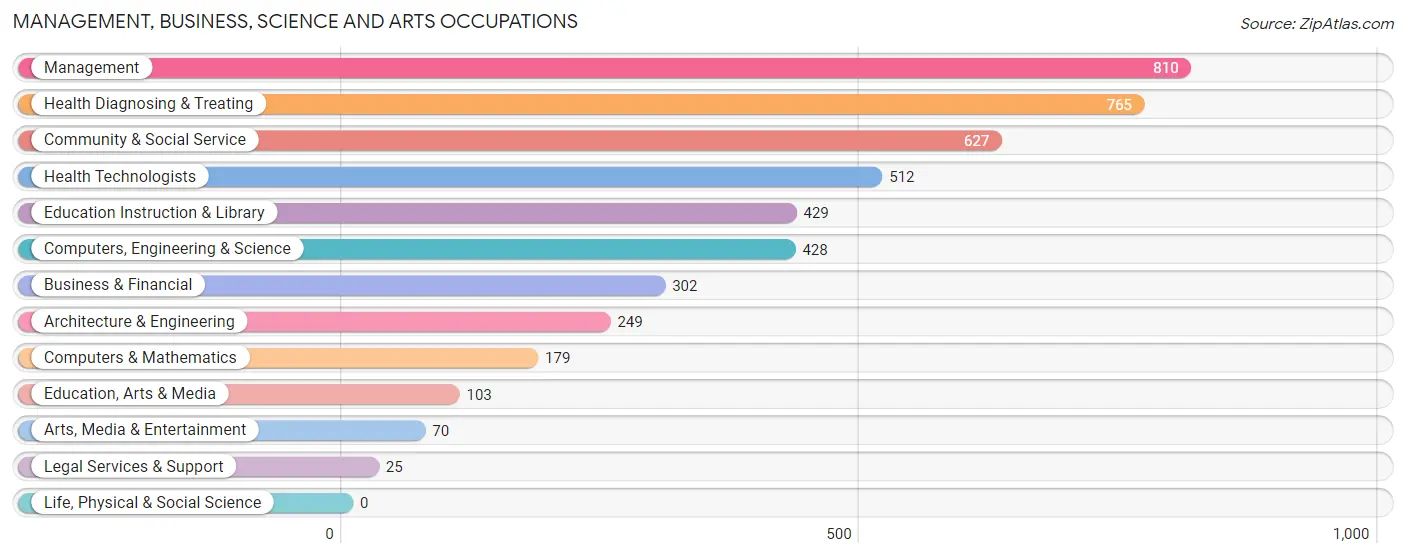
Management, Business, Science and Arts Occupations
The most common Management, Business, Science and Arts occupations in New Franklin are Management (810 | 10.9%), Health Diagnosing & Treating (765 | 10.3%), Community & Social Service (627 | 8.4%), Health Technologists (512 | 6.9%), and Education Instruction & Library (429 | 5.8%).
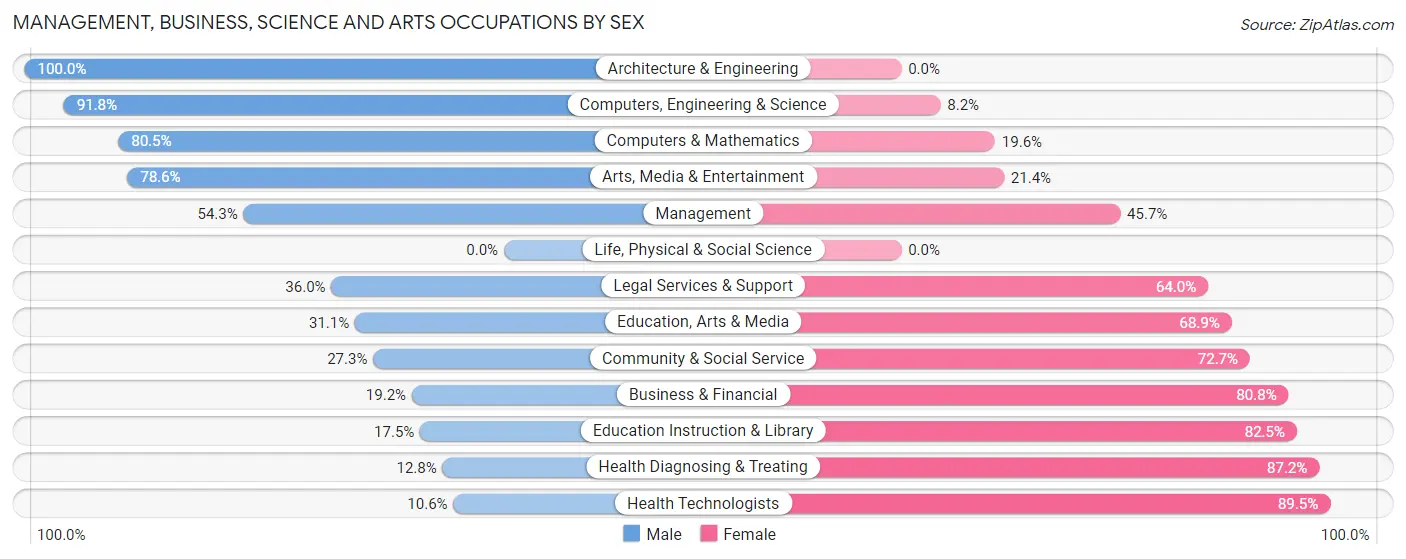
Management, Business, Science and Arts Occupations by Sex
Within the Management, Business, Science and Arts occupations in New Franklin, the most male-oriented occupations are Architecture & Engineering (100.0%), Computers, Engineering & Science (91.8%), and Computers & Mathematics (80.4%), while the most female-oriented occupations are Health Technologists (89.4%), Health Diagnosing & Treating (87.2%), and Education Instruction & Library (82.5%).
| Occupation | Male | Female |
| Management | 440 (54.3%) | 370 (45.7%) |
| Business & Financial | 58 (19.2%) | 244 (80.8%) |
| Computers, Engineering & Science | 393 (91.8%) | 35 (8.2%) |
| Computers & Mathematics | 144 (80.4%) | 35 (19.6%) |
| Architecture & Engineering | 249 (100.0%) | 0 (0.0%) |
| Life, Physical & Social Science | 0 (0.0%) | 0 (0.0%) |
| Community & Social Service | 171 (27.3%) | 456 (72.7%) |
| Education, Arts & Media | 32 (31.1%) | 71 (68.9%) |
| Legal Services & Support | 9 (36.0%) | 16 (64.0%) |
| Education Instruction & Library | 75 (17.5%) | 354 (82.5%) |
| Arts, Media & Entertainment | 55 (78.6%) | 15 (21.4%) |
| Health Diagnosing & Treating | 98 (12.8%) | 667 (87.2%) |
| Health Technologists | 54 (10.5%) | 458 (89.4%) |
| Total (Category) | 1,160 (39.6%) | 1,772 (60.4%) |
| Total (Overall) | 3,718 (50.0%) | 3,724 (50.0%) |
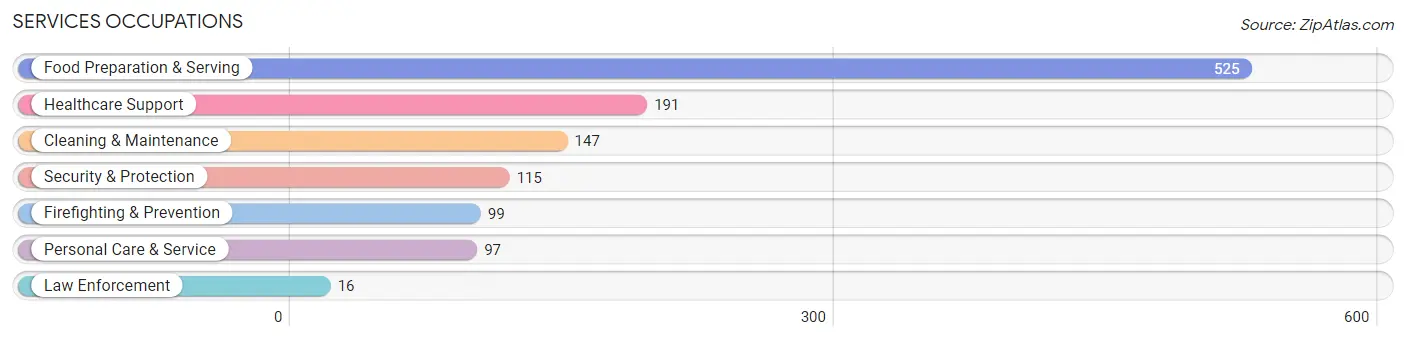
Services Occupations
The most common Services occupations in New Franklin are Food Preparation & Serving (525 | 7.0%), Healthcare Support (191 | 2.6%), Cleaning & Maintenance (147 | 2.0%), Security & Protection (115 | 1.5%), and Firefighting & Prevention (99 | 1.3%).
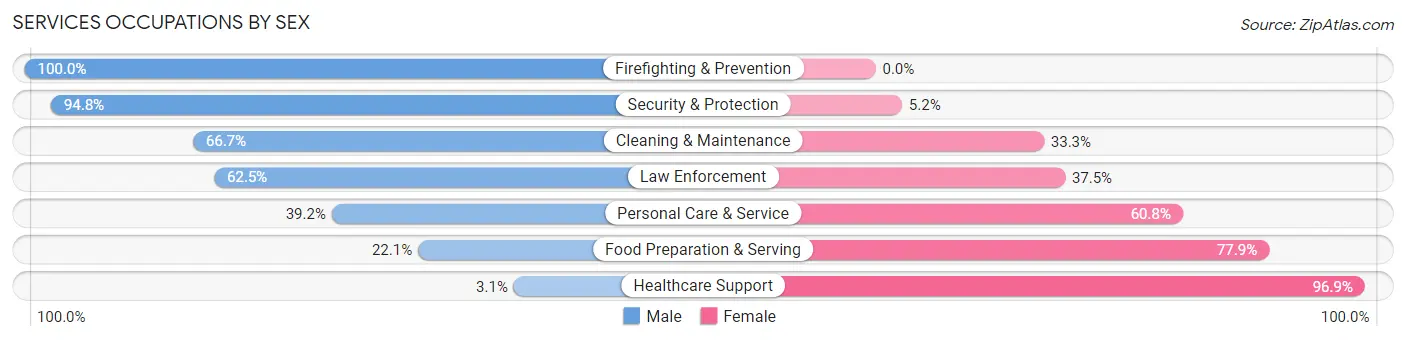
Services Occupations by Sex
Within the Services occupations in New Franklin, the most male-oriented occupations are Firefighting & Prevention (100.0%), Security & Protection (94.8%), and Cleaning & Maintenance (66.7%), while the most female-oriented occupations are Healthcare Support (96.9%), Food Preparation & Serving (77.9%), and Personal Care & Service (60.8%).
| Occupation | Male | Female |
| Healthcare Support | 6 (3.1%) | 185 (96.9%) |
| Security & Protection | 109 (94.8%) | 6 (5.2%) |
| Firefighting & Prevention | 99 (100.0%) | 0 (0.0%) |
| Law Enforcement | 10 (62.5%) | 6 (37.5%) |
| Food Preparation & Serving | 116 (22.1%) | 409 (77.9%) |
| Cleaning & Maintenance | 98 (66.7%) | 49 (33.3%) |
| Personal Care & Service | 38 (39.2%) | 59 (60.8%) |
| Total (Category) | 367 (34.1%) | 708 (65.9%) |
| Total (Overall) | 3,718 (50.0%) | 3,724 (50.0%) |
Sales and Office Occupations
The most common Sales and Office occupations in New Franklin are Office & Administration (938 | 12.6%), and Sales & Related (629 | 8.5%).

Sales and Office Occupations by Sex
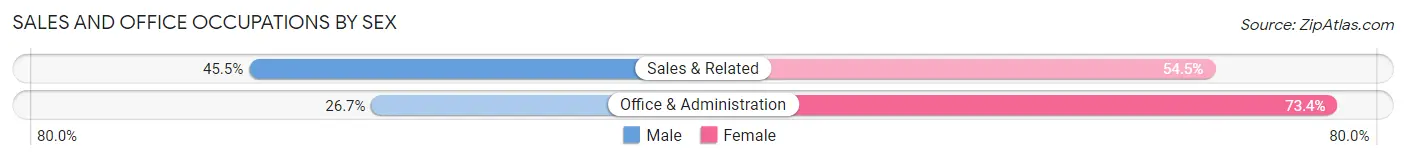
| Occupation | Male | Female |
| Sales & Related | 286 (45.5%) | 343 (54.5%) |
| Office & Administration | 250 (26.7%) | 688 (73.4%) |
| Total (Category) | 536 (34.2%) | 1,031 (65.8%) |
| Total (Overall) | 3,718 (50.0%) | 3,724 (50.0%) |
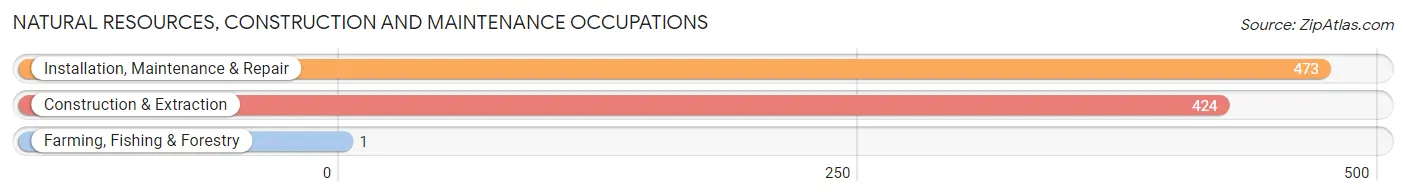
Natural Resources, Construction and Maintenance Occupations
The most common Natural Resources, Construction and Maintenance occupations in New Franklin are Installation, Maintenance & Repair (473 | 6.4%), Construction & Extraction (424 | 5.7%), and Farming, Fishing & Forestry (1 | 0.0%).
Natural Resources, Construction and Maintenance Occupations by Sex
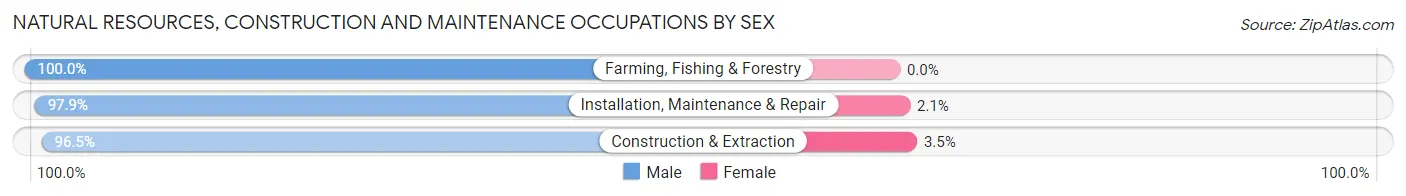
| Occupation | Male | Female |
| Farming, Fishing & Forestry | 1 (100.0%) | 0 (0.0%) |
| Construction & Extraction | 409 (96.5%) | 15 (3.5%) |
| Installation, Maintenance & Repair | 463 (97.9%) | 10 (2.1%) |
| Total (Category) | 873 (97.2%) | 25 (2.8%) |
| Total (Overall) | 3,718 (50.0%) | 3,724 (50.0%) |
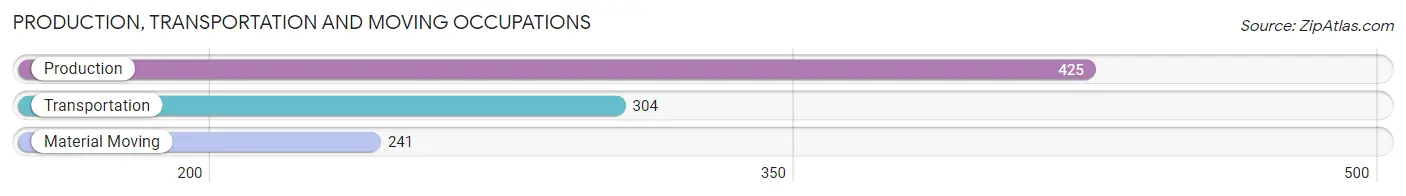
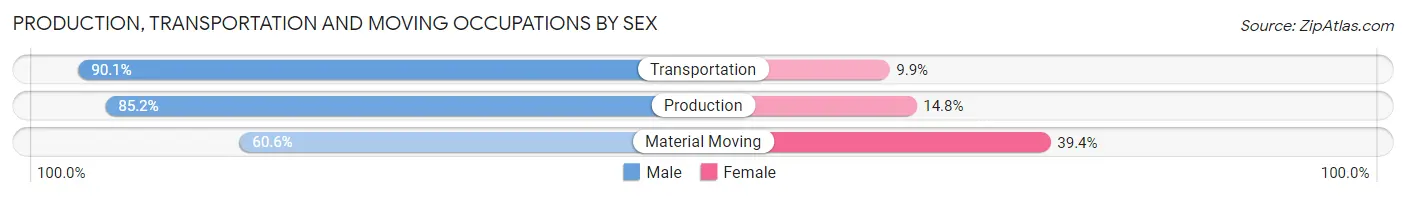
Production, Transportation and Moving Occupations
The most common Production, Transportation and Moving occupations in New Franklin are Production (425 | 5.7%), Transportation (304 | 4.1%), and Material Moving (241 | 3.2%).
Production, Transportation and Moving Occupations by Sex
| Occupation | Male | Female |
| Production | 362 (85.2%) | 63 (14.8%) |
| Transportation | 274 (90.1%) | 30 (9.9%) |
| Material Moving | 146 (60.6%) | 95 (39.4%) |
| Total (Category) | 782 (80.6%) | 188 (19.4%) |
| Total (Overall) | 3,718 (50.0%) | 3,724 (50.0%) |
Employment Industries by Sex in New Franklin
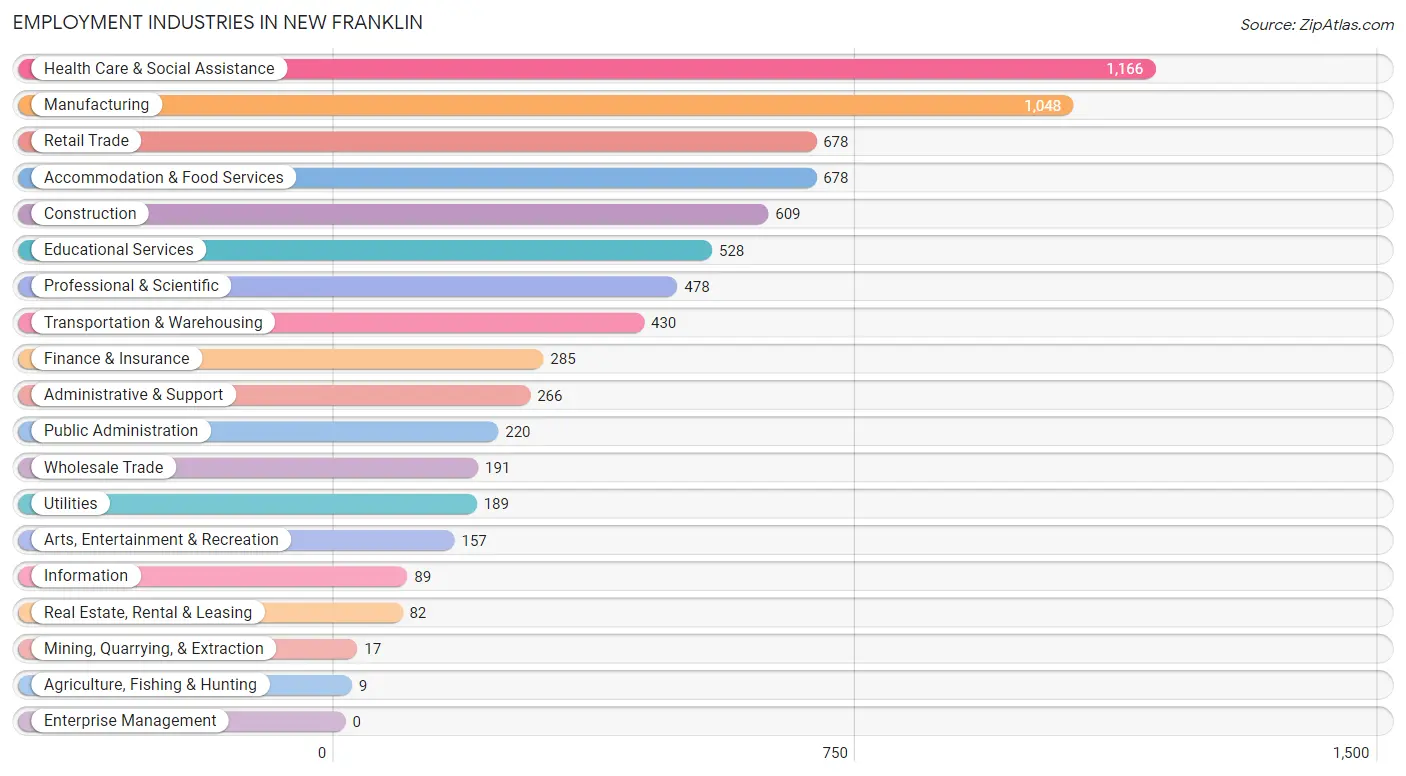
Employment Industries in New Franklin
The major employment industries in New Franklin include Health Care & Social Assistance (1,166 | 15.7%), Manufacturing (1,048 | 14.1%), Retail Trade (678 | 9.1%), Accommodation & Food Services (678 | 9.1%), and Construction (609 | 8.2%).
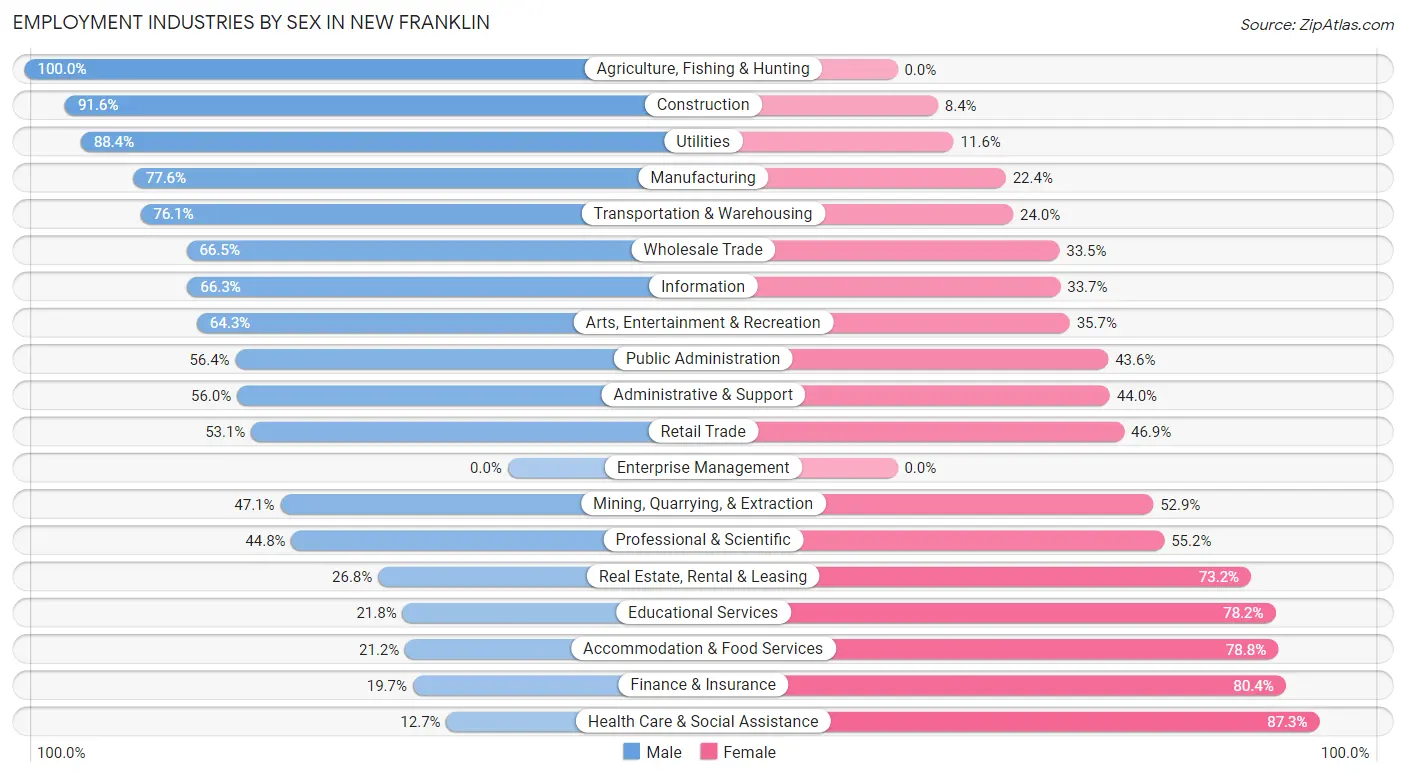
Employment Industries by Sex in New Franklin
The New Franklin industries that see more men than women are Agriculture, Fishing & Hunting (100.0%), Construction (91.6%), and Utilities (88.4%), whereas the industries that tend to have a higher number of women are Health Care & Social Assistance (87.3%), Finance & Insurance (80.3%), and Accommodation & Food Services (78.8%).
| Industry | Male | Female |
| Agriculture, Fishing & Hunting | 9 (100.0%) | 0 (0.0%) |
| Mining, Quarrying, & Extraction | 8 (47.1%) | 9 (52.9%) |
| Construction | 558 (91.6%) | 51 (8.4%) |
| Manufacturing | 813 (77.6%) | 235 (22.4%) |
| Wholesale Trade | 127 (66.5%) | 64 (33.5%) |
| Retail Trade | 360 (53.1%) | 318 (46.9%) |
| Transportation & Warehousing | 327 (76.0%) | 103 (23.9%) |
| Utilities | 167 (88.4%) | 22 (11.6%) |
| Information | 59 (66.3%) | 30 (33.7%) |
| Finance & Insurance | 56 (19.7%) | 229 (80.3%) |
| Real Estate, Rental & Leasing | 22 (26.8%) | 60 (73.2%) |
| Professional & Scientific | 214 (44.8%) | 264 (55.2%) |
| Enterprise Management | 0 (0.0%) | 0 (0.0%) |
| Administrative & Support | 149 (56.0%) | 117 (44.0%) |
| Educational Services | 115 (21.8%) | 413 (78.2%) |
| Health Care & Social Assistance | 148 (12.7%) | 1,018 (87.3%) |
| Arts, Entertainment & Recreation | 101 (64.3%) | 56 (35.7%) |
| Accommodation & Food Services | 144 (21.2%) | 534 (78.8%) |
| Public Administration | 124 (56.4%) | 96 (43.6%) |
| Total | 3,718 (50.0%) | 3,724 (50.0%) |
Education in New Franklin
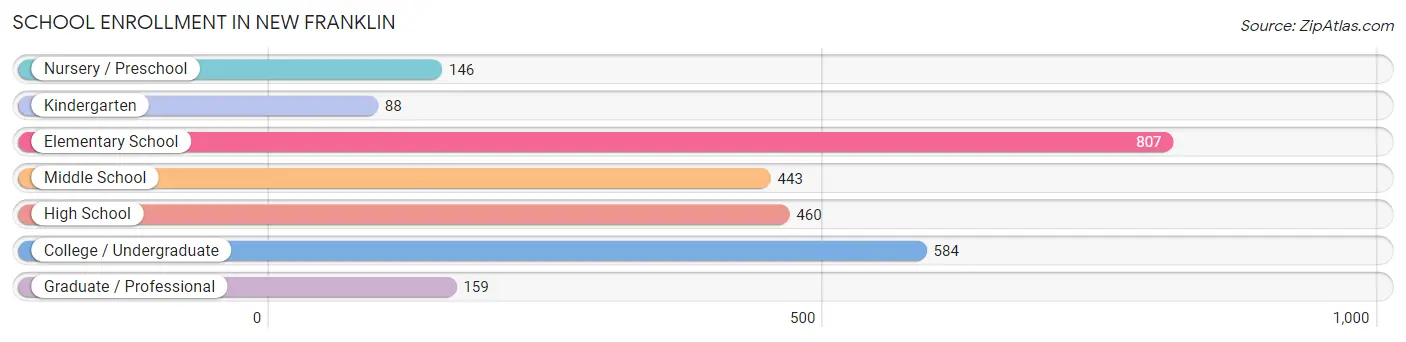
School Enrollment in New Franklin
The most common levels of schooling among the 2,687 students in New Franklin are elementary school (807 | 30.0%), college / undergraduate (584 | 21.7%), and high school (460 | 17.1%).
| School Level | # Students | % Students |
| Nursery / Preschool | 146 | 5.4% |
| Kindergarten | 88 | 3.3% |
| Elementary School | 807 | 30.0% |
| Middle School | 443 | 16.5% |
| High School | 460 | 17.1% |
| College / Undergraduate | 584 | 21.7% |
| Graduate / Professional | 159 | 5.9% |
| Total | 2,687 | 100.0% |
School Enrollment by Age by Funding Source in New Franklin
Out of a total of 2,687 students who are enrolled in schools in New Franklin, 419 (15.6%) attend a private institution, while the remaining 2,268 (84.4%) are enrolled in public schools. The age group of 3 to 4 year olds has the highest likelihood of being enrolled in private schools, with 56 (42.4% in the age bracket) enrolled. Conversely, the age group of 18 to 19 year olds has the lowest likelihood of being enrolled in a private school, with 167 (100.0% in the age bracket) attending a public institution.
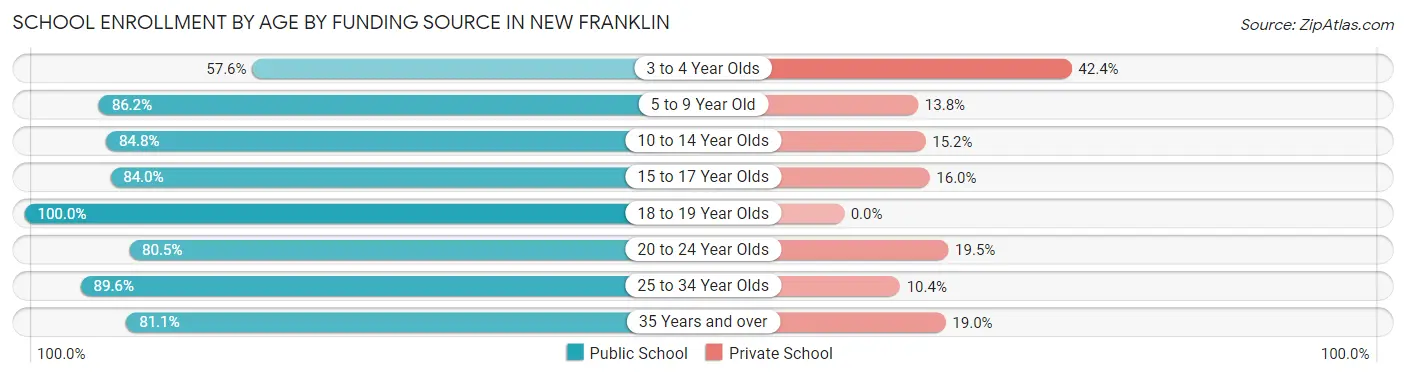
| Age Bracket | Public School | Private School |
| 3 to 4 Year Olds | 76 (57.6%) | 56 (42.4%) |
| 5 to 9 Year Old | 710 (86.2%) | 114 (13.8%) |
| 10 to 14 Year Olds | 463 (84.8%) | 83 (15.2%) |
| 15 to 17 Year Olds | 358 (84.0%) | 68 (16.0%) |
| 18 to 19 Year Olds | 167 (100.0%) | 0 (0.0%) |
| 20 to 24 Year Olds | 207 (80.5%) | 50 (19.5%) |
| 25 to 34 Year Olds | 163 (89.6%) | 19 (10.4%) |
| 35 Years and over | 124 (81.0%) | 29 (19.0%) |
| Total | 2,268 (84.4%) | 419 (15.6%) |
Educational Attainment by Field of Study in New Franklin
Business (504 | 19.7%), education (470 | 18.4%), science & technology (447 | 17.5%), arts & humanities (190 | 7.4%), and engineering (153 | 6.0%) are the most common fields of study among 2,555 individuals in New Franklin who have obtained a bachelor's degree or higher.
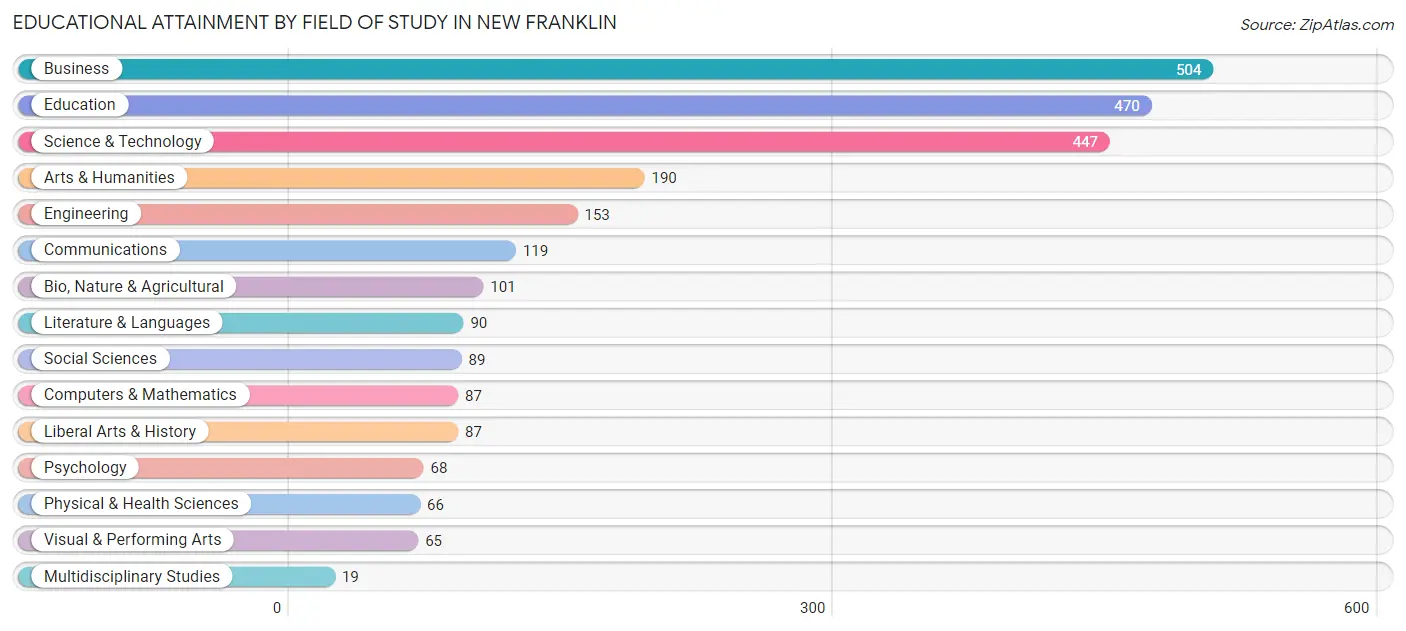
| Field of Study | # Graduates | % Graduates |
| Computers & Mathematics | 87 | 3.4% |
| Bio, Nature & Agricultural | 101 | 4.0% |
| Physical & Health Sciences | 66 | 2.6% |
| Psychology | 68 | 2.7% |
| Social Sciences | 89 | 3.5% |
| Engineering | 153 | 6.0% |
| Multidisciplinary Studies | 19 | 0.7% |
| Science & Technology | 447 | 17.5% |
| Business | 504 | 19.7% |
| Education | 470 | 18.4% |
| Literature & Languages | 90 | 3.5% |
| Liberal Arts & History | 87 | 3.4% |
| Visual & Performing Arts | 65 | 2.5% |
| Communications | 119 | 4.7% |
| Arts & Humanities | 190 | 7.4% |
| Total | 2,555 | 100.0% |
Transportation & Commute in New Franklin
Vehicle Availability by Sex in New Franklin
The most prevalent vehicle ownership categories in New Franklin are males with 3 vehicles (1,261, accounting for 33.9%) and females with 3 vehicles (1,318, making up 34.9%).
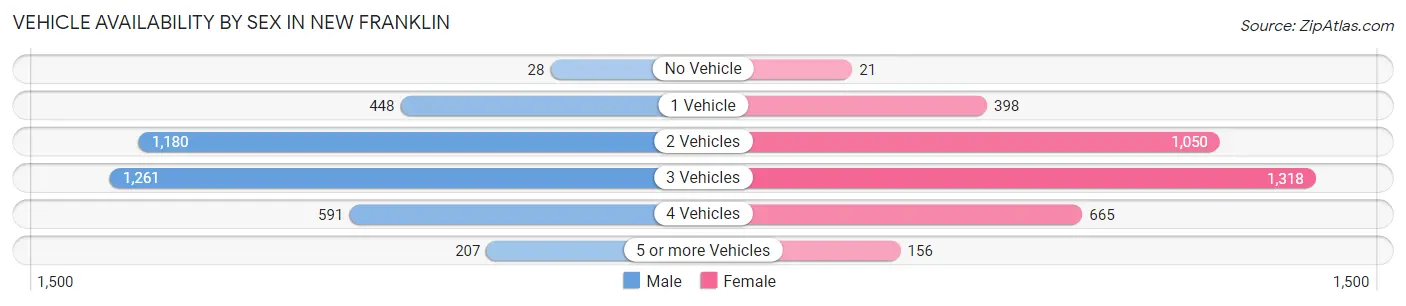
| Vehicles Available | Male | Female |
| No Vehicle | 28 (0.7%) | 21 (0.6%) |
| 1 Vehicle | 448 (12.1%) | 398 (11.0%) |
| 2 Vehicles | 1,180 (31.8%) | 1,050 (29.1%) |
| 3 Vehicles | 1,261 (33.9%) | 1,318 (36.5%) |
| 4 Vehicles | 591 (15.9%) | 665 (18.4%) |
| 5 or more Vehicles | 207 (5.6%) | 156 (4.3%) |
| Total | 3,715 (100.0%) | 3,608 (100.0%) |
Commute Time in New Franklin
The most frequently occuring commute durations in New Franklin are 20 to 24 minutes (1,046 commuters, 15.8%), 15 to 19 minutes (1,031 commuters, 15.5%), and 10 to 14 minutes (878 commuters, 13.2%).
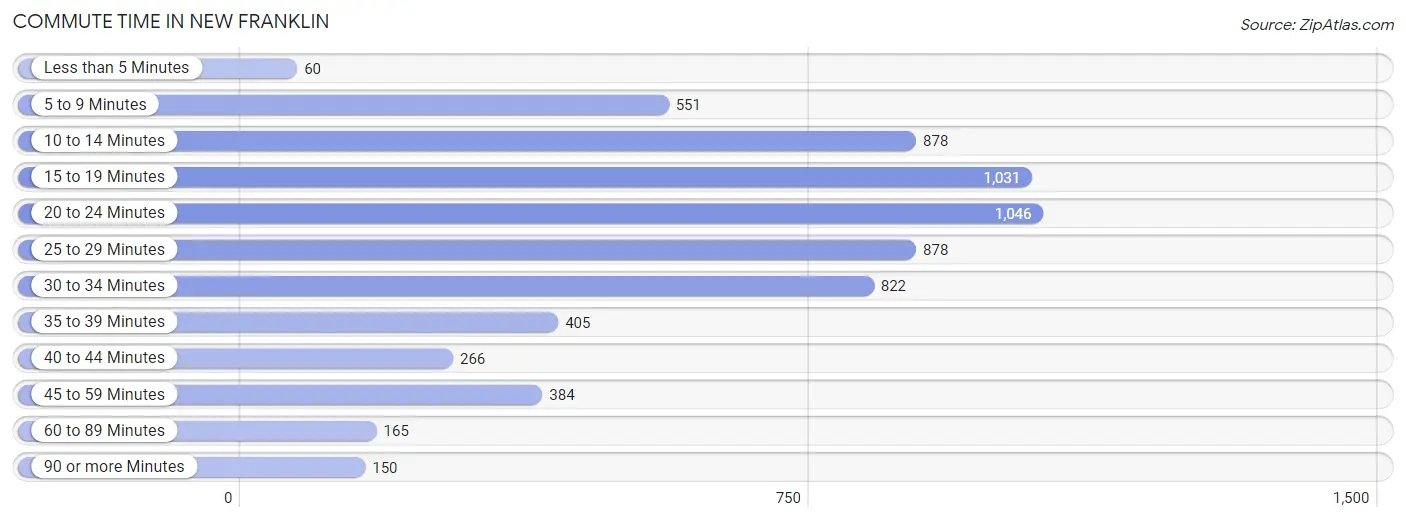
| Commute Time | # Commuters | % Commuters |
| Less than 5 Minutes | 60 | 0.9% |
| 5 to 9 Minutes | 551 | 8.3% |
| 10 to 14 Minutes | 878 | 13.2% |
| 15 to 19 Minutes | 1,031 | 15.5% |
| 20 to 24 Minutes | 1,046 | 15.8% |
| 25 to 29 Minutes | 878 | 13.2% |
| 30 to 34 Minutes | 822 | 12.4% |
| 35 to 39 Minutes | 405 | 6.1% |
| 40 to 44 Minutes | 266 | 4.0% |
| 45 to 59 Minutes | 384 | 5.8% |
| 60 to 89 Minutes | 165 | 2.5% |
| 90 or more Minutes | 150 | 2.3% |
Commute Time by Sex in New Franklin
The most common commute times in New Franklin are 15 to 19 minutes (550 commuters, 16.2%) for males and 20 to 24 minutes (563 commuters, 17.4%) for females.
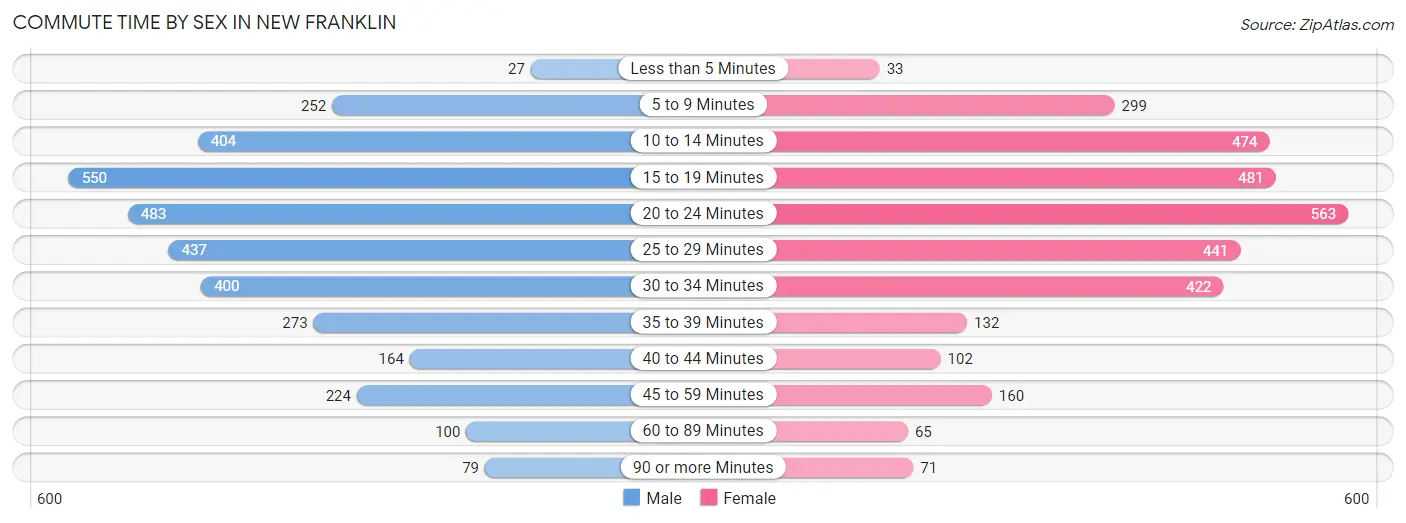
| Commute Time | Male | Female |
| Less than 5 Minutes | 27 (0.8%) | 33 (1.0%) |
| 5 to 9 Minutes | 252 (7.4%) | 299 (9.2%) |
| 10 to 14 Minutes | 404 (11.9%) | 474 (14.6%) |
| 15 to 19 Minutes | 550 (16.2%) | 481 (14.8%) |
| 20 to 24 Minutes | 483 (14.2%) | 563 (17.4%) |
| 25 to 29 Minutes | 437 (12.9%) | 441 (13.6%) |
| 30 to 34 Minutes | 400 (11.8%) | 422 (13.0%) |
| 35 to 39 Minutes | 273 (8.1%) | 132 (4.1%) |
| 40 to 44 Minutes | 164 (4.8%) | 102 (3.2%) |
| 45 to 59 Minutes | 224 (6.6%) | 160 (4.9%) |
| 60 to 89 Minutes | 100 (2.9%) | 65 (2.0%) |
| 90 or more Minutes | 79 (2.3%) | 71 (2.2%) |
Time of Departure to Work by Sex in New Franklin
The most frequent times of departure to work in New Franklin are 7:00 AM to 7:29 AM (470, 13.9%) for males and 7:30 AM to 7:59 AM (578, 17.8%) for females.
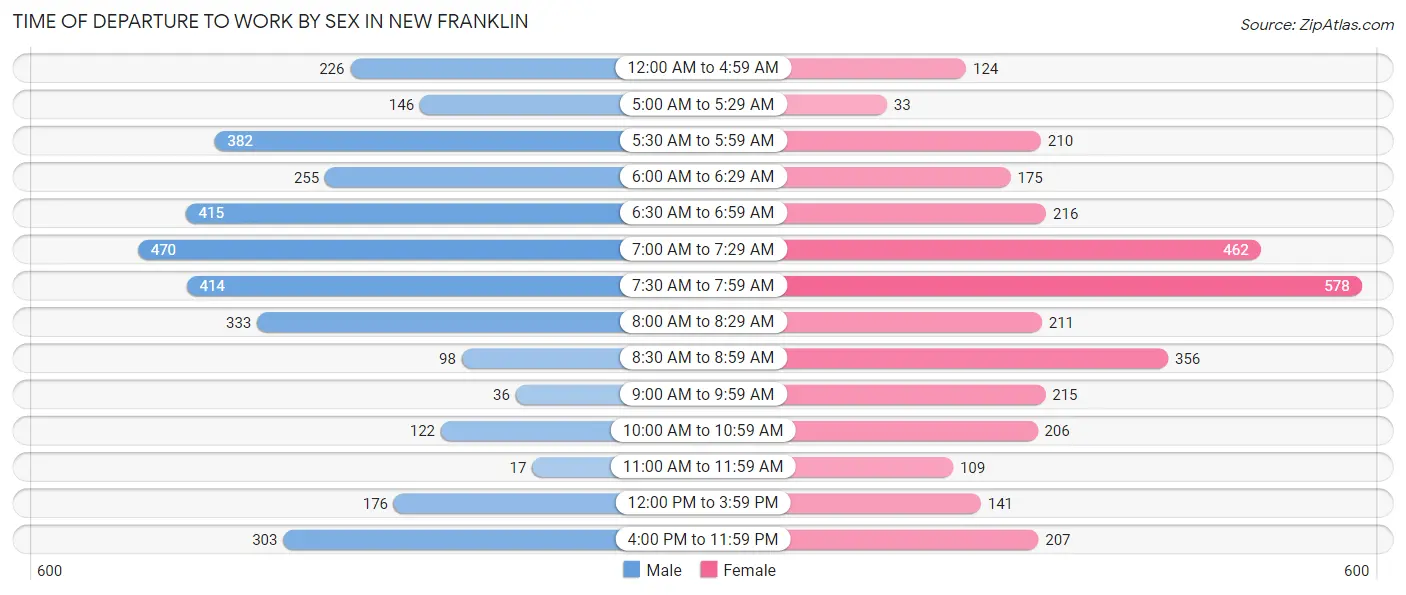
| Time of Departure | Male | Female |
| 12:00 AM to 4:59 AM | 226 (6.7%) | 124 (3.8%) |
| 5:00 AM to 5:29 AM | 146 (4.3%) | 33 (1.0%) |
| 5:30 AM to 5:59 AM | 382 (11.3%) | 210 (6.5%) |
| 6:00 AM to 6:29 AM | 255 (7.5%) | 175 (5.4%) |
| 6:30 AM to 6:59 AM | 415 (12.2%) | 216 (6.7%) |
| 7:00 AM to 7:29 AM | 470 (13.9%) | 462 (14.2%) |
| 7:30 AM to 7:59 AM | 414 (12.2%) | 578 (17.8%) |
| 8:00 AM to 8:29 AM | 333 (9.8%) | 211 (6.5%) |
| 8:30 AM to 8:59 AM | 98 (2.9%) | 356 (11.0%) |
| 9:00 AM to 9:59 AM | 36 (1.1%) | 215 (6.6%) |
| 10:00 AM to 10:59 AM | 122 (3.6%) | 206 (6.4%) |
| 11:00 AM to 11:59 AM | 17 (0.5%) | 109 (3.4%) |
| 12:00 PM to 3:59 PM | 176 (5.2%) | 141 (4.3%) |
| 4:00 PM to 11:59 PM | 303 (8.9%) | 207 (6.4%) |
| Total | 3,393 (100.0%) | 3,243 (100.0%) |
Housing Occupancy in New Franklin
Occupancy by Ownership in New Franklin
Of the total 5,643 dwellings in New Franklin, owner-occupied units account for 4,933 (87.4%), while renter-occupied units make up 710 (12.6%).
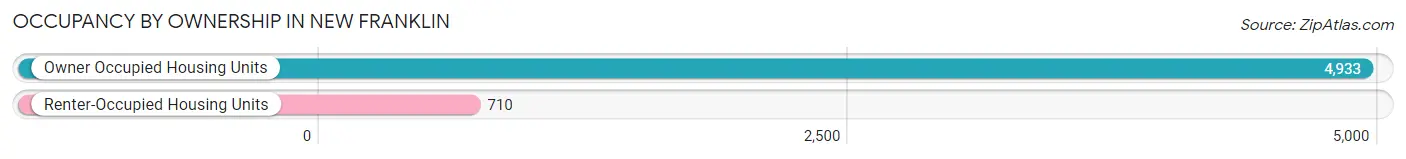
| Occupancy | # Housing Units | % Housing Units |
| Owner Occupied Housing Units | 4,933 | 87.4% |
| Renter-Occupied Housing Units | 710 | 12.6% |
| Total Occupied Housing Units | 5,643 | 100.0% |
Occupancy by Household Size in New Franklin
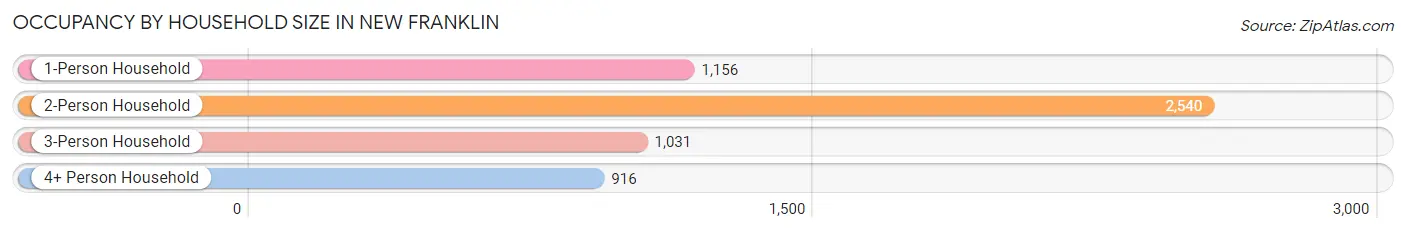
| Household Size | # Housing Units | % Housing Units |
| 1-Person Household | 1,156 | 20.5% |
| 2-Person Household | 2,540 | 45.0% |
| 3-Person Household | 1,031 | 18.3% |
| 4+ Person Household | 916 | 16.2% |
| Total Housing Units | 5,643 | 100.0% |
Occupancy by Ownership by Household Size in New Franklin
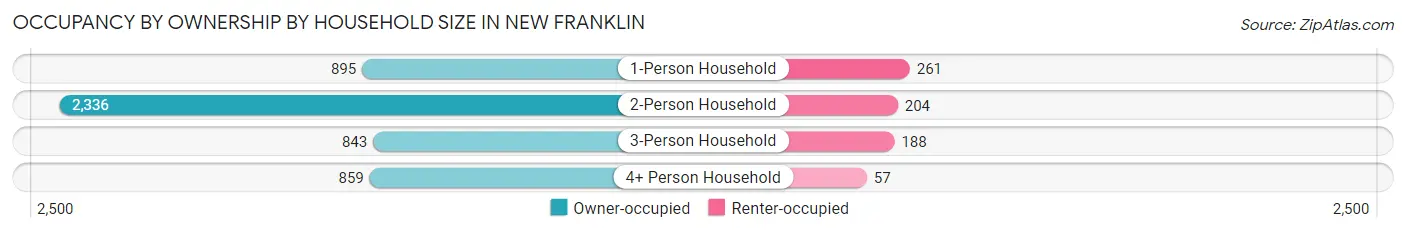
| Household Size | Owner-occupied | Renter-occupied |
| 1-Person Household | 895 (77.4%) | 261 (22.6%) |
| 2-Person Household | 2,336 (92.0%) | 204 (8.0%) |
| 3-Person Household | 843 (81.8%) | 188 (18.2%) |
| 4+ Person Household | 859 (93.8%) | 57 (6.2%) |
| Total Housing Units | 4,933 (87.4%) | 710 (12.6%) |
Occupancy by Educational Attainment in New Franklin
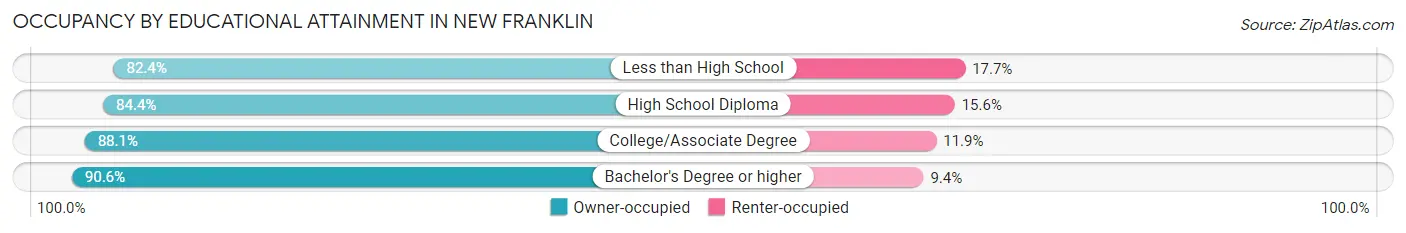
| Household Size | Owner-occupied | Renter-occupied |
| Less than High School | 84 (82.4%) | 18 (17.6%) |
| High School Diploma | 1,544 (84.4%) | 285 (15.6%) |
| College/Associate Degree | 2,040 (88.1%) | 276 (11.9%) |
| Bachelor's Degree or higher | 1,265 (90.6%) | 131 (9.4%) |
Occupancy by Age of Householder in New Franklin
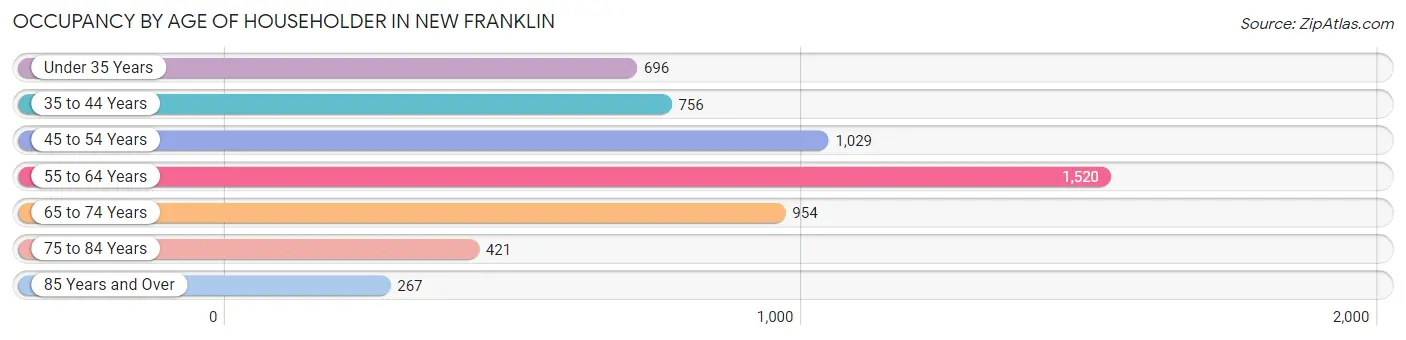
| Age Bracket | # Households | % Households |
| Under 35 Years | 696 | 12.3% |
| 35 to 44 Years | 756 | 13.4% |
| 45 to 54 Years | 1,029 | 18.2% |
| 55 to 64 Years | 1,520 | 26.9% |
| 65 to 74 Years | 954 | 16.9% |
| 75 to 84 Years | 421 | 7.5% |
| 85 Years and Over | 267 | 4.7% |
| Total | 5,643 | 100.0% |
Housing Finances in New Franklin
Median Income by Occupancy in New Franklin
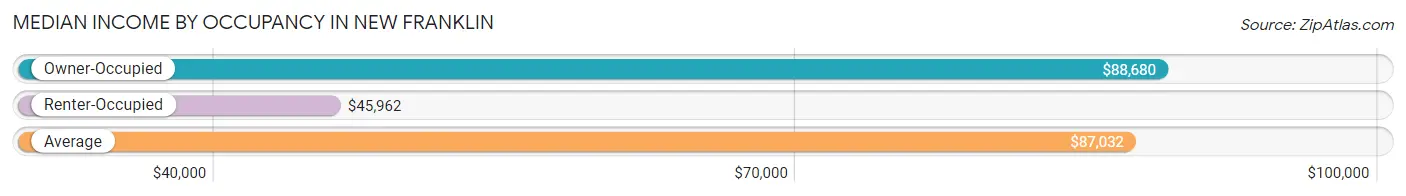
| Occupancy Type | # Households | Median Income |
| Owner-Occupied | 4,933 (87.4%) | $88,680 |
| Renter-Occupied | 710 (12.6%) | $45,962 |
| Average | 5,643 (100.0%) | $87,032 |
Occupancy by Householder Income Bracket in New Franklin
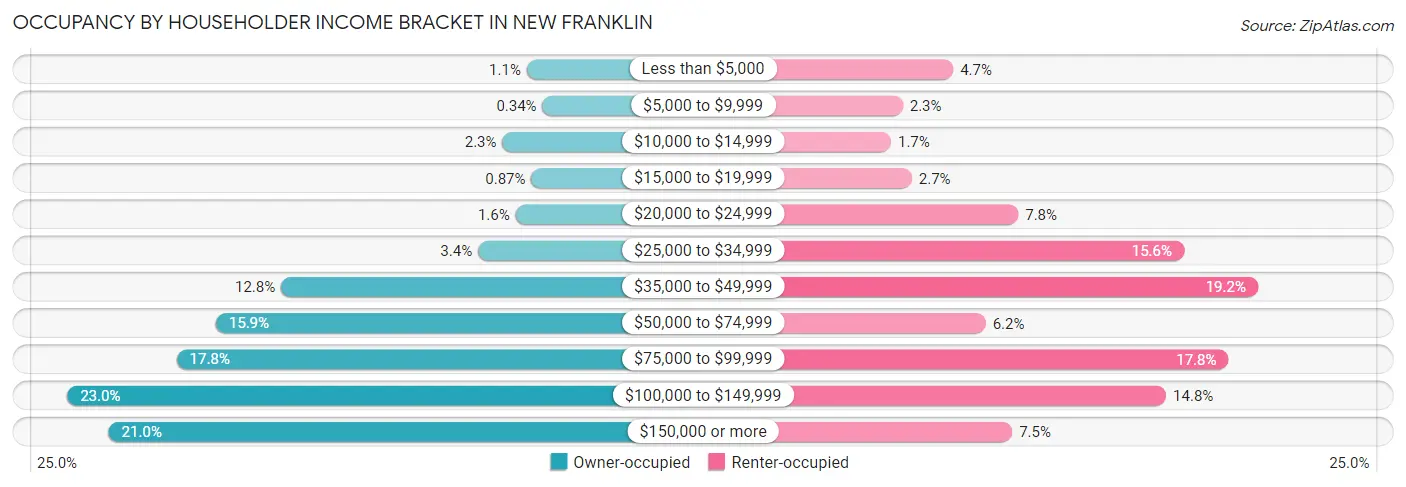
| Income Bracket | Owner-occupied | Renter-occupied |
| Less than $5,000 | 54 (1.1%) | 33 (4.6%) |
| $5,000 to $9,999 | 17 (0.3%) | 16 (2.2%) |
| $10,000 to $14,999 | 111 (2.2%) | 12 (1.7%) |
| $15,000 to $19,999 | 43 (0.9%) | 19 (2.7%) |
| $20,000 to $24,999 | 80 (1.6%) | 55 (7.7%) |
| $25,000 to $34,999 | 168 (3.4%) | 111 (15.6%) |
| $35,000 to $49,999 | 631 (12.8%) | 136 (19.2%) |
| $50,000 to $74,999 | 784 (15.9%) | 44 (6.2%) |
| $75,000 to $99,999 | 876 (17.8%) | 126 (17.7%) |
| $100,000 to $149,999 | 1,133 (23.0%) | 105 (14.8%) |
| $150,000 or more | 1,036 (21.0%) | 53 (7.5%) |
| Total | 4,933 (100.0%) | 710 (100.0%) |
Monthly Housing Cost Tiers in New Franklin
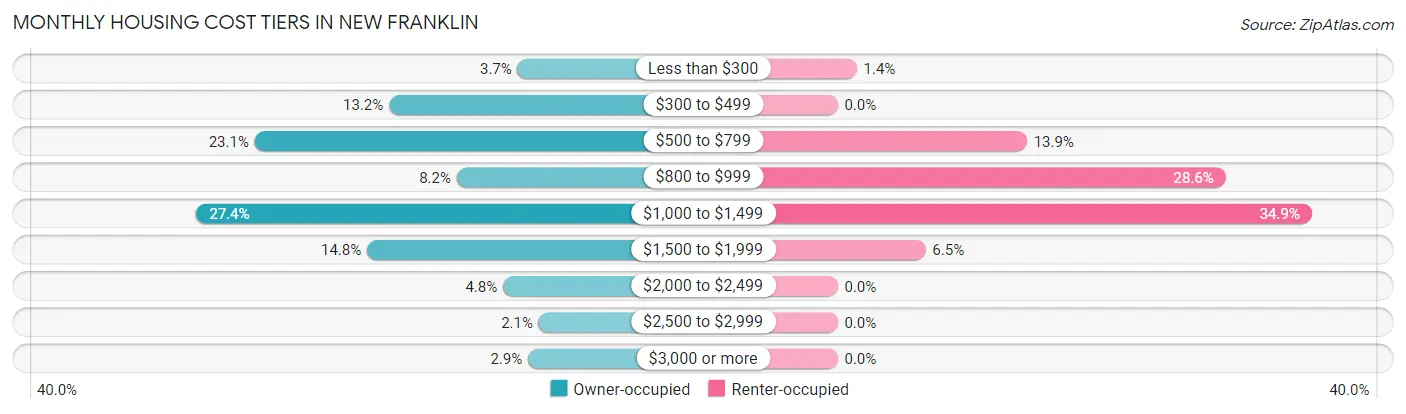
| Monthly Cost | Owner-occupied | Renter-occupied |
| Less than $300 | 182 (3.7%) | 10 (1.4%) |
| $300 to $499 | 649 (13.2%) | 0 (0.0%) |
| $500 to $799 | 1,137 (23.1%) | 99 (13.9%) |
| $800 to $999 | 403 (8.2%) | 203 (28.6%) |
| $1,000 to $1,499 | 1,349 (27.4%) | 248 (34.9%) |
| $1,500 to $1,999 | 729 (14.8%) | 46 (6.5%) |
| $2,000 to $2,499 | 235 (4.8%) | 0 (0.0%) |
| $2,500 to $2,999 | 105 (2.1%) | 0 (0.0%) |
| $3,000 or more | 144 (2.9%) | 0 (0.0%) |
| Total | 4,933 (100.0%) | 710 (100.0%) |
Physical Housing Characteristics in New Franklin
Housing Structures in New Franklin
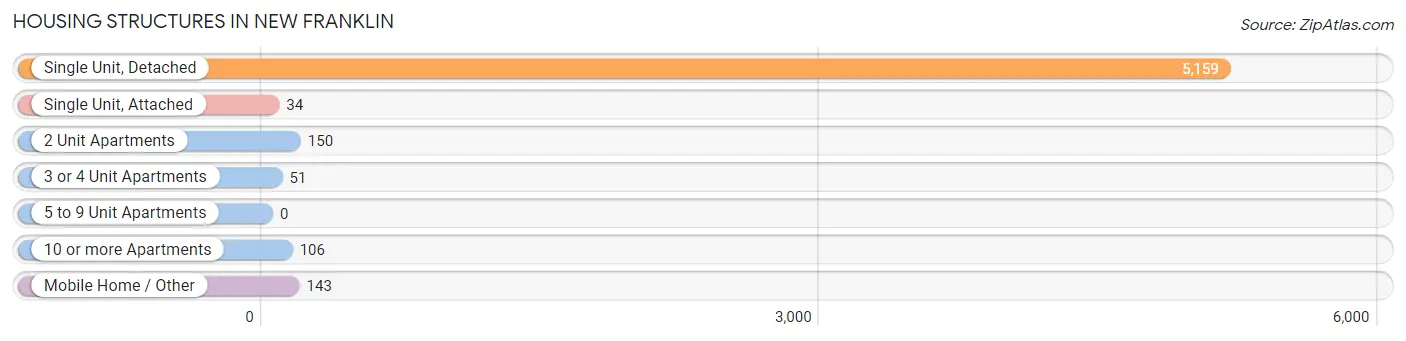
| Structure Type | # Housing Units | % Housing Units |
| Single Unit, Detached | 5,159 | 91.4% |
| Single Unit, Attached | 34 | 0.6% |
| 2 Unit Apartments | 150 | 2.7% |
| 3 or 4 Unit Apartments | 51 | 0.9% |
| 5 to 9 Unit Apartments | 0 | 0.0% |
| 10 or more Apartments | 106 | 1.9% |
| Mobile Home / Other | 143 | 2.5% |
| Total | 5,643 | 100.0% |
Housing Structures by Occupancy in New Franklin
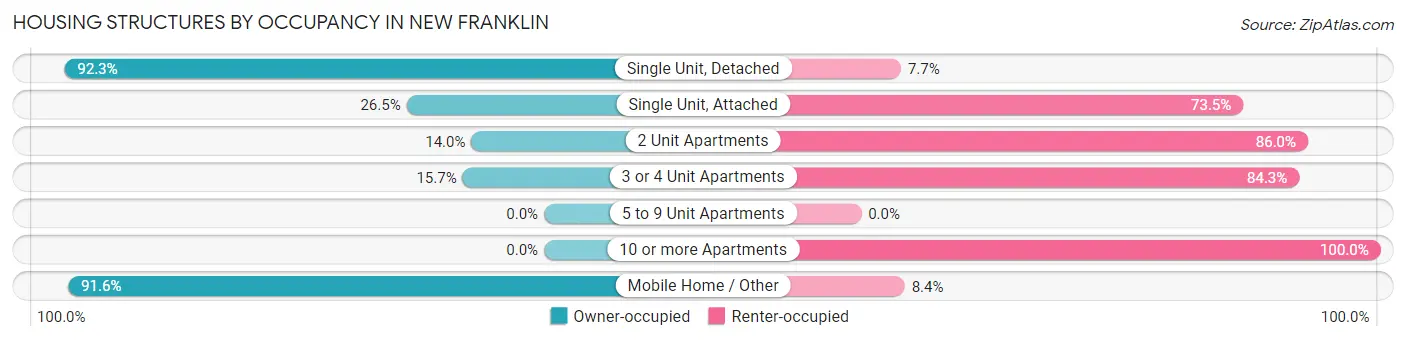
| Structure Type | Owner-occupied | Renter-occupied |
| Single Unit, Detached | 4,764 (92.3%) | 395 (7.7%) |
| Single Unit, Attached | 9 (26.5%) | 25 (73.5%) |
| 2 Unit Apartments | 21 (14.0%) | 129 (86.0%) |
| 3 or 4 Unit Apartments | 8 (15.7%) | 43 (84.3%) |
| 5 to 9 Unit Apartments | 0 (0.0%) | 0 (0.0%) |
| 10 or more Apartments | 0 (0.0%) | 106 (100.0%) |
| Mobile Home / Other | 131 (91.6%) | 12 (8.4%) |
| Total | 4,933 (87.4%) | 710 (12.6%) |
Housing Structures by Number of Rooms in New Franklin
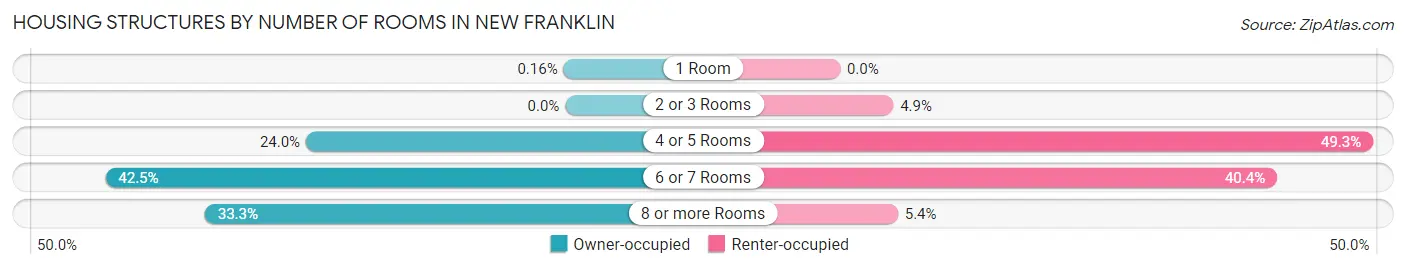
| Number of Rooms | Owner-occupied | Renter-occupied |
| 1 Room | 8 (0.2%) | 0 (0.0%) |
| 2 or 3 Rooms | 0 (0.0%) | 35 (4.9%) |
| 4 or 5 Rooms | 1,183 (24.0%) | 350 (49.3%) |
| 6 or 7 Rooms | 2,098 (42.5%) | 287 (40.4%) |
| 8 or more Rooms | 1,644 (33.3%) | 38 (5.3%) |
| Total | 4,933 (100.0%) | 710 (100.0%) |
Housing Structure by Heating Type in New Franklin
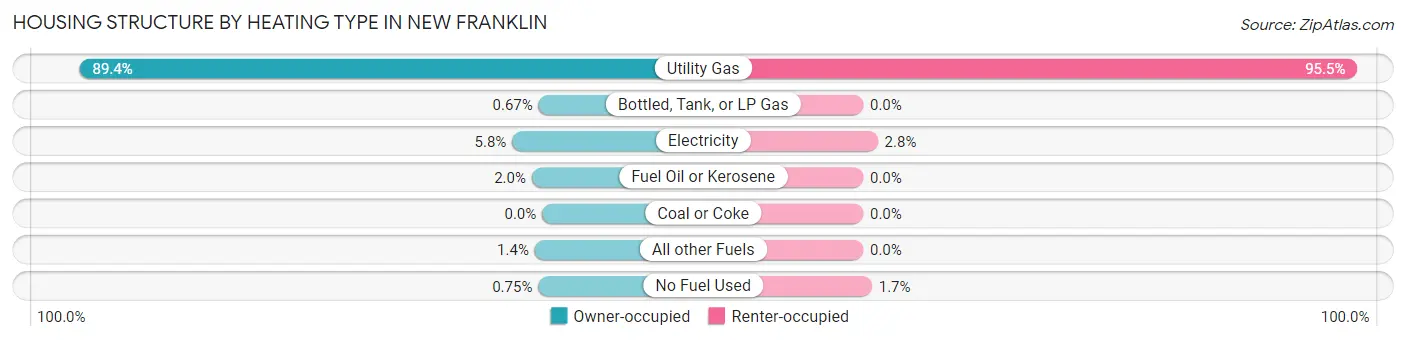
| Heating Type | Owner-occupied | Renter-occupied |
| Utility Gas | 4,410 (89.4%) | 678 (95.5%) |
| Bottled, Tank, or LP Gas | 33 (0.7%) | 0 (0.0%) |
| Electricity | 285 (5.8%) | 20 (2.8%) |
| Fuel Oil or Kerosene | 98 (2.0%) | 0 (0.0%) |
| Coal or Coke | 0 (0.0%) | 0 (0.0%) |
| All other Fuels | 70 (1.4%) | 0 (0.0%) |
| No Fuel Used | 37 (0.7%) | 12 (1.7%) |
| Total | 4,933 (100.0%) | 710 (100.0%) |
Household Vehicle Usage in New Franklin
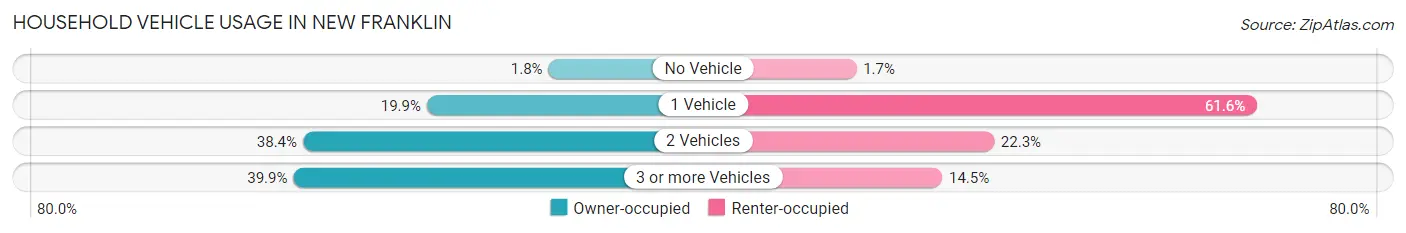
| Vehicles per Household | Owner-occupied | Renter-occupied |
| No Vehicle | 87 (1.8%) | 12 (1.7%) |
| 1 Vehicle | 983 (19.9%) | 437 (61.6%) |
| 2 Vehicles | 1,896 (38.4%) | 158 (22.3%) |
| 3 or more Vehicles | 1,967 (39.9%) | 103 (14.5%) |
| Total | 4,933 (100.0%) | 710 (100.0%) |
Real Estate & Mortgages in New Franklin
Real Estate and Mortgage Overview in New Franklin
| Characteristic | Without Mortgage | With Mortgage |
| Housing Units | 2,016 | 2,917 |
| Median Property Value | $182,400 | $185,800 |
| Median Household Income | $75,849 | $648 |
| Monthly Housing Costs | $556 | $144 |
| Real Estate Taxes | $3,031 | $38 |
Property Value by Mortgage Status in New Franklin
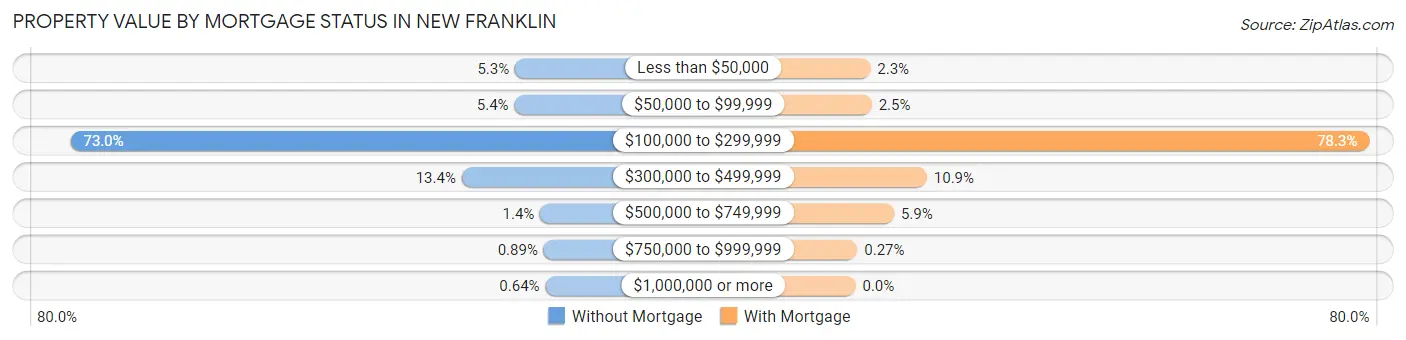
| Property Value | Without Mortgage | With Mortgage |
| Less than $50,000 | 106 (5.3%) | 66 (2.3%) |
| $50,000 to $99,999 | 108 (5.4%) | 72 (2.5%) |
| $100,000 to $299,999 | 1,472 (73.0%) | 2,283 (78.3%) |
| $300,000 to $499,999 | 270 (13.4%) | 317 (10.9%) |
| $500,000 to $749,999 | 29 (1.4%) | 171 (5.9%) |
| $750,000 to $999,999 | 18 (0.9%) | 8 (0.3%) |
| $1,000,000 or more | 13 (0.6%) | 0 (0.0%) |
| Total | 2,016 (100.0%) | 2,917 (100.0%) |
Household Income by Mortgage Status in New Franklin
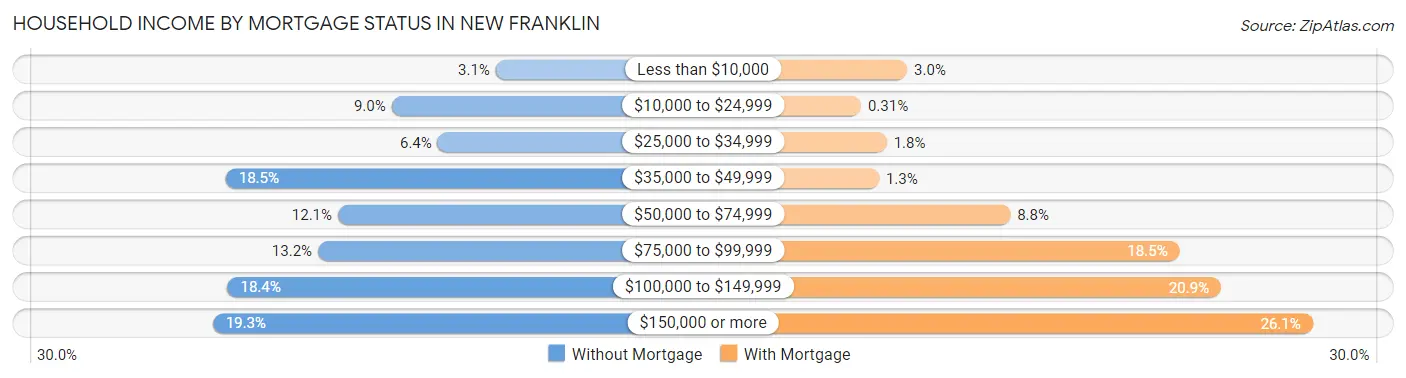
| Household Income | Without Mortgage | With Mortgage |
| Less than $10,000 | 62 (3.1%) | 86 (2.9%) |
| $10,000 to $24,999 | 182 (9.0%) | 9 (0.3%) |
| $25,000 to $34,999 | 129 (6.4%) | 52 (1.8%) |
| $35,000 to $49,999 | 373 (18.5%) | 39 (1.3%) |
| $50,000 to $74,999 | 244 (12.1%) | 258 (8.8%) |
| $75,000 to $99,999 | 267 (13.2%) | 540 (18.5%) |
| $100,000 to $149,999 | 371 (18.4%) | 609 (20.9%) |
| $150,000 or more | 388 (19.3%) | 762 (26.1%) |
| Total | 2,016 (100.0%) | 2,917 (100.0%) |
Property Value to Household Income Ratio in New Franklin
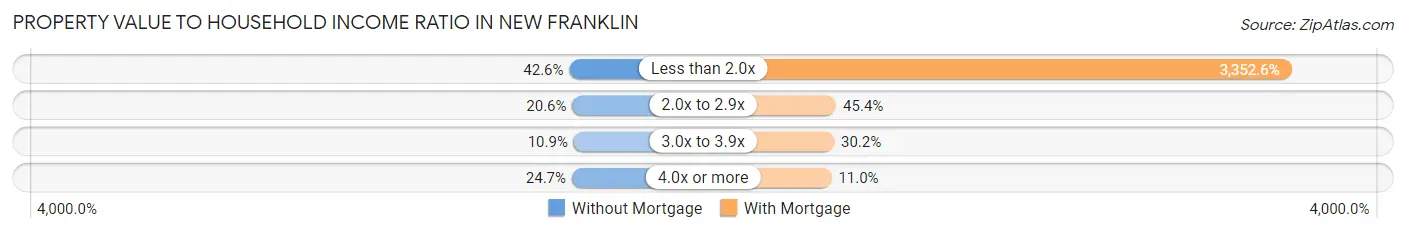
| Value-to-Income Ratio | Without Mortgage | With Mortgage |
| Less than 2.0x | 858 (42.6%) | 97,795 (3,352.6%) |
| 2.0x to 2.9x | 415 (20.6%) | 1,324 (45.4%) |
| 3.0x to 3.9x | 219 (10.9%) | 880 (30.2%) |
| 4.0x or more | 497 (24.6%) | 322 (11.0%) |
| Total | 2,016 (100.0%) | 2,917 (100.0%) |
Real Estate Taxes by Mortgage Status in New Franklin
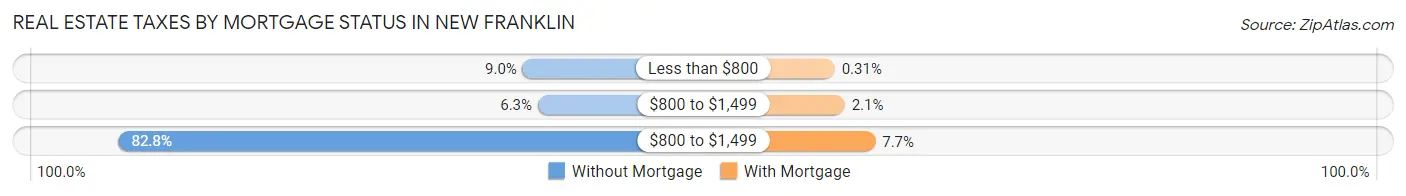
| Property Taxes | Without Mortgage | With Mortgage |
| Less than $800 | 182 (9.0%) | 9 (0.3%) |
| $800 to $1,499 | 126 (6.2%) | 62 (2.1%) |
| $800 to $1,499 | 1,670 (82.8%) | 225 (7.7%) |
| Total | 2,016 (100.0%) | 2,917 (100.0%) |
Health & Disability in New Franklin
Health Insurance Coverage by Age in New Franklin
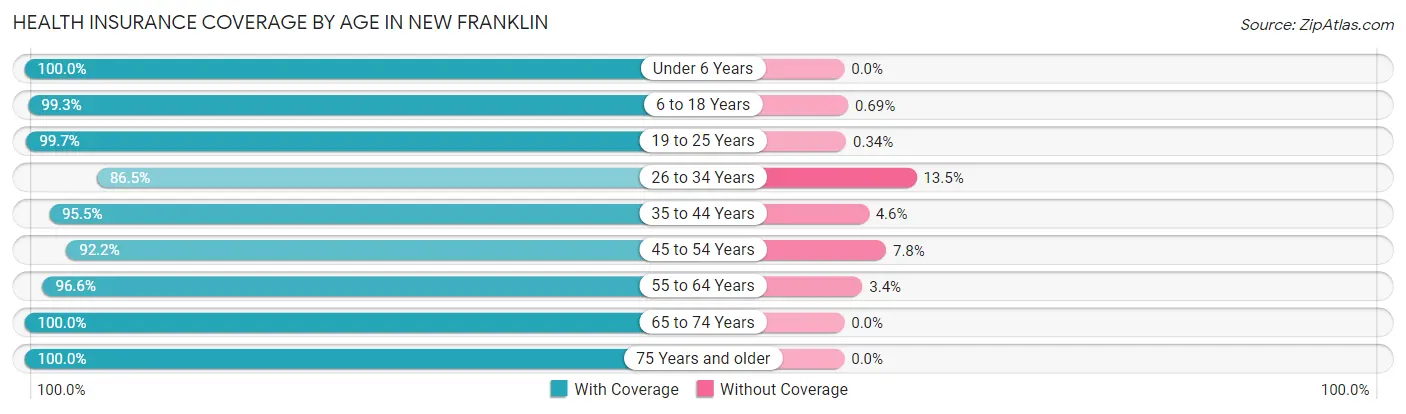
| Age Bracket | With Coverage | Without Coverage |
| Under 6 Years | 718 (100.0%) | 0 (0.0%) |
| 6 to 18 Years | 1,867 (99.3%) | 13 (0.7%) |
| 19 to 25 Years | 888 (99.7%) | 3 (0.3%) |
| 26 to 34 Years | 1,273 (86.5%) | 198 (13.5%) |
| 35 to 44 Years | 1,342 (95.5%) | 64 (4.5%) |
| 45 to 54 Years | 1,850 (92.2%) | 156 (7.8%) |
| 55 to 64 Years | 2,448 (96.6%) | 85 (3.4%) |
| 65 to 74 Years | 1,707 (100.0%) | 0 (0.0%) |
| 75 Years and older | 1,175 (100.0%) | 0 (0.0%) |
| Total | 13,268 (96.2%) | 519 (3.8%) |
Health Insurance Coverage by Citizenship Status in New Franklin
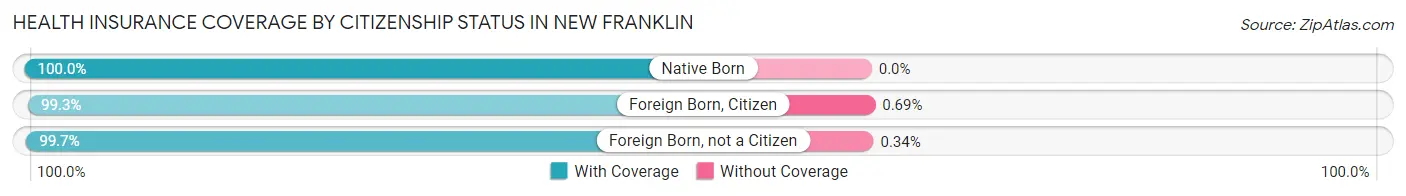
| Citizenship Status | With Coverage | Without Coverage |
| Native Born | 718 (100.0%) | 0 (0.0%) |
| Foreign Born, Citizen | 1,867 (99.3%) | 13 (0.7%) |
| Foreign Born, not a Citizen | 888 (99.7%) | 3 (0.3%) |
Health Insurance Coverage by Household Income in New Franklin
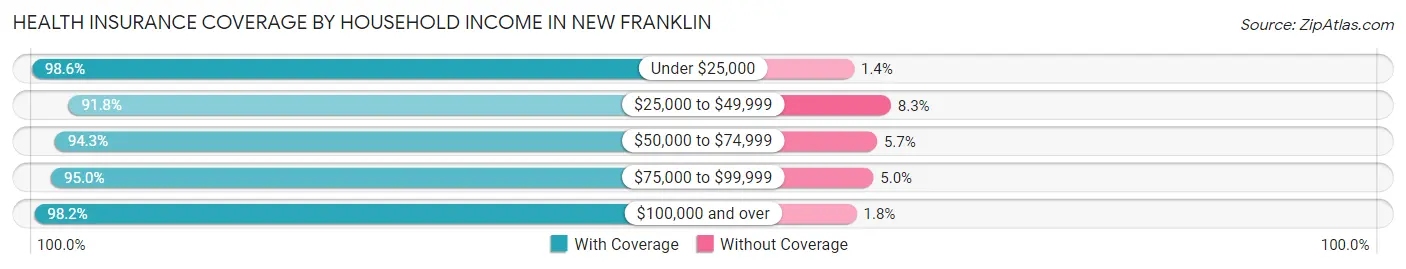
| Household Income | With Coverage | Without Coverage |
| Under $25,000 | 654 (98.6%) | 9 (1.4%) |
| $25,000 to $49,999 | 1,712 (91.7%) | 154 (8.3%) |
| $50,000 to $74,999 | 1,750 (94.3%) | 105 (5.7%) |
| $75,000 to $99,999 | 2,410 (95.0%) | 126 (5.0%) |
| $100,000 and over | 6,715 (98.2%) | 125 (1.8%) |
Public vs Private Health Insurance Coverage by Age in New Franklin
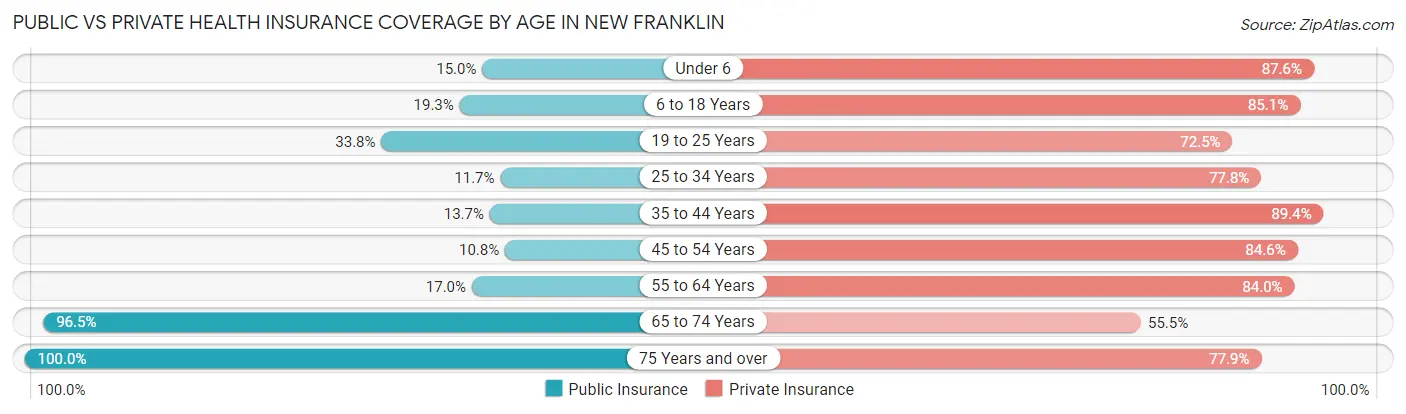
| Age Bracket | Public Insurance | Private Insurance |
| Under 6 | 108 (15.0%) | 629 (87.6%) |
| 6 to 18 Years | 362 (19.3%) | 1,599 (85.1%) |
| 19 to 25 Years | 301 (33.8%) | 646 (72.5%) |
| 25 to 34 Years | 172 (11.7%) | 1,145 (77.8%) |
| 35 to 44 Years | 192 (13.7%) | 1,257 (89.4%) |
| 45 to 54 Years | 217 (10.8%) | 1,697 (84.6%) |
| 55 to 64 Years | 430 (17.0%) | 2,128 (84.0%) |
| 65 to 74 Years | 1,648 (96.5%) | 948 (55.5%) |
| 75 Years and over | 1,175 (100.0%) | 915 (77.9%) |
| Total | 4,605 (33.4%) | 10,964 (79.5%) |
Disability Status by Sex by Age in New Franklin
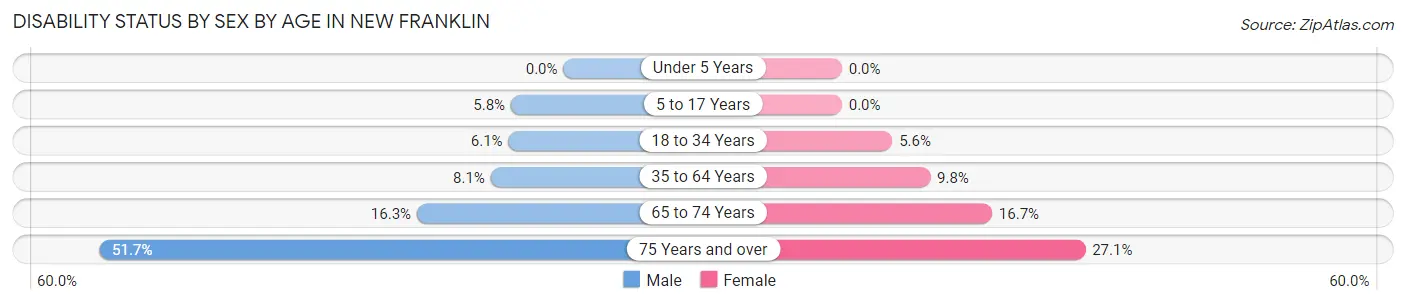
| Age Bracket | Male | Female |
| Under 5 Years | 0 (0.0%) | 0 (0.0%) |
| 5 to 17 Years | 50 (5.8%) | 0 (0.0%) |
| 18 to 34 Years | 71 (6.1%) | 74 (5.6%) |
| 35 to 64 Years | 248 (8.1%) | 283 (9.8%) |
| 65 to 74 Years | 138 (16.3%) | 144 (16.7%) |
| 75 Years and over | 289 (51.7%) | 167 (27.1%) |
Disability Class by Sex by Age in New Franklin
Disability Class: Hearing Difficulty
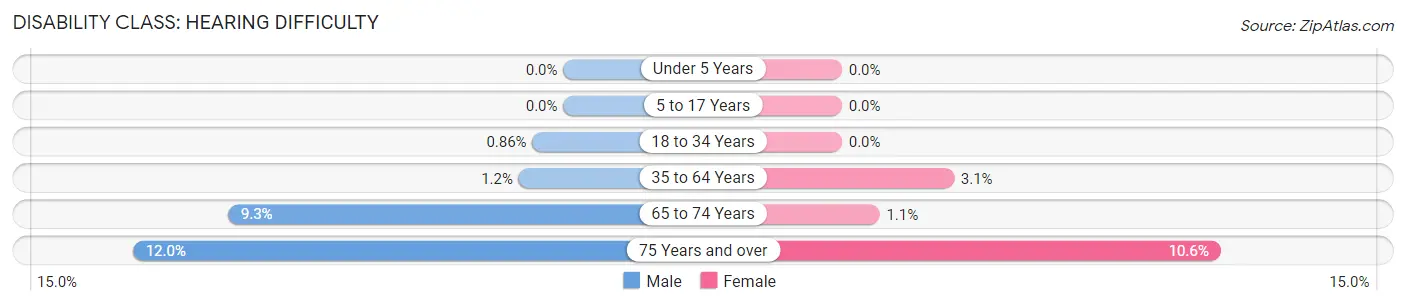
| Age Bracket | Male | Female |
| Under 5 Years | 0 (0.0%) | 0 (0.0%) |
| 5 to 17 Years | 0 (0.0%) | 0 (0.0%) |
| 18 to 34 Years | 10 (0.9%) | 0 (0.0%) |
| 35 to 64 Years | 38 (1.2%) | 90 (3.1%) |
| 65 to 74 Years | 79 (9.3%) | 9 (1.1%) |
| 75 Years and over | 67 (12.0%) | 65 (10.5%) |
Disability Class: Vision Difficulty
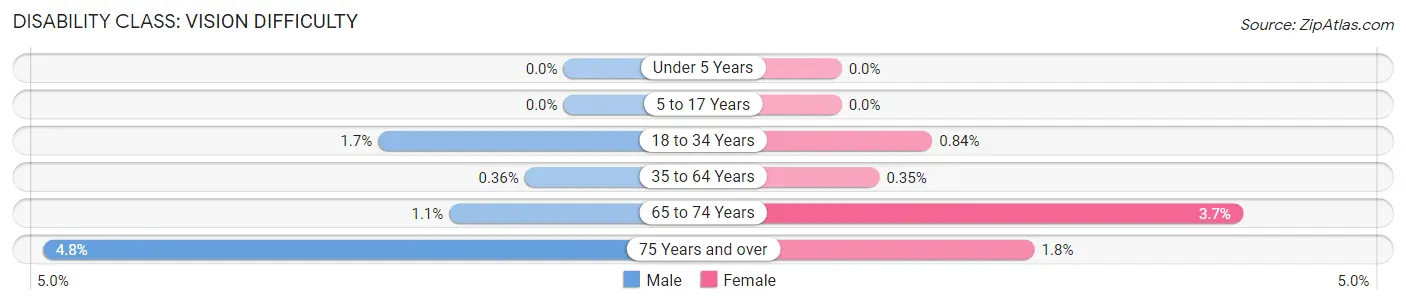
| Age Bracket | Male | Female |
| Under 5 Years | 0 (0.0%) | 0 (0.0%) |
| 5 to 17 Years | 0 (0.0%) | 0 (0.0%) |
| 18 to 34 Years | 20 (1.7%) | 11 (0.8%) |
| 35 to 64 Years | 11 (0.4%) | 10 (0.4%) |
| 65 to 74 Years | 9 (1.1%) | 32 (3.7%) |
| 75 Years and over | 27 (4.8%) | 11 (1.8%) |
Disability Class: Cognitive Difficulty
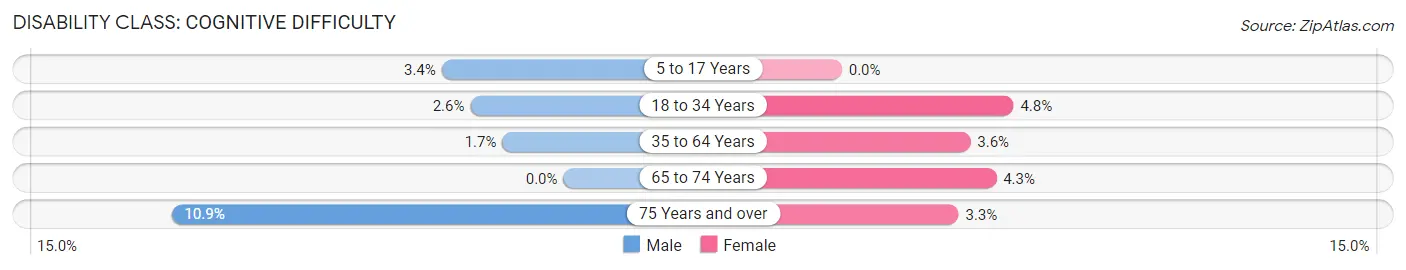
| Age Bracket | Male | Female |
| 5 to 17 Years | 29 (3.4%) | 0 (0.0%) |
| 18 to 34 Years | 30 (2.6%) | 63 (4.8%) |
| 35 to 64 Years | 52 (1.7%) | 103 (3.6%) |
| 65 to 74 Years | 0 (0.0%) | 37 (4.3%) |
| 75 Years and over | 61 (10.9%) | 20 (3.3%) |
Disability Class: Ambulatory Difficulty
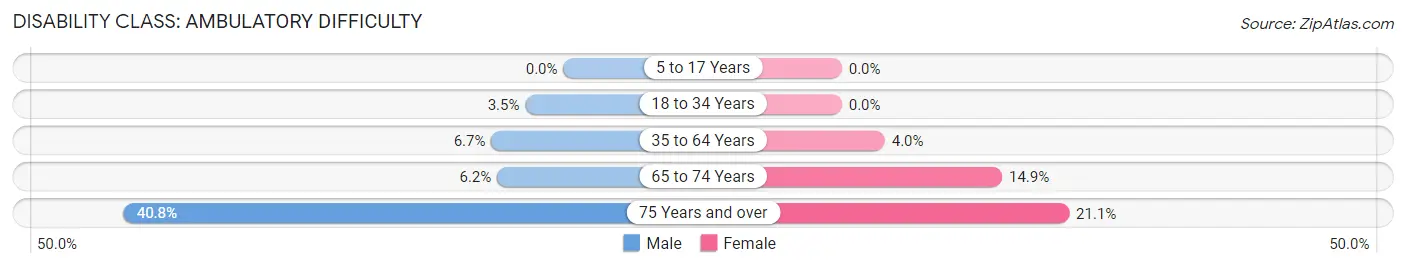
| Age Bracket | Male | Female |
| 5 to 17 Years | 0 (0.0%) | 0 (0.0%) |
| 18 to 34 Years | 41 (3.5%) | 0 (0.0%) |
| 35 to 64 Years | 205 (6.7%) | 115 (4.0%) |
| 65 to 74 Years | 52 (6.1%) | 128 (14.9%) |
| 75 Years and over | 228 (40.8%) | 130 (21.1%) |
Disability Class: Self-Care Difficulty
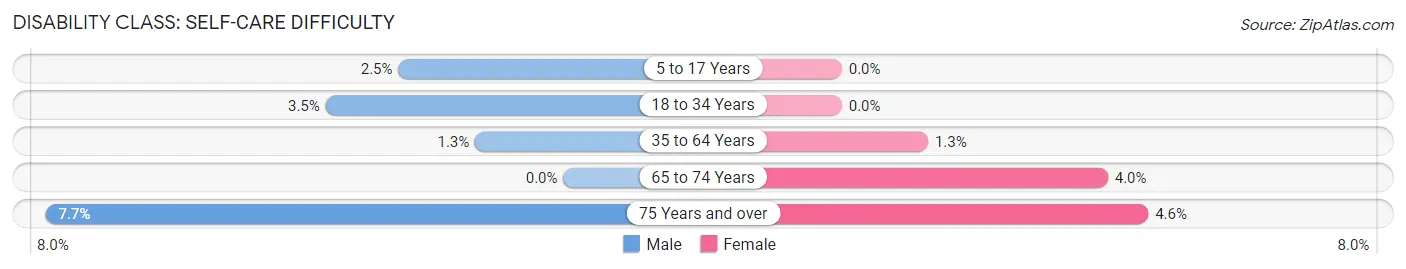
| Age Bracket | Male | Female |
| 5 to 17 Years | 21 (2.5%) | 0 (0.0%) |
| 18 to 34 Years | 41 (3.5%) | 0 (0.0%) |
| 35 to 64 Years | 40 (1.3%) | 37 (1.3%) |
| 65 to 74 Years | 0 (0.0%) | 34 (4.0%) |
| 75 Years and over | 43 (7.7%) | 28 (4.5%) |
Technology Access in New Franklin
Computing Device Access in New Franklin
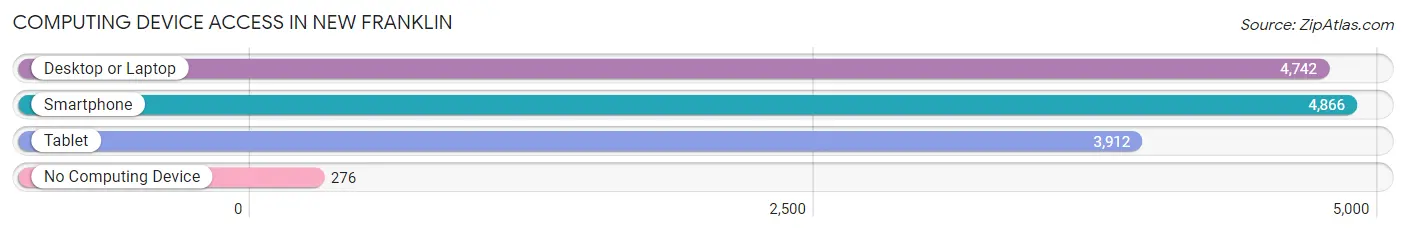
| Device Type | # Households | % Households |
| Desktop or Laptop | 4,742 | 84.0% |
| Smartphone | 4,866 | 86.2% |
| Tablet | 3,912 | 69.3% |
| No Computing Device | 276 | 4.9% |
| Total | 5,643 | 100.0% |
Internet Access in New Franklin
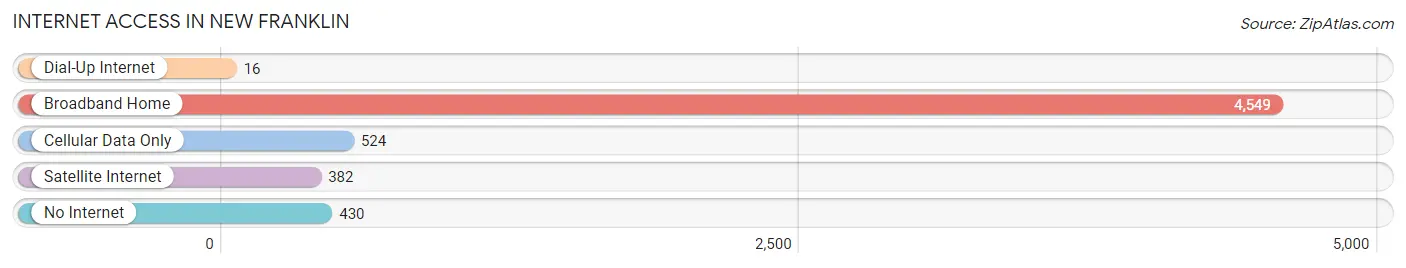
| Internet Type | # Households | % Households |
| Dial-Up Internet | 16 | 0.3% |
| Broadband Home | 4,549 | 80.6% |
| Cellular Data Only | 524 | 9.3% |
| Satellite Internet | 382 | 6.8% |
| No Internet | 430 | 7.6% |
| Total | 5,643 | 100.0% |
New Franklin Summary
Franklin, Ohio is a small city located in the southwestern part of the state, about 20 miles south of Columbus. It is the county seat of Warren County and is part of the Dayton metropolitan area. The city has a population of approximately 11,000 people and is known for its historic downtown area, which is home to a variety of shops, restaurants, and other businesses.
History
Franklin was founded in 1803 by William C. Schenck, a Revolutionary War veteran. The city was named after Benjamin Franklin, and the original plat of the city was laid out in 1804. The city was incorporated in 1816 and quickly became a center of commerce and industry. The city was home to a variety of businesses, including a woolen mill, a sawmill, a gristmill, and a distillery.
In the mid-1800s, the city was a major stop on the Underground Railroad, with many slaves escaping to freedom in Canada. The city was also home to a number of abolitionists, including the prominent Quaker, Levi Coffin.
In the late 1800s, the city experienced a period of growth and prosperity. The city was home to a variety of businesses, including a cigar factory, a furniture factory, and a brewery. The city also had a number of churches, schools, and other institutions.
Geography
Franklin is located in southwestern Ohio, about 20 miles south of Columbus. The city is situated in the Miami Valley, which is part of the larger Great Miami River watershed. The city is located on the east side of the Great Miami River, and is bordered by the cities of Carlisle, Middletown, and Springboro.
The city has a total area of 4.3 square miles, of which 4.2 square miles is land and 0.1 square miles is water. The city is located in a hilly region, with the highest point being the intersection of State Route 123 and State Route 741, which is approximately 890 feet above sea level.
Economy
Franklin’s economy is largely based on manufacturing and retail. The city is home to a variety of manufacturing companies, including a plastics manufacturer, a metal fabricator, and a printing company. The city is also home to a number of retail stores, including a grocery store, a hardware store, and a variety of specialty shops.
The city is also home to a number of healthcare facilities, including a hospital, a nursing home, and a number of medical offices. The city is also home to a number of educational institutions, including a community college and a number of private schools.
Demographics
As of the 2010 census, the population of Franklin was 11,771. The racial makeup of the city was 90.3% White, 4.2% African American, 0.3% Native American, 1.2% Asian, 0.1% Pacific Islander, 1.2% from other races, and 2.7% from two or more races. Hispanic or Latino of any race were 3.3% of the population.
The median income for a household in the city was $45,945, and the median income for a family was $54,945. The per capita income for the city was $22,845. About 8.2% of families and 10.3% of the population were below the poverty line, including 14.2% of those under age 18 and 6.2% of those age 65 or over.
Common Questions
What is the Total Population of New Franklin?
Total Population of New Franklin is 13,874.
What is the Total Male Population of New Franklin?
Total Male Population of New Franklin is 6,830.
What is the Total Female Population of New Franklin?
Total Female Population of New Franklin is 7,044.
What is the Ratio of Males per 100 Females in New Franklin?
There are 96.96 Males per 100 Females in New Franklin.
What is the Ratio of Females per 100 Males in New Franklin?
There are 103.13 Females per 100 Males in New Franklin.
What is the Median Population Age in New Franklin?
Median Population Age in New Franklin is 48.4 Years.
What is the Average Family Size in New Franklin
Average Family Size in New Franklin is 2.8 People.
What is the Average Household Size in New Franklin
Average Household Size in New Franklin is 2.4 People.
What is Per Capita Income in New Franklin?
Per Capita income in New Franklin is $40,498.
What is the Median Family Income in New Franklin?
Median Family Income in New Franklin is $98,903.
What is the Median Household income in New Franklin?
Median Household Income in New Franklin is $87,032.
What is Income or Wage Gap in New Franklin?
Income or Wage Gap in New Franklin is 37.0%.
Women in New Franklin earn 63.0 cents for every dollar earned by a man.
What is Family Income Deficit in New Franklin?
Family Income Deficit in New Franklin is $7,977.
Families that are below poverty line in New Franklin earn $7,977 less on average than the poverty threshold level.
What is Inequality or Gini Index in New Franklin?
Inequality or Gini Index in New Franklin is 0.35.
How Large is the Labor Force in New Franklin?
There are 7,832 People in the Labor Forcein in New Franklin.
What is the Percentage of People in the Labor Force in New Franklin?
66.6% of People are in the Labor Force in New Franklin.
What is the Unemployment Rate in New Franklin?
Unemployment Rate in New Franklin is 4.5%.