Lordstown, OH
Lordstown Map
Lordstown Overview
3,327
TOTAL POPULATION
1,603
MALE POPULATION
1,724
FEMALE POPULATION
92.98
MALES / 100 FEMALES
107.55
FEMALES / 100 MALES
47.9
MEDIAN AGE
3.0
AVG FAMILY SIZE
2.6
AVG HOUSEHOLD SIZE
$29,773
PER CAPITA INCOME
$73,214
AVG FAMILY INCOME
$64,116
AVG HOUSEHOLD INCOME
24.1%
WAGE / INCOME GAP [ % ]
75.9¢/ $1
WAGE / INCOME GAP [ $ ]
0.35
INEQUALITY / GINI INDEX
1,342
LABOR FORCE [ PEOPLE ]
48.5%
PERCENT IN LABOR FORCE
3.0%
UNEMPLOYMENT RATE
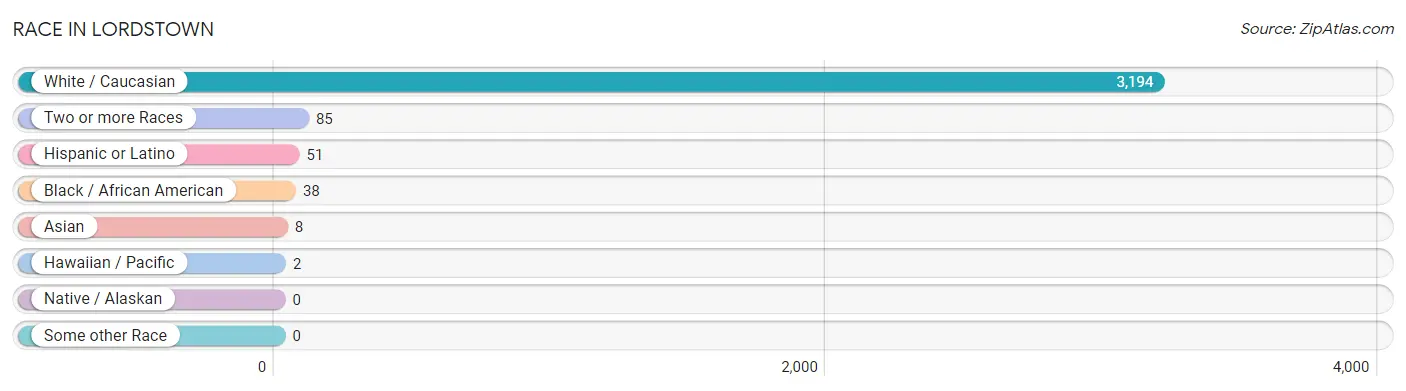
Race in Lordstown
The most populous races in Lordstown are White / Caucasian (3,194 | 96.0%), Two or more Races (85 | 2.5%), and Hispanic or Latino (51 | 1.5%).
| Race | # Population | % Population |
| Asian | 8 | 0.2% |
| Black / African American | 38 | 1.1% |
| Hawaiian / Pacific | 2 | 0.1% |
| Hispanic or Latino | 51 | 1.5% |
| Native / Alaskan | 0 | 0.0% |
| White / Caucasian | 3,194 | 96.0% |
| Two or more Races | 85 | 2.5% |
| Some other Race | 0 | 0.0% |
| Total | 3,327 | 100.0% |
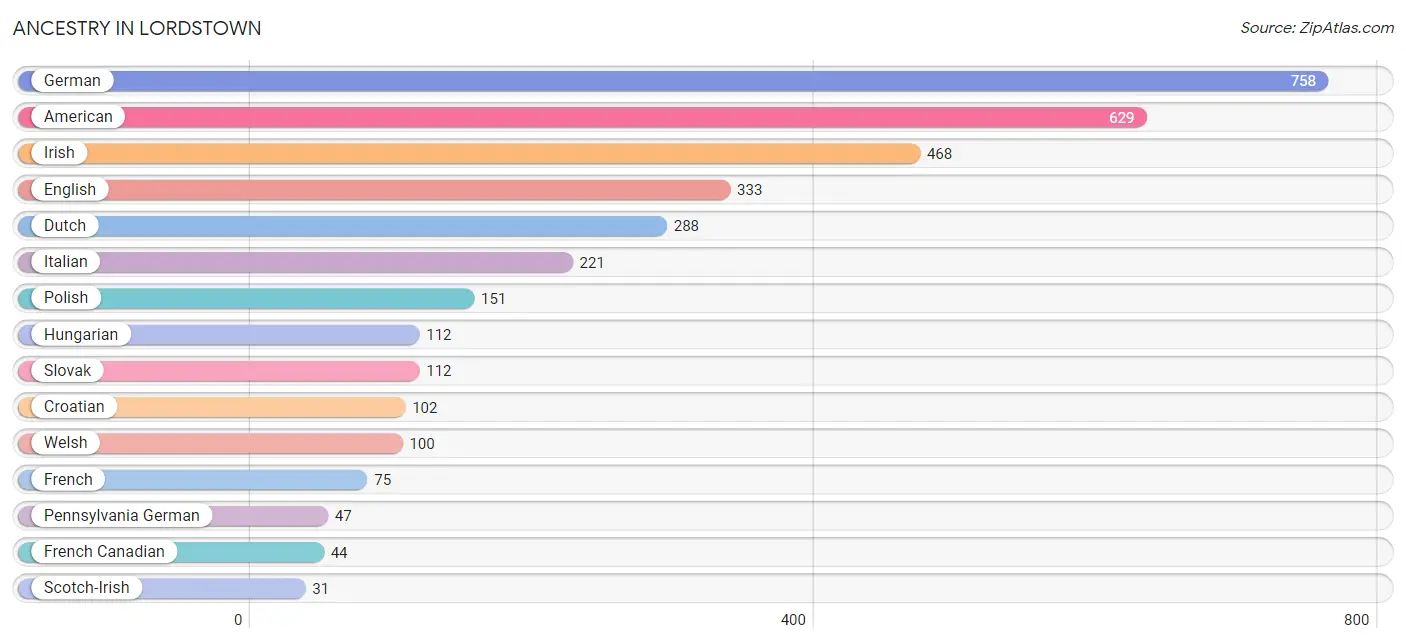
Ancestry in Lordstown
The most populous ancestries reported in Lordstown are German (758 | 22.8%), American (629 | 18.9%), Irish (468 | 14.1%), English (333 | 10.0%), and Dutch (288 | 8.7%), together accounting for 74.4% of all Lordstown residents.
| Ancestry | # Population | % Population |
| American | 629 | 18.9% |
| Arab | 6 | 0.2% |
| Belgian | 5 | 0.2% |
| Cherokee | 4 | 0.1% |
| Croatian | 102 | 3.1% |
| Cuban | 5 | 0.2% |
| Czech | 17 | 0.5% |
| Czechoslovakian | 6 | 0.2% |
| Dutch | 288 | 8.7% |
| English | 333 | 10.0% |
| Finnish | 10 | 0.3% |
| French | 75 | 2.2% |
| French Canadian | 44 | 1.3% |
| German | 758 | 22.8% |
| Hungarian | 112 | 3.4% |
| Indian (Asian) | 25 | 0.7% |
| Irish | 468 | 14.1% |
| Iroquois | 25 | 0.7% |
| Italian | 221 | 6.6% |
| Korean | 19 | 0.6% |
| Lebanese | 6 | 0.2% |
| Lithuanian | 11 | 0.3% |
| Mexican | 19 | 0.6% |
| Native Hawaiian | 2 | 0.1% |
| Pennsylvania German | 47 | 1.4% |
| Polish | 151 | 4.5% |
| Puerto Rican | 15 | 0.4% |
| Russian | 5 | 0.2% |
| Scotch-Irish | 31 | 0.9% |
| Scottish | 29 | 0.9% |
| Serbian | 3 | 0.1% |
| Slovak | 112 | 3.4% |
| Slovene | 2 | 0.1% |
| Swedish | 17 | 0.5% |
| Swiss | 3 | 0.1% |
| Ukrainian | 7 | 0.2% |
| Welsh | 100 | 3.0% | View All 37 Rows |
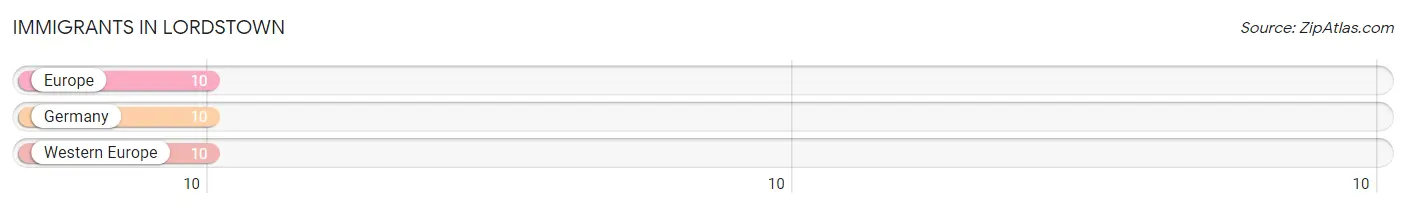
Immigrants in Lordstown
The most numerous immigrant groups reported in Lordstown came from Europe (10 | 0.3%), Germany (10 | 0.3%), and Western Europe (10 | 0.3%), together accounting for 0.9% of all Lordstown residents.
| Immigration Origin | # Population | % Population |
| Europe | 10 | 0.3% |
| Germany | 10 | 0.3% |
| Western Europe | 10 | 0.3% | View All 3 Rows |
Sex and Age in Lordstown
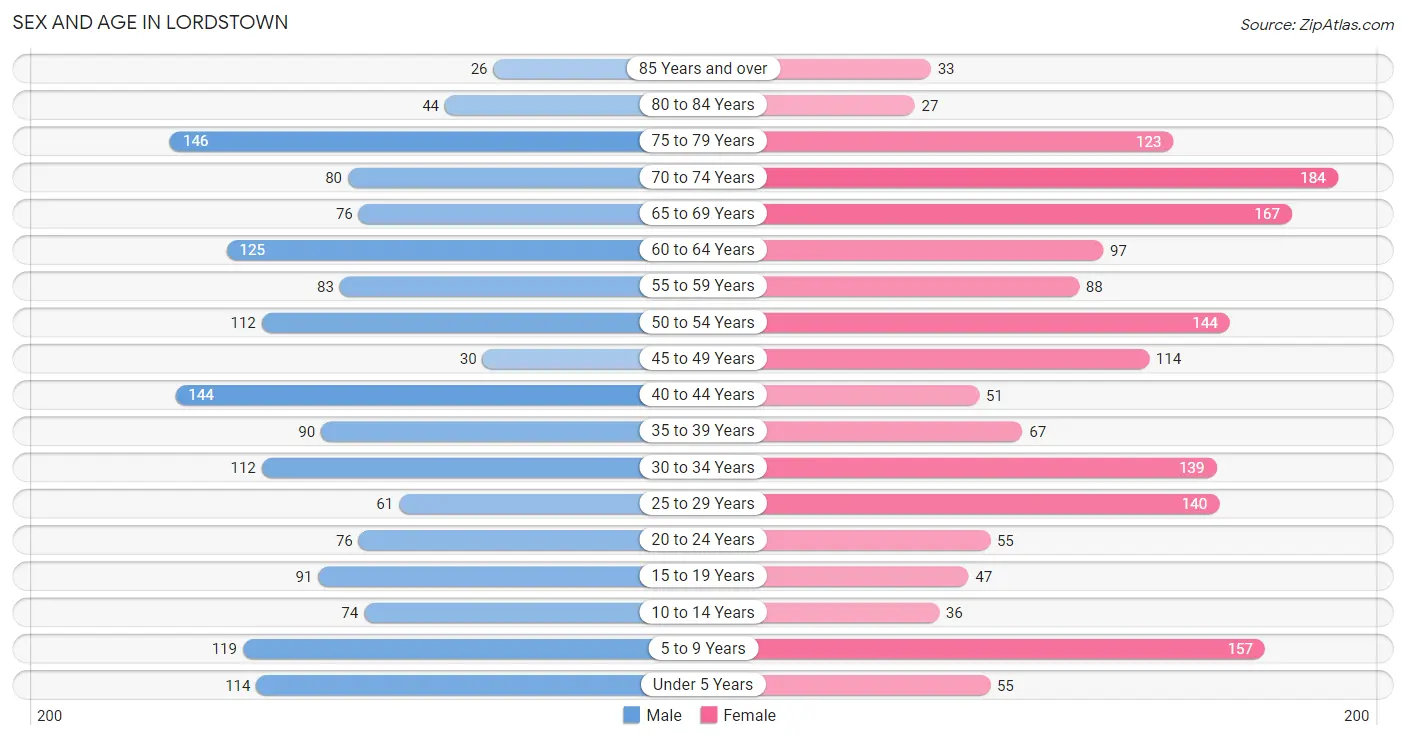
Sex and Age in Lordstown
The most populous age groups in Lordstown are 75 to 79 Years (146 | 9.1%) for men and 70 to 74 Years (184 | 10.7%) for women.
| Age Bracket | Male | Female |
| Under 5 Years | 114 (7.1%) | 55 (3.2%) |
| 5 to 9 Years | 119 (7.4%) | 157 (9.1%) |
| 10 to 14 Years | 74 (4.6%) | 36 (2.1%) |
| 15 to 19 Years | 91 (5.7%) | 47 (2.7%) |
| 20 to 24 Years | 76 (4.7%) | 55 (3.2%) |
| 25 to 29 Years | 61 (3.8%) | 140 (8.1%) |
| 30 to 34 Years | 112 (7.0%) | 139 (8.1%) |
| 35 to 39 Years | 90 (5.6%) | 67 (3.9%) |
| 40 to 44 Years | 144 (9.0%) | 51 (3.0%) |
| 45 to 49 Years | 30 (1.9%) | 114 (6.6%) |
| 50 to 54 Years | 112 (7.0%) | 144 (8.4%) |
| 55 to 59 Years | 83 (5.2%) | 88 (5.1%) |
| 60 to 64 Years | 125 (7.8%) | 97 (5.6%) |
| 65 to 69 Years | 76 (4.7%) | 167 (9.7%) |
| 70 to 74 Years | 80 (5.0%) | 184 (10.7%) |
| 75 to 79 Years | 146 (9.1%) | 123 (7.1%) |
| 80 to 84 Years | 44 (2.7%) | 27 (1.6%) |
| 85 Years and over | 26 (1.6%) | 33 (1.9%) |
| Total | 1,603 (100.0%) | 1,724 (100.0%) |
Families and Households in Lordstown
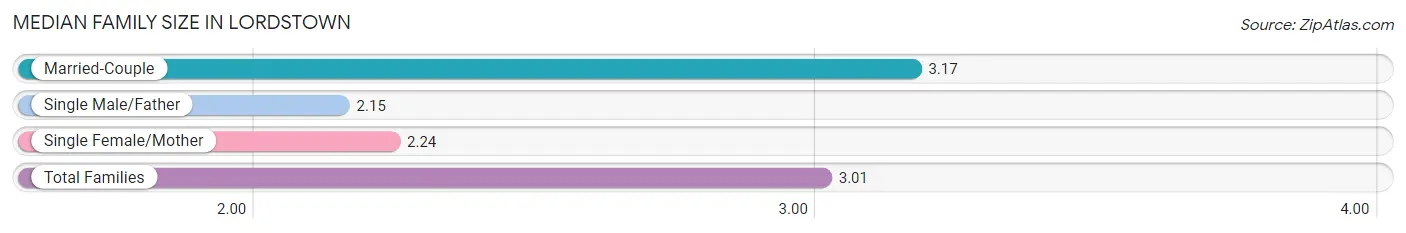
Median Family Size in Lordstown
The median family size in Lordstown is 3.01 persons per family, with married-couple families (795 | 82.8%) accounting for the largest median family size of 3.17 persons per family. On the other hand, single male/father families (41 | 4.3%) represent the smallest median family size with 2.15 persons per family.
| Family Type | # Families | Family Size |
| Married-Couple | 795 (82.8%) | 3.17 |
| Single Male/Father | 41 (4.3%) | 2.15 |
| Single Female/Mother | 124 (12.9%) | 2.24 |
| Total Families | 960 (100.0%) | 3.01 |
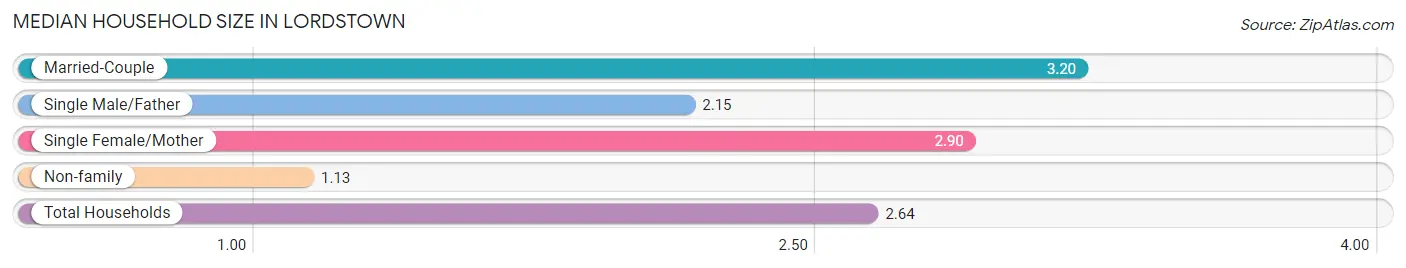
Median Household Size in Lordstown
The median household size in Lordstown is 2.64 persons per household, with married-couple households (795 | 63.1%) accounting for the largest median household size of 3.2 persons per household. non-family households (299 | 23.7%) represent the smallest median household size with 1.13 persons per household.
| Household Type | # Households | Household Size |
| Married-Couple | 795 (63.1%) | 3.20 |
| Single Male/Father | 41 (3.3%) | 2.15 |
| Single Female/Mother | 124 (9.9%) | 2.90 |
| Non-family | 299 (23.7%) | 1.13 |
| Total Households | 1,259 (100.0%) | 2.64 |
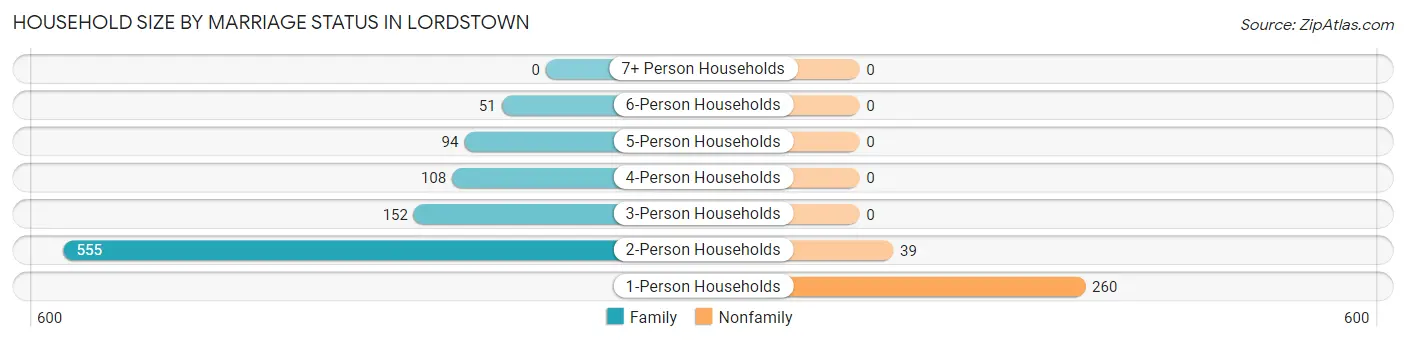
Household Size by Marriage Status in Lordstown
Out of a total of 1,259 households in Lordstown, 960 (76.2%) are family households, while 299 (23.7%) are nonfamily households. The most numerous type of family households are 2-person households, comprising 555, and the most common type of nonfamily households are 1-person households, comprising 260.
| Household Size | Family Households | Nonfamily Households |
| 1-Person Households | - | 260 (20.6%) |
| 2-Person Households | 555 (44.1%) | 39 (3.1%) |
| 3-Person Households | 152 (12.1%) | 0 (0.0%) |
| 4-Person Households | 108 (8.6%) | 0 (0.0%) |
| 5-Person Households | 94 (7.5%) | 0 (0.0%) |
| 6-Person Households | 51 (4.1%) | 0 (0.0%) |
| 7+ Person Households | 0 (0.0%) | 0 (0.0%) |
| Total | 960 (76.2%) | 299 (23.7%) |
Female Fertility in Lordstown
Fertility by Age in Lordstown
Average fertility rate in Lordstown is 26.0 births per 1,000 women. Women in the age bracket of 20 to 34 years have the highest fertility rate with 45.0 births per 1,000 women. Women in the age bracket of 20 to 34 years acount for 88.2% of all women with births.
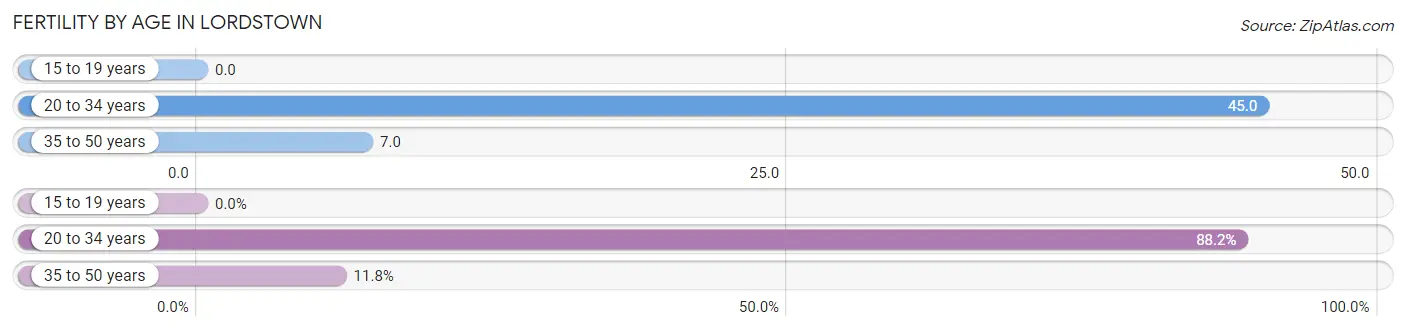
| Age Bracket | Women with Births | Births / 1,000 Women |
| 15 to 19 years | 0 (0.0%) | 0.0 |
| 20 to 34 years | 15 (88.2%) | 45.0 |
| 35 to 50 years | 2 (11.8%) | 7.0 |
| Total | 17 (100.0%) | 26.0 |
Fertility by Age by Marriage Status in Lordstown
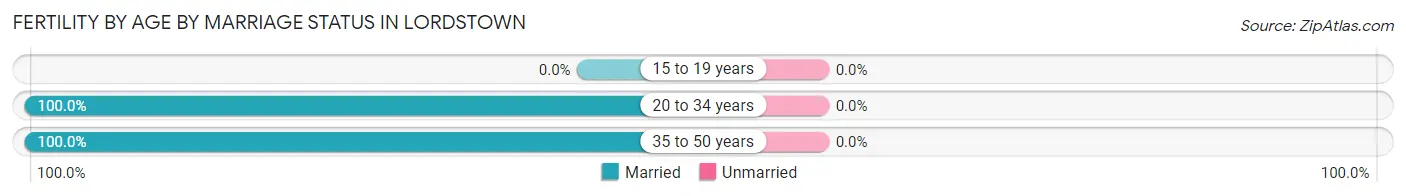
| Age Bracket | Married | Unmarried |
| 15 to 19 years | 0 (0.0%) | 0 (0.0%) |
| 20 to 34 years | 15 (100.0%) | 0 (0.0%) |
| 35 to 50 years | 2 (100.0%) | 0 (0.0%) |
| Total | 17 (100.0%) | 0 (0.0%) |
Fertility by Education in Lordstown
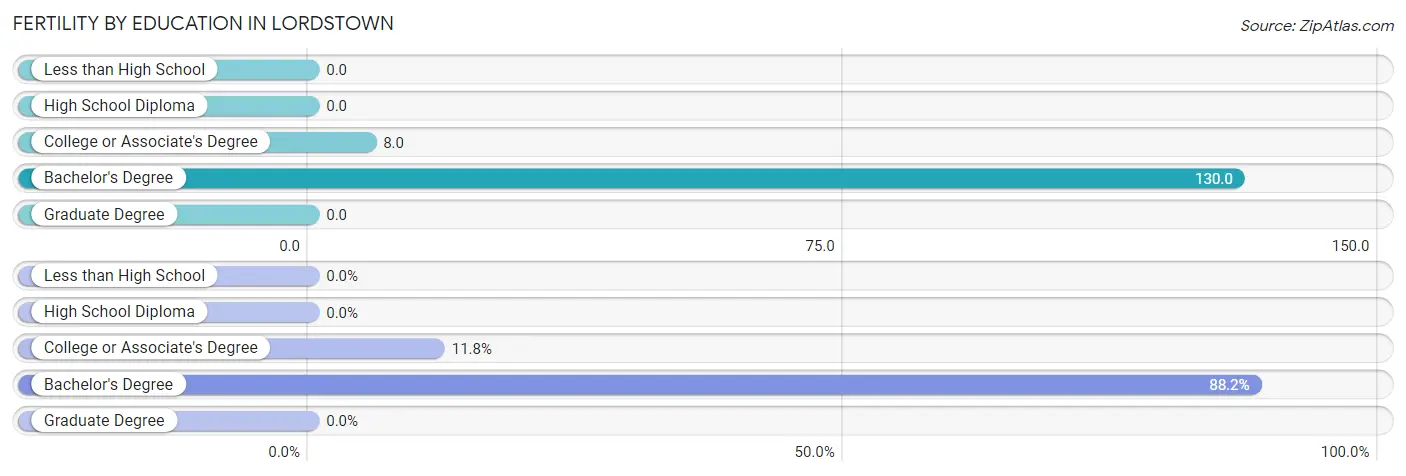
| Educational Attainment | Women with Births | Births / 1,000 Women |
| Less than High School | 0 (0.0%) | 0.0 |
| High School Diploma | 0 (0.0%) | 0.0 |
| College or Associate's Degree | 2 (11.8%) | 8.0 |
| Bachelor's Degree | 15 (88.2%) | 130.0 |
| Graduate Degree | 0 (0.0%) | 0.0 |
| Total | 17 (100.0%) | 26.0 |
Fertility by Education by Marriage Status in Lordstown
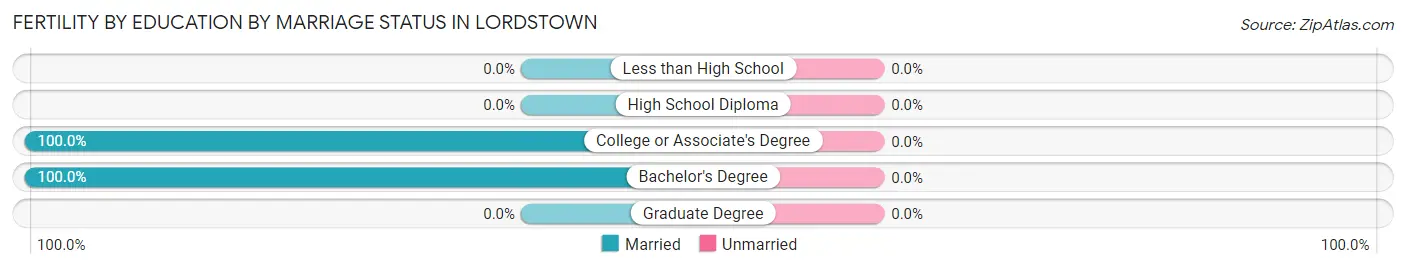
| Educational Attainment | Married | Unmarried |
| Less than High School | 0 (0.0%) | 0 (0.0%) |
| High School Diploma | 0 (0.0%) | 0 (0.0%) |
| College or Associate's Degree | 2 (100.0%) | 0 (0.0%) |
| Bachelor's Degree | 15 (100.0%) | 0 (0.0%) |
| Graduate Degree | 0 (0.0%) | 0 (0.0%) |
| Total | 17 (100.0%) | 0 (0.0%) |
Income in Lordstown
Income Overview in Lordstown
Per Capita Income in Lordstown is $29,773, while median incomes of families and households are $73,214 and $64,116 respectively.
| Characteristic | Number | Measure |
| Per Capita Income | 3,327 | $29,773 |
| Median Family Income | 960 | $73,214 |
| Mean Family Income | 960 | $84,489 |
| Median Household Income | 1,259 | $64,116 |
| Mean Household Income | 1,259 | $76,721 |
| Income Deficit | 960 | $0 |
| Wage / Income Gap (%) | 3,327 | 24.10% |
| Wage / Income Gap ($) | 3,327 | 75.90¢ per $1 |
| Gini / Inequality Index | 3,327 | 0.35 |
Earnings by Sex in Lordstown
Average Earnings in Lordstown are $33,997, $35,560 for men and $26,991 for women, a difference of 24.1%.
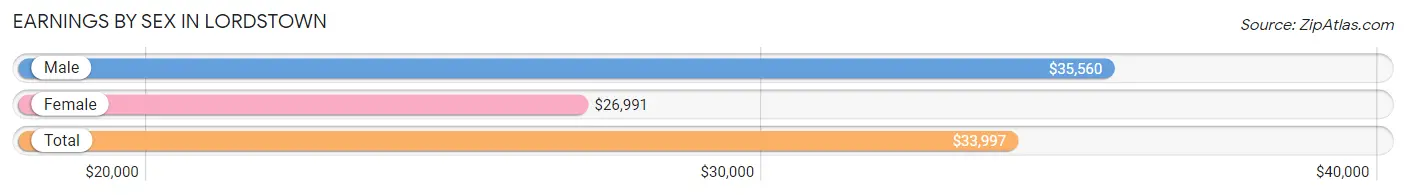
| Sex | Number | Average Earnings |
| Male | 780 (52.2%) | $35,560 |
| Female | 713 (47.8%) | $26,991 |
| Total | 1,493 (100.0%) | $33,997 |
Earnings by Sex by Income Bracket in Lordstown
The most common earnings brackets in Lordstown are $100,000+ for men (100 | 12.8%) and $25,000 to $29,999 for women (93 | 13.0%).
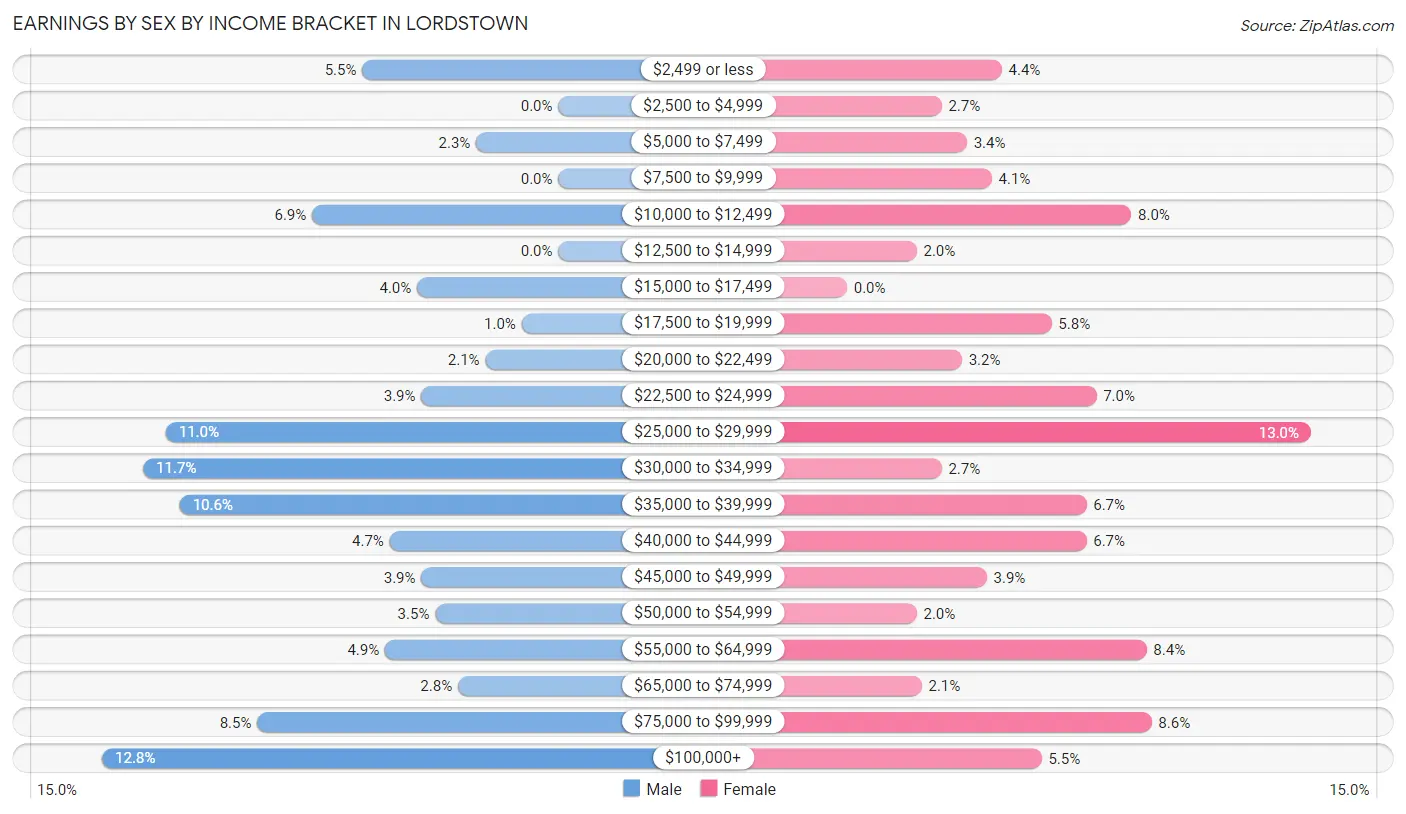
| Income | Male | Female |
| $2,499 or less | 43 (5.5%) | 31 (4.3%) |
| $2,500 to $4,999 | 0 (0.0%) | 19 (2.7%) |
| $5,000 to $7,499 | 18 (2.3%) | 24 (3.4%) |
| $7,500 to $9,999 | 0 (0.0%) | 29 (4.1%) |
| $10,000 to $12,499 | 54 (6.9%) | 57 (8.0%) |
| $12,500 to $14,999 | 0 (0.0%) | 14 (2.0%) |
| $15,000 to $17,499 | 31 (4.0%) | 0 (0.0%) |
| $17,500 to $19,999 | 8 (1.0%) | 41 (5.8%) |
| $20,000 to $22,499 | 16 (2.1%) | 23 (3.2%) |
| $22,500 to $24,999 | 30 (3.8%) | 50 (7.0%) |
| $25,000 to $29,999 | 86 (11.0%) | 93 (13.0%) |
| $30,000 to $34,999 | 91 (11.7%) | 19 (2.7%) |
| $35,000 to $39,999 | 83 (10.6%) | 48 (6.7%) |
| $40,000 to $44,999 | 37 (4.7%) | 48 (6.7%) |
| $45,000 to $49,999 | 30 (3.8%) | 28 (3.9%) |
| $50,000 to $54,999 | 27 (3.5%) | 14 (2.0%) |
| $55,000 to $64,999 | 38 (4.9%) | 60 (8.4%) |
| $65,000 to $74,999 | 22 (2.8%) | 15 (2.1%) |
| $75,000 to $99,999 | 66 (8.5%) | 61 (8.6%) |
| $100,000+ | 100 (12.8%) | 39 (5.5%) |
| Total | 780 (100.0%) | 713 (100.0%) |
Earnings by Sex by Educational Attainment in Lordstown
Average earnings in Lordstown are $36,810 for men and $33,882 for women, a difference of 8.0%. Men with an educational attainment of bachelor's degree enjoy the highest average annual earnings of $91,875, while those with less than high school education earn the least with $2,499. Women with an educational attainment of graduate degree earn the most with the average annual earnings of $63,971, while those with less than high school education have the smallest earnings of $24,500.
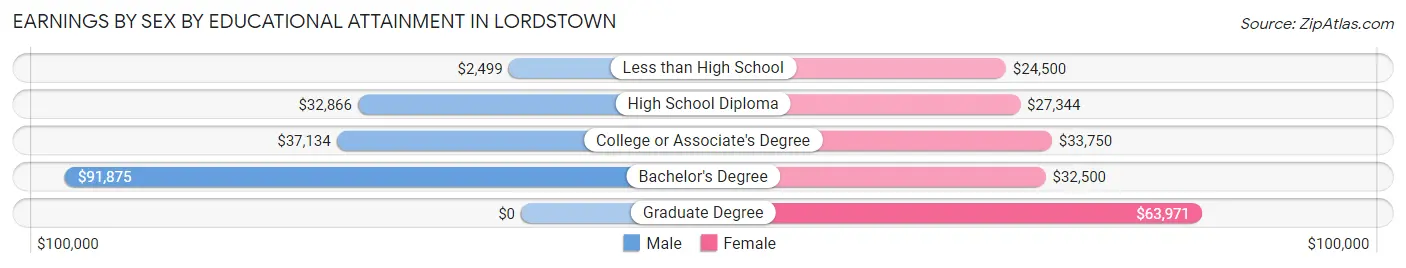
| Educational Attainment | Male Income | Female Income |
| Less than High School | $2,499 | $24,500 |
| High School Diploma | $32,866 | $27,344 |
| College or Associate's Degree | $37,134 | $33,750 |
| Bachelor's Degree | $91,875 | $32,500 |
| Graduate Degree | - | - |
| Total | $36,810 | $33,882 |
Family Income in Lordstown
Family Income Brackets in Lordstown
According to the Lordstown family income data, there are 282 families falling into the $50,000 to $74,999 income range, which is the most common income bracket and makes up 29.4% of all families. Conversely, the $10,000 to $14,999 income bracket is the least frequent group with only 12 families (1.3%) belonging to this category.
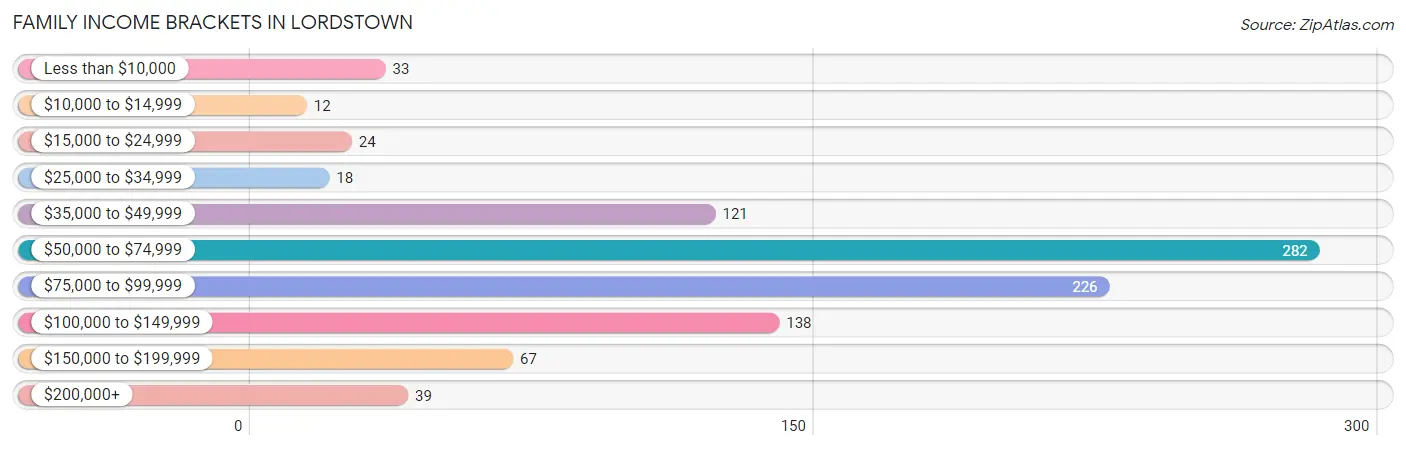
| Income Bracket | # Families | % Families |
| Less than $10,000 | 33 | 3.4% |
| $10,000 to $14,999 | 12 | 1.3% |
| $15,000 to $24,999 | 24 | 2.5% |
| $25,000 to $34,999 | 18 | 1.9% |
| $35,000 to $49,999 | 121 | 12.6% |
| $50,000 to $74,999 | 282 | 29.4% |
| $75,000 to $99,999 | 226 | 23.5% |
| $100,000 to $149,999 | 138 | 14.4% |
| $150,000 to $199,999 | 67 | 7.0% |
| $200,000+ | 39 | 4.1% |
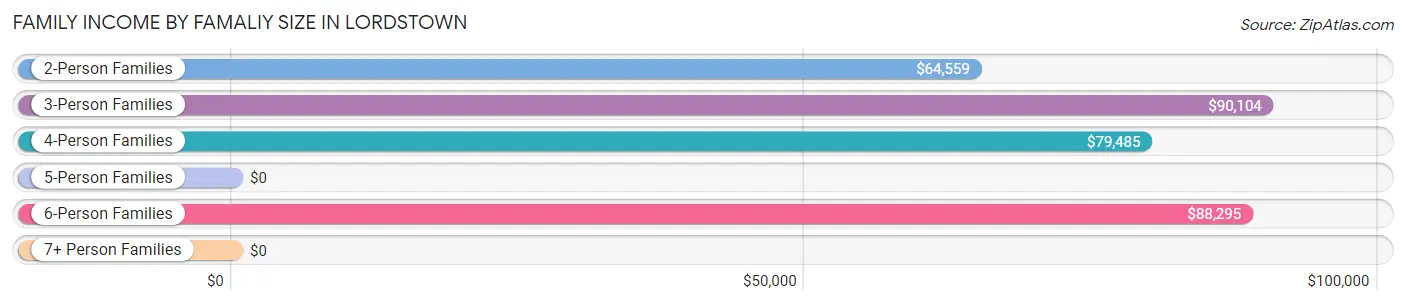
Family Income by Famaliy Size in Lordstown
3-person families (135 | 14.1%) account for the highest median family income in Lordstown with $90,104 per family, while 2-person families (602 | 62.7%) have the highest median income of $32,280 per family member.
| Income Bracket | # Families | Median Income |
| 2-Person Families | 602 (62.7%) | $64,559 |
| 3-Person Families | 135 (14.1%) | $90,104 |
| 4-Person Families | 78 (8.1%) | $79,485 |
| 5-Person Families | 109 (11.4%) | $0 |
| 6-Person Families | 36 (3.7%) | $88,295 |
| 7+ Person Families | 0 (0.0%) | $0 |
| Total | 960 (100.0%) | $73,214 |
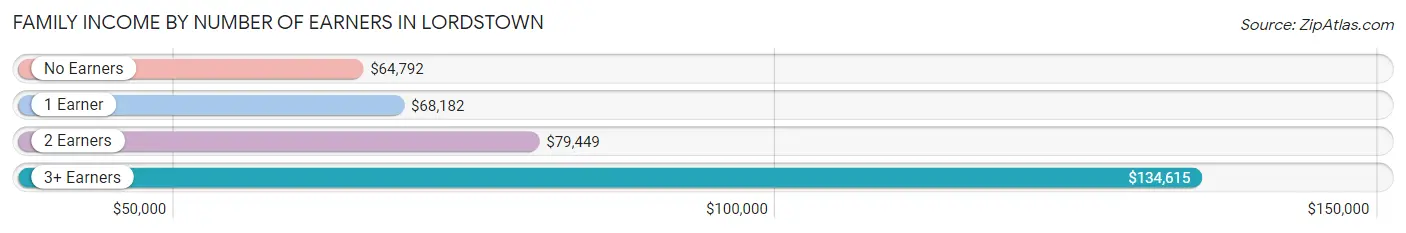
Family Income by Number of Earners in Lordstown
The median family income in Lordstown is $73,214, with families comprising 3+ earners (22) having the highest median family income of $134,615, while families with no earners (193) have the lowest median family income of $64,792, accounting for 2.3% and 20.1% of families, respectively.
| Number of Earners | # Families | Median Income |
| No Earners | 193 (20.1%) | $64,792 |
| 1 Earner | 354 (36.9%) | $68,182 |
| 2 Earners | 391 (40.7%) | $79,449 |
| 3+ Earners | 22 (2.3%) | $134,615 |
| Total | 960 (100.0%) | $73,214 |
Household Income in Lordstown
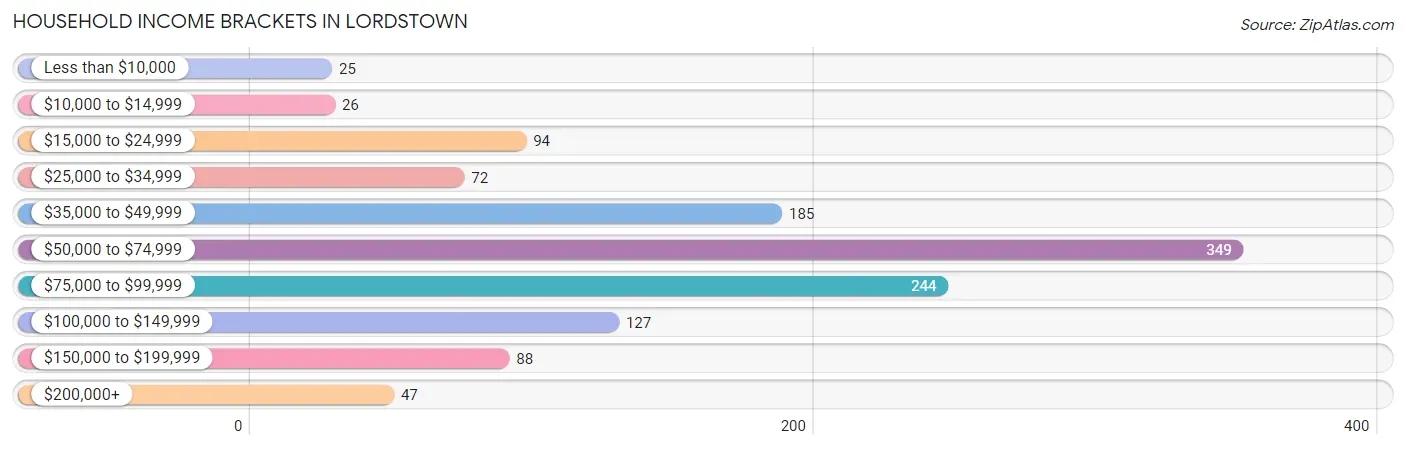
Household Income Brackets in Lordstown
With 349 households falling in the category, the $50,000 to $74,999 income range is the most frequent in Lordstown, accounting for 27.7% of all households. In contrast, only 25 households (2.0%) fall into the less than $10,000 income bracket, making it the least populous group.
| Income Bracket | # Households | % Households |
| Less than $10,000 | 25 | 2.0% |
| $10,000 to $14,999 | 26 | 2.1% |
| $15,000 to $24,999 | 94 | 7.5% |
| $25,000 to $34,999 | 72 | 5.7% |
| $35,000 to $49,999 | 185 | 14.7% |
| $50,000 to $74,999 | 349 | 27.7% |
| $75,000 to $99,999 | 244 | 19.4% |
| $100,000 to $149,999 | 127 | 10.1% |
| $150,000 to $199,999 | 88 | 7.0% |
| $200,000+ | 47 | 3.7% |
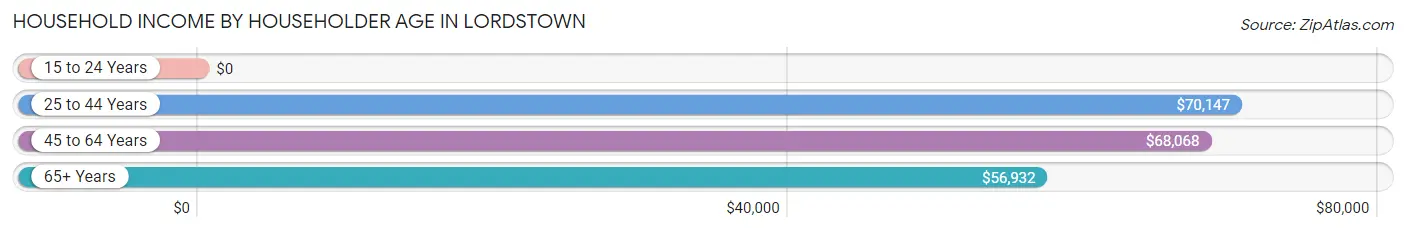
Household Income by Householder Age in Lordstown
The median household income in Lordstown is $64,116, with the highest median household income of $70,147 found in the 25 to 44 years age bracket for the primary householder. A total of 300 households (23.8%) fall into this category.
| Income Bracket | # Households | Median Income |
| 15 to 24 Years | 0 (0.0%) | $0 |
| 25 to 44 Years | 300 (23.8%) | $70,147 |
| 45 to 64 Years | 402 (31.9%) | $68,068 |
| 65+ Years | 557 (44.2%) | $56,932 |
| Total | 1,259 (100.0%) | $64,116 |
Poverty in Lordstown
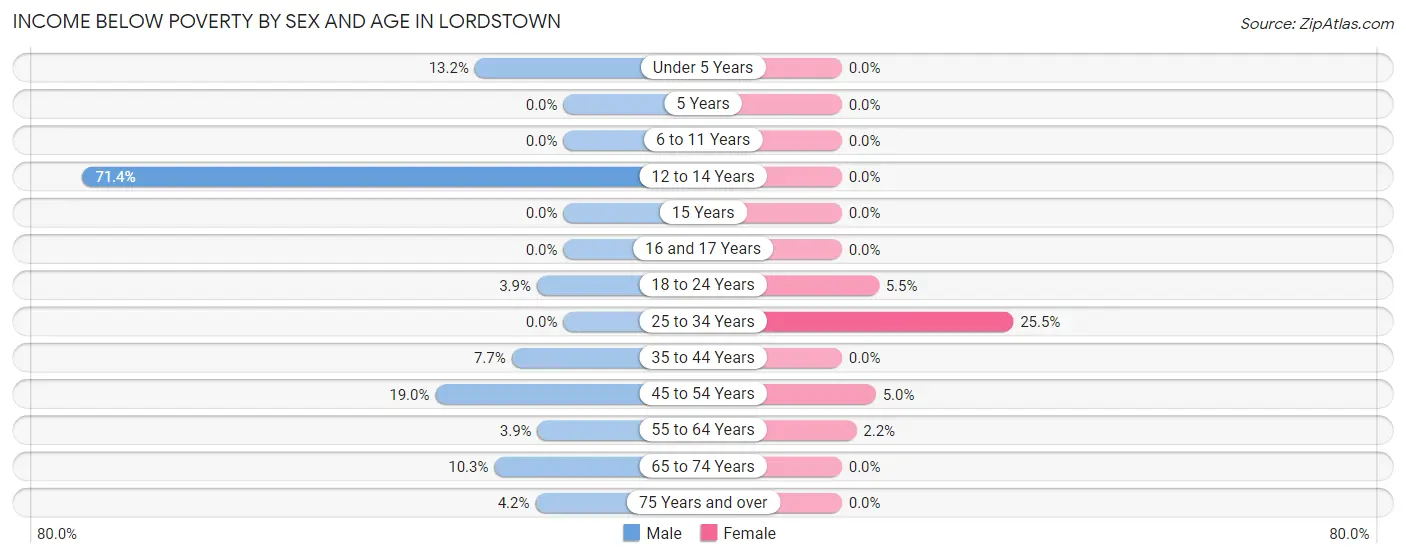
Income Below Poverty by Sex and Age in Lordstown
With 6.7% poverty level for males and 5.3% for females among the residents of Lordstown, 12 to 14 year old males and 25 to 34 year old females are the most vulnerable to poverty, with 10 males (71.4%) and 71 females (25.5%) in their respective age groups living below the poverty level.
| Age Bracket | Male | Female |
| Under 5 Years | 15 (13.2%) | 0 (0.0%) |
| 5 Years | 0 (0.0%) | 0 (0.0%) |
| 6 to 11 Years | 0 (0.0%) | 0 (0.0%) |
| 12 to 14 Years | 10 (71.4%) | 0 (0.0%) |
| 15 Years | 0 (0.0%) | 0 (0.0%) |
| 16 and 17 Years | 0 (0.0%) | 0 (0.0%) |
| 18 to 24 Years | 5 (3.9%) | 4 (5.5%) |
| 25 to 34 Years | 0 (0.0%) | 71 (25.5%) |
| 35 to 44 Years | 18 (7.7%) | 0 (0.0%) |
| 45 to 54 Years | 27 (19.0%) | 13 (5.0%) |
| 55 to 64 Years | 8 (3.8%) | 4 (2.2%) |
| 65 to 74 Years | 16 (10.3%) | 0 (0.0%) |
| 75 Years and over | 9 (4.2%) | 0 (0.0%) |
| Total | 108 (6.7%) | 92 (5.3%) |
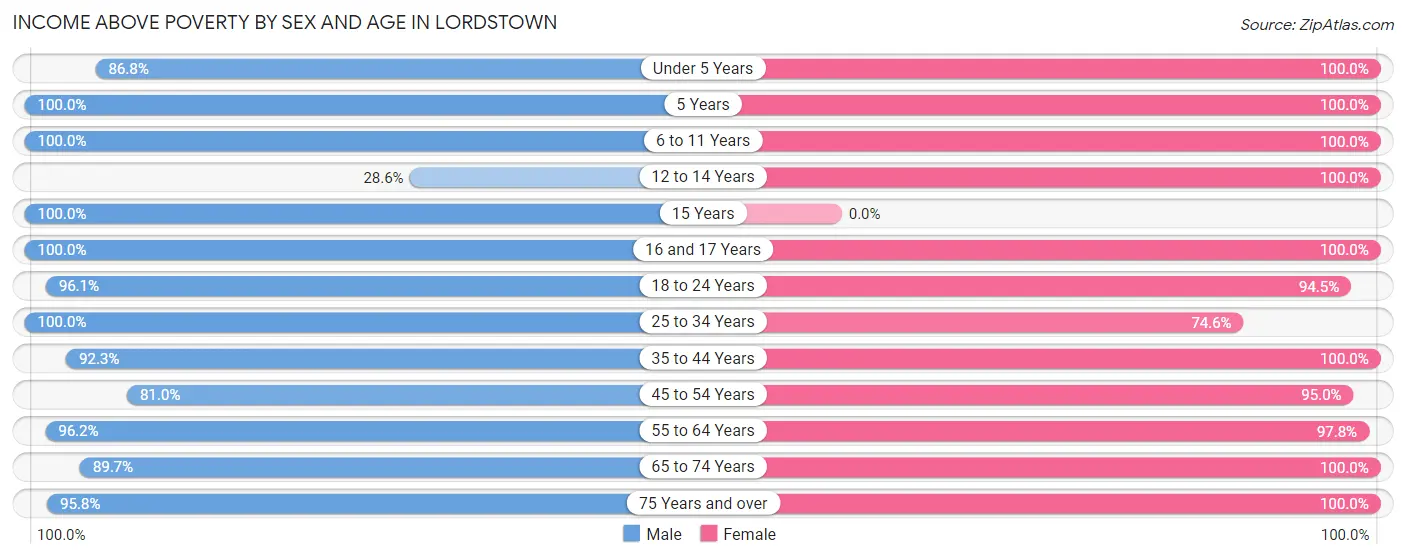
Income Above Poverty by Sex and Age in Lordstown
According to the poverty statistics in Lordstown, males aged 5 years and females aged under 5 years are the age groups that are most secure financially, with 100.0% of males and 100.0% of females in these age groups living above the poverty line.
| Age Bracket | Male | Female |
| Under 5 Years | 99 (86.8%) | 55 (100.0%) |
| 5 Years | 33 (100.0%) | 3 (100.0%) |
| 6 to 11 Years | 146 (100.0%) | 164 (100.0%) |
| 12 to 14 Years | 4 (28.6%) | 26 (100.0%) |
| 15 Years | 5 (100.0%) | 0 (0.0%) |
| 16 and 17 Years | 35 (100.0%) | 29 (100.0%) |
| 18 to 24 Years | 122 (96.1%) | 69 (94.5%) |
| 25 to 34 Years | 173 (100.0%) | 208 (74.6%) |
| 35 to 44 Years | 216 (92.3%) | 118 (100.0%) |
| 45 to 54 Years | 115 (81.0%) | 245 (95.0%) |
| 55 to 64 Years | 200 (96.2%) | 181 (97.8%) |
| 65 to 74 Years | 140 (89.7%) | 351 (100.0%) |
| 75 Years and over | 207 (95.8%) | 183 (100.0%) |
| Total | 1,495 (93.3%) | 1,632 (94.7%) |
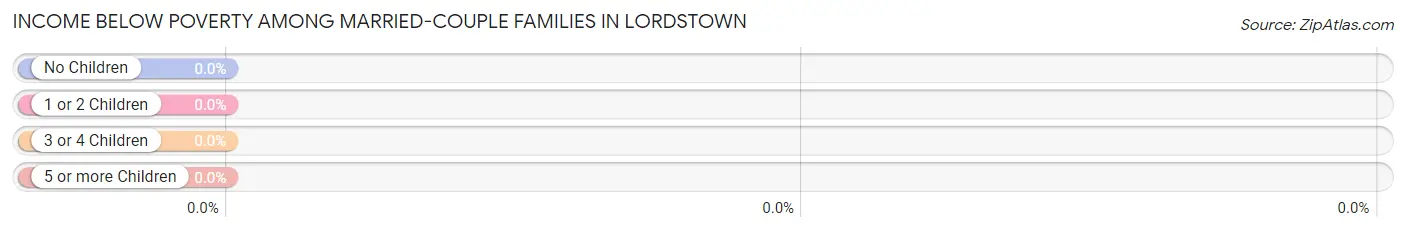
Income Below Poverty Among Married-Couple Families in Lordstown
| Children | Above Poverty | Below Poverty |
| No Children | 571 (100.0%) | 0 (0.0%) |
| 1 or 2 Children | 154 (100.0%) | 0 (0.0%) |
| 3 or 4 Children | 70 (100.0%) | 0 (0.0%) |
| 5 or more Children | 0 (0.0%) | 0 (0.0%) |
| Total | 795 (100.0%) | 0 (0.0%) |
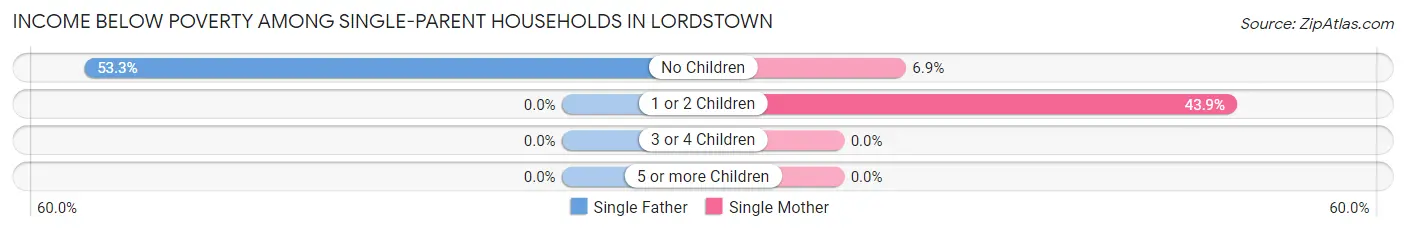
Income Below Poverty Among Single-Parent Households in Lordstown
According to the poverty data in Lordstown, 39.0% or 16 single-father households and 26.6% or 33 single-mother households are living below the poverty line. Among single-father households, those with no children have the highest poverty rate, with 16 households (53.3%) experiencing poverty. Likewise, among single-mother households, those with 1 or 2 children have the highest poverty rate, with 29 households (43.9%) falling below the poverty line.
| Children | Single Father | Single Mother |
| No Children | 16 (53.3%) | 4 (6.9%) |
| 1 or 2 Children | 0 (0.0%) | 29 (43.9%) |
| 3 or 4 Children | 0 (0.0%) | 0 (0.0%) |
| 5 or more Children | 0 (0.0%) | 0 (0.0%) |
| Total | 16 (39.0%) | 33 (26.6%) |
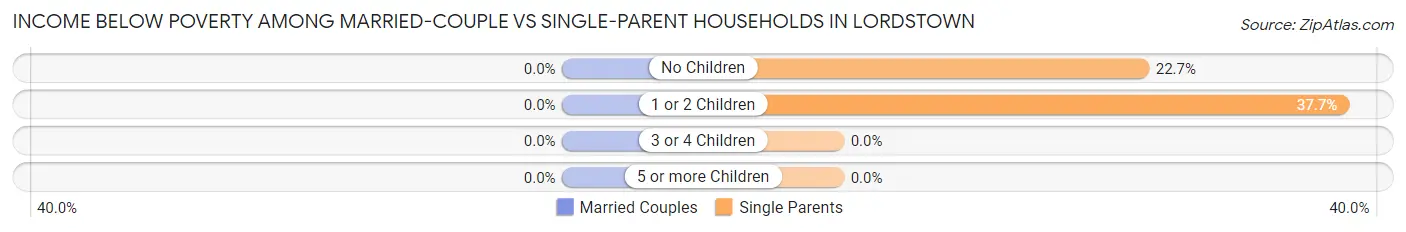
Income Below Poverty Among Married-Couple vs Single-Parent Households in Lordstown
| Children | Married-Couple Families | Single-Parent Households |
| No Children | 0 (0.0%) | 20 (22.7%) |
| 1 or 2 Children | 0 (0.0%) | 29 (37.7%) |
| 3 or 4 Children | 0 (0.0%) | 0 (0.0%) |
| 5 or more Children | 0 (0.0%) | 0 (0.0%) |
| Total | 0 (0.0%) | 49 (29.7%) |
Employment Characteristics in Lordstown
Employment by Class of Employer in Lordstown
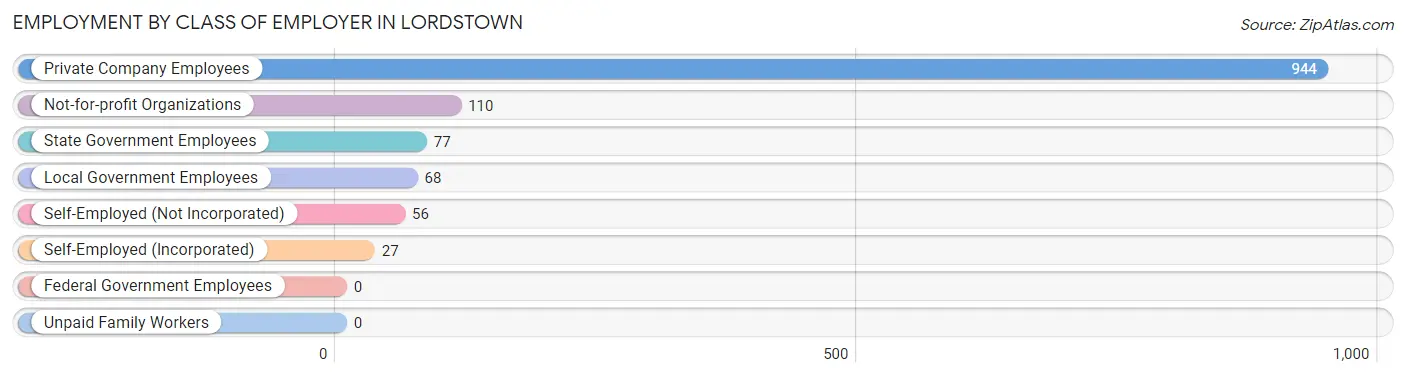
Among the 1,282 employed individuals in Lordstown, private company employees (944 | 73.6%), not-for-profit organizations (110 | 8.6%), and state government employees (77 | 6.0%) make up the most common classes of employment.
| Employer Class | # Employees | % Employees |
| Private Company Employees | 944 | 73.6% |
| Self-Employed (Incorporated) | 27 | 2.1% |
| Self-Employed (Not Incorporated) | 56 | 4.4% |
| Not-for-profit Organizations | 110 | 8.6% |
| Local Government Employees | 68 | 5.3% |
| State Government Employees | 77 | 6.0% |
| Federal Government Employees | 0 | 0.0% |
| Unpaid Family Workers | 0 | 0.0% |
| Total | 1,282 | 100.0% |
Employment Status by Age in Lordstown
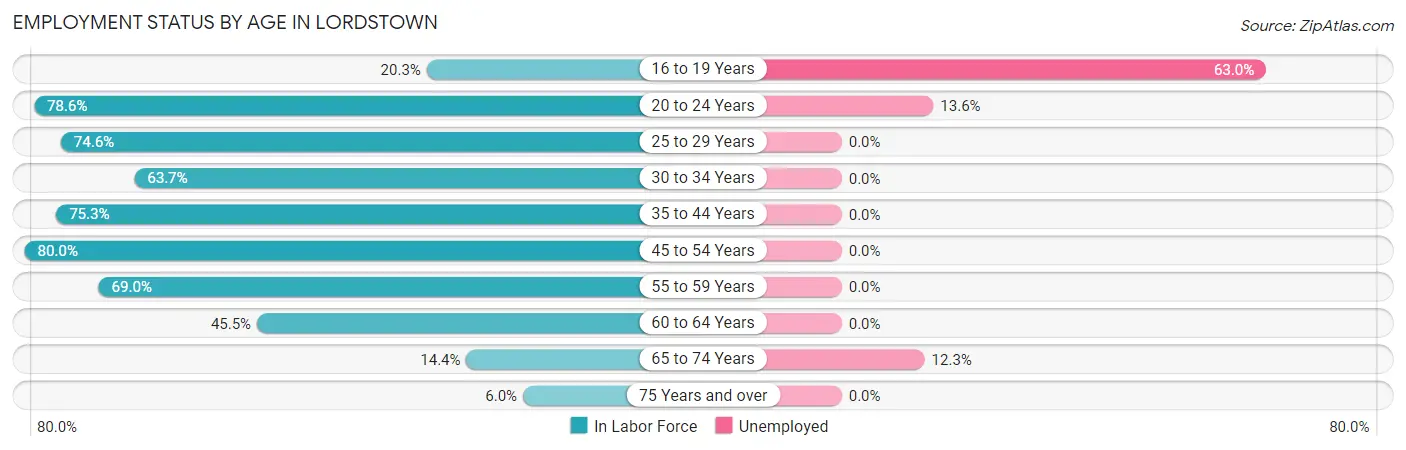
According to the labor force statistics for Lordstown, out of the total population over 16 years of age (2,767), 48.5% or 1,342 individuals are in the labor force, with 3.0% or 40 of them unemployed. The age group with the highest labor force participation rate is 45 to 54 years, with 80.0% or 320 individuals in the labor force. Within the labor force, the 16 to 19 years age range has the highest percentage of unemployed individuals, with 63.0% or 17 of them being unemployed.
| Age Bracket | In Labor Force | Unemployed |
| 16 to 19 Years | 27 (20.3%) | 17 (63.0%) |
| 20 to 24 Years | 103 (78.6%) | 14 (13.6%) |
| 25 to 29 Years | 150 (74.6%) | 0 (0.0%) |
| 30 to 34 Years | 160 (63.7%) | 0 (0.0%) |
| 35 to 44 Years | 265 (75.3%) | 0 (0.0%) |
| 45 to 54 Years | 320 (80.0%) | 0 (0.0%) |
| 55 to 59 Years | 118 (69.0%) | 0 (0.0%) |
| 60 to 64 Years | 101 (45.5%) | 0 (0.0%) |
| 65 to 74 Years | 73 (14.4%) | 9 (12.3%) |
| 75 Years and over | 24 (6.0%) | 0 (0.0%) |
| Total | 1,342 (48.5%) | 40 (3.0%) |
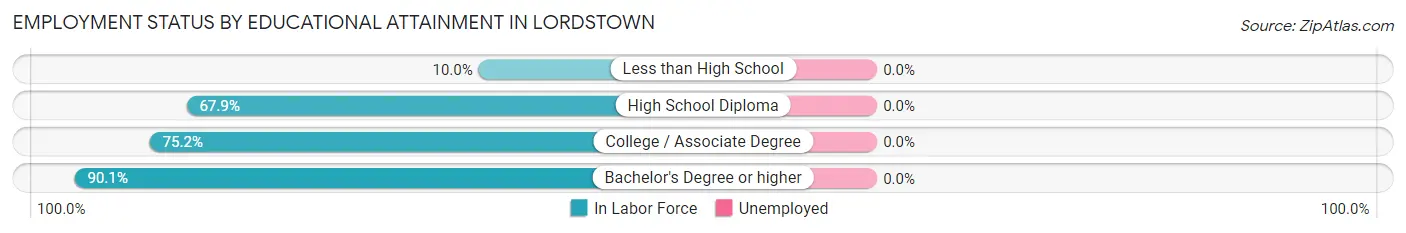
Employment Status by Educational Attainment in Lordstown
| Educational Attainment | In Labor Force | Unemployed |
| Less than High School | 14 (10.0%) | 0 (0.0%) |
| High School Diploma | 393 (67.9%) | 0 (0.0%) |
| College / Associate Degree | 425 (75.2%) | 0 (0.0%) |
| Bachelor's Degree or higher | 282 (90.1%) | 0 (0.0%) |
| Total | 1,115 (69.8%) | 0 (0.0%) |
Employment Occupations by Sex in Lordstown
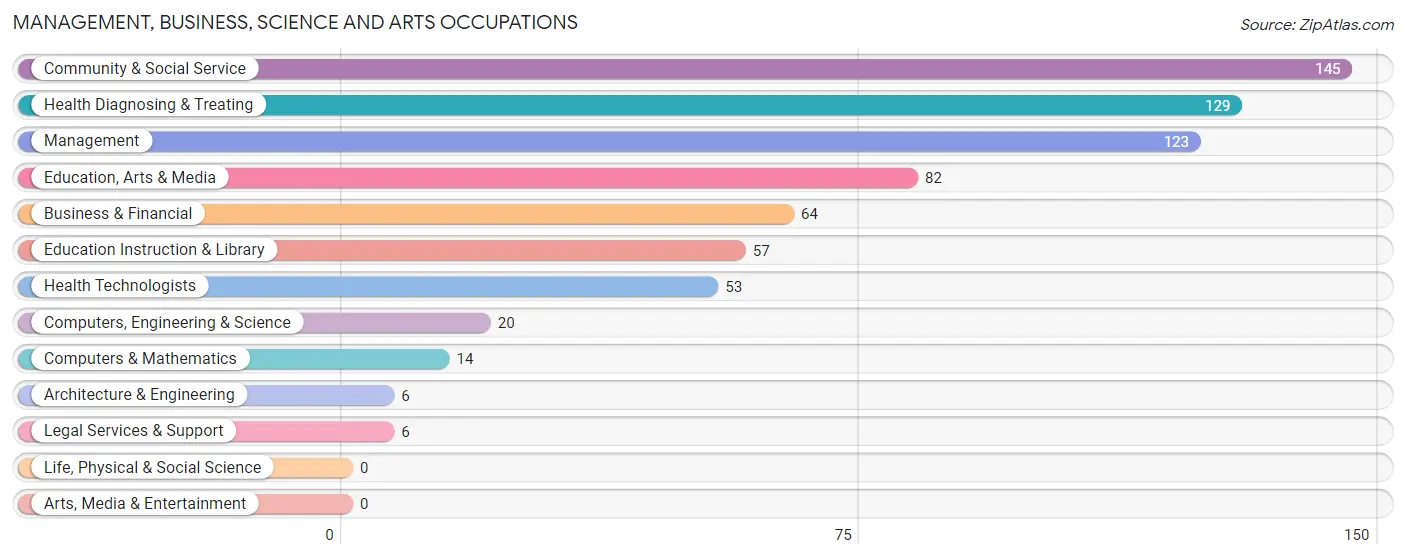
Management, Business, Science and Arts Occupations
The most common Management, Business, Science and Arts occupations in Lordstown are Community & Social Service (145 | 11.2%), Health Diagnosing & Treating (129 | 9.9%), Management (123 | 9.5%), Education, Arts & Media (82 | 6.3%), and Business & Financial (64 | 4.9%).
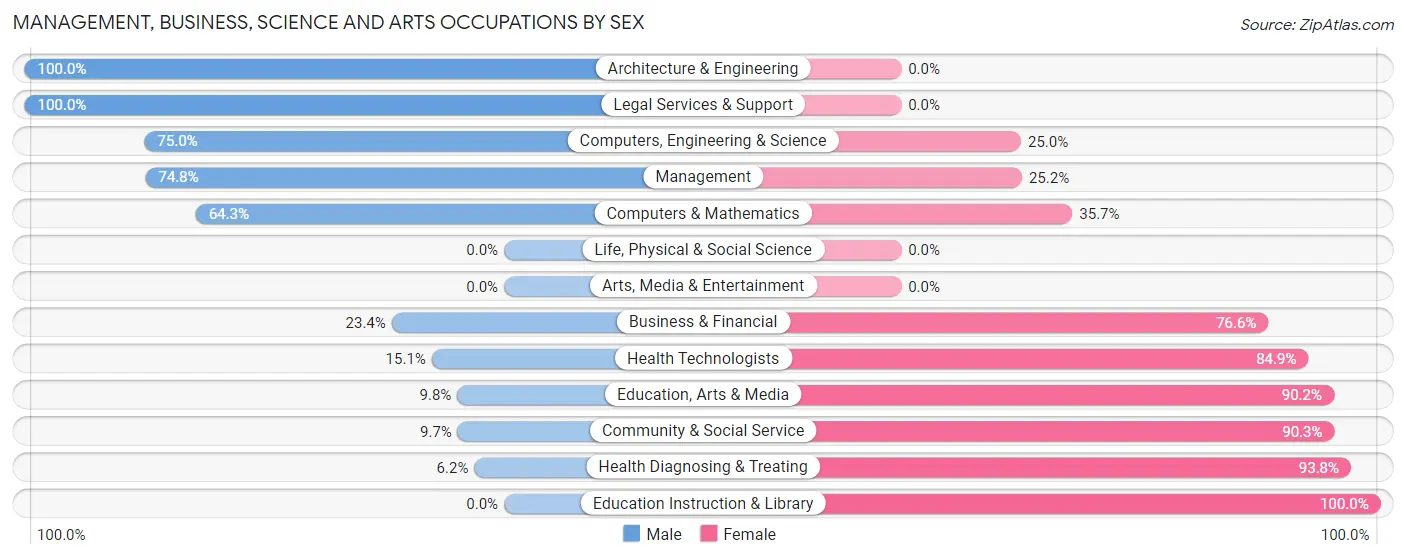
Management, Business, Science and Arts Occupations by Sex
Within the Management, Business, Science and Arts occupations in Lordstown, the most male-oriented occupations are Architecture & Engineering (100.0%), Legal Services & Support (100.0%), and Computers, Engineering & Science (75.0%), while the most female-oriented occupations are Education Instruction & Library (100.0%), Health Diagnosing & Treating (93.8%), and Community & Social Service (90.3%).
| Occupation | Male | Female |
| Management | 92 (74.8%) | 31 (25.2%) |
| Business & Financial | 15 (23.4%) | 49 (76.6%) |
| Computers, Engineering & Science | 15 (75.0%) | 5 (25.0%) |
| Computers & Mathematics | 9 (64.3%) | 5 (35.7%) |
| Architecture & Engineering | 6 (100.0%) | 0 (0.0%) |
| Life, Physical & Social Science | 0 (0.0%) | 0 (0.0%) |
| Community & Social Service | 14 (9.7%) | 131 (90.3%) |
| Education, Arts & Media | 8 (9.8%) | 74 (90.2%) |
| Legal Services & Support | 6 (100.0%) | 0 (0.0%) |
| Education Instruction & Library | 0 (0.0%) | 57 (100.0%) |
| Arts, Media & Entertainment | 0 (0.0%) | 0 (0.0%) |
| Health Diagnosing & Treating | 8 (6.2%) | 121 (93.8%) |
| Health Technologists | 8 (15.1%) | 45 (84.9%) |
| Total (Category) | 144 (29.9%) | 337 (70.1%) |
| Total (Overall) | 677 (52.0%) | 624 (48.0%) |
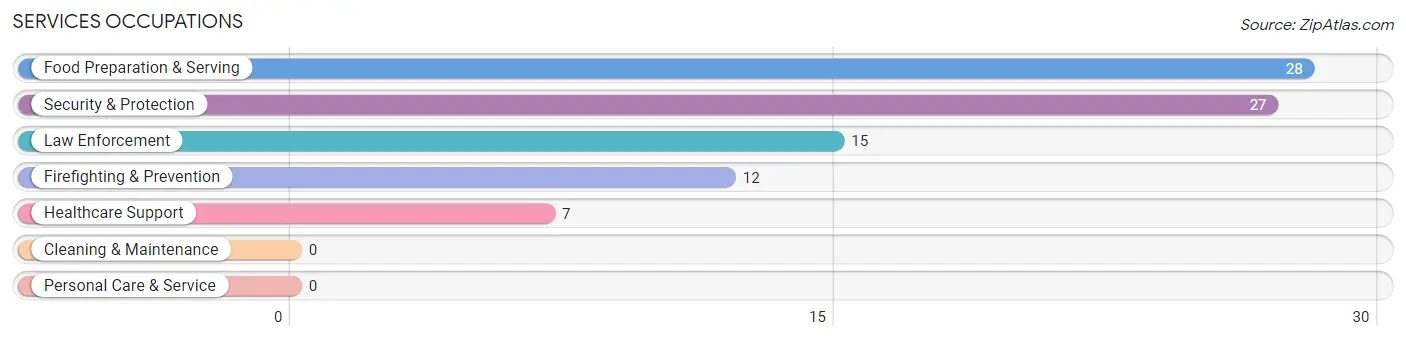
Services Occupations
The most common Services occupations in Lordstown are Food Preparation & Serving (28 | 2.1%), Security & Protection (27 | 2.1%), Law Enforcement (15 | 1.1%), Firefighting & Prevention (12 | 0.9%), and Healthcare Support (7 | 0.5%).
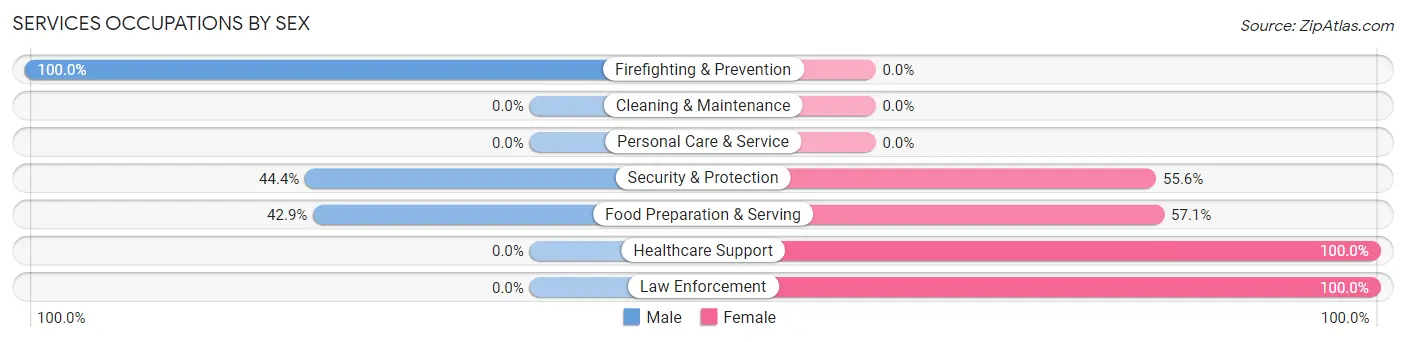
Services Occupations by Sex
Within the Services occupations in Lordstown, the most male-oriented occupations are Firefighting & Prevention (100.0%), Security & Protection (44.4%), and Food Preparation & Serving (42.9%), while the most female-oriented occupations are Healthcare Support (100.0%), Law Enforcement (100.0%), and Food Preparation & Serving (57.1%).
| Occupation | Male | Female |
| Healthcare Support | 0 (0.0%) | 7 (100.0%) |
| Security & Protection | 12 (44.4%) | 15 (55.6%) |
| Firefighting & Prevention | 12 (100.0%) | 0 (0.0%) |
| Law Enforcement | 0 (0.0%) | 15 (100.0%) |
| Food Preparation & Serving | 12 (42.9%) | 16 (57.1%) |
| Cleaning & Maintenance | 0 (0.0%) | 0 (0.0%) |
| Personal Care & Service | 0 (0.0%) | 0 (0.0%) |
| Total (Category) | 24 (38.7%) | 38 (61.3%) |
| Total (Overall) | 677 (52.0%) | 624 (48.0%) |
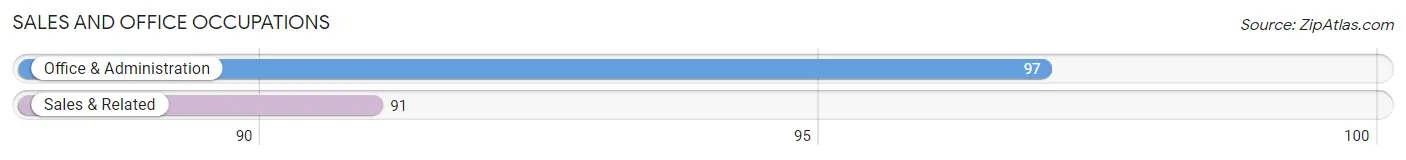
Sales and Office Occupations
The most common Sales and Office occupations in Lordstown are Office & Administration (97 | 7.5%), and Sales & Related (91 | 7.0%).
Sales and Office Occupations by Sex
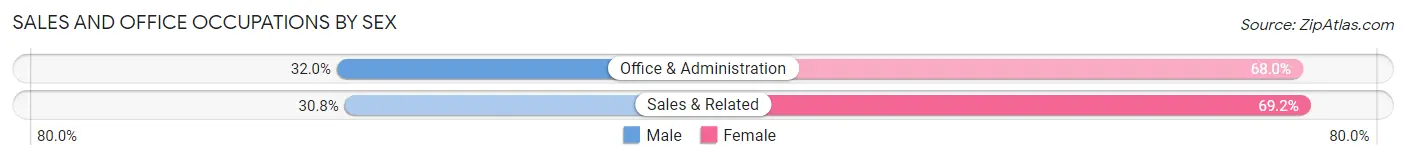
| Occupation | Male | Female |
| Sales & Related | 28 (30.8%) | 63 (69.2%) |
| Office & Administration | 31 (32.0%) | 66 (68.0%) |
| Total (Category) | 59 (31.4%) | 129 (68.6%) |
| Total (Overall) | 677 (52.0%) | 624 (48.0%) |
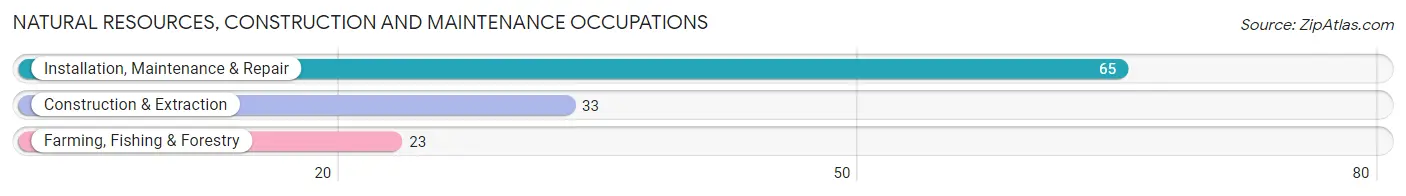
Natural Resources, Construction and Maintenance Occupations
The most common Natural Resources, Construction and Maintenance occupations in Lordstown are Installation, Maintenance & Repair (65 | 5.0%), Construction & Extraction (33 | 2.5%), and Farming, Fishing & Forestry (23 | 1.8%).
Natural Resources, Construction and Maintenance Occupations by Sex
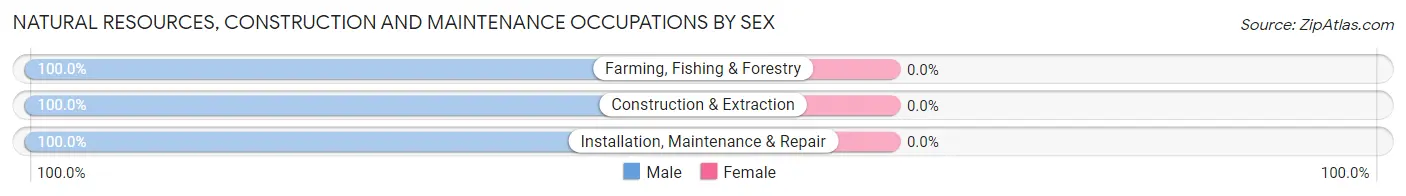
| Occupation | Male | Female |
| Farming, Fishing & Forestry | 23 (100.0%) | 0 (0.0%) |
| Construction & Extraction | 33 (100.0%) | 0 (0.0%) |
| Installation, Maintenance & Repair | 65 (100.0%) | 0 (0.0%) |
| Total (Category) | 121 (100.0%) | 0 (0.0%) |
| Total (Overall) | 677 (52.0%) | 624 (48.0%) |
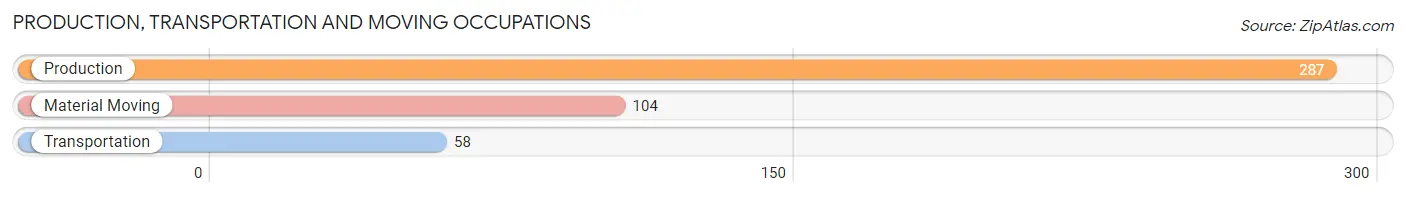
Production, Transportation and Moving Occupations
The most common Production, Transportation and Moving occupations in Lordstown are Production (287 | 22.1%), Material Moving (104 | 8.0%), and Transportation (58 | 4.5%).
Production, Transportation and Moving Occupations by Sex
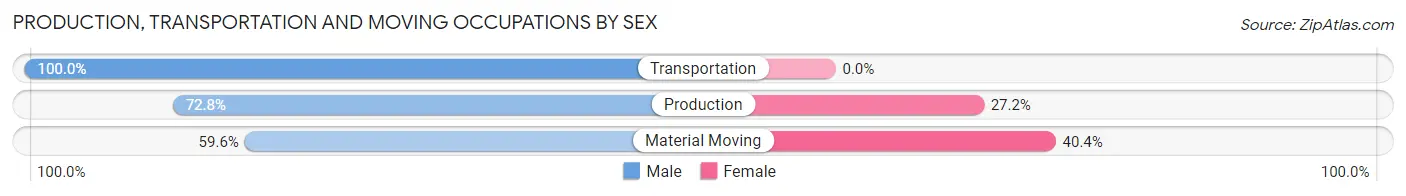
| Occupation | Male | Female |
| Production | 209 (72.8%) | 78 (27.2%) |
| Transportation | 58 (100.0%) | 0 (0.0%) |
| Material Moving | 62 (59.6%) | 42 (40.4%) |
| Total (Category) | 329 (73.3%) | 120 (26.7%) |
| Total (Overall) | 677 (52.0%) | 624 (48.0%) |
Employment Industries by Sex in Lordstown
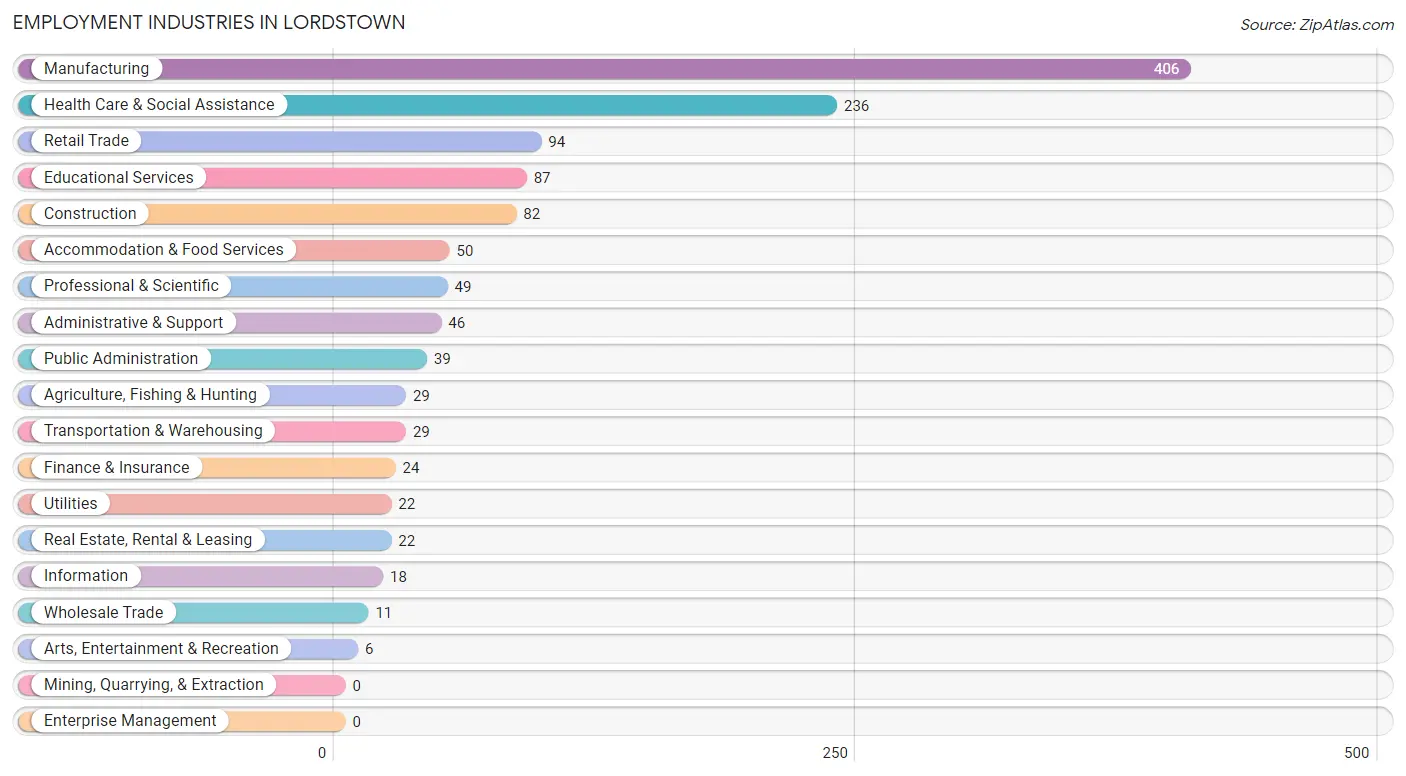
Employment Industries in Lordstown
The major employment industries in Lordstown include Manufacturing (406 | 31.2%), Health Care & Social Assistance (236 | 18.1%), Retail Trade (94 | 7.2%), Educational Services (87 | 6.7%), and Construction (82 | 6.3%).
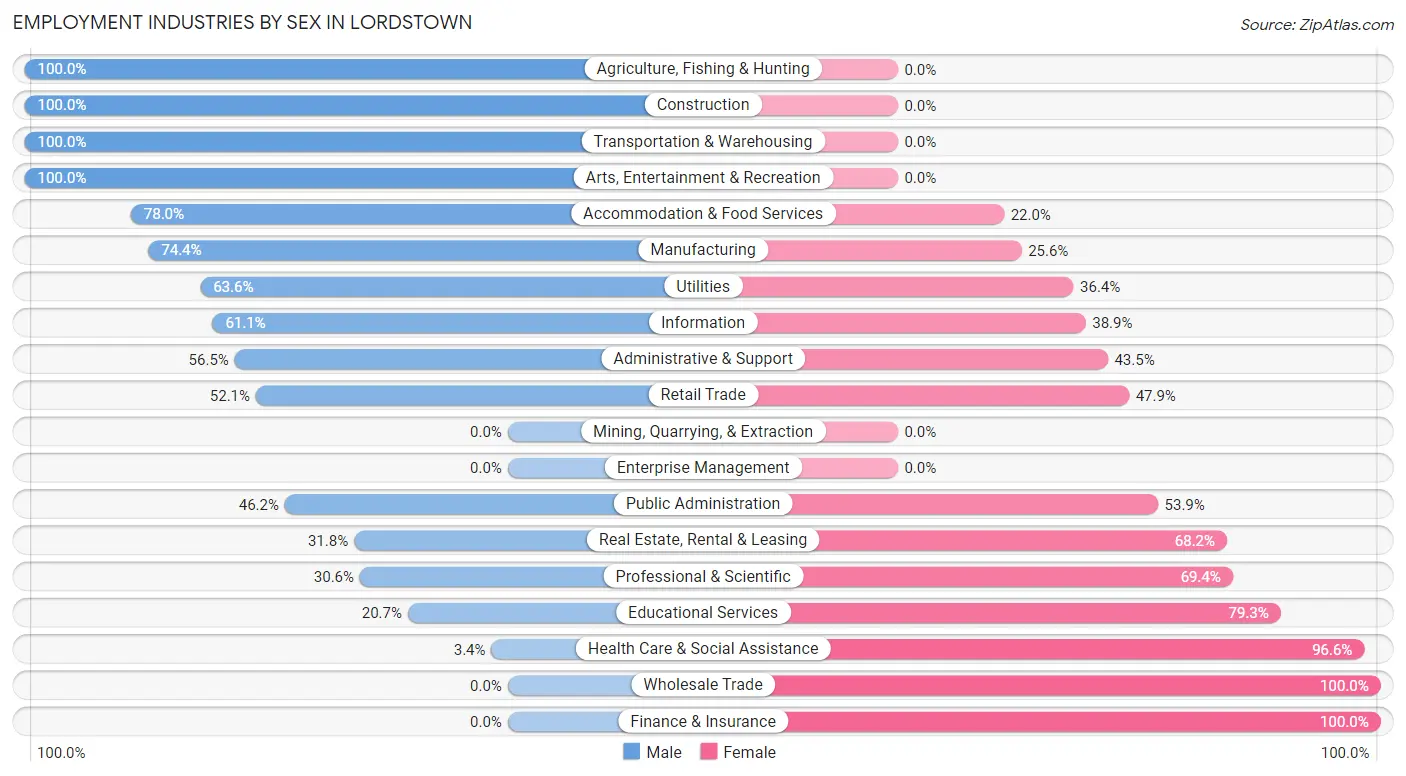
Employment Industries by Sex in Lordstown
The Lordstown industries that see more men than women are Agriculture, Fishing & Hunting (100.0%), Construction (100.0%), and Transportation & Warehousing (100.0%), whereas the industries that tend to have a higher number of women are Wholesale Trade (100.0%), Finance & Insurance (100.0%), and Health Care & Social Assistance (96.6%).
| Industry | Male | Female |
| Agriculture, Fishing & Hunting | 29 (100.0%) | 0 (0.0%) |
| Mining, Quarrying, & Extraction | 0 (0.0%) | 0 (0.0%) |
| Construction | 82 (100.0%) | 0 (0.0%) |
| Manufacturing | 302 (74.4%) | 104 (25.6%) |
| Wholesale Trade | 0 (0.0%) | 11 (100.0%) |
| Retail Trade | 49 (52.1%) | 45 (47.9%) |
| Transportation & Warehousing | 29 (100.0%) | 0 (0.0%) |
| Utilities | 14 (63.6%) | 8 (36.4%) |
| Information | 11 (61.1%) | 7 (38.9%) |
| Finance & Insurance | 0 (0.0%) | 24 (100.0%) |
| Real Estate, Rental & Leasing | 7 (31.8%) | 15 (68.2%) |
| Professional & Scientific | 15 (30.6%) | 34 (69.4%) |
| Enterprise Management | 0 (0.0%) | 0 (0.0%) |
| Administrative & Support | 26 (56.5%) | 20 (43.5%) |
| Educational Services | 18 (20.7%) | 69 (79.3%) |
| Health Care & Social Assistance | 8 (3.4%) | 228 (96.6%) |
| Arts, Entertainment & Recreation | 6 (100.0%) | 0 (0.0%) |
| Accommodation & Food Services | 39 (78.0%) | 11 (22.0%) |
| Public Administration | 18 (46.2%) | 21 (53.8%) |
| Total | 677 (52.0%) | 624 (48.0%) |
Education in Lordstown
School Enrollment in Lordstown
The most common levels of schooling among the 556 students in Lordstown are elementary school (226 | 40.6%), high school (108 | 19.4%), and middle school (107 | 19.2%).
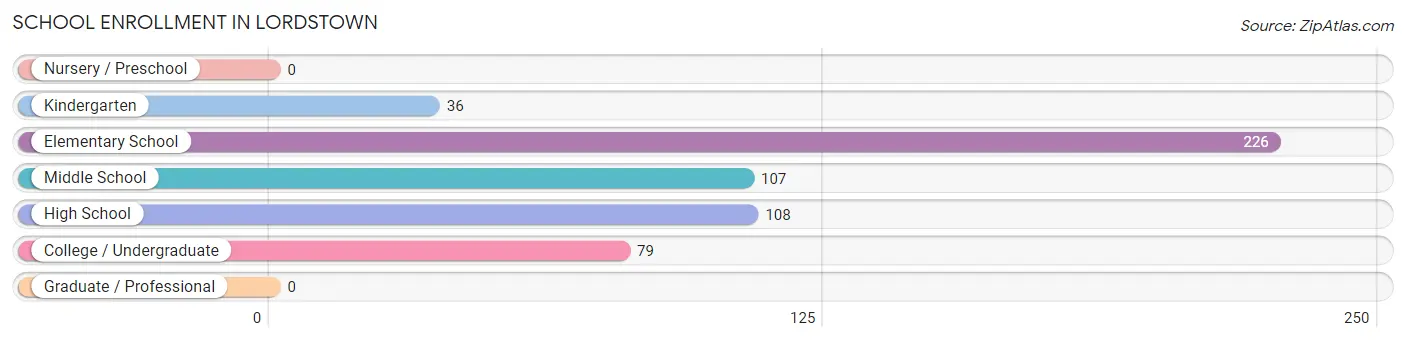
| School Level | # Students | % Students |
| Nursery / Preschool | 0 | 0.0% |
| Kindergarten | 36 | 6.5% |
| Elementary School | 226 | 40.6% |
| Middle School | 107 | 19.2% |
| High School | 108 | 19.4% |
| College / Undergraduate | 79 | 14.2% |
| Graduate / Professional | 0 | 0.0% |
| Total | 556 | 100.0% |
School Enrollment by Age by Funding Source in Lordstown
Out of a total of 556 students who are enrolled in schools in Lordstown, 23 (4.1%) attend a private institution, while the remaining 533 (95.9%) are enrolled in public schools. The age group of 25 to 34 year olds has the highest likelihood of being enrolled in private schools, with 14 (100.0% in the age bracket) enrolled. Conversely, the age group of 5 to 9 year old has the lowest likelihood of being enrolled in a private school, with 265 (100.0% in the age bracket) attending a public institution.
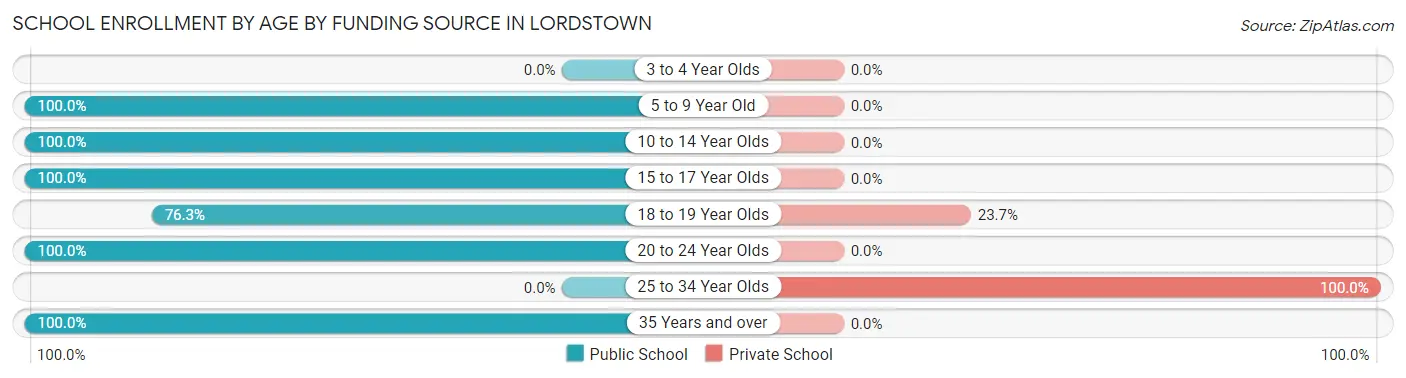
| Age Bracket | Public School | Private School |
| 3 to 4 Year Olds | 0 (0.0%) | 0 (0.0%) |
| 5 to 9 Year Old | 265 (100.0%) | 0 (0.0%) |
| 10 to 14 Year Olds | 110 (100.0%) | 0 (0.0%) |
| 15 to 17 Year Olds | 69 (100.0%) | 0 (0.0%) |
| 18 to 19 Year Olds | 29 (76.3%) | 9 (23.7%) |
| 20 to 24 Year Olds | 39 (100.0%) | 0 (0.0%) |
| 25 to 34 Year Olds | 0 (0.0%) | 14 (100.0%) |
| 35 Years and over | 21 (100.0%) | 0 (0.0%) |
| Total | 533 (95.9%) | 23 (4.1%) |
Educational Attainment by Field of Study in Lordstown
Science & technology (86 | 19.5%), business (78 | 17.7%), education (67 | 15.2%), communications (46 | 10.4%), and bio, nature & agricultural (35 | 7.9%) are the most common fields of study among 441 individuals in Lordstown who have obtained a bachelor's degree or higher.
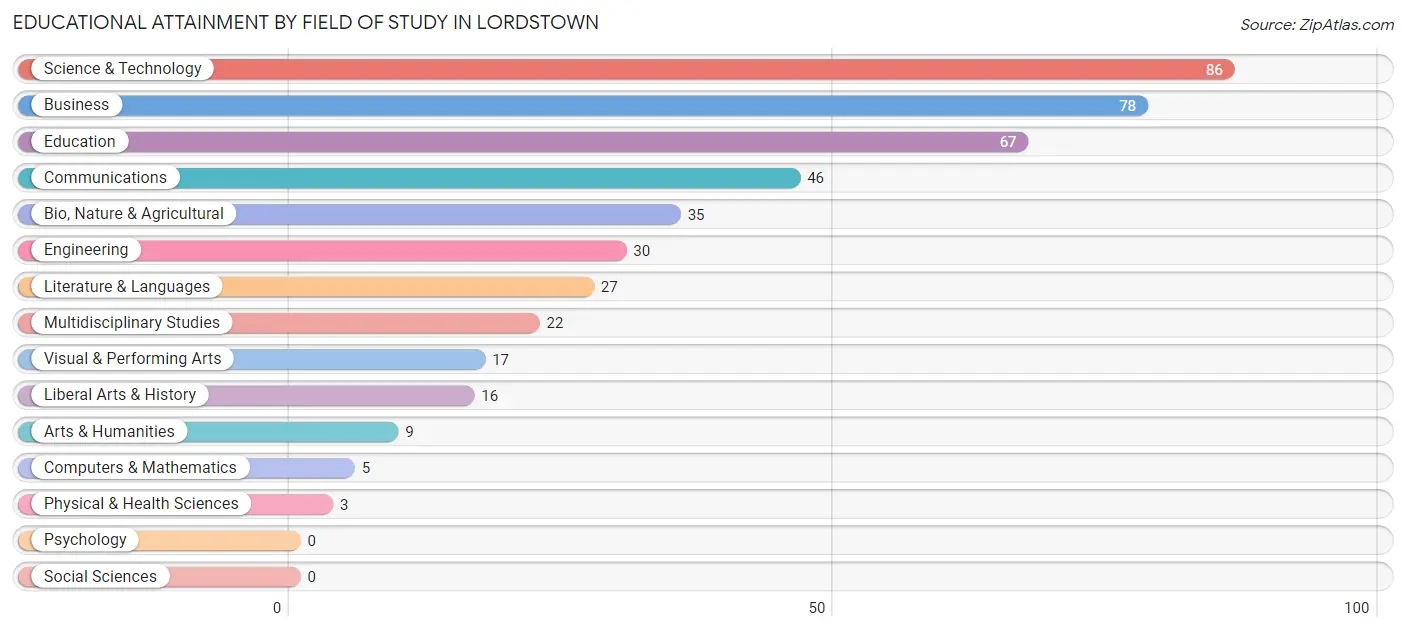
| Field of Study | # Graduates | % Graduates |
| Computers & Mathematics | 5 | 1.1% |
| Bio, Nature & Agricultural | 35 | 7.9% |
| Physical & Health Sciences | 3 | 0.7% |
| Psychology | 0 | 0.0% |
| Social Sciences | 0 | 0.0% |
| Engineering | 30 | 6.8% |
| Multidisciplinary Studies | 22 | 5.0% |
| Science & Technology | 86 | 19.5% |
| Business | 78 | 17.7% |
| Education | 67 | 15.2% |
| Literature & Languages | 27 | 6.1% |
| Liberal Arts & History | 16 | 3.6% |
| Visual & Performing Arts | 17 | 3.8% |
| Communications | 46 | 10.4% |
| Arts & Humanities | 9 | 2.0% |
| Total | 441 | 100.0% |
Transportation & Commute in Lordstown
Vehicle Availability by Sex in Lordstown
The most prevalent vehicle ownership categories in Lordstown are males with 2 vehicles (354, accounting for 53.1%) and females with 2 vehicles (359, making up 57.6%).
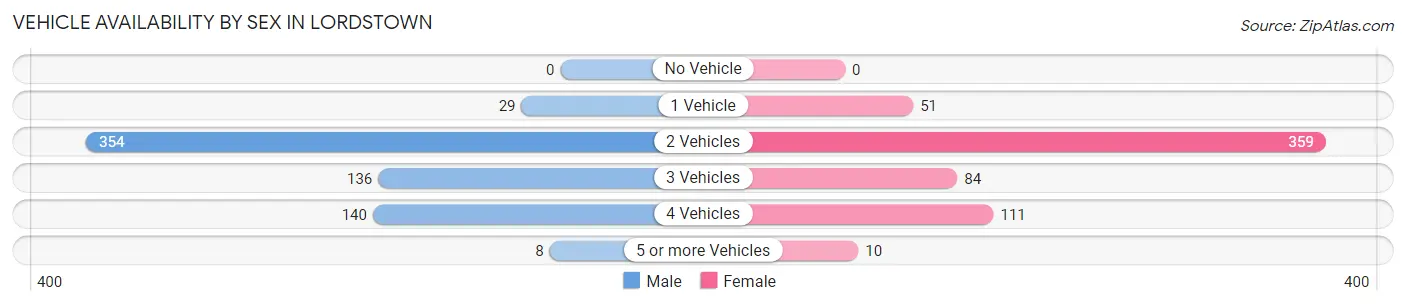
| Vehicles Available | Male | Female |
| No Vehicle | 0 (0.0%) | 0 (0.0%) |
| 1 Vehicle | 29 (4.3%) | 51 (8.3%) |
| 2 Vehicles | 354 (53.1%) | 359 (58.4%) |
| 3 Vehicles | 136 (20.4%) | 84 (13.7%) |
| 4 Vehicles | 140 (21.0%) | 111 (18.0%) |
| 5 or more Vehicles | 8 (1.2%) | 10 (1.6%) |
| Total | 667 (100.0%) | 615 (100.0%) |
Commute Time in Lordstown
The most frequently occuring commute durations in Lordstown are 15 to 19 minutes (270 commuters, 21.9%), 20 to 24 minutes (211 commuters, 17.1%), and 30 to 34 minutes (117 commuters, 9.5%).
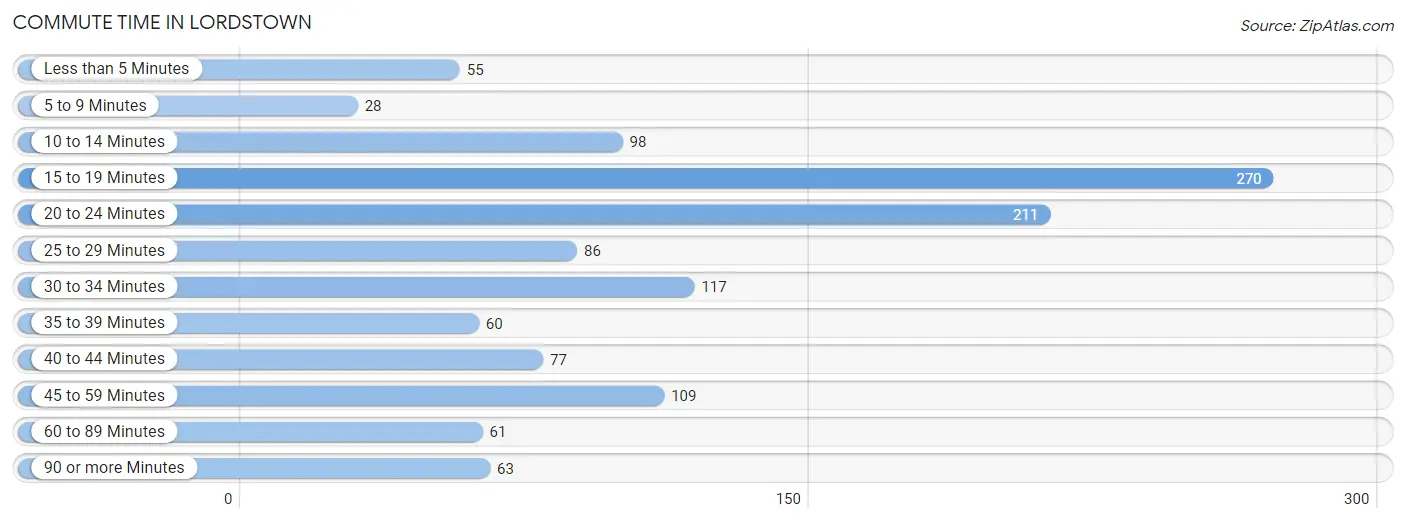
| Commute Time | # Commuters | % Commuters |
| Less than 5 Minutes | 55 | 4.4% |
| 5 to 9 Minutes | 28 | 2.3% |
| 10 to 14 Minutes | 98 | 7.9% |
| 15 to 19 Minutes | 270 | 21.9% |
| 20 to 24 Minutes | 211 | 17.1% |
| 25 to 29 Minutes | 86 | 7.0% |
| 30 to 34 Minutes | 117 | 9.5% |
| 35 to 39 Minutes | 60 | 4.9% |
| 40 to 44 Minutes | 77 | 6.2% |
| 45 to 59 Minutes | 109 | 8.8% |
| 60 to 89 Minutes | 61 | 4.9% |
| 90 or more Minutes | 63 | 5.1% |
Commute Time by Sex in Lordstown
The most common commute times in Lordstown are 15 to 19 minutes (140 commuters, 21.3%) for males and 15 to 19 minutes (130 commuters, 22.5%) for females.
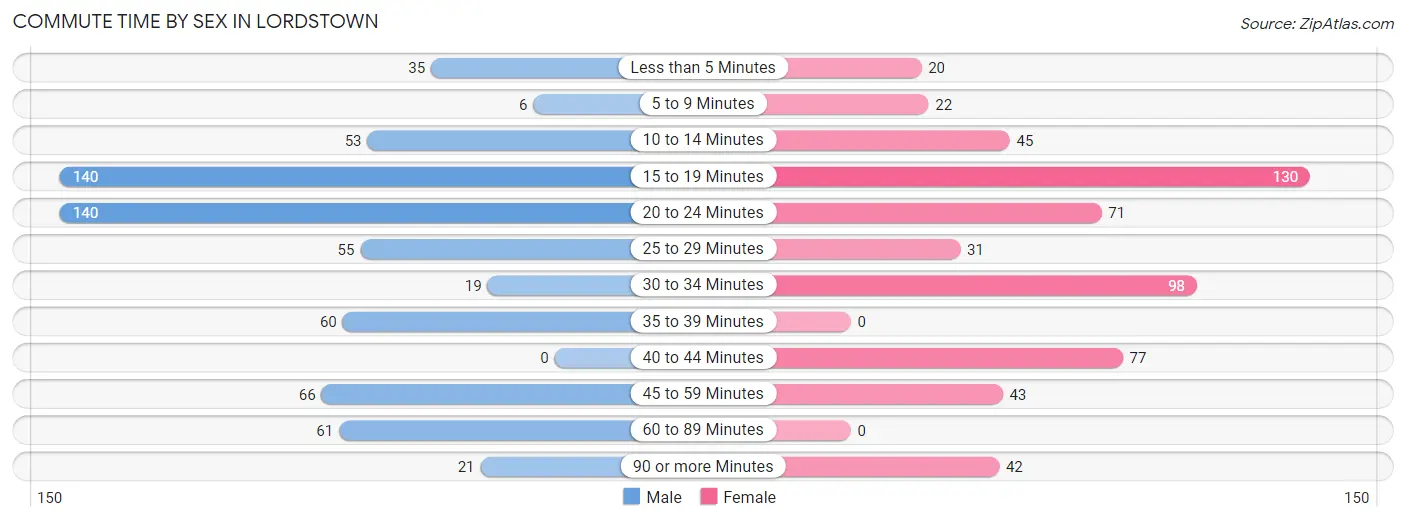
| Commute Time | Male | Female |
| Less than 5 Minutes | 35 (5.3%) | 20 (3.5%) |
| 5 to 9 Minutes | 6 (0.9%) | 22 (3.8%) |
| 10 to 14 Minutes | 53 (8.1%) | 45 (7.8%) |
| 15 to 19 Minutes | 140 (21.3%) | 130 (22.5%) |
| 20 to 24 Minutes | 140 (21.3%) | 71 (12.3%) |
| 25 to 29 Minutes | 55 (8.4%) | 31 (5.3%) |
| 30 to 34 Minutes | 19 (2.9%) | 98 (16.9%) |
| 35 to 39 Minutes | 60 (9.1%) | 0 (0.0%) |
| 40 to 44 Minutes | 0 (0.0%) | 77 (13.3%) |
| 45 to 59 Minutes | 66 (10.1%) | 43 (7.4%) |
| 60 to 89 Minutes | 61 (9.3%) | 0 (0.0%) |
| 90 or more Minutes | 21 (3.2%) | 42 (7.2%) |
Time of Departure to Work by Sex in Lordstown
The most frequent times of departure to work in Lordstown are 7:30 AM to 7:59 AM (112, 17.1%) for males and 7:30 AM to 7:59 AM (125, 21.6%) for females.
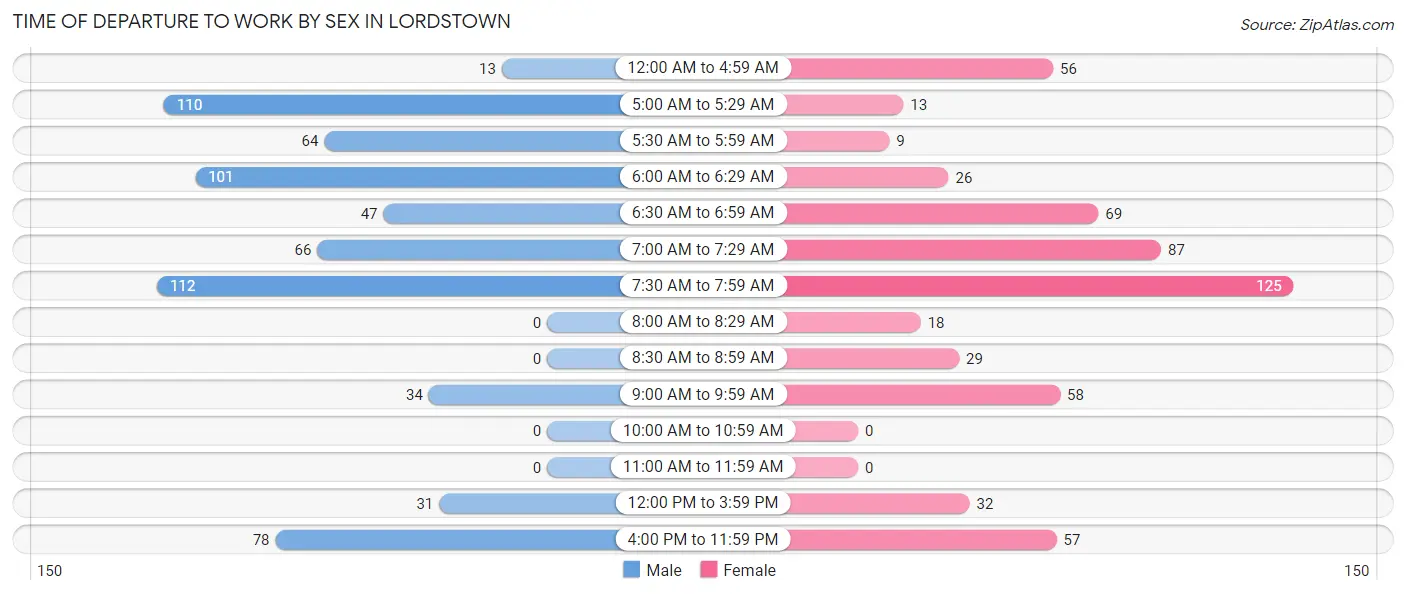
| Time of Departure | Male | Female |
| 12:00 AM to 4:59 AM | 13 (2.0%) | 56 (9.7%) |
| 5:00 AM to 5:29 AM | 110 (16.8%) | 13 (2.2%) |
| 5:30 AM to 5:59 AM | 64 (9.8%) | 9 (1.5%) |
| 6:00 AM to 6:29 AM | 101 (15.4%) | 26 (4.5%) |
| 6:30 AM to 6:59 AM | 47 (7.2%) | 69 (11.9%) |
| 7:00 AM to 7:29 AM | 66 (10.1%) | 87 (15.0%) |
| 7:30 AM to 7:59 AM | 112 (17.1%) | 125 (21.6%) |
| 8:00 AM to 8:29 AM | 0 (0.0%) | 18 (3.1%) |
| 8:30 AM to 8:59 AM | 0 (0.0%) | 29 (5.0%) |
| 9:00 AM to 9:59 AM | 34 (5.2%) | 58 (10.0%) |
| 10:00 AM to 10:59 AM | 0 (0.0%) | 0 (0.0%) |
| 11:00 AM to 11:59 AM | 0 (0.0%) | 0 (0.0%) |
| 12:00 PM to 3:59 PM | 31 (4.7%) | 32 (5.5%) |
| 4:00 PM to 11:59 PM | 78 (11.9%) | 57 (9.8%) |
| Total | 656 (100.0%) | 579 (100.0%) |
Housing Occupancy in Lordstown
Occupancy by Ownership in Lordstown
Of the total 1,259 dwellings in Lordstown, owner-occupied units account for 1,068 (84.8%), while renter-occupied units make up 191 (15.2%).
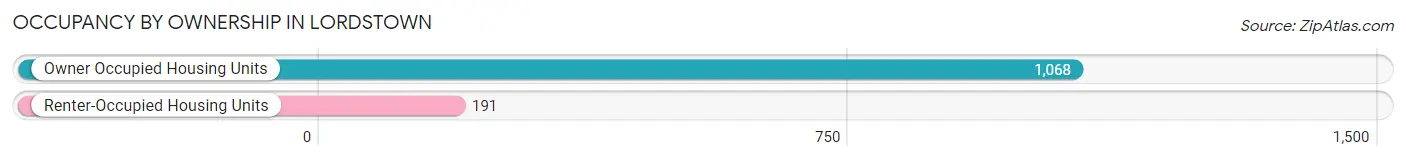
| Occupancy | # Housing Units | % Housing Units |
| Owner Occupied Housing Units | 1,068 | 84.8% |
| Renter-Occupied Housing Units | 191 | 15.2% |
| Total Occupied Housing Units | 1,259 | 100.0% |
Occupancy by Household Size in Lordstown
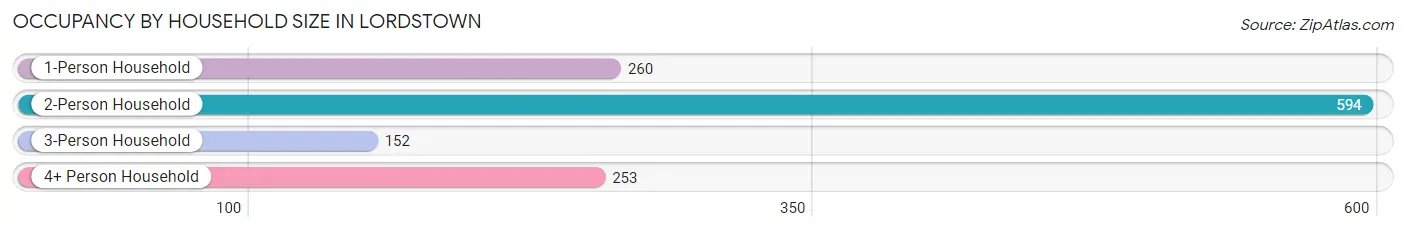
| Household Size | # Housing Units | % Housing Units |
| 1-Person Household | 260 | 20.6% |
| 2-Person Household | 594 | 47.2% |
| 3-Person Household | 152 | 12.1% |
| 4+ Person Household | 253 | 20.1% |
| Total Housing Units | 1,259 | 100.0% |
Occupancy by Ownership by Household Size in Lordstown
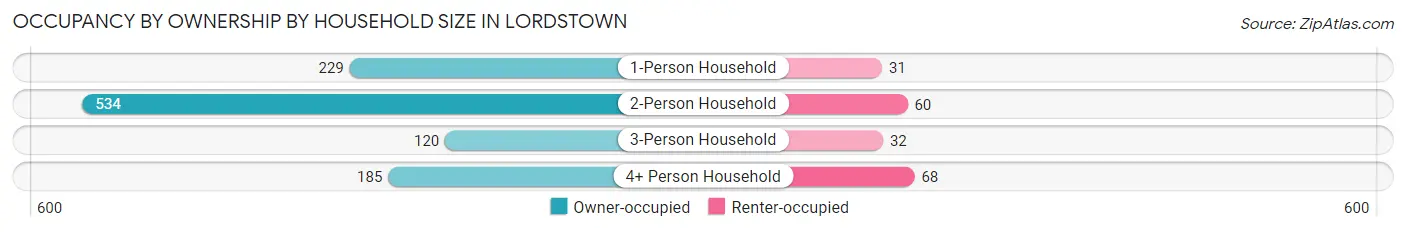
| Household Size | Owner-occupied | Renter-occupied |
| 1-Person Household | 229 (88.1%) | 31 (11.9%) |
| 2-Person Household | 534 (89.9%) | 60 (10.1%) |
| 3-Person Household | 120 (78.9%) | 32 (21.0%) |
| 4+ Person Household | 185 (73.1%) | 68 (26.9%) |
| Total Housing Units | 1,068 (84.8%) | 191 (15.2%) |
Occupancy by Educational Attainment in Lordstown
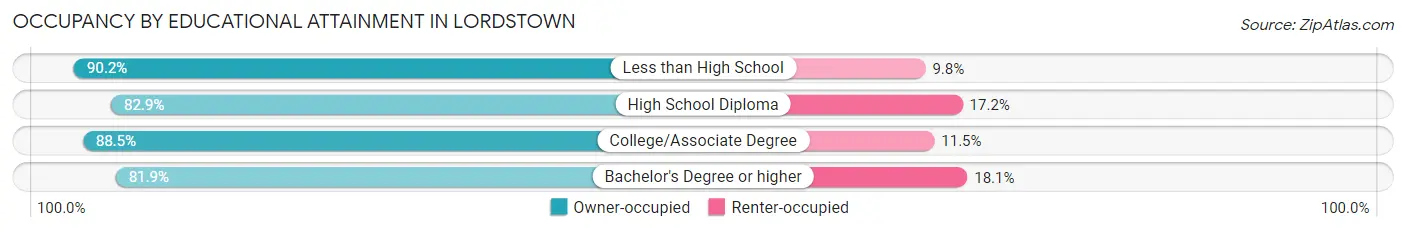
| Household Size | Owner-occupied | Renter-occupied |
| Less than High School | 83 (90.2%) | 9 (9.8%) |
| High School Diploma | 459 (82.9%) | 95 (17.2%) |
| College/Associate Degree | 322 (88.5%) | 42 (11.5%) |
| Bachelor's Degree or higher | 204 (81.9%) | 45 (18.1%) |
Occupancy by Age of Householder in Lordstown
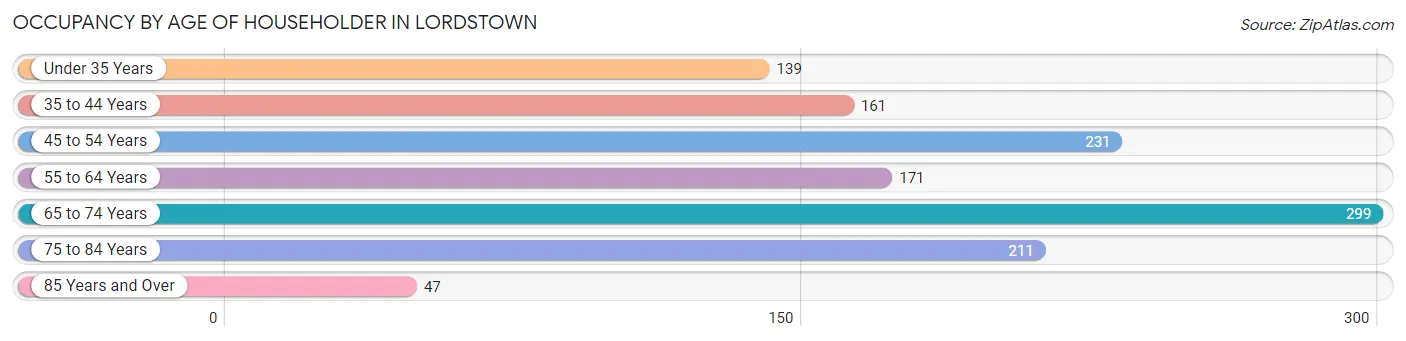
| Age Bracket | # Households | % Households |
| Under 35 Years | 139 | 11.0% |
| 35 to 44 Years | 161 | 12.8% |
| 45 to 54 Years | 231 | 18.3% |
| 55 to 64 Years | 171 | 13.6% |
| 65 to 74 Years | 299 | 23.7% |
| 75 to 84 Years | 211 | 16.8% |
| 85 Years and Over | 47 | 3.7% |
| Total | 1,259 | 100.0% |
Housing Finances in Lordstown
Median Income by Occupancy in Lordstown
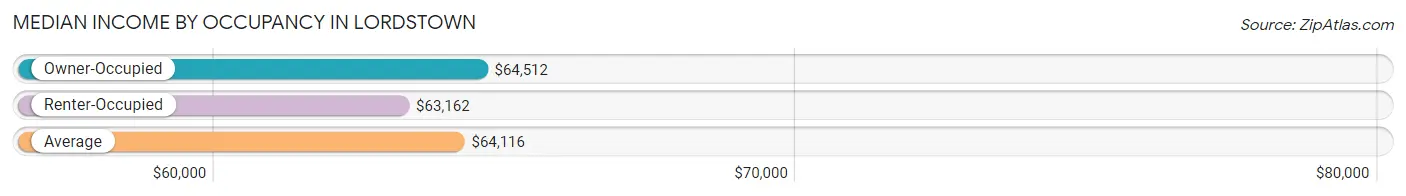
| Occupancy Type | # Households | Median Income |
| Owner-Occupied | 1,068 (84.8%) | $64,512 |
| Renter-Occupied | 191 (15.2%) | $63,162 |
| Average | 1,259 (100.0%) | $64,116 |
Occupancy by Householder Income Bracket in Lordstown
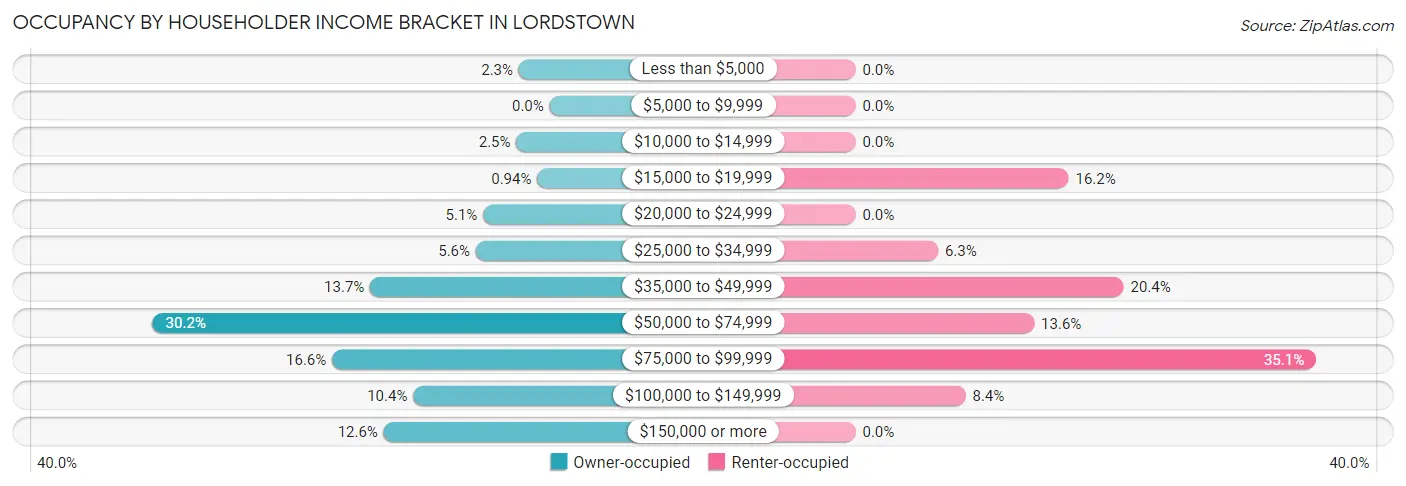
| Income Bracket | Owner-occupied | Renter-occupied |
| Less than $5,000 | 25 (2.3%) | 0 (0.0%) |
| $5,000 to $9,999 | 0 (0.0%) | 0 (0.0%) |
| $10,000 to $14,999 | 27 (2.5%) | 0 (0.0%) |
| $15,000 to $19,999 | 10 (0.9%) | 31 (16.2%) |
| $20,000 to $24,999 | 54 (5.1%) | 0 (0.0%) |
| $25,000 to $34,999 | 60 (5.6%) | 12 (6.3%) |
| $35,000 to $49,999 | 146 (13.7%) | 39 (20.4%) |
| $50,000 to $74,999 | 323 (30.2%) | 26 (13.6%) |
| $75,000 to $99,999 | 177 (16.6%) | 67 (35.1%) |
| $100,000 to $149,999 | 111 (10.4%) | 16 (8.4%) |
| $150,000 or more | 135 (12.6%) | 0 (0.0%) |
| Total | 1,068 (100.0%) | 191 (100.0%) |
Monthly Housing Cost Tiers in Lordstown
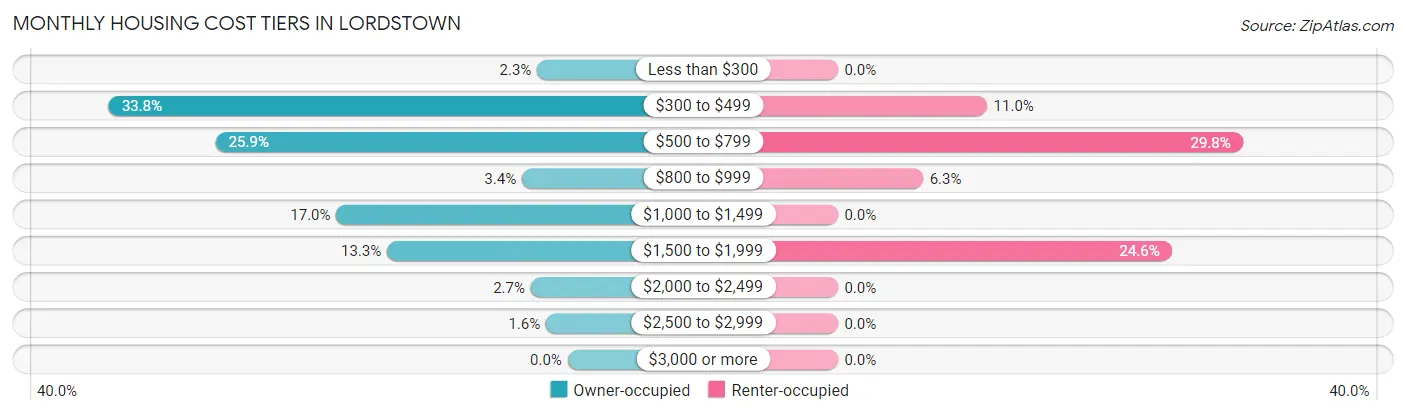
| Monthly Cost | Owner-occupied | Renter-occupied |
| Less than $300 | 24 (2.2%) | 0 (0.0%) |
| $300 to $499 | 361 (33.8%) | 21 (11.0%) |
| $500 to $799 | 277 (25.9%) | 57 (29.8%) |
| $800 to $999 | 36 (3.4%) | 12 (6.3%) |
| $1,000 to $1,499 | 182 (17.0%) | 0 (0.0%) |
| $1,500 to $1,999 | 142 (13.3%) | 47 (24.6%) |
| $2,000 to $2,499 | 29 (2.7%) | 0 (0.0%) |
| $2,500 to $2,999 | 17 (1.6%) | 0 (0.0%) |
| $3,000 or more | 0 (0.0%) | 0 (0.0%) |
| Total | 1,068 (100.0%) | 191 (100.0%) |
Physical Housing Characteristics in Lordstown
Housing Structures in Lordstown
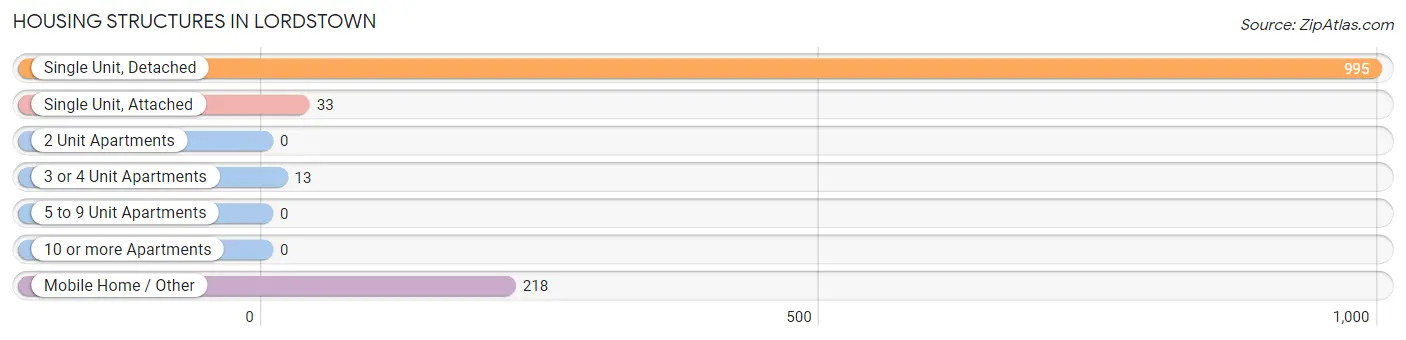
| Structure Type | # Housing Units | % Housing Units |
| Single Unit, Detached | 995 | 79.0% |
| Single Unit, Attached | 33 | 2.6% |
| 2 Unit Apartments | 0 | 0.0% |
| 3 or 4 Unit Apartments | 13 | 1.0% |
| 5 to 9 Unit Apartments | 0 | 0.0% |
| 10 or more Apartments | 0 | 0.0% |
| Mobile Home / Other | 218 | 17.3% |
| Total | 1,259 | 100.0% |
Housing Structures by Occupancy in Lordstown
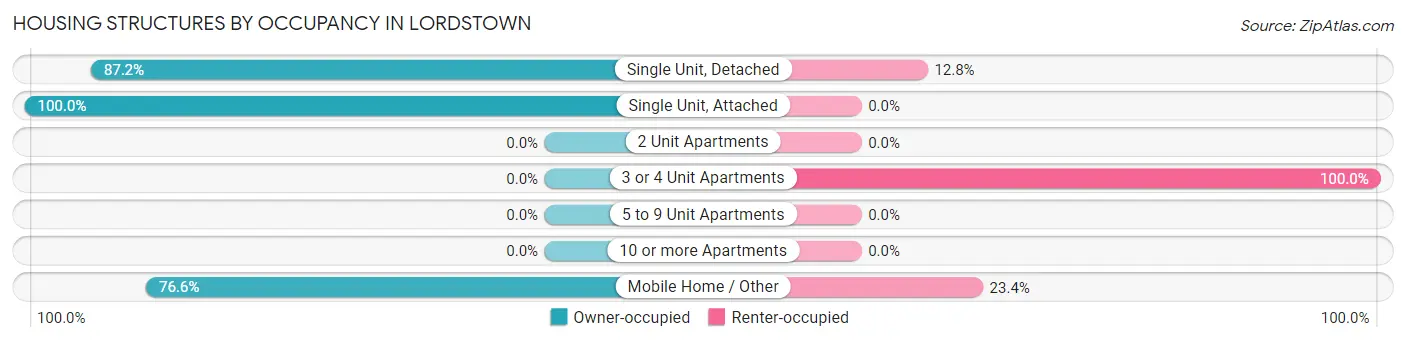
| Structure Type | Owner-occupied | Renter-occupied |
| Single Unit, Detached | 868 (87.2%) | 127 (12.8%) |
| Single Unit, Attached | 33 (100.0%) | 0 (0.0%) |
| 2 Unit Apartments | 0 (0.0%) | 0 (0.0%) |
| 3 or 4 Unit Apartments | 0 (0.0%) | 13 (100.0%) |
| 5 to 9 Unit Apartments | 0 (0.0%) | 0 (0.0%) |
| 10 or more Apartments | 0 (0.0%) | 0 (0.0%) |
| Mobile Home / Other | 167 (76.6%) | 51 (23.4%) |
| Total | 1,068 (84.8%) | 191 (15.2%) |
Housing Structures by Number of Rooms in Lordstown
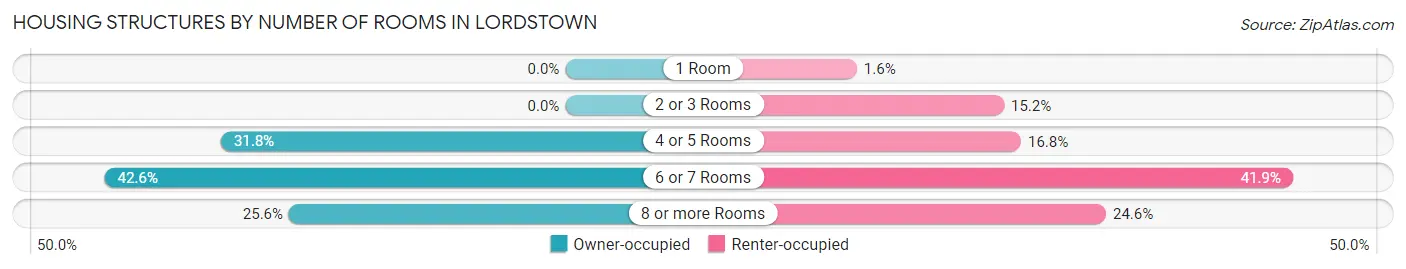
| Number of Rooms | Owner-occupied | Renter-occupied |
| 1 Room | 0 (0.0%) | 3 (1.6%) |
| 2 or 3 Rooms | 0 (0.0%) | 29 (15.2%) |
| 4 or 5 Rooms | 340 (31.8%) | 32 (16.8%) |
| 6 or 7 Rooms | 455 (42.6%) | 80 (41.9%) |
| 8 or more Rooms | 273 (25.6%) | 47 (24.6%) |
| Total | 1,068 (100.0%) | 191 (100.0%) |
Housing Structure by Heating Type in Lordstown
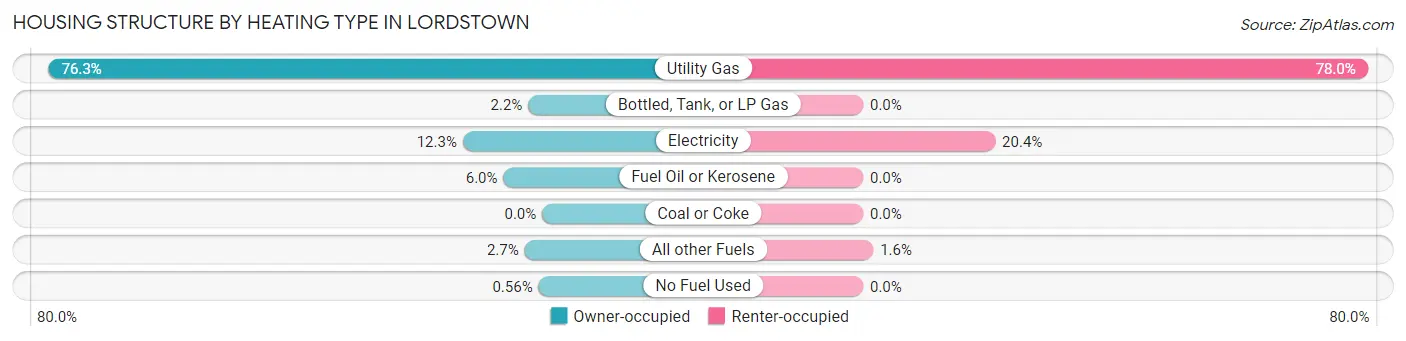
| Heating Type | Owner-occupied | Renter-occupied |
| Utility Gas | 815 (76.3%) | 149 (78.0%) |
| Bottled, Tank, or LP Gas | 23 (2.1%) | 0 (0.0%) |
| Electricity | 131 (12.3%) | 39 (20.4%) |
| Fuel Oil or Kerosene | 64 (6.0%) | 0 (0.0%) |
| Coal or Coke | 0 (0.0%) | 0 (0.0%) |
| All other Fuels | 29 (2.7%) | 3 (1.6%) |
| No Fuel Used | 6 (0.6%) | 0 (0.0%) |
| Total | 1,068 (100.0%) | 191 (100.0%) |
Household Vehicle Usage in Lordstown
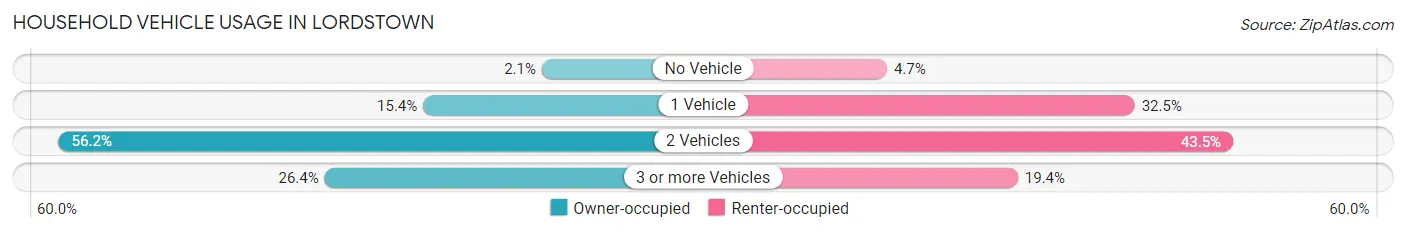
| Vehicles per Household | Owner-occupied | Renter-occupied |
| No Vehicle | 22 (2.1%) | 9 (4.7%) |
| 1 Vehicle | 164 (15.4%) | 62 (32.5%) |
| 2 Vehicles | 600 (56.2%) | 83 (43.5%) |
| 3 or more Vehicles | 282 (26.4%) | 37 (19.4%) |
| Total | 1,068 (100.0%) | 191 (100.0%) |
Real Estate & Mortgages in Lordstown
Real Estate and Mortgage Overview in Lordstown
| Characteristic | Without Mortgage | With Mortgage |
| Housing Units | 532 | 536 |
| Median Property Value | $130,100 | $168,600 |
| Median Household Income | $52,045 | $91 |
| Monthly Housing Costs | $471 | $0 |
| Real Estate Taxes | $1,639 | $9 |
Property Value by Mortgage Status in Lordstown
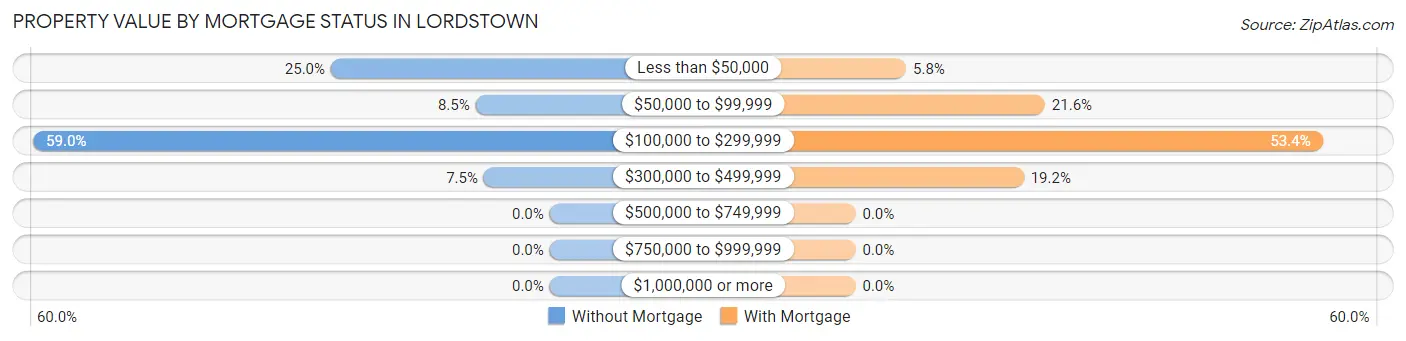
| Property Value | Without Mortgage | With Mortgage |
| Less than $50,000 | 133 (25.0%) | 31 (5.8%) |
| $50,000 to $99,999 | 45 (8.5%) | 116 (21.6%) |
| $100,000 to $299,999 | 314 (59.0%) | 286 (53.4%) |
| $300,000 to $499,999 | 40 (7.5%) | 103 (19.2%) |
| $500,000 to $749,999 | 0 (0.0%) | 0 (0.0%) |
| $750,000 to $999,999 | 0 (0.0%) | 0 (0.0%) |
| $1,000,000 or more | 0 (0.0%) | 0 (0.0%) |
| Total | 532 (100.0%) | 536 (100.0%) |
Household Income by Mortgage Status in Lordstown
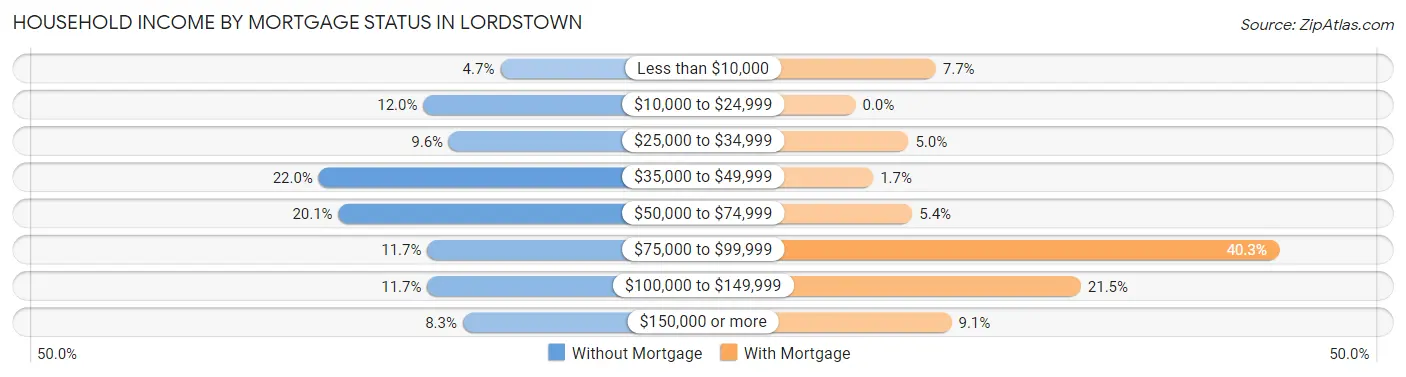
| Household Income | Without Mortgage | With Mortgage |
| Less than $10,000 | 25 (4.7%) | 41 (7.6%) |
| $10,000 to $24,999 | 64 (12.0%) | 0 (0.0%) |
| $25,000 to $34,999 | 51 (9.6%) | 27 (5.0%) |
| $35,000 to $49,999 | 117 (22.0%) | 9 (1.7%) |
| $50,000 to $74,999 | 107 (20.1%) | 29 (5.4%) |
| $75,000 to $99,999 | 62 (11.7%) | 216 (40.3%) |
| $100,000 to $149,999 | 62 (11.7%) | 115 (21.5%) |
| $150,000 or more | 44 (8.3%) | 49 (9.1%) |
| Total | 532 (100.0%) | 536 (100.0%) |
Property Value to Household Income Ratio in Lordstown
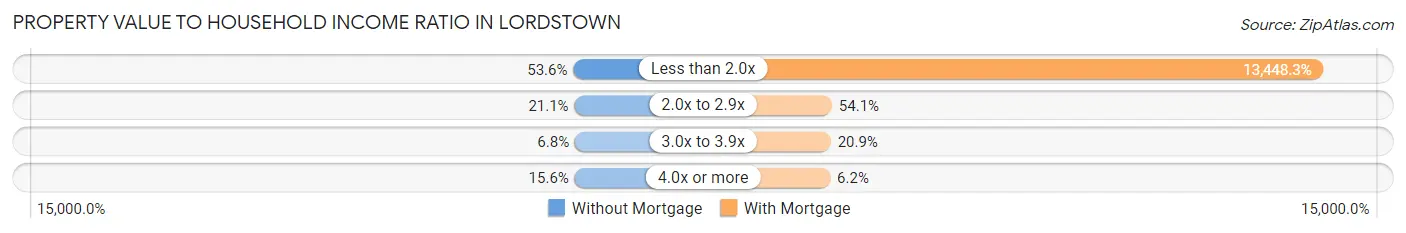
| Value-to-Income Ratio | Without Mortgage | With Mortgage |
| Less than 2.0x | 285 (53.6%) | 72,083 (13,448.3%) |
| 2.0x to 2.9x | 112 (21.0%) | 290 (54.1%) |
| 3.0x to 3.9x | 36 (6.8%) | 112 (20.9%) |
| 4.0x or more | 83 (15.6%) | 33 (6.2%) |
| Total | 532 (100.0%) | 536 (100.0%) |
Real Estate Taxes by Mortgage Status in Lordstown
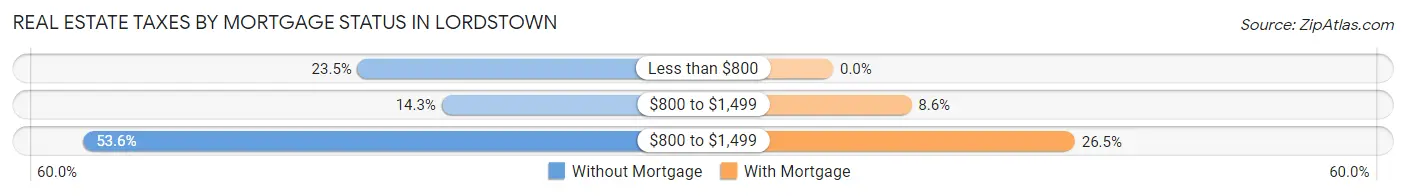
| Property Taxes | Without Mortgage | With Mortgage |
| Less than $800 | 125 (23.5%) | 0 (0.0%) |
| $800 to $1,499 | 76 (14.3%) | 46 (8.6%) |
| $800 to $1,499 | 285 (53.6%) | 142 (26.5%) |
| Total | 532 (100.0%) | 536 (100.0%) |
Health & Disability in Lordstown
Health Insurance Coverage by Age in Lordstown
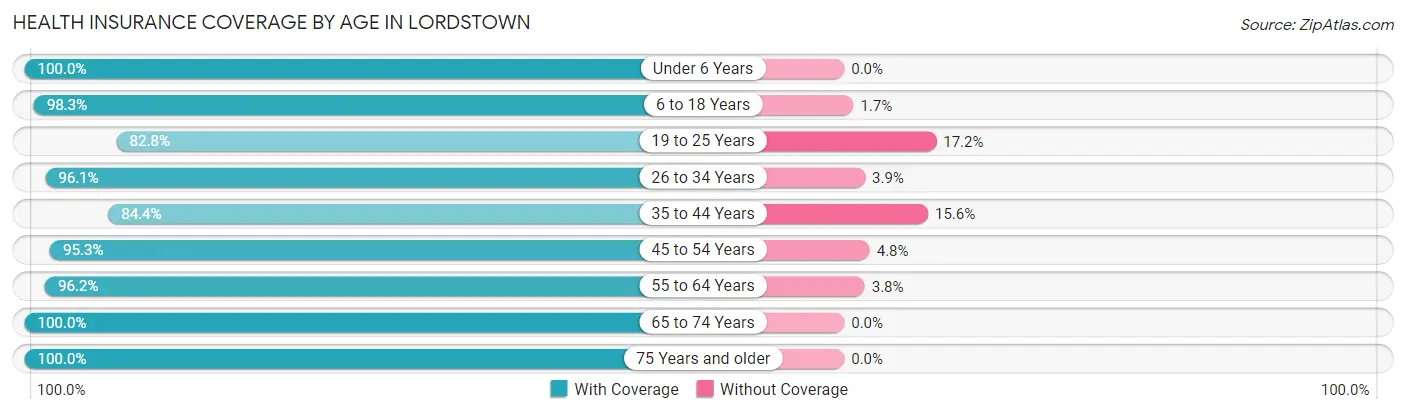
| Age Bracket | With Coverage | Without Coverage |
| Under 6 Years | 205 (100.0%) | 0 (0.0%) |
| 6 to 18 Years | 456 (98.3%) | 8 (1.7%) |
| 19 to 25 Years | 140 (82.8%) | 29 (17.2%) |
| 26 to 34 Years | 421 (96.1%) | 17 (3.9%) |
| 35 to 44 Years | 297 (84.4%) | 55 (15.6%) |
| 45 to 54 Years | 381 (95.3%) | 19 (4.8%) |
| 55 to 64 Years | 378 (96.2%) | 15 (3.8%) |
| 65 to 74 Years | 507 (100.0%) | 0 (0.0%) |
| 75 Years and older | 399 (100.0%) | 0 (0.0%) |
| Total | 3,184 (95.7%) | 143 (4.3%) |
Health Insurance Coverage by Citizenship Status in Lordstown
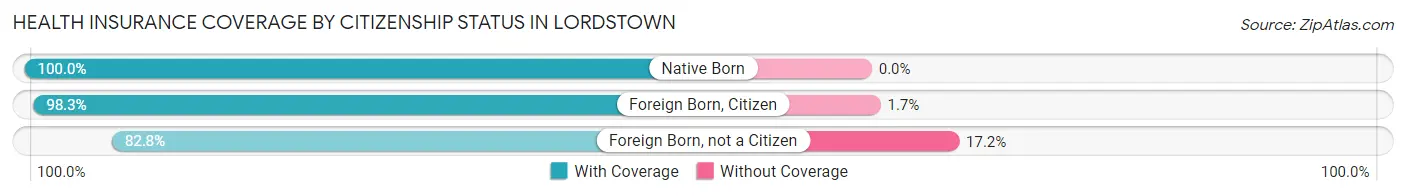
| Citizenship Status | With Coverage | Without Coverage |
| Native Born | 205 (100.0%) | 0 (0.0%) |
| Foreign Born, Citizen | 456 (98.3%) | 8 (1.7%) |
| Foreign Born, not a Citizen | 140 (82.8%) | 29 (17.2%) |
Health Insurance Coverage by Household Income in Lordstown
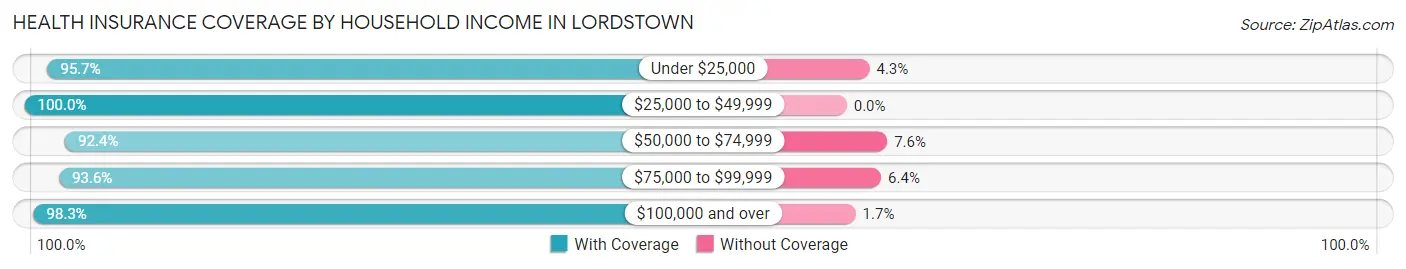
| Household Income | With Coverage | Without Coverage |
| Under $25,000 | 180 (95.7%) | 8 (4.3%) |
| $25,000 to $49,999 | 573 (100.0%) | 0 (0.0%) |
| $50,000 to $74,999 | 817 (92.4%) | 67 (7.6%) |
| $75,000 to $99,999 | 784 (93.6%) | 54 (6.4%) |
| $100,000 and over | 830 (98.3%) | 14 (1.7%) |
Public vs Private Health Insurance Coverage by Age in Lordstown
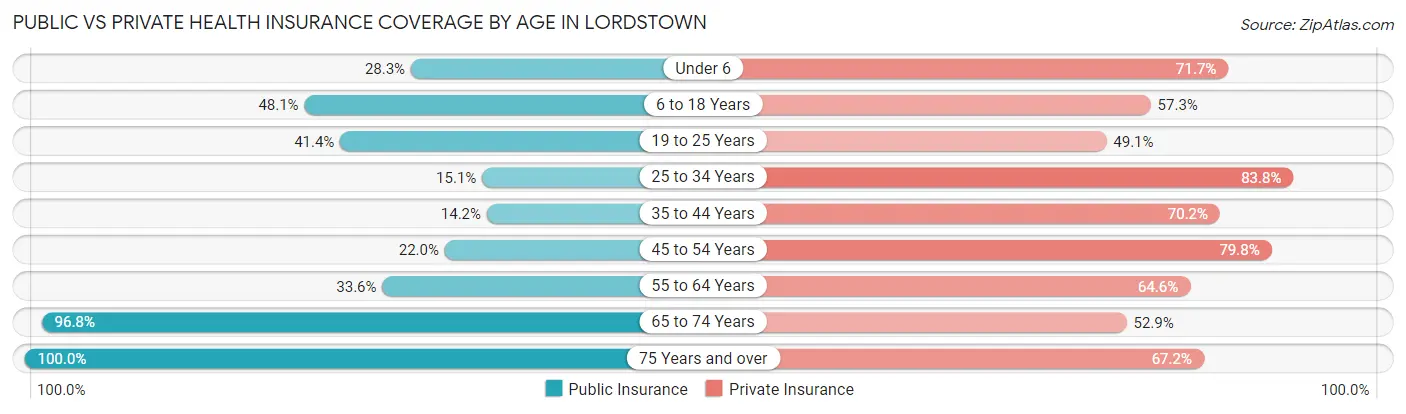
| Age Bracket | Public Insurance | Private Insurance |
| Under 6 | 58 (28.3%) | 147 (71.7%) |
| 6 to 18 Years | 223 (48.1%) | 266 (57.3%) |
| 19 to 25 Years | 70 (41.4%) | 83 (49.1%) |
| 25 to 34 Years | 66 (15.1%) | 367 (83.8%) |
| 35 to 44 Years | 50 (14.2%) | 247 (70.2%) |
| 45 to 54 Years | 88 (22.0%) | 319 (79.7%) |
| 55 to 64 Years | 132 (33.6%) | 254 (64.6%) |
| 65 to 74 Years | 491 (96.8%) | 268 (52.9%) |
| 75 Years and over | 399 (100.0%) | 268 (67.2%) |
| Total | 1,577 (47.4%) | 2,219 (66.7%) |
Disability Status by Sex by Age in Lordstown
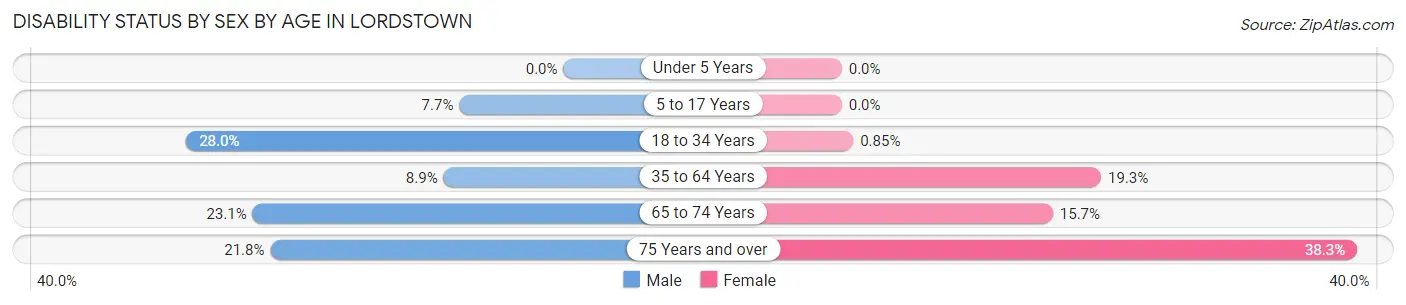
| Age Bracket | Male | Female |
| Under 5 Years | 0 (0.0%) | 0 (0.0%) |
| 5 to 17 Years | 18 (7.7%) | 0 (0.0%) |
| 18 to 34 Years | 84 (28.0%) | 3 (0.9%) |
| 35 to 64 Years | 52 (8.9%) | 108 (19.3%) |
| 65 to 74 Years | 36 (23.1%) | 55 (15.7%) |
| 75 Years and over | 47 (21.8%) | 70 (38.3%) |
Disability Class by Sex by Age in Lordstown
Disability Class: Hearing Difficulty
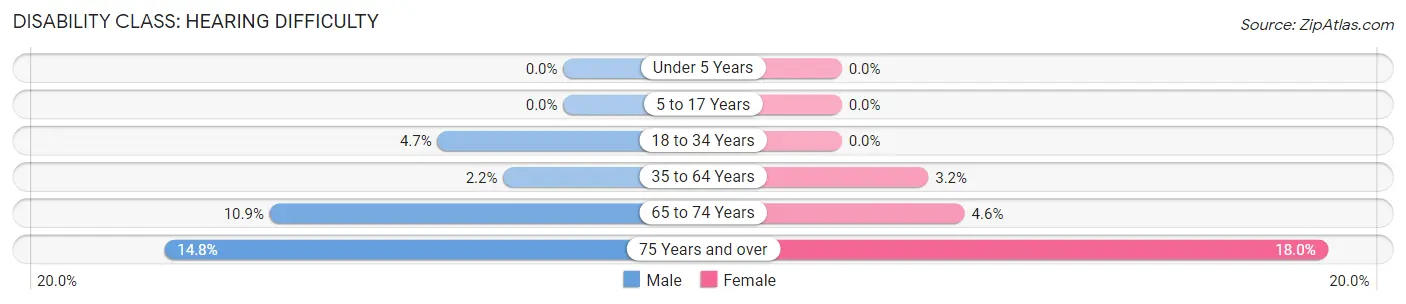
| Age Bracket | Male | Female |
| Under 5 Years | 0 (0.0%) | 0 (0.0%) |
| 5 to 17 Years | 0 (0.0%) | 0 (0.0%) |
| 18 to 34 Years | 14 (4.7%) | 0 (0.0%) |
| 35 to 64 Years | 13 (2.2%) | 18 (3.2%) |
| 65 to 74 Years | 17 (10.9%) | 16 (4.6%) |
| 75 Years and over | 32 (14.8%) | 33 (18.0%) |
Disability Class: Vision Difficulty
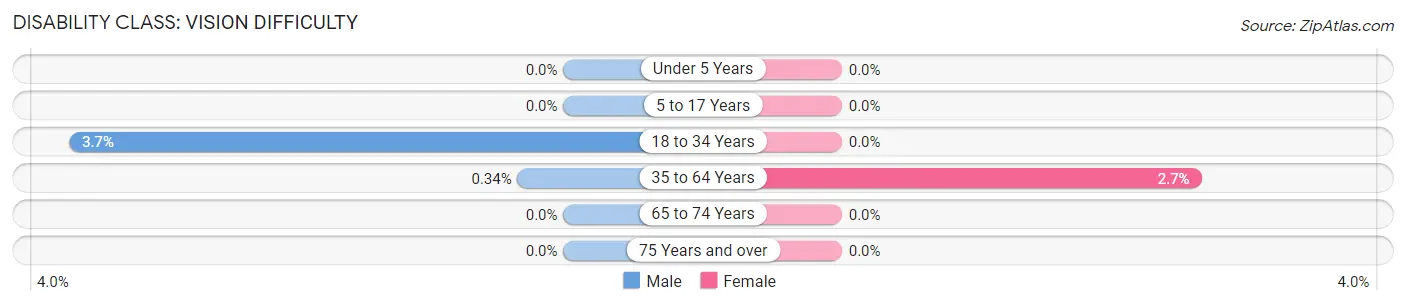
| Age Bracket | Male | Female |
| Under 5 Years | 0 (0.0%) | 0 (0.0%) |
| 5 to 17 Years | 0 (0.0%) | 0 (0.0%) |
| 18 to 34 Years | 11 (3.7%) | 0 (0.0%) |
| 35 to 64 Years | 2 (0.3%) | 15 (2.7%) |
| 65 to 74 Years | 0 (0.0%) | 0 (0.0%) |
| 75 Years and over | 0 (0.0%) | 0 (0.0%) |
Disability Class: Cognitive Difficulty
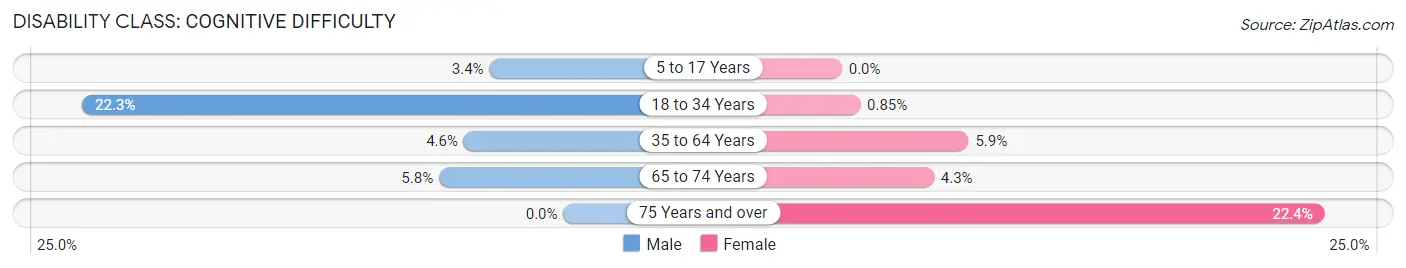
| Age Bracket | Male | Female |
| 5 to 17 Years | 8 (3.4%) | 0 (0.0%) |
| 18 to 34 Years | 67 (22.3%) | 3 (0.9%) |
| 35 to 64 Years | 27 (4.6%) | 33 (5.9%) |
| 65 to 74 Years | 9 (5.8%) | 15 (4.3%) |
| 75 Years and over | 0 (0.0%) | 41 (22.4%) |
Disability Class: Ambulatory Difficulty
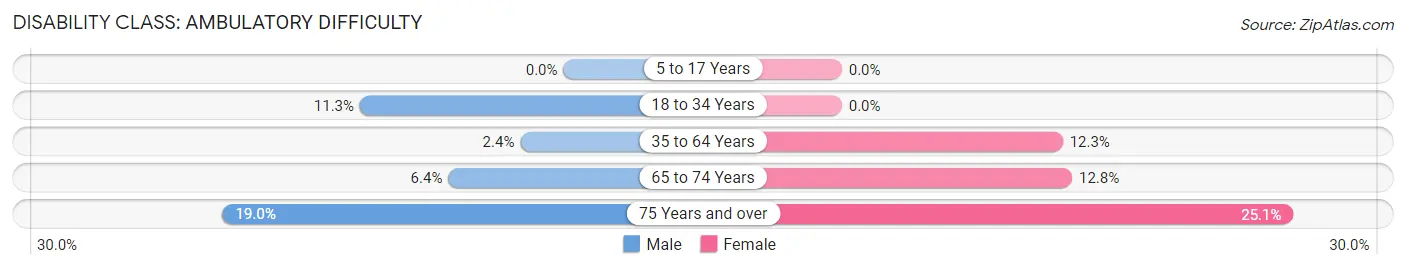
| Age Bracket | Male | Female |
| 5 to 17 Years | 0 (0.0%) | 0 (0.0%) |
| 18 to 34 Years | 34 (11.3%) | 0 (0.0%) |
| 35 to 64 Years | 14 (2.4%) | 69 (12.3%) |
| 65 to 74 Years | 10 (6.4%) | 45 (12.8%) |
| 75 Years and over | 41 (19.0%) | 46 (25.1%) |
Disability Class: Self-Care Difficulty
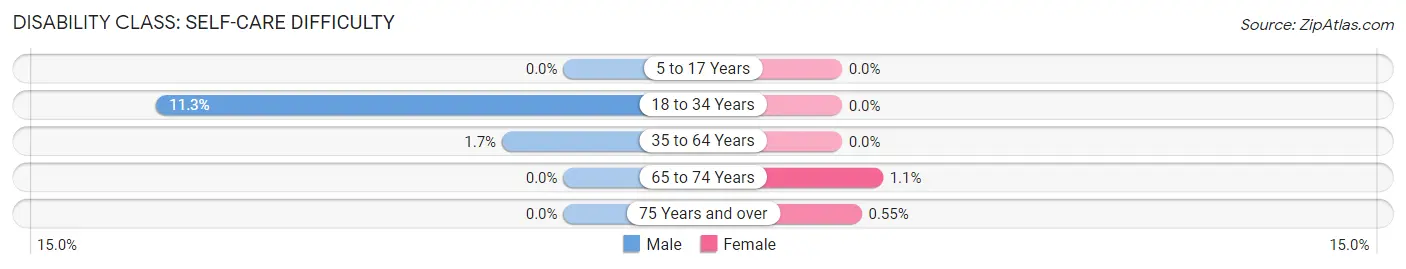
| Age Bracket | Male | Female |
| 5 to 17 Years | 0 (0.0%) | 0 (0.0%) |
| 18 to 34 Years | 34 (11.3%) | 0 (0.0%) |
| 35 to 64 Years | 10 (1.7%) | 0 (0.0%) |
| 65 to 74 Years | 0 (0.0%) | 4 (1.1%) |
| 75 Years and over | 0 (0.0%) | 1 (0.5%) |
Technology Access in Lordstown
Computing Device Access in Lordstown
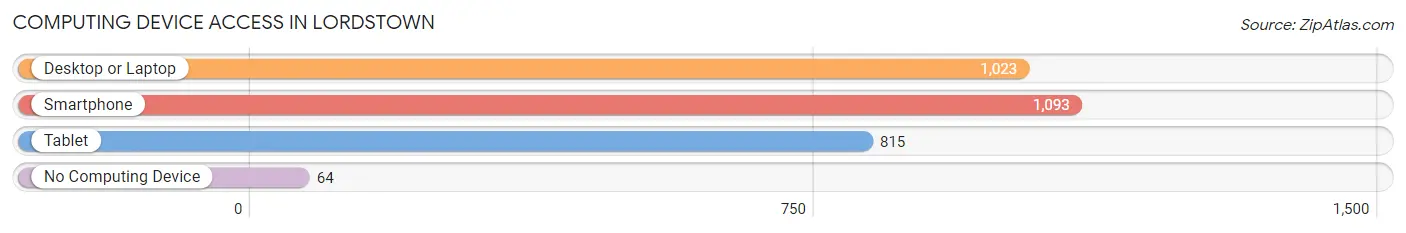
| Device Type | # Households | % Households |
| Desktop or Laptop | 1,023 | 81.2% |
| Smartphone | 1,093 | 86.8% |
| Tablet | 815 | 64.7% |
| No Computing Device | 64 | 5.1% |
| Total | 1,259 | 100.0% |
Internet Access in Lordstown
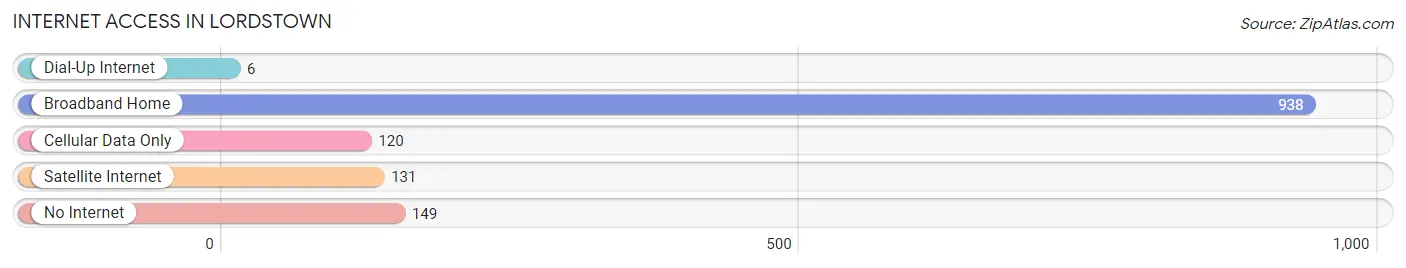
| Internet Type | # Households | % Households |
| Dial-Up Internet | 6 | 0.5% |
| Broadband Home | 938 | 74.5% |
| Cellular Data Only | 120 | 9.5% |
| Satellite Internet | 131 | 10.4% |
| No Internet | 149 | 11.8% |
| Total | 1,259 | 100.0% |
Lordstown Summary
History
The history of Lordstown, Ohio dates back to the early 1800s when the area was first settled by European immigrants. The first settlers were mostly of German and English descent, and the area was known as “Lord’s Town” after the Lord family who owned much of the land. The town was officially incorporated in 1832 and was named after the Lord family.
In the late 1800s, Lordstown became a major hub for the steel industry. The Lordstown Steel Company was founded in 1891 and was the first steel mill in the area. The steel mill was a major employer in the area and helped to spur economic growth.
The town also became a major agricultural center in the early 1900s. The area was known for its dairy farms and was home to several large farms. The town also had a thriving fruit and vegetable industry.
The town experienced a population boom in the 1950s and 1960s due to the growth of the steel industry and the influx of new residents. The population peaked in 1970 at over 5,000 people.
Geography
Lordstown is located in Trumbull County, Ohio, about 30 miles southeast of Cleveland. The town is situated on the Mahoning River and is surrounded by rolling hills and farmland. The town is located in the Appalachian Plateau region of Ohio and is part of the Appalachian Mountains.
The climate in Lordstown is humid continental, with hot summers and cold winters. The average annual temperature is around 50 degrees Fahrenheit. The town receives an average of 40 inches of precipitation per year.
Economy
The economy of Lordstown is largely based on manufacturing and agriculture. The town is home to several large manufacturing companies, including the Lordstown Steel Company, which is the largest employer in the area. The town is also home to several smaller manufacturing companies, such as the Lordstown Automotive Parts Company.
Agriculture is also an important part of the economy in Lordstown. The town is home to several large farms, which produce a variety of crops, including corn, soybeans, and wheat. The town is also home to several dairy farms, which produce milk and other dairy products.
Demographics
As of the 2010 census, the population of Lordstown was 4,821. The population is largely white (94.3%), with small percentages of African American (2.2%), Asian (1.2%), and Hispanic (1.3%) residents. The median household income in the town is $45,945, and the median age is 41.
The town is home to several churches, including the Lordstown United Methodist Church, the Lordstown Presbyterian Church, and the Lordstown Baptist Church. The town is also home to several schools, including Lordstown High School, Lordstown Middle School, and Lordstown Elementary School.
Common Questions
What is the Total Population of Lordstown?
Total Population of Lordstown is 3,327.
What is the Total Male Population of Lordstown?
Total Male Population of Lordstown is 1,603.
What is the Total Female Population of Lordstown?
Total Female Population of Lordstown is 1,724.
What is the Ratio of Males per 100 Females in Lordstown?
There are 92.98 Males per 100 Females in Lordstown.
What is the Ratio of Females per 100 Males in Lordstown?
There are 107.55 Females per 100 Males in Lordstown.
What is the Median Population Age in Lordstown?
Median Population Age in Lordstown is 47.9 Years.
What is the Average Family Size in Lordstown
Average Family Size in Lordstown is 3.0 People.
What is the Average Household Size in Lordstown
Average Household Size in Lordstown is 2.6 People.
What is Per Capita Income in Lordstown?
Per Capita income in Lordstown is $29,773.
What is the Median Family Income in Lordstown?
Median Family Income in Lordstown is $73,214.
What is the Median Household income in Lordstown?
Median Household Income in Lordstown is $64,116.
What is Income or Wage Gap in Lordstown?
Income or Wage Gap in Lordstown is 24.1%.
Women in Lordstown earn 75.9 cents for every dollar earned by a man.
What is Inequality or Gini Index in Lordstown?
Inequality or Gini Index in Lordstown is 0.35.
How Large is the Labor Force in Lordstown?
There are 1,342 People in the Labor Forcein in Lordstown.
What is the Percentage of People in the Labor Force in Lordstown?
48.5% of People are in the Labor Force in Lordstown.
What is the Unemployment Rate in Lordstown?
Unemployment Rate in Lordstown is 3.0%.