Harbor View, OH
Harbor View Map
Harbor View Overview
124
TOTAL POPULATION
81
MALE POPULATION
43
FEMALE POPULATION
188.37
MALES / 100 FEMALES
53.09
FEMALES / 100 MALES
26.5
MEDIAN AGE
5.3
AVG FAMILY SIZE
5.0
AVG HOUSEHOLD SIZE
$16,776
PER CAPITA INCOME
$58,250
AVG FAMILY INCOME
$67,083
AVG HOUSEHOLD INCOME
0.32
INEQUALITY / GINI INDEX
58
LABOR FORCE [ PEOPLE ]
54.7%
PERCENT IN LABOR FORCE
Harbor View Zip Codes
Harbor View Area Codes
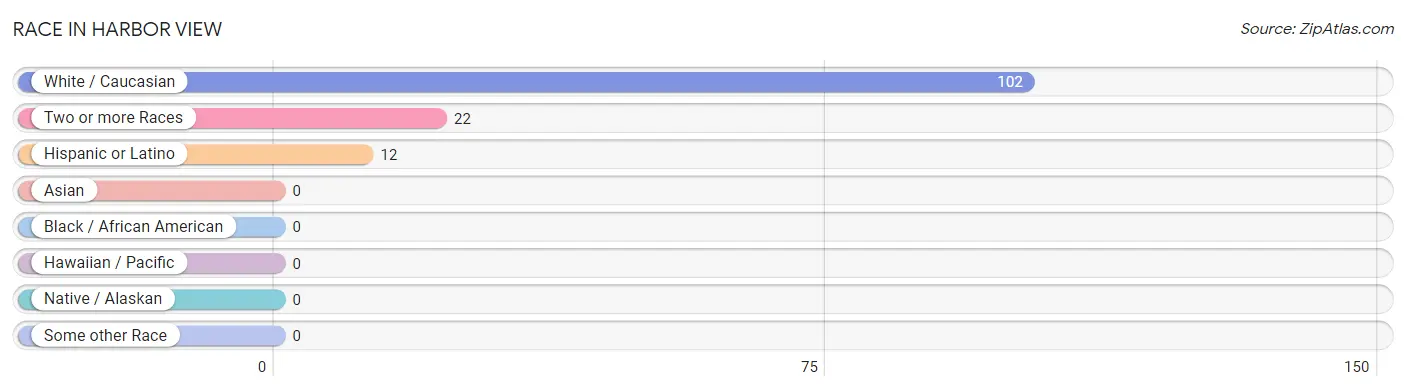
Race in Harbor View
The most populous races in Harbor View are White / Caucasian (102 | 82.3%), Two or more Races (22 | 17.7%), and Hispanic or Latino (12 | 9.7%).
| Race | # Population | % Population |
| Asian | 0 | 0.0% |
| Black / African American | 0 | 0.0% |
| Hawaiian / Pacific | 0 | 0.0% |
| Hispanic or Latino | 12 | 9.7% |
| Native / Alaskan | 0 | 0.0% |
| White / Caucasian | 102 | 82.3% |
| Two or more Races | 22 | 17.7% |
| Some other Race | 0 | 0.0% |
| Total | 124 | 100.0% |
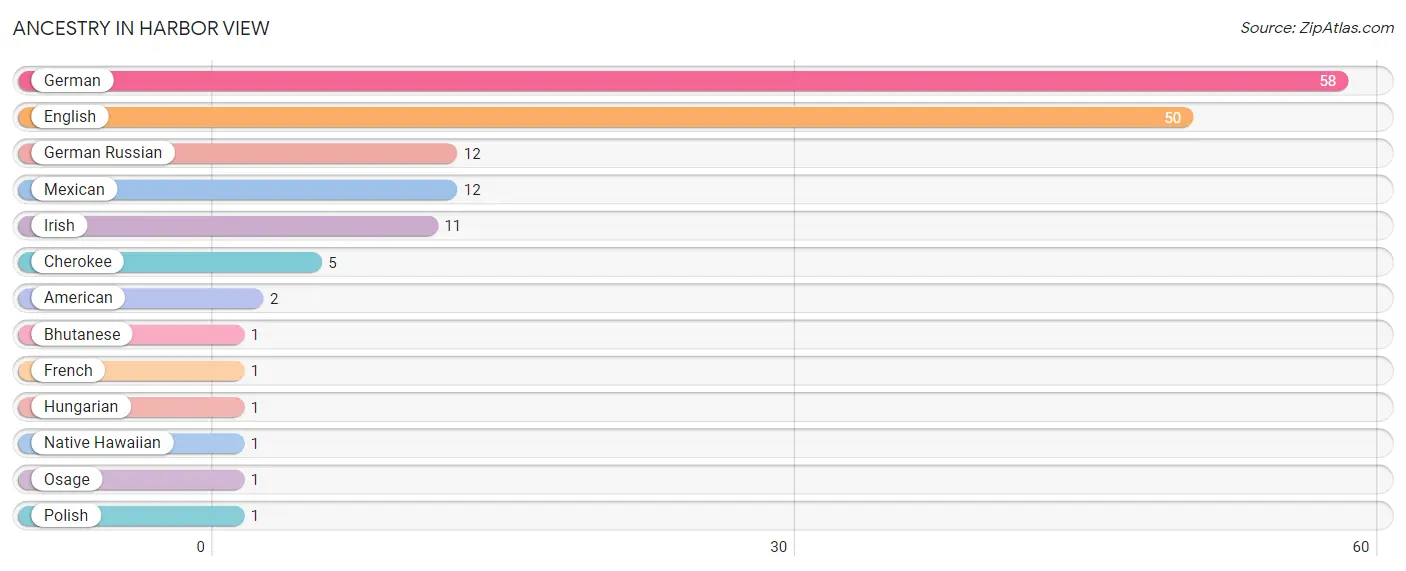
Ancestry in Harbor View
The most populous ancestries reported in Harbor View are German (58 | 46.8%), English (50 | 40.3%), German Russian (12 | 9.7%), Mexican (12 | 9.7%), and Irish (11 | 8.9%), together accounting for 115.3% of all Harbor View residents.
| Ancestry | # Population | % Population |
| American | 2 | 1.6% |
| Bhutanese | 1 | 0.8% |
| Cherokee | 5 | 4.0% |
| English | 50 | 40.3% |
| French | 1 | 0.8% |
| German | 58 | 46.8% |
| German Russian | 12 | 9.7% |
| Hungarian | 1 | 0.8% |
| Irish | 11 | 8.9% |
| Mexican | 12 | 9.7% |
| Native Hawaiian | 1 | 0.8% |
| Osage | 1 | 0.8% |
| Polish | 1 | 0.8% | View All 13 Rows |
Immigrants in Harbor View

| Immigration Origin | # Population | % Population | View All 0 Rows |
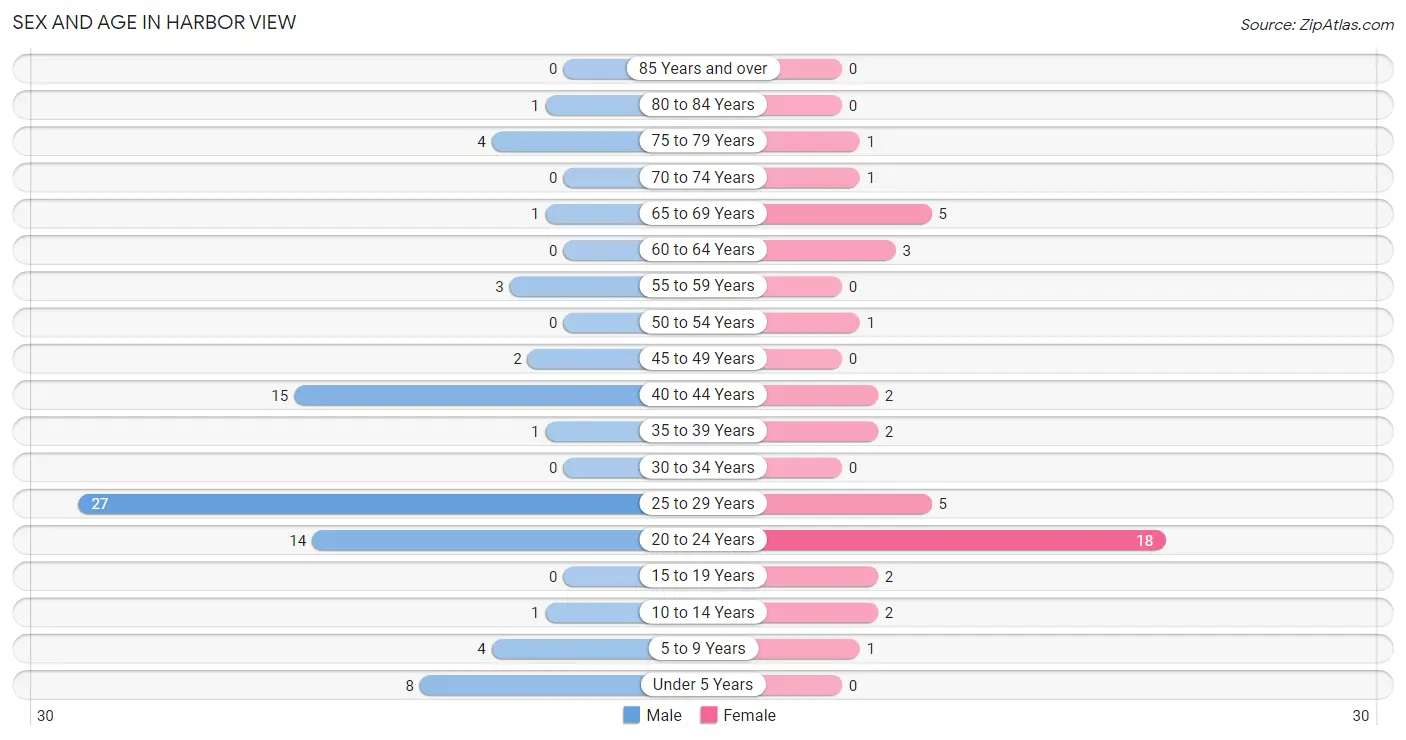
Sex and Age in Harbor View
Sex and Age in Harbor View
The most populous age groups in Harbor View are 25 to 29 Years (27 | 33.3%) for men and 20 to 24 Years (18 | 41.9%) for women.
| Age Bracket | Male | Female |
| Under 5 Years | 8 (9.9%) | 0 (0.0%) |
| 5 to 9 Years | 4 (4.9%) | 1 (2.3%) |
| 10 to 14 Years | 1 (1.2%) | 2 (4.6%) |
| 15 to 19 Years | 0 (0.0%) | 2 (4.6%) |
| 20 to 24 Years | 14 (17.3%) | 18 (41.9%) |
| 25 to 29 Years | 27 (33.3%) | 5 (11.6%) |
| 30 to 34 Years | 0 (0.0%) | 0 (0.0%) |
| 35 to 39 Years | 1 (1.2%) | 2 (4.6%) |
| 40 to 44 Years | 15 (18.5%) | 2 (4.6%) |
| 45 to 49 Years | 2 (2.5%) | 0 (0.0%) |
| 50 to 54 Years | 0 (0.0%) | 1 (2.3%) |
| 55 to 59 Years | 3 (3.7%) | 0 (0.0%) |
| 60 to 64 Years | 0 (0.0%) | 3 (7.0%) |
| 65 to 69 Years | 1 (1.2%) | 5 (11.6%) |
| 70 to 74 Years | 0 (0.0%) | 1 (2.3%) |
| 75 to 79 Years | 4 (4.9%) | 1 (2.3%) |
| 80 to 84 Years | 1 (1.2%) | 0 (0.0%) |
| 85 Years and over | 0 (0.0%) | 0 (0.0%) |
| Total | 81 (100.0%) | 43 (100.0%) |
Families and Households in Harbor View
Median Family Size in Harbor View
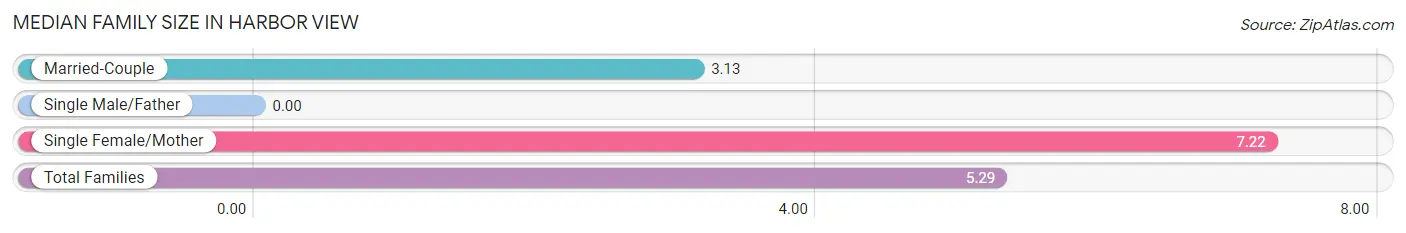
| Family Type | # Families | Family Size |
| Married-Couple | 8 (47.1%) | 3.13 |
| Single Male/Father | 0 (0.0%) | - |
| Single Female/Mother | 9 (52.9%) | 7.22 |
| Total Families | 17 (100.0%) | 5.29 |
Median Household Size in Harbor View
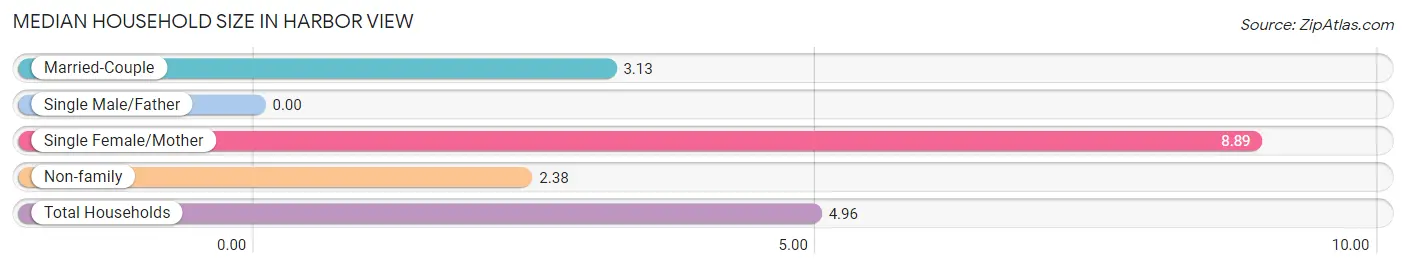
| Household Type | # Households | Household Size |
| Married-Couple | 8 (32.0%) | 3.13 |
| Single Male/Father | 0 (0.0%) | - |
| Single Female/Mother | 9 (36.0%) | 8.89 |
| Non-family | 8 (32.0%) | 2.38 |
| Total Households | 25 (100.0%) | 4.96 |
Household Size by Marriage Status in Harbor View
Out of a total of 25 households in Harbor View, 17 (68.0%) are family households, while 8 (32.0%) are nonfamily households. The most numerous type of family households are 5-person households, comprising 9, and the most common type of nonfamily households are 3-person households, comprising 5.
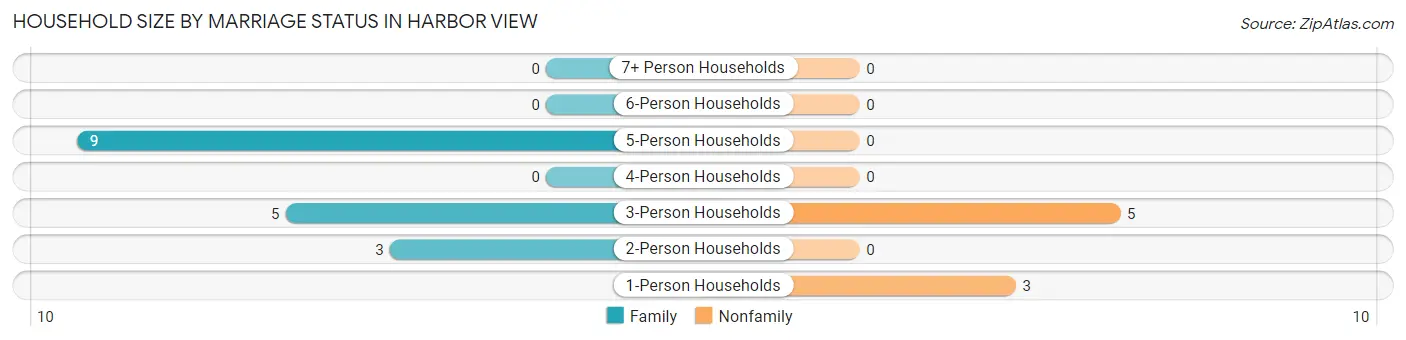
| Household Size | Family Households | Nonfamily Households |
| 1-Person Households | - | 3 (12.0%) |
| 2-Person Households | 3 (12.0%) | 0 (0.0%) |
| 3-Person Households | 5 (20.0%) | 5 (20.0%) |
| 4-Person Households | 0 (0.0%) | 0 (0.0%) |
| 5-Person Households | 9 (36.0%) | 0 (0.0%) |
| 6-Person Households | 0 (0.0%) | 0 (0.0%) |
| 7+ Person Households | 0 (0.0%) | 0 (0.0%) |
| Total | 17 (68.0%) | 8 (32.0%) |
Female Fertility in Harbor View
Fertility by Age in Harbor View
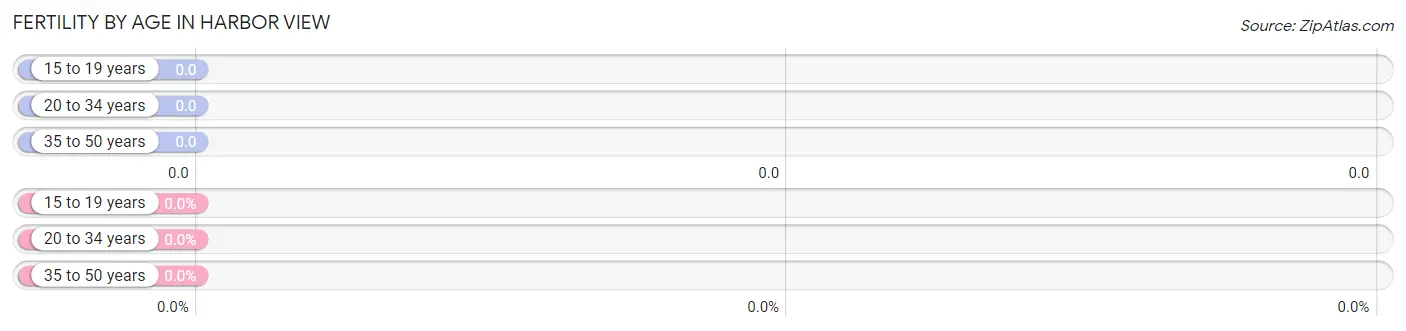
| Age Bracket | Women with Births | Births / 1,000 Women |
| 15 to 19 years | 0 (0.0%) | 0.0 |
| 20 to 34 years | 0 (0.0%) | 0.0 |
| 35 to 50 years | 0 (0.0%) | 0.0 |
| Total | 0 (0.0%) | 0.0 |
Fertility by Age by Marriage Status in Harbor View
| Age Bracket | Married | Unmarried |
| 15 to 19 years | 0 (0.0%) | 0 (0.0%) |
| 20 to 34 years | 0 (0.0%) | 0 (0.0%) |
| 35 to 50 years | 0 (0.0%) | 0 (0.0%) |
| Total | 0 (0.0%) | 0 (0.0%) |
Fertility by Education in Harbor View
| Educational Attainment | Women with Births | Births / 1,000 Women |
| Less than High School | 0 (0.0%) | 0.0 |
| High School Diploma | 0 (0.0%) | 0.0 |
| College or Associate's Degree | 0 (0.0%) | 0.0 |
| Bachelor's Degree | 0 (0.0%) | 0.0 |
| Graduate Degree | 0 (0.0%) | 0.0 |
| Total | 0 (0.0%) | 0.0 |
Fertility by Education by Marriage Status in Harbor View
| Educational Attainment | Married | Unmarried |
| Less than High School | 0 (0.0%) | 0 (0.0%) |
| High School Diploma | 0 (0.0%) | 0 (0.0%) |
| College or Associate's Degree | 0 (0.0%) | 0 (0.0%) |
| Bachelor's Degree | 0 (0.0%) | 0 (0.0%) |
| Graduate Degree | 0 (0.0%) | 0 (0.0%) |
| Total | 0 (0.0%) | 0 (0.0%) |
Income in Harbor View
Income Overview in Harbor View
Per Capita Income in Harbor View is $16,776, while median incomes of families and households are $58,250 and $67,083 respectively.
| Characteristic | Number | Measure |
| Per Capita Income | 124 | $16,776 |
| Median Family Income | 17 | $58,250 |
| Mean Family Income | 17 | $53,194 |
| Median Household Income | 25 | $67,083 |
| Mean Household Income | 25 | $71,596 |
| Income Deficit | 17 | $0 |
| Wage / Income Gap (%) | 124 | 0.00% |
| Wage / Income Gap ($) | 124 | 100.00¢ per $1 |
| Gini / Inequality Index | 124 | 0.32 |
Earnings by Sex in Harbor View
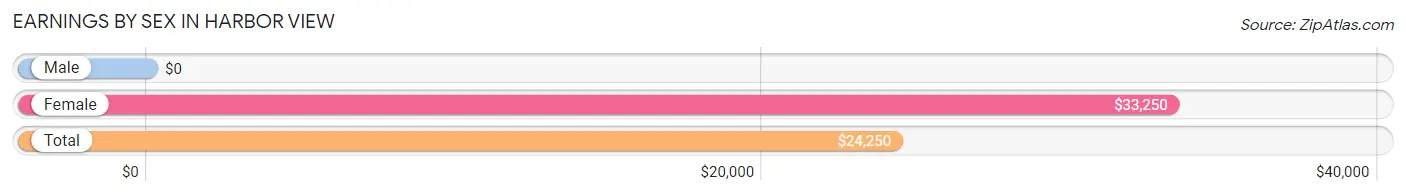
| Sex | Number | Average Earnings |
| Male | 31 (53.4%) | $0 |
| Female | 27 (46.6%) | $33,250 |
| Total | 58 (100.0%) | $24,250 |
Earnings by Sex by Income Bracket in Harbor View
The most common earnings brackets in Harbor View are $2,499 or less for men (11 | 35.5%) and $30,000 to $34,999 for women (15 | 55.6%).
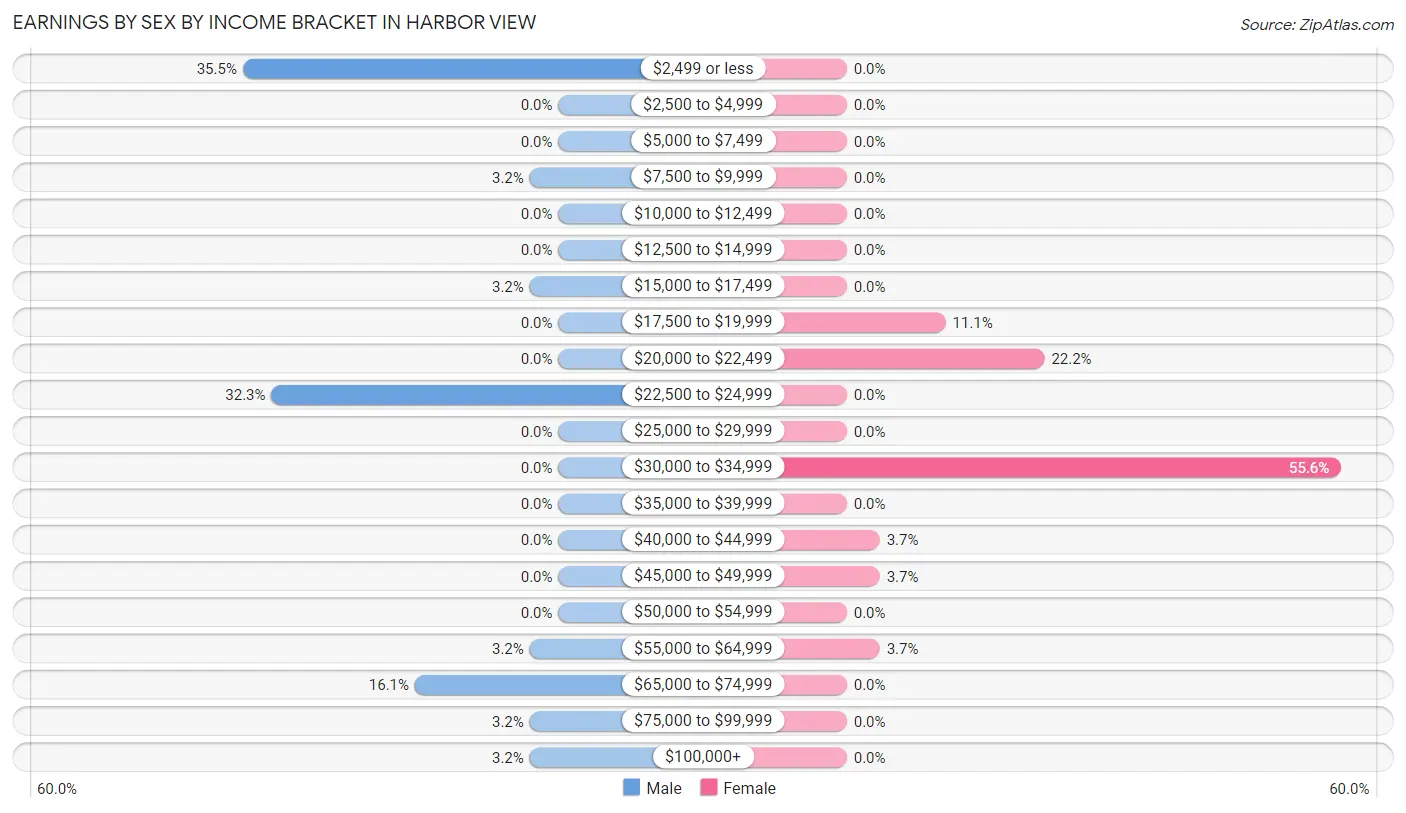
| Income | Male | Female |
| $2,499 or less | 11 (35.5%) | 0 (0.0%) |
| $2,500 to $4,999 | 0 (0.0%) | 0 (0.0%) |
| $5,000 to $7,499 | 0 (0.0%) | 0 (0.0%) |
| $7,500 to $9,999 | 1 (3.2%) | 0 (0.0%) |
| $10,000 to $12,499 | 0 (0.0%) | 0 (0.0%) |
| $12,500 to $14,999 | 0 (0.0%) | 0 (0.0%) |
| $15,000 to $17,499 | 1 (3.2%) | 0 (0.0%) |
| $17,500 to $19,999 | 0 (0.0%) | 3 (11.1%) |
| $20,000 to $22,499 | 0 (0.0%) | 6 (22.2%) |
| $22,500 to $24,999 | 10 (32.3%) | 0 (0.0%) |
| $25,000 to $29,999 | 0 (0.0%) | 0 (0.0%) |
| $30,000 to $34,999 | 0 (0.0%) | 15 (55.6%) |
| $35,000 to $39,999 | 0 (0.0%) | 0 (0.0%) |
| $40,000 to $44,999 | 0 (0.0%) | 1 (3.7%) |
| $45,000 to $49,999 | 0 (0.0%) | 1 (3.7%) |
| $50,000 to $54,999 | 0 (0.0%) | 0 (0.0%) |
| $55,000 to $64,999 | 1 (3.2%) | 1 (3.7%) |
| $65,000 to $74,999 | 5 (16.1%) | 0 (0.0%) |
| $75,000 to $99,999 | 1 (3.2%) | 0 (0.0%) |
| $100,000+ | 1 (3.2%) | 0 (0.0%) |
| Total | 31 (100.0%) | 27 (100.0%) |
Earnings by Sex by Educational Attainment in Harbor View
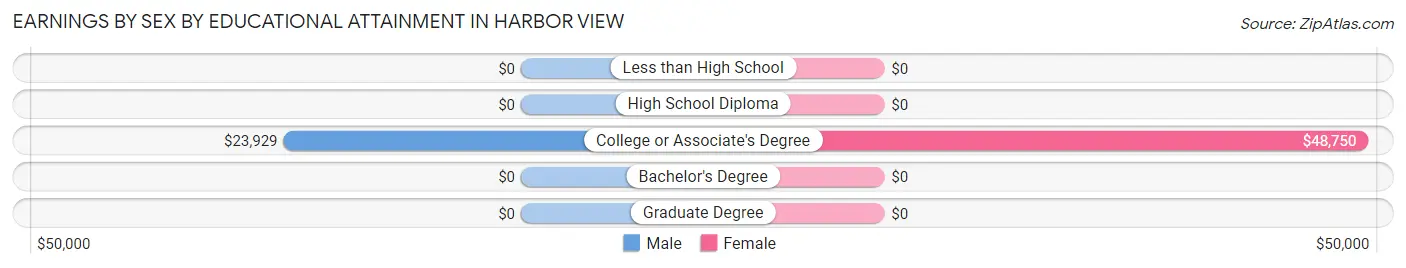
| Educational Attainment | Male Income | Female Income |
| Less than High School | - | - |
| High School Diploma | - | - |
| College or Associate's Degree | $23,929 | $48,750 |
| Bachelor's Degree | - | - |
| Graduate Degree | - | - |
| Total | - | - |
Family Income in Harbor View
Family Income Brackets in Harbor View
According to the Harbor View family income data, there are 8 families falling into the $50,000 to $74,999 income range, which is the most common income bracket and makes up 47.1% of all families.
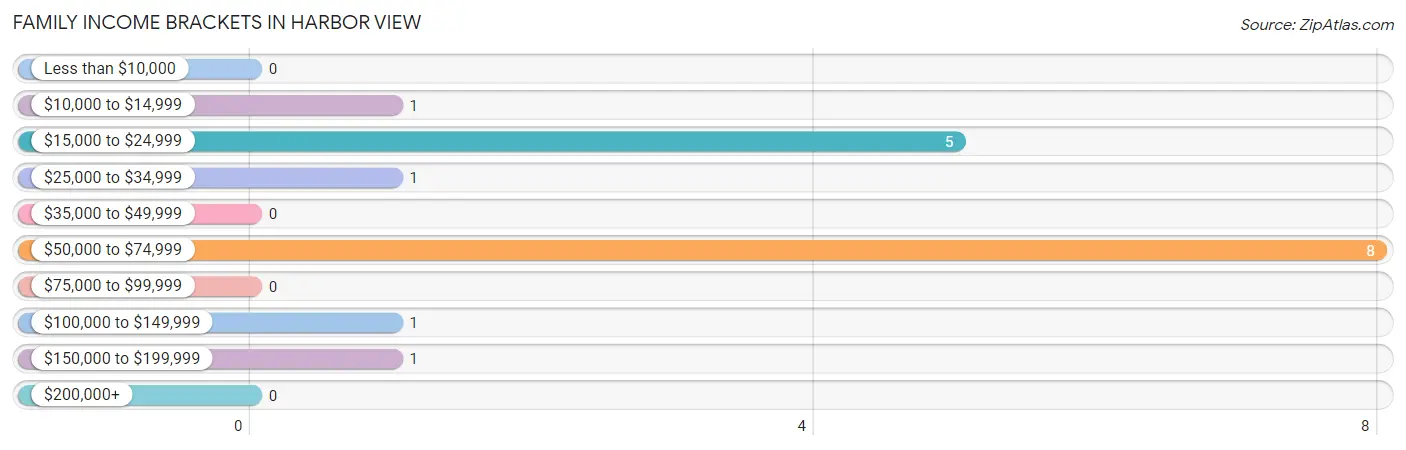
| Income Bracket | # Families | % Families |
| Less than $10,000 | 0 | 0.0% |
| $10,000 to $14,999 | 1 | 5.9% |
| $15,000 to $24,999 | 5 | 29.4% |
| $25,000 to $34,999 | 1 | 5.9% |
| $35,000 to $49,999 | 0 | 0.0% |
| $50,000 to $74,999 | 8 | 47.1% |
| $75,000 to $99,999 | 0 | 0.0% |
| $100,000 to $149,999 | 1 | 5.9% |
| $150,000 to $199,999 | 1 | 5.9% |
| $200,000+ | 0 | 0.0% |
Family Income by Famaliy Size in Harbor View
3-person families (5 | 29.4%) account for the highest median family income in Harbor View with $65,417 per family, while 3-person families (5 | 29.4%) have the highest median income of $21,806 per family member.
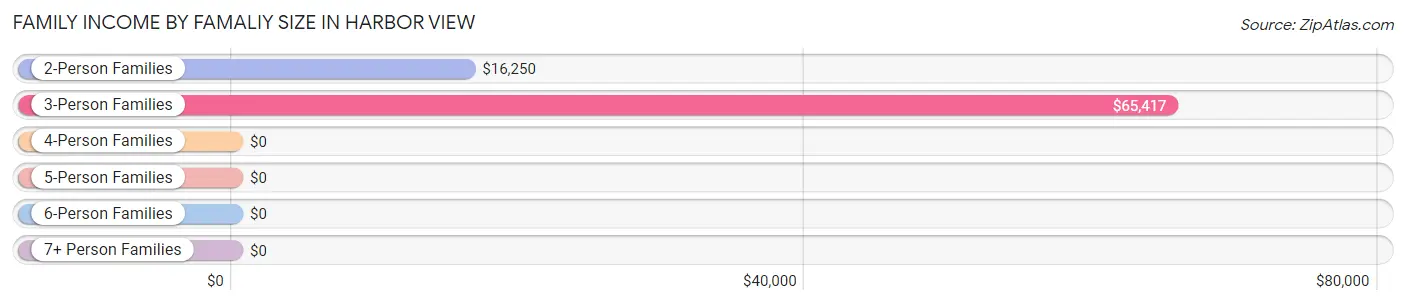
| Income Bracket | # Families | Median Income |
| 2-Person Families | 3 (17.6%) | $16,250 |
| 3-Person Families | 5 (29.4%) | $65,417 |
| 4-Person Families | 7 (41.2%) | $0 |
| 5-Person Families | 2 (11.8%) | $0 |
| 6-Person Families | 0 (0.0%) | $0 |
| 7+ Person Families | 0 (0.0%) | $0 |
| Total | 17 (100.0%) | $58,250 |
Family Income by Number of Earners in Harbor View
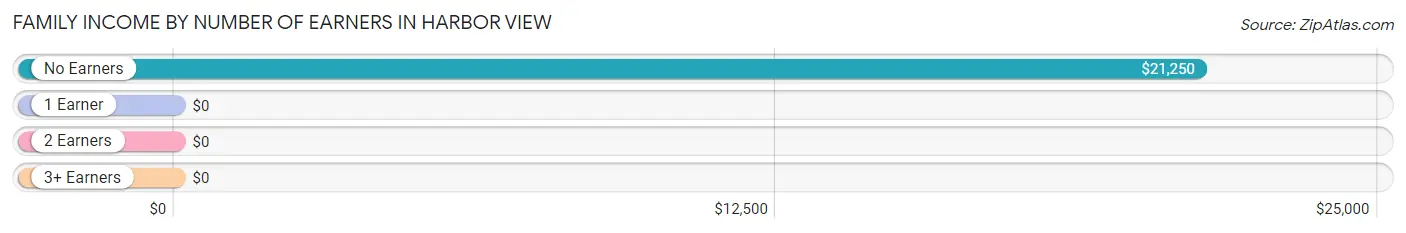
| Number of Earners | # Families | Median Income |
| No Earners | 3 (17.6%) | $21,250 |
| 1 Earner | 9 (52.9%) | $0 |
| 2 Earners | 4 (23.5%) | $0 |
| 3+ Earners | 1 (5.9%) | $0 |
| Total | 17 (100.0%) | $58,250 |
Household Income in Harbor View
Household Income Brackets in Harbor View
With 6 households falling in the category, the $100,000 to $149,999 income range is the most frequent in Harbor View, accounting for 24.0% of all households.
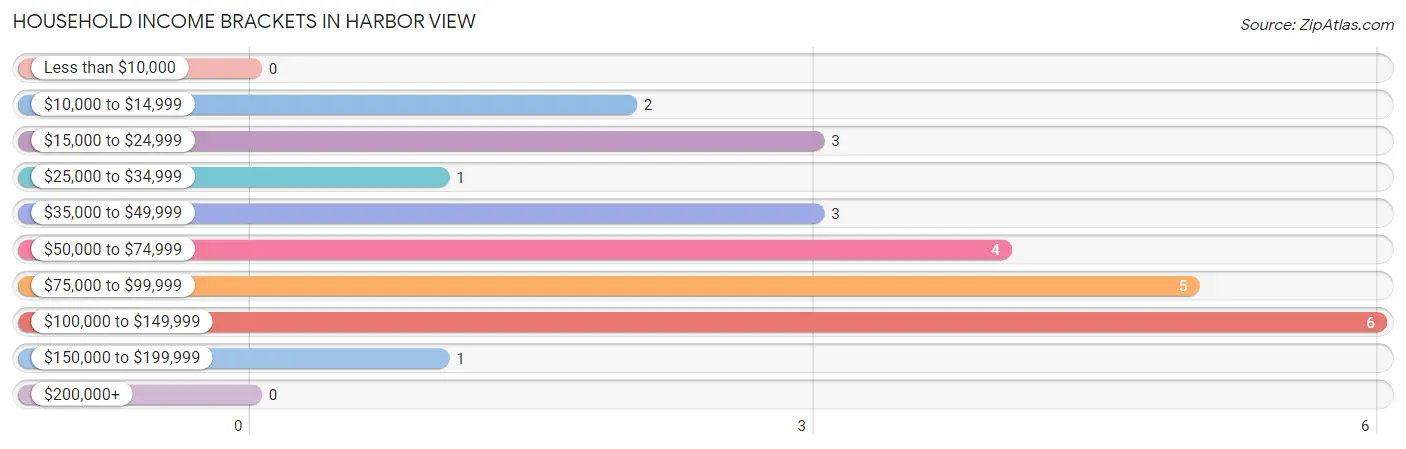
| Income Bracket | # Households | % Households |
| Less than $10,000 | 0 | 0.0% |
| $10,000 to $14,999 | 2 | 8.0% |
| $15,000 to $24,999 | 3 | 12.0% |
| $25,000 to $34,999 | 1 | 4.0% |
| $35,000 to $49,999 | 3 | 12.0% |
| $50,000 to $74,999 | 4 | 16.0% |
| $75,000 to $99,999 | 5 | 20.0% |
| $100,000 to $149,999 | 6 | 24.0% |
| $150,000 to $199,999 | 1 | 4.0% |
| $200,000+ | 0 | 0.0% |
Household Income by Householder Age in Harbor View
The median household income in Harbor View is $67,083, with the highest median household income of $66,667 found in the 45 to 64 years age bracket for the primary householder. A total of 6 households (24.0%) fall into this category.
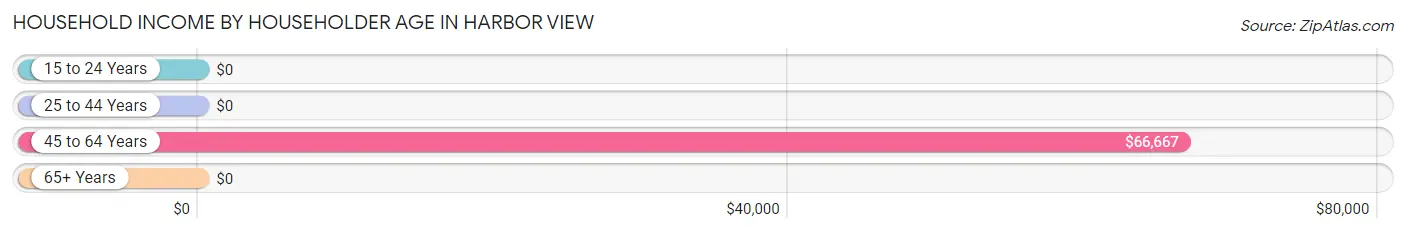
| Income Bracket | # Households | Median Income |
| 15 to 24 Years | 0 (0.0%) | $0 |
| 25 to 44 Years | 10 (40.0%) | $0 |
| 45 to 64 Years | 6 (24.0%) | $66,667 |
| 65+ Years | 9 (36.0%) | $0 |
| Total | 25 (100.0%) | $67,083 |
Poverty in Harbor View
Income Below Poverty by Sex and Age in Harbor View
With 17.3% poverty level for males and 11.6% for females among the residents of Harbor View, under 5 year old males and 45 to 54 year old females are the most vulnerable to poverty, with 8 males (100.0%) and 1 females (100.0%) in their respective age groups living below the poverty level.
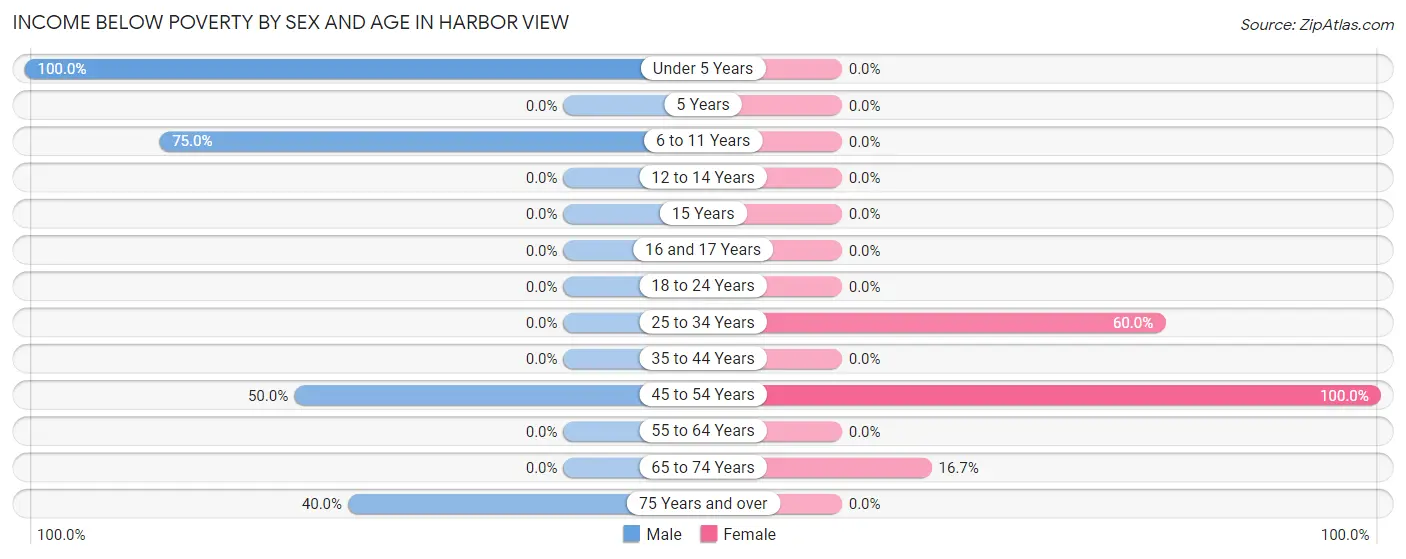
| Age Bracket | Male | Female |
| Under 5 Years | 8 (100.0%) | 0 (0.0%) |
| 5 Years | 0 (0.0%) | 0 (0.0%) |
| 6 to 11 Years | 3 (75.0%) | 0 (0.0%) |
| 12 to 14 Years | 0 (0.0%) | 0 (0.0%) |
| 15 Years | 0 (0.0%) | 0 (0.0%) |
| 16 and 17 Years | 0 (0.0%) | 0 (0.0%) |
| 18 to 24 Years | 0 (0.0%) | 0 (0.0%) |
| 25 to 34 Years | 0 (0.0%) | 3 (60.0%) |
| 35 to 44 Years | 0 (0.0%) | 0 (0.0%) |
| 45 to 54 Years | 1 (50.0%) | 1 (100.0%) |
| 55 to 64 Years | 0 (0.0%) | 0 (0.0%) |
| 65 to 74 Years | 0 (0.0%) | 1 (16.7%) |
| 75 Years and over | 2 (40.0%) | 0 (0.0%) |
| Total | 14 (17.3%) | 5 (11.6%) |
Income Above Poverty by Sex and Age in Harbor View
According to the poverty statistics in Harbor View, males aged 12 to 14 years and females aged 6 to 11 years are the age groups that are most secure financially, with 100.0% of males and 100.0% of females in these age groups living above the poverty line.
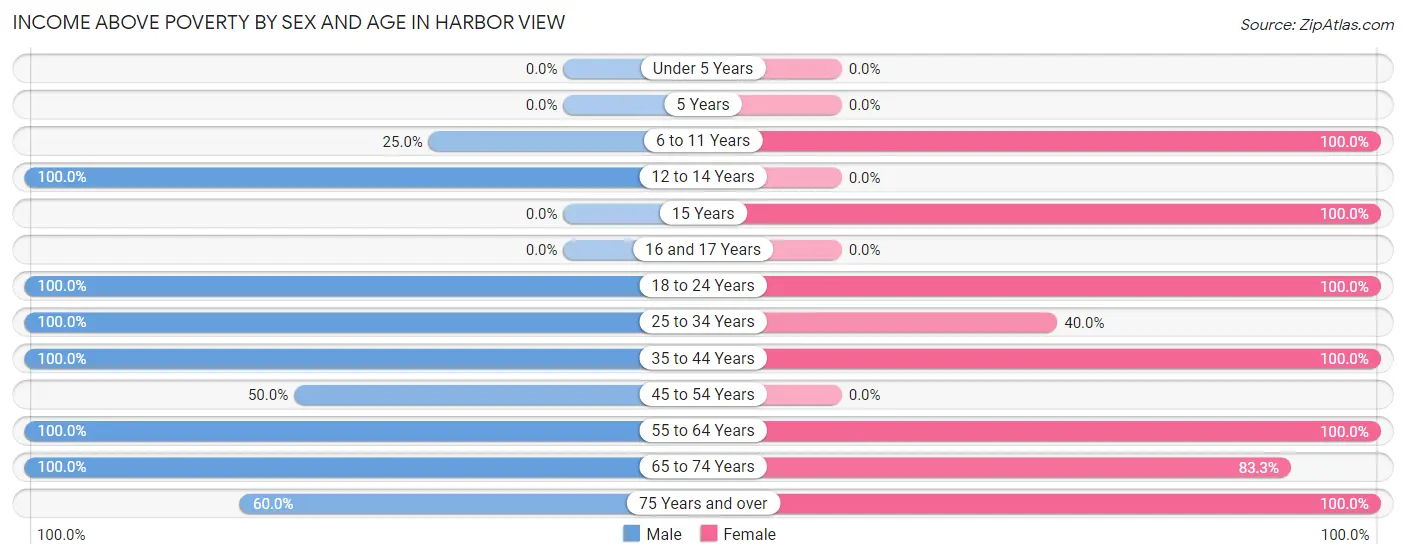
| Age Bracket | Male | Female |
| Under 5 Years | 0 (0.0%) | 0 (0.0%) |
| 5 Years | 0 (0.0%) | 0 (0.0%) |
| 6 to 11 Years | 1 (25.0%) | 3 (100.0%) |
| 12 to 14 Years | 1 (100.0%) | 0 (0.0%) |
| 15 Years | 0 (0.0%) | 2 (100.0%) |
| 16 and 17 Years | 0 (0.0%) | 0 (0.0%) |
| 18 to 24 Years | 14 (100.0%) | 18 (100.0%) |
| 25 to 34 Years | 27 (100.0%) | 2 (40.0%) |
| 35 to 44 Years | 16 (100.0%) | 4 (100.0%) |
| 45 to 54 Years | 1 (50.0%) | 0 (0.0%) |
| 55 to 64 Years | 3 (100.0%) | 3 (100.0%) |
| 65 to 74 Years | 1 (100.0%) | 5 (83.3%) |
| 75 Years and over | 3 (60.0%) | 1 (100.0%) |
| Total | 67 (82.7%) | 38 (88.4%) |
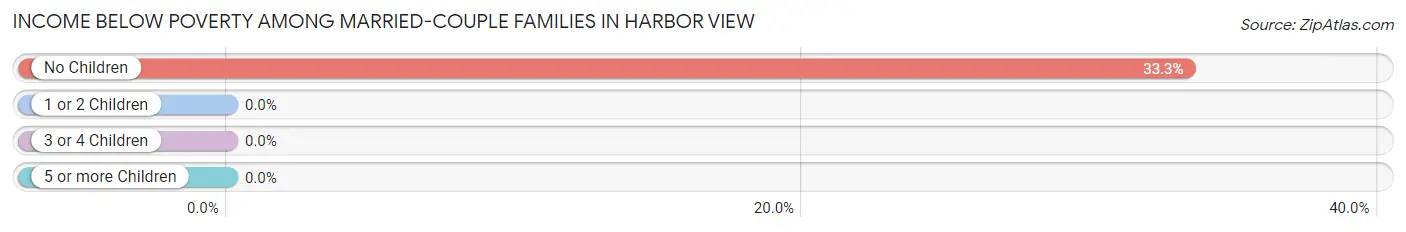
Income Below Poverty Among Married-Couple Families in Harbor View
The poverty statistics for married-couple families in Harbor View show that 25.0% or 2 of the total 8 families live below the poverty line. Families with no children have the highest poverty rate of 33.3%, comprising of 2 families. On the other hand, families with 1 or 2 children have the lowest poverty rate of 0.0%, which includes 0 families.
| Children | Above Poverty | Below Poverty |
| No Children | 4 (66.7%) | 2 (33.3%) |
| 1 or 2 Children | 1 (100.0%) | 0 (0.0%) |
| 3 or 4 Children | 1 (100.0%) | 0 (0.0%) |
| 5 or more Children | 0 (0.0%) | 0 (0.0%) |
| Total | 6 (75.0%) | 2 (25.0%) |
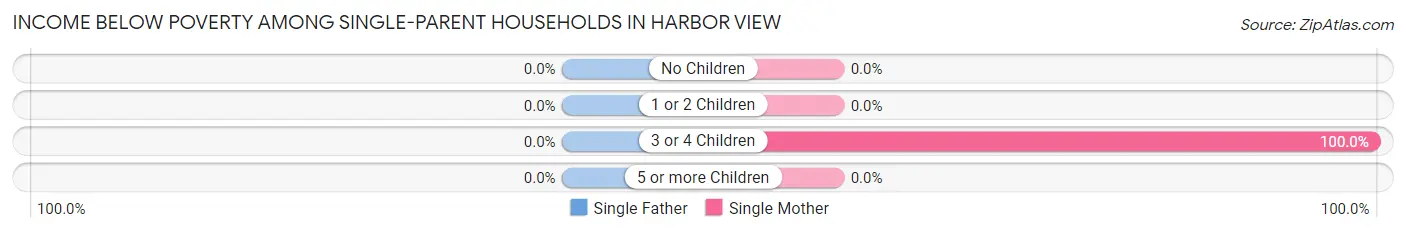
Income Below Poverty Among Single-Parent Households in Harbor View
| Children | Single Father | Single Mother |
| No Children | 0 (0.0%) | 0 (0.0%) |
| 1 or 2 Children | 0 (0.0%) | 0 (0.0%) |
| 3 or 4 Children | 0 (0.0%) | 3 (100.0%) |
| 5 or more Children | 0 (0.0%) | 0 (0.0%) |
| Total | 0 (0.0%) | 3 (33.3%) |
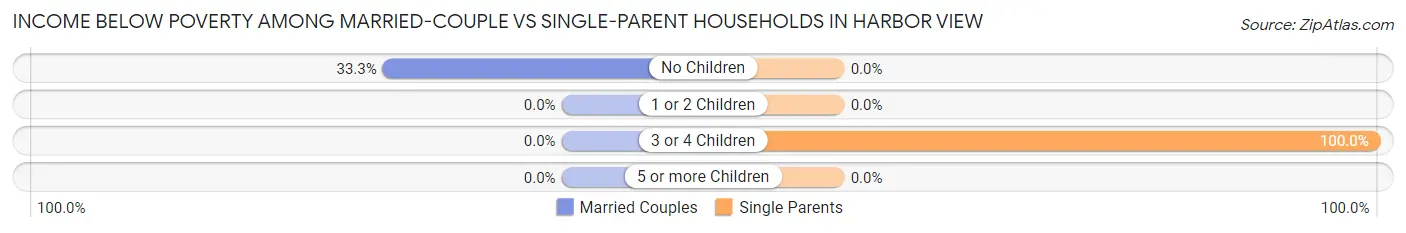
Income Below Poverty Among Married-Couple vs Single-Parent Households in Harbor View
The poverty data for Harbor View shows that 2 of the married-couple family households (25.0%) and 3 of the single-parent households (33.3%) are living below the poverty level. Within the married-couple family households, those with no children have the highest poverty rate, with 2 households (33.3%) falling below the poverty line. Among the single-parent households, those with 3 or 4 children have the highest poverty rate, with 3 household (100.0%) living below poverty.
| Children | Married-Couple Families | Single-Parent Households |
| No Children | 2 (33.3%) | 0 (0.0%) |
| 1 or 2 Children | 0 (0.0%) | 0 (0.0%) |
| 3 or 4 Children | 0 (0.0%) | 3 (100.0%) |
| 5 or more Children | 0 (0.0%) | 0 (0.0%) |
| Total | 2 (25.0%) | 3 (33.3%) |
Employment Characteristics in Harbor View
Employment by Class of Employer in Harbor View
Among the 58 employed individuals in Harbor View, private company employees (42 | 72.4%), not-for-profit organizations (11 | 19.0%), and state government employees (5 | 8.6%) make up the most common classes of employment.
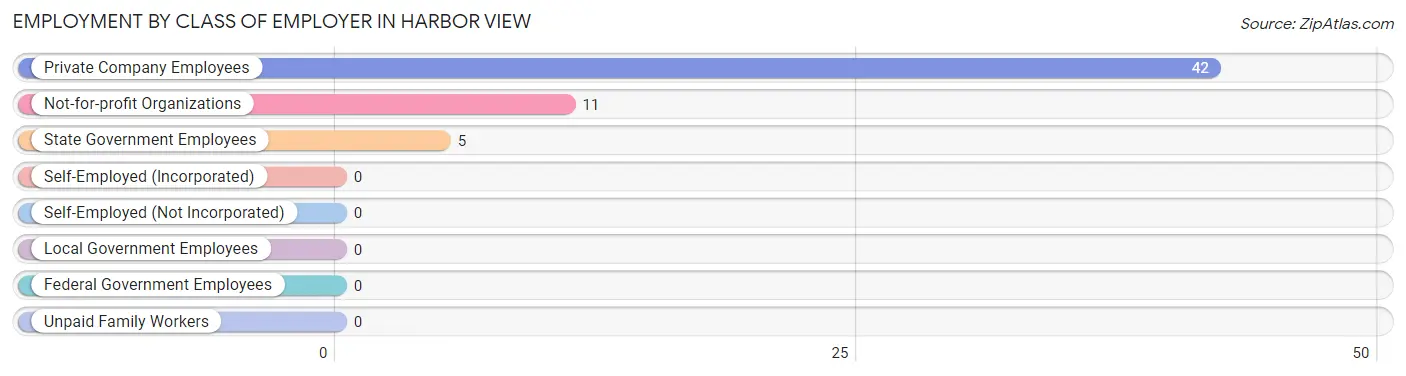
| Employer Class | # Employees | % Employees |
| Private Company Employees | 42 | 72.4% |
| Self-Employed (Incorporated) | 0 | 0.0% |
| Self-Employed (Not Incorporated) | 0 | 0.0% |
| Not-for-profit Organizations | 11 | 19.0% |
| Local Government Employees | 0 | 0.0% |
| State Government Employees | 5 | 8.6% |
| Federal Government Employees | 0 | 0.0% |
| Unpaid Family Workers | 0 | 0.0% |
| Total | 58 | 100.0% |
Employment Status by Age in Harbor View
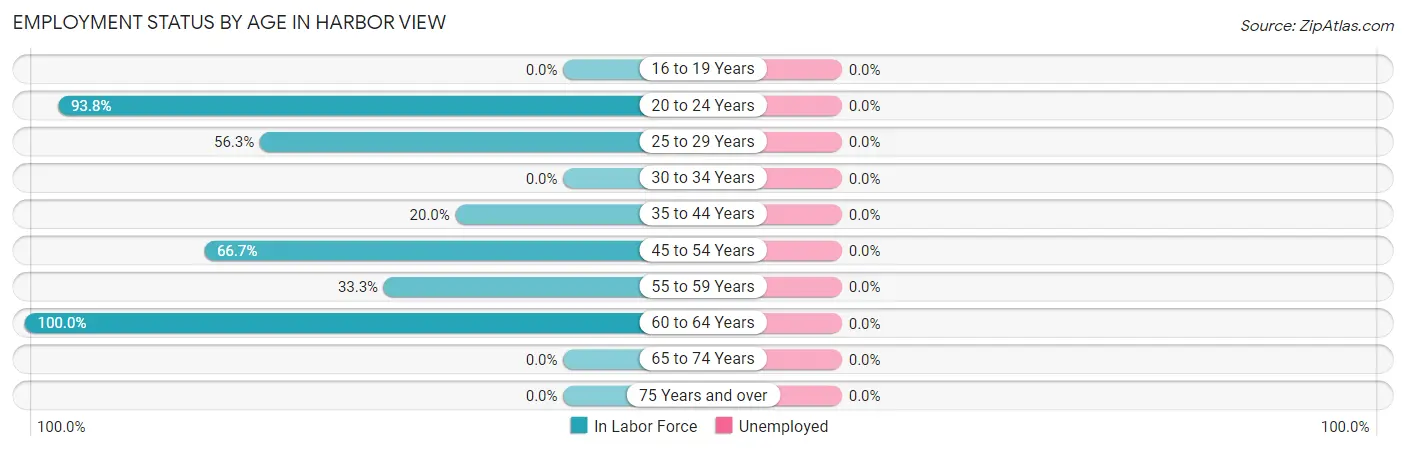
| Age Bracket | In Labor Force | Unemployed |
| 16 to 19 Years | 0 (0.0%) | 0 (0.0%) |
| 20 to 24 Years | 30 (93.8%) | 0 (0.0%) |
| 25 to 29 Years | 18 (56.3%) | 0 (0.0%) |
| 30 to 34 Years | 0 (0.0%) | 0 (0.0%) |
| 35 to 44 Years | 4 (20.0%) | 0 (0.0%) |
| 45 to 54 Years | 2 (66.7%) | 0 (0.0%) |
| 55 to 59 Years | 1 (33.3%) | 0 (0.0%) |
| 60 to 64 Years | 3 (100.0%) | 0 (0.0%) |
| 65 to 74 Years | 0 (0.0%) | 0 (0.0%) |
| 75 Years and over | 0 (0.0%) | 0 (0.0%) |
| Total | 58 (54.7%) | 0 (0.0%) |
Employment Status by Educational Attainment in Harbor View
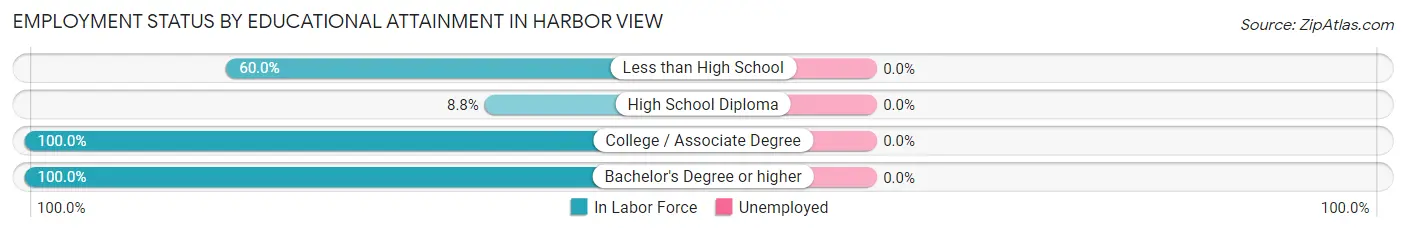
| Educational Attainment | In Labor Force | Unemployed |
| Less than High School | 3 (60.0%) | 0 (0.0%) |
| High School Diploma | 3 (8.8%) | 0 (0.0%) |
| College / Associate Degree | 15 (100.0%) | 0 (0.0%) |
| Bachelor's Degree or higher | 7 (100.0%) | 0 (0.0%) |
| Total | 28 (45.9%) | 0 (0.0%) |
Employment Occupations by Sex in Harbor View
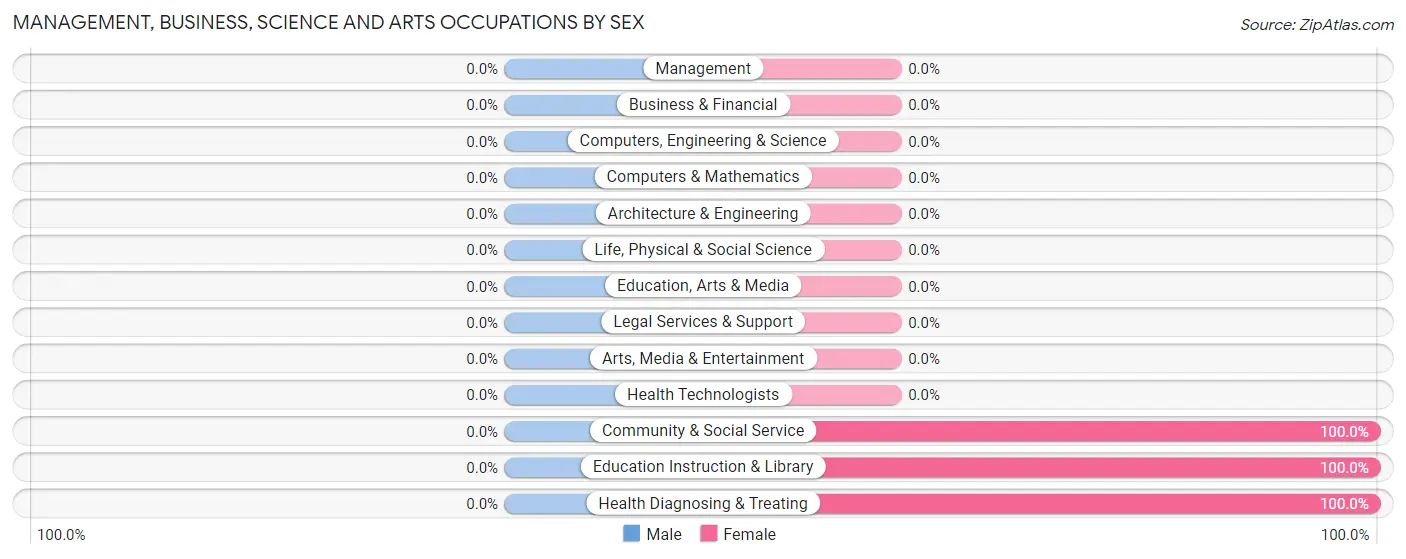
Management, Business, Science and Arts Occupations
The most common Management, Business, Science and Arts occupations in Harbor View are Community & Social Service (2 | 3.5%), Education Instruction & Library (2 | 3.5%), and Health Diagnosing & Treating (2 | 3.5%).
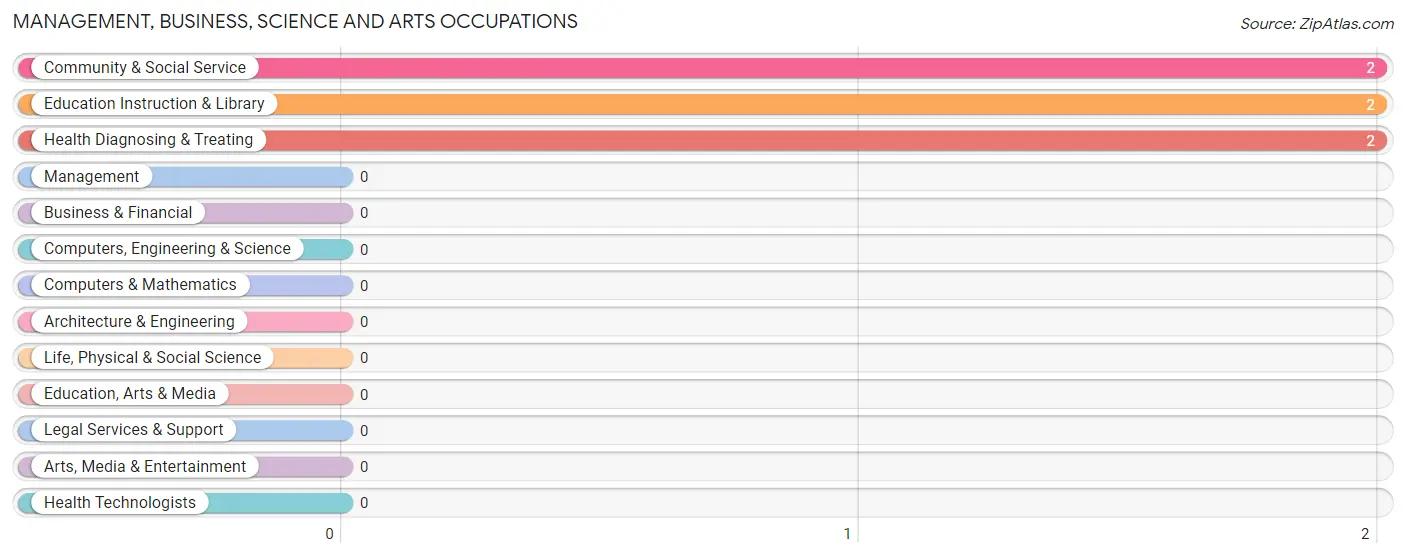
Management, Business, Science and Arts Occupations by Sex
| Occupation | Male | Female |
| Management | 0 (0.0%) | 0 (0.0%) |
| Business & Financial | 0 (0.0%) | 0 (0.0%) |
| Computers, Engineering & Science | 0 (0.0%) | 0 (0.0%) |
| Computers & Mathematics | 0 (0.0%) | 0 (0.0%) |
| Architecture & Engineering | 0 (0.0%) | 0 (0.0%) |
| Life, Physical & Social Science | 0 (0.0%) | 0 (0.0%) |
| Community & Social Service | 0 (0.0%) | 2 (100.0%) |
| Education, Arts & Media | 0 (0.0%) | 0 (0.0%) |
| Legal Services & Support | 0 (0.0%) | 0 (0.0%) |
| Education Instruction & Library | 0 (0.0%) | 2 (100.0%) |
| Arts, Media & Entertainment | 0 (0.0%) | 0 (0.0%) |
| Health Diagnosing & Treating | 0 (0.0%) | 2 (100.0%) |
| Health Technologists | 0 (0.0%) | 0 (0.0%) |
| Total (Category) | 0 (0.0%) | 4 (100.0%) |
| Total (Overall) | 31 (53.4%) | 27 (46.6%) |
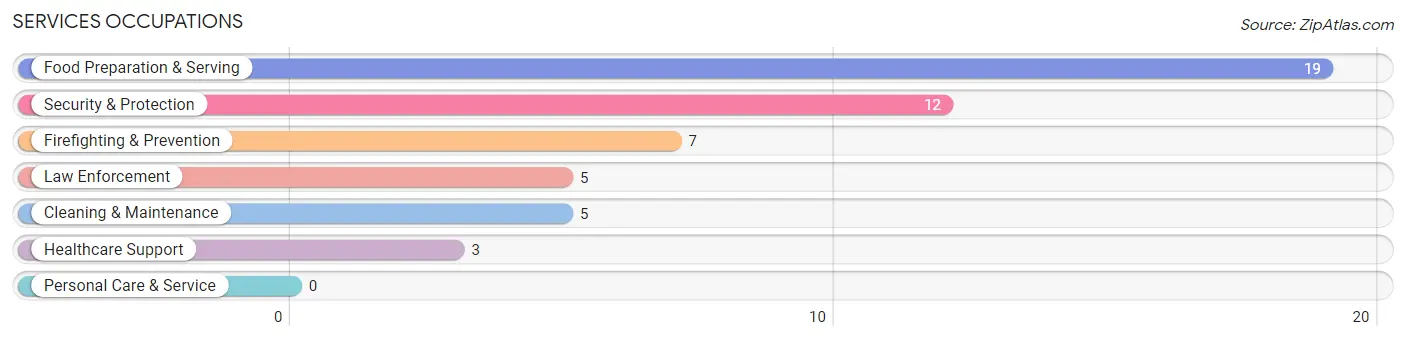
Services Occupations
The most common Services occupations in Harbor View are Food Preparation & Serving (19 | 32.8%), Security & Protection (12 | 20.7%), Firefighting & Prevention (7 | 12.1%), Law Enforcement (5 | 8.6%), and Cleaning & Maintenance (5 | 8.6%).
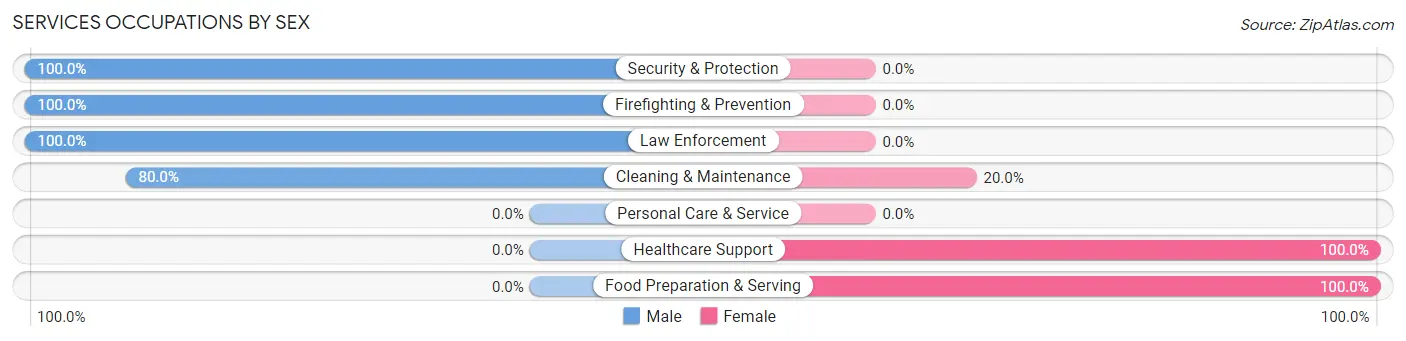
Services Occupations by Sex
Within the Services occupations in Harbor View, the most male-oriented occupations are Security & Protection (100.0%), Firefighting & Prevention (100.0%), and Law Enforcement (100.0%), while the most female-oriented occupations are Healthcare Support (100.0%), Food Preparation & Serving (100.0%), and Cleaning & Maintenance (20.0%).
| Occupation | Male | Female |
| Healthcare Support | 0 (0.0%) | 3 (100.0%) |
| Security & Protection | 12 (100.0%) | 0 (0.0%) |
| Firefighting & Prevention | 7 (100.0%) | 0 (0.0%) |
| Law Enforcement | 5 (100.0%) | 0 (0.0%) |
| Food Preparation & Serving | 0 (0.0%) | 19 (100.0%) |
| Cleaning & Maintenance | 4 (80.0%) | 1 (20.0%) |
| Personal Care & Service | 0 (0.0%) | 0 (0.0%) |
| Total (Category) | 16 (41.0%) | 23 (59.0%) |
| Total (Overall) | 31 (53.4%) | 27 (46.6%) |
Sales and Office Occupations
The most common Sales and Office occupations in Harbor View are , and Office & Administration (12 | 20.7%).
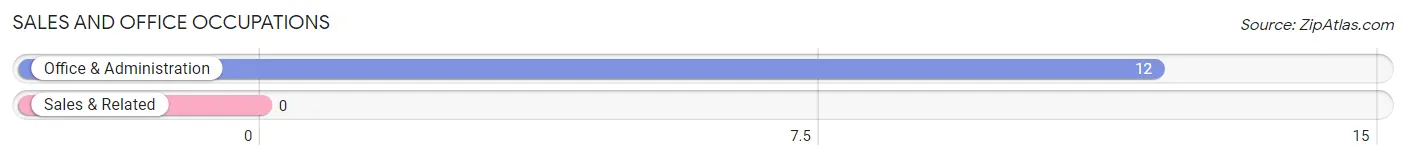
Sales and Office Occupations by Sex
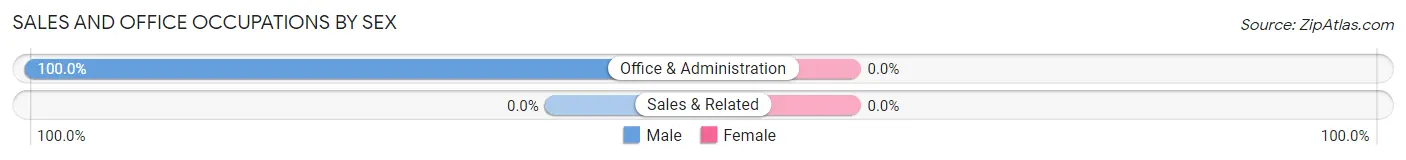
| Occupation | Male | Female |
| Sales & Related | 0 (0.0%) | 0 (0.0%) |
| Office & Administration | 12 (100.0%) | 0 (0.0%) |
| Total (Category) | 12 (100.0%) | 0 (0.0%) |
| Total (Overall) | 31 (53.4%) | 27 (46.6%) |
Natural Resources, Construction and Maintenance Occupations
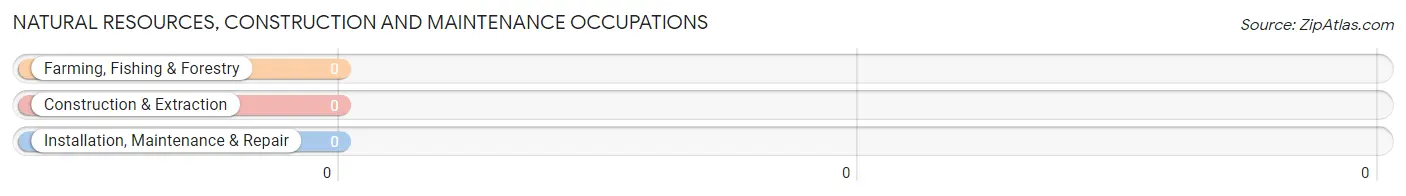
Natural Resources, Construction and Maintenance Occupations by Sex
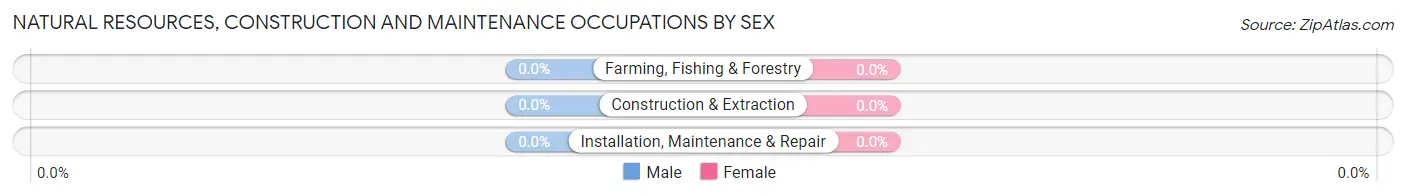
| Occupation | Male | Female |
| Farming, Fishing & Forestry | 0 (0.0%) | 0 (0.0%) |
| Construction & Extraction | 0 (0.0%) | 0 (0.0%) |
| Installation, Maintenance & Repair | 0 (0.0%) | 0 (0.0%) |
| Total (Category) | 0 (0.0%) | 0 (0.0%) |
| Total (Overall) | 31 (53.4%) | 27 (46.6%) |
Production, Transportation and Moving Occupations
The most common Production, Transportation and Moving occupations in Harbor View are Production (1 | 1.7%), Transportation (1 | 1.7%), and Material Moving (1 | 1.7%).
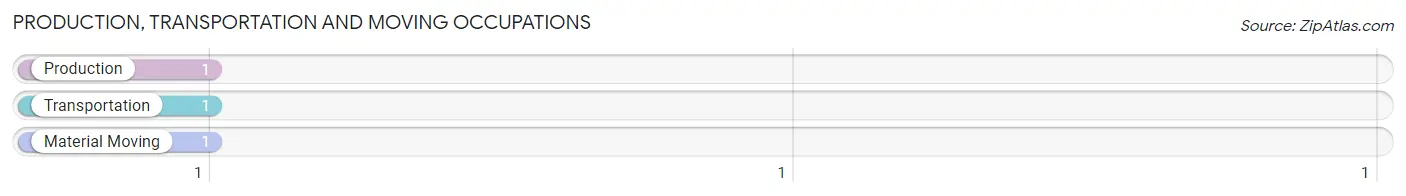
Production, Transportation and Moving Occupations by Sex
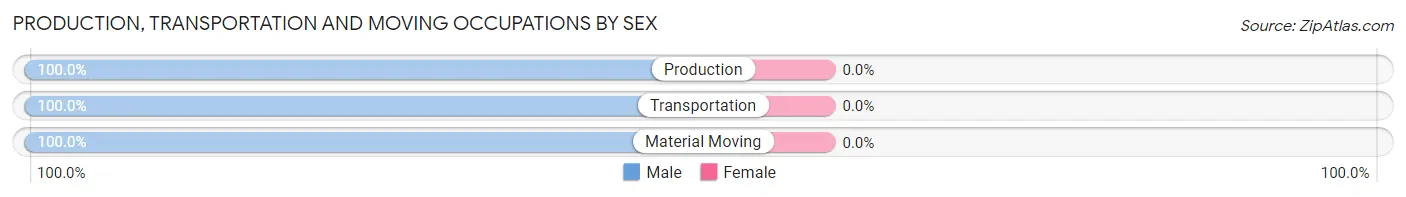
| Occupation | Male | Female |
| Production | 1 (100.0%) | 0 (0.0%) |
| Transportation | 1 (100.0%) | 0 (0.0%) |
| Material Moving | 1 (100.0%) | 0 (0.0%) |
| Total (Category) | 3 (100.0%) | 0 (0.0%) |
| Total (Overall) | 31 (53.4%) | 27 (46.6%) |
Employment Industries by Sex in Harbor View
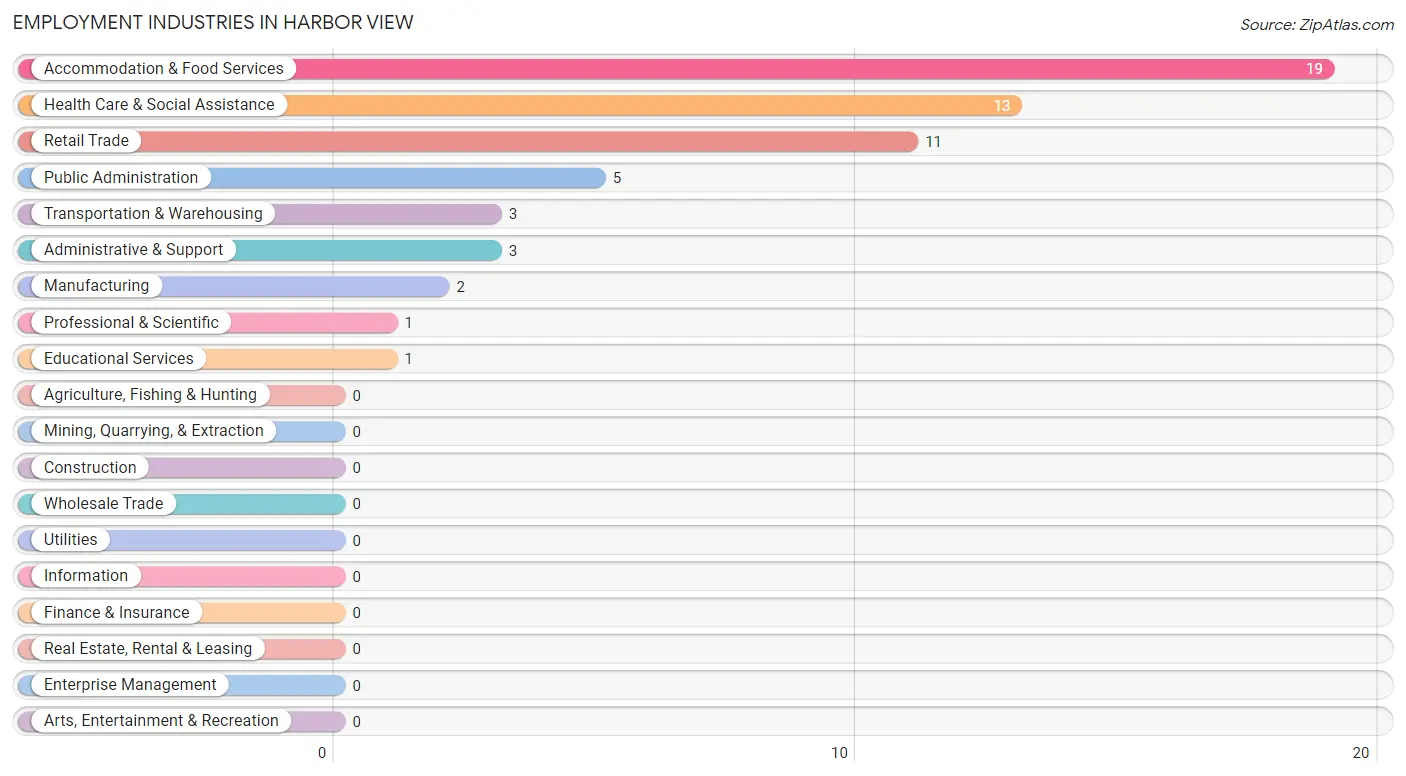
Employment Industries in Harbor View
The major employment industries in Harbor View include Accommodation & Food Services (19 | 32.8%), Health Care & Social Assistance (13 | 22.4%), Retail Trade (11 | 19.0%), Public Administration (5 | 8.6%), and Transportation & Warehousing (3 | 5.2%).
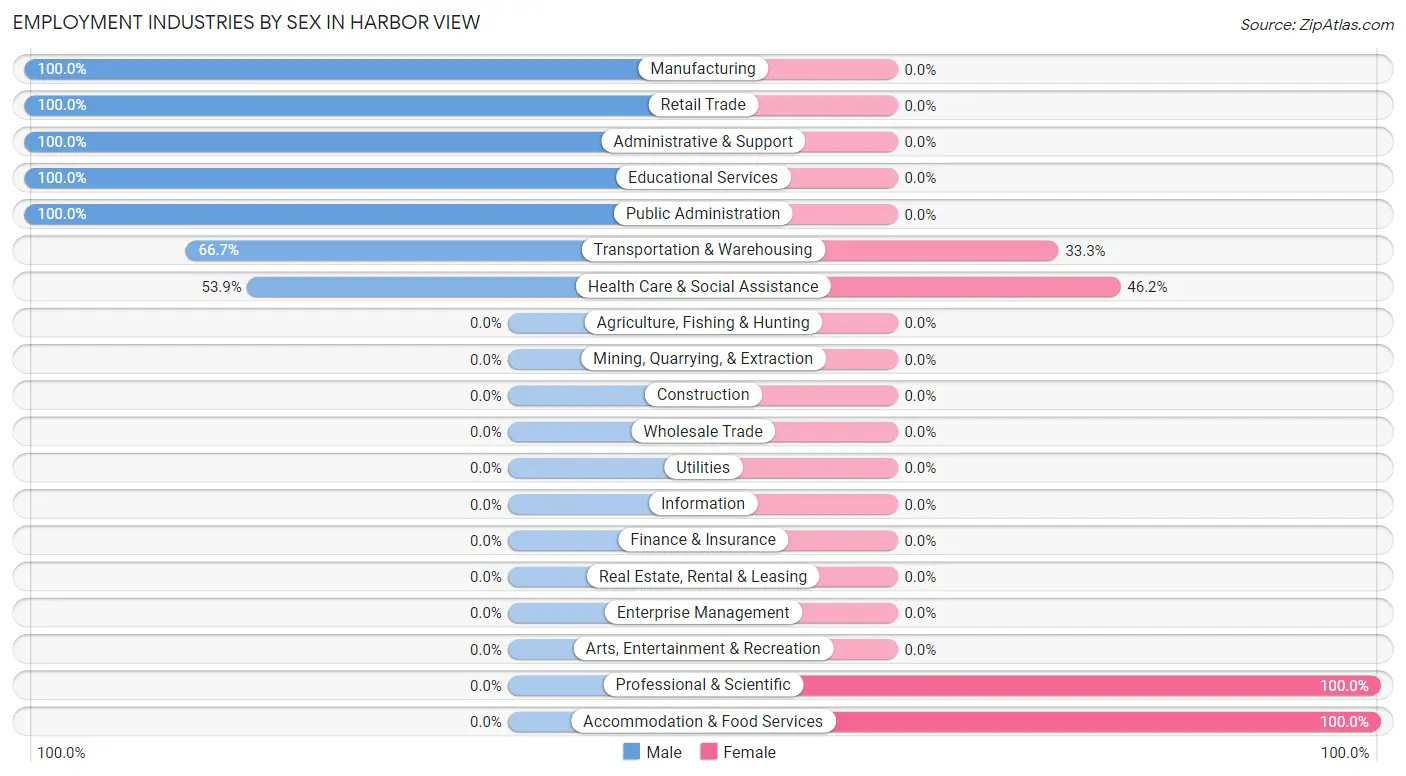
Employment Industries by Sex in Harbor View
The Harbor View industries that see more men than women are Manufacturing (100.0%), Retail Trade (100.0%), and Administrative & Support (100.0%), whereas the industries that tend to have a higher number of women are Professional & Scientific (100.0%), Accommodation & Food Services (100.0%), and Health Care & Social Assistance (46.2%).
| Industry | Male | Female |
| Agriculture, Fishing & Hunting | 0 (0.0%) | 0 (0.0%) |
| Mining, Quarrying, & Extraction | 0 (0.0%) | 0 (0.0%) |
| Construction | 0 (0.0%) | 0 (0.0%) |
| Manufacturing | 2 (100.0%) | 0 (0.0%) |
| Wholesale Trade | 0 (0.0%) | 0 (0.0%) |
| Retail Trade | 11 (100.0%) | 0 (0.0%) |
| Transportation & Warehousing | 2 (66.7%) | 1 (33.3%) |
| Utilities | 0 (0.0%) | 0 (0.0%) |
| Information | 0 (0.0%) | 0 (0.0%) |
| Finance & Insurance | 0 (0.0%) | 0 (0.0%) |
| Real Estate, Rental & Leasing | 0 (0.0%) | 0 (0.0%) |
| Professional & Scientific | 0 (0.0%) | 1 (100.0%) |
| Enterprise Management | 0 (0.0%) | 0 (0.0%) |
| Administrative & Support | 3 (100.0%) | 0 (0.0%) |
| Educational Services | 1 (100.0%) | 0 (0.0%) |
| Health Care & Social Assistance | 7 (53.8%) | 6 (46.2%) |
| Arts, Entertainment & Recreation | 0 (0.0%) | 0 (0.0%) |
| Accommodation & Food Services | 0 (0.0%) | 19 (100.0%) |
| Public Administration | 5 (100.0%) | 0 (0.0%) |
| Total | 31 (53.4%) | 27 (46.6%) |
Education in Harbor View
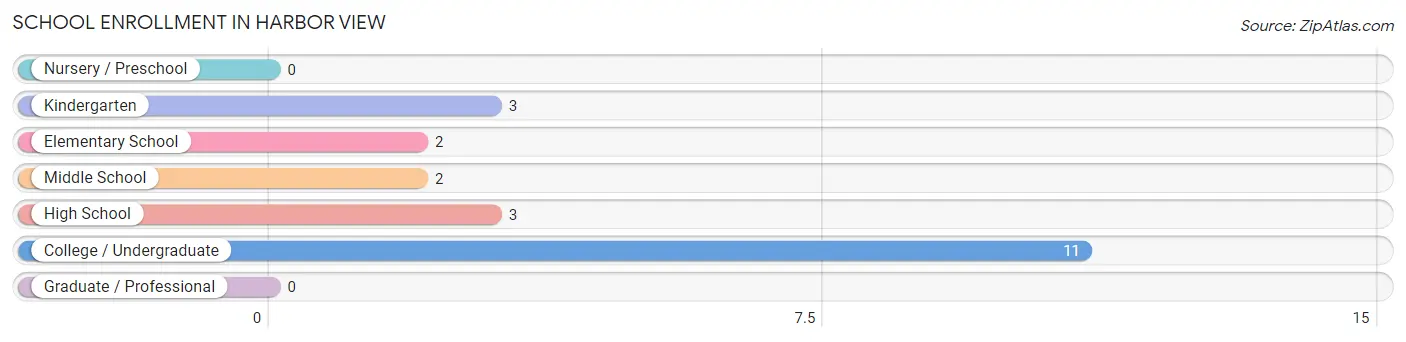
School Enrollment in Harbor View
The most common levels of schooling among the 21 students in Harbor View are college / undergraduate (11 | 52.4%), kindergarten (3 | 14.3%), and high school (3 | 14.3%).
| School Level | # Students | % Students |
| Nursery / Preschool | 0 | 0.0% |
| Kindergarten | 3 | 14.3% |
| Elementary School | 2 | 9.5% |
| Middle School | 2 | 9.5% |
| High School | 3 | 14.3% |
| College / Undergraduate | 11 | 52.4% |
| Graduate / Professional | 0 | 0.0% |
| Total | 21 | 100.0% |
School Enrollment by Age by Funding Source in Harbor View
Out of a total of 21 students who are enrolled in schools in Harbor View, 9 (42.9%) attend a private institution, while the remaining 12 (57.1%) are enrolled in public schools. The age group of 25 to 34 year olds has the highest likelihood of being enrolled in private schools, with 8 (100.0% in the age bracket) enrolled. Conversely, the age group of 5 to 9 year old has the lowest likelihood of being enrolled in a private school, with 5 (100.0% in the age bracket) attending a public institution.
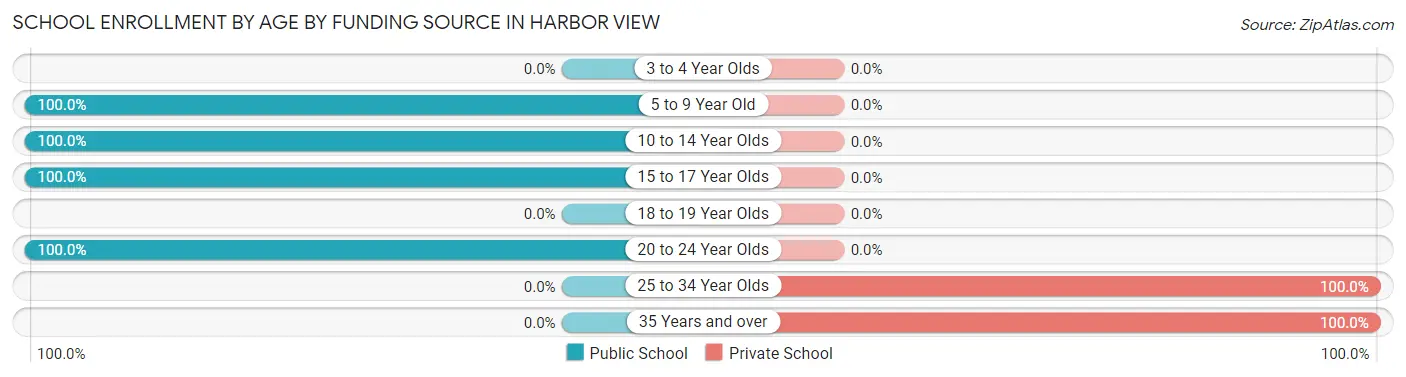
| Age Bracket | Public School | Private School |
| 3 to 4 Year Olds | 0 (0.0%) | 0 (0.0%) |
| 5 to 9 Year Old | 5 (100.0%) | 0 (0.0%) |
| 10 to 14 Year Olds | 3 (100.0%) | 0 (0.0%) |
| 15 to 17 Year Olds | 2 (100.0%) | 0 (0.0%) |
| 18 to 19 Year Olds | 0 (0.0%) | 0 (0.0%) |
| 20 to 24 Year Olds | 2 (100.0%) | 0 (0.0%) |
| 25 to 34 Year Olds | 0 (0.0%) | 8 (100.0%) |
| 35 Years and over | 0 (0.0%) | 1 (100.0%) |
| Total | 12 (57.1%) | 9 (42.9%) |
Educational Attainment by Field of Study in Harbor View
Arts & humanities (5 | 55.6%), engineering (2 | 22.2%), computers & mathematics (1 | 11.1%), and business (1 | 11.1%) are the most common fields of study among 9 individuals in Harbor View who have obtained a bachelor's degree or higher.
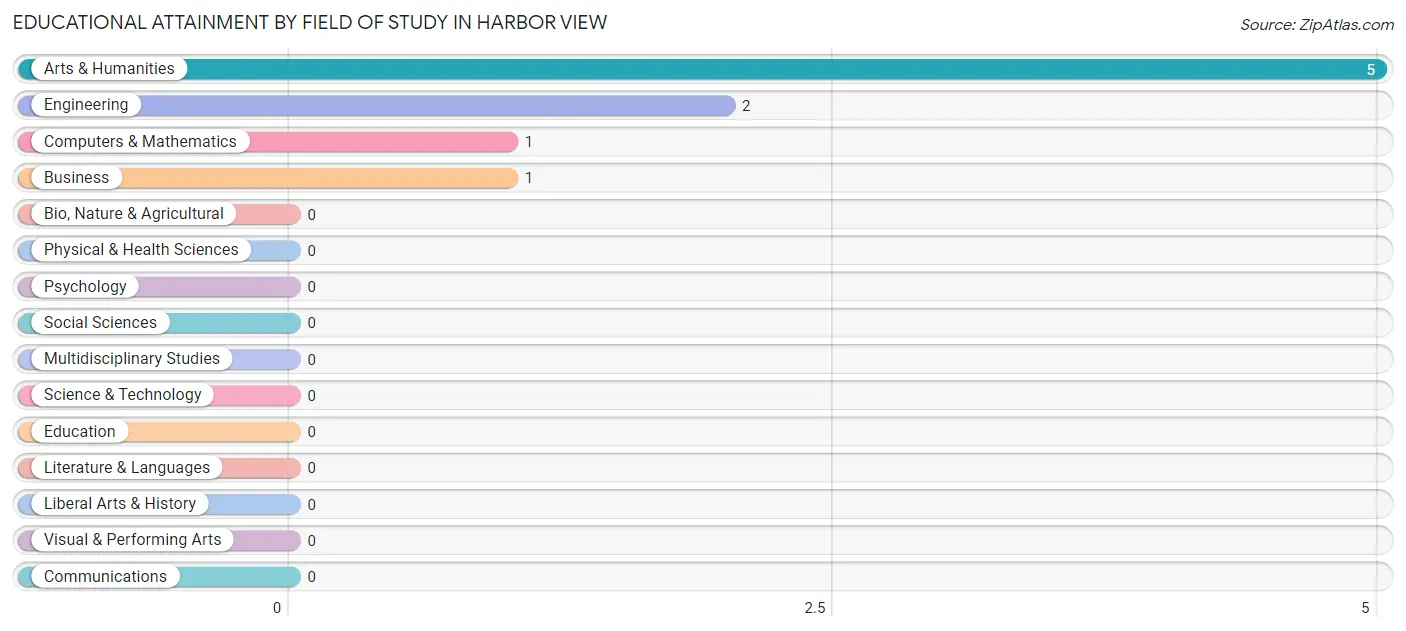
| Field of Study | # Graduates | % Graduates |
| Computers & Mathematics | 1 | 11.1% |
| Bio, Nature & Agricultural | 0 | 0.0% |
| Physical & Health Sciences | 0 | 0.0% |
| Psychology | 0 | 0.0% |
| Social Sciences | 0 | 0.0% |
| Engineering | 2 | 22.2% |
| Multidisciplinary Studies | 0 | 0.0% |
| Science & Technology | 0 | 0.0% |
| Business | 1 | 11.1% |
| Education | 0 | 0.0% |
| Literature & Languages | 0 | 0.0% |
| Liberal Arts & History | 0 | 0.0% |
| Visual & Performing Arts | 0 | 0.0% |
| Communications | 0 | 0.0% |
| Arts & Humanities | 5 | 55.6% |
| Total | 9 | 100.0% |
Transportation & Commute in Harbor View
Vehicle Availability by Sex in Harbor View
The most prevalent vehicle ownership categories in Harbor View are males with 3 vehicles (13, accounting for 41.9%) and females with 3 vehicles (13, making up 48.1%).
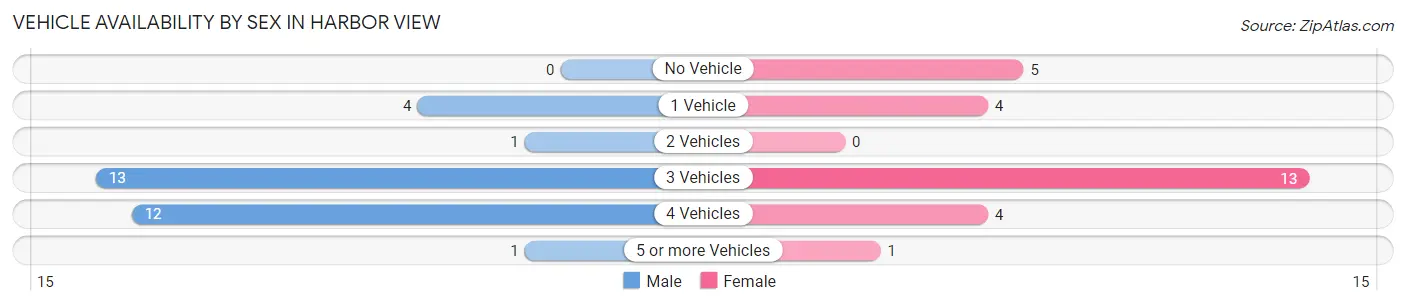
| Vehicles Available | Male | Female |
| No Vehicle | 0 (0.0%) | 5 (18.5%) |
| 1 Vehicle | 4 (12.9%) | 4 (14.8%) |
| 2 Vehicles | 1 (3.2%) | 0 (0.0%) |
| 3 Vehicles | 13 (41.9%) | 13 (48.1%) |
| 4 Vehicles | 12 (38.7%) | 4 (14.8%) |
| 5 or more Vehicles | 1 (3.2%) | 1 (3.7%) |
| Total | 31 (100.0%) | 27 (100.0%) |
Commute Time in Harbor View
The most frequently occuring commute durations in Harbor View are 30 to 34 minutes (19 commuters, 32.8%), 15 to 19 minutes (18 commuters, 31.0%), and 35 to 39 minutes (12 commuters, 20.7%).
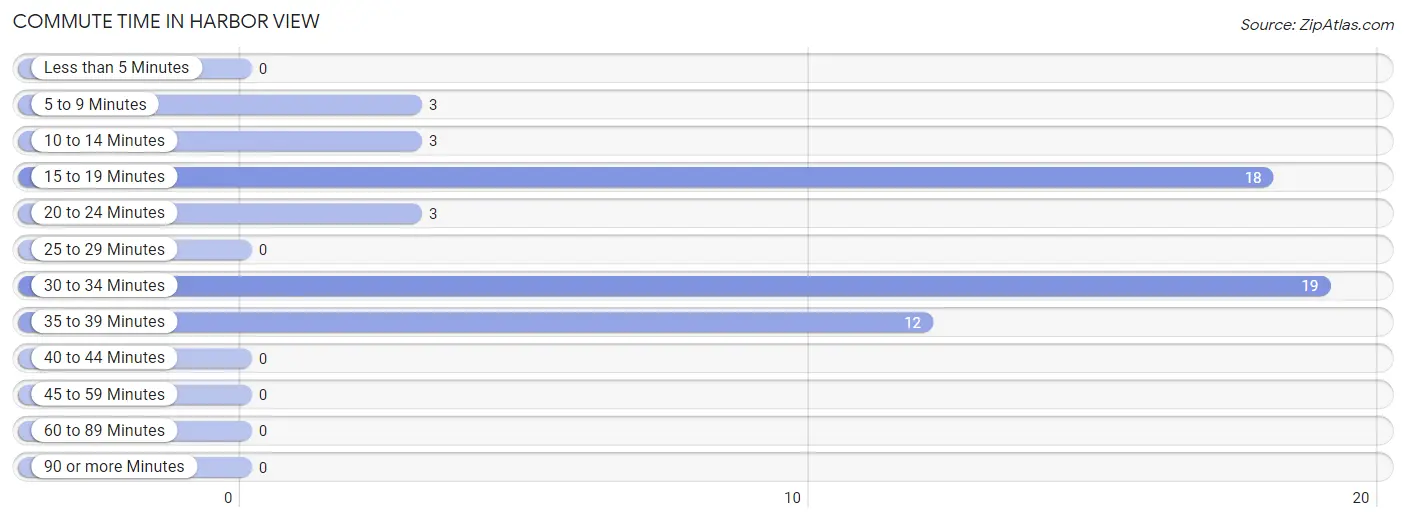
| Commute Time | # Commuters | % Commuters |
| Less than 5 Minutes | 0 | 0.0% |
| 5 to 9 Minutes | 3 | 5.2% |
| 10 to 14 Minutes | 3 | 5.2% |
| 15 to 19 Minutes | 18 | 31.0% |
| 20 to 24 Minutes | 3 | 5.2% |
| 25 to 29 Minutes | 0 | 0.0% |
| 30 to 34 Minutes | 19 | 32.8% |
| 35 to 39 Minutes | 12 | 20.7% |
| 40 to 44 Minutes | 0 | 0.0% |
| 45 to 59 Minutes | 0 | 0.0% |
| 60 to 89 Minutes | 0 | 0.0% |
| 90 or more Minutes | 0 | 0.0% |
Commute Time by Sex in Harbor View
The most common commute times in Harbor View are 30 to 34 minutes (12 commuters, 38.7%) for males and 15 to 19 minutes (16 commuters, 59.3%) for females.
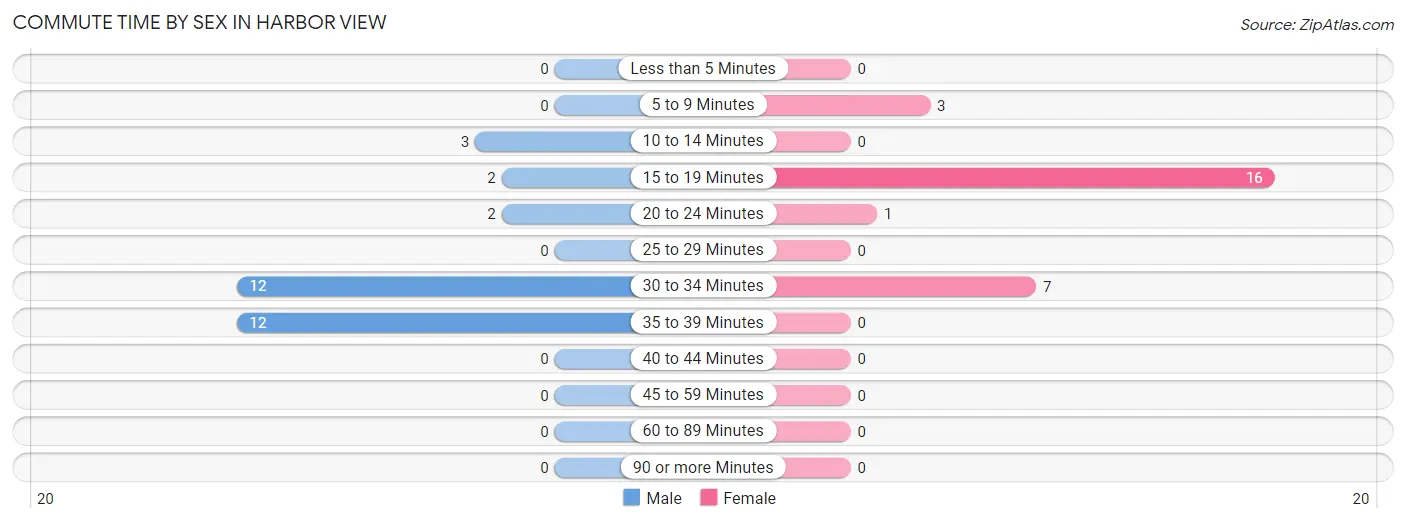
| Commute Time | Male | Female |
| Less than 5 Minutes | 0 (0.0%) | 0 (0.0%) |
| 5 to 9 Minutes | 0 (0.0%) | 3 (11.1%) |
| 10 to 14 Minutes | 3 (9.7%) | 0 (0.0%) |
| 15 to 19 Minutes | 2 (6.5%) | 16 (59.3%) |
| 20 to 24 Minutes | 2 (6.5%) | 1 (3.7%) |
| 25 to 29 Minutes | 0 (0.0%) | 0 (0.0%) |
| 30 to 34 Minutes | 12 (38.7%) | 7 (25.9%) |
| 35 to 39 Minutes | 12 (38.7%) | 0 (0.0%) |
| 40 to 44 Minutes | 0 (0.0%) | 0 (0.0%) |
| 45 to 59 Minutes | 0 (0.0%) | 0 (0.0%) |
| 60 to 89 Minutes | 0 (0.0%) | 0 (0.0%) |
| 90 or more Minutes | 0 (0.0%) | 0 (0.0%) |
Time of Departure to Work by Sex in Harbor View
The most frequent times of departure to work in Harbor View are 12:00 PM to 3:59 PM (11, 35.5%) for males and 12:00 PM to 3:59 PM (12, 44.4%) for females.
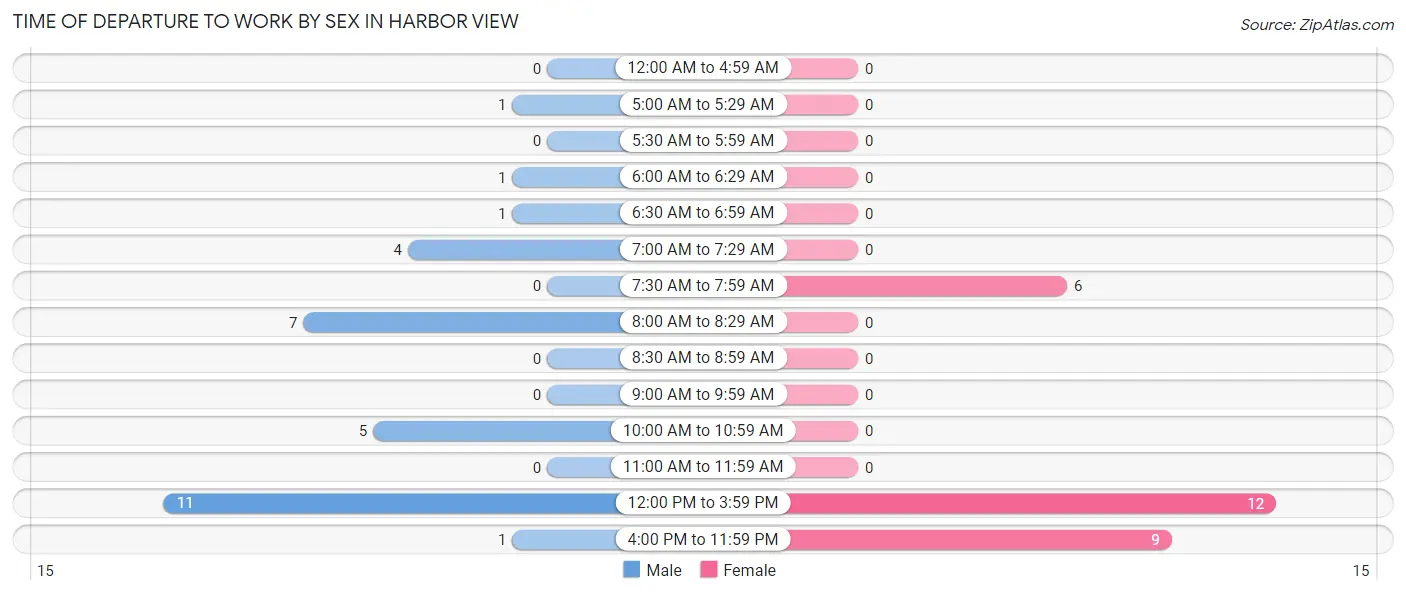
| Time of Departure | Male | Female |
| 12:00 AM to 4:59 AM | 0 (0.0%) | 0 (0.0%) |
| 5:00 AM to 5:29 AM | 1 (3.2%) | 0 (0.0%) |
| 5:30 AM to 5:59 AM | 0 (0.0%) | 0 (0.0%) |
| 6:00 AM to 6:29 AM | 1 (3.2%) | 0 (0.0%) |
| 6:30 AM to 6:59 AM | 1 (3.2%) | 0 (0.0%) |
| 7:00 AM to 7:29 AM | 4 (12.9%) | 0 (0.0%) |
| 7:30 AM to 7:59 AM | 0 (0.0%) | 6 (22.2%) |
| 8:00 AM to 8:29 AM | 7 (22.6%) | 0 (0.0%) |
| 8:30 AM to 8:59 AM | 0 (0.0%) | 0 (0.0%) |
| 9:00 AM to 9:59 AM | 0 (0.0%) | 0 (0.0%) |
| 10:00 AM to 10:59 AM | 5 (16.1%) | 0 (0.0%) |
| 11:00 AM to 11:59 AM | 0 (0.0%) | 0 (0.0%) |
| 12:00 PM to 3:59 PM | 11 (35.5%) | 12 (44.4%) |
| 4:00 PM to 11:59 PM | 1 (3.2%) | 9 (33.3%) |
| Total | 31 (100.0%) | 27 (100.0%) |
Housing Occupancy in Harbor View
Occupancy by Ownership in Harbor View
Of the total 25 dwellings in Harbor View, owner-occupied units account for 19 (76.0%), while renter-occupied units make up 6 (24.0%).
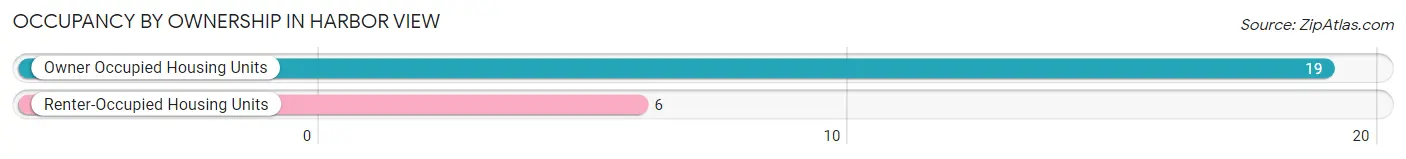
| Occupancy | # Housing Units | % Housing Units |
| Owner Occupied Housing Units | 19 | 76.0% |
| Renter-Occupied Housing Units | 6 | 24.0% |
| Total Occupied Housing Units | 25 | 100.0% |
Occupancy by Household Size in Harbor View
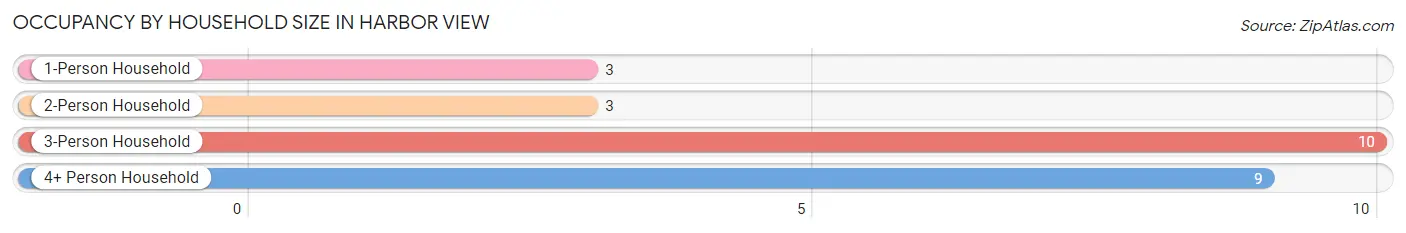
| Household Size | # Housing Units | % Housing Units |
| 1-Person Household | 3 | 12.0% |
| 2-Person Household | 3 | 12.0% |
| 3-Person Household | 10 | 40.0% |
| 4+ Person Household | 9 | 36.0% |
| Total Housing Units | 25 | 100.0% |
Occupancy by Ownership by Household Size in Harbor View
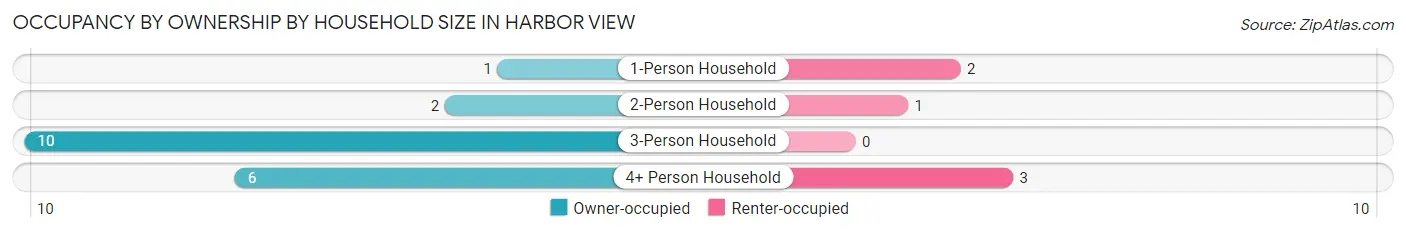
| Household Size | Owner-occupied | Renter-occupied |
| 1-Person Household | 1 (33.3%) | 2 (66.7%) |
| 2-Person Household | 2 (66.7%) | 1 (33.3%) |
| 3-Person Household | 10 (100.0%) | 0 (0.0%) |
| 4+ Person Household | 6 (66.7%) | 3 (33.3%) |
| Total Housing Units | 19 (76.0%) | 6 (24.0%) |
Occupancy by Educational Attainment in Harbor View
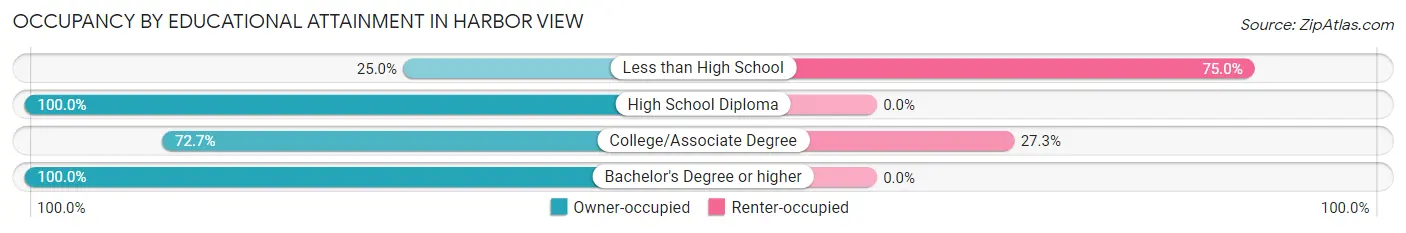
| Household Size | Owner-occupied | Renter-occupied |
| Less than High School | 1 (25.0%) | 3 (75.0%) |
| High School Diploma | 4 (100.0%) | 0 (0.0%) |
| College/Associate Degree | 8 (72.7%) | 3 (27.3%) |
| Bachelor's Degree or higher | 6 (100.0%) | 0 (0.0%) |
Occupancy by Age of Householder in Harbor View
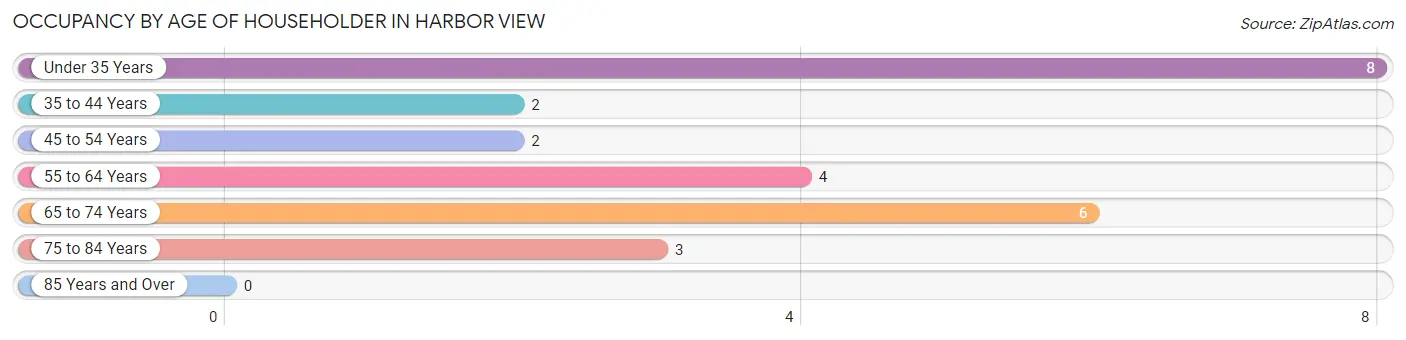
| Age Bracket | # Households | % Households |
| Under 35 Years | 8 | 32.0% |
| 35 to 44 Years | 2 | 8.0% |
| 45 to 54 Years | 2 | 8.0% |
| 55 to 64 Years | 4 | 16.0% |
| 65 to 74 Years | 6 | 24.0% |
| 75 to 84 Years | 3 | 12.0% |
| 85 Years and Over | 0 | 0.0% |
| Total | 25 | 100.0% |
Housing Finances in Harbor View
Median Income by Occupancy in Harbor View
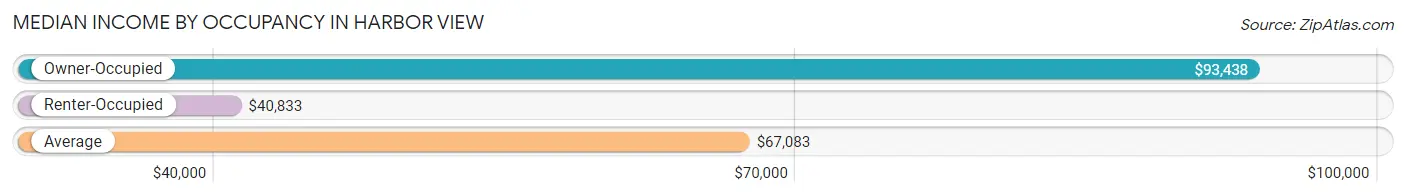
| Occupancy Type | # Households | Median Income |
| Owner-Occupied | 19 (76.0%) | $93,438 |
| Renter-Occupied | 6 (24.0%) | $40,833 |
| Average | 25 (100.0%) | $67,083 |
Occupancy by Householder Income Bracket in Harbor View
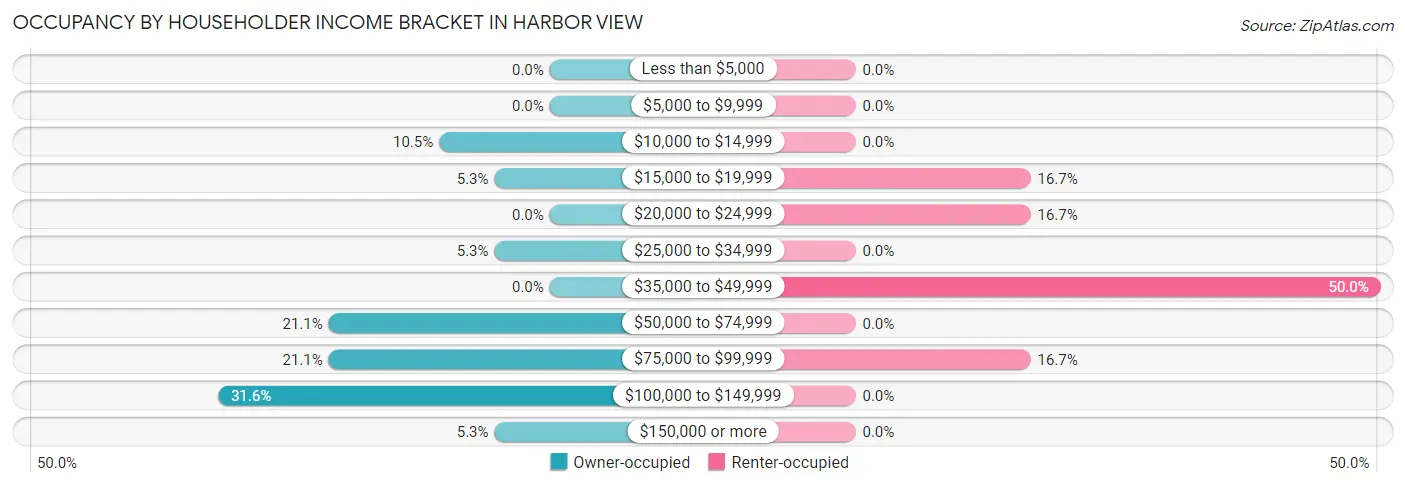
| Income Bracket | Owner-occupied | Renter-occupied |
| Less than $5,000 | 0 (0.0%) | 0 (0.0%) |
| $5,000 to $9,999 | 0 (0.0%) | 0 (0.0%) |
| $10,000 to $14,999 | 2 (10.5%) | 0 (0.0%) |
| $15,000 to $19,999 | 1 (5.3%) | 1 (16.7%) |
| $20,000 to $24,999 | 0 (0.0%) | 1 (16.7%) |
| $25,000 to $34,999 | 1 (5.3%) | 0 (0.0%) |
| $35,000 to $49,999 | 0 (0.0%) | 3 (50.0%) |
| $50,000 to $74,999 | 4 (21.0%) | 0 (0.0%) |
| $75,000 to $99,999 | 4 (21.0%) | 1 (16.7%) |
| $100,000 to $149,999 | 6 (31.6%) | 0 (0.0%) |
| $150,000 or more | 1 (5.3%) | 0 (0.0%) |
| Total | 19 (100.0%) | 6 (100.0%) |
Monthly Housing Cost Tiers in Harbor View
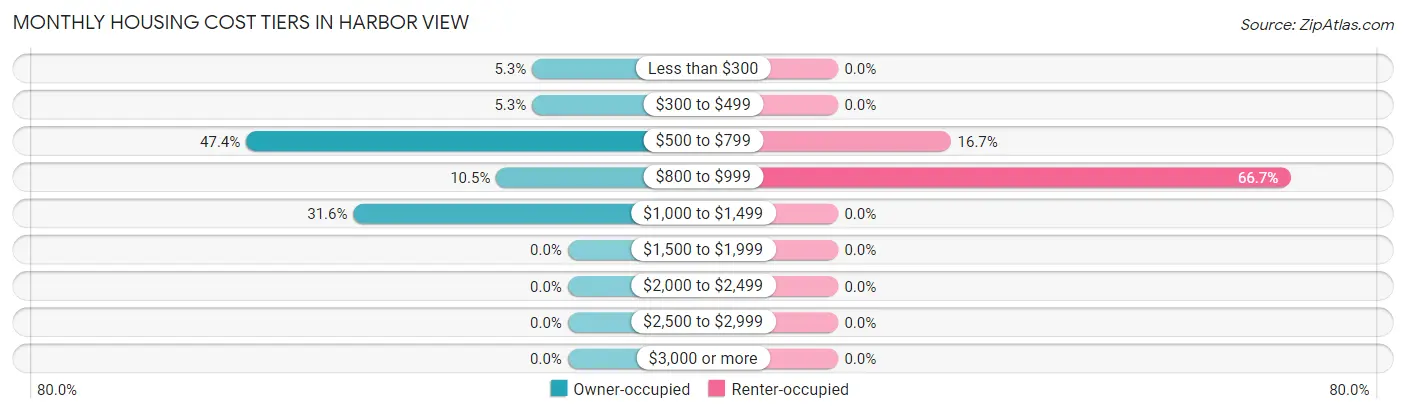
| Monthly Cost | Owner-occupied | Renter-occupied |
| Less than $300 | 1 (5.3%) | 0 (0.0%) |
| $300 to $499 | 1 (5.3%) | 0 (0.0%) |
| $500 to $799 | 9 (47.4%) | 1 (16.7%) |
| $800 to $999 | 2 (10.5%) | 4 (66.7%) |
| $1,000 to $1,499 | 6 (31.6%) | 0 (0.0%) |
| $1,500 to $1,999 | 0 (0.0%) | 0 (0.0%) |
| $2,000 to $2,499 | 0 (0.0%) | 0 (0.0%) |
| $2,500 to $2,999 | 0 (0.0%) | 0 (0.0%) |
| $3,000 or more | 0 (0.0%) | 0 (0.0%) |
| Total | 19 (100.0%) | 6 (100.0%) |
Physical Housing Characteristics in Harbor View
Housing Structures in Harbor View
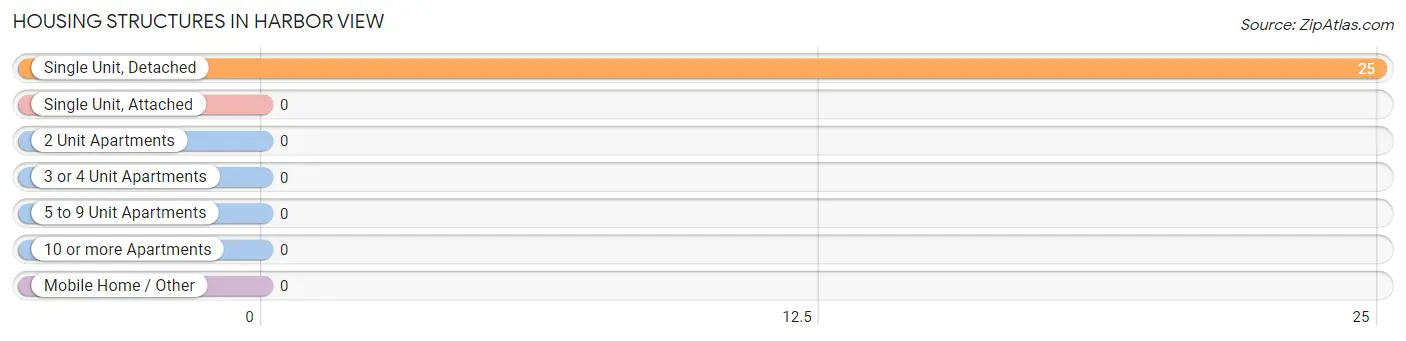
| Structure Type | # Housing Units | % Housing Units |
| Single Unit, Detached | 25 | 100.0% |
| Single Unit, Attached | 0 | 0.0% |
| 2 Unit Apartments | 0 | 0.0% |
| 3 or 4 Unit Apartments | 0 | 0.0% |
| 5 to 9 Unit Apartments | 0 | 0.0% |
| 10 or more Apartments | 0 | 0.0% |
| Mobile Home / Other | 0 | 0.0% |
| Total | 25 | 100.0% |
Housing Structures by Occupancy in Harbor View
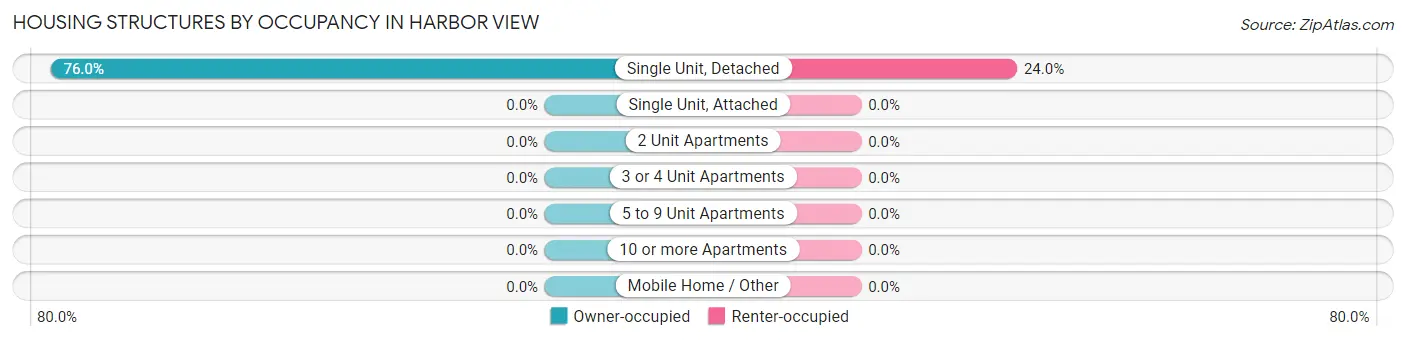
| Structure Type | Owner-occupied | Renter-occupied |
| Single Unit, Detached | 19 (76.0%) | 6 (24.0%) |
| Single Unit, Attached | 0 (0.0%) | 0 (0.0%) |
| 2 Unit Apartments | 0 (0.0%) | 0 (0.0%) |
| 3 or 4 Unit Apartments | 0 (0.0%) | 0 (0.0%) |
| 5 to 9 Unit Apartments | 0 (0.0%) | 0 (0.0%) |
| 10 or more Apartments | 0 (0.0%) | 0 (0.0%) |
| Mobile Home / Other | 0 (0.0%) | 0 (0.0%) |
| Total | 19 (76.0%) | 6 (24.0%) |
Housing Structures by Number of Rooms in Harbor View
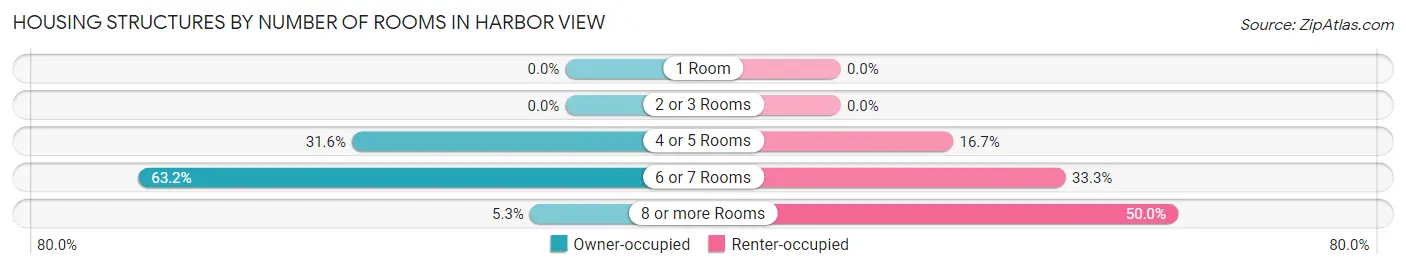
| Number of Rooms | Owner-occupied | Renter-occupied |
| 1 Room | 0 (0.0%) | 0 (0.0%) |
| 2 or 3 Rooms | 0 (0.0%) | 0 (0.0%) |
| 4 or 5 Rooms | 6 (31.6%) | 1 (16.7%) |
| 6 or 7 Rooms | 12 (63.2%) | 2 (33.3%) |
| 8 or more Rooms | 1 (5.3%) | 3 (50.0%) |
| Total | 19 (100.0%) | 6 (100.0%) |
Housing Structure by Heating Type in Harbor View
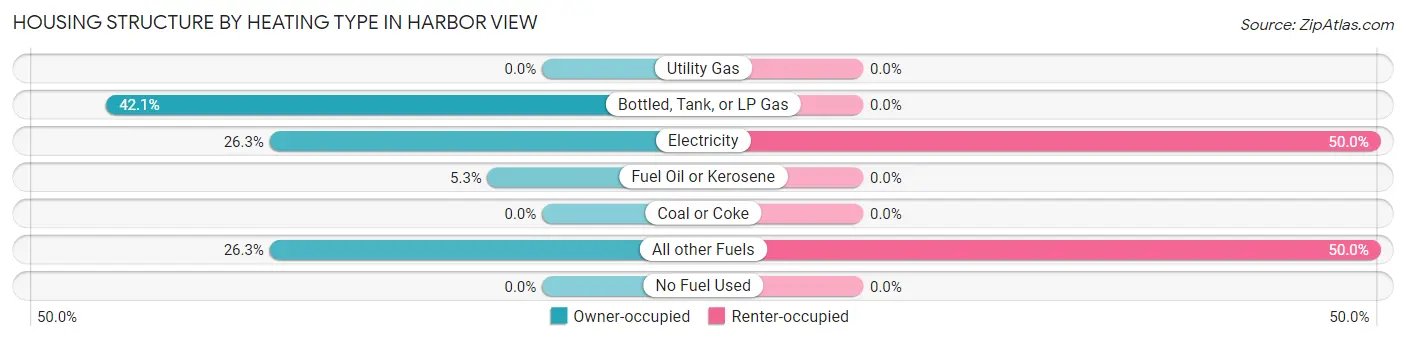
| Heating Type | Owner-occupied | Renter-occupied |
| Utility Gas | 0 (0.0%) | 0 (0.0%) |
| Bottled, Tank, or LP Gas | 8 (42.1%) | 0 (0.0%) |
| Electricity | 5 (26.3%) | 3 (50.0%) |
| Fuel Oil or Kerosene | 1 (5.3%) | 0 (0.0%) |
| Coal or Coke | 0 (0.0%) | 0 (0.0%) |
| All other Fuels | 5 (26.3%) | 3 (50.0%) |
| No Fuel Used | 0 (0.0%) | 0 (0.0%) |
| Total | 19 (100.0%) | 6 (100.0%) |
Household Vehicle Usage in Harbor View
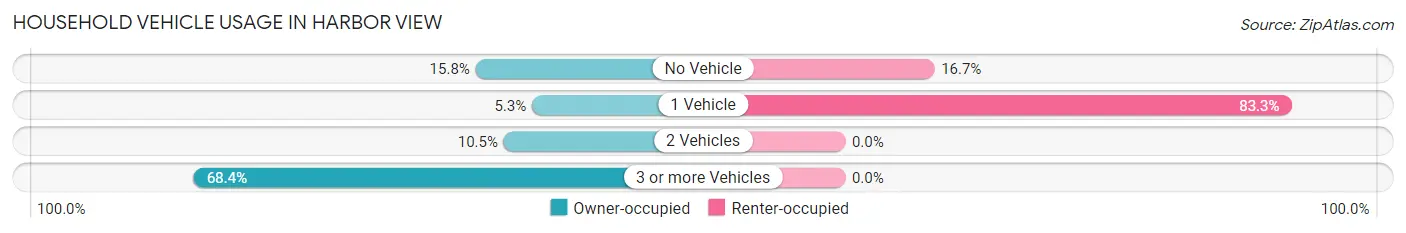
| Vehicles per Household | Owner-occupied | Renter-occupied |
| No Vehicle | 3 (15.8%) | 1 (16.7%) |
| 1 Vehicle | 1 (5.3%) | 5 (83.3%) |
| 2 Vehicles | 2 (10.5%) | 0 (0.0%) |
| 3 or more Vehicles | 13 (68.4%) | 0 (0.0%) |
| Total | 19 (100.0%) | 6 (100.0%) |
Real Estate & Mortgages in Harbor View
Real Estate and Mortgage Overview in Harbor View
| Characteristic | Without Mortgage | With Mortgage |
| Housing Units | 11 | 8 |
| Median Property Value | $91,000 | $210,000 |
| Median Household Income | $66,250 | $1 |
| Monthly Housing Costs | $631 | $0 |
| Real Estate Taxes | $1,188 | $0 |
Property Value by Mortgage Status in Harbor View
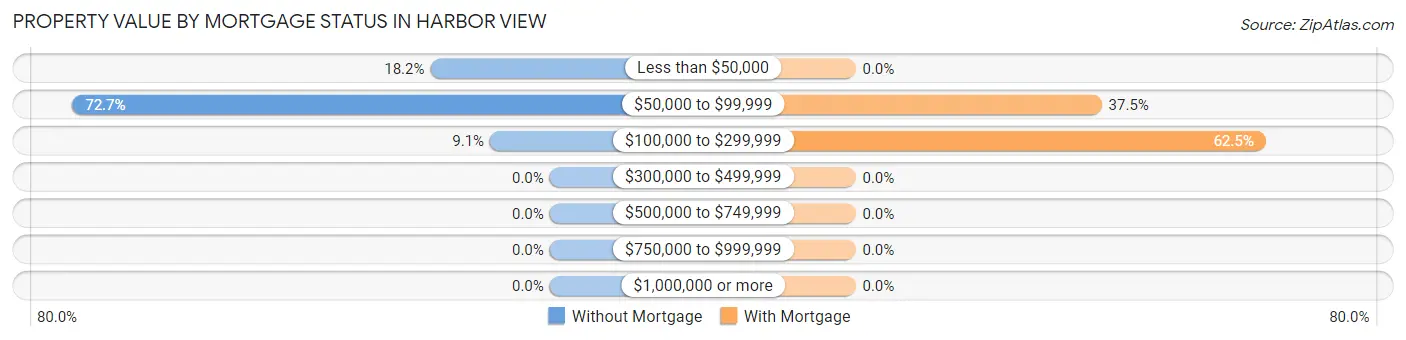
| Property Value | Without Mortgage | With Mortgage |
| Less than $50,000 | 2 (18.2%) | 0 (0.0%) |
| $50,000 to $99,999 | 8 (72.7%) | 3 (37.5%) |
| $100,000 to $299,999 | 1 (9.1%) | 5 (62.5%) |
| $300,000 to $499,999 | 0 (0.0%) | 0 (0.0%) |
| $500,000 to $749,999 | 0 (0.0%) | 0 (0.0%) |
| $750,000 to $999,999 | 0 (0.0%) | 0 (0.0%) |
| $1,000,000 or more | 0 (0.0%) | 0 (0.0%) |
| Total | 11 (100.0%) | 8 (100.0%) |
Household Income by Mortgage Status in Harbor View
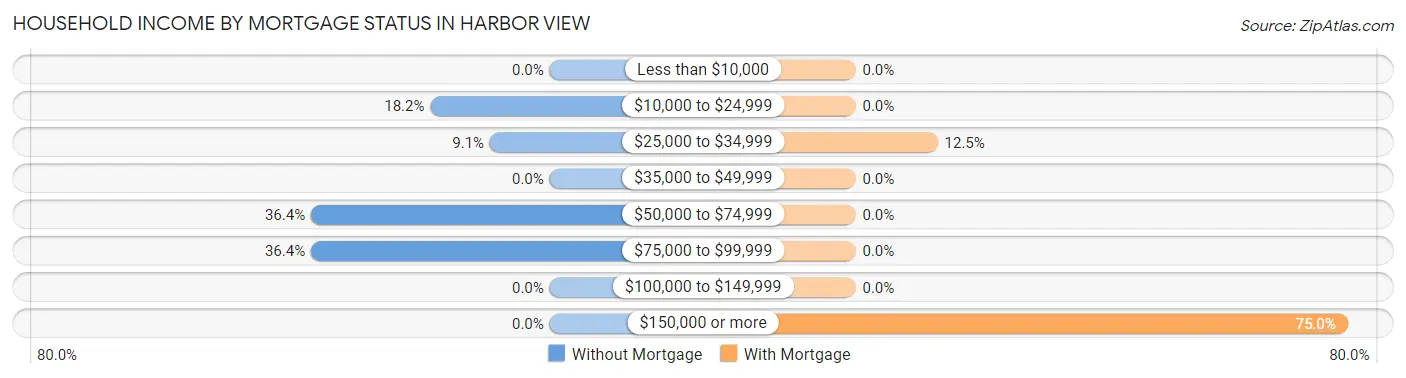
| Household Income | Without Mortgage | With Mortgage |
| Less than $10,000 | 0 (0.0%) | 0 (0.0%) |
| $10,000 to $24,999 | 2 (18.2%) | 0 (0.0%) |
| $25,000 to $34,999 | 1 (9.1%) | 1 (12.5%) |
| $35,000 to $49,999 | 0 (0.0%) | 0 (0.0%) |
| $50,000 to $74,999 | 4 (36.4%) | 0 (0.0%) |
| $75,000 to $99,999 | 4 (36.4%) | 0 (0.0%) |
| $100,000 to $149,999 | 0 (0.0%) | 0 (0.0%) |
| $150,000 or more | 0 (0.0%) | 6 (75.0%) |
| Total | 11 (100.0%) | 8 (100.0%) |
Property Value to Household Income Ratio in Harbor View
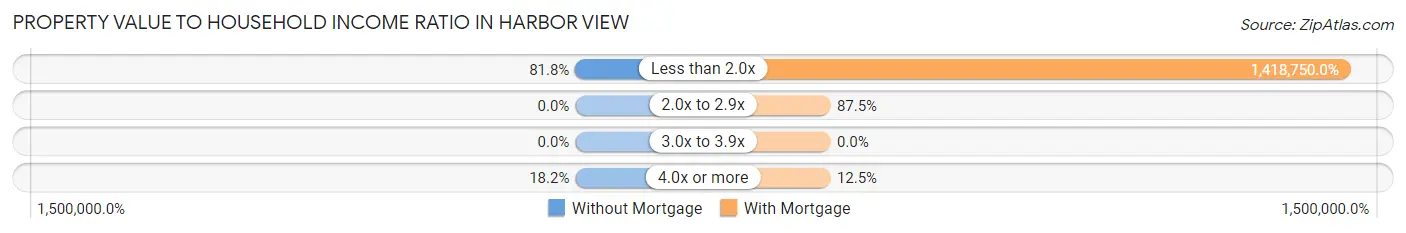
| Value-to-Income Ratio | Without Mortgage | With Mortgage |
| Less than 2.0x | 9 (81.8%) | 113,500 (1,418,750.0%) |
| 2.0x to 2.9x | 0 (0.0%) | 7 (87.5%) |
| 3.0x to 3.9x | 0 (0.0%) | 0 (0.0%) |
| 4.0x or more | 2 (18.2%) | 1 (12.5%) |
| Total | 11 (100.0%) | 8 (100.0%) |
Real Estate Taxes by Mortgage Status in Harbor View
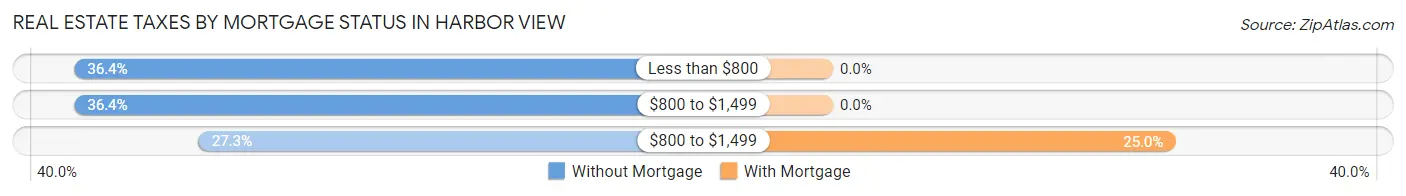
| Property Taxes | Without Mortgage | With Mortgage |
| Less than $800 | 4 (36.4%) | 0 (0.0%) |
| $800 to $1,499 | 4 (36.4%) | 0 (0.0%) |
| $800 to $1,499 | 3 (27.3%) | 2 (25.0%) |
| Total | 11 (100.0%) | 8 (100.0%) |
Health & Disability in Harbor View
Health Insurance Coverage by Age in Harbor View
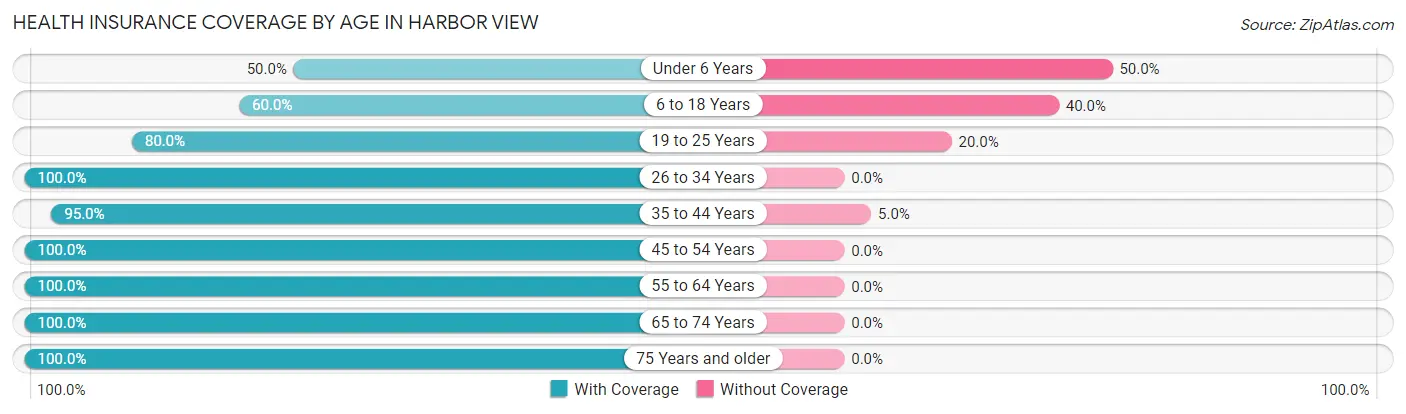
| Age Bracket | With Coverage | Without Coverage |
| Under 6 Years | 4 (50.0%) | 4 (50.0%) |
| 6 to 18 Years | 6 (60.0%) | 4 (40.0%) |
| 19 to 25 Years | 32 (80.0%) | 8 (20.0%) |
| 26 to 34 Years | 24 (100.0%) | 0 (0.0%) |
| 35 to 44 Years | 19 (95.0%) | 1 (5.0%) |
| 45 to 54 Years | 3 (100.0%) | 0 (0.0%) |
| 55 to 64 Years | 6 (100.0%) | 0 (0.0%) |
| 65 to 74 Years | 7 (100.0%) | 0 (0.0%) |
| 75 Years and older | 6 (100.0%) | 0 (0.0%) |
| Total | 107 (86.3%) | 17 (13.7%) |
Health Insurance Coverage by Citizenship Status in Harbor View
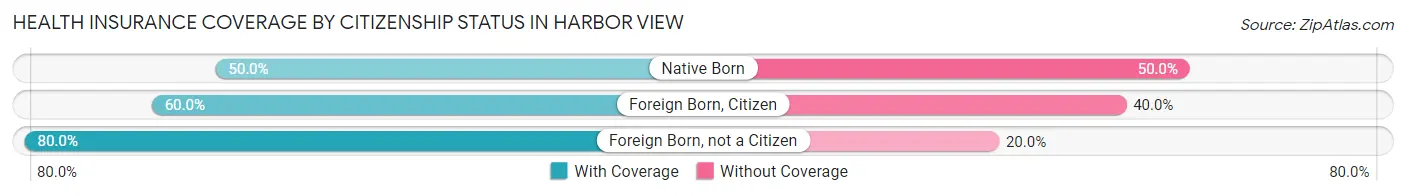
| Citizenship Status | With Coverage | Without Coverage |
| Native Born | 4 (50.0%) | 4 (50.0%) |
| Foreign Born, Citizen | 6 (60.0%) | 4 (40.0%) |
| Foreign Born, not a Citizen | 32 (80.0%) | 8 (20.0%) |
Health Insurance Coverage by Household Income in Harbor View
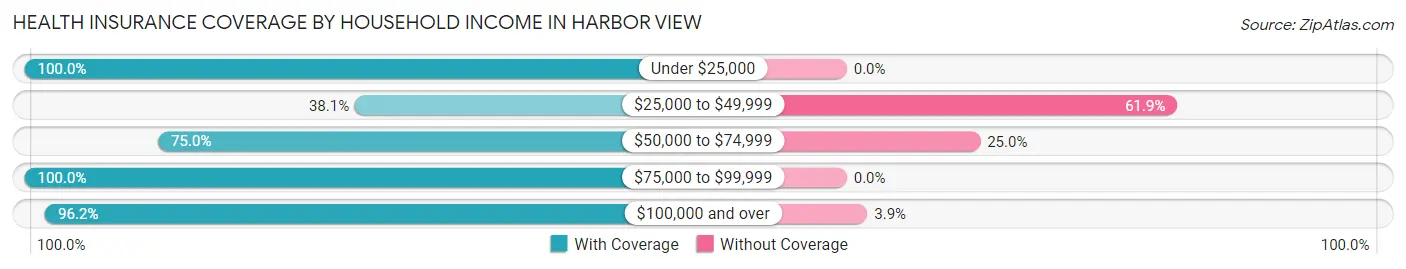
| Household Income | With Coverage | Without Coverage |
| Under $25,000 | 8 (100.0%) | 0 (0.0%) |
| $25,000 to $49,999 | 8 (38.1%) | 13 (61.9%) |
| $50,000 to $74,999 | 9 (75.0%) | 3 (25.0%) |
| $75,000 to $99,999 | 57 (100.0%) | 0 (0.0%) |
| $100,000 and over | 25 (96.2%) | 1 (3.8%) |
Public vs Private Health Insurance Coverage by Age in Harbor View
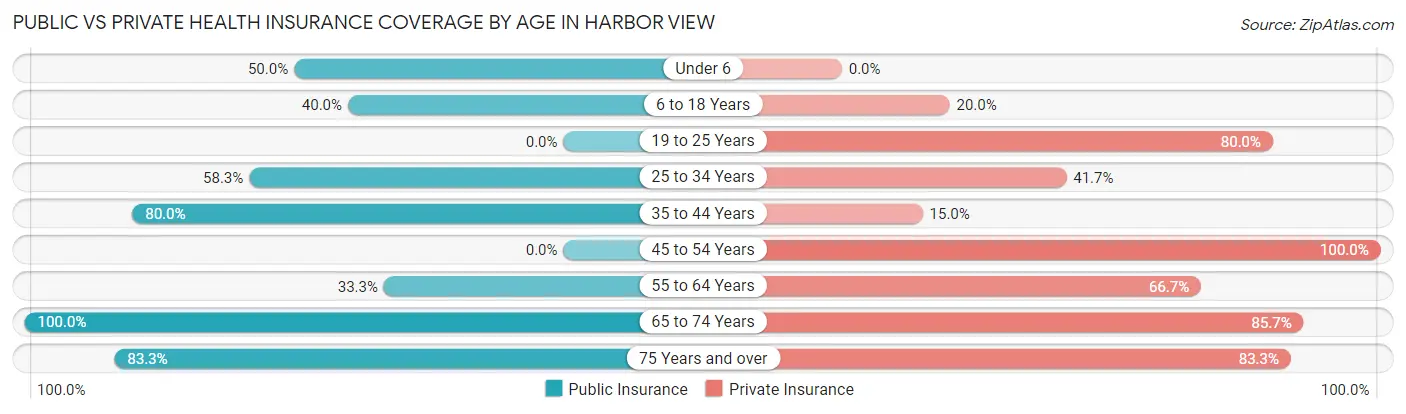
| Age Bracket | Public Insurance | Private Insurance |
| Under 6 | 4 (50.0%) | 0 (0.0%) |
| 6 to 18 Years | 4 (40.0%) | 2 (20.0%) |
| 19 to 25 Years | 0 (0.0%) | 32 (80.0%) |
| 25 to 34 Years | 14 (58.3%) | 10 (41.7%) |
| 35 to 44 Years | 16 (80.0%) | 3 (15.0%) |
| 45 to 54 Years | 0 (0.0%) | 3 (100.0%) |
| 55 to 64 Years | 2 (33.3%) | 4 (66.7%) |
| 65 to 74 Years | 7 (100.0%) | 6 (85.7%) |
| 75 Years and over | 5 (83.3%) | 5 (83.3%) |
| Total | 52 (41.9%) | 65 (52.4%) |
Disability Status by Sex by Age in Harbor View
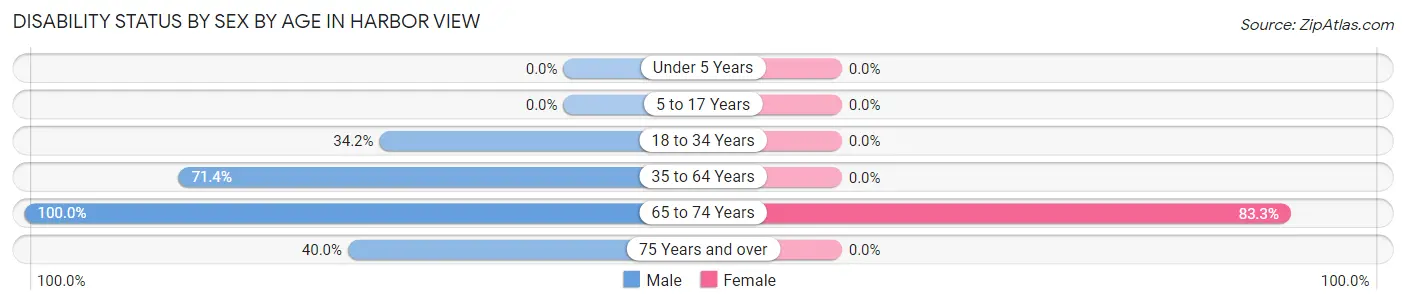
| Age Bracket | Male | Female |
| Under 5 Years | 0 (0.0%) | 0 (0.0%) |
| 5 to 17 Years | 0 (0.0%) | 0 (0.0%) |
| 18 to 34 Years | 14 (34.2%) | 0 (0.0%) |
| 35 to 64 Years | 15 (71.4%) | 0 (0.0%) |
| 65 to 74 Years | 1 (100.0%) | 5 (83.3%) |
| 75 Years and over | 2 (40.0%) | 0 (0.0%) |
Disability Class by Sex by Age in Harbor View
Disability Class: Hearing Difficulty
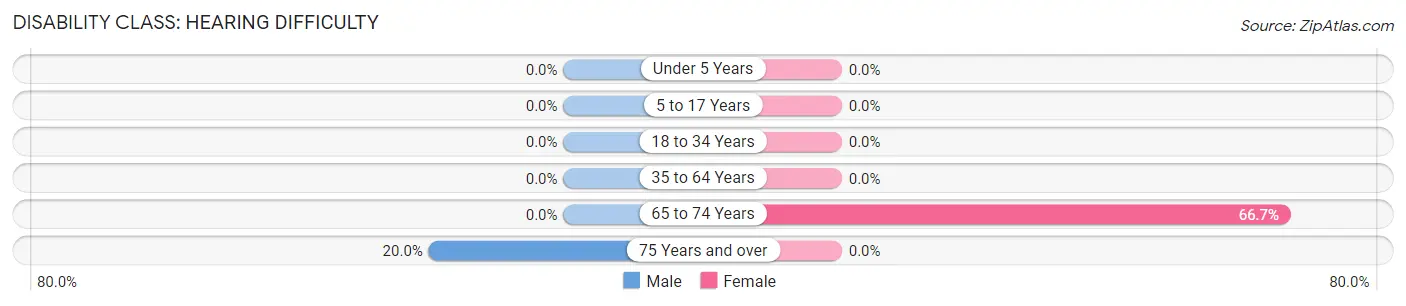
| Age Bracket | Male | Female |
| Under 5 Years | 0 (0.0%) | 0 (0.0%) |
| 5 to 17 Years | 0 (0.0%) | 0 (0.0%) |
| 18 to 34 Years | 0 (0.0%) | 0 (0.0%) |
| 35 to 64 Years | 0 (0.0%) | 0 (0.0%) |
| 65 to 74 Years | 0 (0.0%) | 4 (66.7%) |
| 75 Years and over | 1 (20.0%) | 0 (0.0%) |
Disability Class: Vision Difficulty
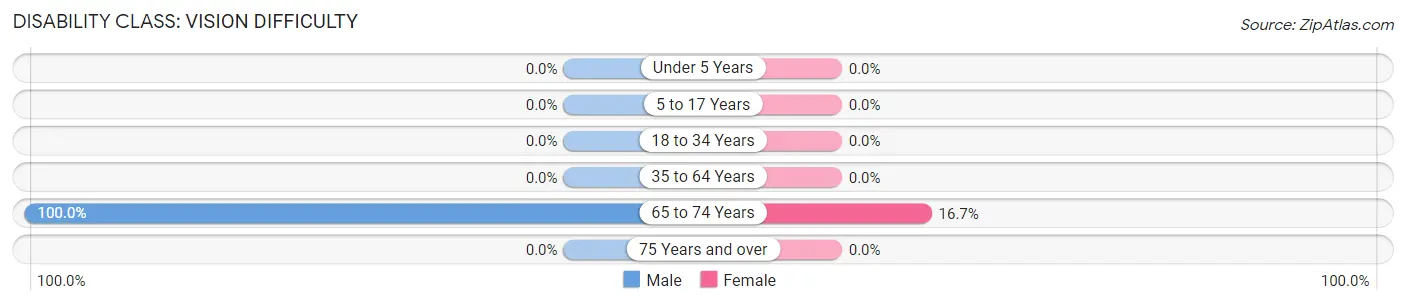
| Age Bracket | Male | Female |
| Under 5 Years | 0 (0.0%) | 0 (0.0%) |
| 5 to 17 Years | 0 (0.0%) | 0 (0.0%) |
| 18 to 34 Years | 0 (0.0%) | 0 (0.0%) |
| 35 to 64 Years | 0 (0.0%) | 0 (0.0%) |
| 65 to 74 Years | 1 (100.0%) | 1 (16.7%) |
| 75 Years and over | 0 (0.0%) | 0 (0.0%) |
Disability Class: Cognitive Difficulty
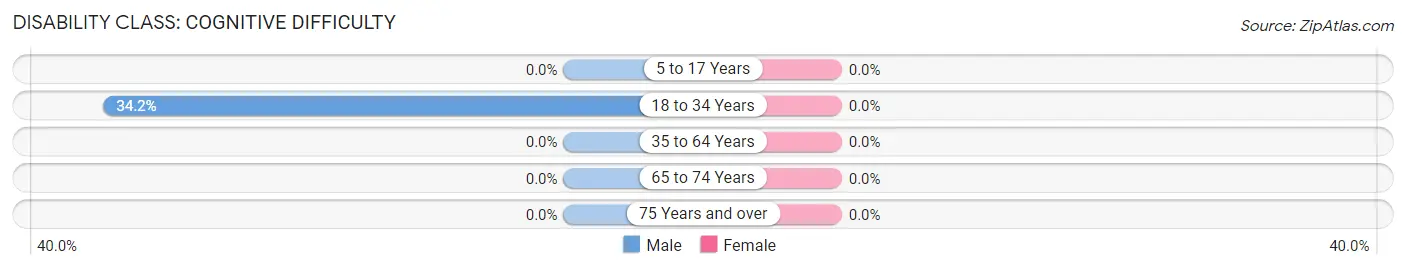
| Age Bracket | Male | Female |
| 5 to 17 Years | 0 (0.0%) | 0 (0.0%) |
| 18 to 34 Years | 14 (34.2%) | 0 (0.0%) |
| 35 to 64 Years | 0 (0.0%) | 0 (0.0%) |
| 65 to 74 Years | 0 (0.0%) | 0 (0.0%) |
| 75 Years and over | 0 (0.0%) | 0 (0.0%) |
Disability Class: Ambulatory Difficulty
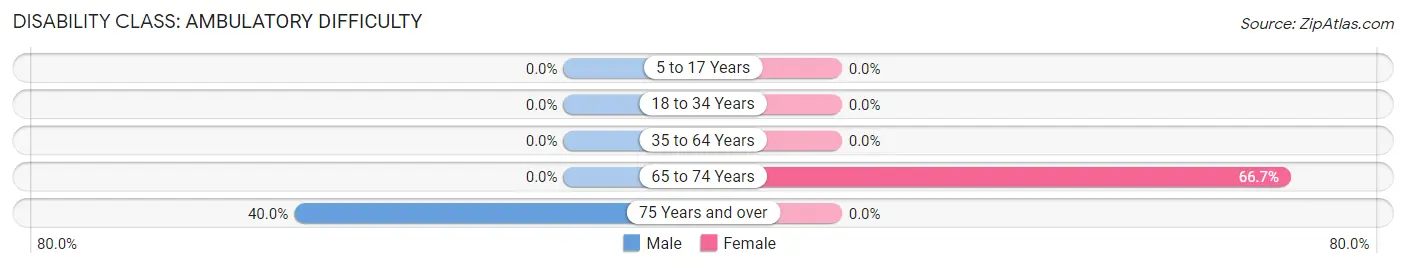
| Age Bracket | Male | Female |
| 5 to 17 Years | 0 (0.0%) | 0 (0.0%) |
| 18 to 34 Years | 0 (0.0%) | 0 (0.0%) |
| 35 to 64 Years | 0 (0.0%) | 0 (0.0%) |
| 65 to 74 Years | 0 (0.0%) | 4 (66.7%) |
| 75 Years and over | 2 (40.0%) | 0 (0.0%) |
Disability Class: Self-Care Difficulty
| Age Bracket | Male | Female |
| 5 to 17 Years | 0 (0.0%) | 0 (0.0%) |
| 18 to 34 Years | 0 (0.0%) | 0 (0.0%) |
| 35 to 64 Years | 0 (0.0%) | 0 (0.0%) |
| 65 to 74 Years | 0 (0.0%) | 0 (0.0%) |
| 75 Years and over | 0 (0.0%) | 0 (0.0%) |
Technology Access in Harbor View
Computing Device Access in Harbor View
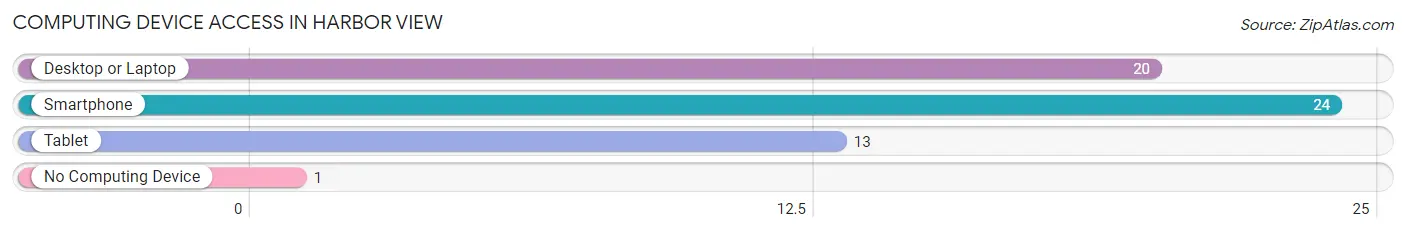
| Device Type | # Households | % Households |
| Desktop or Laptop | 20 | 80.0% |
| Smartphone | 24 | 96.0% |
| Tablet | 13 | 52.0% |
| No Computing Device | 1 | 4.0% |
| Total | 25 | 100.0% |
Internet Access in Harbor View
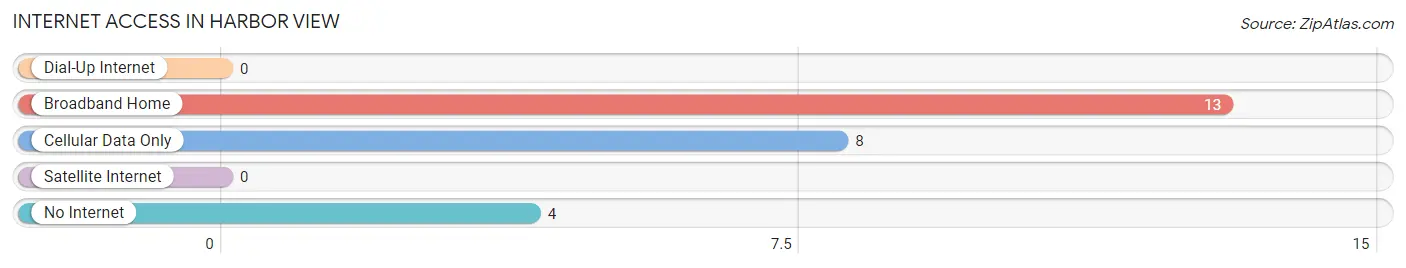
| Internet Type | # Households | % Households |
| Dial-Up Internet | 0 | 0.0% |
| Broadband Home | 13 | 52.0% |
| Cellular Data Only | 8 | 32.0% |
| Satellite Internet | 0 | 0.0% |
| No Internet | 4 | 16.0% |
| Total | 25 | 100.0% |
Harbor View Summary
Harbor View is a small village located in Cuyahoga County, Ohio. It is situated on the south shore of Lake Erie, just east of Cleveland. The village has a population of approximately 1,500 people and covers an area of 0.7 square miles.
History
Harbor View was founded in 1837 by a group of settlers from Connecticut. The village was originally known as “Harbor View” because of its location on the lake. The settlers built a small dock and began to fish and trade with the local Native American tribes. In 1845, the village was officially incorporated as a village.
In the late 19th century, Harbor View began to grow as a resort town. The village was known for its beautiful beaches and its proximity to Cleveland. Many wealthy Clevelanders built summer homes in the village. The village also became a popular destination for boaters and fishermen.
In the early 20th century, Harbor View began to decline as a resort town. The Great Depression and World War II caused many of the wealthy Clevelanders to leave the village. The village also suffered from a lack of investment and development.
In the late 20th century, Harbor View began to experience a resurgence. The village was revitalized by the construction of a new marina and the development of a new residential area. The village also began to attract new businesses and residents.
Geography
Harbor View is located on the south shore of Lake Erie, just east of Cleveland. The village is situated on a small peninsula, which is surrounded by the lake on three sides. The village is bordered by the cities of Cleveland and Euclid to the west and south, respectively.
The village is located in a flat, low-lying area. The terrain is mostly flat, with some rolling hills. The village is located in a temperate climate, with hot summers and cold winters.
Economy
The economy of Harbor View is largely based on tourism and recreation. The village is home to a number of marinas, which attract boaters and fishermen from all over the region. The village also has a number of restaurants, bars, and shops, which cater to tourists and locals alike.
The village also has a number of small businesses, including a grocery store, a hardware store, and a pharmacy. The village also has a number of professional services, such as lawyers, accountants, and doctors.
Demographics
As of the 2010 census, the population of Harbor View was 1,500. The village is predominantly white, with a small African American population. The median household income is $45,000, and the median home value is $150,000.
Conclusion
Harbor View is a small village located on the south shore of Lake Erie, just east of Cleveland. The village has a population of approximately 1,500 people and covers an area of 0.7 square miles. The village was founded in 1837 and has a long history of tourism and recreation. The economy of Harbor View is largely based on tourism and recreation, and the village is home to a number of marinas, restaurants, bars, and shops. The village is predominantly white, with a small African American population. The median household income is $45,000, and the median home value is $150,000.
Common Questions
What is the Total Population of Harbor View?
Total Population of Harbor View is 124.
What is the Total Male Population of Harbor View?
Total Male Population of Harbor View is 81.
What is the Total Female Population of Harbor View?
Total Female Population of Harbor View is 43.
What is the Ratio of Males per 100 Females in Harbor View?
There are 188.37 Males per 100 Females in Harbor View.
What is the Ratio of Females per 100 Males in Harbor View?
There are 53.09 Females per 100 Males in Harbor View.
What is the Median Population Age in Harbor View?
Median Population Age in Harbor View is 26.5 Years.
What is the Average Family Size in Harbor View
Average Family Size in Harbor View is 5.3 People.
What is the Average Household Size in Harbor View
Average Household Size in Harbor View is 5.0 People.
What is Per Capita Income in Harbor View?
Per Capita income in Harbor View is $16,776.
What is the Median Family Income in Harbor View?
Median Family Income in Harbor View is $58,250.
What is the Median Household income in Harbor View?
Median Household Income in Harbor View is $67,083.
What is Inequality or Gini Index in Harbor View?
Inequality or Gini Index in Harbor View is 0.32.
How Large is the Labor Force in Harbor View?
There are 58 People in the Labor Forcein in Harbor View.
What is the Percentage of People in the Labor Force in Harbor View?
54.7% of People are in the Labor Force in Harbor View.