Holiday Valley, OH
Holiday Valley Map
Holiday Valley Overview
1,515
TOTAL POPULATION
689
MALE POPULATION
826
FEMALE POPULATION
83.41
MALES / 100 FEMALES
119.88
FEMALES / 100 MALES
56.2
MEDIAN AGE
3.0
AVG FAMILY SIZE
2.3
AVG HOUSEHOLD SIZE
$36,260
PER CAPITA INCOME
$96,063
AVG FAMILY INCOME
$82,891
AVG HOUSEHOLD INCOME
14.6%
WAGE / INCOME GAP [ % ]
85.4¢/ $1
WAGE / INCOME GAP [ $ ]
0.29
INEQUALITY / GINI INDEX
699
LABOR FORCE [ PEOPLE ]
51.9%
PERCENT IN LABOR FORCE
4.9%
UNEMPLOYMENT RATE
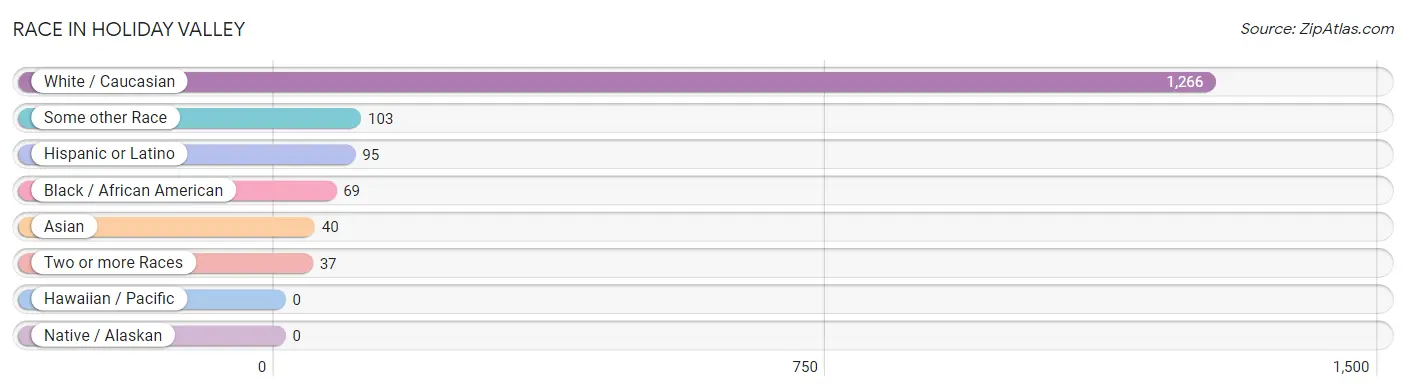
Race in Holiday Valley
The most populous races in Holiday Valley are White / Caucasian (1,266 | 83.6%), Some other Race (103 | 6.8%), and Hispanic or Latino (95 | 6.3%).
| Race | # Population | % Population |
| Asian | 40 | 2.6% |
| Black / African American | 69 | 4.5% |
| Hawaiian / Pacific | 0 | 0.0% |
| Hispanic or Latino | 95 | 6.3% |
| Native / Alaskan | 0 | 0.0% |
| White / Caucasian | 1,266 | 83.6% |
| Two or more Races | 37 | 2.4% |
| Some other Race | 103 | 6.8% |
| Total | 1,515 | 100.0% |
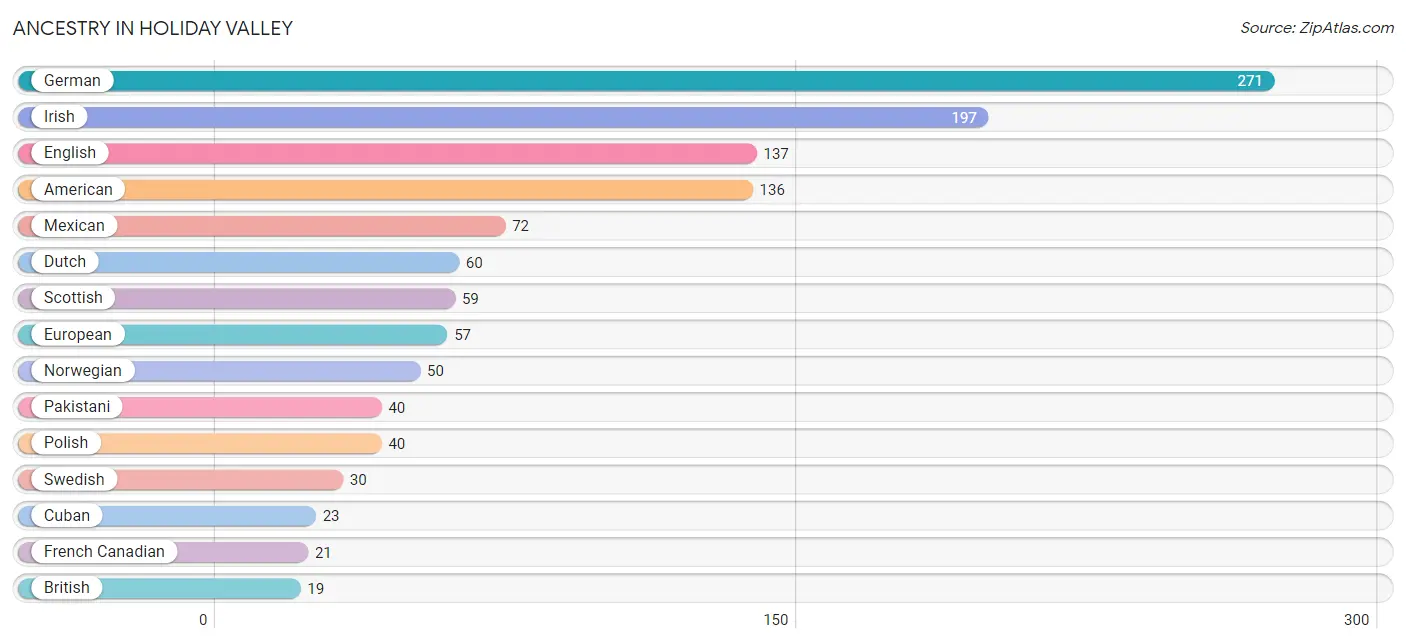
Ancestry in Holiday Valley
The most populous ancestries reported in Holiday Valley are German (271 | 17.9%), Irish (197 | 13.0%), English (137 | 9.0%), American (136 | 9.0%), and Mexican (72 | 4.8%), together accounting for 53.7% of all Holiday Valley residents.
| Ancestry | # Population | % Population |
| American | 136 | 9.0% |
| Bhutanese | 8 | 0.5% |
| British | 19 | 1.3% |
| Croatian | 9 | 0.6% |
| Cuban | 23 | 1.5% |
| Dutch | 60 | 4.0% |
| English | 137 | 9.0% |
| European | 57 | 3.8% |
| French Canadian | 21 | 1.4% |
| German | 271 | 17.9% |
| Irish | 197 | 13.0% |
| Italian | 7 | 0.5% |
| Mexican | 72 | 4.8% |
| Northern European | 8 | 0.5% |
| Norwegian | 50 | 3.3% |
| Pakistani | 40 | 2.6% |
| Polish | 40 | 2.6% |
| Scottish | 59 | 3.9% |
| Swedish | 30 | 2.0% | View All 19 Rows |
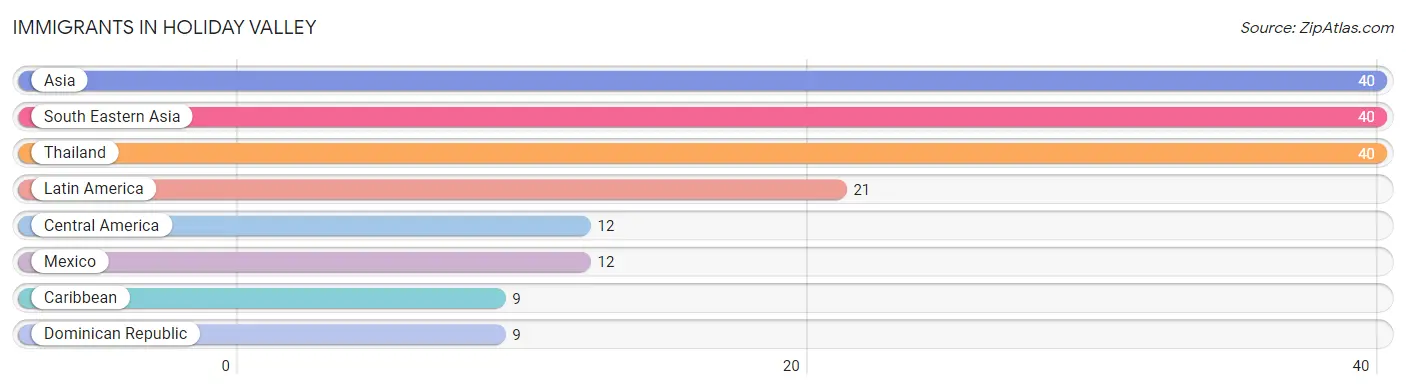
Immigrants in Holiday Valley
The most numerous immigrant groups reported in Holiday Valley came from Asia (40 | 2.6%), South Eastern Asia (40 | 2.6%), Thailand (40 | 2.6%), Latin America (21 | 1.4%), and Central America (12 | 0.8%), together accounting for 10.1% of all Holiday Valley residents.
| Immigration Origin | # Population | % Population |
| Asia | 40 | 2.6% |
| Caribbean | 9 | 0.6% |
| Central America | 12 | 0.8% |
| Dominican Republic | 9 | 0.6% |
| Latin America | 21 | 1.4% |
| Mexico | 12 | 0.8% |
| South Eastern Asia | 40 | 2.6% |
| Thailand | 40 | 2.6% | View All 8 Rows |
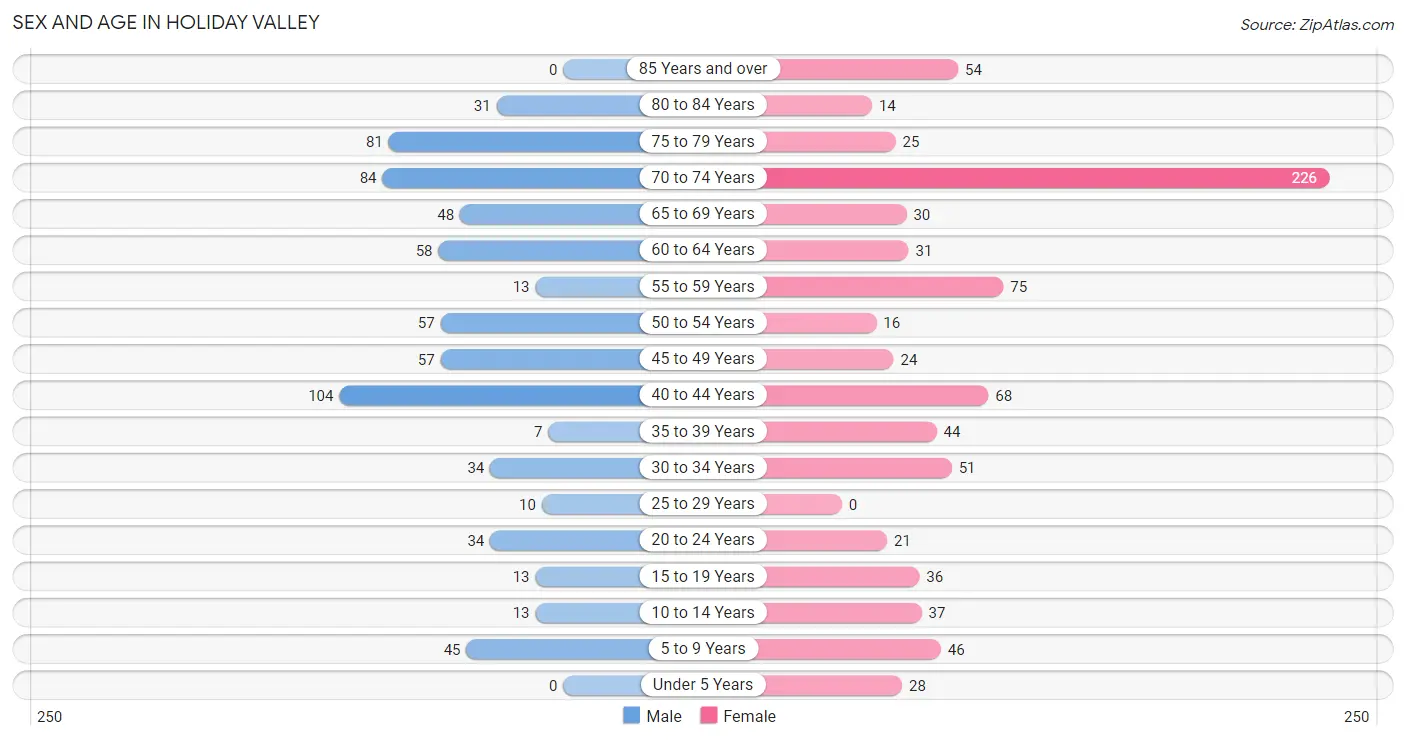
Sex and Age in Holiday Valley
Sex and Age in Holiday Valley
The most populous age groups in Holiday Valley are 40 to 44 Years (104 | 15.1%) for men and 70 to 74 Years (226 | 27.4%) for women.
| Age Bracket | Male | Female |
| Under 5 Years | 0 (0.0%) | 28 (3.4%) |
| 5 to 9 Years | 45 (6.5%) | 46 (5.6%) |
| 10 to 14 Years | 13 (1.9%) | 37 (4.5%) |
| 15 to 19 Years | 13 (1.9%) | 36 (4.4%) |
| 20 to 24 Years | 34 (4.9%) | 21 (2.5%) |
| 25 to 29 Years | 10 (1.5%) | 0 (0.0%) |
| 30 to 34 Years | 34 (4.9%) | 51 (6.2%) |
| 35 to 39 Years | 7 (1.0%) | 44 (5.3%) |
| 40 to 44 Years | 104 (15.1%) | 68 (8.2%) |
| 45 to 49 Years | 57 (8.3%) | 24 (2.9%) |
| 50 to 54 Years | 57 (8.3%) | 16 (1.9%) |
| 55 to 59 Years | 13 (1.9%) | 75 (9.1%) |
| 60 to 64 Years | 58 (8.4%) | 31 (3.7%) |
| 65 to 69 Years | 48 (7.0%) | 30 (3.6%) |
| 70 to 74 Years | 84 (12.2%) | 226 (27.4%) |
| 75 to 79 Years | 81 (11.8%) | 25 (3.0%) |
| 80 to 84 Years | 31 (4.5%) | 14 (1.7%) |
| 85 Years and over | 0 (0.0%) | 54 (6.5%) |
| Total | 689 (100.0%) | 826 (100.0%) |
Families and Households in Holiday Valley
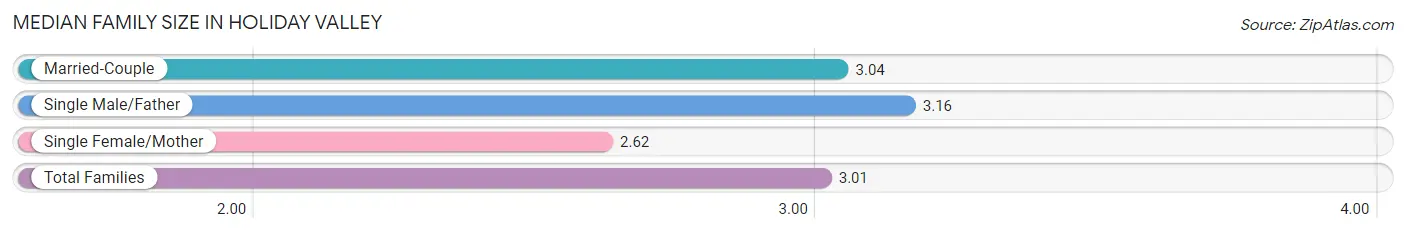
Median Family Size in Holiday Valley
The median family size in Holiday Valley is 3.01 persons per family, with single male/father families (31 | 8.1%) accounting for the largest median family size of 3.16 persons per family. On the other hand, single female/mother families (39 | 10.2%) represent the smallest median family size with 2.62 persons per family.
| Family Type | # Families | Family Size |
| Married-Couple | 311 (81.6%) | 3.04 |
| Single Male/Father | 31 (8.1%) | 3.16 |
| Single Female/Mother | 39 (10.2%) | 2.62 |
| Total Families | 381 (100.0%) | 3.01 |
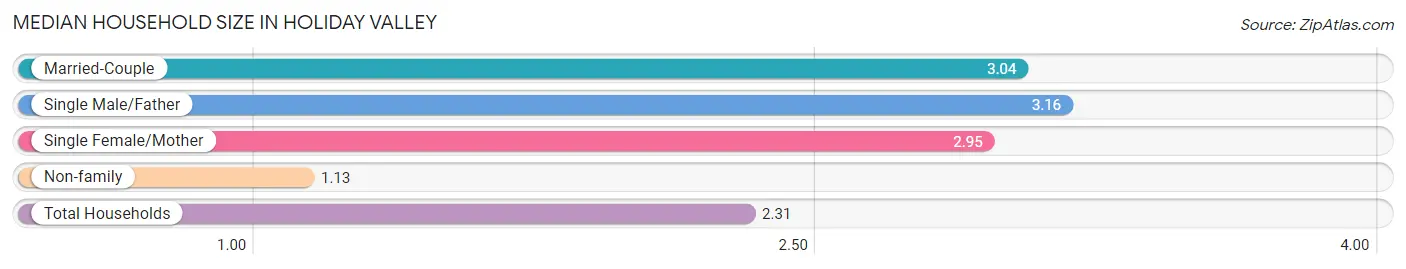
Median Household Size in Holiday Valley
The median household size in Holiday Valley is 2.31 persons per household, with single male/father households (31 | 5.0%) accounting for the largest median household size of 3.16 persons per household. non-family households (236 | 38.3%) represent the smallest median household size with 1.13 persons per household.
| Household Type | # Households | Household Size |
| Married-Couple | 311 (50.4%) | 3.04 |
| Single Male/Father | 31 (5.0%) | 3.16 |
| Single Female/Mother | 39 (6.3%) | 2.95 |
| Non-family | 236 (38.3%) | 1.13 |
| Total Households | 617 (100.0%) | 2.31 |
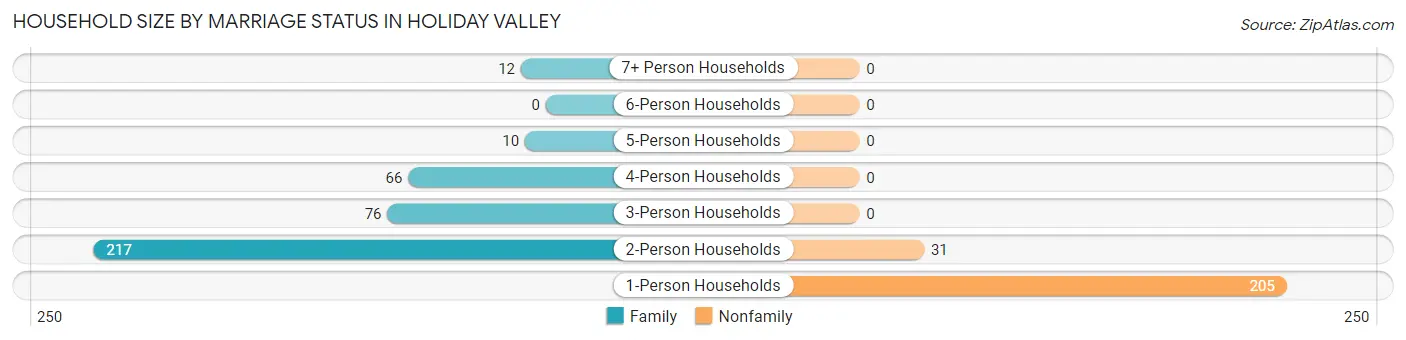
Household Size by Marriage Status in Holiday Valley
Out of a total of 617 households in Holiday Valley, 381 (61.8%) are family households, while 236 (38.3%) are nonfamily households. The most numerous type of family households are 2-person households, comprising 217, and the most common type of nonfamily households are 1-person households, comprising 205.
| Household Size | Family Households | Nonfamily Households |
| 1-Person Households | - | 205 (33.2%) |
| 2-Person Households | 217 (35.2%) | 31 (5.0%) |
| 3-Person Households | 76 (12.3%) | 0 (0.0%) |
| 4-Person Households | 66 (10.7%) | 0 (0.0%) |
| 5-Person Households | 10 (1.6%) | 0 (0.0%) |
| 6-Person Households | 0 (0.0%) | 0 (0.0%) |
| 7+ Person Households | 12 (1.9%) | 0 (0.0%) |
| Total | 381 (61.8%) | 236 (38.3%) |
Female Fertility in Holiday Valley
Fertility by Age in Holiday Valley
Average fertility rate in Holiday Valley is 33.0 births per 1,000 women. Women in the age bracket of 35 to 50 years have the highest fertility rate with 59.0 births per 1,000 women. Women in the age bracket of 35 to 50 years acount for 100.0% of all women with births.
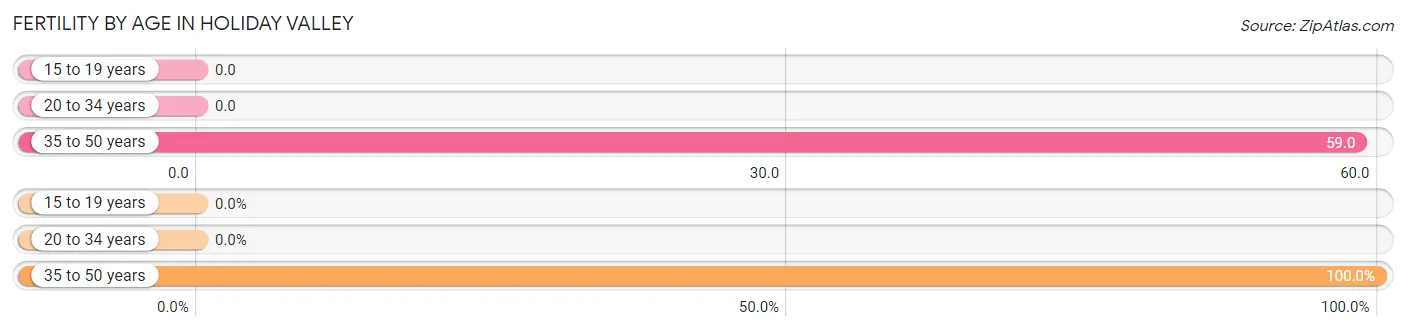
| Age Bracket | Women with Births | Births / 1,000 Women |
| 15 to 19 years | 0 (0.0%) | 0.0 |
| 20 to 34 years | 0 (0.0%) | 0.0 |
| 35 to 50 years | 8 (100.0%) | 59.0 |
| Total | 8 (100.0%) | 33.0 |
Fertility by Age by Marriage Status in Holiday Valley
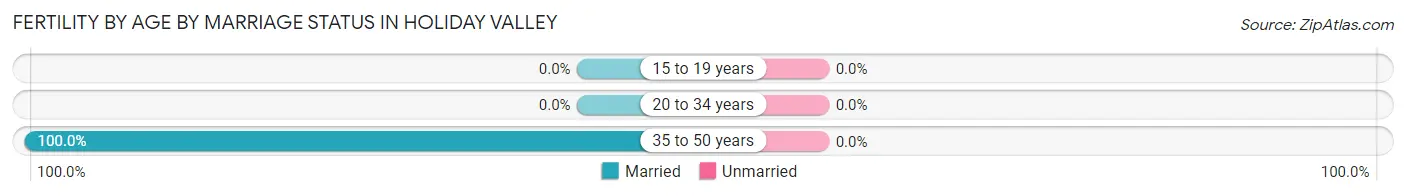
| Age Bracket | Married | Unmarried |
| 15 to 19 years | 0 (0.0%) | 0 (0.0%) |
| 20 to 34 years | 0 (0.0%) | 0 (0.0%) |
| 35 to 50 years | 8 (100.0%) | 0 (0.0%) |
| Total | 8 (100.0%) | 0 (0.0%) |
Fertility by Education in Holiday Valley
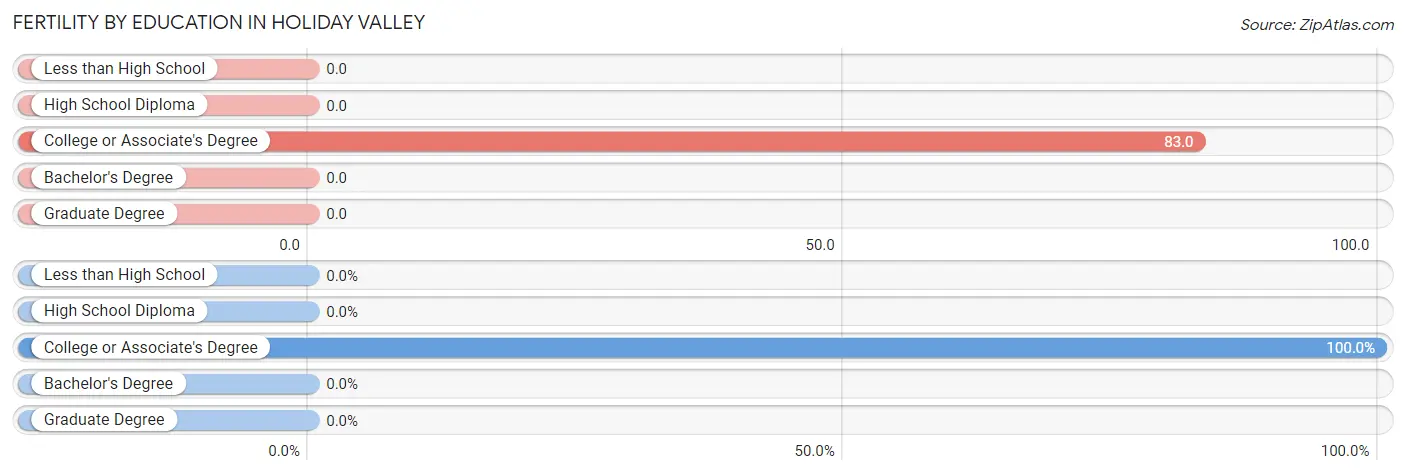
| Educational Attainment | Women with Births | Births / 1,000 Women |
| Less than High School | 0 (0.0%) | 0.0 |
| High School Diploma | 0 (0.0%) | 0.0 |
| College or Associate's Degree | 8 (100.0%) | 83.0 |
| Bachelor's Degree | 0 (0.0%) | 0.0 |
| Graduate Degree | 0 (0.0%) | 0.0 |
| Total | 8 (100.0%) | 33.0 |
Fertility by Education by Marriage Status in Holiday Valley
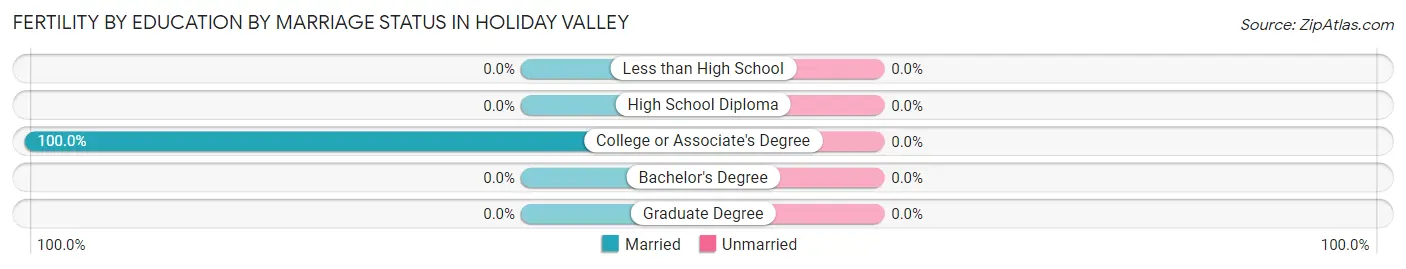
| Educational Attainment | Married | Unmarried |
| Less than High School | 0 (0.0%) | 0 (0.0%) |
| High School Diploma | 0 (0.0%) | 0 (0.0%) |
| College or Associate's Degree | 8 (100.0%) | 0 (0.0%) |
| Bachelor's Degree | 0 (0.0%) | 0 (0.0%) |
| Graduate Degree | 0 (0.0%) | 0 (0.0%) |
| Total | 8 (100.0%) | 0 (0.0%) |
Income in Holiday Valley
Income Overview in Holiday Valley
Per Capita Income in Holiday Valley is $36,260, while median incomes of families and households are $96,063 and $82,891 respectively.
| Characteristic | Number | Measure |
| Per Capita Income | 1,515 | $36,260 |
| Median Family Income | 381 | $96,063 |
| Mean Family Income | 381 | $97,034 |
| Median Household Income | 617 | $82,891 |
| Mean Household Income | 617 | $83,349 |
| Income Deficit | 381 | $0 |
| Wage / Income Gap (%) | 1,515 | 14.60% |
| Wage / Income Gap ($) | 1,515 | 85.40¢ per $1 |
| Gini / Inequality Index | 1,515 | 0.29 |
Earnings by Sex in Holiday Valley
Average Earnings in Holiday Valley are $36,023, $40,385 for men and $34,489 for women, a difference of 14.6%.
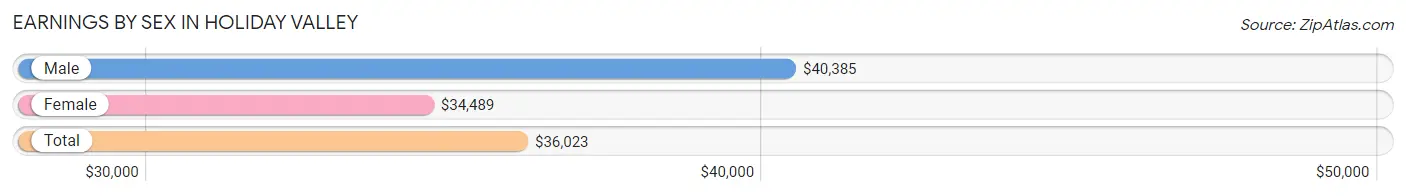
| Sex | Number | Average Earnings |
| Male | 392 (54.2%) | $40,385 |
| Female | 331 (45.8%) | $34,489 |
| Total | 723 (100.0%) | $36,023 |
Earnings by Sex by Income Bracket in Holiday Valley
The most common earnings brackets in Holiday Valley are $15,000 to $17,499 for men (71 | 18.1%) and $2,499 or less for women (56 | 16.9%).
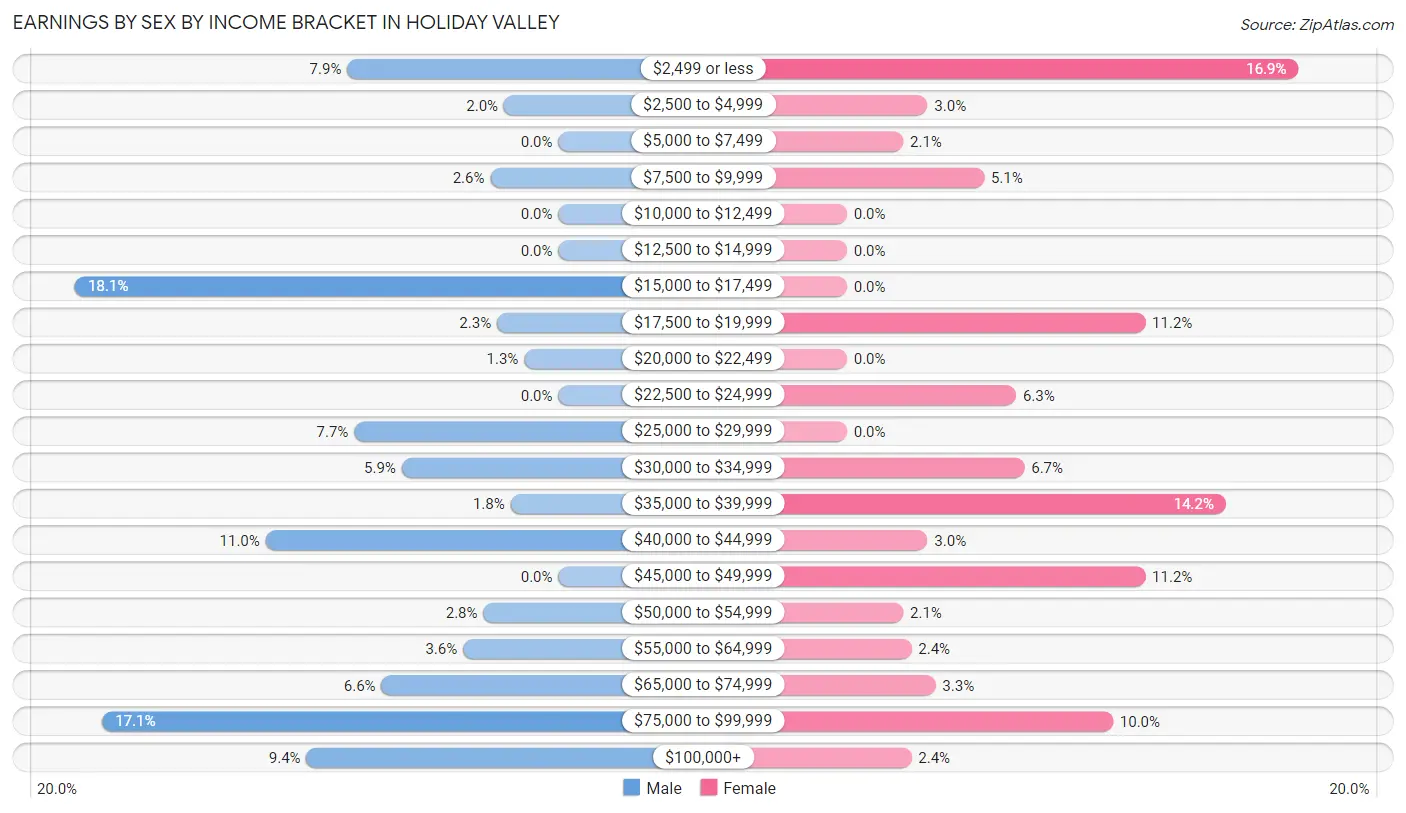
| Income | Male | Female |
| $2,499 or less | 31 (7.9%) | 56 (16.9%) |
| $2,500 to $4,999 | 8 (2.0%) | 10 (3.0%) |
| $5,000 to $7,499 | 0 (0.0%) | 7 (2.1%) |
| $7,500 to $9,999 | 10 (2.5%) | 17 (5.1%) |
| $10,000 to $12,499 | 0 (0.0%) | 0 (0.0%) |
| $12,500 to $14,999 | 0 (0.0%) | 0 (0.0%) |
| $15,000 to $17,499 | 71 (18.1%) | 0 (0.0%) |
| $17,500 to $19,999 | 9 (2.3%) | 37 (11.2%) |
| $20,000 to $22,499 | 5 (1.3%) | 0 (0.0%) |
| $22,500 to $24,999 | 0 (0.0%) | 21 (6.3%) |
| $25,000 to $29,999 | 30 (7.6%) | 0 (0.0%) |
| $30,000 to $34,999 | 23 (5.9%) | 22 (6.7%) |
| $35,000 to $39,999 | 7 (1.8%) | 47 (14.2%) |
| $40,000 to $44,999 | 43 (11.0%) | 10 (3.0%) |
| $45,000 to $49,999 | 0 (0.0%) | 37 (11.2%) |
| $50,000 to $54,999 | 11 (2.8%) | 7 (2.1%) |
| $55,000 to $64,999 | 14 (3.6%) | 8 (2.4%) |
| $65,000 to $74,999 | 26 (6.6%) | 11 (3.3%) |
| $75,000 to $99,999 | 67 (17.1%) | 33 (10.0%) |
| $100,000+ | 37 (9.4%) | 8 (2.4%) |
| Total | 392 (100.0%) | 331 (100.0%) |
Earnings by Sex by Educational Attainment in Holiday Valley
Average earnings in Holiday Valley are $42,308 for men and $37,639 for women, a difference of 11.0%. Men with an educational attainment of bachelor's degree enjoy the highest average annual earnings of $99,118, while those with high school diploma education earn the least with $26,167. Women with an educational attainment of high school diploma earn the most with the average annual earnings of $37,543, while those with high school diploma education have the smallest earnings of $37,543.
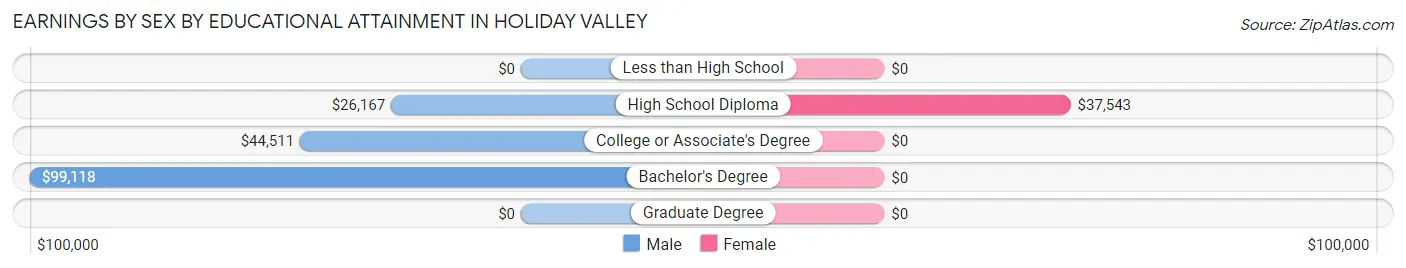
| Educational Attainment | Male Income | Female Income |
| Less than High School | - | - |
| High School Diploma | $26,167 | $37,543 |
| College or Associate's Degree | $44,511 | $0 |
| Bachelor's Degree | $99,118 | $0 |
| Graduate Degree | - | - |
| Total | $42,308 | $37,639 |
Family Income in Holiday Valley
Family Income Brackets in Holiday Valley
According to the Holiday Valley family income data, there are 144 families falling into the $100,000 to $149,999 income range, which is the most common income bracket and makes up 37.8% of all families.
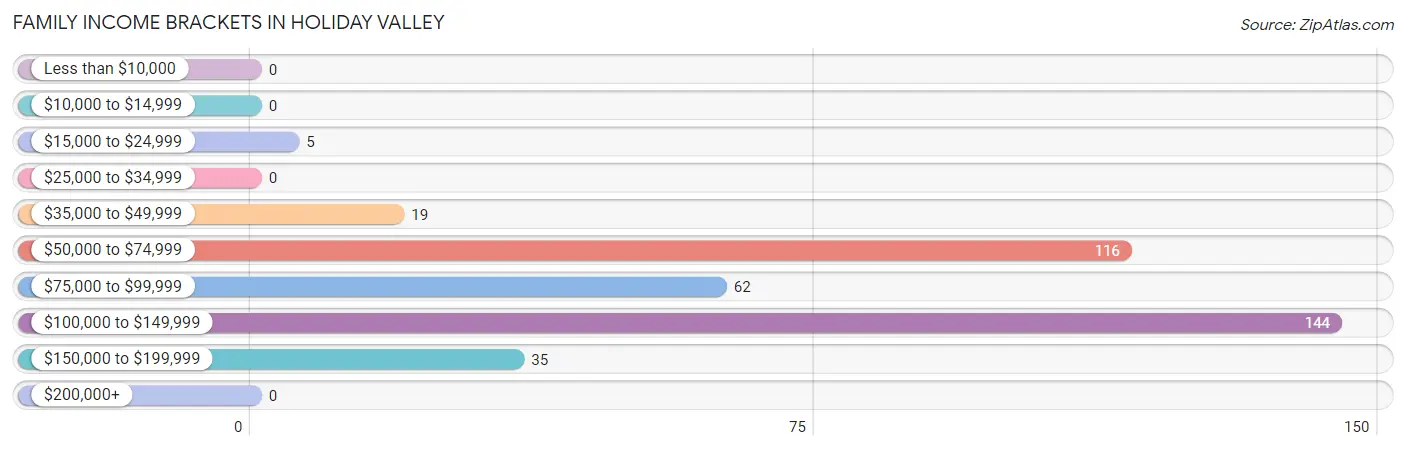
| Income Bracket | # Families | % Families |
| Less than $10,000 | 0 | 0.0% |
| $10,000 to $14,999 | 0 | 0.0% |
| $15,000 to $24,999 | 5 | 1.3% |
| $25,000 to $34,999 | 0 | 0.0% |
| $35,000 to $49,999 | 19 | 5.0% |
| $50,000 to $74,999 | 116 | 30.4% |
| $75,000 to $99,999 | 62 | 16.3% |
| $100,000 to $149,999 | 144 | 37.8% |
| $150,000 to $199,999 | 35 | 9.2% |
| $200,000+ | 0 | 0.0% |
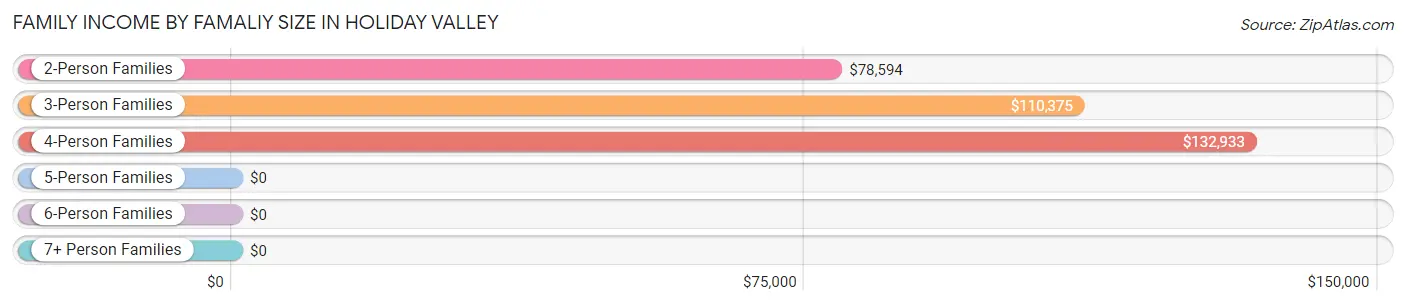
Family Income by Famaliy Size in Holiday Valley
4-person families (57 | 15.0%) account for the highest median family income in Holiday Valley with $132,933 per family, while 2-person families (217 | 57.0%) have the highest median income of $39,297 per family member.
| Income Bracket | # Families | Median Income |
| 2-Person Families | 217 (57.0%) | $78,594 |
| 3-Person Families | 85 (22.3%) | $110,375 |
| 4-Person Families | 57 (15.0%) | $132,933 |
| 5-Person Families | 10 (2.6%) | $0 |
| 6-Person Families | 0 (0.0%) | $0 |
| 7+ Person Families | 12 (3.2%) | $0 |
| Total | 381 (100.0%) | $96,063 |
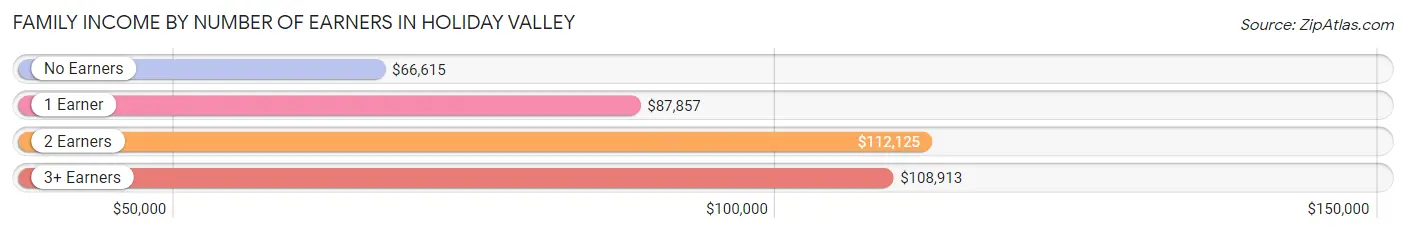
Family Income by Number of Earners in Holiday Valley
The median family income in Holiday Valley is $96,063, with families comprising 2 earners (154) having the highest median family income of $112,125, while families with no earners (107) have the lowest median family income of $66,615, accounting for 40.4% and 28.1% of families, respectively.
| Number of Earners | # Families | Median Income |
| No Earners | 107 (28.1%) | $66,615 |
| 1 Earner | 74 (19.4%) | $87,857 |
| 2 Earners | 154 (40.4%) | $112,125 |
| 3+ Earners | 46 (12.1%) | $108,913 |
| Total | 381 (100.0%) | $96,063 |
Household Income in Holiday Valley
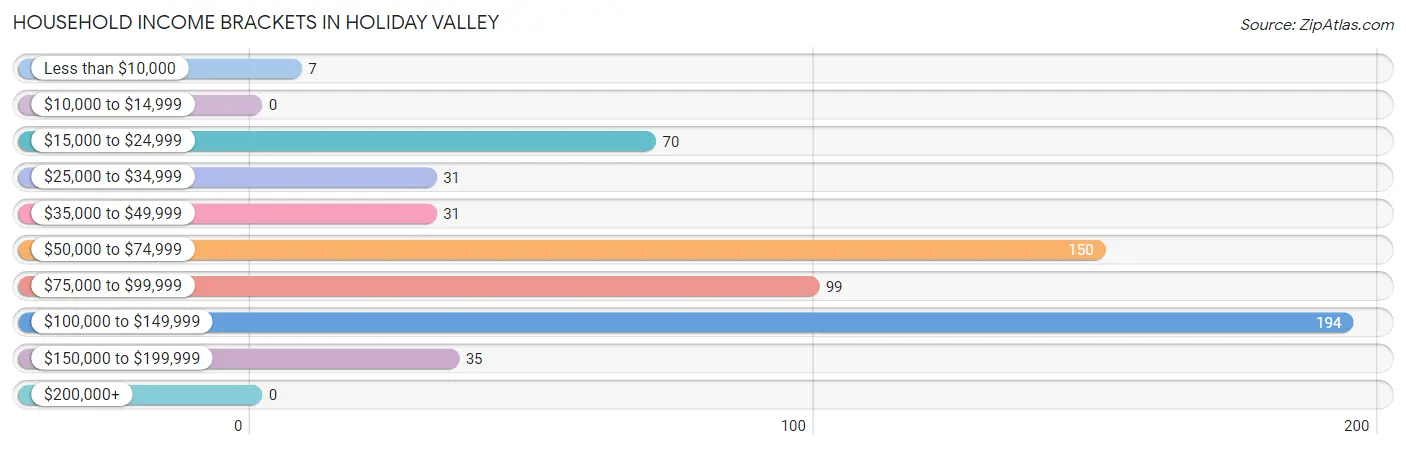
Household Income Brackets in Holiday Valley
With 194 households falling in the category, the $100,000 to $149,999 income range is the most frequent in Holiday Valley, accounting for 31.4% of all households.
| Income Bracket | # Households | % Households |
| Less than $10,000 | 7 | 1.1% |
| $10,000 to $14,999 | 0 | 0.0% |
| $15,000 to $24,999 | 70 | 11.3% |
| $25,000 to $34,999 | 31 | 5.0% |
| $35,000 to $49,999 | 31 | 5.0% |
| $50,000 to $74,999 | 150 | 24.3% |
| $75,000 to $99,999 | 99 | 16.0% |
| $100,000 to $149,999 | 194 | 31.4% |
| $150,000 to $199,999 | 35 | 5.7% |
| $200,000+ | 0 | 0.0% |
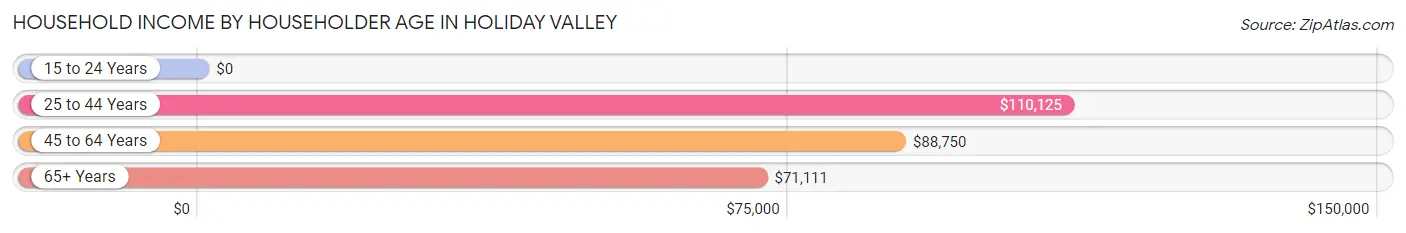
Household Income by Householder Age in Holiday Valley
The median household income in Holiday Valley is $82,891, with the highest median household income of $110,125 found in the 25 to 44 years age bracket for the primary householder. A total of 71 households (11.5%) fall into this category. Meanwhile, the 15 to 24 years age bracket for the primary householder has the lowest median household income of $0, with 11 households (1.8%) in this group.
| Income Bracket | # Households | Median Income |
| 15 to 24 Years | 11 (1.8%) | $0 |
| 25 to 44 Years | 71 (11.5%) | $110,125 |
| 45 to 64 Years | 233 (37.8%) | $88,750 |
| 65+ Years | 302 (48.9%) | $71,111 |
| Total | 617 (100.0%) | $82,891 |
Poverty in Holiday Valley
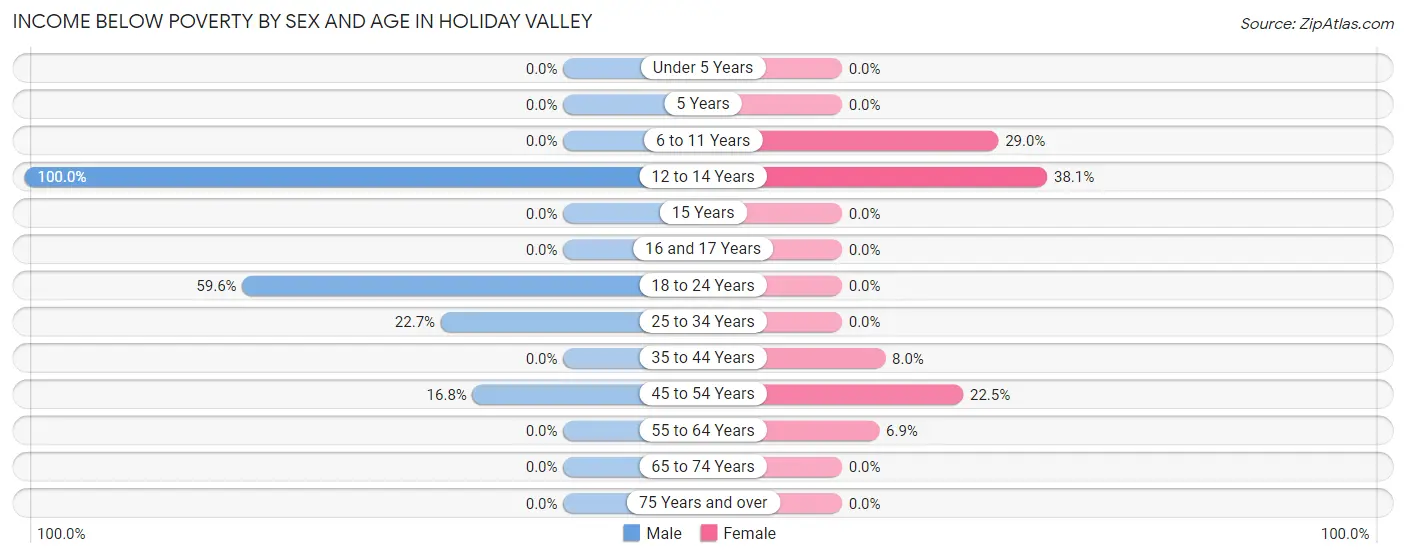
Income Below Poverty by Sex and Age in Holiday Valley
With 10.1% poverty level for males and 6.8% for females among the residents of Holiday Valley, 12 to 14 year old males and 12 to 14 year old females are the most vulnerable to poverty, with 13 males (100.0%) and 8 females (38.1%) in their respective age groups living below the poverty level.
| Age Bracket | Male | Female |
| Under 5 Years | 0 (0.0%) | 0 (0.0%) |
| 5 Years | 0 (0.0%) | 0 (0.0%) |
| 6 to 11 Years | 0 (0.0%) | 18 (29.0%) |
| 12 to 14 Years | 13 (100.0%) | 8 (38.1%) |
| 15 Years | 0 (0.0%) | 0 (0.0%) |
| 16 and 17 Years | 0 (0.0%) | 0 (0.0%) |
| 18 to 24 Years | 28 (59.6%) | 0 (0.0%) |
| 25 to 34 Years | 10 (22.7%) | 0 (0.0%) |
| 35 to 44 Years | 0 (0.0%) | 9 (8.0%) |
| 45 to 54 Years | 17 (16.8%) | 9 (22.5%) |
| 55 to 64 Years | 0 (0.0%) | 7 (6.9%) |
| 65 to 74 Years | 0 (0.0%) | 0 (0.0%) |
| 75 Years and over | 0 (0.0%) | 0 (0.0%) |
| Total | 68 (10.1%) | 51 (6.8%) |
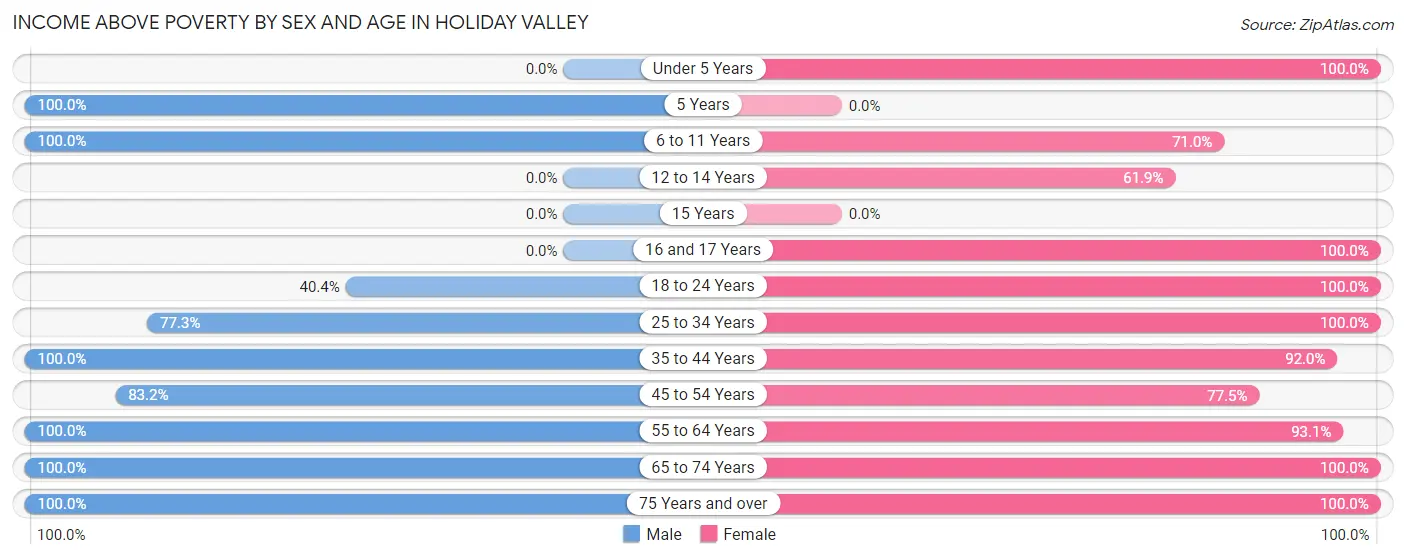
Income Above Poverty by Sex and Age in Holiday Valley
According to the poverty statistics in Holiday Valley, males aged 5 years and females aged under 5 years are the age groups that are most secure financially, with 100.0% of males and 100.0% of females in these age groups living above the poverty line.
| Age Bracket | Male | Female |
| Under 5 Years | 0 (0.0%) | 28 (100.0%) |
| 5 Years | 25 (100.0%) | 0 (0.0%) |
| 6 to 11 Years | 20 (100.0%) | 44 (71.0%) |
| 12 to 14 Years | 0 (0.0%) | 13 (61.9%) |
| 15 Years | 0 (0.0%) | 0 (0.0%) |
| 16 and 17 Years | 0 (0.0%) | 26 (100.0%) |
| 18 to 24 Years | 19 (40.4%) | 31 (100.0%) |
| 25 to 34 Years | 34 (77.3%) | 51 (100.0%) |
| 35 to 44 Years | 111 (100.0%) | 103 (92.0%) |
| 45 to 54 Years | 84 (83.2%) | 31 (77.5%) |
| 55 to 64 Years | 71 (100.0%) | 94 (93.1%) |
| 65 to 74 Years | 132 (100.0%) | 229 (100.0%) |
| 75 Years and over | 107 (100.0%) | 52 (100.0%) |
| Total | 603 (89.9%) | 702 (93.2%) |
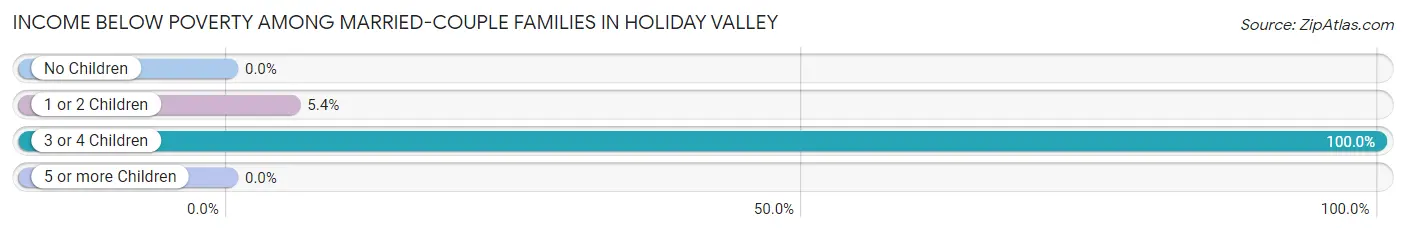
Income Below Poverty Among Married-Couple Families in Holiday Valley
The poverty statistics for married-couple families in Holiday Valley show that 5.5% or 17 of the total 311 families live below the poverty line. Families with 3 or 4 children have the highest poverty rate of 100.0%, comprising of 12 families. On the other hand, families with no children have the lowest poverty rate of 0.0%, which includes 0 families.
| Children | Above Poverty | Below Poverty |
| No Children | 207 (100.0%) | 0 (0.0%) |
| 1 or 2 Children | 87 (94.6%) | 5 (5.4%) |
| 3 or 4 Children | 0 (0.0%) | 12 (100.0%) |
| 5 or more Children | 0 (0.0%) | 0 (0.0%) |
| Total | 294 (94.5%) | 17 (5.5%) |
Income Below Poverty Among Single-Parent Households in Holiday Valley
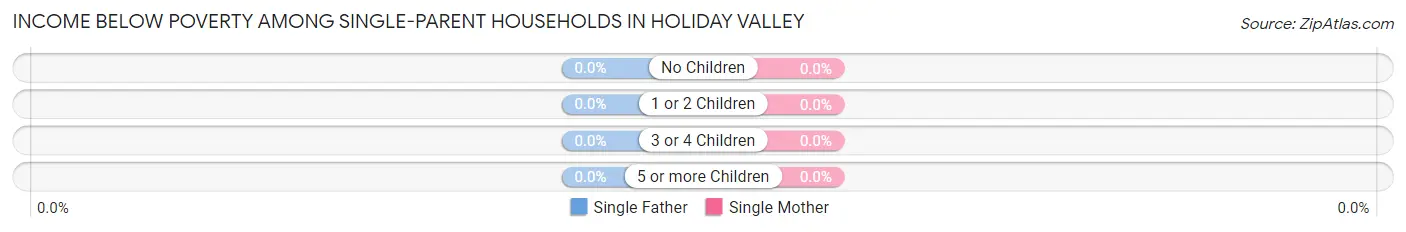
| Children | Single Father | Single Mother |
| No Children | 0 (0.0%) | 0 (0.0%) |
| 1 or 2 Children | 0 (0.0%) | 0 (0.0%) |
| 3 or 4 Children | 0 (0.0%) | 0 (0.0%) |
| 5 or more Children | 0 (0.0%) | 0 (0.0%) |
| Total | 0 (0.0%) | 0 (0.0%) |
Income Below Poverty Among Married-Couple vs Single-Parent Households in Holiday Valley
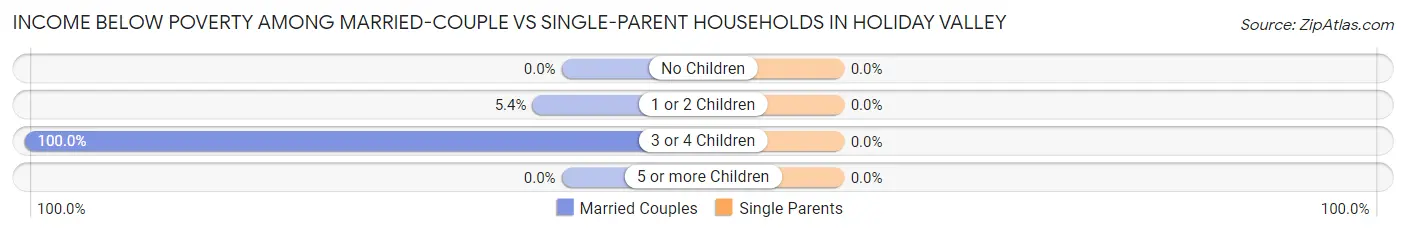
| Children | Married-Couple Families | Single-Parent Households |
| No Children | 0 (0.0%) | 0 (0.0%) |
| 1 or 2 Children | 5 (5.4%) | 0 (0.0%) |
| 3 or 4 Children | 12 (100.0%) | 0 (0.0%) |
| 5 or more Children | 0 (0.0%) | 0 (0.0%) |
| Total | 17 (5.5%) | 0 (0.0%) |
Employment Characteristics in Holiday Valley
Employment by Class of Employer in Holiday Valley
Among the 665 employed individuals in Holiday Valley, private company employees (417 | 62.7%), self-employed (not incorporated) (108 | 16.2%), and not-for-profit organizations (41 | 6.2%) make up the most common classes of employment.
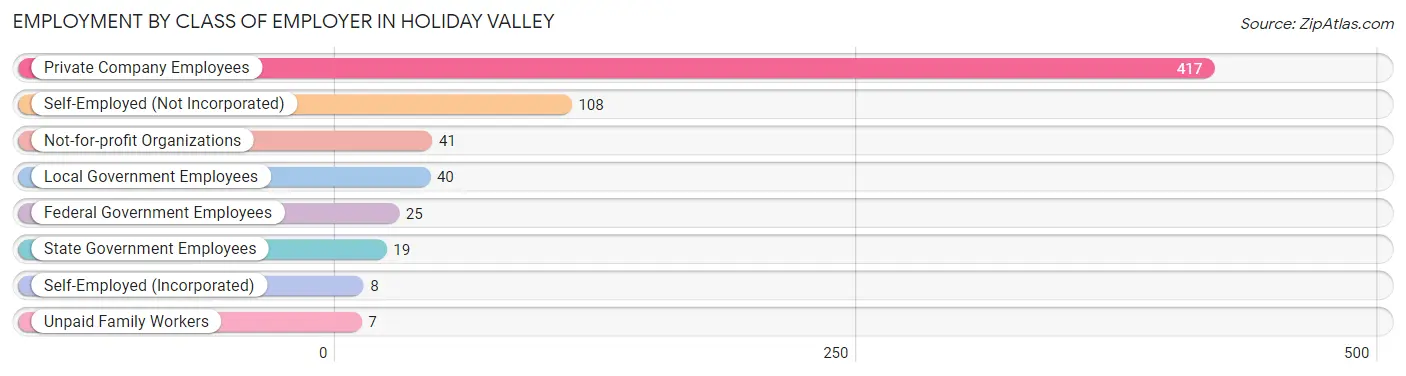
| Employer Class | # Employees | % Employees |
| Private Company Employees | 417 | 62.7% |
| Self-Employed (Incorporated) | 8 | 1.2% |
| Self-Employed (Not Incorporated) | 108 | 16.2% |
| Not-for-profit Organizations | 41 | 6.2% |
| Local Government Employees | 40 | 6.0% |
| State Government Employees | 19 | 2.9% |
| Federal Government Employees | 25 | 3.8% |
| Unpaid Family Workers | 7 | 1.1% |
| Total | 665 | 100.0% |
Employment Status by Age in Holiday Valley
According to the labor force statistics for Holiday Valley, out of the total population over 16 years of age (1,346), 51.9% or 699 individuals are in the labor force, with 4.9% or 34 of them unemployed. The age group with the highest labor force participation rate is 20 to 24 years, with 100.0% or 55 individuals in the labor force. Within the labor force, the 45 to 54 years age range has the highest percentage of unemployed individuals, with 14.6% or 18 of them being unemployed.
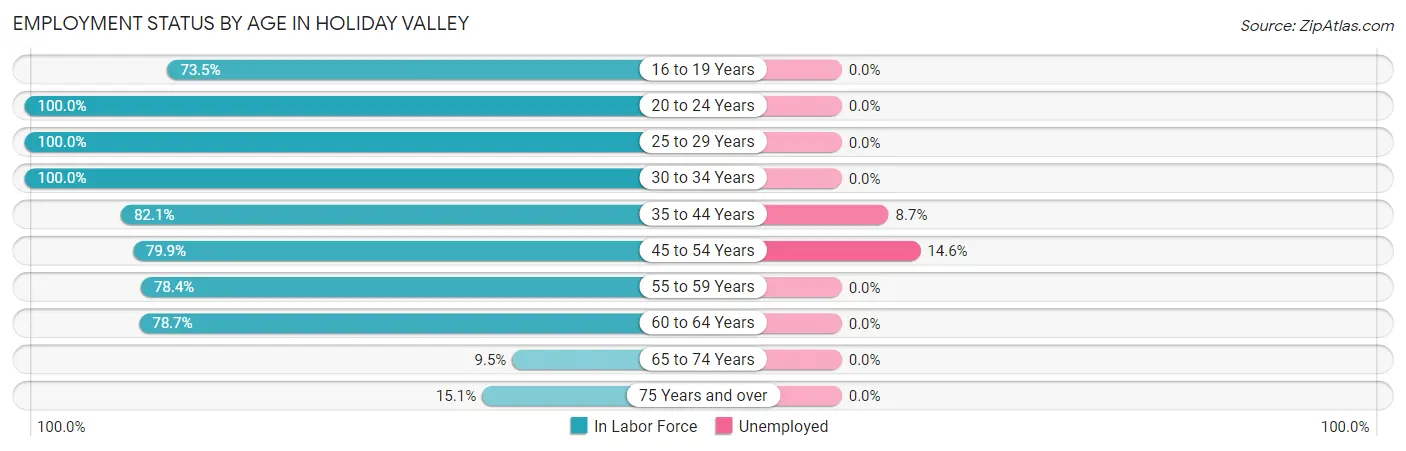
| Age Bracket | In Labor Force | Unemployed |
| 16 to 19 Years | 36 (73.5%) | 0 (0.0%) |
| 20 to 24 Years | 55 (100.0%) | 0 (0.0%) |
| 25 to 29 Years | 10 (100.0%) | 0 (0.0%) |
| 30 to 34 Years | 85 (100.0%) | 0 (0.0%) |
| 35 to 44 Years | 183 (82.1%) | 16 (8.7%) |
| 45 to 54 Years | 123 (79.9%) | 18 (14.6%) |
| 55 to 59 Years | 69 (78.4%) | 0 (0.0%) |
| 60 to 64 Years | 70 (78.7%) | 0 (0.0%) |
| 65 to 74 Years | 37 (9.5%) | 0 (0.0%) |
| 75 Years and over | 31 (15.1%) | 0 (0.0%) |
| Total | 699 (51.9%) | 34 (4.9%) |
Employment Status by Educational Attainment in Holiday Valley
According to labor force statistics for Holiday Valley, 83.2% of individuals (540) out of the total population between 25 and 64 years of age (649) are in the labor force, with 6.4% or 35 of them being unemployed. The group with the highest labor force participation rate are those with the educational attainment of college / associate degree, with 91.5% or 172 individuals in the labor force. Within the labor force, individuals with less than high school education have the highest percentage of unemployment, with 100.0% or 12 of them being unemployed.
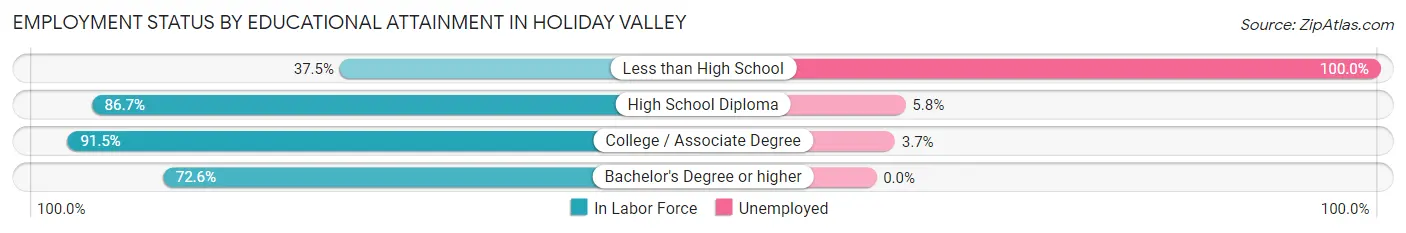
| Educational Attainment | In Labor Force | Unemployed |
| Less than High School | 12 (37.5%) | 32 (100.0%) |
| High School Diploma | 274 (86.7%) | 18 (5.8%) |
| College / Associate Degree | 172 (91.5%) | 7 (3.7%) |
| Bachelor's Degree or higher | 82 (72.6%) | 0 (0.0%) |
| Total | 540 (83.2%) | 42 (6.4%) |
Employment Occupations by Sex in Holiday Valley
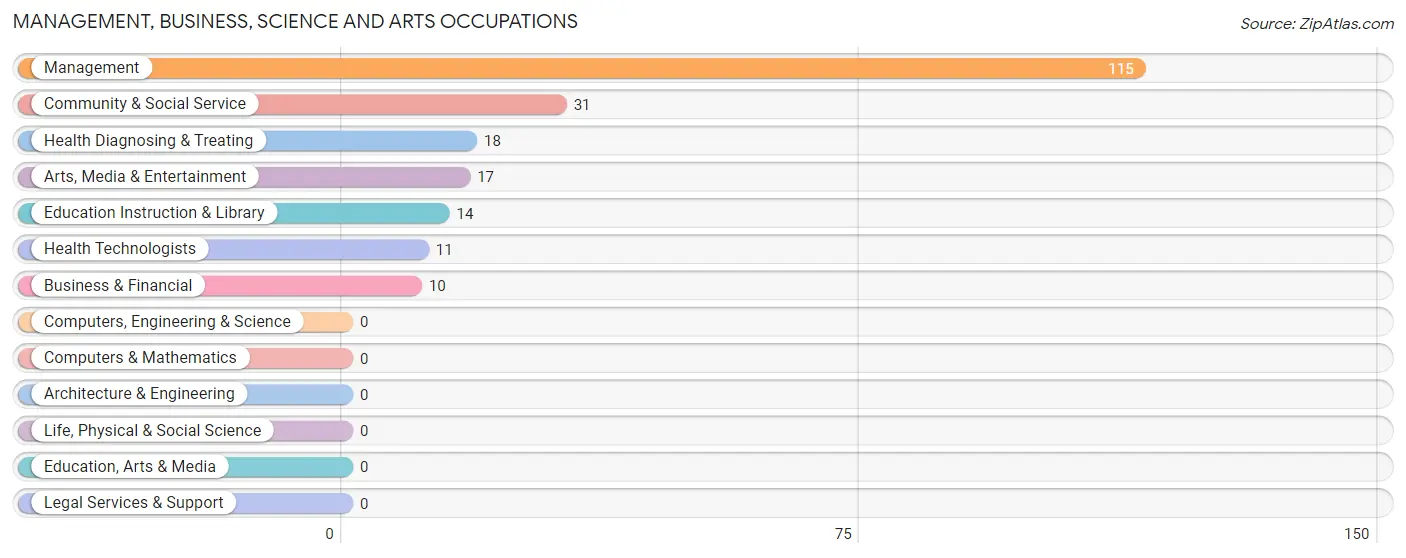
Management, Business, Science and Arts Occupations
The most common Management, Business, Science and Arts occupations in Holiday Valley are Management (115 | 17.6%), Community & Social Service (31 | 4.7%), Health Diagnosing & Treating (18 | 2.8%), Arts, Media & Entertainment (17 | 2.6%), and Education Instruction & Library (14 | 2.1%).
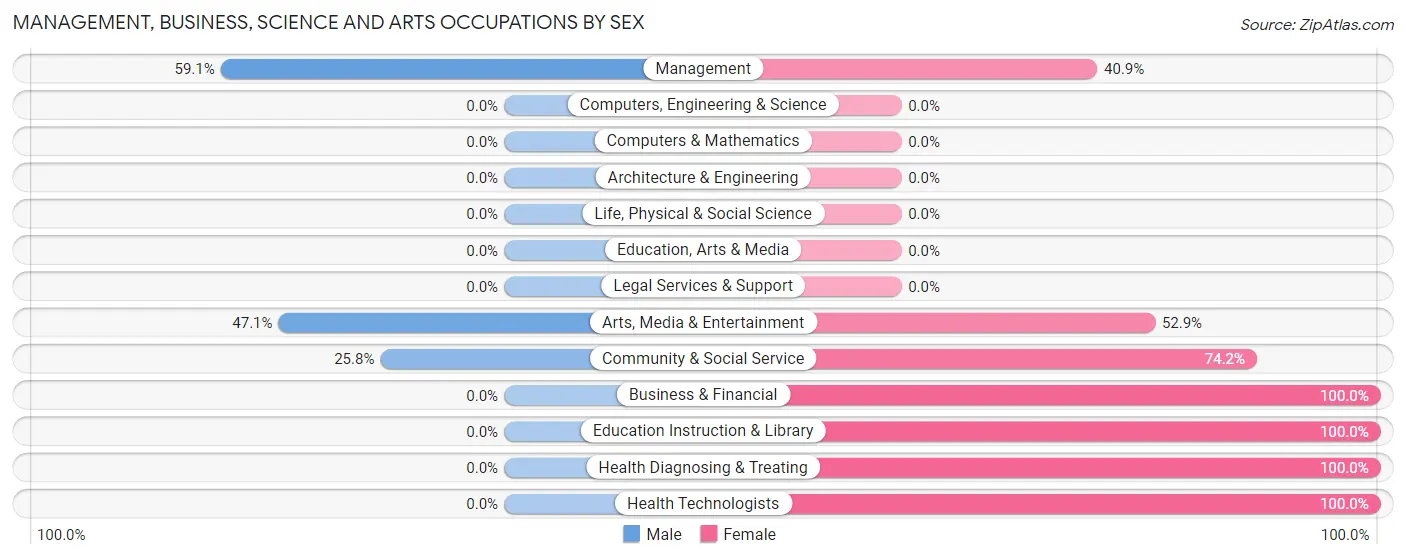
Management, Business, Science and Arts Occupations by Sex
Within the Management, Business, Science and Arts occupations in Holiday Valley, the most male-oriented occupations are Management (59.1%), Arts, Media & Entertainment (47.1%), and Community & Social Service (25.8%), while the most female-oriented occupations are Business & Financial (100.0%), Education Instruction & Library (100.0%), and Health Diagnosing & Treating (100.0%).
| Occupation | Male | Female |
| Management | 68 (59.1%) | 47 (40.9%) |
| Business & Financial | 0 (0.0%) | 10 (100.0%) |
| Computers, Engineering & Science | 0 (0.0%) | 0 (0.0%) |
| Computers & Mathematics | 0 (0.0%) | 0 (0.0%) |
| Architecture & Engineering | 0 (0.0%) | 0 (0.0%) |
| Life, Physical & Social Science | 0 (0.0%) | 0 (0.0%) |
| Community & Social Service | 8 (25.8%) | 23 (74.2%) |
| Education, Arts & Media | 0 (0.0%) | 0 (0.0%) |
| Legal Services & Support | 0 (0.0%) | 0 (0.0%) |
| Education Instruction & Library | 0 (0.0%) | 14 (100.0%) |
| Arts, Media & Entertainment | 8 (47.1%) | 9 (52.9%) |
| Health Diagnosing & Treating | 0 (0.0%) | 18 (100.0%) |
| Health Technologists | 0 (0.0%) | 11 (100.0%) |
| Total (Category) | 76 (43.7%) | 98 (56.3%) |
| Total (Overall) | 350 (53.4%) | 305 (46.6%) |
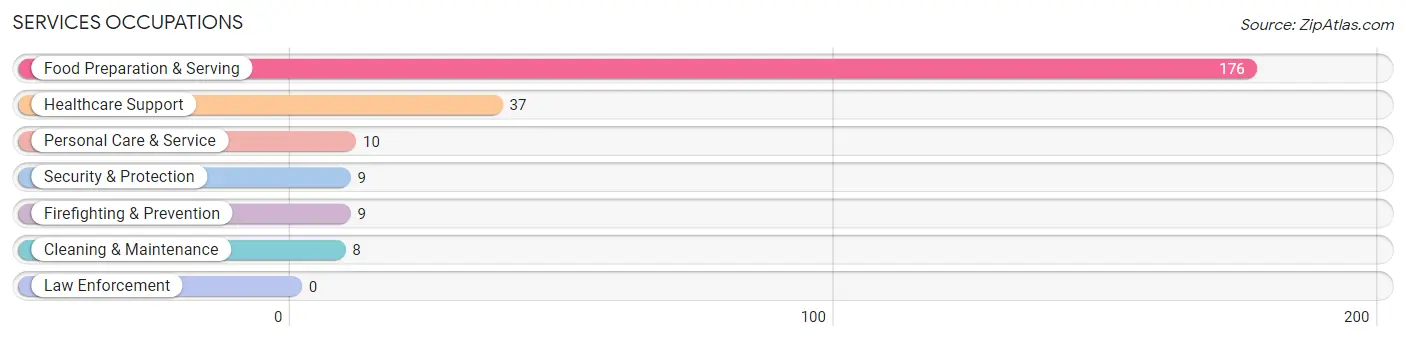
Services Occupations
The most common Services occupations in Holiday Valley are Food Preparation & Serving (176 | 26.9%), Healthcare Support (37 | 5.7%), Personal Care & Service (10 | 1.5%), Security & Protection (9 | 1.4%), and Firefighting & Prevention (9 | 1.4%).
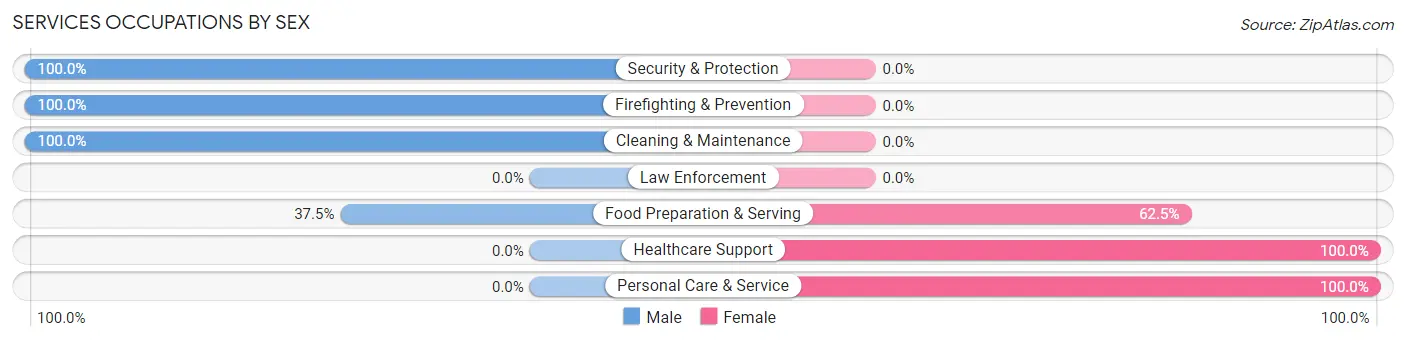
Services Occupations by Sex
Within the Services occupations in Holiday Valley, the most male-oriented occupations are Security & Protection (100.0%), Firefighting & Prevention (100.0%), and Cleaning & Maintenance (100.0%), while the most female-oriented occupations are Healthcare Support (100.0%), Personal Care & Service (100.0%), and Food Preparation & Serving (62.5%).
| Occupation | Male | Female |
| Healthcare Support | 0 (0.0%) | 37 (100.0%) |
| Security & Protection | 9 (100.0%) | 0 (0.0%) |
| Firefighting & Prevention | 9 (100.0%) | 0 (0.0%) |
| Law Enforcement | 0 (0.0%) | 0 (0.0%) |
| Food Preparation & Serving | 66 (37.5%) | 110 (62.5%) |
| Cleaning & Maintenance | 8 (100.0%) | 0 (0.0%) |
| Personal Care & Service | 0 (0.0%) | 10 (100.0%) |
| Total (Category) | 83 (34.6%) | 157 (65.4%) |
| Total (Overall) | 350 (53.4%) | 305 (46.6%) |
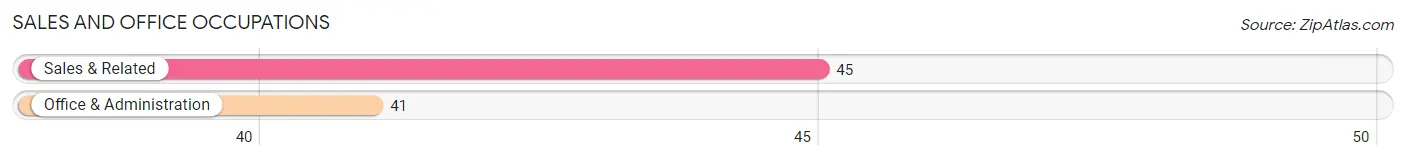
Sales and Office Occupations
The most common Sales and Office occupations in Holiday Valley are Sales & Related (45 | 6.9%), and Office & Administration (41 | 6.3%).
Sales and Office Occupations by Sex
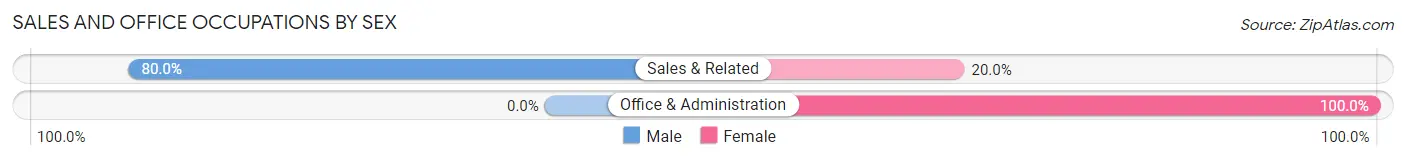
| Occupation | Male | Female |
| Sales & Related | 36 (80.0%) | 9 (20.0%) |
| Office & Administration | 0 (0.0%) | 41 (100.0%) |
| Total (Category) | 36 (41.9%) | 50 (58.1%) |
| Total (Overall) | 350 (53.4%) | 305 (46.6%) |
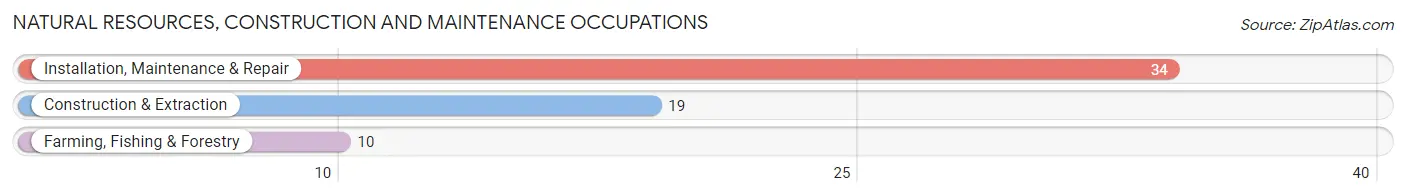
Natural Resources, Construction and Maintenance Occupations
The most common Natural Resources, Construction and Maintenance occupations in Holiday Valley are Installation, Maintenance & Repair (34 | 5.2%), Construction & Extraction (19 | 2.9%), and Farming, Fishing & Forestry (10 | 1.5%).
Natural Resources, Construction and Maintenance Occupations by Sex
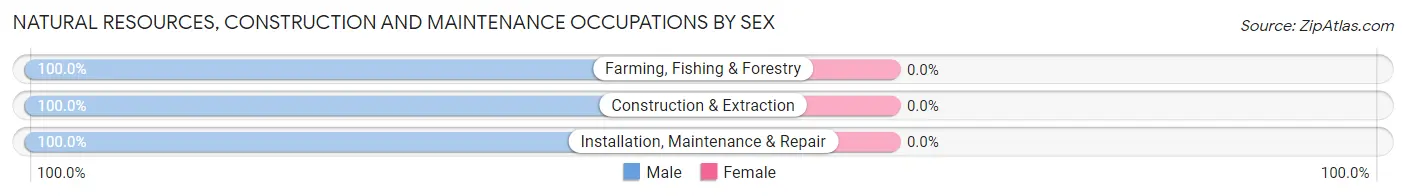
| Occupation | Male | Female |
| Farming, Fishing & Forestry | 10 (100.0%) | 0 (0.0%) |
| Construction & Extraction | 19 (100.0%) | 0 (0.0%) |
| Installation, Maintenance & Repair | 34 (100.0%) | 0 (0.0%) |
| Total (Category) | 63 (100.0%) | 0 (0.0%) |
| Total (Overall) | 350 (53.4%) | 305 (46.6%) |
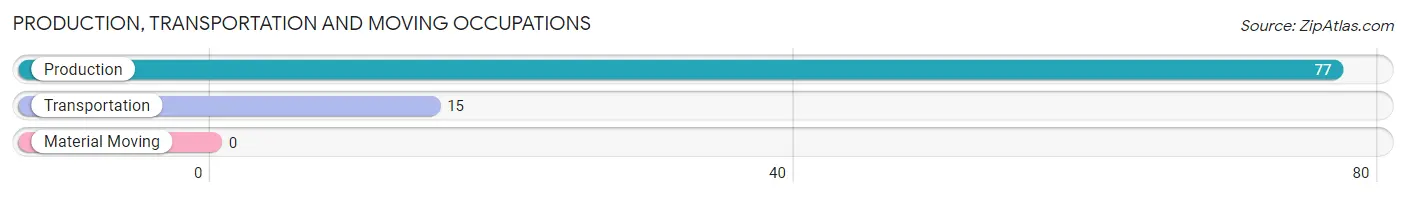
Production, Transportation and Moving Occupations
The most common Production, Transportation and Moving occupations in Holiday Valley are Production (77 | 11.8%), and Transportation (15 | 2.3%).
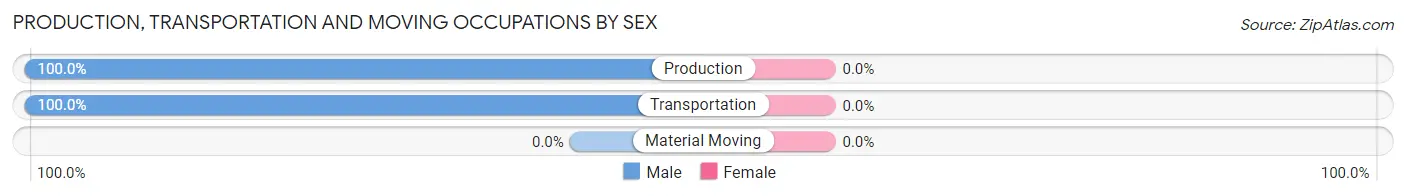
Production, Transportation and Moving Occupations by Sex
| Occupation | Male | Female |
| Production | 77 (100.0%) | 0 (0.0%) |
| Transportation | 15 (100.0%) | 0 (0.0%) |
| Material Moving | 0 (0.0%) | 0 (0.0%) |
| Total (Category) | 92 (100.0%) | 0 (0.0%) |
| Total (Overall) | 350 (53.4%) | 305 (46.6%) |
Employment Industries by Sex in Holiday Valley
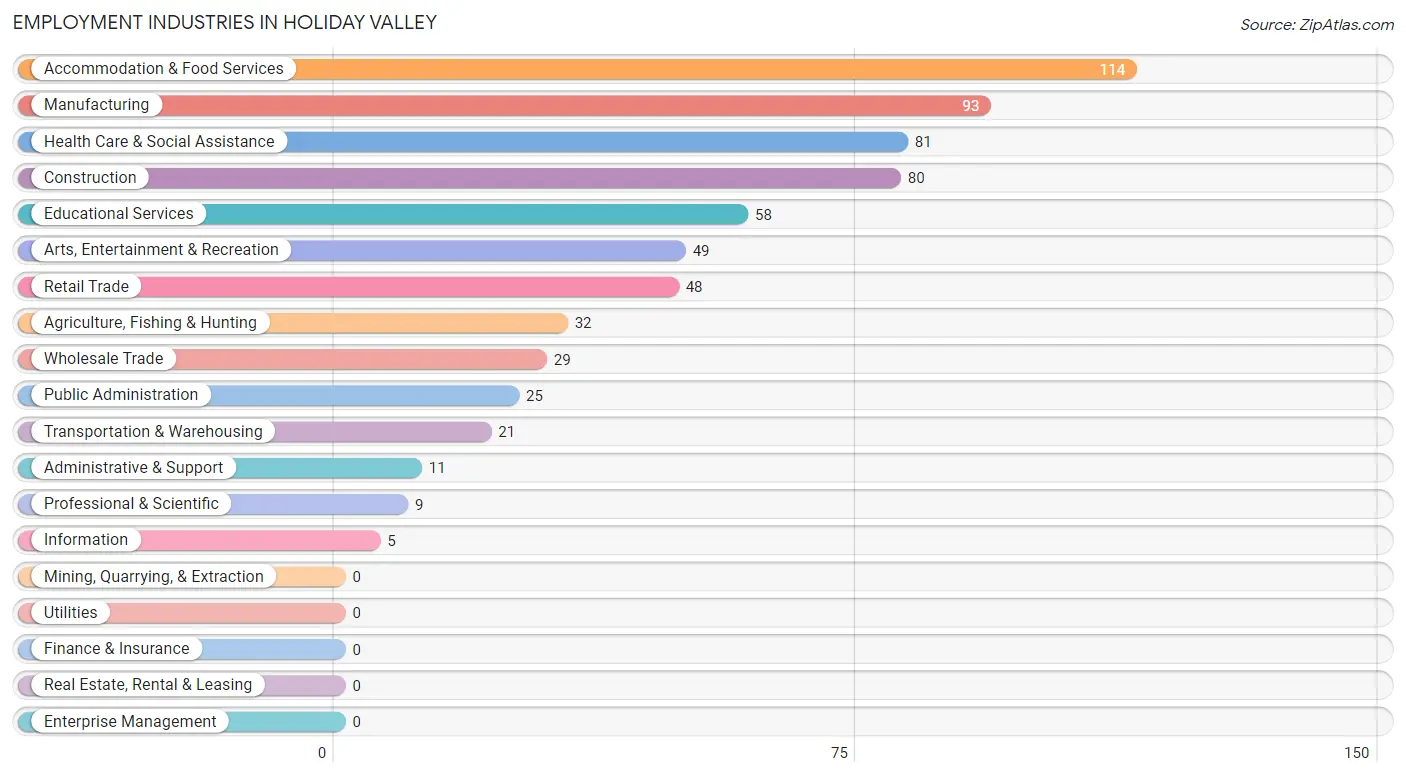
Employment Industries in Holiday Valley
The major employment industries in Holiday Valley include Accommodation & Food Services (114 | 17.4%), Manufacturing (93 | 14.2%), Health Care & Social Assistance (81 | 12.4%), Construction (80 | 12.2%), and Educational Services (58 | 8.8%).
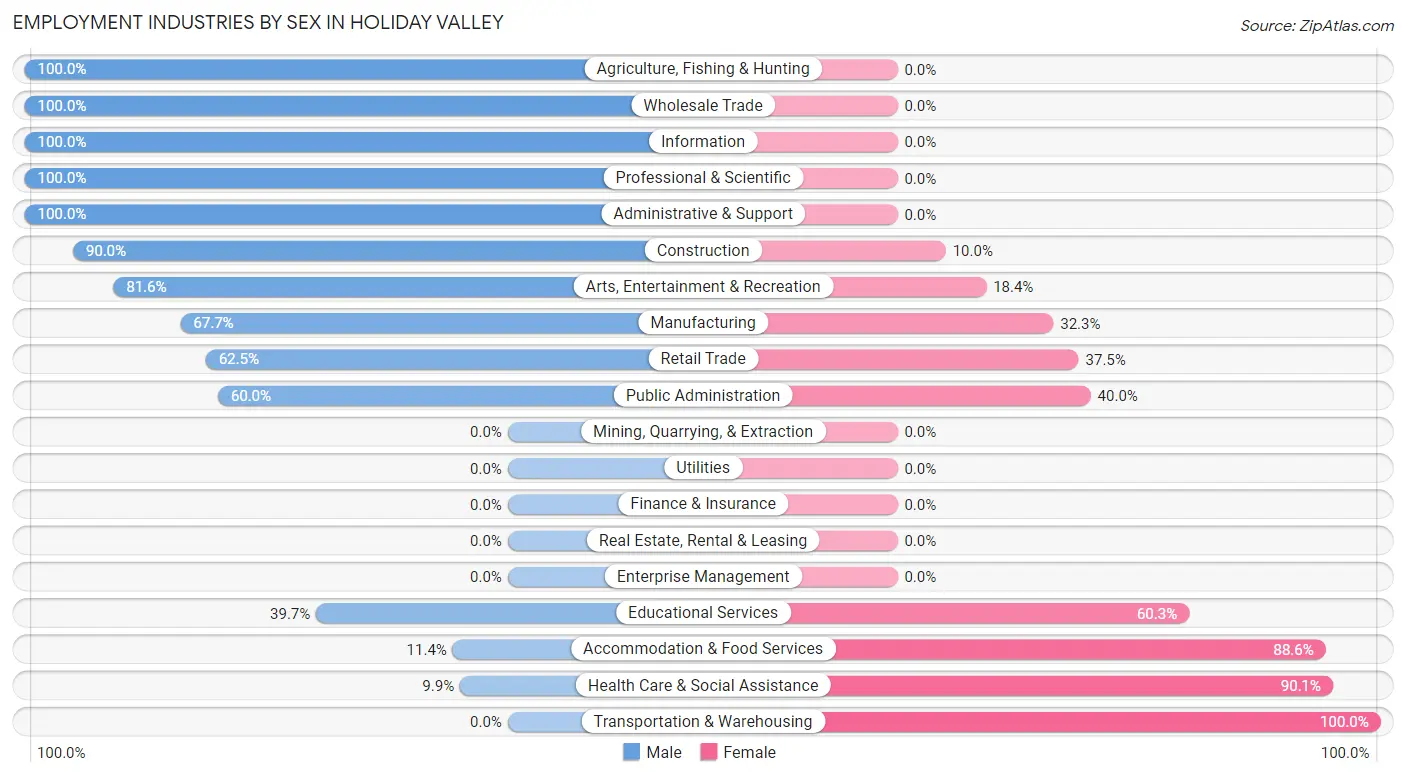
Employment Industries by Sex in Holiday Valley
The Holiday Valley industries that see more men than women are Agriculture, Fishing & Hunting (100.0%), Wholesale Trade (100.0%), and Information (100.0%), whereas the industries that tend to have a higher number of women are Transportation & Warehousing (100.0%), Health Care & Social Assistance (90.1%), and Accommodation & Food Services (88.6%).
| Industry | Male | Female |
| Agriculture, Fishing & Hunting | 32 (100.0%) | 0 (0.0%) |
| Mining, Quarrying, & Extraction | 0 (0.0%) | 0 (0.0%) |
| Construction | 72 (90.0%) | 8 (10.0%) |
| Manufacturing | 63 (67.7%) | 30 (32.3%) |
| Wholesale Trade | 29 (100.0%) | 0 (0.0%) |
| Retail Trade | 30 (62.5%) | 18 (37.5%) |
| Transportation & Warehousing | 0 (0.0%) | 21 (100.0%) |
| Utilities | 0 (0.0%) | 0 (0.0%) |
| Information | 5 (100.0%) | 0 (0.0%) |
| Finance & Insurance | 0 (0.0%) | 0 (0.0%) |
| Real Estate, Rental & Leasing | 0 (0.0%) | 0 (0.0%) |
| Professional & Scientific | 9 (100.0%) | 0 (0.0%) |
| Enterprise Management | 0 (0.0%) | 0 (0.0%) |
| Administrative & Support | 11 (100.0%) | 0 (0.0%) |
| Educational Services | 23 (39.7%) | 35 (60.3%) |
| Health Care & Social Assistance | 8 (9.9%) | 73 (90.1%) |
| Arts, Entertainment & Recreation | 40 (81.6%) | 9 (18.4%) |
| Accommodation & Food Services | 13 (11.4%) | 101 (88.6%) |
| Public Administration | 15 (60.0%) | 10 (40.0%) |
| Total | 350 (53.4%) | 305 (46.6%) |
Education in Holiday Valley
School Enrollment in Holiday Valley
The most common levels of schooling among the 224 students in Holiday Valley are elementary school (66 | 29.5%), nursery / preschool (53 | 23.7%), and middle school (50 | 22.3%).
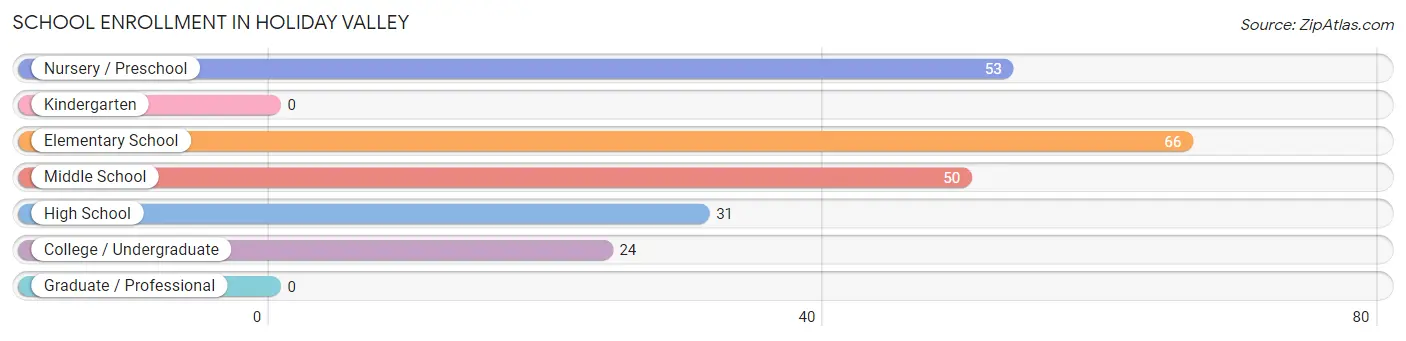
| School Level | # Students | % Students |
| Nursery / Preschool | 53 | 23.7% |
| Kindergarten | 0 | 0.0% |
| Elementary School | 66 | 29.5% |
| Middle School | 50 | 22.3% |
| High School | 31 | 13.8% |
| College / Undergraduate | 24 | 10.7% |
| Graduate / Professional | 0 | 0.0% |
| Total | 224 | 100.0% |
School Enrollment by Age by Funding Source in Holiday Valley
Out of a total of 224 students who are enrolled in schools in Holiday Valley, 6 (2.7%) attend a private institution, while the remaining 218 (97.3%) are enrolled in public schools. The age group of 35 years and over has the highest likelihood of being enrolled in private schools, with 6 (100.0% in the age bracket) enrolled. Conversely, the age group of 3 to 4 year olds has the lowest likelihood of being enrolled in a private school, with 28 (100.0% in the age bracket) attending a public institution.
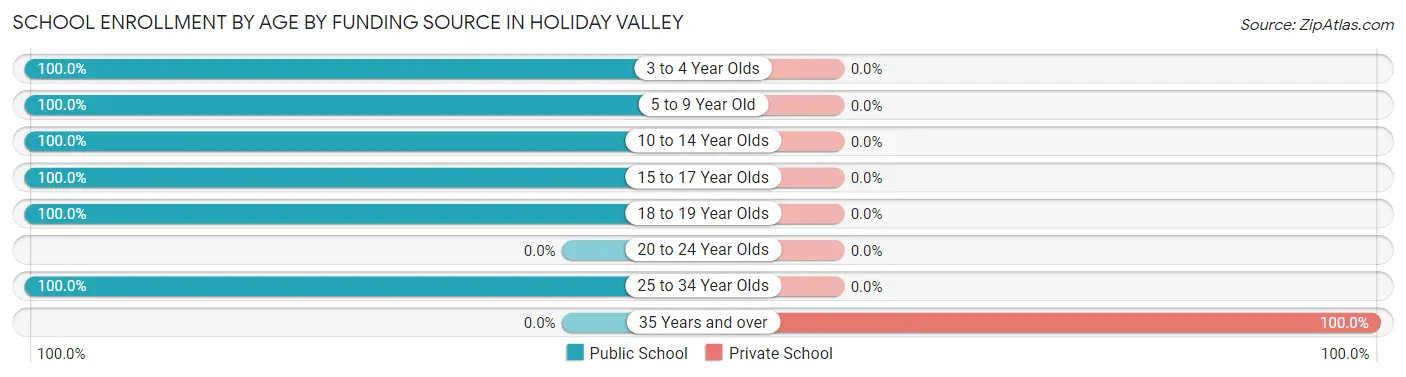
| Age Bracket | Public School | Private School |
| 3 to 4 Year Olds | 28 (100.0%) | 0 (0.0%) |
| 5 to 9 Year Old | 91 (100.0%) | 0 (0.0%) |
| 10 to 14 Year Olds | 50 (100.0%) | 0 (0.0%) |
| 15 to 17 Year Olds | 26 (100.0%) | 0 (0.0%) |
| 18 to 19 Year Olds | 5 (100.0%) | 0 (0.0%) |
| 20 to 24 Year Olds | 0 (0.0%) | 0 (0.0%) |
| 25 to 34 Year Olds | 18 (100.0%) | 0 (0.0%) |
| 35 Years and over | 0 (0.0%) | 6 (100.0%) |
| Total | 218 (97.3%) | 6 (2.7%) |
Educational Attainment by Field of Study in Holiday Valley
Science & technology (52 | 24.2%), social sciences (29 | 13.5%), arts & humanities (26 | 12.1%), education (24 | 11.2%), and business (22 | 10.2%) are the most common fields of study among 215 individuals in Holiday Valley who have obtained a bachelor's degree or higher.
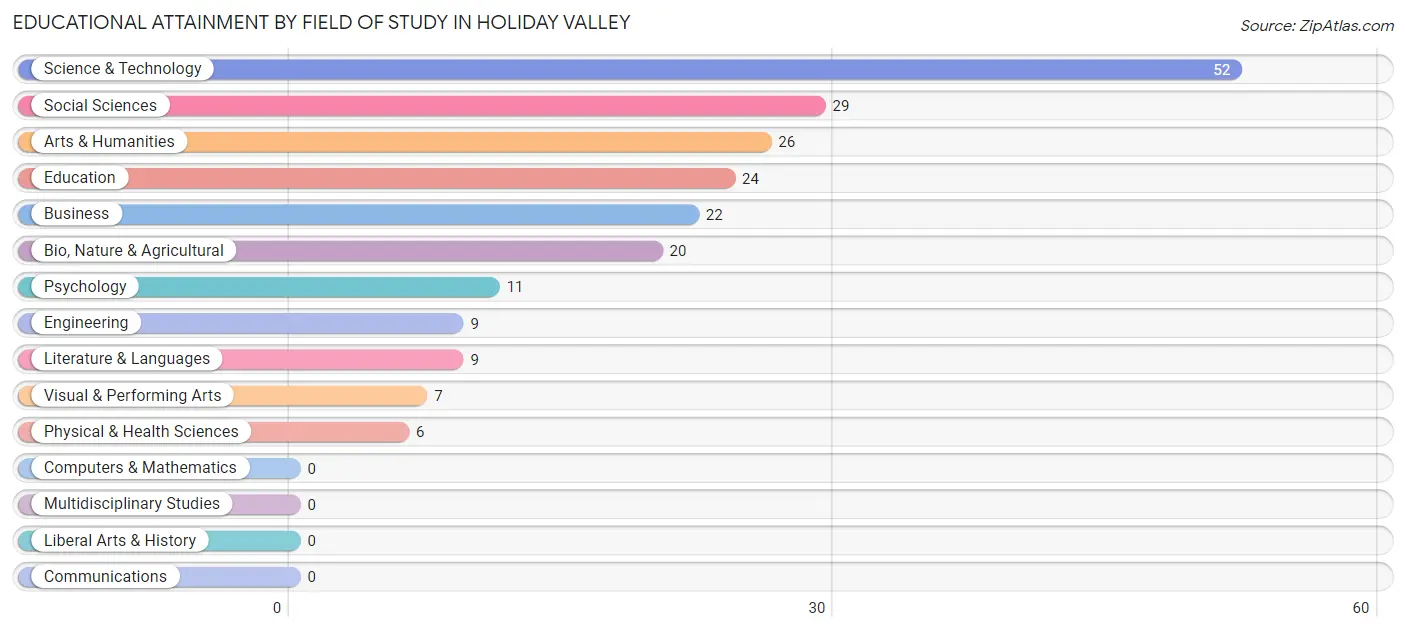
| Field of Study | # Graduates | % Graduates |
| Computers & Mathematics | 0 | 0.0% |
| Bio, Nature & Agricultural | 20 | 9.3% |
| Physical & Health Sciences | 6 | 2.8% |
| Psychology | 11 | 5.1% |
| Social Sciences | 29 | 13.5% |
| Engineering | 9 | 4.2% |
| Multidisciplinary Studies | 0 | 0.0% |
| Science & Technology | 52 | 24.2% |
| Business | 22 | 10.2% |
| Education | 24 | 11.2% |
| Literature & Languages | 9 | 4.2% |
| Liberal Arts & History | 0 | 0.0% |
| Visual & Performing Arts | 7 | 3.3% |
| Communications | 0 | 0.0% |
| Arts & Humanities | 26 | 12.1% |
| Total | 215 | 100.0% |
Transportation & Commute in Holiday Valley
Vehicle Availability by Sex in Holiday Valley
The most prevalent vehicle ownership categories in Holiday Valley are males with 3 vehicles (157, accounting for 43.6%) and females with 3 vehicles (97, making up 51.5%).
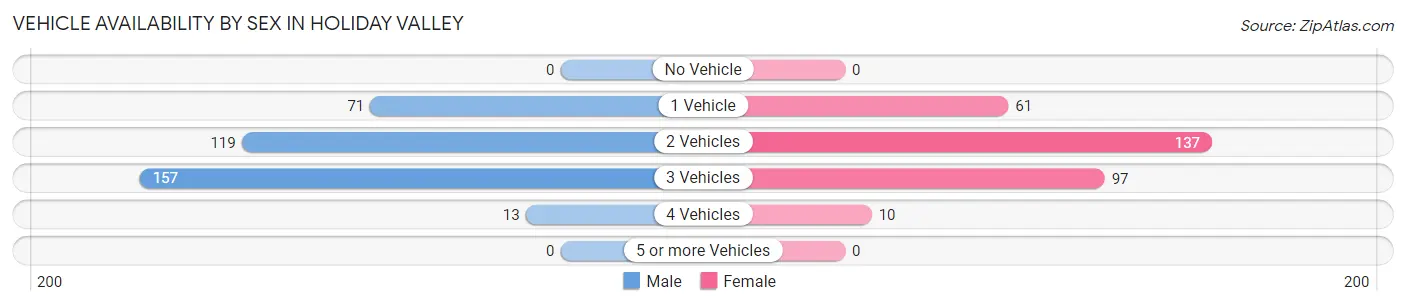
| Vehicles Available | Male | Female |
| No Vehicle | 0 (0.0%) | 0 (0.0%) |
| 1 Vehicle | 71 (19.7%) | 61 (20.0%) |
| 2 Vehicles | 119 (33.1%) | 137 (44.9%) |
| 3 Vehicles | 157 (43.6%) | 97 (31.8%) |
| 4 Vehicles | 13 (3.6%) | 10 (3.3%) |
| 5 or more Vehicles | 0 (0.0%) | 0 (0.0%) |
| Total | 360 (100.0%) | 305 (100.0%) |
Commute Time in Holiday Valley
The most frequently occuring commute durations in Holiday Valley are 20 to 24 minutes (147 commuters, 24.8%), 15 to 19 minutes (127 commuters, 21.4%), and 30 to 34 minutes (59 commuters, 10.0%).
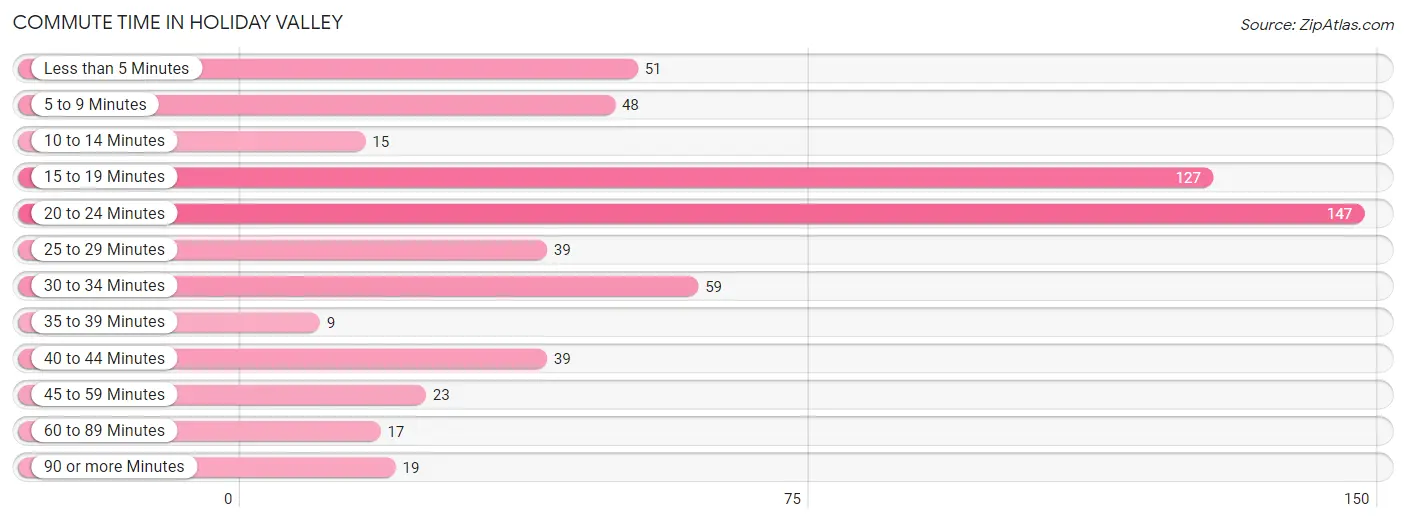
| Commute Time | # Commuters | % Commuters |
| Less than 5 Minutes | 51 | 8.6% |
| 5 to 9 Minutes | 48 | 8.1% |
| 10 to 14 Minutes | 15 | 2.5% |
| 15 to 19 Minutes | 127 | 21.4% |
| 20 to 24 Minutes | 147 | 24.8% |
| 25 to 29 Minutes | 39 | 6.6% |
| 30 to 34 Minutes | 59 | 10.0% |
| 35 to 39 Minutes | 9 | 1.5% |
| 40 to 44 Minutes | 39 | 6.6% |
| 45 to 59 Minutes | 23 | 3.9% |
| 60 to 89 Minutes | 17 | 2.9% |
| 90 or more Minutes | 19 | 3.2% |
Commute Time by Sex in Holiday Valley
The most common commute times in Holiday Valley are 20 to 24 minutes (103 commuters, 32.8%) for males and 15 to 19 minutes (84 commuters, 30.1%) for females.
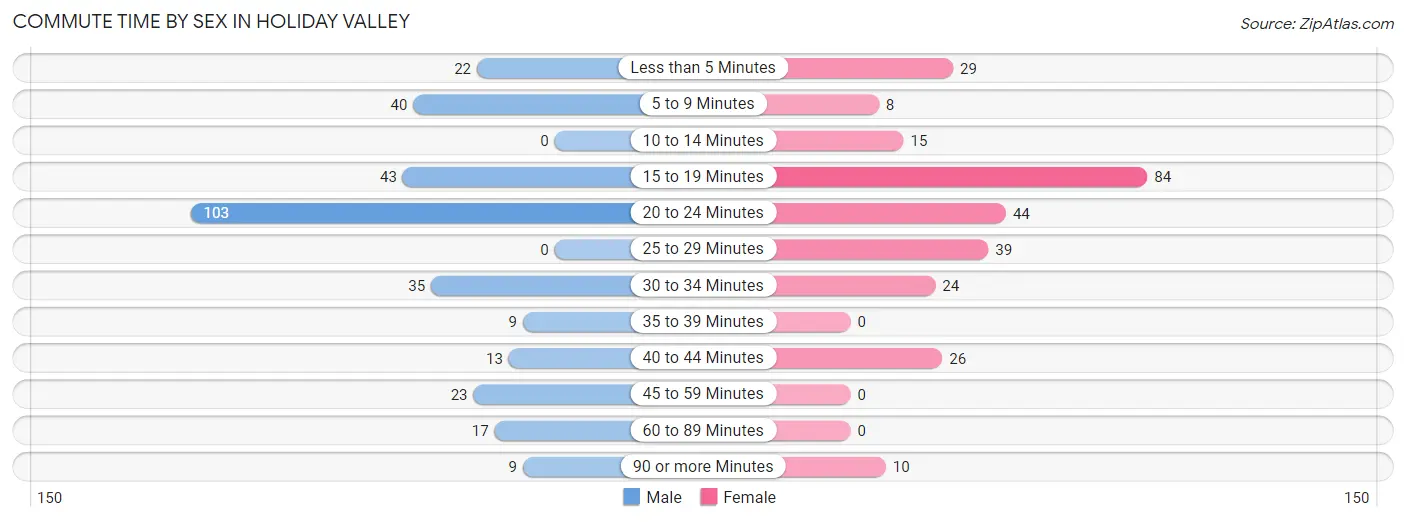
| Commute Time | Male | Female |
| Less than 5 Minutes | 22 (7.0%) | 29 (10.4%) |
| 5 to 9 Minutes | 40 (12.7%) | 8 (2.9%) |
| 10 to 14 Minutes | 0 (0.0%) | 15 (5.4%) |
| 15 to 19 Minutes | 43 (13.7%) | 84 (30.1%) |
| 20 to 24 Minutes | 103 (32.8%) | 44 (15.8%) |
| 25 to 29 Minutes | 0 (0.0%) | 39 (14.0%) |
| 30 to 34 Minutes | 35 (11.2%) | 24 (8.6%) |
| 35 to 39 Minutes | 9 (2.9%) | 0 (0.0%) |
| 40 to 44 Minutes | 13 (4.1%) | 26 (9.3%) |
| 45 to 59 Minutes | 23 (7.3%) | 0 (0.0%) |
| 60 to 89 Minutes | 17 (5.4%) | 0 (0.0%) |
| 90 or more Minutes | 9 (2.9%) | 10 (3.6%) |
Time of Departure to Work by Sex in Holiday Valley
The most frequent times of departure to work in Holiday Valley are 4:00 PM to 11:59 PM (71, 22.6%) for males and 4:00 PM to 11:59 PM (56, 20.1%) for females.
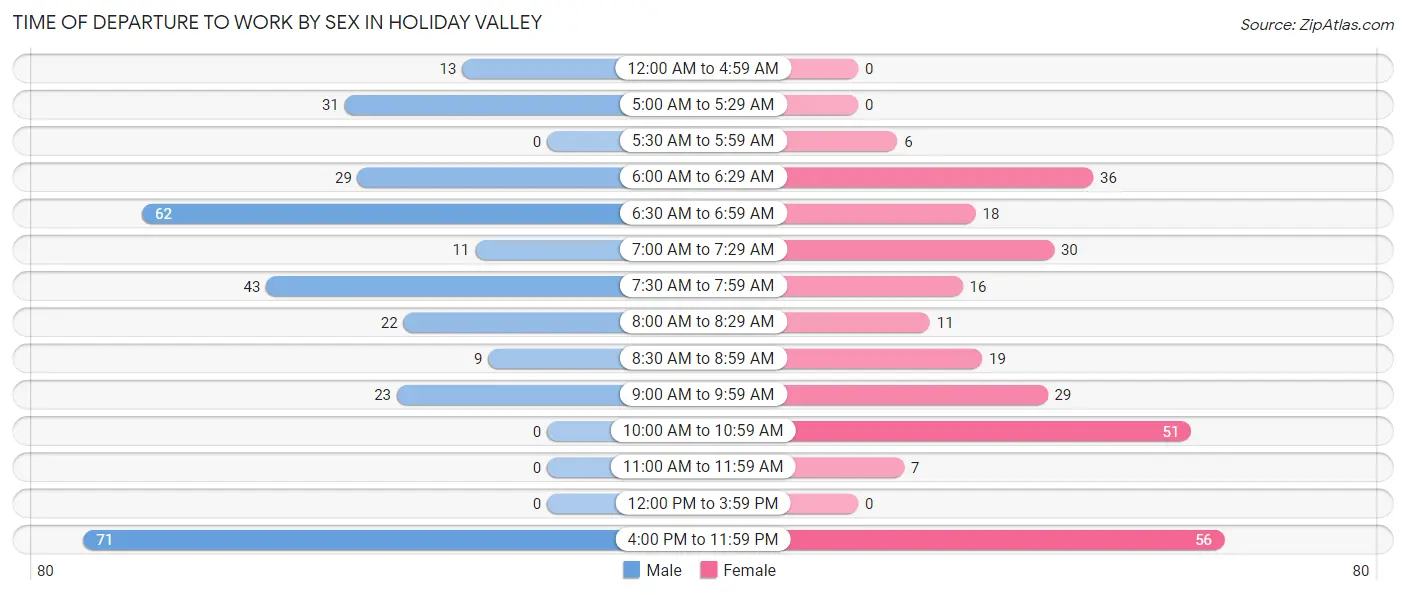
| Time of Departure | Male | Female |
| 12:00 AM to 4:59 AM | 13 (4.1%) | 0 (0.0%) |
| 5:00 AM to 5:29 AM | 31 (9.9%) | 0 (0.0%) |
| 5:30 AM to 5:59 AM | 0 (0.0%) | 6 (2.1%) |
| 6:00 AM to 6:29 AM | 29 (9.2%) | 36 (12.9%) |
| 6:30 AM to 6:59 AM | 62 (19.8%) | 18 (6.5%) |
| 7:00 AM to 7:29 AM | 11 (3.5%) | 30 (10.7%) |
| 7:30 AM to 7:59 AM | 43 (13.7%) | 16 (5.7%) |
| 8:00 AM to 8:29 AM | 22 (7.0%) | 11 (3.9%) |
| 8:30 AM to 8:59 AM | 9 (2.9%) | 19 (6.8%) |
| 9:00 AM to 9:59 AM | 23 (7.3%) | 29 (10.4%) |
| 10:00 AM to 10:59 AM | 0 (0.0%) | 51 (18.3%) |
| 11:00 AM to 11:59 AM | 0 (0.0%) | 7 (2.5%) |
| 12:00 PM to 3:59 PM | 0 (0.0%) | 0 (0.0%) |
| 4:00 PM to 11:59 PM | 71 (22.6%) | 56 (20.1%) |
| Total | 314 (100.0%) | 279 (100.0%) |
Housing Occupancy in Holiday Valley
Occupancy by Ownership in Holiday Valley
Of the total 617 dwellings in Holiday Valley, owner-occupied units account for 577 (93.5%), while renter-occupied units make up 40 (6.5%).
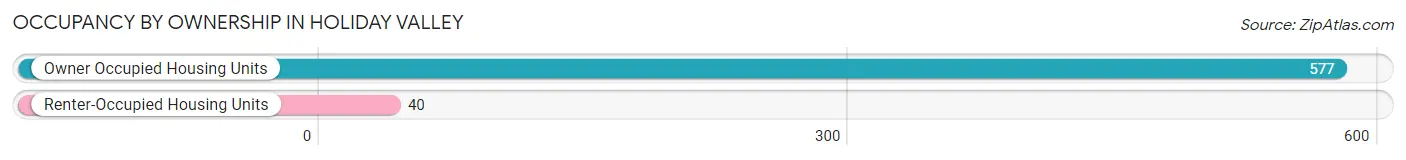
| Occupancy | # Housing Units | % Housing Units |
| Owner Occupied Housing Units | 577 | 93.5% |
| Renter-Occupied Housing Units | 40 | 6.5% |
| Total Occupied Housing Units | 617 | 100.0% |
Occupancy by Household Size in Holiday Valley
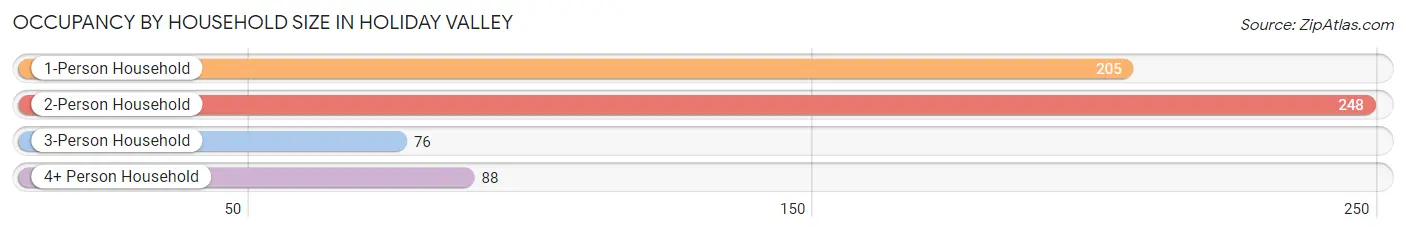
| Household Size | # Housing Units | % Housing Units |
| 1-Person Household | 205 | 33.2% |
| 2-Person Household | 248 | 40.2% |
| 3-Person Household | 76 | 12.3% |
| 4+ Person Household | 88 | 14.3% |
| Total Housing Units | 617 | 100.0% |
Occupancy by Ownership by Household Size in Holiday Valley
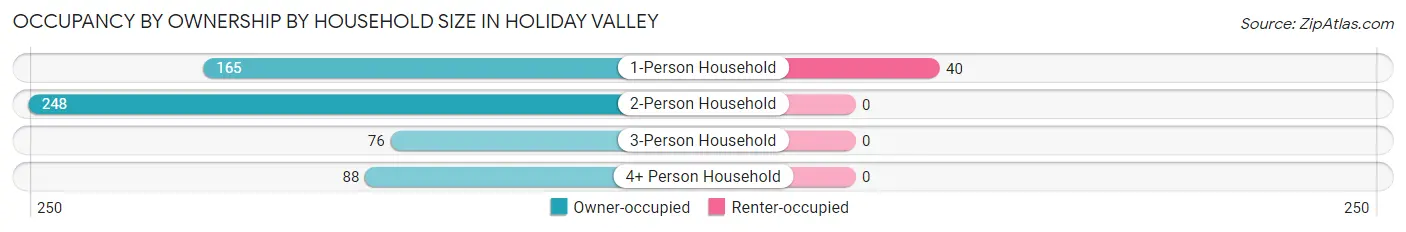
| Household Size | Owner-occupied | Renter-occupied |
| 1-Person Household | 165 (80.5%) | 40 (19.5%) |
| 2-Person Household | 248 (100.0%) | 0 (0.0%) |
| 3-Person Household | 76 (100.0%) | 0 (0.0%) |
| 4+ Person Household | 88 (100.0%) | 0 (0.0%) |
| Total Housing Units | 577 (93.5%) | 40 (6.5%) |
Occupancy by Educational Attainment in Holiday Valley
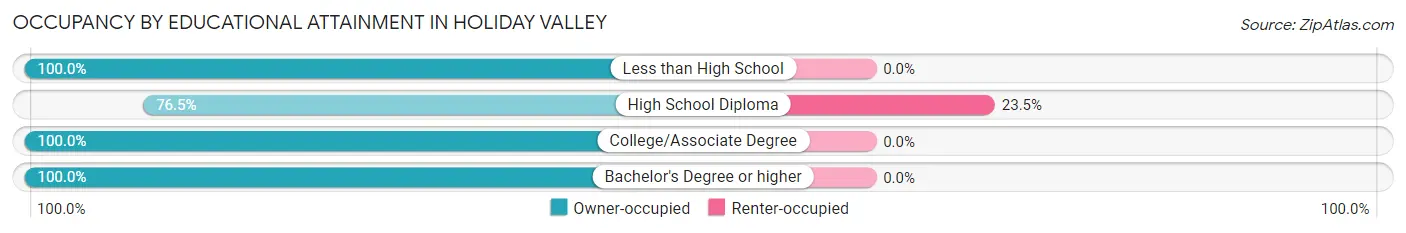
| Household Size | Owner-occupied | Renter-occupied |
| Less than High School | 36 (100.0%) | 0 (0.0%) |
| High School Diploma | 130 (76.5%) | 40 (23.5%) |
| College/Associate Degree | 296 (100.0%) | 0 (0.0%) |
| Bachelor's Degree or higher | 115 (100.0%) | 0 (0.0%) |
Occupancy by Age of Householder in Holiday Valley
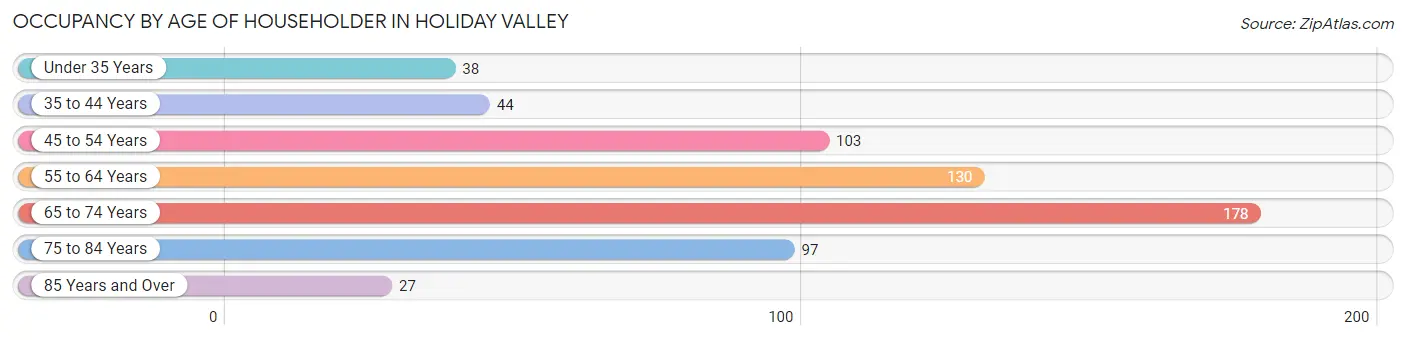
| Age Bracket | # Households | % Households |
| Under 35 Years | 38 | 6.2% |
| 35 to 44 Years | 44 | 7.1% |
| 45 to 54 Years | 103 | 16.7% |
| 55 to 64 Years | 130 | 21.1% |
| 65 to 74 Years | 178 | 28.8% |
| 75 to 84 Years | 97 | 15.7% |
| 85 Years and Over | 27 | 4.4% |
| Total | 617 | 100.0% |
Housing Finances in Holiday Valley
Median Income by Occupancy in Holiday Valley
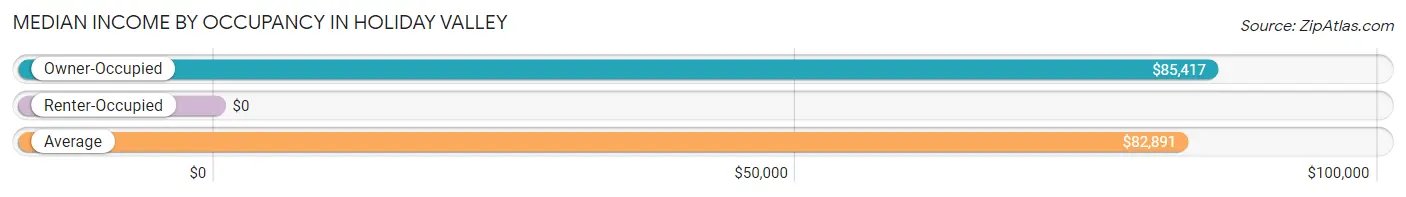
| Occupancy Type | # Households | Median Income |
| Owner-Occupied | 577 (93.5%) | $85,417 |
| Renter-Occupied | 40 (6.5%) | $0 |
| Average | 617 (100.0%) | $82,891 |
Occupancy by Householder Income Bracket in Holiday Valley
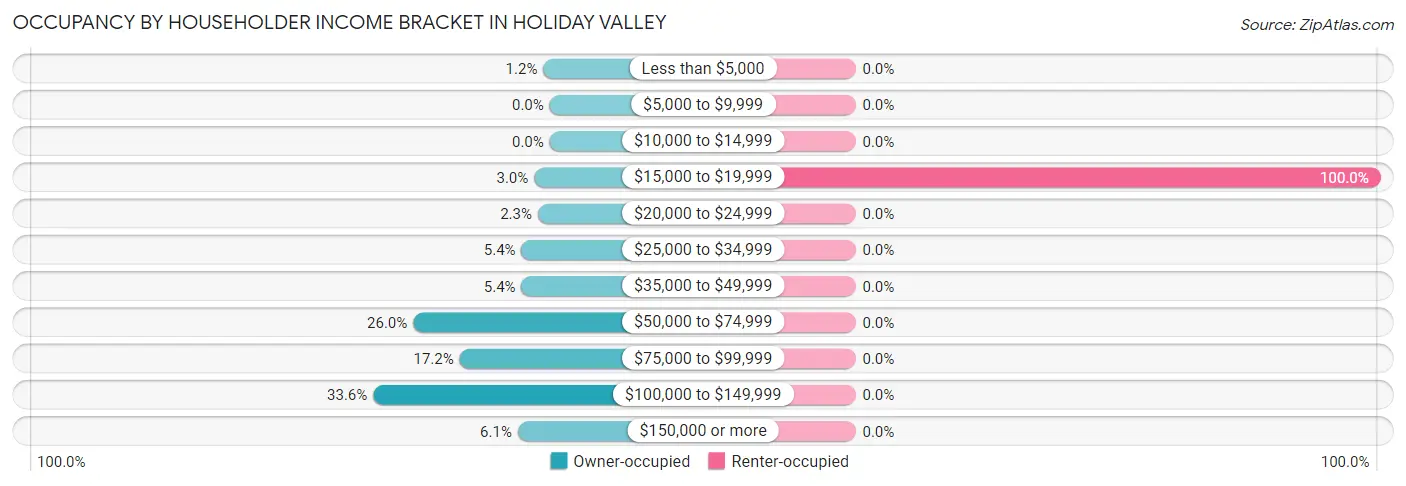
| Income Bracket | Owner-occupied | Renter-occupied |
| Less than $5,000 | 7 (1.2%) | 0 (0.0%) |
| $5,000 to $9,999 | 0 (0.0%) | 0 (0.0%) |
| $10,000 to $14,999 | 0 (0.0%) | 0 (0.0%) |
| $15,000 to $19,999 | 17 (2.9%) | 40 (100.0%) |
| $20,000 to $24,999 | 13 (2.2%) | 0 (0.0%) |
| $25,000 to $34,999 | 31 (5.4%) | 0 (0.0%) |
| $35,000 to $49,999 | 31 (5.4%) | 0 (0.0%) |
| $50,000 to $74,999 | 150 (26.0%) | 0 (0.0%) |
| $75,000 to $99,999 | 99 (17.2%) | 0 (0.0%) |
| $100,000 to $149,999 | 194 (33.6%) | 0 (0.0%) |
| $150,000 or more | 35 (6.1%) | 0 (0.0%) |
| Total | 577 (100.0%) | 40 (100.0%) |
Monthly Housing Cost Tiers in Holiday Valley
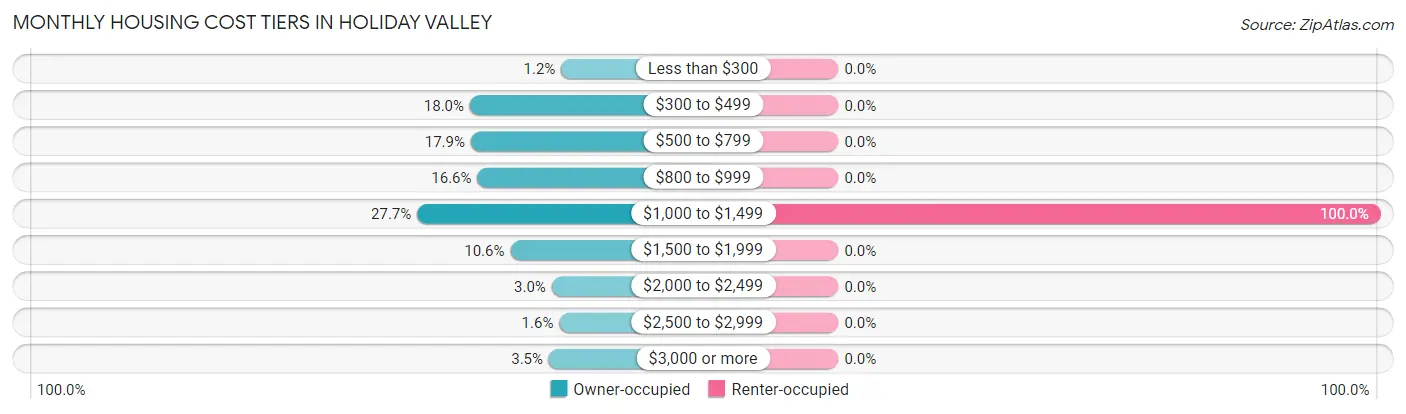
| Monthly Cost | Owner-occupied | Renter-occupied |
| Less than $300 | 7 (1.2%) | 0 (0.0%) |
| $300 to $499 | 104 (18.0%) | 0 (0.0%) |
| $500 to $799 | 103 (17.8%) | 0 (0.0%) |
| $800 to $999 | 96 (16.6%) | 0 (0.0%) |
| $1,000 to $1,499 | 160 (27.7%) | 40 (100.0%) |
| $1,500 to $1,999 | 61 (10.6%) | 0 (0.0%) |
| $2,000 to $2,499 | 17 (2.9%) | 0 (0.0%) |
| $2,500 to $2,999 | 9 (1.6%) | 0 (0.0%) |
| $3,000 or more | 20 (3.5%) | 0 (0.0%) |
| Total | 577 (100.0%) | 40 (100.0%) |
Physical Housing Characteristics in Holiday Valley
Housing Structures in Holiday Valley
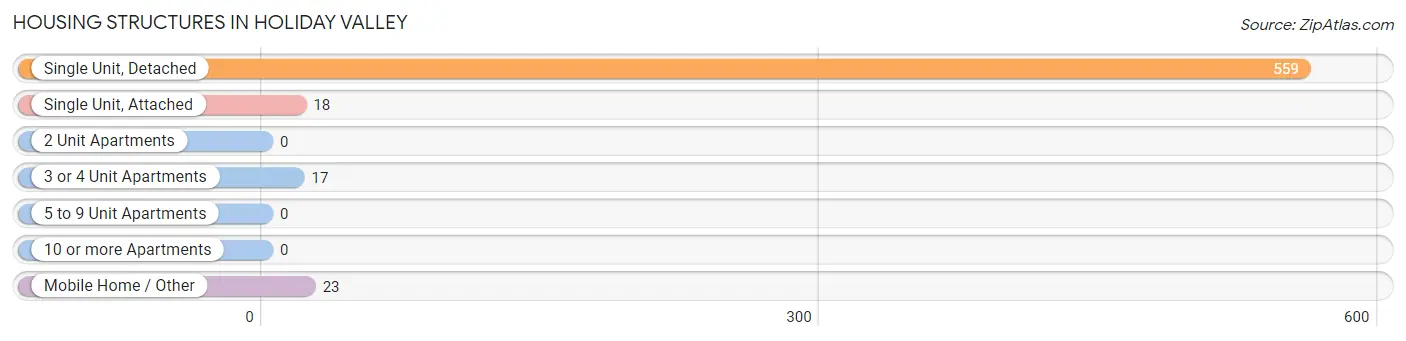
| Structure Type | # Housing Units | % Housing Units |
| Single Unit, Detached | 559 | 90.6% |
| Single Unit, Attached | 18 | 2.9% |
| 2 Unit Apartments | 0 | 0.0% |
| 3 or 4 Unit Apartments | 17 | 2.8% |
| 5 to 9 Unit Apartments | 0 | 0.0% |
| 10 or more Apartments | 0 | 0.0% |
| Mobile Home / Other | 23 | 3.7% |
| Total | 617 | 100.0% |
Housing Structures by Occupancy in Holiday Valley
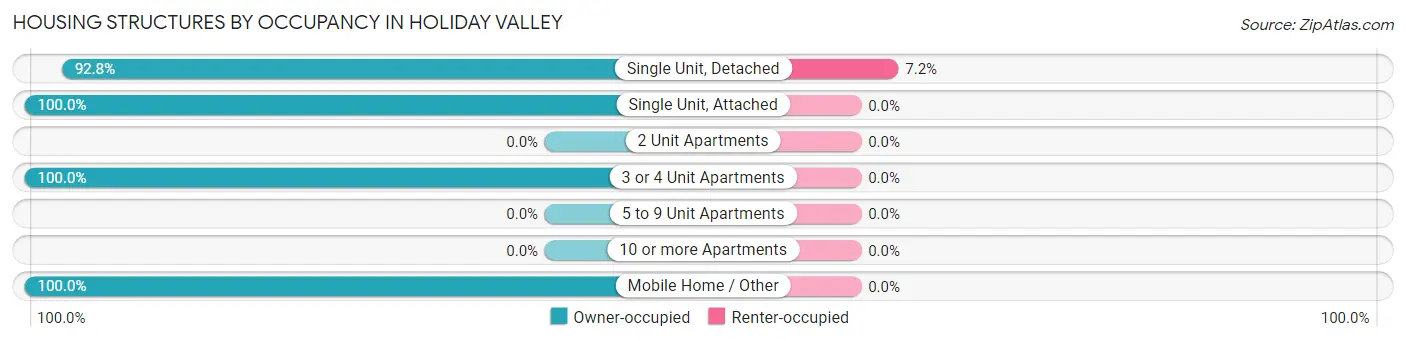
| Structure Type | Owner-occupied | Renter-occupied |
| Single Unit, Detached | 519 (92.8%) | 40 (7.2%) |
| Single Unit, Attached | 18 (100.0%) | 0 (0.0%) |
| 2 Unit Apartments | 0 (0.0%) | 0 (0.0%) |
| 3 or 4 Unit Apartments | 17 (100.0%) | 0 (0.0%) |
| 5 to 9 Unit Apartments | 0 (0.0%) | 0 (0.0%) |
| 10 or more Apartments | 0 (0.0%) | 0 (0.0%) |
| Mobile Home / Other | 23 (100.0%) | 0 (0.0%) |
| Total | 577 (93.5%) | 40 (6.5%) |
Housing Structures by Number of Rooms in Holiday Valley
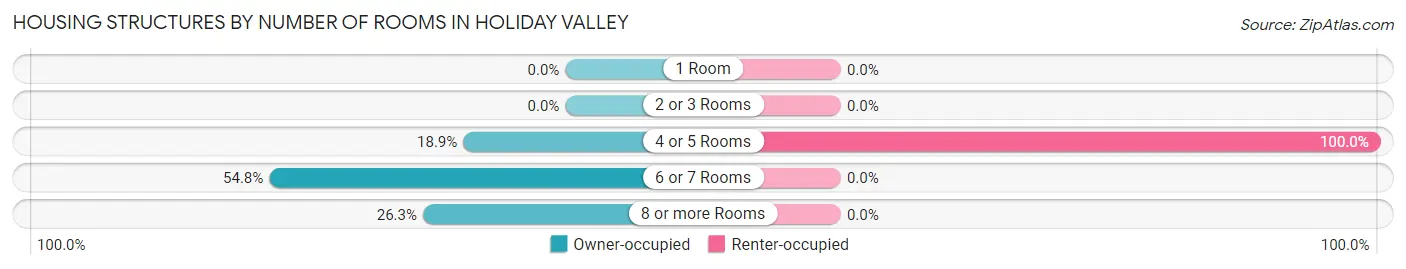
| Number of Rooms | Owner-occupied | Renter-occupied |
| 1 Room | 0 (0.0%) | 0 (0.0%) |
| 2 or 3 Rooms | 0 (0.0%) | 0 (0.0%) |
| 4 or 5 Rooms | 109 (18.9%) | 40 (100.0%) |
| 6 or 7 Rooms | 316 (54.8%) | 0 (0.0%) |
| 8 or more Rooms | 152 (26.3%) | 0 (0.0%) |
| Total | 577 (100.0%) | 40 (100.0%) |
Housing Structure by Heating Type in Holiday Valley
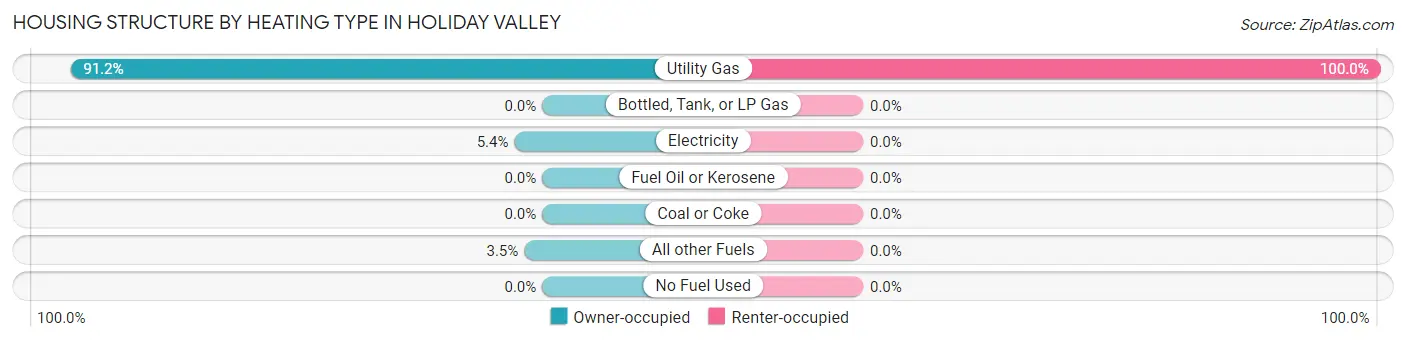
| Heating Type | Owner-occupied | Renter-occupied |
| Utility Gas | 526 (91.2%) | 40 (100.0%) |
| Bottled, Tank, or LP Gas | 0 (0.0%) | 0 (0.0%) |
| Electricity | 31 (5.4%) | 0 (0.0%) |
| Fuel Oil or Kerosene | 0 (0.0%) | 0 (0.0%) |
| Coal or Coke | 0 (0.0%) | 0 (0.0%) |
| All other Fuels | 20 (3.5%) | 0 (0.0%) |
| No Fuel Used | 0 (0.0%) | 0 (0.0%) |
| Total | 577 (100.0%) | 40 (100.0%) |
Household Vehicle Usage in Holiday Valley
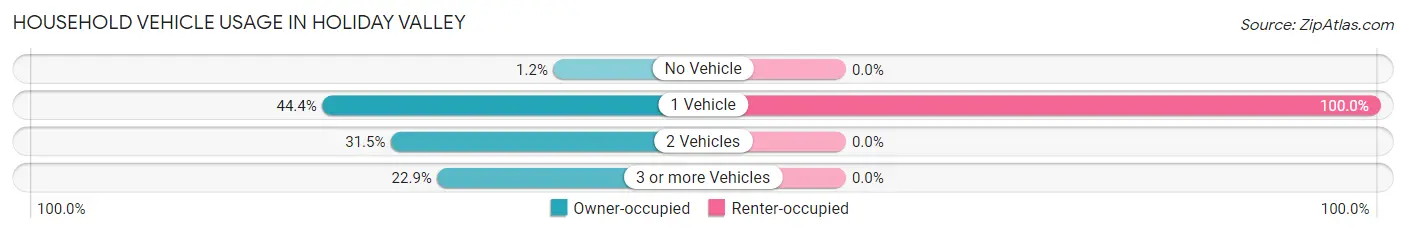
| Vehicles per Household | Owner-occupied | Renter-occupied |
| No Vehicle | 7 (1.2%) | 0 (0.0%) |
| 1 Vehicle | 256 (44.4%) | 40 (100.0%) |
| 2 Vehicles | 182 (31.5%) | 0 (0.0%) |
| 3 or more Vehicles | 132 (22.9%) | 0 (0.0%) |
| Total | 577 (100.0%) | 40 (100.0%) |
Real Estate & Mortgages in Holiday Valley
Real Estate and Mortgage Overview in Holiday Valley
| Characteristic | Without Mortgage | With Mortgage |
| Housing Units | 209 | 368 |
| Median Property Value | $172,800 | $181,000 |
| Median Household Income | $71,042 | $19 |
| Monthly Housing Costs | $487 | $20 |
| Real Estate Taxes | $2,420 | $16 |
Property Value by Mortgage Status in Holiday Valley
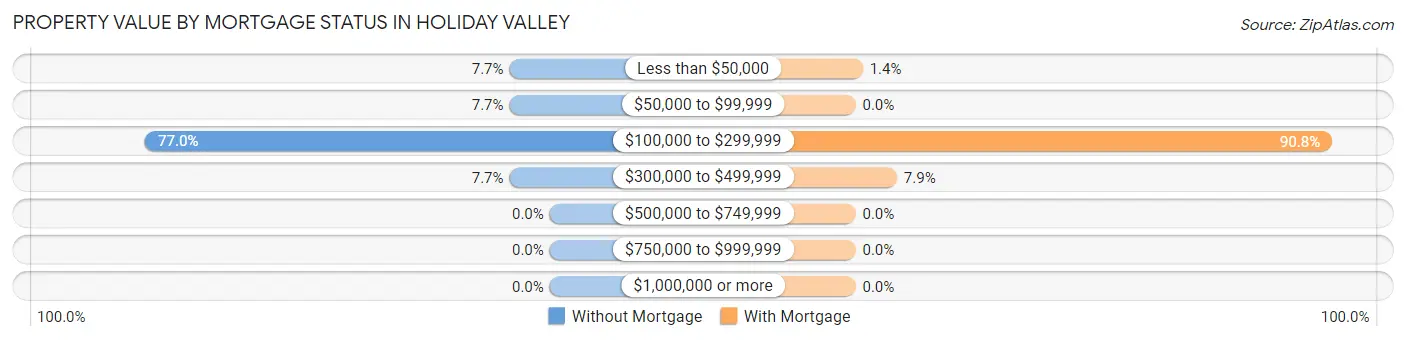
| Property Value | Without Mortgage | With Mortgage |
| Less than $50,000 | 16 (7.7%) | 5 (1.4%) |
| $50,000 to $99,999 | 16 (7.7%) | 0 (0.0%) |
| $100,000 to $299,999 | 161 (77.0%) | 334 (90.8%) |
| $300,000 to $499,999 | 16 (7.7%) | 29 (7.9%) |
| $500,000 to $749,999 | 0 (0.0%) | 0 (0.0%) |
| $750,000 to $999,999 | 0 (0.0%) | 0 (0.0%) |
| $1,000,000 or more | 0 (0.0%) | 0 (0.0%) |
| Total | 209 (100.0%) | 368 (100.0%) |
Household Income by Mortgage Status in Holiday Valley
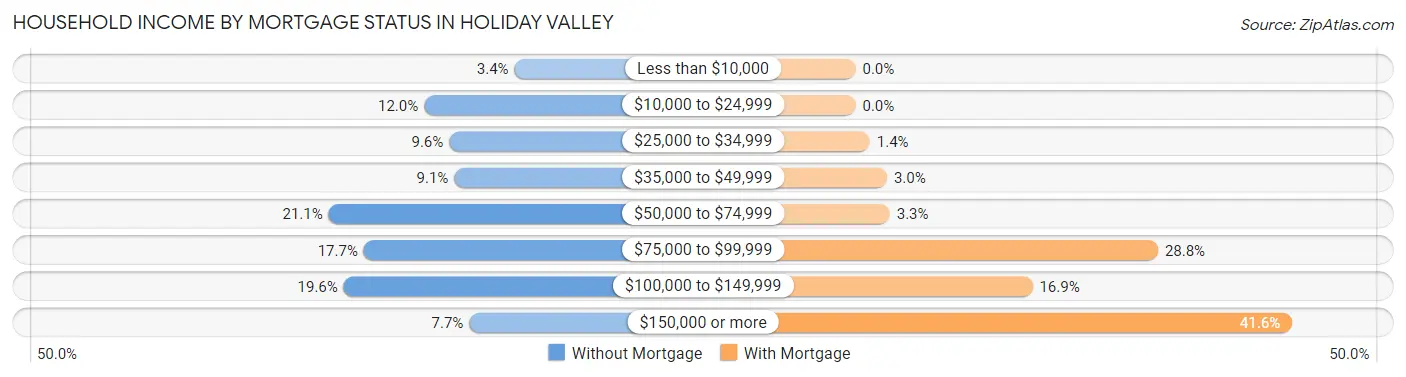
| Household Income | Without Mortgage | With Mortgage |
| Less than $10,000 | 7 (3.4%) | 0 (0.0%) |
| $10,000 to $24,999 | 25 (12.0%) | 0 (0.0%) |
| $25,000 to $34,999 | 20 (9.6%) | 5 (1.4%) |
| $35,000 to $49,999 | 19 (9.1%) | 11 (3.0%) |
| $50,000 to $74,999 | 44 (21.0%) | 12 (3.3%) |
| $75,000 to $99,999 | 37 (17.7%) | 106 (28.8%) |
| $100,000 to $149,999 | 41 (19.6%) | 62 (16.9%) |
| $150,000 or more | 16 (7.7%) | 153 (41.6%) |
| Total | 209 (100.0%) | 368 (100.0%) |
Property Value to Household Income Ratio in Holiday Valley
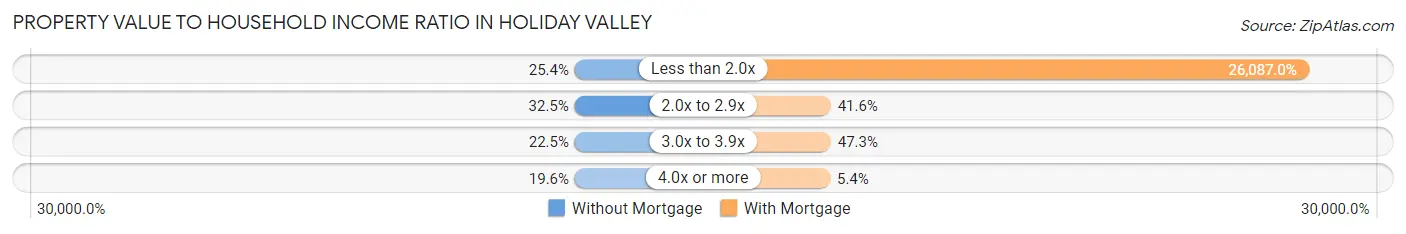
| Value-to-Income Ratio | Without Mortgage | With Mortgage |
| Less than 2.0x | 53 (25.4%) | 96,000 (26,087.0%) |
| 2.0x to 2.9x | 68 (32.5%) | 153 (41.6%) |
| 3.0x to 3.9x | 47 (22.5%) | 174 (47.3%) |
| 4.0x or more | 41 (19.6%) | 20 (5.4%) |
| Total | 209 (100.0%) | 368 (100.0%) |
Real Estate Taxes by Mortgage Status in Holiday Valley
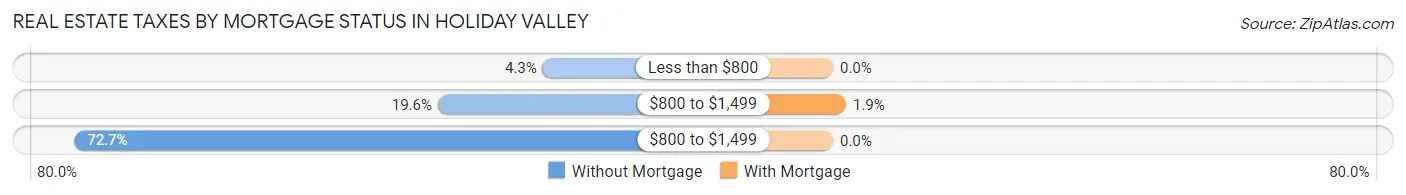
| Property Taxes | Without Mortgage | With Mortgage |
| Less than $800 | 9 (4.3%) | 0 (0.0%) |
| $800 to $1,499 | 41 (19.6%) | 7 (1.9%) |
| $800 to $1,499 | 152 (72.7%) | 0 (0.0%) |
| Total | 209 (100.0%) | 368 (100.0%) |
Health & Disability in Holiday Valley
Health Insurance Coverage by Age in Holiday Valley
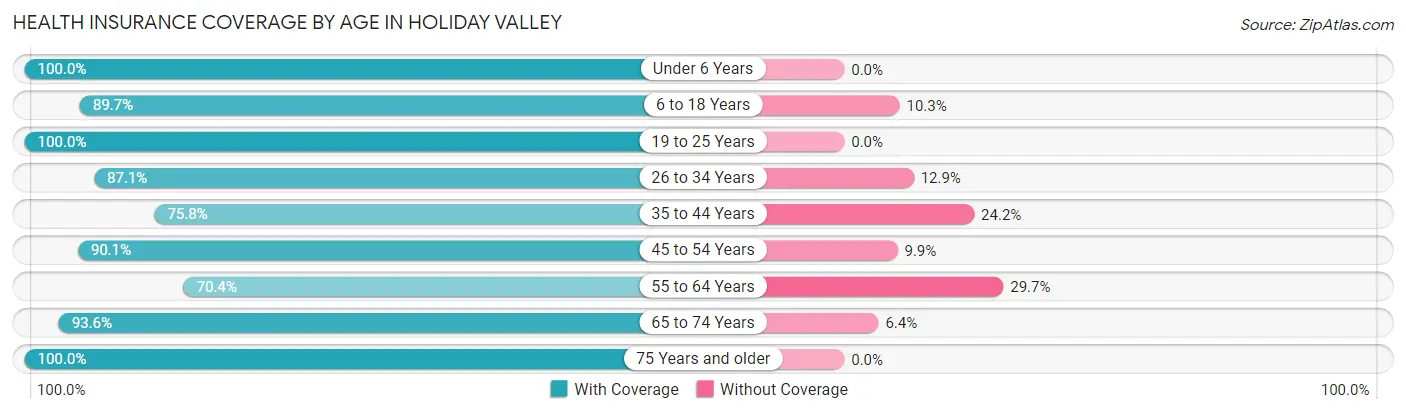
| Age Bracket | With Coverage | Without Coverage |
| Under 6 Years | 53 (100.0%) | 0 (0.0%) |
| 6 to 18 Years | 148 (89.7%) | 17 (10.3%) |
| 19 to 25 Years | 55 (100.0%) | 0 (0.0%) |
| 26 to 34 Years | 74 (87.1%) | 11 (12.9%) |
| 35 to 44 Years | 169 (75.8%) | 54 (24.2%) |
| 45 to 54 Years | 127 (90.1%) | 14 (9.9%) |
| 55 to 64 Years | 121 (70.4%) | 51 (29.6%) |
| 65 to 74 Years | 338 (93.6%) | 23 (6.4%) |
| 75 Years and older | 159 (100.0%) | 0 (0.0%) |
| Total | 1,244 (88.0%) | 170 (12.0%) |
Health Insurance Coverage by Citizenship Status in Holiday Valley
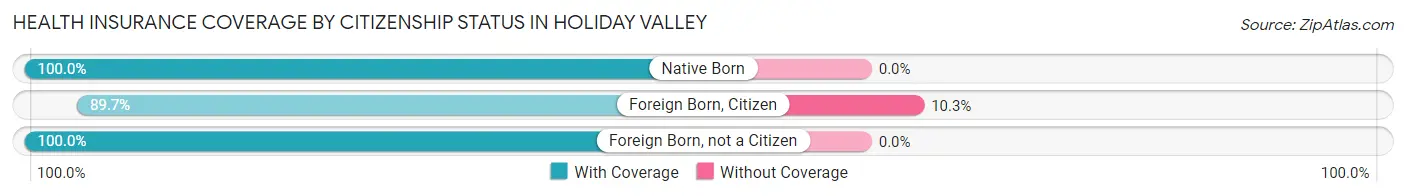
| Citizenship Status | With Coverage | Without Coverage |
| Native Born | 53 (100.0%) | 0 (0.0%) |
| Foreign Born, Citizen | 148 (89.7%) | 17 (10.3%) |
| Foreign Born, not a Citizen | 55 (100.0%) | 0 (0.0%) |
Health Insurance Coverage by Household Income in Holiday Valley
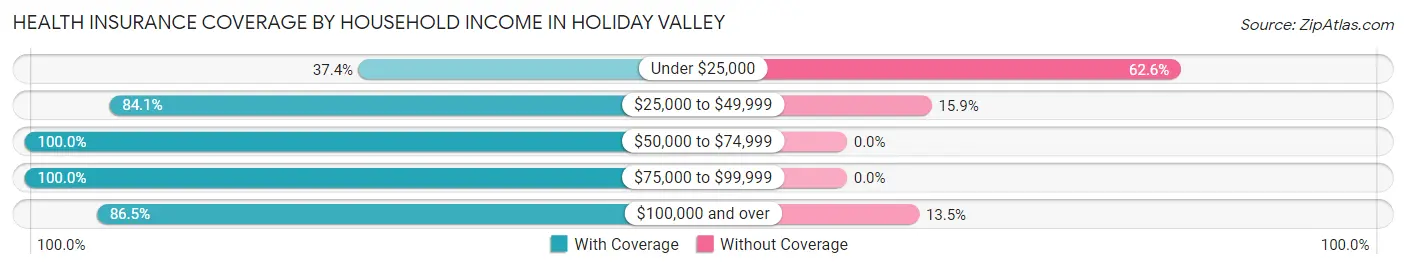
| Household Income | With Coverage | Without Coverage |
| Under $25,000 | 37 (37.4%) | 62 (62.6%) |
| $25,000 to $49,999 | 106 (84.1%) | 20 (15.9%) |
| $50,000 to $74,999 | 330 (100.0%) | 0 (0.0%) |
| $75,000 to $99,999 | 208 (100.0%) | 0 (0.0%) |
| $100,000 and over | 563 (86.5%) | 88 (13.5%) |
Public vs Private Health Insurance Coverage by Age in Holiday Valley
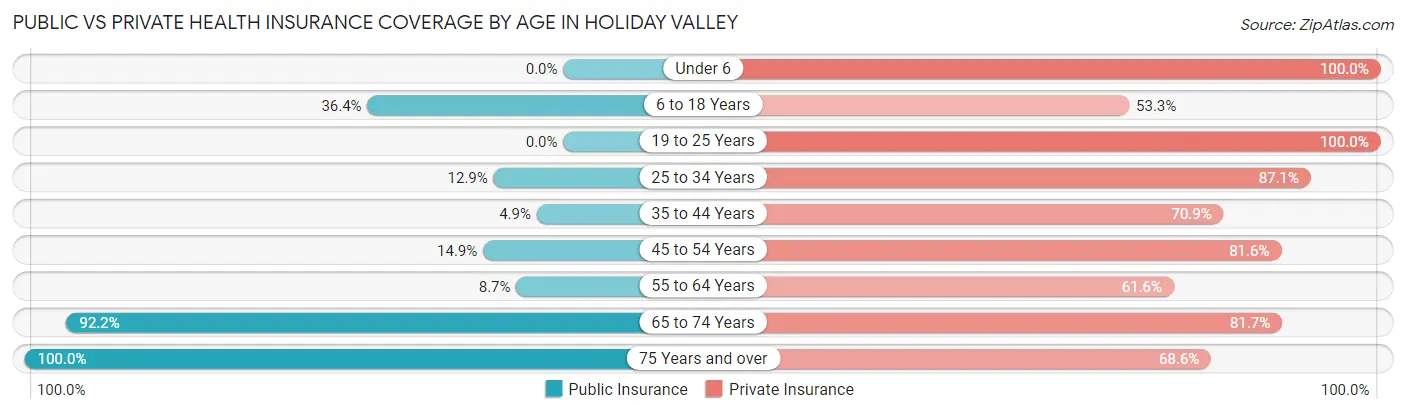
| Age Bracket | Public Insurance | Private Insurance |
| Under 6 | 0 (0.0%) | 53 (100.0%) |
| 6 to 18 Years | 60 (36.4%) | 88 (53.3%) |
| 19 to 25 Years | 0 (0.0%) | 55 (100.0%) |
| 25 to 34 Years | 11 (12.9%) | 74 (87.1%) |
| 35 to 44 Years | 11 (4.9%) | 158 (70.9%) |
| 45 to 54 Years | 21 (14.9%) | 115 (81.6%) |
| 55 to 64 Years | 15 (8.7%) | 106 (61.6%) |
| 65 to 74 Years | 333 (92.2%) | 295 (81.7%) |
| 75 Years and over | 159 (100.0%) | 109 (68.5%) |
| Total | 610 (43.1%) | 1,053 (74.5%) |
Disability Status by Sex by Age in Holiday Valley
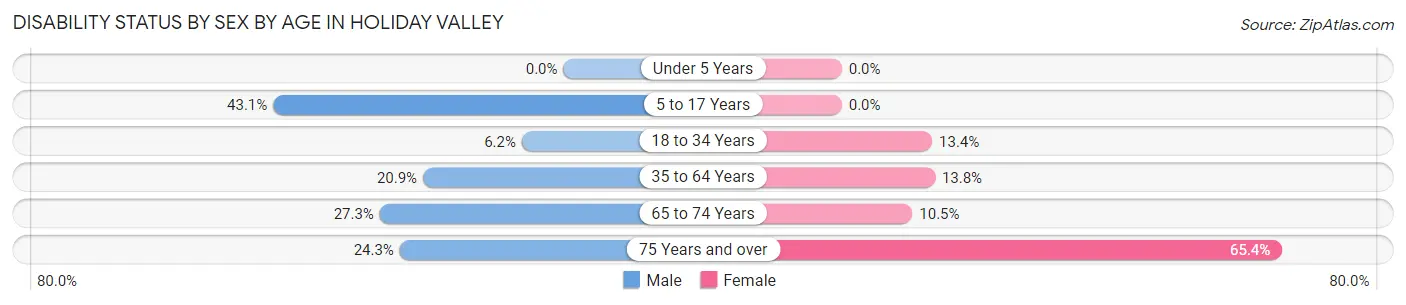
| Age Bracket | Male | Female |
| Under 5 Years | 0 (0.0%) | 0 (0.0%) |
| 5 to 17 Years | 25 (43.1%) | 0 (0.0%) |
| 18 to 34 Years | 5 (6.2%) | 11 (13.4%) |
| 35 to 64 Years | 59 (20.8%) | 35 (13.8%) |
| 65 to 74 Years | 36 (27.3%) | 24 (10.5%) |
| 75 Years and over | 26 (24.3%) | 34 (65.4%) |
Disability Class by Sex by Age in Holiday Valley
Disability Class: Hearing Difficulty
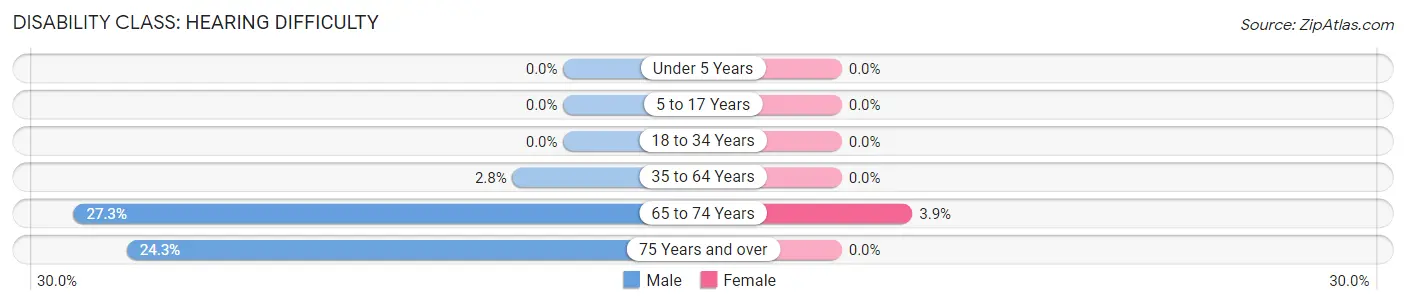
| Age Bracket | Male | Female |
| Under 5 Years | 0 (0.0%) | 0 (0.0%) |
| 5 to 17 Years | 0 (0.0%) | 0 (0.0%) |
| 18 to 34 Years | 0 (0.0%) | 0 (0.0%) |
| 35 to 64 Years | 8 (2.8%) | 0 (0.0%) |
| 65 to 74 Years | 36 (27.3%) | 9 (3.9%) |
| 75 Years and over | 26 (24.3%) | 0 (0.0%) |
Disability Class: Vision Difficulty
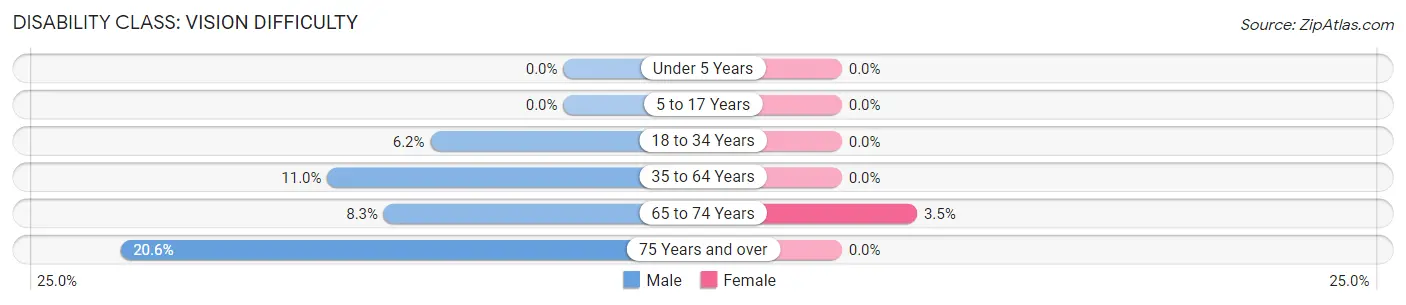
| Age Bracket | Male | Female |
| Under 5 Years | 0 (0.0%) | 0 (0.0%) |
| 5 to 17 Years | 0 (0.0%) | 0 (0.0%) |
| 18 to 34 Years | 5 (6.2%) | 0 (0.0%) |
| 35 to 64 Years | 31 (11.0%) | 0 (0.0%) |
| 65 to 74 Years | 11 (8.3%) | 8 (3.5%) |
| 75 Years and over | 22 (20.6%) | 0 (0.0%) |
Disability Class: Cognitive Difficulty
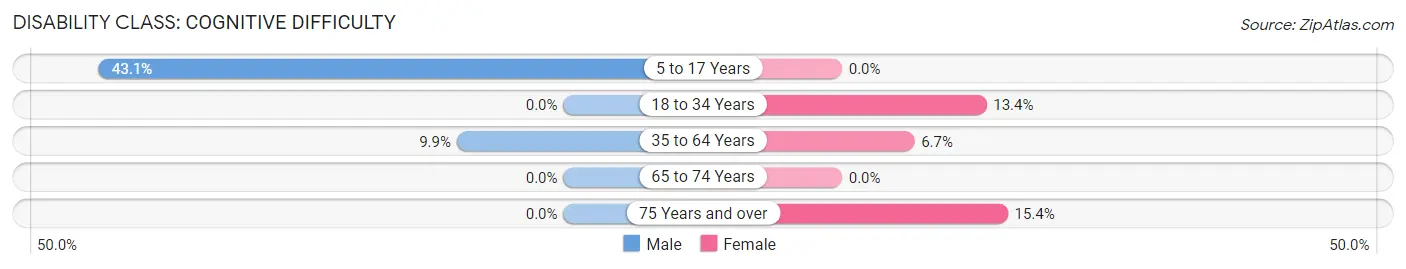
| Age Bracket | Male | Female |
| 5 to 17 Years | 25 (43.1%) | 0 (0.0%) |
| 18 to 34 Years | 0 (0.0%) | 11 (13.4%) |
| 35 to 64 Years | 28 (9.9%) | 17 (6.7%) |
| 65 to 74 Years | 0 (0.0%) | 0 (0.0%) |
| 75 Years and over | 0 (0.0%) | 8 (15.4%) |
Disability Class: Ambulatory Difficulty
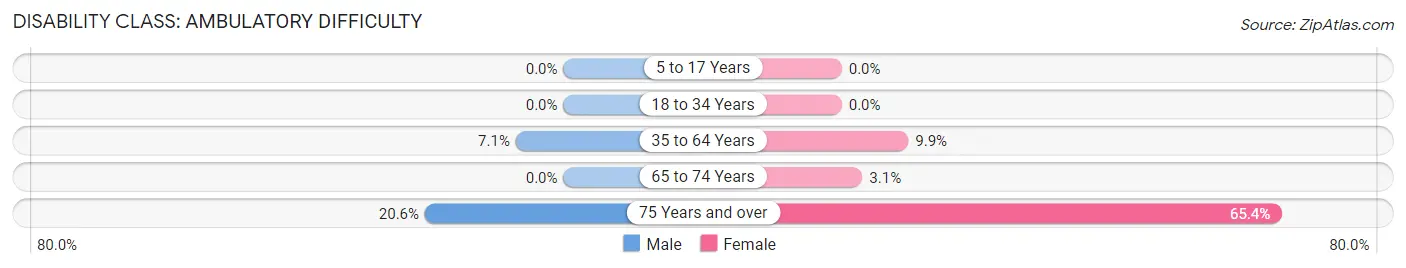
| Age Bracket | Male | Female |
| 5 to 17 Years | 0 (0.0%) | 0 (0.0%) |
| 18 to 34 Years | 0 (0.0%) | 0 (0.0%) |
| 35 to 64 Years | 20 (7.1%) | 25 (9.9%) |
| 65 to 74 Years | 0 (0.0%) | 7 (3.1%) |
| 75 Years and over | 22 (20.6%) | 34 (65.4%) |
Disability Class: Self-Care Difficulty
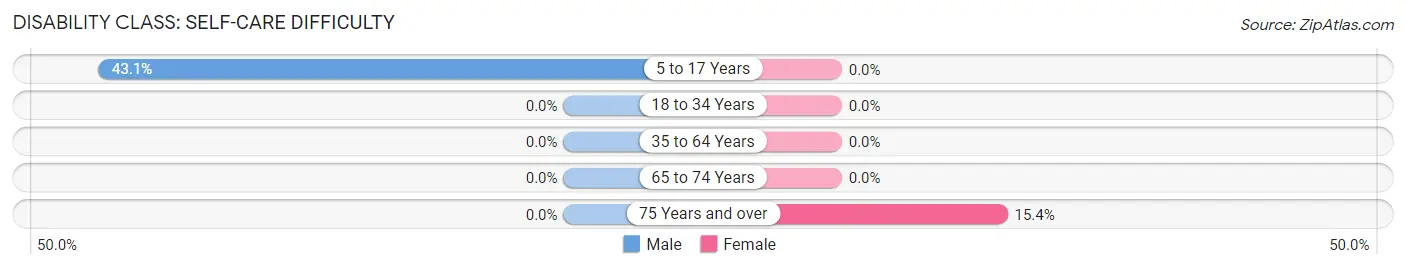
| Age Bracket | Male | Female |
| 5 to 17 Years | 25 (43.1%) | 0 (0.0%) |
| 18 to 34 Years | 0 (0.0%) | 0 (0.0%) |
| 35 to 64 Years | 0 (0.0%) | 0 (0.0%) |
| 65 to 74 Years | 0 (0.0%) | 0 (0.0%) |
| 75 Years and over | 0 (0.0%) | 8 (15.4%) |
Technology Access in Holiday Valley
Computing Device Access in Holiday Valley
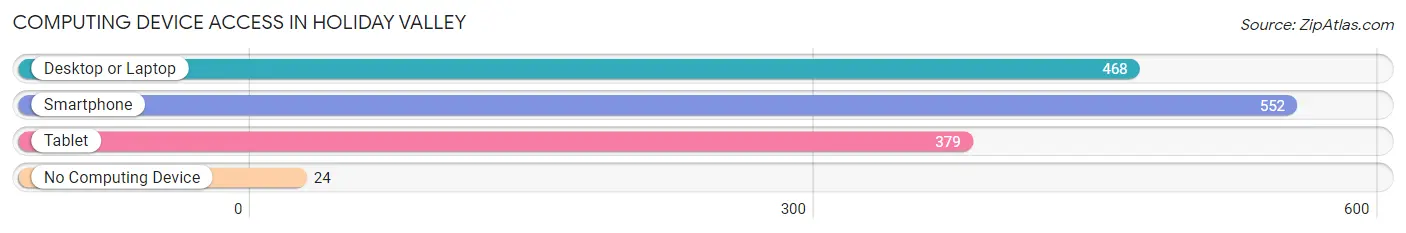
| Device Type | # Households | % Households |
| Desktop or Laptop | 468 | 75.8% |
| Smartphone | 552 | 89.5% |
| Tablet | 379 | 61.4% |
| No Computing Device | 24 | 3.9% |
| Total | 617 | 100.0% |
Internet Access in Holiday Valley
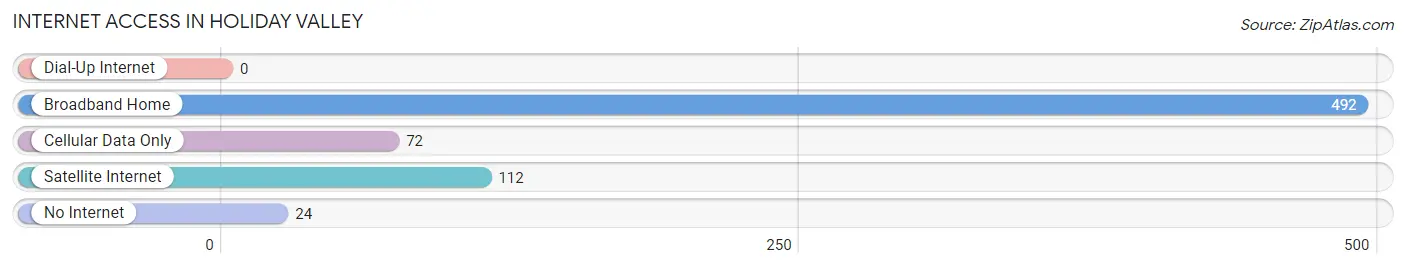
| Internet Type | # Households | % Households |
| Dial-Up Internet | 0 | 0.0% |
| Broadband Home | 492 | 79.7% |
| Cellular Data Only | 72 | 11.7% |
| Satellite Internet | 112 | 18.1% |
| No Internet | 24 | 3.9% |
| Total | 617 | 100.0% |
Holiday Valley Summary
Holiday Valley is a small village located in the state of Ohio, United States. It is situated in the southeastern corner of the state, near the border with West Virginia. The village is part of the larger Holiday Valley Township, which is located in the Appalachian foothills. The population of the village was estimated to be around 1,000 people in 2020.
History
Holiday Valley was founded in 1820 by a group of settlers from Pennsylvania. The village was originally known as “Holiday’s Valley”, named after the first settler, John Holiday. The village was initially a farming community, but it soon became a popular destination for tourists. In the late 19th century, the village was home to several resorts, including the Holiday Valley Hotel and the Holiday Valley Inn.
In the early 20th century, the village began to experience a decline in tourism due to the Great Depression. However, the village was able to remain a popular destination for outdoor recreation. In the 1950s, the village was home to several ski resorts, including the Holiday Valley Ski Resort. The resort was a popular destination for skiers and snowboarders from all over the country.
Geography
Holiday Valley is located in the Appalachian foothills of southeastern Ohio. The village is situated in the Holiday Valley Township, which is part of the larger Belmont County. The village is located at the intersection of State Route 7 and State Route 8. The village is surrounded by rolling hills and forests, making it a popular destination for outdoor recreation.
The village is located near several major cities, including Pittsburgh, Pennsylvania, and Columbus, Ohio. The nearest major airport is the Pittsburgh International Airport, which is located about an hour away.
Economy
The economy of Holiday Valley is largely based on tourism. The village is home to several ski resorts, including the Holiday Valley Ski Resort. The resort is a popular destination for skiers and snowboarders from all over the country. The village is also home to several restaurants, bars, and shops.
The village is also home to several manufacturing companies, including the Holiday Valley Manufacturing Company. The company produces a variety of products, including furniture, clothing, and toys.
Demographics
The population of Holiday Valley was estimated to be around 1,000 people in 2020. The village is predominantly white, with about 95% of the population identifying as Caucasian. The remaining 5% of the population is made up of African Americans, Hispanics, and other ethnicities.
The median household income in Holiday Valley is around $50,000. The village has a low unemployment rate, with only about 4% of the population being unemployed. The village also has a low poverty rate, with only about 5% of the population living below the poverty line.
Conclusion
Holiday Valley is a small village located in the southeastern corner of Ohio. The village is home to several ski resorts, restaurants, bars, and shops. The village is predominantly white, with a median household income of around $50,000. The village has a low unemployment rate and a low poverty rate. Holiday Valley is a popular destination for outdoor recreation and is a great place to visit for a weekend getaway.
Common Questions
What is the Total Population of Holiday Valley?
Total Population of Holiday Valley is 1,515.
What is the Total Male Population of Holiday Valley?
Total Male Population of Holiday Valley is 689.
What is the Total Female Population of Holiday Valley?
Total Female Population of Holiday Valley is 826.
What is the Ratio of Males per 100 Females in Holiday Valley?
There are 83.41 Males per 100 Females in Holiday Valley.
What is the Ratio of Females per 100 Males in Holiday Valley?
There are 119.88 Females per 100 Males in Holiday Valley.
What is the Median Population Age in Holiday Valley?
Median Population Age in Holiday Valley is 56.2 Years.
What is the Average Family Size in Holiday Valley
Average Family Size in Holiday Valley is 3.0 People.
What is the Average Household Size in Holiday Valley
Average Household Size in Holiday Valley is 2.3 People.
What is Per Capita Income in Holiday Valley?
Per Capita income in Holiday Valley is $36,260.
What is the Median Family Income in Holiday Valley?
Median Family Income in Holiday Valley is $96,063.
What is the Median Household income in Holiday Valley?
Median Household Income in Holiday Valley is $82,891.
What is Income or Wage Gap in Holiday Valley?
Income or Wage Gap in Holiday Valley is 14.6%.
Women in Holiday Valley earn 85.4 cents for every dollar earned by a man.
What is Inequality or Gini Index in Holiday Valley?
Inequality or Gini Index in Holiday Valley is 0.29.
How Large is the Labor Force in Holiday Valley?
There are 699 People in the Labor Forcein in Holiday Valley.
What is the Percentage of People in the Labor Force in Holiday Valley?
51.9% of People are in the Labor Force in Holiday Valley.
What is the Unemployment Rate in Holiday Valley?
Unemployment Rate in Holiday Valley is 4.9%.