Zip Codes with the Highest Percentage of Population Employed in Food Preparation & Serving in Mansfield, OH
RELATED REPORTS & OPTIONS
Food Preparation & Serving
Mansfield
Compare Zip Codes
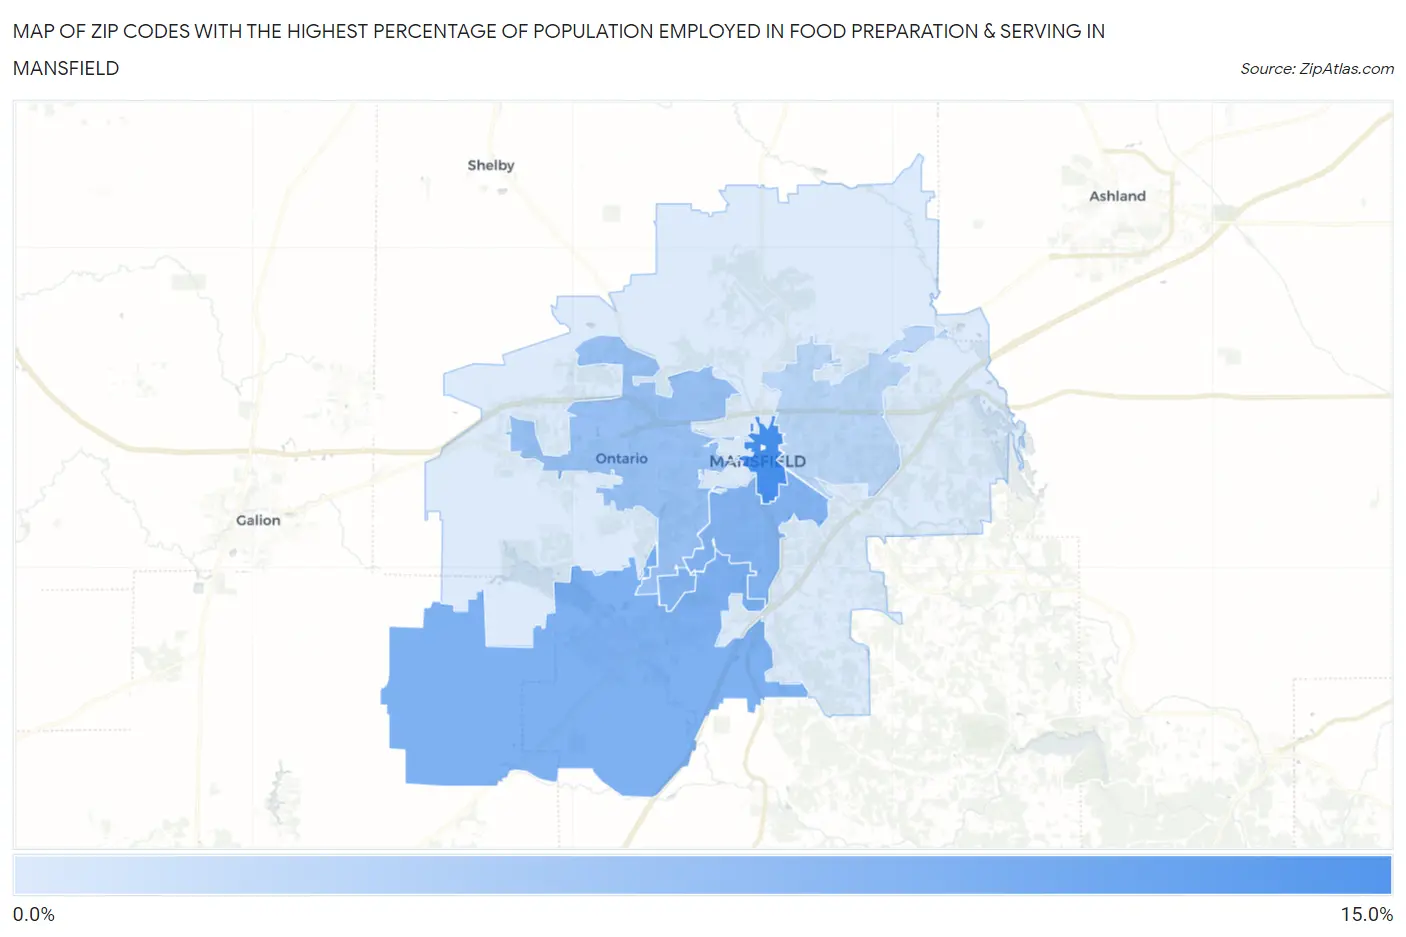
Map of Zip Codes with the Highest Percentage of Population Employed in Food Preparation & Serving in Mansfield
0.0%
15.0%
Zip Codes with the Highest Percentage of Population Employed in Food Preparation & Serving in Mansfield, OH
| Zip Code | % Employed | vs State | vs National | |
| 1. | 44902 | 11.2% | 5.6%(+5.57)#91 | 5.3%(+5.89)#1,971 |
| 2. | 44904 | 8.8% | 5.6%(+3.21)#173 | 5.3%(+3.53)#3,713 |
| 3. | 44907 | 8.6% | 5.6%(+2.97)#186 | 5.3%(+3.29)#3,993 |
| 4. | 44906 | 7.7% | 5.6%(+2.06)#240 | 5.3%(+2.38)#5,267 |
| 5. | 44905 | 6.2% | 5.6%(+0.600)#390 | 5.3%(+0.920)#8,710 |
| 6. | 44903 | 4.8% | 5.6%(-0.791)#602 | 5.3%(-0.471)#13,699 |
1
Common Questions
What are the Top 5 Zip Codes with the Highest Percentage of Population Employed in Food Preparation & Serving in Mansfield, OH?
Top 5 Zip Codes with the Highest Percentage of Population Employed in Food Preparation & Serving in Mansfield, OH are:
What zip code has the Highest Percentage of Population Employed in Food Preparation & Serving in Mansfield, OH?
44902 has the Highest Percentage of Population Employed in Food Preparation & Serving in Mansfield, OH with 11.2%.
What is the Percentage of Population Employed in Food Preparation & Serving in Mansfield, OH?
Percentage of Population Employed in Food Preparation & Serving in Mansfield is 9.1%.
What is the Percentage of Population Employed in Food Preparation & Serving in Ohio?
Percentage of Population Employed in Food Preparation & Serving in Ohio is 5.6%.
What is the Percentage of Population Employed in Food Preparation & Serving in the United States?
Percentage of Population Employed in Food Preparation & Serving in the United States is 5.3%.