Holloway, OH
Holloway Map
Holloway Overview
352
TOTAL POPULATION
195
MALE POPULATION
157
FEMALE POPULATION
124.20
MALES / 100 FEMALES
80.51
FEMALES / 100 MALES
35.1
MEDIAN AGE
3.6
AVG FAMILY SIZE
2.8
AVG HOUSEHOLD SIZE
$20,192
PER CAPITA INCOME
$52,344
AVG FAMILY INCOME
$51,154
AVG HOUSEHOLD INCOME
0.40
INEQUALITY / GINI INDEX
151
LABOR FORCE [ PEOPLE ]
58.8%
PERCENT IN LABOR FORCE
Holloway Zip Codes
Holloway Area Codes
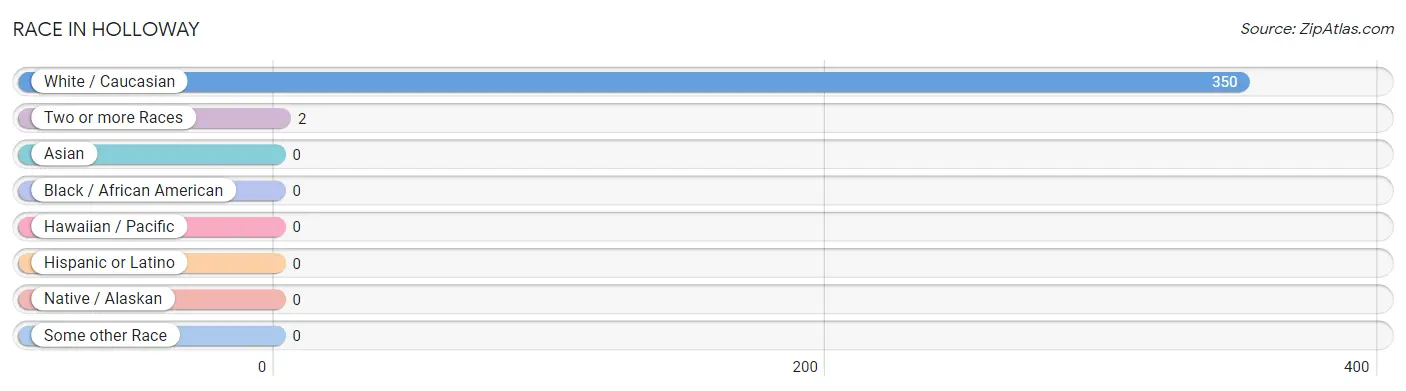
Race in Holloway
The most populous races in Holloway are White / Caucasian (350 | 99.4%), and Two or more Races (2 | 0.6%).
| Race | # Population | % Population |
| Asian | 0 | 0.0% |
| Black / African American | 0 | 0.0% |
| Hawaiian / Pacific | 0 | 0.0% |
| Hispanic or Latino | 0 | 0.0% |
| Native / Alaskan | 0 | 0.0% |
| White / Caucasian | 350 | 99.4% |
| Two or more Races | 2 | 0.6% |
| Some other Race | 0 | 0.0% |
| Total | 352 | 100.0% |
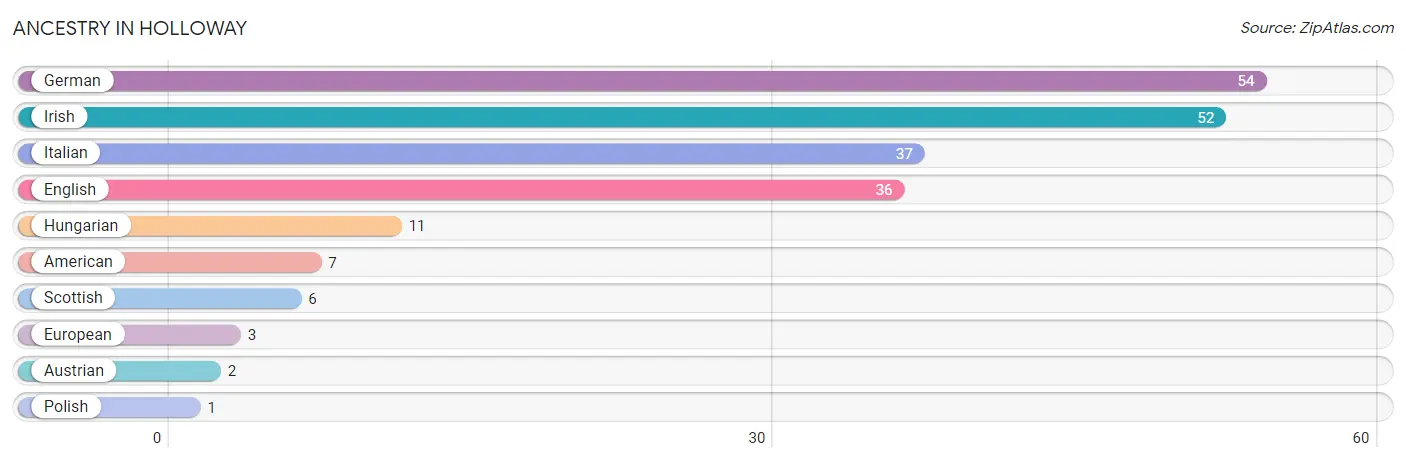
Ancestry in Holloway
The most populous ancestries reported in Holloway are German (54 | 15.3%), Irish (52 | 14.8%), Italian (37 | 10.5%), English (36 | 10.2%), and Hungarian (11 | 3.1%), together accounting for 54.0% of all Holloway residents.
| Ancestry | # Population | % Population |
| American | 7 | 2.0% |
| Austrian | 2 | 0.6% |
| English | 36 | 10.2% |
| European | 3 | 0.9% |
| German | 54 | 15.3% |
| Hungarian | 11 | 3.1% |
| Irish | 52 | 14.8% |
| Italian | 37 | 10.5% |
| Polish | 1 | 0.3% |
| Scottish | 6 | 1.7% | View All 10 Rows |
Immigrants in Holloway

| Immigration Origin | # Population | % Population | View All 0 Rows |
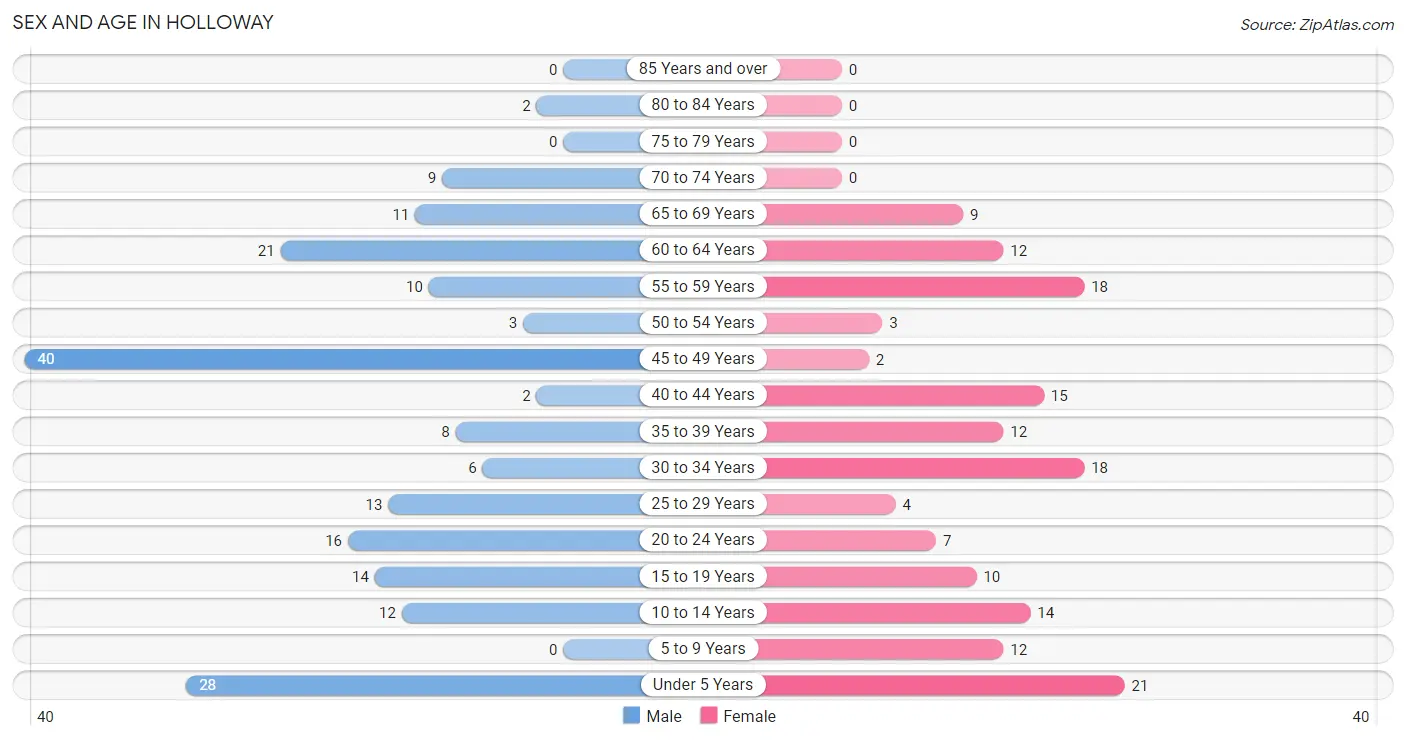
Sex and Age in Holloway
Sex and Age in Holloway
The most populous age groups in Holloway are 45 to 49 Years (40 | 20.5%) for men and Under 5 Years (21 | 13.4%) for women.
| Age Bracket | Male | Female |
| Under 5 Years | 28 (14.4%) | 21 (13.4%) |
| 5 to 9 Years | 0 (0.0%) | 12 (7.6%) |
| 10 to 14 Years | 12 (6.1%) | 14 (8.9%) |
| 15 to 19 Years | 14 (7.2%) | 10 (6.4%) |
| 20 to 24 Years | 16 (8.2%) | 7 (4.5%) |
| 25 to 29 Years | 13 (6.7%) | 4 (2.5%) |
| 30 to 34 Years | 6 (3.1%) | 18 (11.5%) |
| 35 to 39 Years | 8 (4.1%) | 12 (7.6%) |
| 40 to 44 Years | 2 (1.0%) | 15 (9.6%) |
| 45 to 49 Years | 40 (20.5%) | 2 (1.3%) |
| 50 to 54 Years | 3 (1.5%) | 3 (1.9%) |
| 55 to 59 Years | 10 (5.1%) | 18 (11.5%) |
| 60 to 64 Years | 21 (10.8%) | 12 (7.6%) |
| 65 to 69 Years | 11 (5.6%) | 9 (5.7%) |
| 70 to 74 Years | 9 (4.6%) | 0 (0.0%) |
| 75 to 79 Years | 0 (0.0%) | 0 (0.0%) |
| 80 to 84 Years | 2 (1.0%) | 0 (0.0%) |
| 85 Years and over | 0 (0.0%) | 0 (0.0%) |
| Total | 195 (100.0%) | 157 (100.0%) |
Families and Households in Holloway
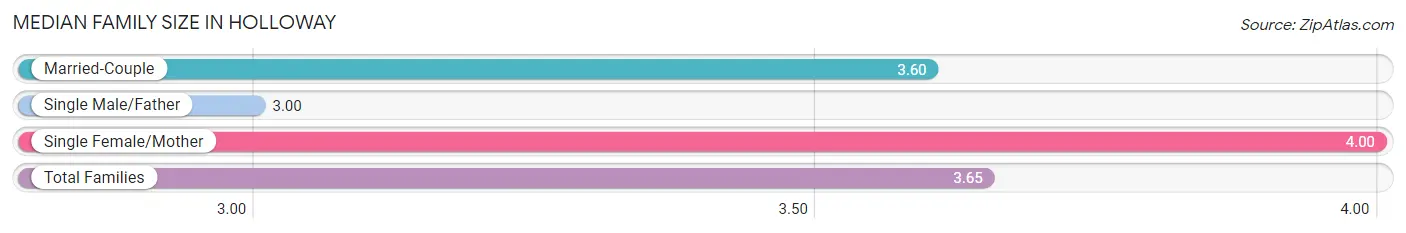
Median Family Size in Holloway
The median family size in Holloway is 3.65 persons per family, with single female/mother families (12 | 15.2%) accounting for the largest median family size of 4 persons per family. On the other hand, single male/father families (2 | 2.5%) represent the smallest median family size with 3.00 persons per family.
| Family Type | # Families | Family Size |
| Married-Couple | 65 (82.3%) | 3.60 |
| Single Male/Father | 2 (2.5%) | 3.00 |
| Single Female/Mother | 12 (15.2%) | 4.00 |
| Total Families | 79 (100.0%) | 3.65 |
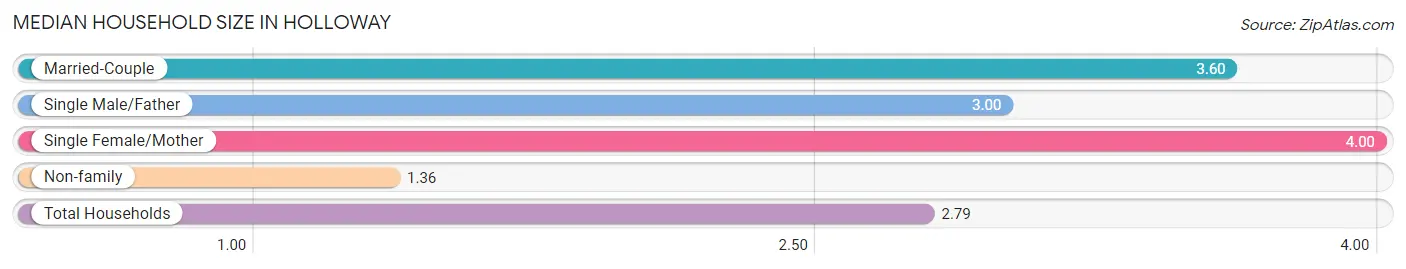
Median Household Size in Holloway
The median household size in Holloway is 2.79 persons per household, with single female/mother households (12 | 9.5%) accounting for the largest median household size of 4 persons per household. non-family households (47 | 37.3%) represent the smallest median household size with 1.36 persons per household.
| Household Type | # Households | Household Size |
| Married-Couple | 65 (51.6%) | 3.60 |
| Single Male/Father | 2 (1.6%) | 3.00 |
| Single Female/Mother | 12 (9.5%) | 4.00 |
| Non-family | 47 (37.3%) | 1.36 |
| Total Households | 126 (100.0%) | 2.79 |
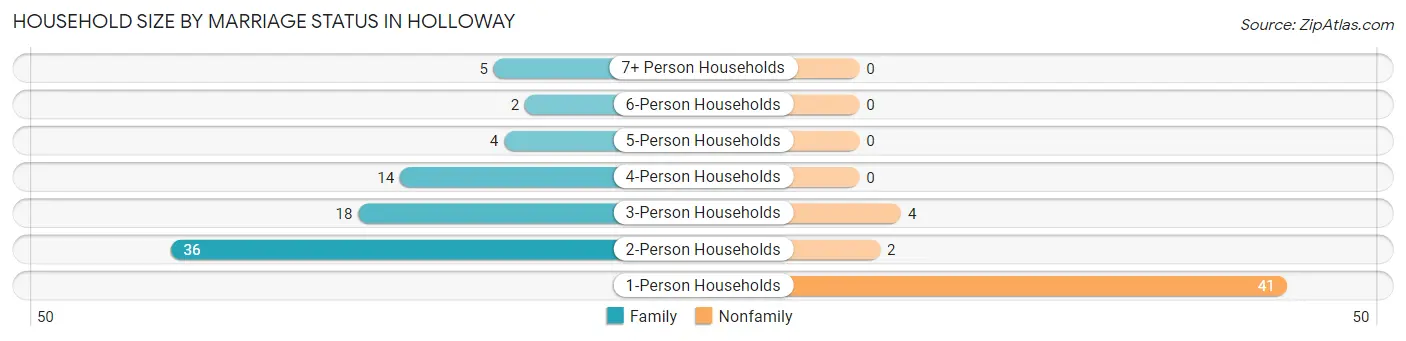
Household Size by Marriage Status in Holloway
Out of a total of 126 households in Holloway, 79 (62.7%) are family households, while 47 (37.3%) are nonfamily households. The most numerous type of family households are 2-person households, comprising 36, and the most common type of nonfamily households are 1-person households, comprising 41.
| Household Size | Family Households | Nonfamily Households |
| 1-Person Households | - | 41 (32.5%) |
| 2-Person Households | 36 (28.6%) | 2 (1.6%) |
| 3-Person Households | 18 (14.3%) | 4 (3.2%) |
| 4-Person Households | 14 (11.1%) | 0 (0.0%) |
| 5-Person Households | 4 (3.2%) | 0 (0.0%) |
| 6-Person Households | 2 (1.6%) | 0 (0.0%) |
| 7+ Person Households | 5 (4.0%) | 0 (0.0%) |
| Total | 79 (62.7%) | 47 (37.3%) |
Female Fertility in Holloway
Fertility by Age in Holloway
| Age Bracket | Women with Births | Births / 1,000 Women |
| 15 to 19 years | 0 (0.0%) | 0.0 |
| 20 to 34 years | 0 (0.0%) | 0.0 |
| 35 to 50 years | 0 (0.0%) | 0.0 |
| Total | 0 (0.0%) | 0.0 |
Fertility by Age by Marriage Status in Holloway
| Age Bracket | Married | Unmarried |
| 15 to 19 years | 0 (0.0%) | 0 (0.0%) |
| 20 to 34 years | 0 (0.0%) | 0 (0.0%) |
| 35 to 50 years | 0 (0.0%) | 0 (0.0%) |
| Total | 0 (0.0%) | 0 (0.0%) |
Fertility by Education in Holloway
| Educational Attainment | Women with Births | Births / 1,000 Women |
| Less than High School | 0 (0.0%) | 0.0 |
| High School Diploma | 0 (0.0%) | 0.0 |
| College or Associate's Degree | 0 (0.0%) | 0.0 |
| Bachelor's Degree | 0 (0.0%) | 0.0 |
| Graduate Degree | 0 (0.0%) | 0.0 |
| Total | 0 (0.0%) | 0.0 |
Fertility by Education by Marriage Status in Holloway
| Educational Attainment | Married | Unmarried |
| Less than High School | 0 (0.0%) | 0 (0.0%) |
| High School Diploma | 0 (0.0%) | 0 (0.0%) |
| College or Associate's Degree | 0 (0.0%) | 0 (0.0%) |
| Bachelor's Degree | 0 (0.0%) | 0 (0.0%) |
| Graduate Degree | 0 (0.0%) | 0 (0.0%) |
| Total | 0 (0.0%) | 0 (0.0%) |
Income in Holloway
Income Overview in Holloway
Per Capita Income in Holloway is $20,192, while median incomes of families and households are $52,344 and $51,154 respectively.
| Characteristic | Number | Measure |
| Per Capita Income | 352 | $20,192 |
| Median Family Income | 79 | $52,344 |
| Mean Family Income | 79 | $57,628 |
| Median Household Income | 126 | $51,154 |
| Mean Household Income | 126 | $51,127 |
| Income Deficit | 79 | $0 |
| Wage / Income Gap (%) | 352 | 0.00% |
| Wage / Income Gap ($) | 352 | 100.00¢ per $1 |
| Gini / Inequality Index | 352 | 0.40 |
Earnings by Sex in Holloway
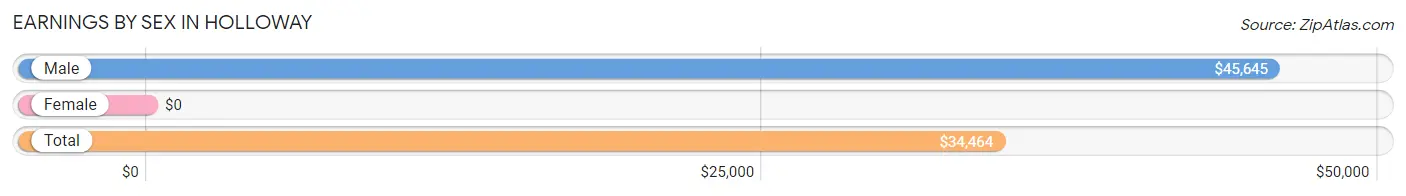
| Sex | Number | Average Earnings |
| Male | 116 (67.8%) | $45,645 |
| Female | 55 (32.2%) | $0 |
| Total | 171 (100.0%) | $34,464 |
Earnings by Sex by Income Bracket in Holloway
The most common earnings brackets in Holloway are $45,000 to $49,999 for men (33 | 28.4%) and $7,500 to $9,999 for women (18 | 32.7%).
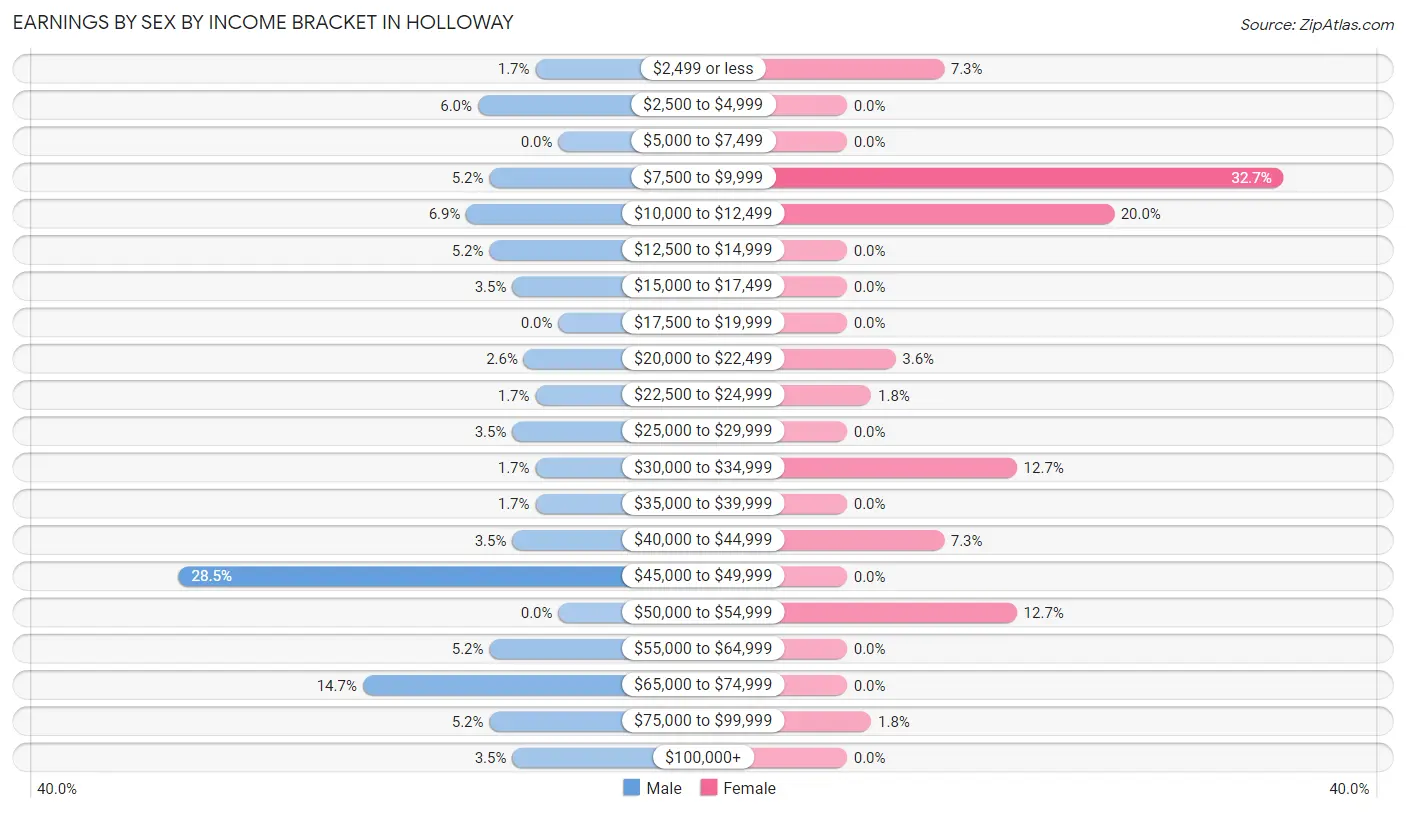
| Income | Male | Female |
| $2,499 or less | 2 (1.7%) | 4 (7.3%) |
| $2,500 to $4,999 | 7 (6.0%) | 0 (0.0%) |
| $5,000 to $7,499 | 0 (0.0%) | 0 (0.0%) |
| $7,500 to $9,999 | 6 (5.2%) | 18 (32.7%) |
| $10,000 to $12,499 | 8 (6.9%) | 11 (20.0%) |
| $12,500 to $14,999 | 6 (5.2%) | 0 (0.0%) |
| $15,000 to $17,499 | 4 (3.5%) | 0 (0.0%) |
| $17,500 to $19,999 | 0 (0.0%) | 0 (0.0%) |
| $20,000 to $22,499 | 3 (2.6%) | 2 (3.6%) |
| $22,500 to $24,999 | 2 (1.7%) | 1 (1.8%) |
| $25,000 to $29,999 | 4 (3.5%) | 0 (0.0%) |
| $30,000 to $34,999 | 2 (1.7%) | 7 (12.7%) |
| $35,000 to $39,999 | 2 (1.7%) | 0 (0.0%) |
| $40,000 to $44,999 | 4 (3.5%) | 4 (7.3%) |
| $45,000 to $49,999 | 33 (28.4%) | 0 (0.0%) |
| $50,000 to $54,999 | 0 (0.0%) | 7 (12.7%) |
| $55,000 to $64,999 | 6 (5.2%) | 0 (0.0%) |
| $65,000 to $74,999 | 17 (14.7%) | 0 (0.0%) |
| $75,000 to $99,999 | 6 (5.2%) | 1 (1.8%) |
| $100,000+ | 4 (3.5%) | 0 (0.0%) |
| Total | 116 (100.0%) | 55 (100.0%) |
Earnings by Sex by Educational Attainment in Holloway
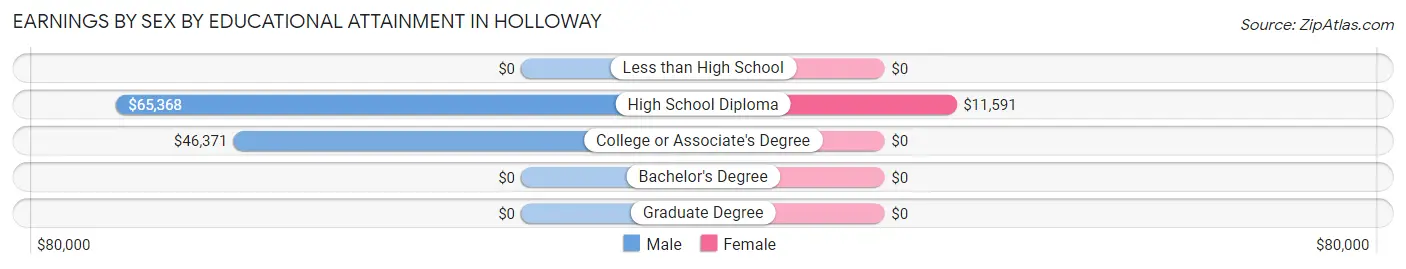
| Educational Attainment | Male Income | Female Income |
| Less than High School | - | - |
| High School Diploma | $65,368 | $11,591 |
| College or Associate's Degree | $46,371 | $0 |
| Bachelor's Degree | - | - |
| Graduate Degree | - | - |
| Total | $46,694 | $0 |
Family Income in Holloway
Family Income Brackets in Holloway
According to the Holloway family income data, there are 22 families falling into the $50,000 to $74,999 income range, which is the most common income bracket and makes up 27.9% of all families.
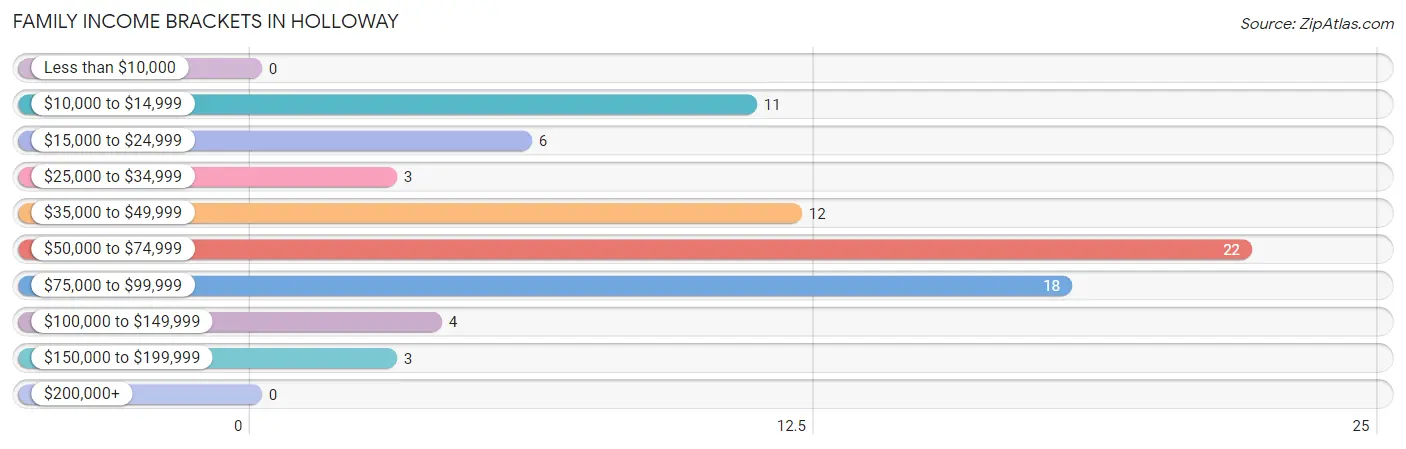
| Income Bracket | # Families | % Families |
| Less than $10,000 | 0 | 0.0% |
| $10,000 to $14,999 | 11 | 13.9% |
| $15,000 to $24,999 | 6 | 7.6% |
| $25,000 to $34,999 | 3 | 3.8% |
| $35,000 to $49,999 | 12 | 15.2% |
| $50,000 to $74,999 | 22 | 27.8% |
| $75,000 to $99,999 | 18 | 22.8% |
| $100,000 to $149,999 | 4 | 5.1% |
| $150,000 to $199,999 | 3 | 3.8% |
| $200,000+ | 0 | 0.0% |
Family Income by Famaliy Size in Holloway
2-person families (36 | 45.6%) account for the highest median family income in Holloway with $53,077 per family, while 2-person families (36 | 45.6%) have the highest median income of $26,538 per family member.
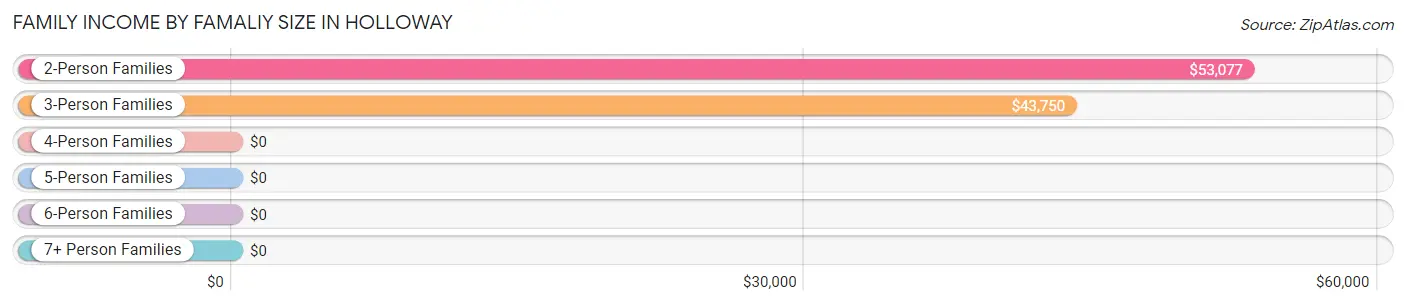
| Income Bracket | # Families | Median Income |
| 2-Person Families | 36 (45.6%) | $53,077 |
| 3-Person Families | 18 (22.8%) | $43,750 |
| 4-Person Families | 14 (17.7%) | $0 |
| 5-Person Families | 4 (5.1%) | $0 |
| 6-Person Families | 2 (2.5%) | $0 |
| 7+ Person Families | 5 (6.3%) | $0 |
| Total | 79 (100.0%) | $52,344 |
Family Income by Number of Earners in Holloway
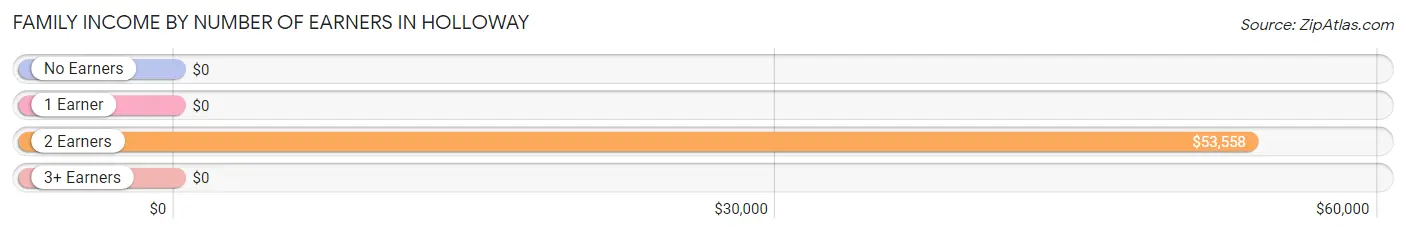
| Number of Earners | # Families | Median Income |
| No Earners | 11 (13.9%) | $0 |
| 1 Earner | 17 (21.5%) | $0 |
| 2 Earners | 49 (62.0%) | $53,558 |
| 3+ Earners | 2 (2.5%) | $0 |
| Total | 79 (100.0%) | $52,344 |
Household Income in Holloway
Household Income Brackets in Holloway
With 33 households falling in the category, the $75,000 to $99,999 income range is the most frequent in Holloway, accounting for 26.2% of all households.
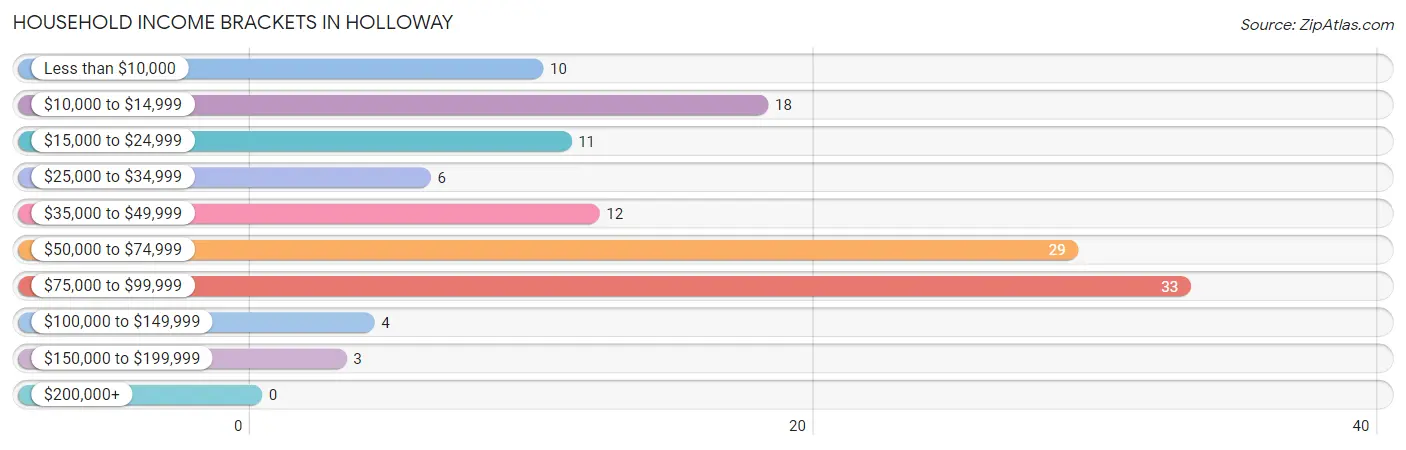
| Income Bracket | # Households | % Households |
| Less than $10,000 | 10 | 7.9% |
| $10,000 to $14,999 | 18 | 14.3% |
| $15,000 to $24,999 | 11 | 8.7% |
| $25,000 to $34,999 | 6 | 4.8% |
| $35,000 to $49,999 | 12 | 9.5% |
| $50,000 to $74,999 | 29 | 23.0% |
| $75,000 to $99,999 | 33 | 26.2% |
| $100,000 to $149,999 | 4 | 3.2% |
| $150,000 to $199,999 | 3 | 2.4% |
| $200,000+ | 0 | 0.0% |
Household Income by Householder Age in Holloway
The median household income in Holloway is $51,154, with the highest median household income of $82,574 found in the 45 to 64 years age bracket for the primary householder. A total of 63 households (50.0%) fall into this category. Meanwhile, the 15 to 24 years age bracket for the primary householder has the lowest median household income of $0, with 4 households (3.2%) in this group.
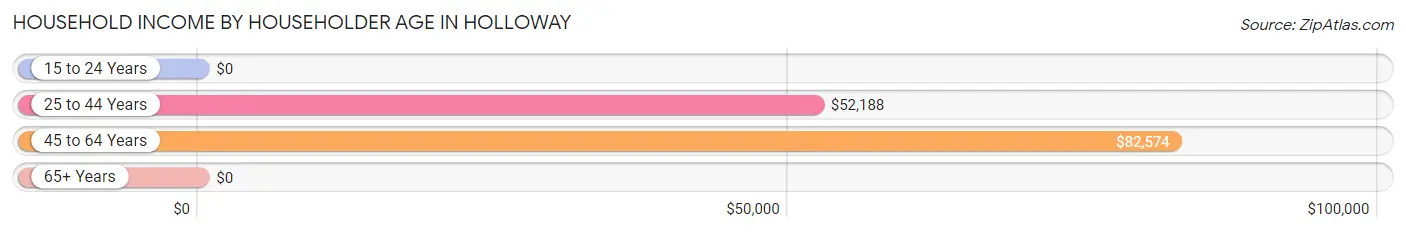
| Income Bracket | # Households | Median Income |
| 15 to 24 Years | 4 (3.2%) | $0 |
| 25 to 44 Years | 41 (32.5%) | $52,188 |
| 45 to 64 Years | 63 (50.0%) | $82,574 |
| 65+ Years | 18 (14.3%) | $0 |
| Total | 126 (100.0%) | $51,154 |
Poverty in Holloway
Income Below Poverty by Sex and Age in Holloway
With 30.3% poverty level for males and 47.1% for females among the residents of Holloway, 75 year old and over males and 15 year old females are the most vulnerable to poverty, with 2 males (100.0%) and 5 females (100.0%) in their respective age groups living below the poverty level.
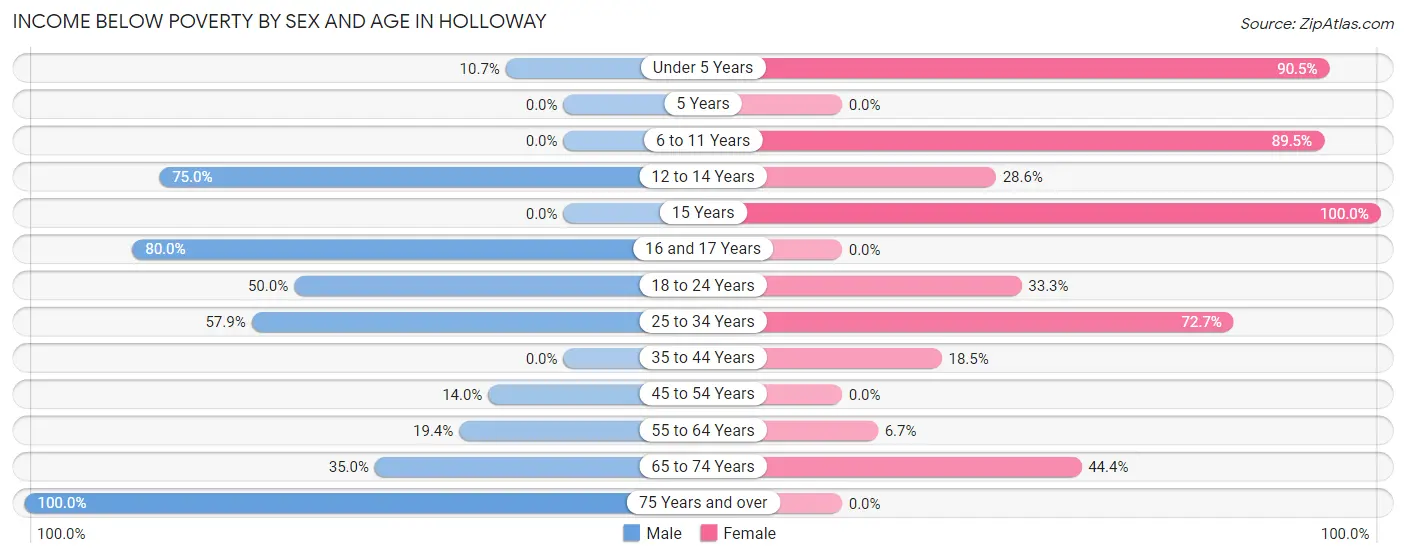
| Age Bracket | Male | Female |
| Under 5 Years | 3 (10.7%) | 19 (90.5%) |
| 5 Years | 0 (0.0%) | 0 (0.0%) |
| 6 to 11 Years | 0 (0.0%) | 17 (89.5%) |
| 12 to 14 Years | 9 (75.0%) | 2 (28.6%) |
| 15 Years | 0 (0.0%) | 5 (100.0%) |
| 16 and 17 Years | 4 (80.0%) | 0 (0.0%) |
| 18 to 24 Years | 11 (50.0%) | 4 (33.3%) |
| 25 to 34 Years | 11 (57.9%) | 16 (72.7%) |
| 35 to 44 Years | 0 (0.0%) | 5 (18.5%) |
| 45 to 54 Years | 6 (14.0%) | 0 (0.0%) |
| 55 to 64 Years | 6 (19.4%) | 2 (6.7%) |
| 65 to 74 Years | 7 (35.0%) | 4 (44.4%) |
| 75 Years and over | 2 (100.0%) | 0 (0.0%) |
| Total | 59 (30.3%) | 74 (47.1%) |
Income Above Poverty by Sex and Age in Holloway
According to the poverty statistics in Holloway, males aged 15 years and females aged 45 to 54 years are the age groups that are most secure financially, with 100.0% of males and 100.0% of females in these age groups living above the poverty line.
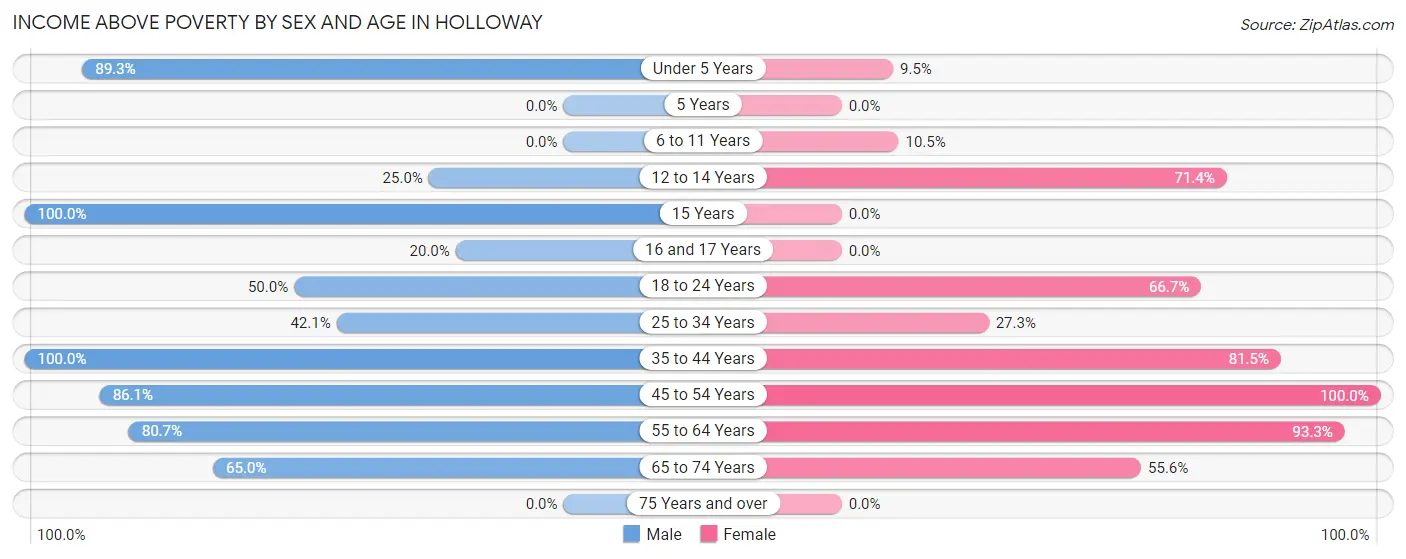
| Age Bracket | Male | Female |
| Under 5 Years | 25 (89.3%) | 2 (9.5%) |
| 5 Years | 0 (0.0%) | 0 (0.0%) |
| 6 to 11 Years | 0 (0.0%) | 2 (10.5%) |
| 12 to 14 Years | 3 (25.0%) | 5 (71.4%) |
| 15 Years | 3 (100.0%) | 0 (0.0%) |
| 16 and 17 Years | 1 (20.0%) | 0 (0.0%) |
| 18 to 24 Years | 11 (50.0%) | 8 (66.7%) |
| 25 to 34 Years | 8 (42.1%) | 6 (27.3%) |
| 35 to 44 Years | 10 (100.0%) | 22 (81.5%) |
| 45 to 54 Years | 37 (86.1%) | 5 (100.0%) |
| 55 to 64 Years | 25 (80.6%) | 28 (93.3%) |
| 65 to 74 Years | 13 (65.0%) | 5 (55.6%) |
| 75 Years and over | 0 (0.0%) | 0 (0.0%) |
| Total | 136 (69.7%) | 83 (52.9%) |
Income Below Poverty Among Married-Couple Families in Holloway
The poverty statistics for married-couple families in Holloway show that 26.2% or 17 of the total 65 families live below the poverty line. Families with 5 or more children have the highest poverty rate of 100.0%, comprising of 5 families. On the other hand, families with no children have the lowest poverty rate of 15.4%, which includes 6 families.
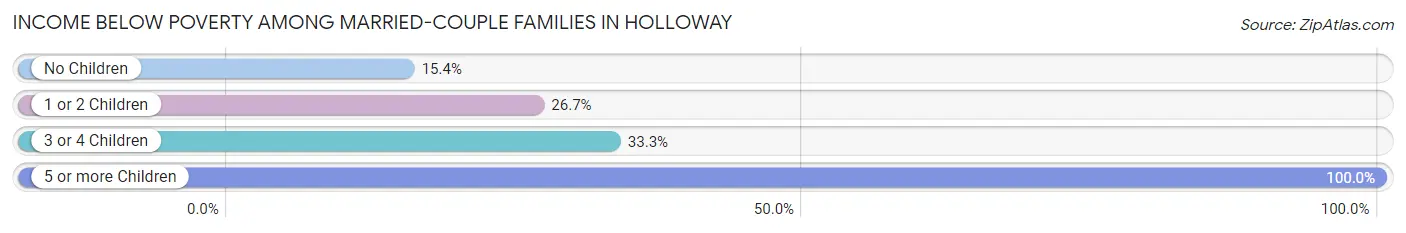
| Children | Above Poverty | Below Poverty |
| No Children | 33 (84.6%) | 6 (15.4%) |
| 1 or 2 Children | 11 (73.3%) | 4 (26.7%) |
| 3 or 4 Children | 4 (66.7%) | 2 (33.3%) |
| 5 or more Children | 0 (0.0%) | 5 (100.0%) |
| Total | 48 (73.9%) | 17 (26.2%) |
Income Below Poverty Among Single-Parent Households in Holloway
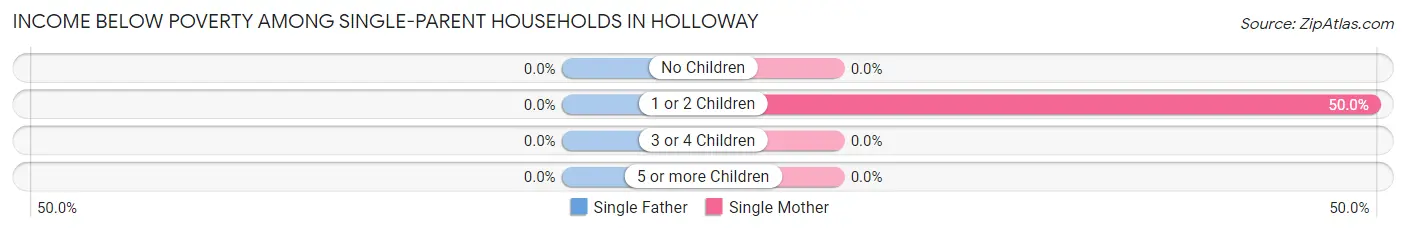
| Children | Single Father | Single Mother |
| No Children | 0 (0.0%) | 0 (0.0%) |
| 1 or 2 Children | 0 (0.0%) | 5 (50.0%) |
| 3 or 4 Children | 0 (0.0%) | 0 (0.0%) |
| 5 or more Children | 0 (0.0%) | 0 (0.0%) |
| Total | 0 (0.0%) | 5 (41.7%) |
Income Below Poverty Among Married-Couple vs Single-Parent Households in Holloway
The poverty data for Holloway shows that 17 of the married-couple family households (26.2%) and 5 of the single-parent households (35.7%) are living below the poverty level. Within the married-couple family households, those with 5 or more children have the highest poverty rate, with 5 households (100.0%) falling below the poverty line. Among the single-parent households, those with 1 or 2 children have the highest poverty rate, with 5 household (50.0%) living below poverty.
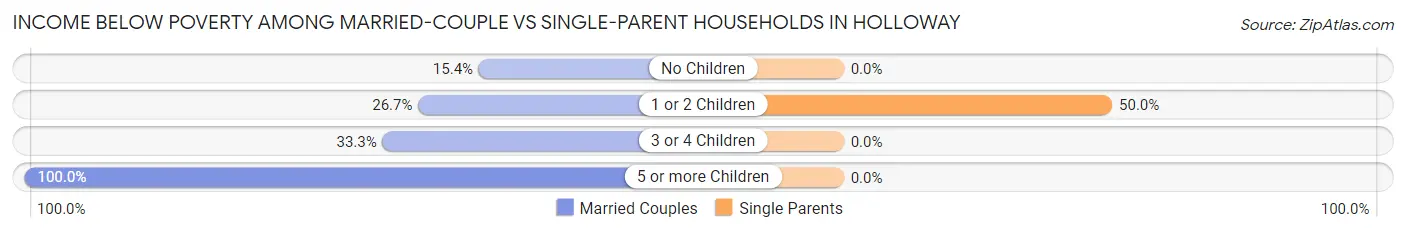
| Children | Married-Couple Families | Single-Parent Households |
| No Children | 6 (15.4%) | 0 (0.0%) |
| 1 or 2 Children | 4 (26.7%) | 5 (50.0%) |
| 3 or 4 Children | 2 (33.3%) | 0 (0.0%) |
| 5 or more Children | 5 (100.0%) | 0 (0.0%) |
| Total | 17 (26.2%) | 5 (35.7%) |
Employment Characteristics in Holloway
Employment by Class of Employer in Holloway
Among the 149 employed individuals in Holloway, private company employees (138 | 92.6%), state government employees (5 | 3.4%), and not-for-profit organizations (4 | 2.7%) make up the most common classes of employment.
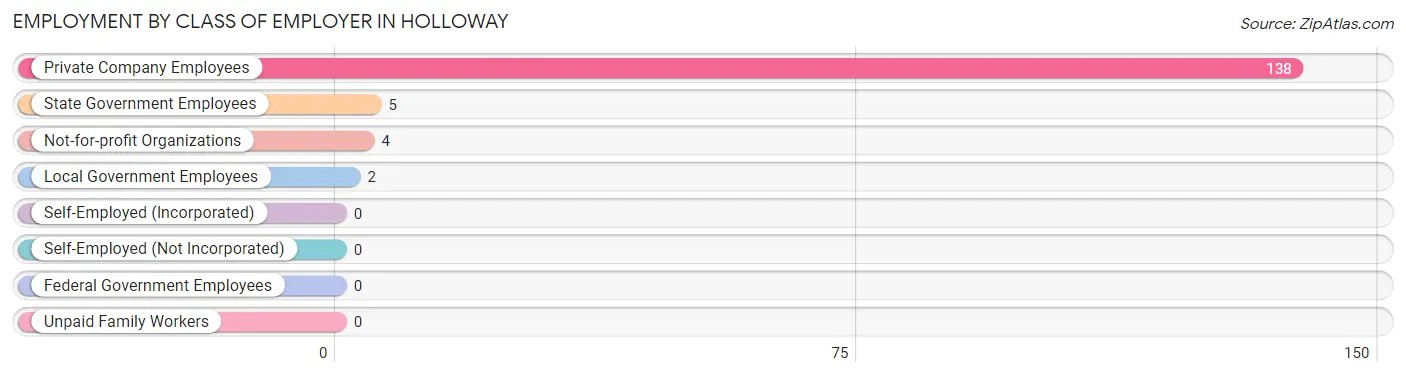
| Employer Class | # Employees | % Employees |
| Private Company Employees | 138 | 92.6% |
| Self-Employed (Incorporated) | 0 | 0.0% |
| Self-Employed (Not Incorporated) | 0 | 0.0% |
| Not-for-profit Organizations | 4 | 2.7% |
| Local Government Employees | 2 | 1.3% |
| State Government Employees | 5 | 3.4% |
| Federal Government Employees | 0 | 0.0% |
| Unpaid Family Workers | 0 | 0.0% |
| Total | 149 | 100.0% |
Employment Status by Age in Holloway
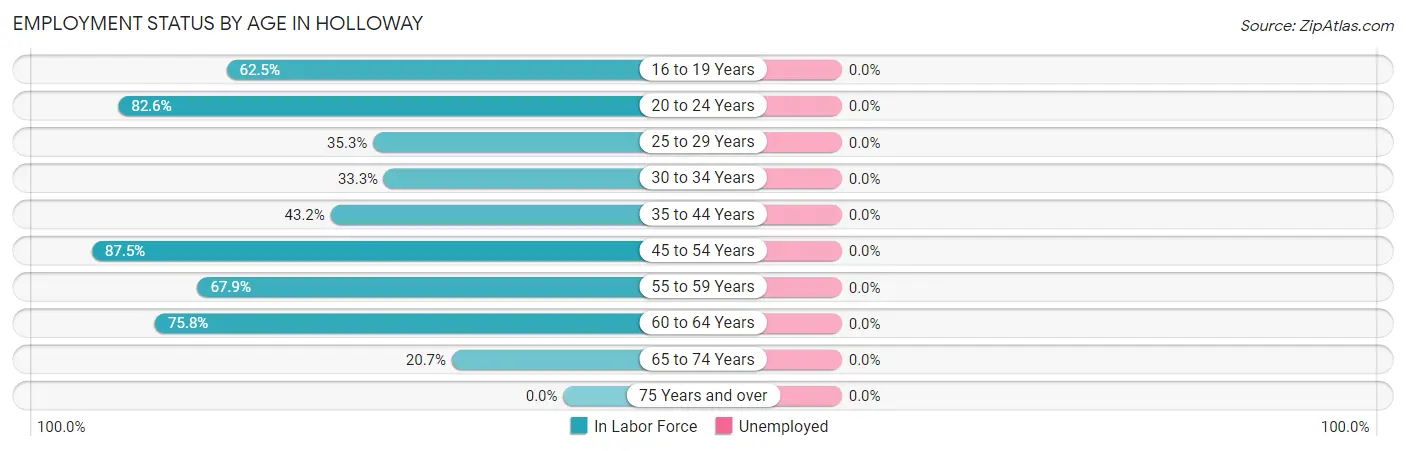
| Age Bracket | In Labor Force | Unemployed |
| 16 to 19 Years | 10 (62.5%) | 0 (0.0%) |
| 20 to 24 Years | 19 (82.6%) | 0 (0.0%) |
| 25 to 29 Years | 6 (35.3%) | 0 (0.0%) |
| 30 to 34 Years | 8 (33.3%) | 0 (0.0%) |
| 35 to 44 Years | 16 (43.2%) | 0 (0.0%) |
| 45 to 54 Years | 42 (87.5%) | 0 (0.0%) |
| 55 to 59 Years | 19 (67.9%) | 0 (0.0%) |
| 60 to 64 Years | 25 (75.8%) | 0 (0.0%) |
| 65 to 74 Years | 6 (20.7%) | 0 (0.0%) |
| 75 Years and over | 0 (0.0%) | 0 (0.0%) |
| Total | 151 (58.8%) | 0 (0.0%) |
Employment Status by Educational Attainment in Holloway
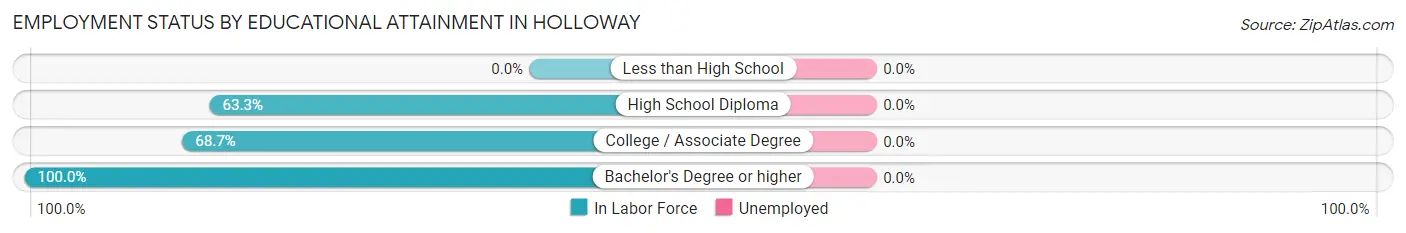
| Educational Attainment | In Labor Force | Unemployed |
| Less than High School | 0 (0.0%) | 0 (0.0%) |
| High School Diploma | 57 (63.3%) | 0 (0.0%) |
| College / Associate Degree | 57 (68.7%) | 0 (0.0%) |
| Bachelor's Degree or higher | 2 (100.0%) | 0 (0.0%) |
| Total | 116 (62.0%) | 0 (0.0%) |
Employment Occupations by Sex in Holloway
Management, Business, Science and Arts Occupations
The most common Management, Business, Science and Arts occupations in Holloway are Management (5 | 3.3%), Computers, Engineering & Science (4 | 2.6%), Architecture & Engineering (4 | 2.6%), Business & Financial (2 | 1.3%), and Community & Social Service (2 | 1.3%).
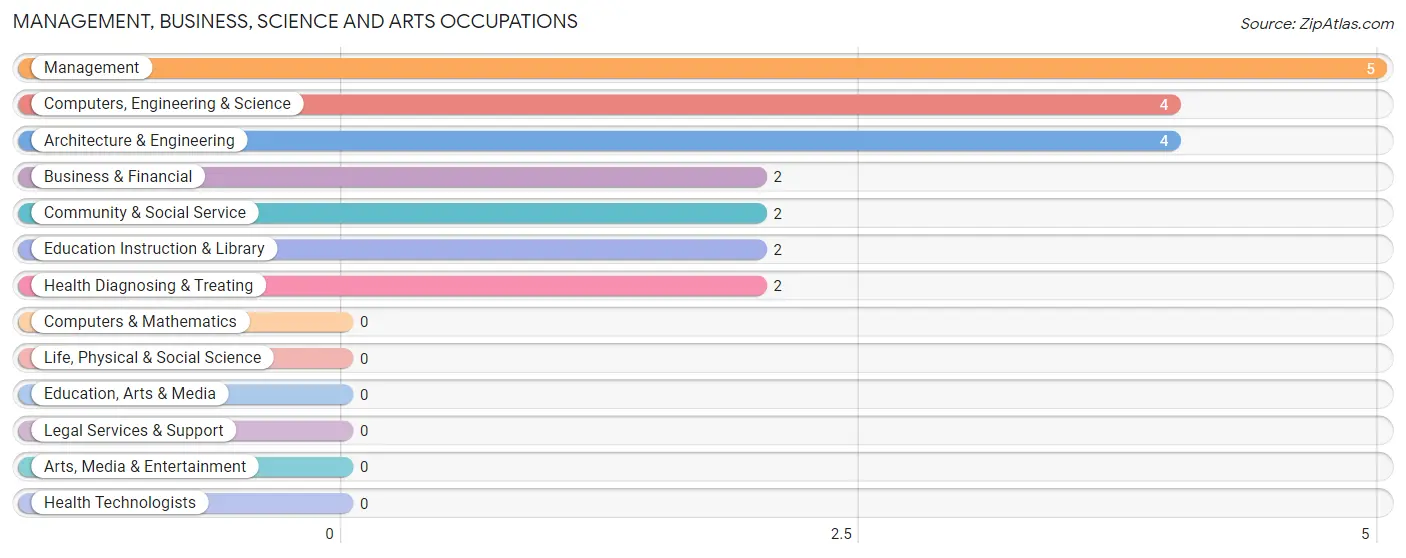
Management, Business, Science and Arts Occupations by Sex
Within the Management, Business, Science and Arts occupations in Holloway, the most male-oriented occupations are Computers, Engineering & Science (100.0%), Architecture & Engineering (100.0%), and Health Diagnosing & Treating (100.0%), while the most female-oriented occupations are Management (100.0%), Community & Social Service (100.0%), and Education Instruction & Library (100.0%).
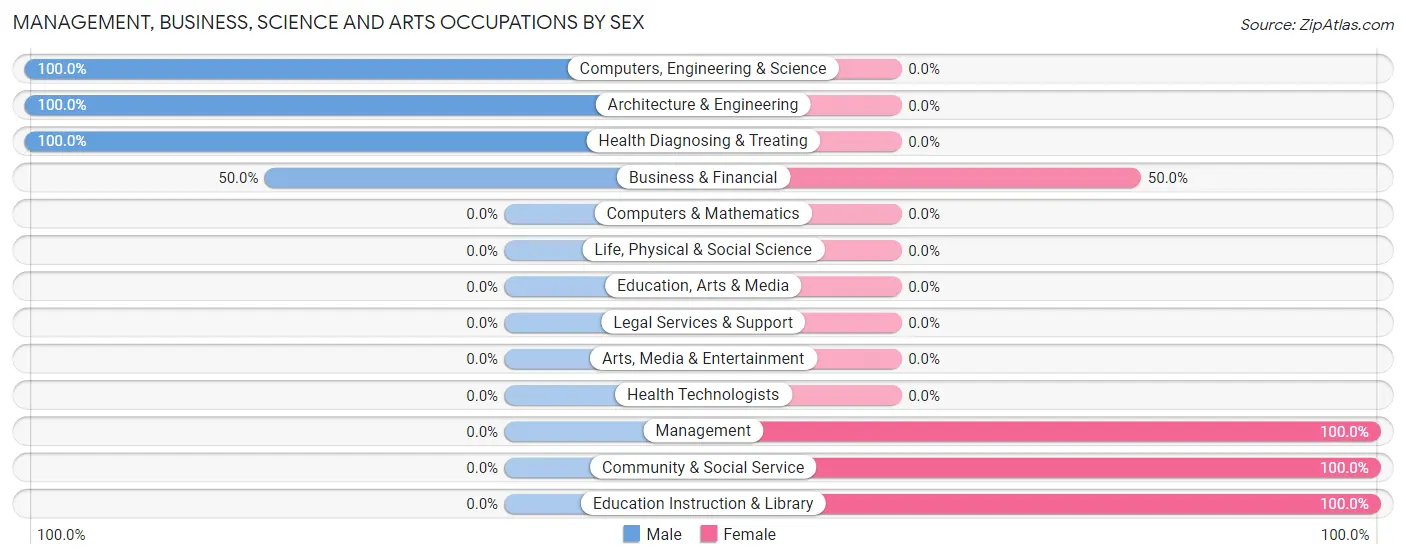
| Occupation | Male | Female |
| Management | 0 (0.0%) | 5 (100.0%) |
| Business & Financial | 1 (50.0%) | 1 (50.0%) |
| Computers, Engineering & Science | 4 (100.0%) | 0 (0.0%) |
| Computers & Mathematics | 0 (0.0%) | 0 (0.0%) |
| Architecture & Engineering | 4 (100.0%) | 0 (0.0%) |
| Life, Physical & Social Science | 0 (0.0%) | 0 (0.0%) |
| Community & Social Service | 0 (0.0%) | 2 (100.0%) |
| Education, Arts & Media | 0 (0.0%) | 0 (0.0%) |
| Legal Services & Support | 0 (0.0%) | 0 (0.0%) |
| Education Instruction & Library | 0 (0.0%) | 2 (100.0%) |
| Arts, Media & Entertainment | 0 (0.0%) | 0 (0.0%) |
| Health Diagnosing & Treating | 2 (100.0%) | 0 (0.0%) |
| Health Technologists | 0 (0.0%) | 0 (0.0%) |
| Total (Category) | 7 (46.7%) | 8 (53.3%) |
| Total (Overall) | 113 (74.8%) | 38 (25.2%) |
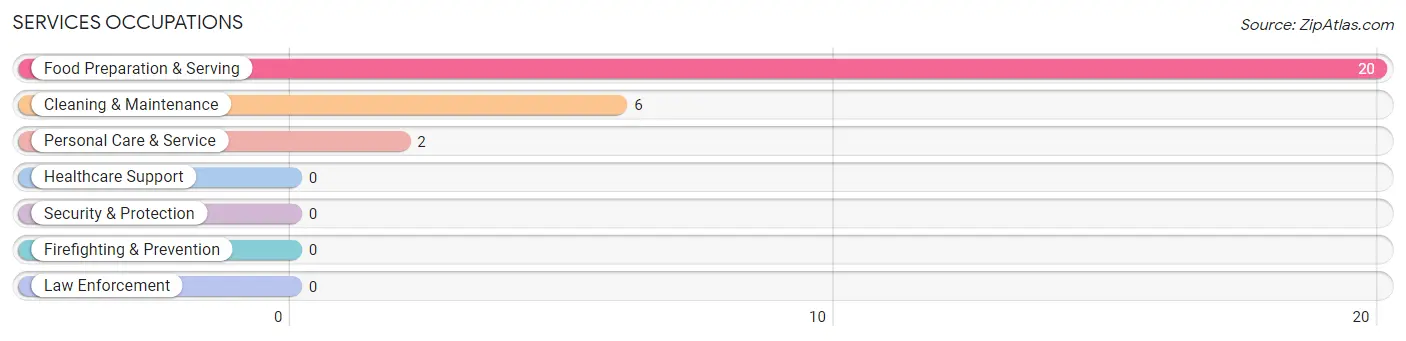
Services Occupations
The most common Services occupations in Holloway are Food Preparation & Serving (20 | 13.3%), Cleaning & Maintenance (6 | 4.0%), and Personal Care & Service (2 | 1.3%).
Services Occupations by Sex
Within the Services occupations in Holloway, the most male-oriented occupations are Cleaning & Maintenance (100.0%), and Food Preparation & Serving (75.0%), while the most female-oriented occupations are Personal Care & Service (100.0%), and Food Preparation & Serving (25.0%).
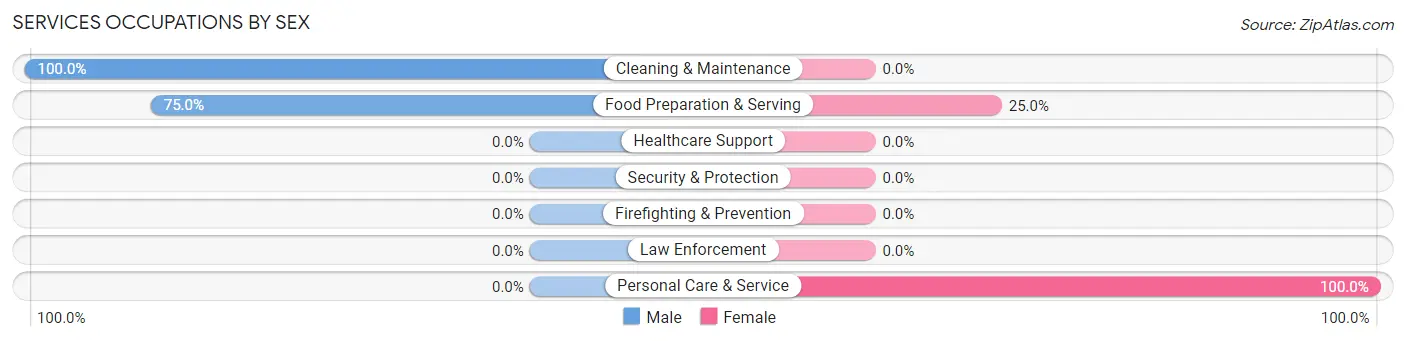
| Occupation | Male | Female |
| Healthcare Support | 0 (0.0%) | 0 (0.0%) |
| Security & Protection | 0 (0.0%) | 0 (0.0%) |
| Firefighting & Prevention | 0 (0.0%) | 0 (0.0%) |
| Law Enforcement | 0 (0.0%) | 0 (0.0%) |
| Food Preparation & Serving | 15 (75.0%) | 5 (25.0%) |
| Cleaning & Maintenance | 6 (100.0%) | 0 (0.0%) |
| Personal Care & Service | 0 (0.0%) | 2 (100.0%) |
| Total (Category) | 21 (75.0%) | 7 (25.0%) |
| Total (Overall) | 113 (74.8%) | 38 (25.2%) |
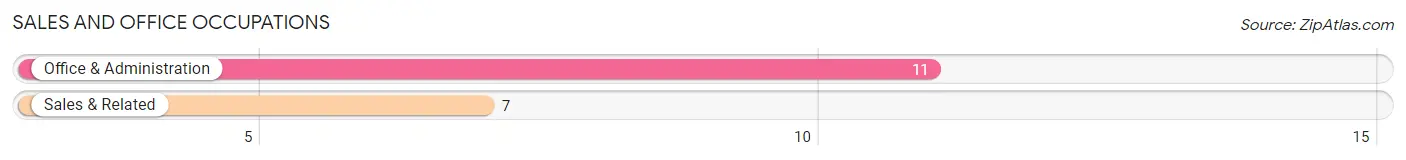
Sales and Office Occupations
The most common Sales and Office occupations in Holloway are Office & Administration (11 | 7.3%), and Sales & Related (7 | 4.6%).
Sales and Office Occupations by Sex
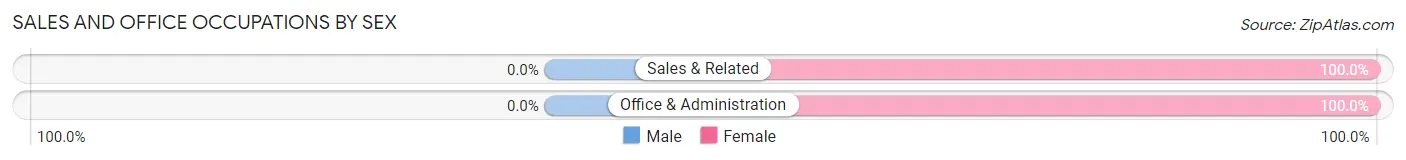
| Occupation | Male | Female |
| Sales & Related | 0 (0.0%) | 7 (100.0%) |
| Office & Administration | 0 (0.0%) | 11 (100.0%) |
| Total (Category) | 0 (0.0%) | 18 (100.0%) |
| Total (Overall) | 113 (74.8%) | 38 (25.2%) |
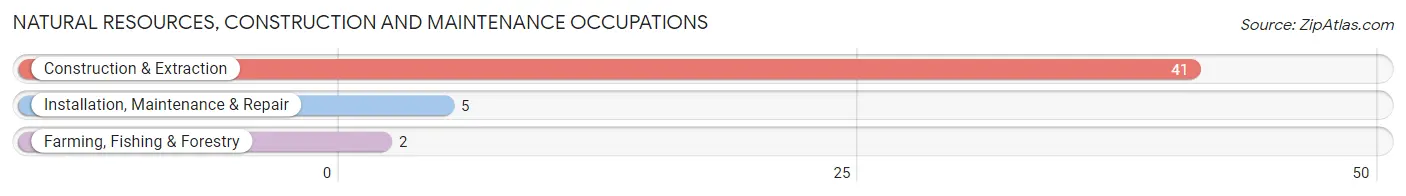
Natural Resources, Construction and Maintenance Occupations
The most common Natural Resources, Construction and Maintenance occupations in Holloway are Construction & Extraction (41 | 27.2%), Installation, Maintenance & Repair (5 | 3.3%), and Farming, Fishing & Forestry (2 | 1.3%).
Natural Resources, Construction and Maintenance Occupations by Sex
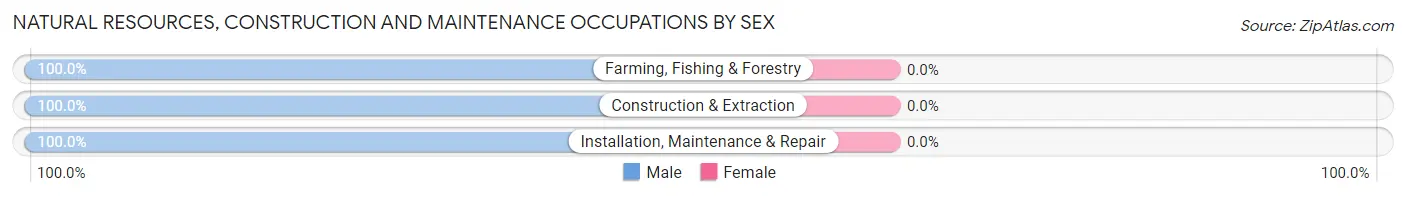
| Occupation | Male | Female |
| Farming, Fishing & Forestry | 2 (100.0%) | 0 (0.0%) |
| Construction & Extraction | 41 (100.0%) | 0 (0.0%) |
| Installation, Maintenance & Repair | 5 (100.0%) | 0 (0.0%) |
| Total (Category) | 48 (100.0%) | 0 (0.0%) |
| Total (Overall) | 113 (74.8%) | 38 (25.2%) |
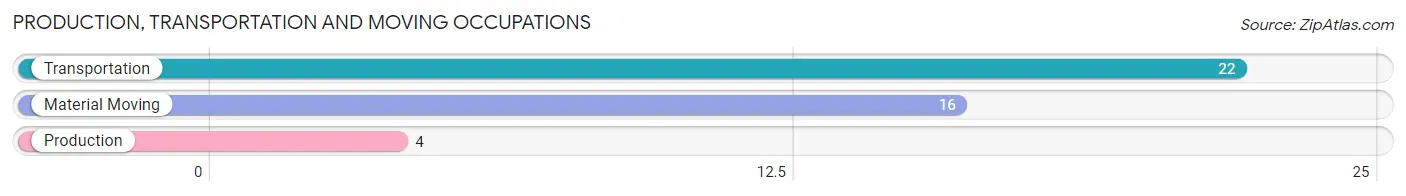
Production, Transportation and Moving Occupations
The most common Production, Transportation and Moving occupations in Holloway are Transportation (22 | 14.6%), Material Moving (16 | 10.6%), and Production (4 | 2.6%).
Production, Transportation and Moving Occupations by Sex
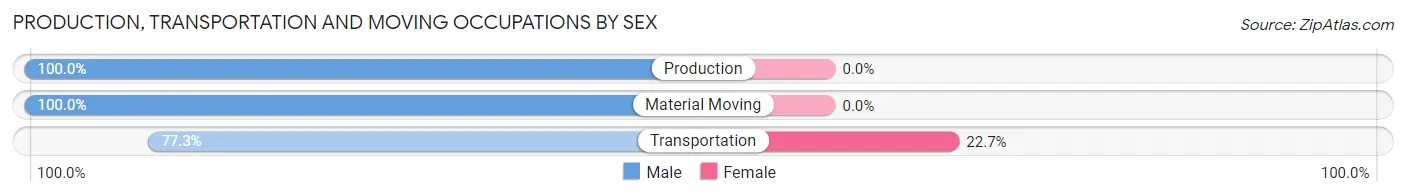
| Occupation | Male | Female |
| Production | 4 (100.0%) | 0 (0.0%) |
| Transportation | 17 (77.3%) | 5 (22.7%) |
| Material Moving | 16 (100.0%) | 0 (0.0%) |
| Total (Category) | 37 (88.1%) | 5 (11.9%) |
| Total (Overall) | 113 (74.8%) | 38 (25.2%) |
Employment Industries by Sex in Holloway
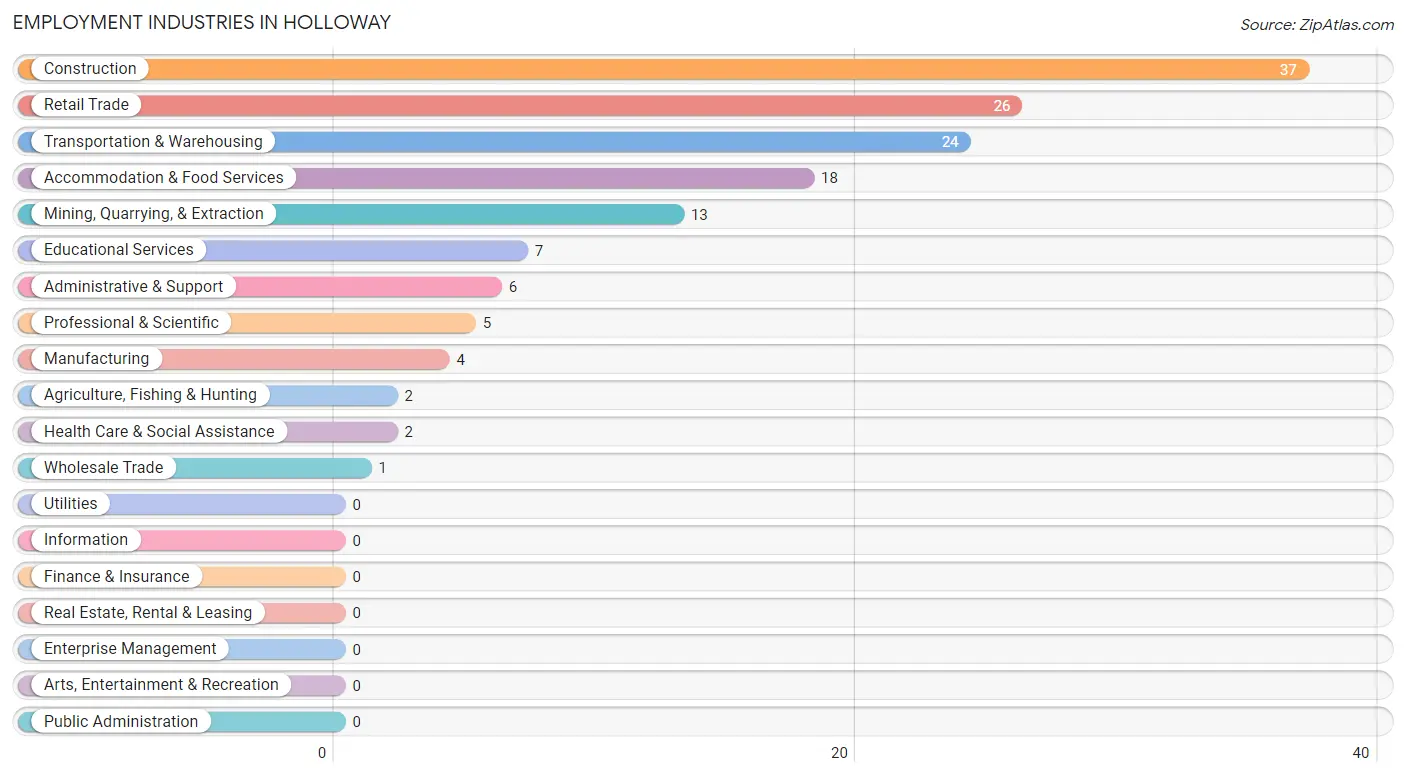
Employment Industries in Holloway
The major employment industries in Holloway include Construction (37 | 24.5%), Retail Trade (26 | 17.2%), Transportation & Warehousing (24 | 15.9%), Accommodation & Food Services (18 | 11.9%), and Mining, Quarrying, & Extraction (13 | 8.6%).
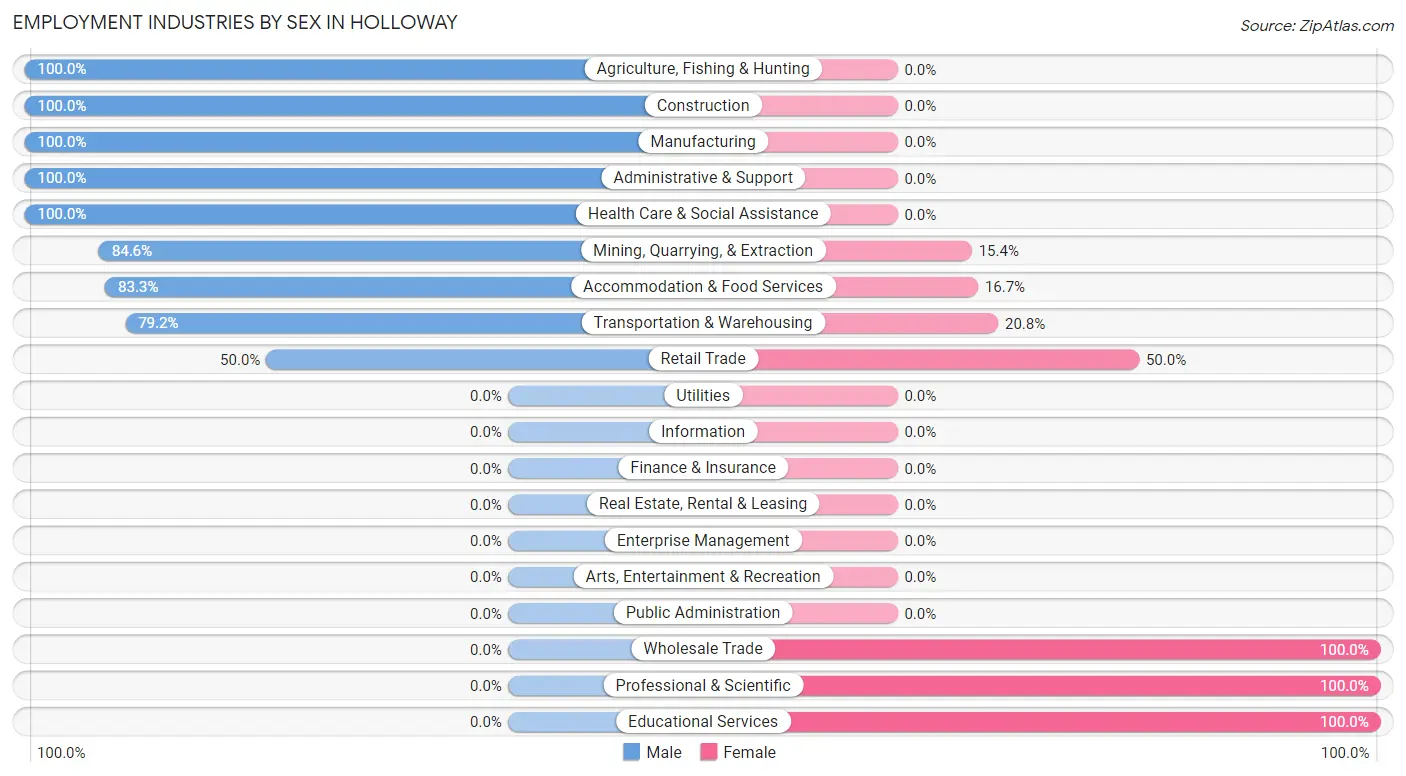
Employment Industries by Sex in Holloway
The Holloway industries that see more men than women are Agriculture, Fishing & Hunting (100.0%), Construction (100.0%), and Manufacturing (100.0%), whereas the industries that tend to have a higher number of women are Wholesale Trade (100.0%), Professional & Scientific (100.0%), and Educational Services (100.0%).
| Industry | Male | Female |
| Agriculture, Fishing & Hunting | 2 (100.0%) | 0 (0.0%) |
| Mining, Quarrying, & Extraction | 11 (84.6%) | 2 (15.4%) |
| Construction | 37 (100.0%) | 0 (0.0%) |
| Manufacturing | 4 (100.0%) | 0 (0.0%) |
| Wholesale Trade | 0 (0.0%) | 1 (100.0%) |
| Retail Trade | 13 (50.0%) | 13 (50.0%) |
| Transportation & Warehousing | 19 (79.2%) | 5 (20.8%) |
| Utilities | 0 (0.0%) | 0 (0.0%) |
| Information | 0 (0.0%) | 0 (0.0%) |
| Finance & Insurance | 0 (0.0%) | 0 (0.0%) |
| Real Estate, Rental & Leasing | 0 (0.0%) | 0 (0.0%) |
| Professional & Scientific | 0 (0.0%) | 5 (100.0%) |
| Enterprise Management | 0 (0.0%) | 0 (0.0%) |
| Administrative & Support | 6 (100.0%) | 0 (0.0%) |
| Educational Services | 0 (0.0%) | 7 (100.0%) |
| Health Care & Social Assistance | 2 (100.0%) | 0 (0.0%) |
| Arts, Entertainment & Recreation | 0 (0.0%) | 0 (0.0%) |
| Accommodation & Food Services | 15 (83.3%) | 3 (16.7%) |
| Public Administration | 0 (0.0%) | 0 (0.0%) |
| Total | 113 (74.8%) | 38 (25.2%) |
Education in Holloway
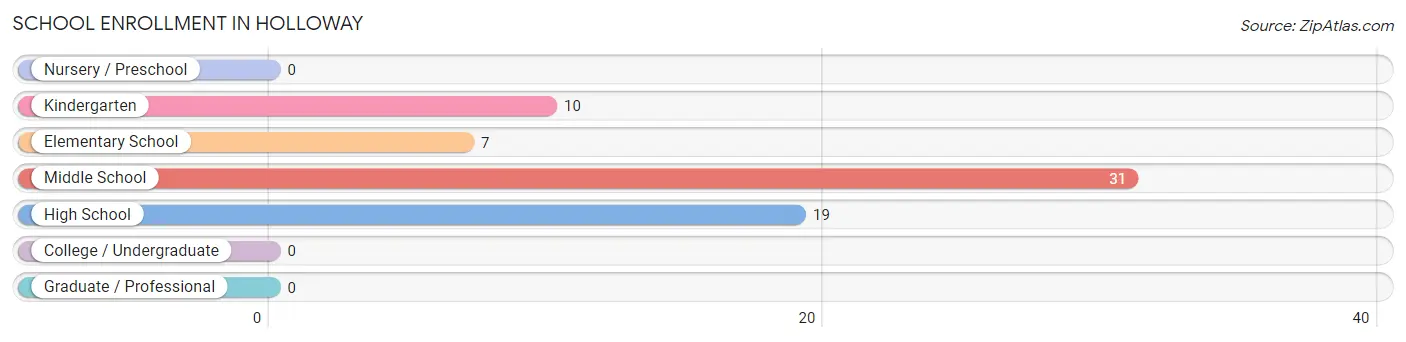
School Enrollment in Holloway
The most common levels of schooling among the 67 students in Holloway are middle school (31 | 46.3%), high school (19 | 28.4%), and kindergarten (10 | 14.9%).
| School Level | # Students | % Students |
| Nursery / Preschool | 0 | 0.0% |
| Kindergarten | 10 | 14.9% |
| Elementary School | 7 | 10.4% |
| Middle School | 31 | 46.3% |
| High School | 19 | 28.4% |
| College / Undergraduate | 0 | 0.0% |
| Graduate / Professional | 0 | 0.0% |
| Total | 67 | 100.0% |
School Enrollment by Age by Funding Source in Holloway
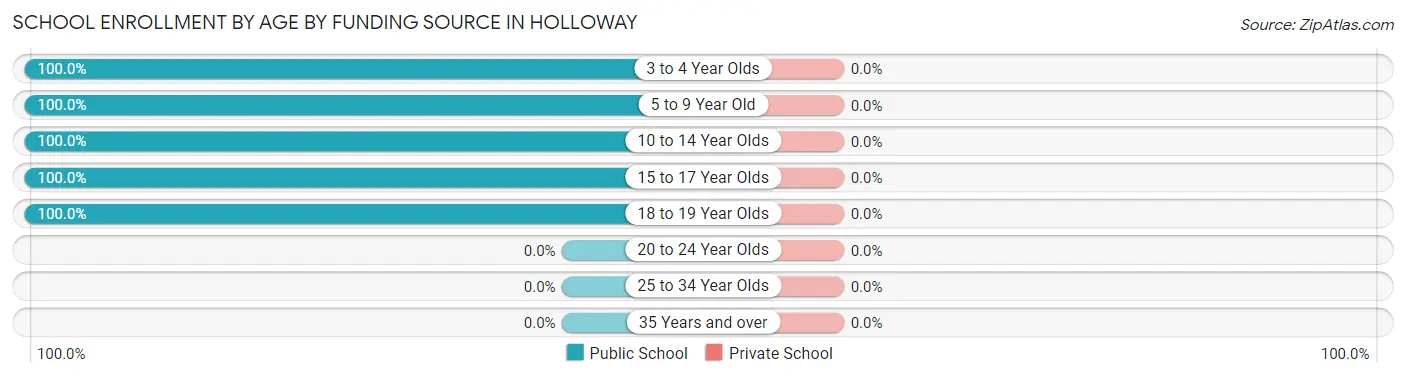
| Age Bracket | Public School | Private School |
| 3 to 4 Year Olds | 5 (100.0%) | 0 (0.0%) |
| 5 to 9 Year Old | 12 (100.0%) | 0 (0.0%) |
| 10 to 14 Year Olds | 26 (100.0%) | 0 (0.0%) |
| 15 to 17 Year Olds | 13 (100.0%) | 0 (0.0%) |
| 18 to 19 Year Olds | 11 (100.0%) | 0 (0.0%) |
| 20 to 24 Year Olds | 0 (0.0%) | 0 (0.0%) |
| 25 to 34 Year Olds | 0 (0.0%) | 0 (0.0%) |
| 35 Years and over | 0 (0.0%) | 0 (0.0%) |
| Total | 67 (100.0%) | 0 (0.0%) |
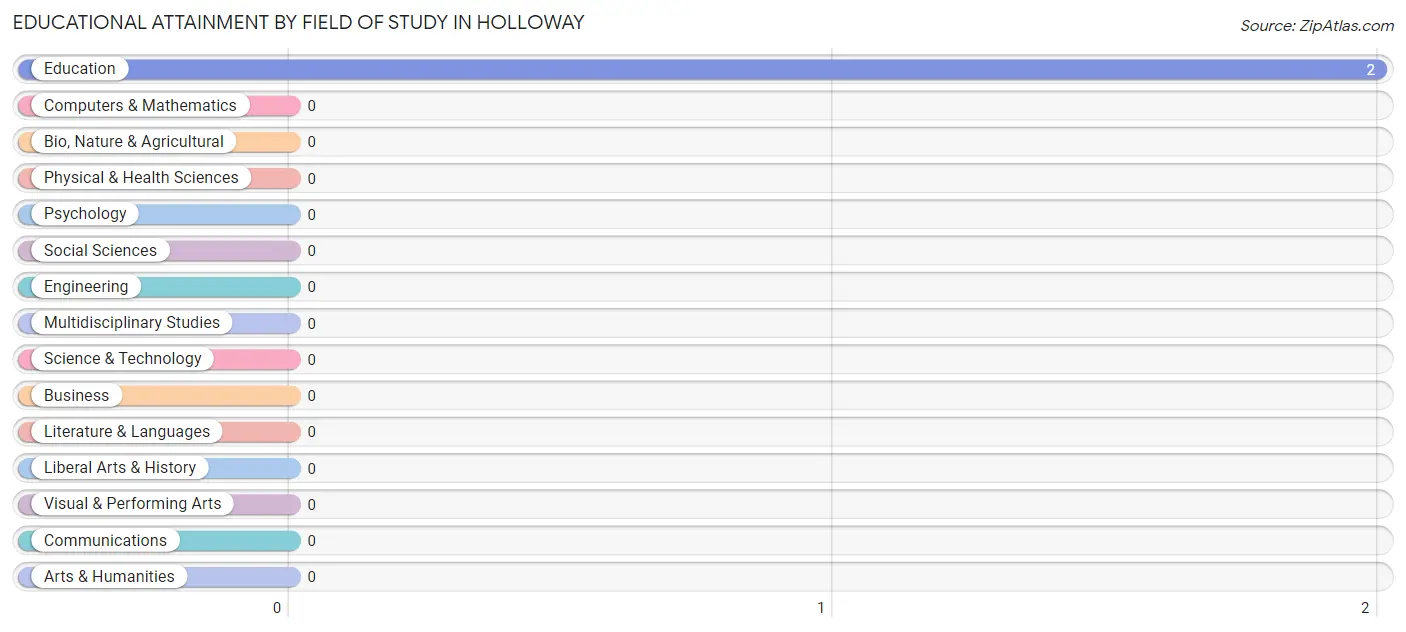
Educational Attainment by Field of Study in Holloway
, and education (2 | 100.0%) are the most common fields of study among 2 individuals in Holloway who have obtained a bachelor's degree or higher.
| Field of Study | # Graduates | % Graduates |
| Computers & Mathematics | 0 | 0.0% |
| Bio, Nature & Agricultural | 0 | 0.0% |
| Physical & Health Sciences | 0 | 0.0% |
| Psychology | 0 | 0.0% |
| Social Sciences | 0 | 0.0% |
| Engineering | 0 | 0.0% |
| Multidisciplinary Studies | 0 | 0.0% |
| Science & Technology | 0 | 0.0% |
| Business | 0 | 0.0% |
| Education | 2 | 100.0% |
| Literature & Languages | 0 | 0.0% |
| Liberal Arts & History | 0 | 0.0% |
| Visual & Performing Arts | 0 | 0.0% |
| Communications | 0 | 0.0% |
| Arts & Humanities | 0 | 0.0% |
| Total | 2 | 100.0% |
Transportation & Commute in Holloway
Vehicle Availability by Sex in Holloway
The most prevalent vehicle ownership categories in Holloway are males with 3 vehicles (37, accounting for 33.3%) and females with 3 vehicles (1, making up 97.4%).
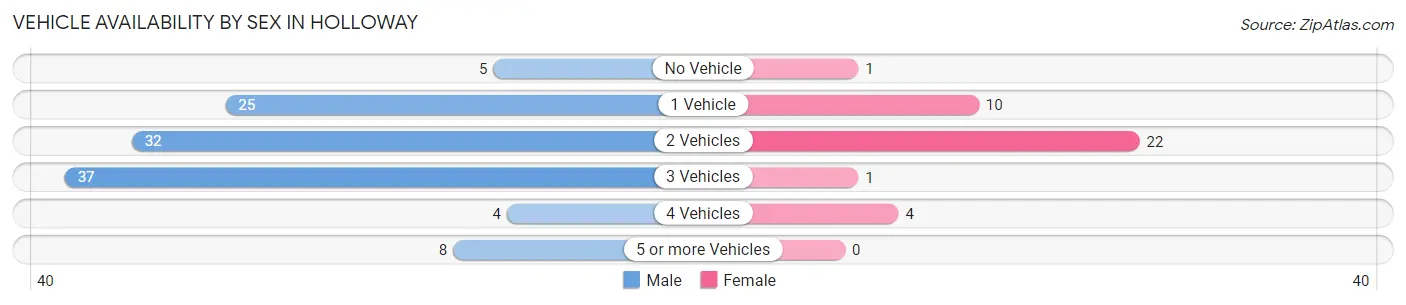
| Vehicles Available | Male | Female |
| No Vehicle | 5 (4.5%) | 1 (2.6%) |
| 1 Vehicle | 25 (22.5%) | 10 (26.3%) |
| 2 Vehicles | 32 (28.8%) | 22 (57.9%) |
| 3 Vehicles | 37 (33.3%) | 1 (2.6%) |
| 4 Vehicles | 4 (3.6%) | 4 (10.5%) |
| 5 or more Vehicles | 8 (7.2%) | 0 (0.0%) |
| Total | 111 (100.0%) | 38 (100.0%) |
Commute Time in Holloway
The most frequently occuring commute durations in Holloway are 20 to 24 minutes (57 commuters, 38.3%), 30 to 34 minutes (30 commuters, 20.1%), and 45 to 59 minutes (18 commuters, 12.1%).
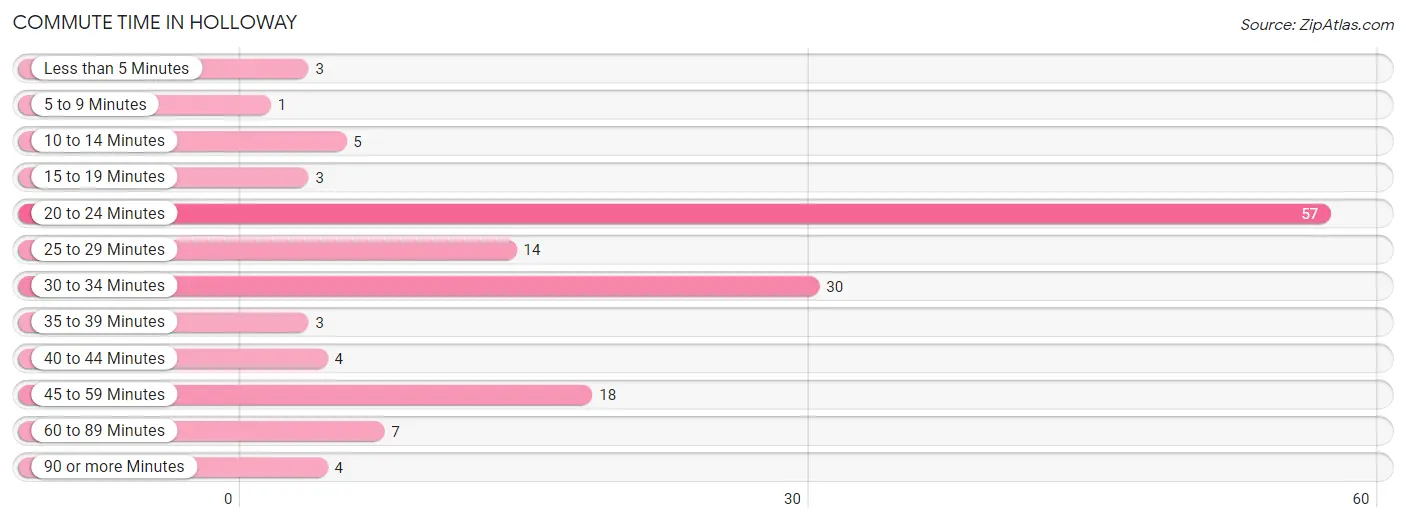
| Commute Time | # Commuters | % Commuters |
| Less than 5 Minutes | 3 | 2.0% |
| 5 to 9 Minutes | 1 | 0.7% |
| 10 to 14 Minutes | 5 | 3.4% |
| 15 to 19 Minutes | 3 | 2.0% |
| 20 to 24 Minutes | 57 | 38.3% |
| 25 to 29 Minutes | 14 | 9.4% |
| 30 to 34 Minutes | 30 | 20.1% |
| 35 to 39 Minutes | 3 | 2.0% |
| 40 to 44 Minutes | 4 | 2.7% |
| 45 to 59 Minutes | 18 | 12.1% |
| 60 to 89 Minutes | 7 | 4.7% |
| 90 or more Minutes | 4 | 2.7% |
Commute Time by Sex in Holloway
The most common commute times in Holloway are 20 to 24 minutes (46 commuters, 41.4%) for males and 20 to 24 minutes (11 commuters, 28.9%) for females.
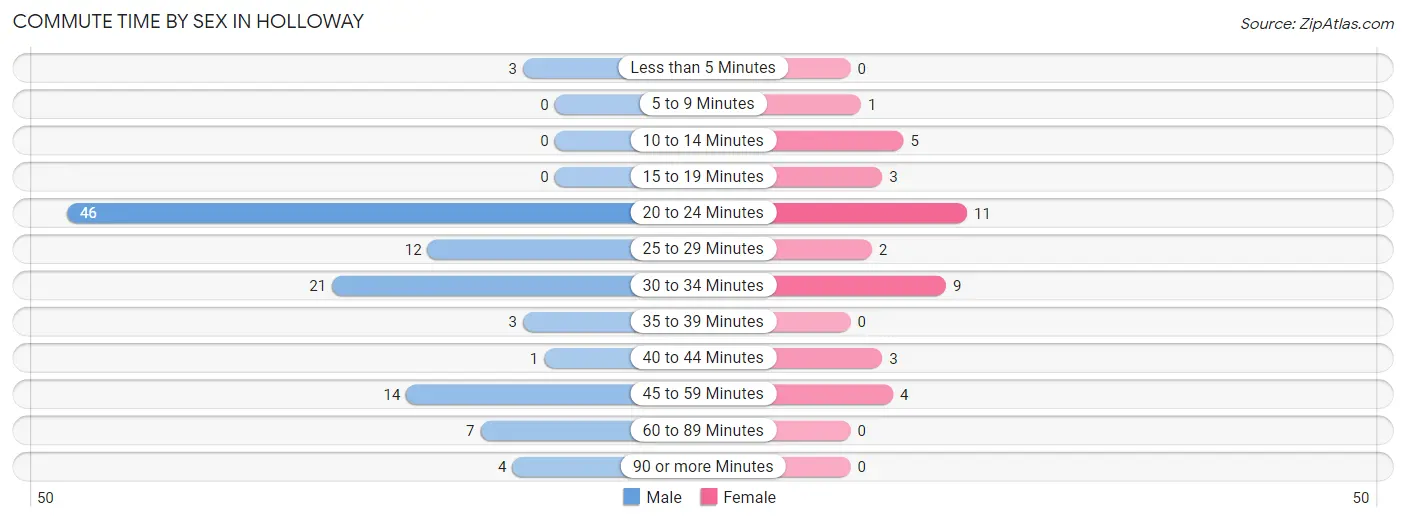
| Commute Time | Male | Female |
| Less than 5 Minutes | 3 (2.7%) | 0 (0.0%) |
| 5 to 9 Minutes | 0 (0.0%) | 1 (2.6%) |
| 10 to 14 Minutes | 0 (0.0%) | 5 (13.2%) |
| 15 to 19 Minutes | 0 (0.0%) | 3 (7.9%) |
| 20 to 24 Minutes | 46 (41.4%) | 11 (28.9%) |
| 25 to 29 Minutes | 12 (10.8%) | 2 (5.3%) |
| 30 to 34 Minutes | 21 (18.9%) | 9 (23.7%) |
| 35 to 39 Minutes | 3 (2.7%) | 0 (0.0%) |
| 40 to 44 Minutes | 1 (0.9%) | 3 (7.9%) |
| 45 to 59 Minutes | 14 (12.6%) | 4 (10.5%) |
| 60 to 89 Minutes | 7 (6.3%) | 0 (0.0%) |
| 90 or more Minutes | 4 (3.6%) | 0 (0.0%) |
Time of Departure to Work by Sex in Holloway
The most frequent times of departure to work in Holloway are 8:00 AM to 8:29 AM (41, 36.9%) for males and 7:00 AM to 7:29 AM (15, 39.5%) for females.
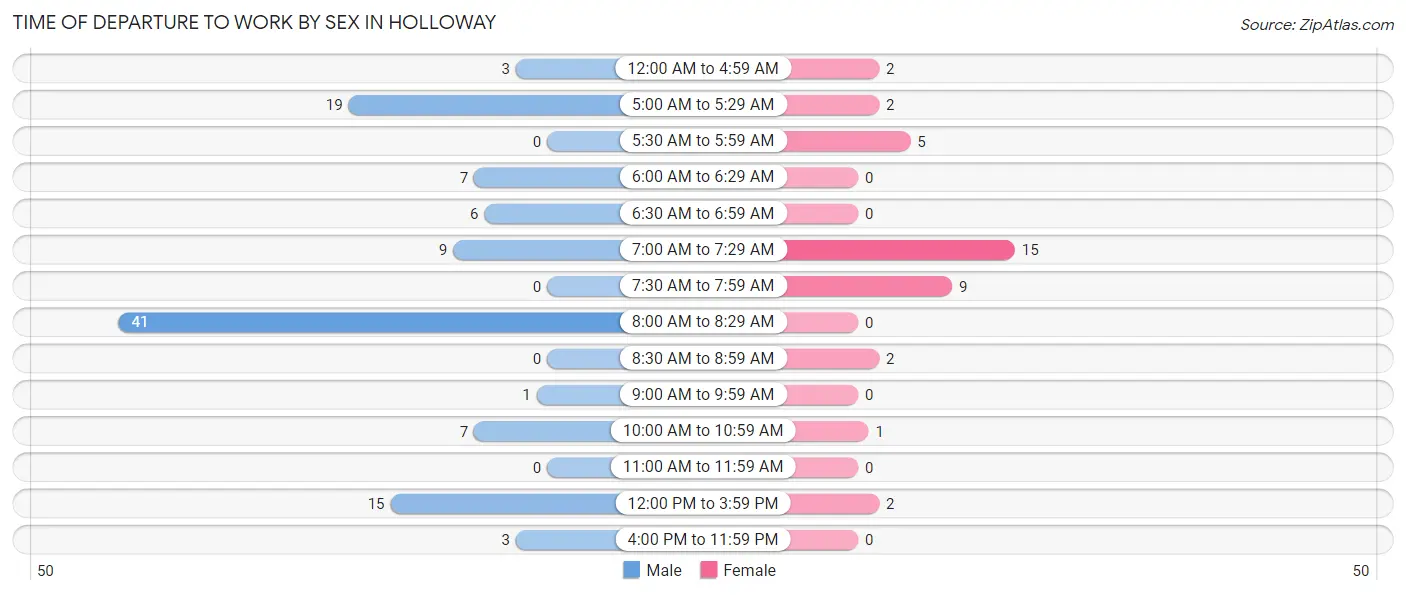
| Time of Departure | Male | Female |
| 12:00 AM to 4:59 AM | 3 (2.7%) | 2 (5.3%) |
| 5:00 AM to 5:29 AM | 19 (17.1%) | 2 (5.3%) |
| 5:30 AM to 5:59 AM | 0 (0.0%) | 5 (13.2%) |
| 6:00 AM to 6:29 AM | 7 (6.3%) | 0 (0.0%) |
| 6:30 AM to 6:59 AM | 6 (5.4%) | 0 (0.0%) |
| 7:00 AM to 7:29 AM | 9 (8.1%) | 15 (39.5%) |
| 7:30 AM to 7:59 AM | 0 (0.0%) | 9 (23.7%) |
| 8:00 AM to 8:29 AM | 41 (36.9%) | 0 (0.0%) |
| 8:30 AM to 8:59 AM | 0 (0.0%) | 2 (5.3%) |
| 9:00 AM to 9:59 AM | 1 (0.9%) | 0 (0.0%) |
| 10:00 AM to 10:59 AM | 7 (6.3%) | 1 (2.6%) |
| 11:00 AM to 11:59 AM | 0 (0.0%) | 0 (0.0%) |
| 12:00 PM to 3:59 PM | 15 (13.5%) | 2 (5.3%) |
| 4:00 PM to 11:59 PM | 3 (2.7%) | 0 (0.0%) |
| Total | 111 (100.0%) | 38 (100.0%) |
Housing Occupancy in Holloway
Occupancy by Ownership in Holloway
Of the total 126 dwellings in Holloway, owner-occupied units account for 92 (73.0%), while renter-occupied units make up 34 (27.0%).
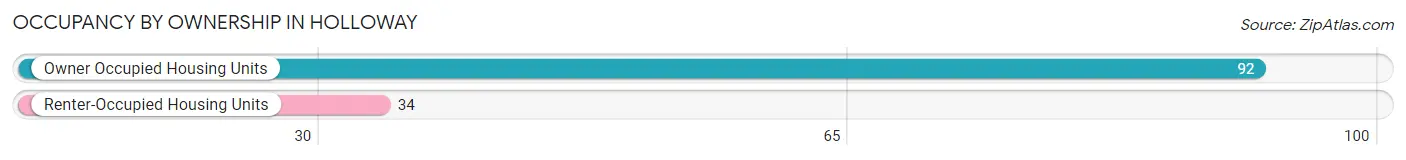
| Occupancy | # Housing Units | % Housing Units |
| Owner Occupied Housing Units | 92 | 73.0% |
| Renter-Occupied Housing Units | 34 | 27.0% |
| Total Occupied Housing Units | 126 | 100.0% |
Occupancy by Household Size in Holloway
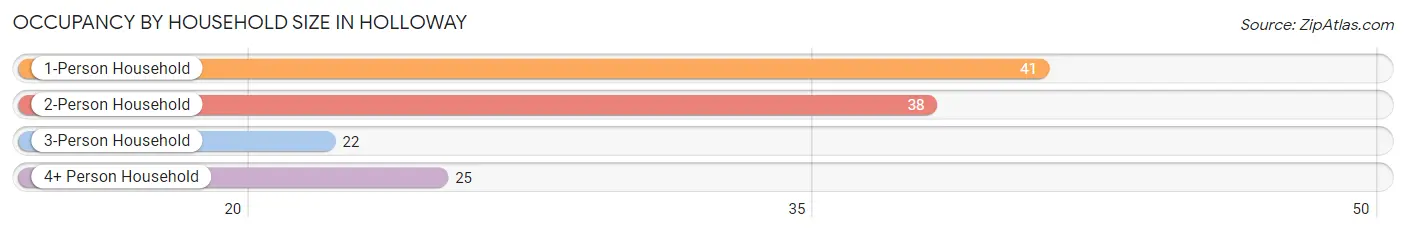
| Household Size | # Housing Units | % Housing Units |
| 1-Person Household | 41 | 32.5% |
| 2-Person Household | 38 | 30.2% |
| 3-Person Household | 22 | 17.5% |
| 4+ Person Household | 25 | 19.8% |
| Total Housing Units | 126 | 100.0% |
Occupancy by Ownership by Household Size in Holloway
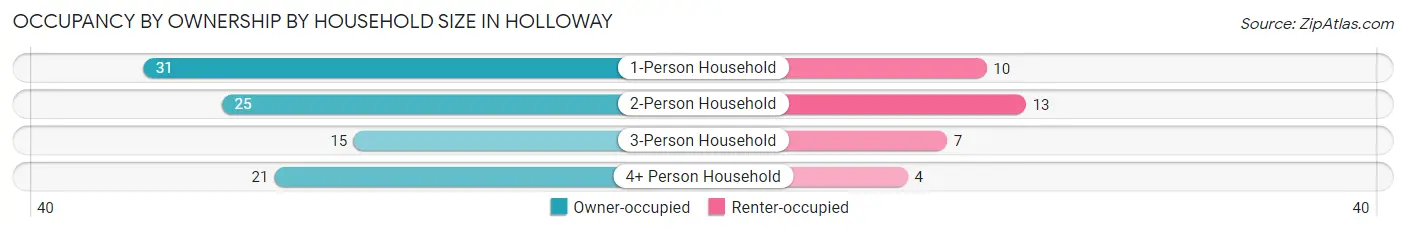
| Household Size | Owner-occupied | Renter-occupied |
| 1-Person Household | 31 (75.6%) | 10 (24.4%) |
| 2-Person Household | 25 (65.8%) | 13 (34.2%) |
| 3-Person Household | 15 (68.2%) | 7 (31.8%) |
| 4+ Person Household | 21 (84.0%) | 4 (16.0%) |
| Total Housing Units | 92 (73.0%) | 34 (27.0%) |
Occupancy by Educational Attainment in Holloway
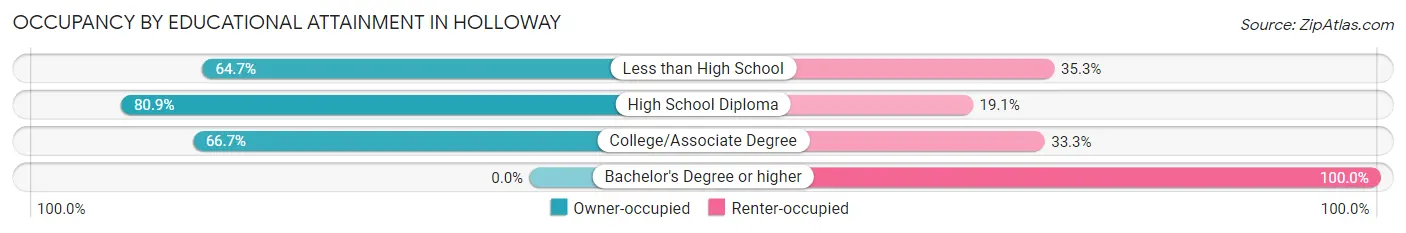
| Household Size | Owner-occupied | Renter-occupied |
| Less than High School | 11 (64.7%) | 6 (35.3%) |
| High School Diploma | 55 (80.9%) | 13 (19.1%) |
| College/Associate Degree | 26 (66.7%) | 13 (33.3%) |
| Bachelor's Degree or higher | 0 (0.0%) | 2 (100.0%) |
Occupancy by Age of Householder in Holloway
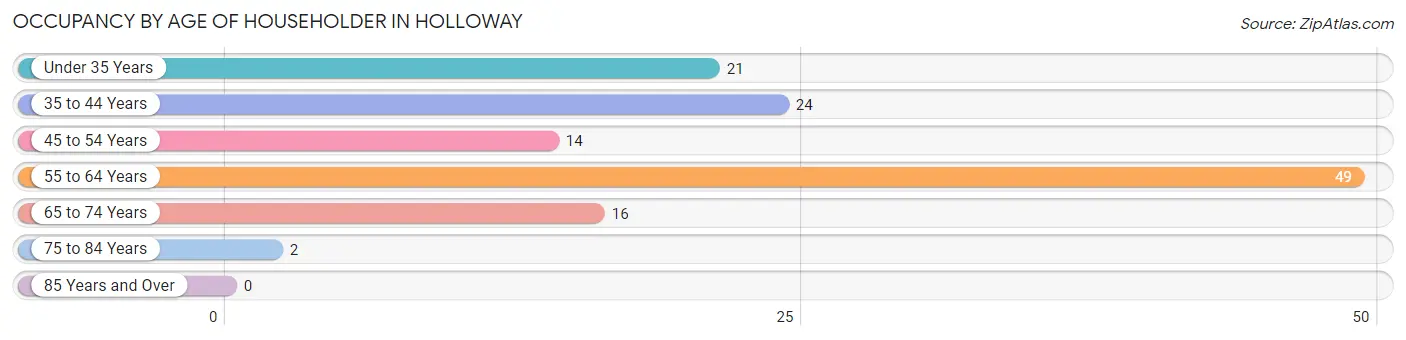
| Age Bracket | # Households | % Households |
| Under 35 Years | 21 | 16.7% |
| 35 to 44 Years | 24 | 19.1% |
| 45 to 54 Years | 14 | 11.1% |
| 55 to 64 Years | 49 | 38.9% |
| 65 to 74 Years | 16 | 12.7% |
| 75 to 84 Years | 2 | 1.6% |
| 85 Years and Over | 0 | 0.0% |
| Total | 126 | 100.0% |
Housing Finances in Holloway
Median Income by Occupancy in Holloway
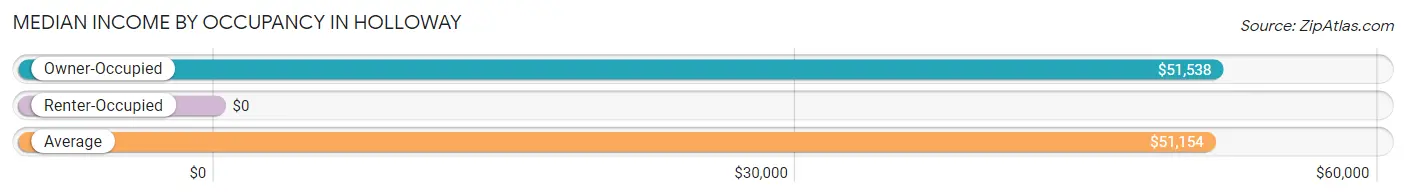
| Occupancy Type | # Households | Median Income |
| Owner-Occupied | 92 (73.0%) | $51,538 |
| Renter-Occupied | 34 (27.0%) | $0 |
| Average | 126 (100.0%) | $51,154 |
Occupancy by Householder Income Bracket in Holloway
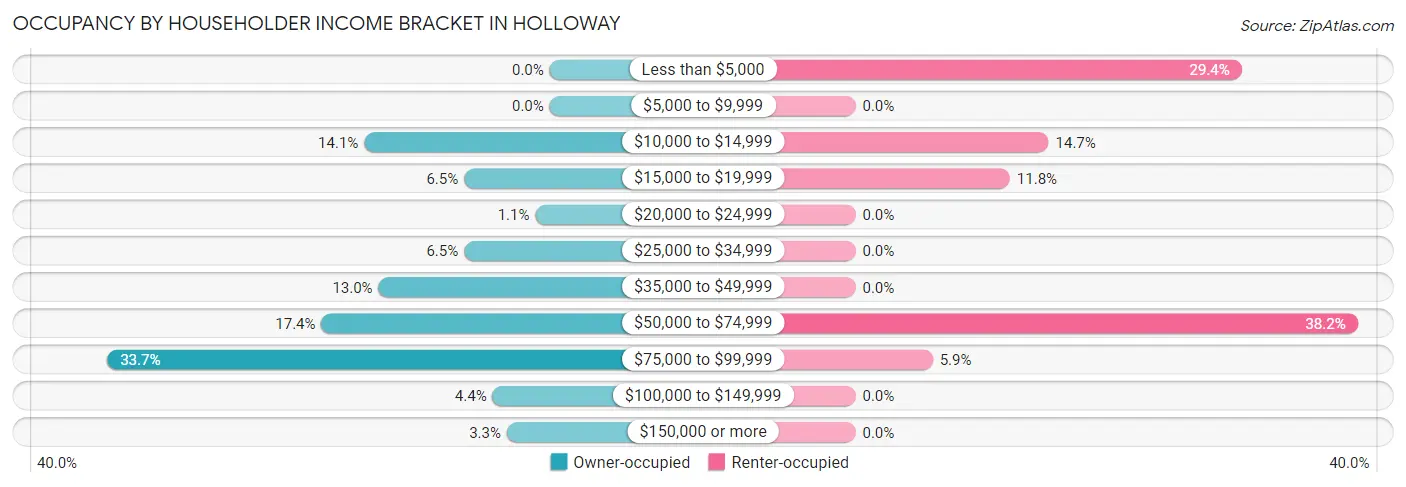
| Income Bracket | Owner-occupied | Renter-occupied |
| Less than $5,000 | 0 (0.0%) | 10 (29.4%) |
| $5,000 to $9,999 | 0 (0.0%) | 0 (0.0%) |
| $10,000 to $14,999 | 13 (14.1%) | 5 (14.7%) |
| $15,000 to $19,999 | 6 (6.5%) | 4 (11.8%) |
| $20,000 to $24,999 | 1 (1.1%) | 0 (0.0%) |
| $25,000 to $34,999 | 6 (6.5%) | 0 (0.0%) |
| $35,000 to $49,999 | 12 (13.0%) | 0 (0.0%) |
| $50,000 to $74,999 | 16 (17.4%) | 13 (38.2%) |
| $75,000 to $99,999 | 31 (33.7%) | 2 (5.9%) |
| $100,000 to $149,999 | 4 (4.3%) | 0 (0.0%) |
| $150,000 or more | 3 (3.3%) | 0 (0.0%) |
| Total | 92 (100.0%) | 34 (100.0%) |
Monthly Housing Cost Tiers in Holloway
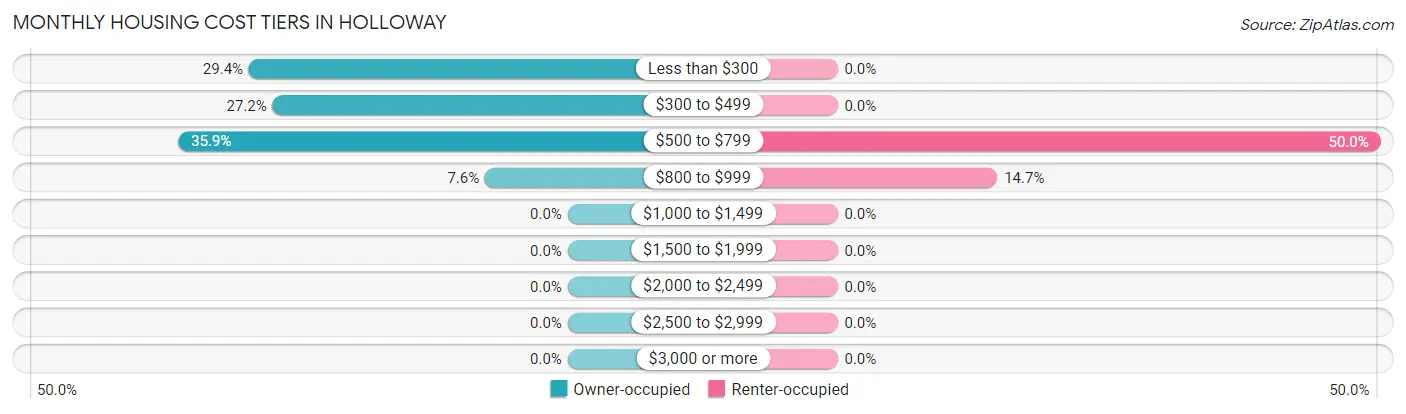
| Monthly Cost | Owner-occupied | Renter-occupied |
| Less than $300 | 27 (29.3%) | 0 (0.0%) |
| $300 to $499 | 25 (27.2%) | 0 (0.0%) |
| $500 to $799 | 33 (35.9%) | 17 (50.0%) |
| $800 to $999 | 7 (7.6%) | 5 (14.7%) |
| $1,000 to $1,499 | 0 (0.0%) | 0 (0.0%) |
| $1,500 to $1,999 | 0 (0.0%) | 0 (0.0%) |
| $2,000 to $2,499 | 0 (0.0%) | 0 (0.0%) |
| $2,500 to $2,999 | 0 (0.0%) | 0 (0.0%) |
| $3,000 or more | 0 (0.0%) | 0 (0.0%) |
| Total | 92 (100.0%) | 34 (100.0%) |
Physical Housing Characteristics in Holloway
Housing Structures in Holloway
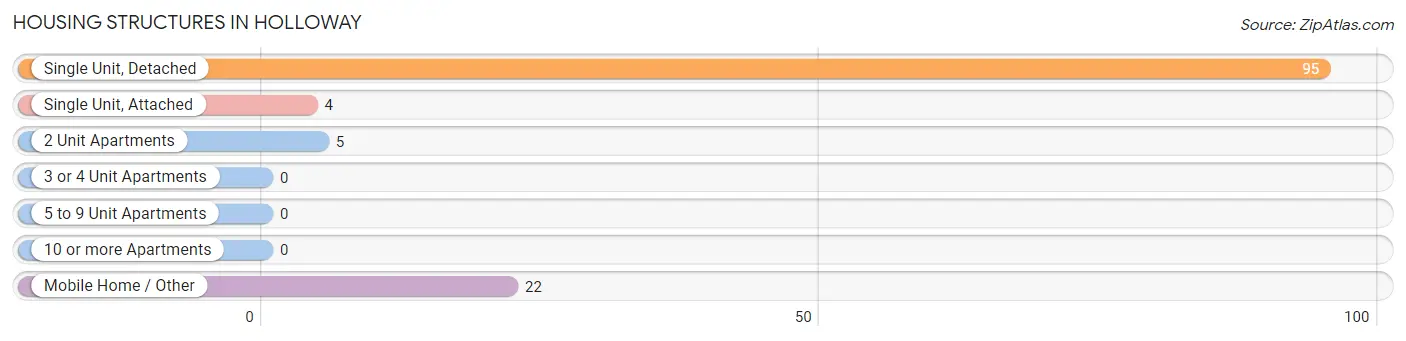
| Structure Type | # Housing Units | % Housing Units |
| Single Unit, Detached | 95 | 75.4% |
| Single Unit, Attached | 4 | 3.2% |
| 2 Unit Apartments | 5 | 4.0% |
| 3 or 4 Unit Apartments | 0 | 0.0% |
| 5 to 9 Unit Apartments | 0 | 0.0% |
| 10 or more Apartments | 0 | 0.0% |
| Mobile Home / Other | 22 | 17.5% |
| Total | 126 | 100.0% |
Housing Structures by Occupancy in Holloway
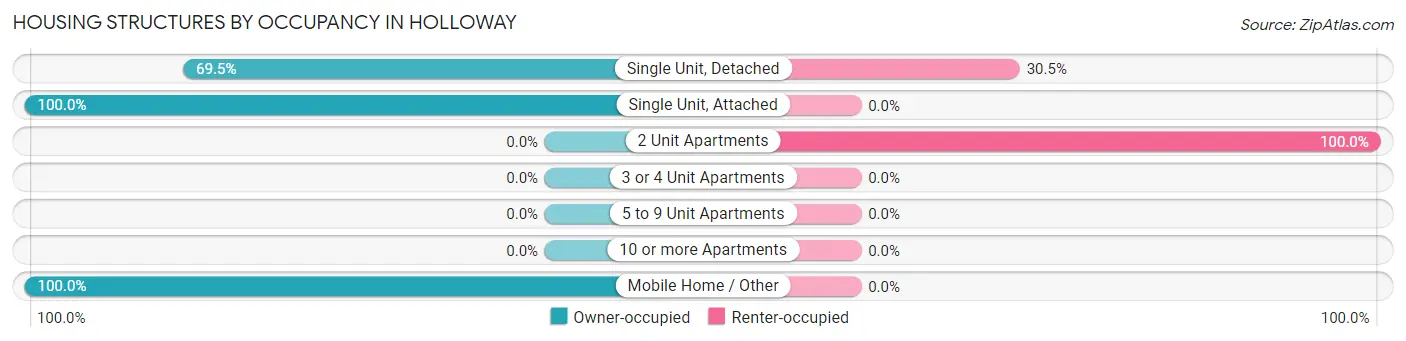
| Structure Type | Owner-occupied | Renter-occupied |
| Single Unit, Detached | 66 (69.5%) | 29 (30.5%) |
| Single Unit, Attached | 4 (100.0%) | 0 (0.0%) |
| 2 Unit Apartments | 0 (0.0%) | 5 (100.0%) |
| 3 or 4 Unit Apartments | 0 (0.0%) | 0 (0.0%) |
| 5 to 9 Unit Apartments | 0 (0.0%) | 0 (0.0%) |
| 10 or more Apartments | 0 (0.0%) | 0 (0.0%) |
| Mobile Home / Other | 22 (100.0%) | 0 (0.0%) |
| Total | 92 (73.0%) | 34 (27.0%) |
Housing Structures by Number of Rooms in Holloway
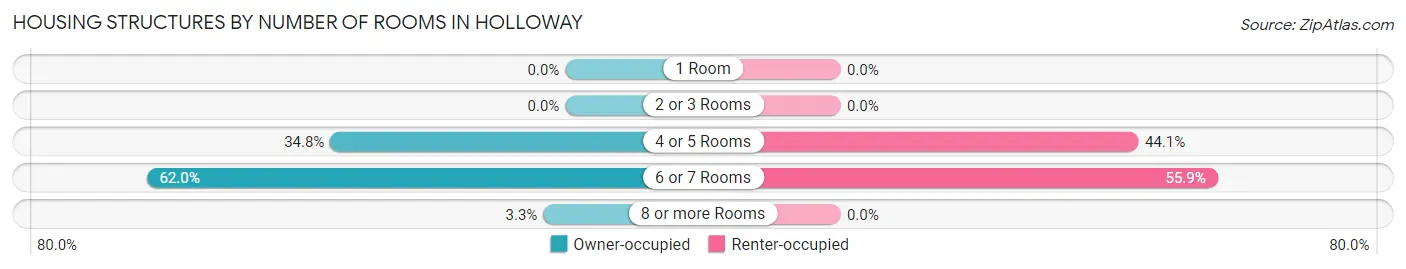
| Number of Rooms | Owner-occupied | Renter-occupied |
| 1 Room | 0 (0.0%) | 0 (0.0%) |
| 2 or 3 Rooms | 0 (0.0%) | 0 (0.0%) |
| 4 or 5 Rooms | 32 (34.8%) | 15 (44.1%) |
| 6 or 7 Rooms | 57 (62.0%) | 19 (55.9%) |
| 8 or more Rooms | 3 (3.3%) | 0 (0.0%) |
| Total | 92 (100.0%) | 34 (100.0%) |
Housing Structure by Heating Type in Holloway
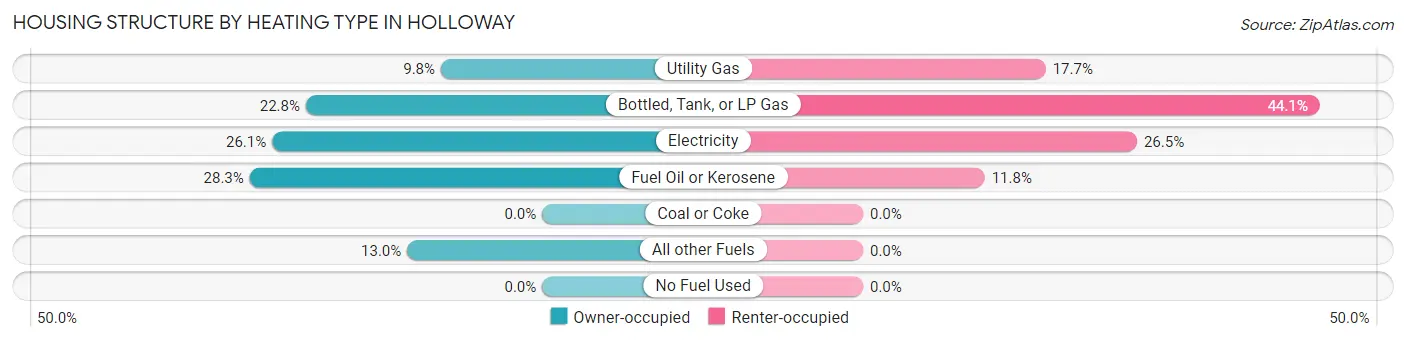
| Heating Type | Owner-occupied | Renter-occupied |
| Utility Gas | 9 (9.8%) | 6 (17.6%) |
| Bottled, Tank, or LP Gas | 21 (22.8%) | 15 (44.1%) |
| Electricity | 24 (26.1%) | 9 (26.5%) |
| Fuel Oil or Kerosene | 26 (28.3%) | 4 (11.8%) |
| Coal or Coke | 0 (0.0%) | 0 (0.0%) |
| All other Fuels | 12 (13.0%) | 0 (0.0%) |
| No Fuel Used | 0 (0.0%) | 0 (0.0%) |
| Total | 92 (100.0%) | 34 (100.0%) |
Household Vehicle Usage in Holloway
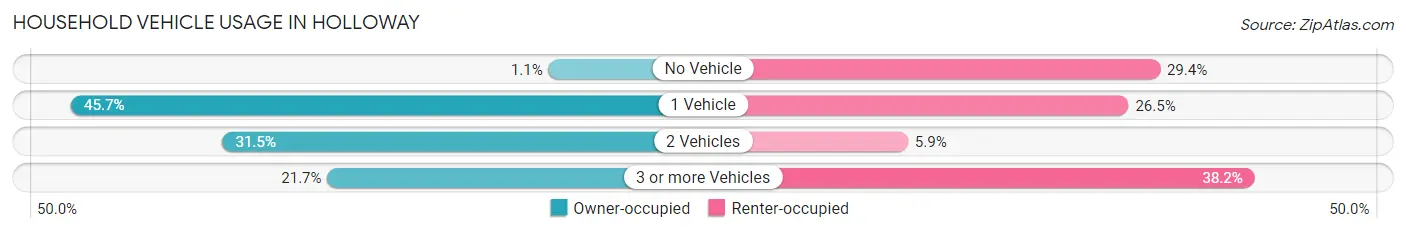
| Vehicles per Household | Owner-occupied | Renter-occupied |
| No Vehicle | 1 (1.1%) | 10 (29.4%) |
| 1 Vehicle | 42 (45.7%) | 9 (26.5%) |
| 2 Vehicles | 29 (31.5%) | 2 (5.9%) |
| 3 or more Vehicles | 20 (21.7%) | 13 (38.2%) |
| Total | 92 (100.0%) | 34 (100.0%) |
Real Estate & Mortgages in Holloway
Real Estate and Mortgage Overview in Holloway
| Characteristic | Without Mortgage | With Mortgage |
| Housing Units | 61 | 31 |
| Median Property Value | - | - |
| Median Household Income | $59,583 | $2 |
| Monthly Housing Costs | $329 | $0 |
| Real Estate Taxes | $325 | $0 |
Property Value by Mortgage Status in Holloway
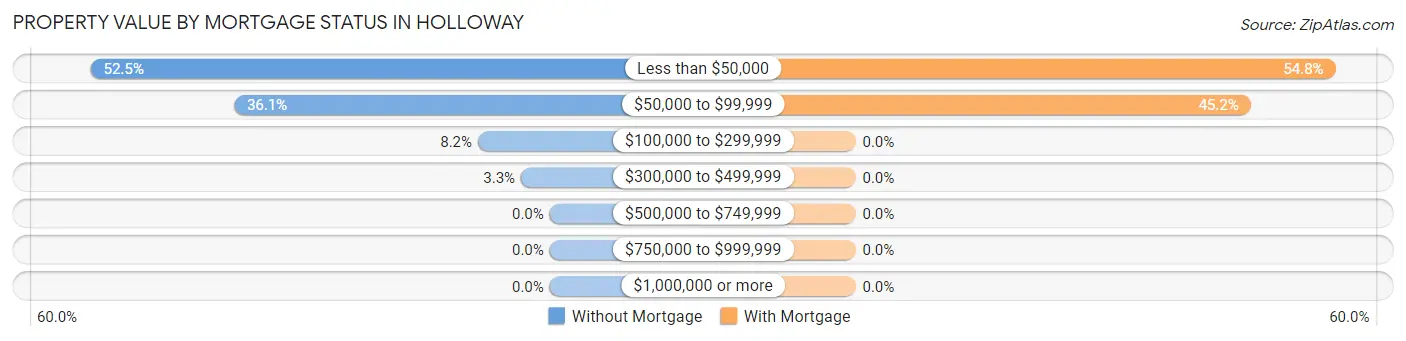
| Property Value | Without Mortgage | With Mortgage |
| Less than $50,000 | 32 (52.5%) | 17 (54.8%) |
| $50,000 to $99,999 | 22 (36.1%) | 14 (45.2%) |
| $100,000 to $299,999 | 5 (8.2%) | 0 (0.0%) |
| $300,000 to $499,999 | 2 (3.3%) | 0 (0.0%) |
| $500,000 to $749,999 | 0 (0.0%) | 0 (0.0%) |
| $750,000 to $999,999 | 0 (0.0%) | 0 (0.0%) |
| $1,000,000 or more | 0 (0.0%) | 0 (0.0%) |
| Total | 61 (100.0%) | 31 (100.0%) |
Household Income by Mortgage Status in Holloway
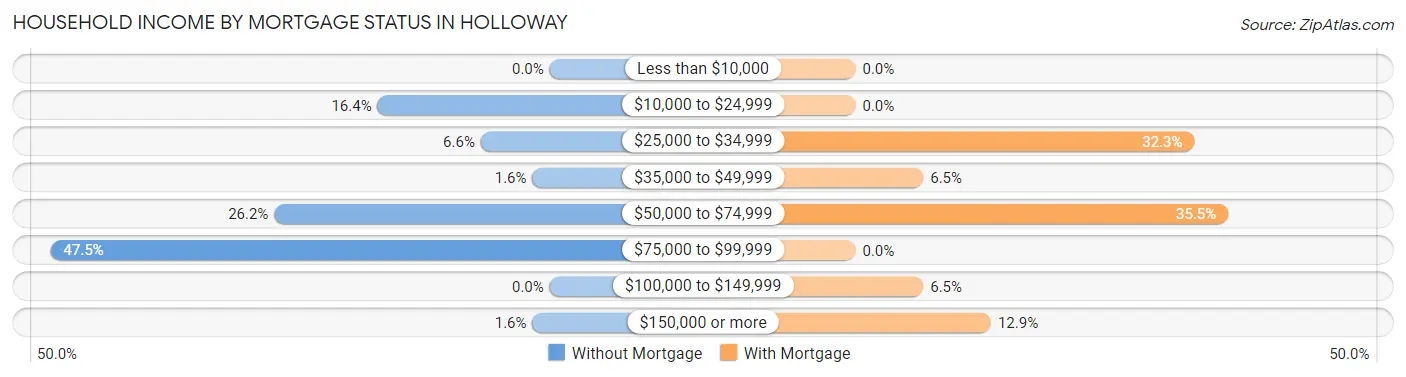
| Household Income | Without Mortgage | With Mortgage |
| Less than $10,000 | 0 (0.0%) | 0 (0.0%) |
| $10,000 to $24,999 | 10 (16.4%) | 0 (0.0%) |
| $25,000 to $34,999 | 4 (6.6%) | 10 (32.3%) |
| $35,000 to $49,999 | 1 (1.6%) | 2 (6.5%) |
| $50,000 to $74,999 | 16 (26.2%) | 11 (35.5%) |
| $75,000 to $99,999 | 29 (47.5%) | 0 (0.0%) |
| $100,000 to $149,999 | 0 (0.0%) | 2 (6.5%) |
| $150,000 or more | 1 (1.6%) | 4 (12.9%) |
| Total | 61 (100.0%) | 31 (100.0%) |
Property Value to Household Income Ratio in Holloway
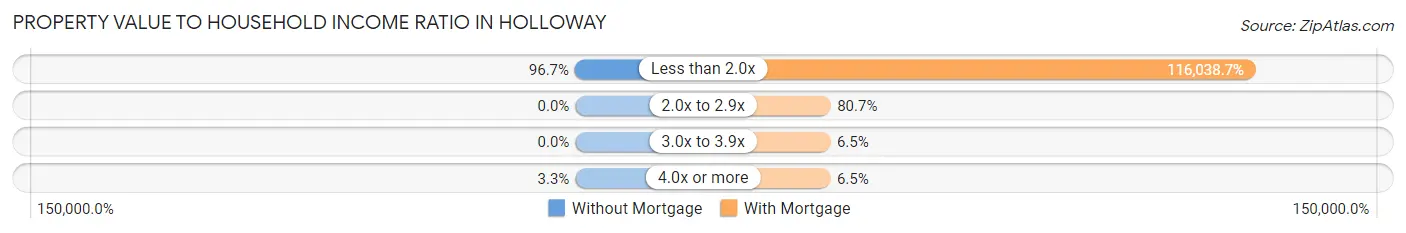
| Value-to-Income Ratio | Without Mortgage | With Mortgage |
| Less than 2.0x | 59 (96.7%) | 35,972 (116,038.7%) |
| 2.0x to 2.9x | 0 (0.0%) | 25 (80.6%) |
| 3.0x to 3.9x | 0 (0.0%) | 2 (6.5%) |
| 4.0x or more | 2 (3.3%) | 2 (6.5%) |
| Total | 61 (100.0%) | 31 (100.0%) |
Real Estate Taxes by Mortgage Status in Holloway
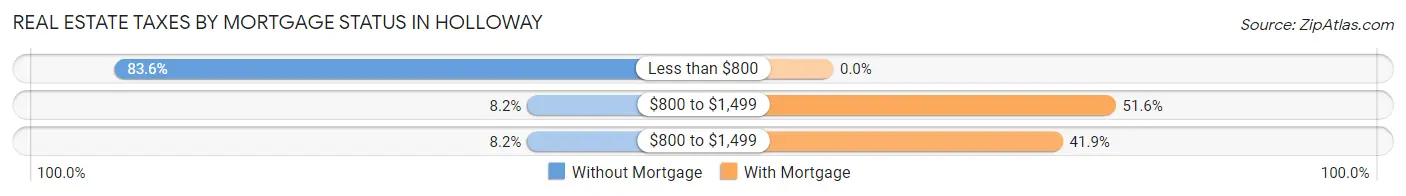
| Property Taxes | Without Mortgage | With Mortgage |
| Less than $800 | 51 (83.6%) | 0 (0.0%) |
| $800 to $1,499 | 5 (8.2%) | 16 (51.6%) |
| $800 to $1,499 | 5 (8.2%) | 13 (41.9%) |
| Total | 61 (100.0%) | 31 (100.0%) |
Health & Disability in Holloway
Health Insurance Coverage by Age in Holloway
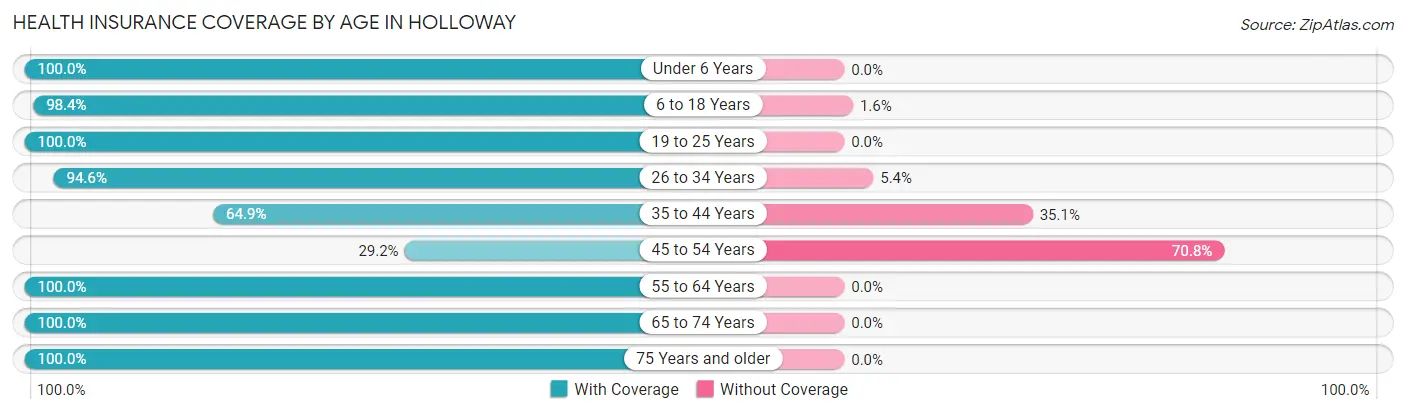
| Age Bracket | With Coverage | Without Coverage |
| Under 6 Years | 49 (100.0%) | 0 (0.0%) |
| 6 to 18 Years | 61 (98.4%) | 1 (1.6%) |
| 19 to 25 Years | 27 (100.0%) | 0 (0.0%) |
| 26 to 34 Years | 35 (94.6%) | 2 (5.4%) |
| 35 to 44 Years | 24 (64.9%) | 13 (35.1%) |
| 45 to 54 Years | 14 (29.2%) | 34 (70.8%) |
| 55 to 64 Years | 61 (100.0%) | 0 (0.0%) |
| 65 to 74 Years | 29 (100.0%) | 0 (0.0%) |
| 75 Years and older | 2 (100.0%) | 0 (0.0%) |
| Total | 302 (85.8%) | 50 (14.2%) |
Health Insurance Coverage by Citizenship Status in Holloway
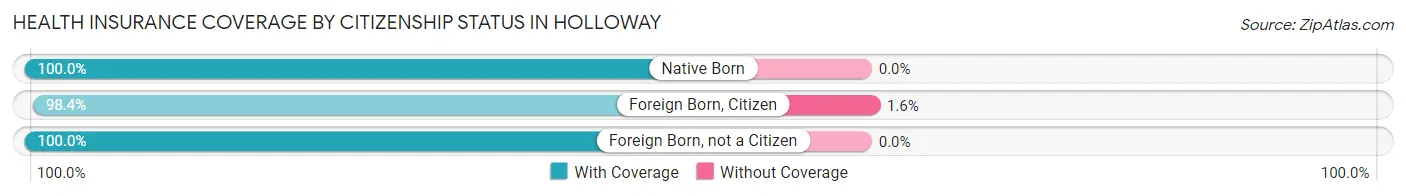
| Citizenship Status | With Coverage | Without Coverage |
| Native Born | 49 (100.0%) | 0 (0.0%) |
| Foreign Born, Citizen | 61 (98.4%) | 1 (1.6%) |
| Foreign Born, not a Citizen | 27 (100.0%) | 0 (0.0%) |
Health Insurance Coverage by Household Income in Holloway
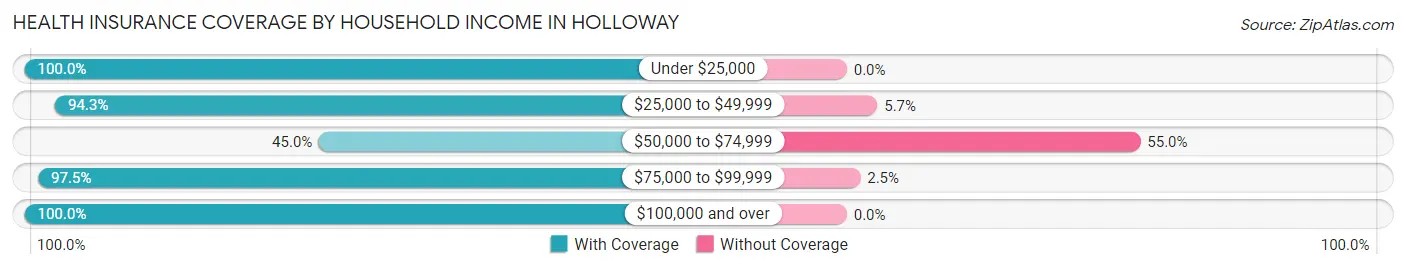
| Household Income | With Coverage | Without Coverage |
| Under $25,000 | 95 (100.0%) | 0 (0.0%) |
| $25,000 to $49,999 | 66 (94.3%) | 4 (5.7%) |
| $50,000 to $74,999 | 36 (45.0%) | 44 (55.0%) |
| $75,000 to $99,999 | 77 (97.5%) | 2 (2.5%) |
| $100,000 and over | 28 (100.0%) | 0 (0.0%) |
Public vs Private Health Insurance Coverage by Age in Holloway
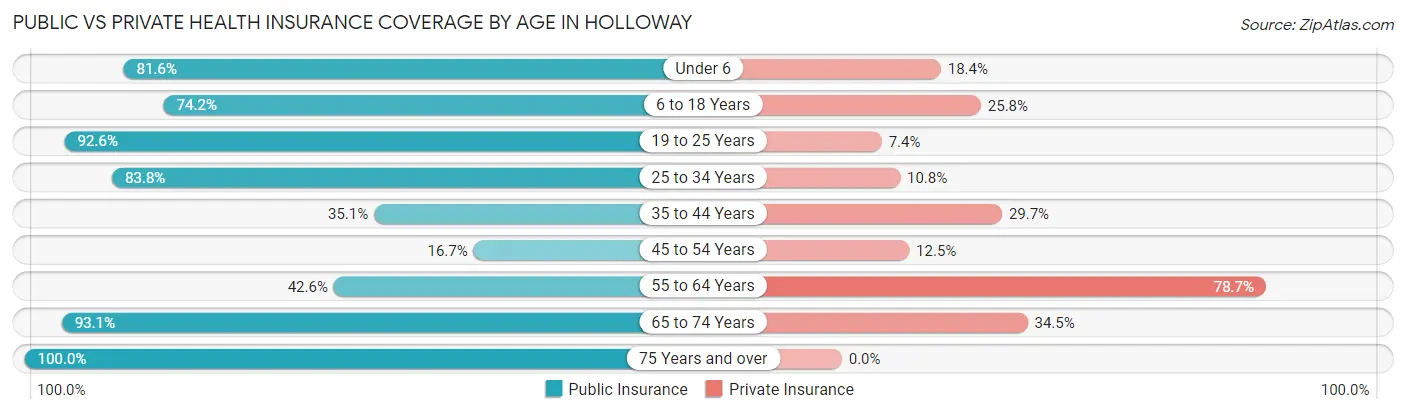
| Age Bracket | Public Insurance | Private Insurance |
| Under 6 | 40 (81.6%) | 9 (18.4%) |
| 6 to 18 Years | 46 (74.2%) | 16 (25.8%) |
| 19 to 25 Years | 25 (92.6%) | 2 (7.4%) |
| 25 to 34 Years | 31 (83.8%) | 4 (10.8%) |
| 35 to 44 Years | 13 (35.1%) | 11 (29.7%) |
| 45 to 54 Years | 8 (16.7%) | 6 (12.5%) |
| 55 to 64 Years | 26 (42.6%) | 48 (78.7%) |
| 65 to 74 Years | 27 (93.1%) | 10 (34.5%) |
| 75 Years and over | 2 (100.0%) | 0 (0.0%) |
| Total | 218 (61.9%) | 106 (30.1%) |
Disability Status by Sex by Age in Holloway
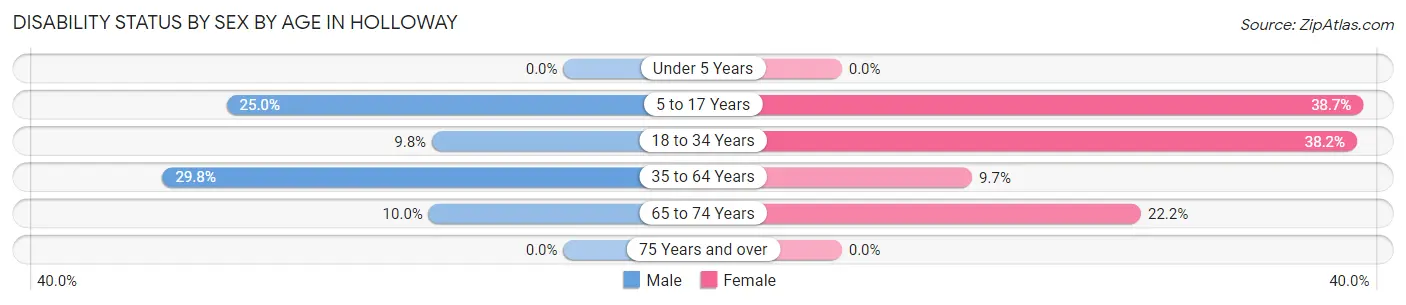
| Age Bracket | Male | Female |
| Under 5 Years | 0 (0.0%) | 0 (0.0%) |
| 5 to 17 Years | 5 (25.0%) | 12 (38.7%) |
| 18 to 34 Years | 4 (9.8%) | 13 (38.2%) |
| 35 to 64 Years | 25 (29.8%) | 6 (9.7%) |
| 65 to 74 Years | 2 (10.0%) | 2 (22.2%) |
| 75 Years and over | 0 (0.0%) | 0 (0.0%) |
Disability Class by Sex by Age in Holloway
Disability Class: Hearing Difficulty
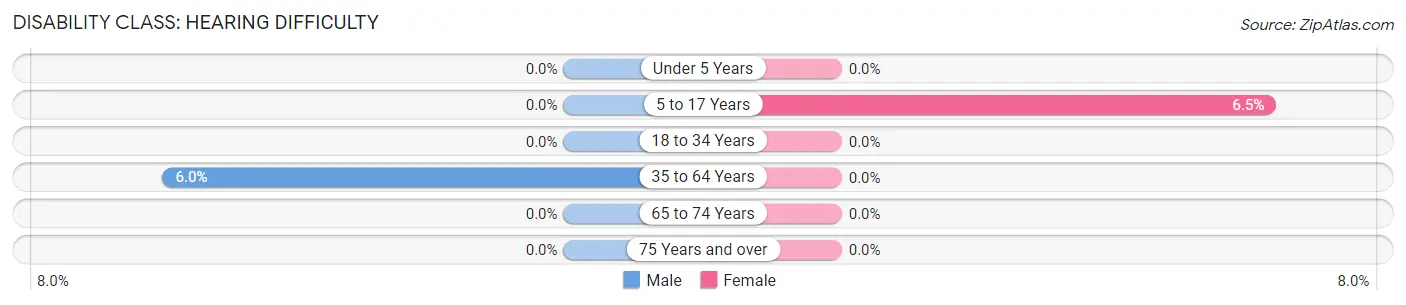
| Age Bracket | Male | Female |
| Under 5 Years | 0 (0.0%) | 0 (0.0%) |
| 5 to 17 Years | 0 (0.0%) | 2 (6.5%) |
| 18 to 34 Years | 0 (0.0%) | 0 (0.0%) |
| 35 to 64 Years | 5 (5.9%) | 0 (0.0%) |
| 65 to 74 Years | 0 (0.0%) | 0 (0.0%) |
| 75 Years and over | 0 (0.0%) | 0 (0.0%) |
Disability Class: Vision Difficulty
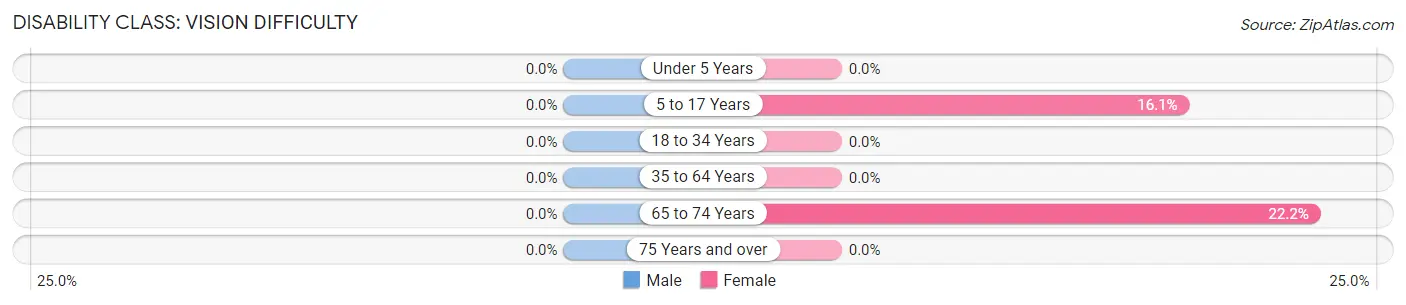
| Age Bracket | Male | Female |
| Under 5 Years | 0 (0.0%) | 0 (0.0%) |
| 5 to 17 Years | 0 (0.0%) | 5 (16.1%) |
| 18 to 34 Years | 0 (0.0%) | 0 (0.0%) |
| 35 to 64 Years | 0 (0.0%) | 0 (0.0%) |
| 65 to 74 Years | 0 (0.0%) | 2 (22.2%) |
| 75 Years and over | 0 (0.0%) | 0 (0.0%) |
Disability Class: Cognitive Difficulty
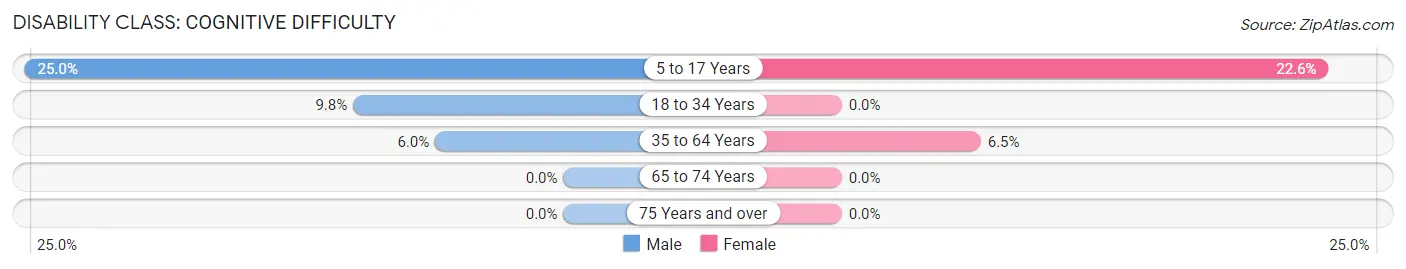
| Age Bracket | Male | Female |
| 5 to 17 Years | 5 (25.0%) | 7 (22.6%) |
| 18 to 34 Years | 4 (9.8%) | 0 (0.0%) |
| 35 to 64 Years | 5 (5.9%) | 4 (6.5%) |
| 65 to 74 Years | 0 (0.0%) | 0 (0.0%) |
| 75 Years and over | 0 (0.0%) | 0 (0.0%) |
Disability Class: Ambulatory Difficulty
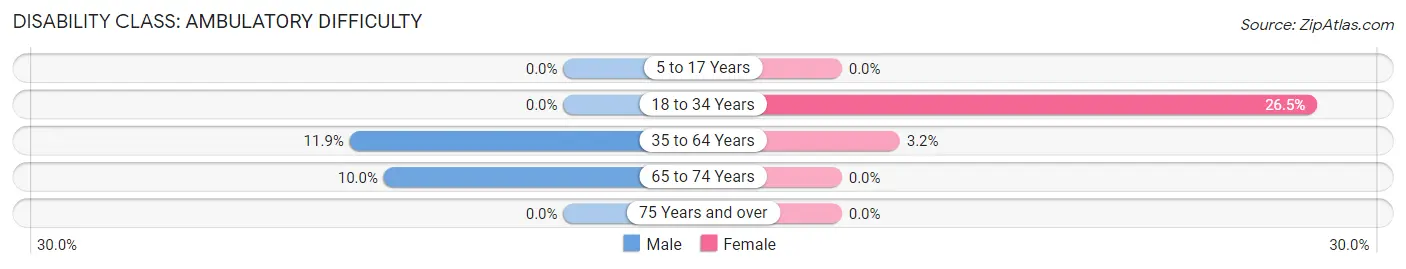
| Age Bracket | Male | Female |
| 5 to 17 Years | 0 (0.0%) | 0 (0.0%) |
| 18 to 34 Years | 0 (0.0%) | 9 (26.5%) |
| 35 to 64 Years | 10 (11.9%) | 2 (3.2%) |
| 65 to 74 Years | 2 (10.0%) | 0 (0.0%) |
| 75 Years and over | 0 (0.0%) | 0 (0.0%) |
Disability Class: Self-Care Difficulty
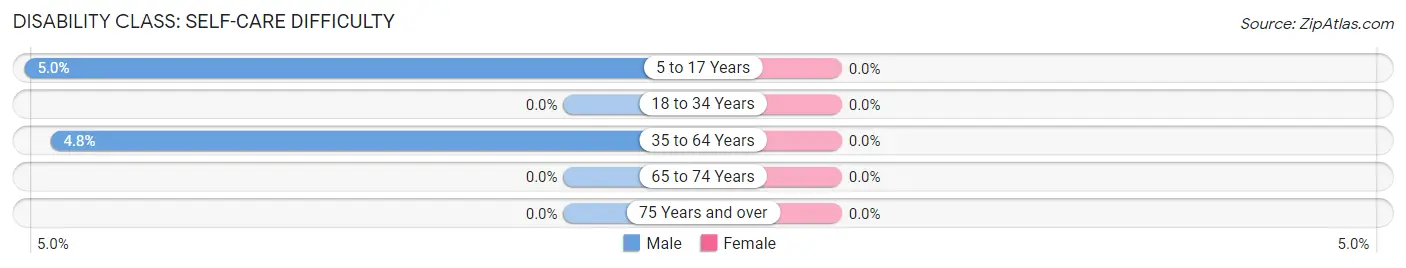
| Age Bracket | Male | Female |
| 5 to 17 Years | 1 (5.0%) | 0 (0.0%) |
| 18 to 34 Years | 0 (0.0%) | 0 (0.0%) |
| 35 to 64 Years | 4 (4.8%) | 0 (0.0%) |
| 65 to 74 Years | 0 (0.0%) | 0 (0.0%) |
| 75 Years and over | 0 (0.0%) | 0 (0.0%) |
Technology Access in Holloway
Computing Device Access in Holloway
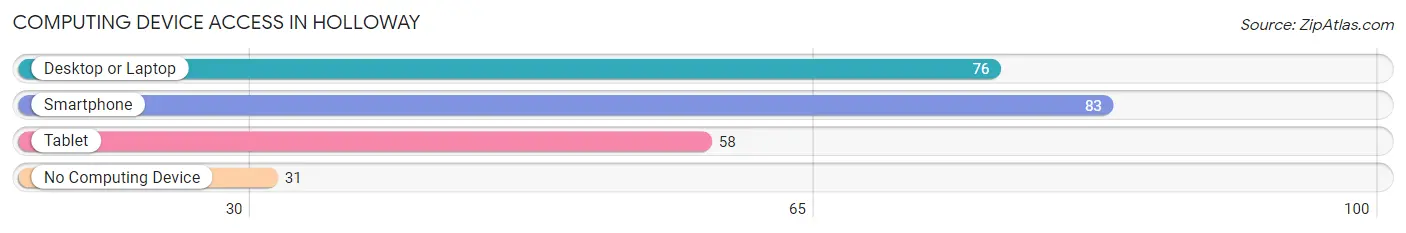
| Device Type | # Households | % Households |
| Desktop or Laptop | 76 | 60.3% |
| Smartphone | 83 | 65.9% |
| Tablet | 58 | 46.0% |
| No Computing Device | 31 | 24.6% |
| Total | 126 | 100.0% |
Internet Access in Holloway
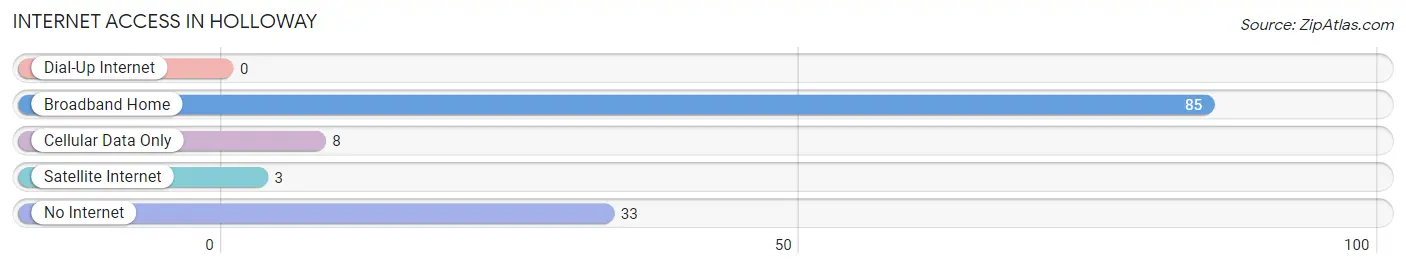
| Internet Type | # Households | % Households |
| Dial-Up Internet | 0 | 0.0% |
| Broadband Home | 85 | 67.5% |
| Cellular Data Only | 8 | 6.4% |
| Satellite Internet | 3 | 2.4% |
| No Internet | 33 | 26.2% |
| Total | 126 | 100.0% |
Holloway Summary
Holloway is a small village located in the northwest corner of Fulton County, Ohio. It is situated on the banks of the Maumee River, approximately 10 miles south of the city of Toledo. The village has a population of approximately 500 people and covers an area of 0.6 square miles.
History
Holloway was founded in 1837 by a group of settlers from Pennsylvania. The village was named after the Holloway family, who were among the first settlers. The village was originally a farming community, but in the late 19th century, it became a center for the lumber industry. The village was incorporated in 1891.
In the early 20th century, Holloway was a popular tourist destination. It was known for its scenic beauty and its many recreational activities, such as fishing, boating, and swimming. The village also had a number of hotels and resorts.
In the 1950s, the village began to decline as the lumber industry moved away and tourism decreased. The village was hit hard by the Great Recession of 2008, and many businesses closed. However, the village has since seen a resurgence in recent years, with new businesses opening and the population increasing.
Geography
Holloway is located in the northwest corner of Fulton County, Ohio. It is situated on the banks of the Maumee River, approximately 10 miles south of the city of Toledo. The village has a total area of 0.6 square miles, all of which is land.
The village is located in a rural area, with rolling hills and forests. The Maumee River runs through the village, providing a scenic backdrop. The village is also home to several parks, including Holloway Park and the Holloway Nature Preserve.
Economy
Holloway is a small, rural village with a limited economy. The village is home to a few small businesses, including a grocery store, a hardware store, and a few restaurants. The village also has a few small manufacturing companies.
The village is also home to a number of farms, which produce a variety of crops, including corn, soybeans, and wheat. The village also has a number of wineries and vineyards, which produce a variety of wines.
Demographics
As of the 2010 census, the village had a population of 500 people. The racial makeup of the village was 97.2% White, 0.6% African American, 0.2% Native American, 0.2% Asian, and 1.8% from other races. The median household income was $41,250, and the median family income was $50,000.
The village is home to a number of churches, including the First United Methodist Church, the Holloway Baptist Church, and the St. John's Lutheran Church. The village also has a public library and a post office.
Conclusion
Holloway is a small village located in the northwest corner of Fulton County, Ohio. It is situated on the banks of the Maumee River, approximately 10 miles south of the city of Toledo. The village has a population of approximately 500 people and covers an area of 0.6 square miles. The village was founded in 1837 and was originally a farming community. In the early 20th century, it became a center for the lumber industry and a popular tourist destination. The village has seen a resurgence in recent years, with new businesses opening and the population increasing. The village is home to a few small businesses, farms, wineries, and vineyards. The racial makeup of the village is 97.2% White, 0.6% African American, 0.2% Native American, 0.2% Asian, and 1.8% from other races. The median household income is $41,250, and the median family income is $50,000. The village is home to a number of churches, a public library, and a post office.
Common Questions
What is the Total Population of Holloway?
Total Population of Holloway is 352.
What is the Total Male Population of Holloway?
Total Male Population of Holloway is 195.
What is the Total Female Population of Holloway?
Total Female Population of Holloway is 157.
What is the Ratio of Males per 100 Females in Holloway?
There are 124.20 Males per 100 Females in Holloway.
What is the Ratio of Females per 100 Males in Holloway?
There are 80.51 Females per 100 Males in Holloway.
What is the Median Population Age in Holloway?
Median Population Age in Holloway is 35.1 Years.
What is the Average Family Size in Holloway
Average Family Size in Holloway is 3.6 People.
What is the Average Household Size in Holloway
Average Household Size in Holloway is 2.8 People.
What is Per Capita Income in Holloway?
Per Capita income in Holloway is $20,192.
What is the Median Family Income in Holloway?
Median Family Income in Holloway is $52,344.
What is the Median Household income in Holloway?
Median Household Income in Holloway is $51,154.
What is Inequality or Gini Index in Holloway?
Inequality or Gini Index in Holloway is 0.40.
How Large is the Labor Force in Holloway?
There are 151 People in the Labor Forcein in Holloway.
What is the Percentage of People in the Labor Force in Holloway?
58.8% of People are in the Labor Force in Holloway.