Kings Mills, OH
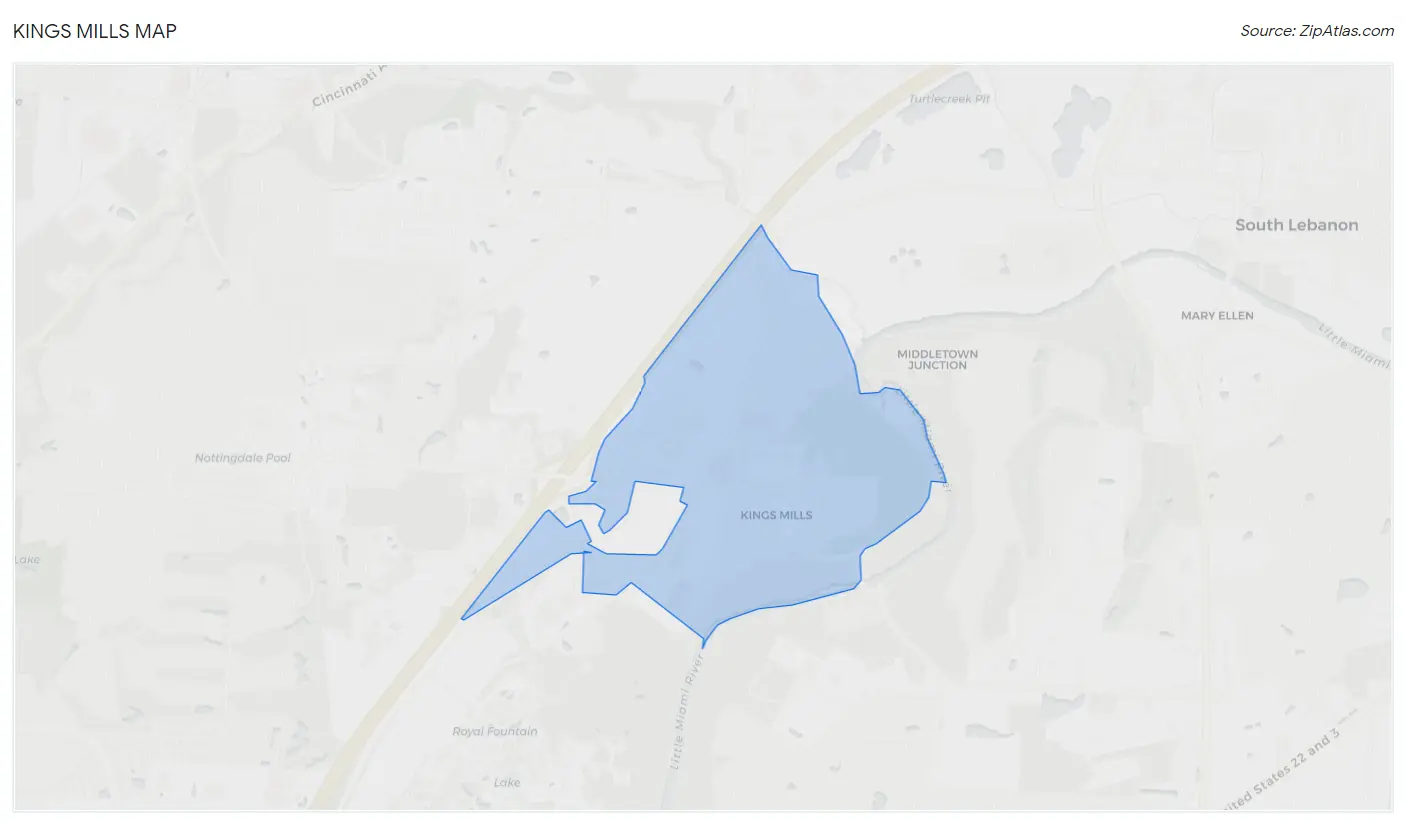
Kings Mills Map
Kings Mills Overview
1,159
TOTAL POPULATION
593
MALE POPULATION
566
FEMALE POPULATION
104.77
MALES / 100 FEMALES
95.45
FEMALES / 100 MALES
47.4
MEDIAN AGE
2.8
AVG FAMILY SIZE
2.3
AVG HOUSEHOLD SIZE
$60,294
PER CAPITA INCOME
$124,931
AVG FAMILY INCOME
$125,655
AVG HOUSEHOLD INCOME
17.5%
WAGE / INCOME GAP [ % ]
82.5¢/ $1
WAGE / INCOME GAP [ $ ]
0.42
INEQUALITY / GINI INDEX
855
LABOR FORCE [ PEOPLE ]
83.8%
PERCENT IN LABOR FORCE
1.6%
UNEMPLOYMENT RATE
Kings Mills Zip Codes
Kings Mills Area Codes
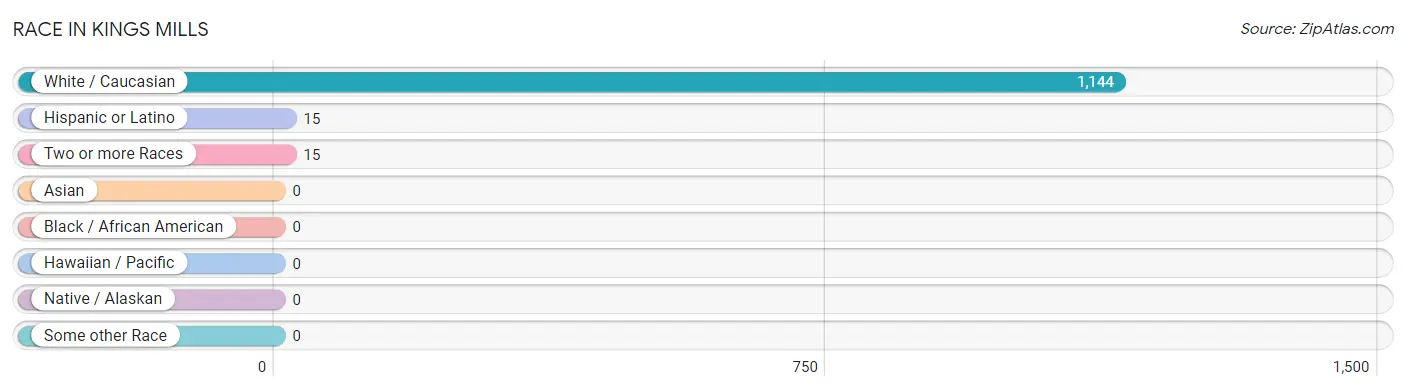
Race in Kings Mills
The most populous races in Kings Mills are White / Caucasian (1,144 | 98.7%), Hispanic or Latino (15 | 1.3%), and Two or more Races (15 | 1.3%).
| Race | # Population | % Population |
| Asian | 0 | 0.0% |
| Black / African American | 0 | 0.0% |
| Hawaiian / Pacific | 0 | 0.0% |
| Hispanic or Latino | 15 | 1.3% |
| Native / Alaskan | 0 | 0.0% |
| White / Caucasian | 1,144 | 98.7% |
| Two or more Races | 15 | 1.3% |
| Some other Race | 0 | 0.0% |
| Total | 1,159 | 100.0% |
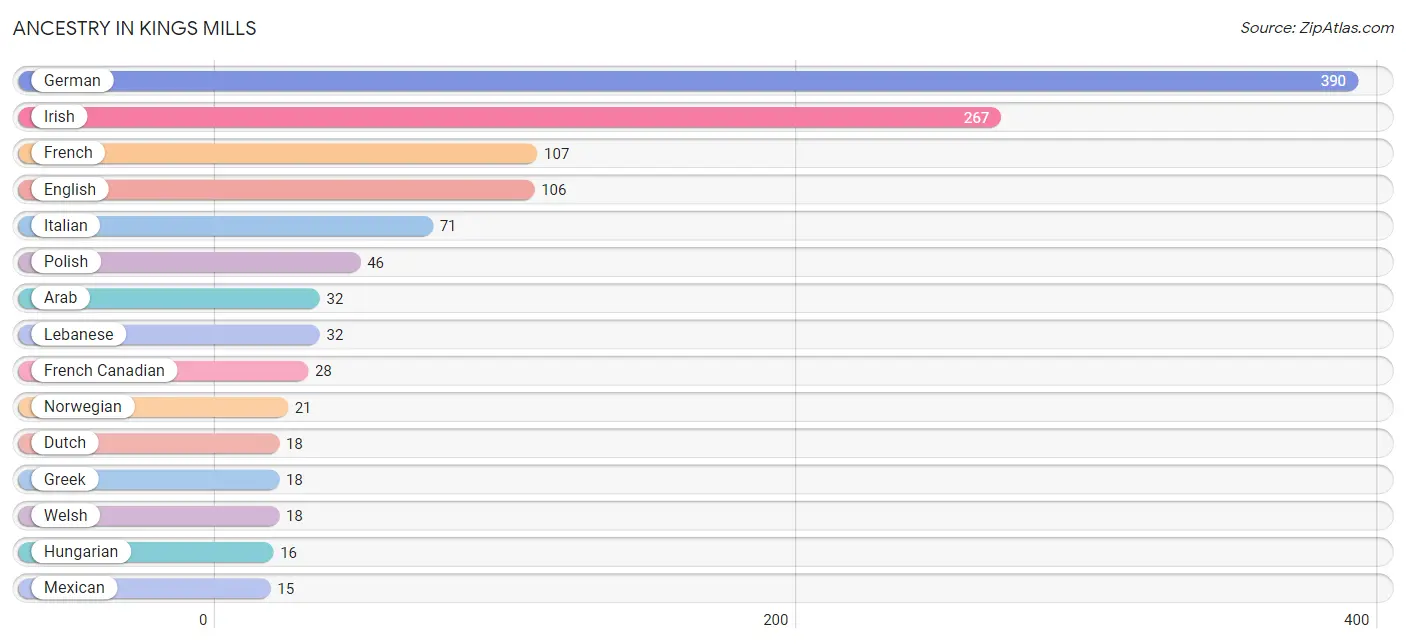
Ancestry in Kings Mills
The most populous ancestries reported in Kings Mills are German (390 | 33.7%), Irish (267 | 23.0%), French (107 | 9.2%), English (106 | 9.1%), and Italian (71 | 6.1%), together accounting for 81.2% of all Kings Mills residents.
| Ancestry | # Population | % Population |
| Arab | 32 | 2.8% |
| Dutch | 18 | 1.5% |
| Eastern European | 13 | 1.1% |
| English | 106 | 9.1% |
| French | 107 | 9.2% |
| French Canadian | 28 | 2.4% |
| German | 390 | 33.7% |
| Greek | 18 | 1.5% |
| Hungarian | 16 | 1.4% |
| Irish | 267 | 23.0% |
| Italian | 71 | 6.1% |
| Lebanese | 32 | 2.8% |
| Mexican | 15 | 1.3% |
| Norwegian | 21 | 1.8% |
| Polish | 46 | 4.0% |
| Welsh | 18 | 1.5% | View All 16 Rows |
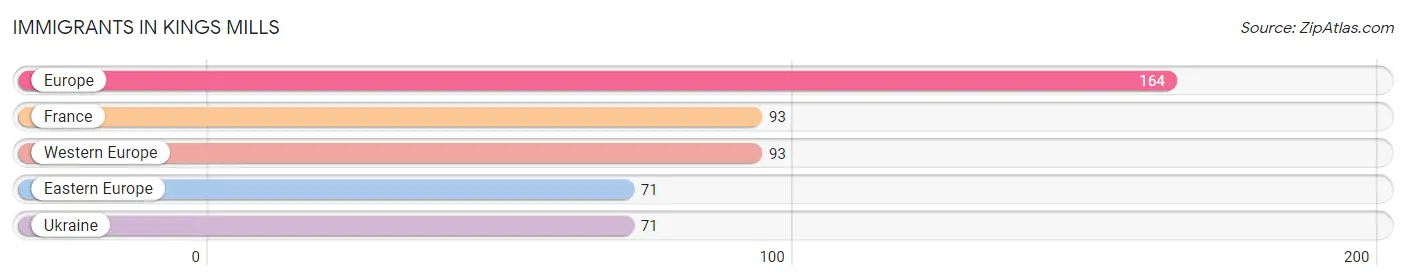
Immigrants in Kings Mills
The most numerous immigrant groups reported in Kings Mills came from Europe (164 | 14.1%), France (93 | 8.0%), Western Europe (93 | 8.0%), Eastern Europe (71 | 6.1%), and Ukraine (71 | 6.1%), together accounting for 42.4% of all Kings Mills residents.
| Immigration Origin | # Population | % Population |
| Eastern Europe | 71 | 6.1% |
| Europe | 164 | 14.1% |
| France | 93 | 8.0% |
| Ukraine | 71 | 6.1% |
| Western Europe | 93 | 8.0% | View All 5 Rows |
Sex and Age in Kings Mills
Sex and Age in Kings Mills
The most populous age groups in Kings Mills are 20 to 24 Years (71 | 12.0%) for men and 60 to 64 Years (112 | 19.8%) for women.
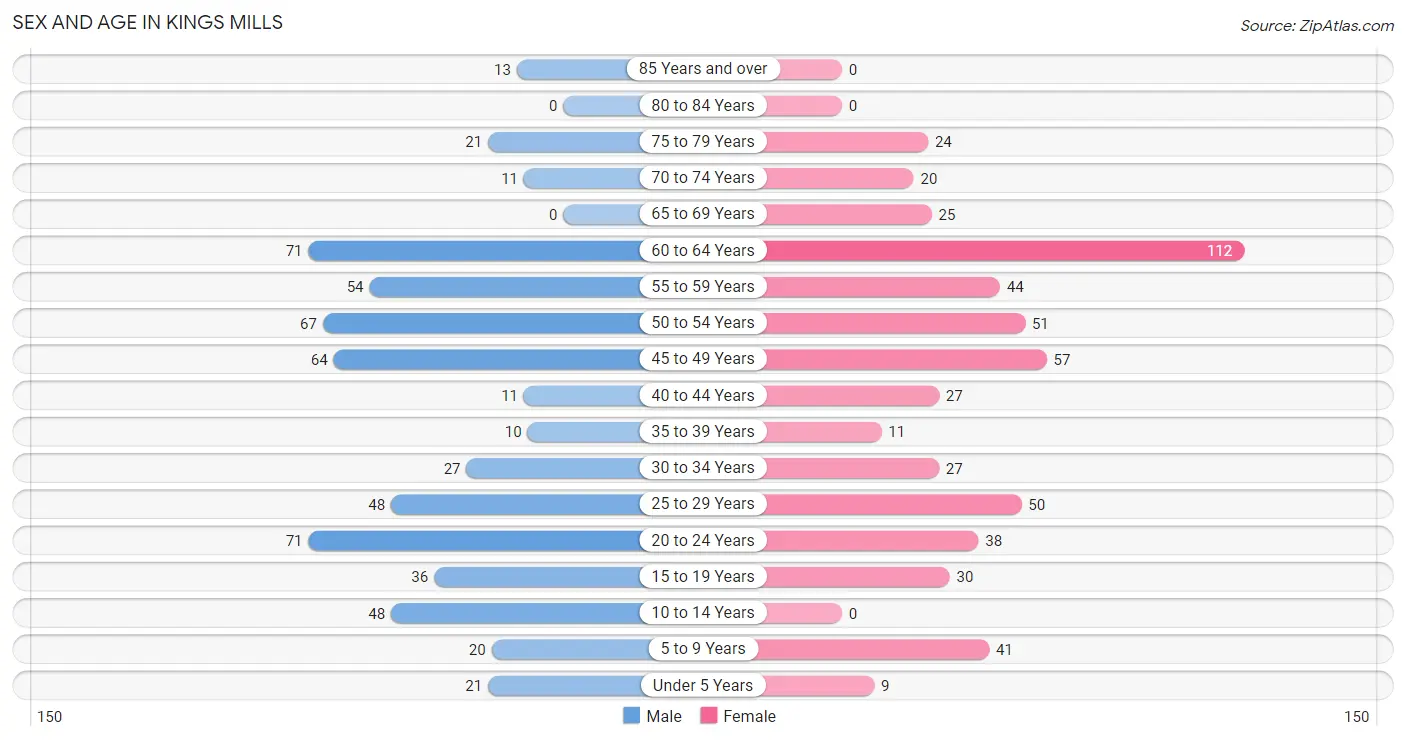
| Age Bracket | Male | Female |
| Under 5 Years | 21 (3.5%) | 9 (1.6%) |
| 5 to 9 Years | 20 (3.4%) | 41 (7.2%) |
| 10 to 14 Years | 48 (8.1%) | 0 (0.0%) |
| 15 to 19 Years | 36 (6.1%) | 30 (5.3%) |
| 20 to 24 Years | 71 (12.0%) | 38 (6.7%) |
| 25 to 29 Years | 48 (8.1%) | 50 (8.8%) |
| 30 to 34 Years | 27 (4.5%) | 27 (4.8%) |
| 35 to 39 Years | 10 (1.7%) | 11 (1.9%) |
| 40 to 44 Years | 11 (1.8%) | 27 (4.8%) |
| 45 to 49 Years | 64 (10.8%) | 57 (10.1%) |
| 50 to 54 Years | 67 (11.3%) | 51 (9.0%) |
| 55 to 59 Years | 54 (9.1%) | 44 (7.8%) |
| 60 to 64 Years | 71 (12.0%) | 112 (19.8%) |
| 65 to 69 Years | 0 (0.0%) | 25 (4.4%) |
| 70 to 74 Years | 11 (1.8%) | 20 (3.5%) |
| 75 to 79 Years | 21 (3.5%) | 24 (4.2%) |
| 80 to 84 Years | 0 (0.0%) | 0 (0.0%) |
| 85 Years and over | 13 (2.2%) | 0 (0.0%) |
| Total | 593 (100.0%) | 566 (100.0%) |
Families and Households in Kings Mills
Median Family Size in Kings Mills
The median family size in Kings Mills is 2.83 persons per family, with married-couple families (253 | 76.9%) accounting for the largest median family size of 3 persons per family. On the other hand, single female/mother families (48 | 14.6%) represent the smallest median family size with 2.02 persons per family.
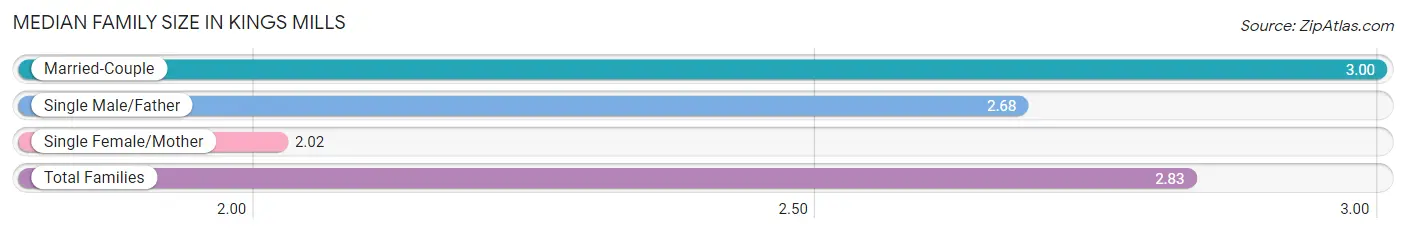
| Family Type | # Families | Family Size |
| Married-Couple | 253 (76.9%) | 3.00 |
| Single Male/Father | 28 (8.5%) | 2.68 |
| Single Female/Mother | 48 (14.6%) | 2.02 |
| Total Families | 329 (100.0%) | 2.83 |
Median Household Size in Kings Mills
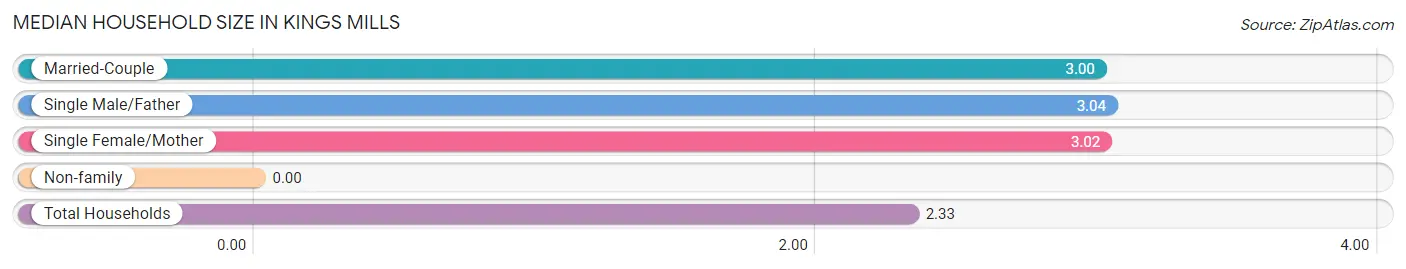
| Household Type | # Households | Household Size |
| Married-Couple | 253 (50.8%) | 3.00 |
| Single Male/Father | 28 (5.6%) | 3.04 |
| Single Female/Mother | 48 (9.6%) | 3.02 |
| Non-family | 169 (33.9%) | - |
| Total Households | 498 (100.0%) | 2.33 |
Household Size by Marriage Status in Kings Mills
Out of a total of 498 households in Kings Mills, 329 (66.1%) are family households, while 169 (33.9%) are nonfamily households. The most numerous type of family households are 3-person households, comprising 160, and the most common type of nonfamily households are 1-person households, comprising 169.
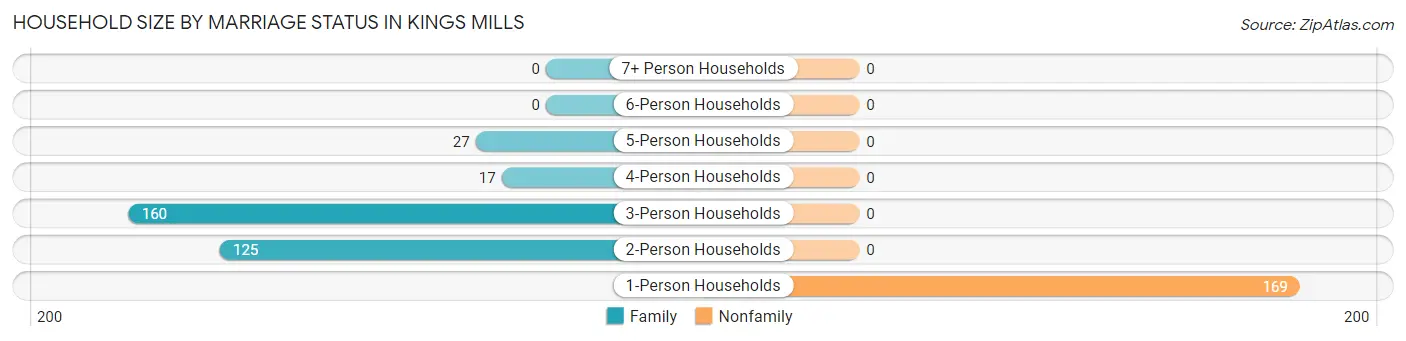
| Household Size | Family Households | Nonfamily Households |
| 1-Person Households | - | 169 (33.9%) |
| 2-Person Households | 125 (25.1%) | 0 (0.0%) |
| 3-Person Households | 160 (32.1%) | 0 (0.0%) |
| 4-Person Households | 17 (3.4%) | 0 (0.0%) |
| 5-Person Households | 27 (5.4%) | 0 (0.0%) |
| 6-Person Households | 0 (0.0%) | 0 (0.0%) |
| 7+ Person Households | 0 (0.0%) | 0 (0.0%) |
| Total | 329 (66.1%) | 169 (33.9%) |
Female Fertility in Kings Mills
Fertility by Age in Kings Mills
| Age Bracket | Women with Births | Births / 1,000 Women |
| 15 to 19 years | 0 (0.0%) | 0.0 |
| 20 to 34 years | 0 (0.0%) | 0.0 |
| 35 to 50 years | 0 (0.0%) | 0.0 |
| Total | 0 (0.0%) | 0.0 |
Fertility by Age by Marriage Status in Kings Mills
| Age Bracket | Married | Unmarried |
| 15 to 19 years | 0 (0.0%) | 0 (0.0%) |
| 20 to 34 years | 0 (0.0%) | 0 (0.0%) |
| 35 to 50 years | 0 (0.0%) | 0 (0.0%) |
| Total | 0 (0.0%) | 0 (0.0%) |
Fertility by Education in Kings Mills
| Educational Attainment | Women with Births | Births / 1,000 Women |
| Less than High School | 0 (0.0%) | 0.0 |
| High School Diploma | 0 (0.0%) | 0.0 |
| College or Associate's Degree | 0 (0.0%) | 0.0 |
| Bachelor's Degree | 0 (0.0%) | 0.0 |
| Graduate Degree | 0 (0.0%) | 0.0 |
| Total | 0 (0.0%) | 0.0 |
Fertility by Education by Marriage Status in Kings Mills
| Educational Attainment | Married | Unmarried |
| Less than High School | 0 (0.0%) | 0 (0.0%) |
| High School Diploma | 0 (0.0%) | 0 (0.0%) |
| College or Associate's Degree | 0 (0.0%) | 0 (0.0%) |
| Bachelor's Degree | 0 (0.0%) | 0 (0.0%) |
| Graduate Degree | 0 (0.0%) | 0 (0.0%) |
| Total | 0 (0.0%) | 0 (0.0%) |
Income in Kings Mills
Income Overview in Kings Mills
Per Capita Income in Kings Mills is $60,294, while median incomes of families and households are $124,931 and $125,655 respectively.
| Characteristic | Number | Measure |
| Per Capita Income | 1,159 | $60,294 |
| Median Family Income | 329 | $124,931 |
| Mean Family Income | 329 | $127,321 |
| Median Household Income | 498 | $125,655 |
| Mean Household Income | 498 | $137,889 |
| Income Deficit | 329 | $0 |
| Wage / Income Gap (%) | 1,159 | 17.55% |
| Wage / Income Gap ($) | 1,159 | 82.45¢ per $1 |
| Gini / Inequality Index | 1,159 | 0.42 |
Earnings by Sex in Kings Mills
Average Earnings in Kings Mills are $42,682, $45,972 for men and $37,904 for women, a difference of 17.5%.
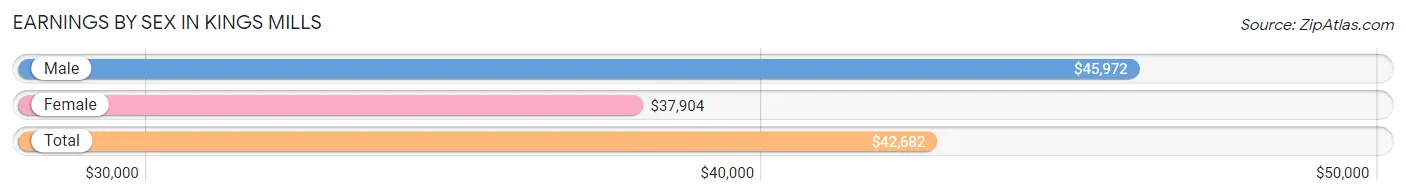
| Sex | Number | Average Earnings |
| Male | 482 (53.8%) | $45,972 |
| Female | 413 (46.2%) | $37,904 |
| Total | 895 (100.0%) | $42,682 |
Earnings by Sex by Income Bracket in Kings Mills
The most common earnings brackets in Kings Mills are $100,000+ for men (123 | 25.5%) and $12,500 to $14,999 for women (59 | 14.3%).
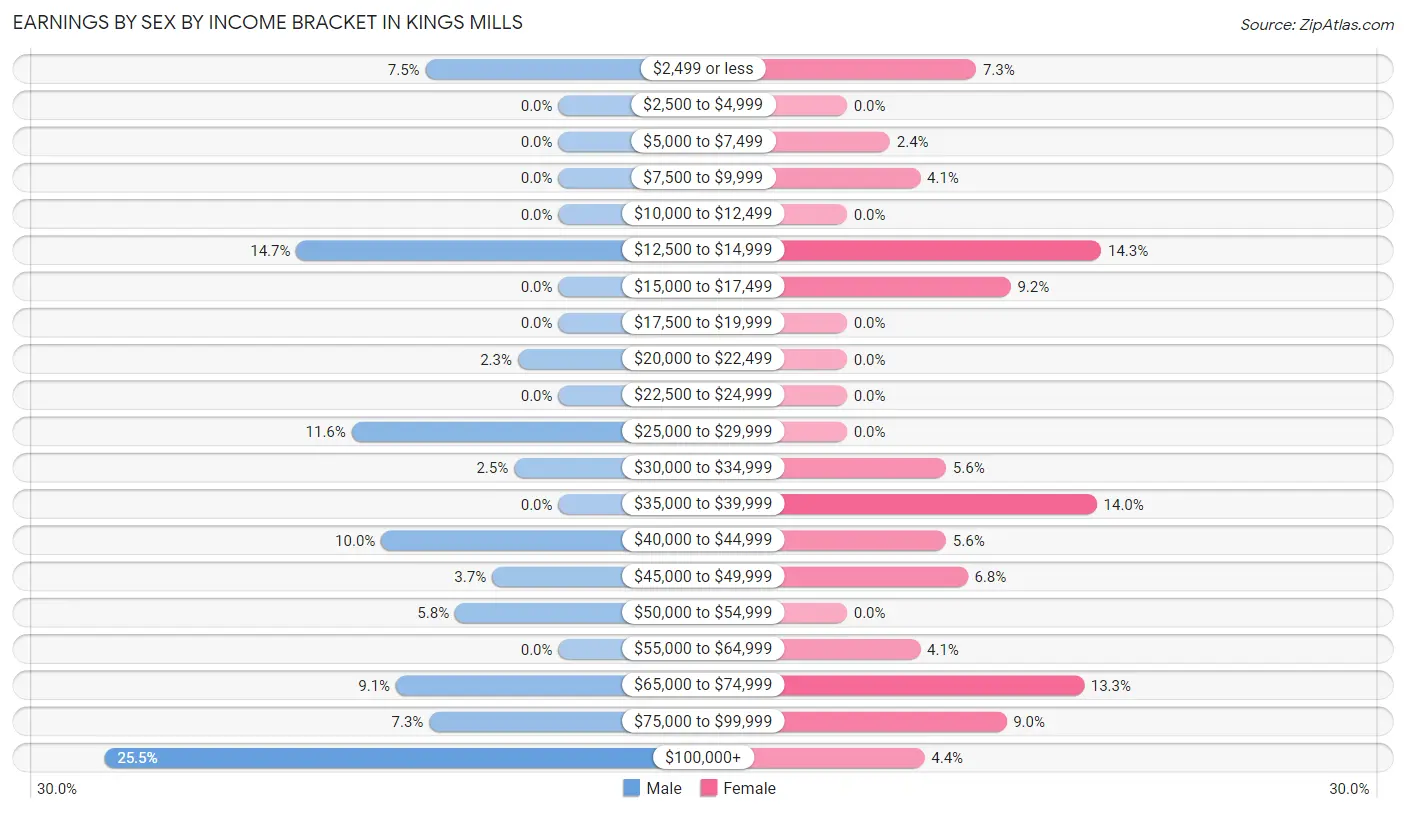
| Income | Male | Female |
| $2,499 or less | 36 (7.5%) | 30 (7.3%) |
| $2,500 to $4,999 | 0 (0.0%) | 0 (0.0%) |
| $5,000 to $7,499 | 0 (0.0%) | 10 (2.4%) |
| $7,500 to $9,999 | 0 (0.0%) | 17 (4.1%) |
| $10,000 to $12,499 | 0 (0.0%) | 0 (0.0%) |
| $12,500 to $14,999 | 71 (14.7%) | 59 (14.3%) |
| $15,000 to $17,499 | 0 (0.0%) | 38 (9.2%) |
| $17,500 to $19,999 | 0 (0.0%) | 0 (0.0%) |
| $20,000 to $22,499 | 11 (2.3%) | 0 (0.0%) |
| $22,500 to $24,999 | 0 (0.0%) | 0 (0.0%) |
| $25,000 to $29,999 | 56 (11.6%) | 0 (0.0%) |
| $30,000 to $34,999 | 12 (2.5%) | 23 (5.6%) |
| $35,000 to $39,999 | 0 (0.0%) | 58 (14.0%) |
| $40,000 to $44,999 | 48 (10.0%) | 23 (5.6%) |
| $45,000 to $49,999 | 18 (3.7%) | 28 (6.8%) |
| $50,000 to $54,999 | 28 (5.8%) | 0 (0.0%) |
| $55,000 to $64,999 | 0 (0.0%) | 17 (4.1%) |
| $65,000 to $74,999 | 44 (9.1%) | 55 (13.3%) |
| $75,000 to $99,999 | 35 (7.3%) | 37 (9.0%) |
| $100,000+ | 123 (25.5%) | 18 (4.4%) |
| Total | 482 (100.0%) | 413 (100.0%) |
Earnings by Sex by Educational Attainment in Kings Mills
Average earnings in Kings Mills are $70,592 for men and $40,598 for women, a difference of 42.5%. Men with an educational attainment of bachelor's degree enjoy the highest average annual earnings of $204,250, while those with bachelor's degree education earn the least with $204,250. Women with an educational attainment of bachelor's degree earn the most with the average annual earnings of $67,857, while those with bachelor's degree education have the smallest earnings of $67,857.
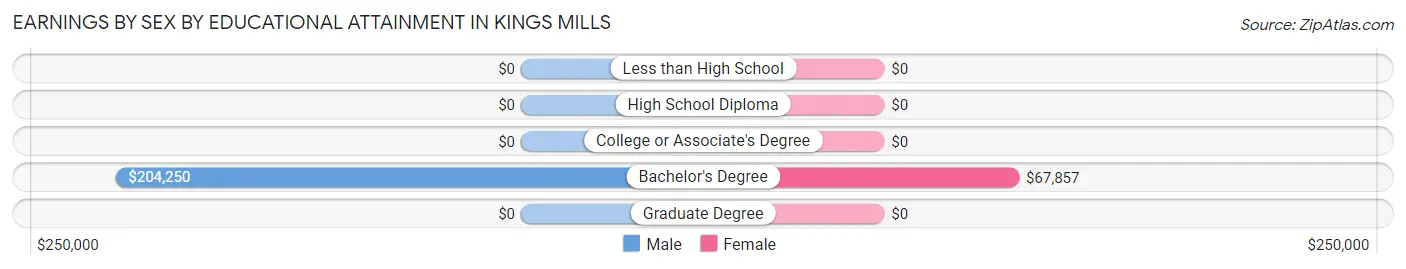
| Educational Attainment | Male Income | Female Income |
| Less than High School | - | - |
| High School Diploma | - | - |
| College or Associate's Degree | - | - |
| Bachelor's Degree | $204,250 | $67,857 |
| Graduate Degree | - | - |
| Total | $70,592 | $40,598 |
Family Income in Kings Mills
Family Income Brackets in Kings Mills
According to the Kings Mills family income data, there are 85 families falling into the $150,000 to $199,999 income range, which is the most common income bracket and makes up 25.8% of all families.
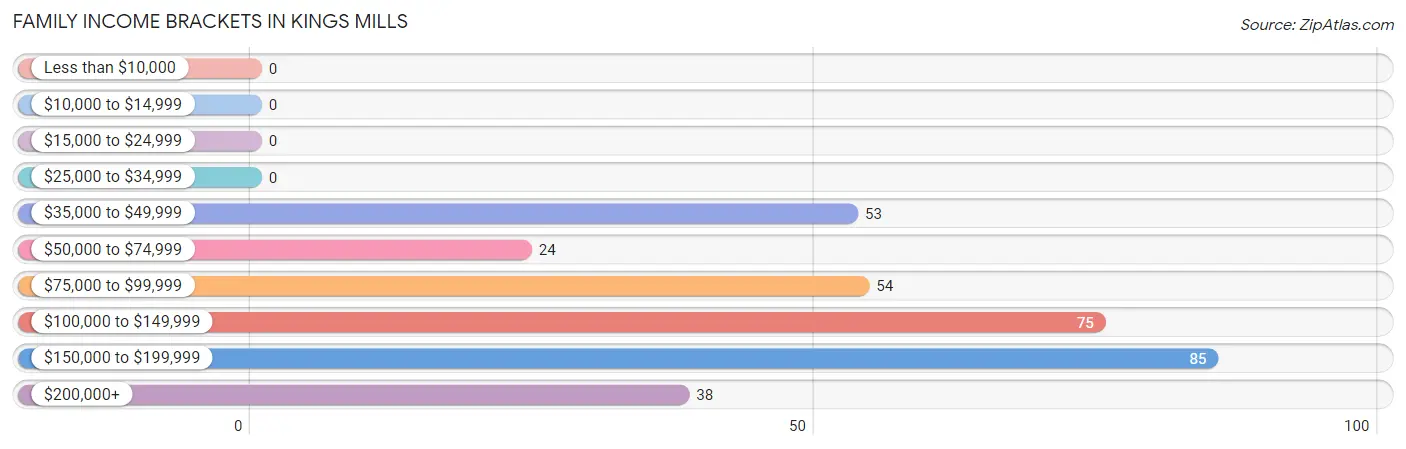
| Income Bracket | # Families | % Families |
| Less than $10,000 | 0 | 0.0% |
| $10,000 to $14,999 | 0 | 0.0% |
| $15,000 to $24,999 | 0 | 0.0% |
| $25,000 to $34,999 | 0 | 0.0% |
| $35,000 to $49,999 | 53 | 16.1% |
| $50,000 to $74,999 | 24 | 7.3% |
| $75,000 to $99,999 | 54 | 16.4% |
| $100,000 to $149,999 | 75 | 22.8% |
| $150,000 to $199,999 | 85 | 25.8% |
| $200,000+ | 38 | 11.6% |
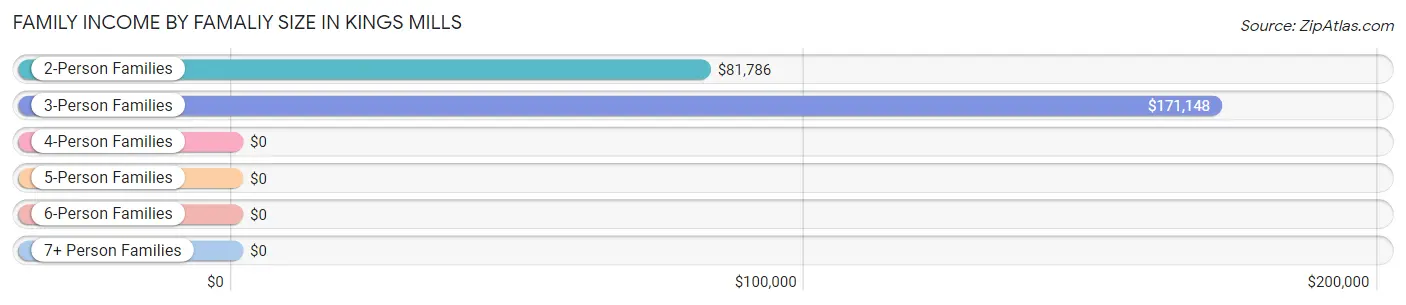
Family Income by Famaliy Size in Kings Mills
3-person families (107 | 32.5%) account for the highest median family income in Kings Mills with $171,148 per family, while 3-person families (107 | 32.5%) have the highest median income of $57,049 per family member.
| Income Bracket | # Families | Median Income |
| 2-Person Families | 178 (54.1%) | $81,786 |
| 3-Person Families | 107 (32.5%) | $171,148 |
| 4-Person Families | 17 (5.2%) | $0 |
| 5-Person Families | 27 (8.2%) | $0 |
| 6-Person Families | 0 (0.0%) | $0 |
| 7+ Person Families | 0 (0.0%) | $0 |
| Total | 329 (100.0%) | $124,931 |
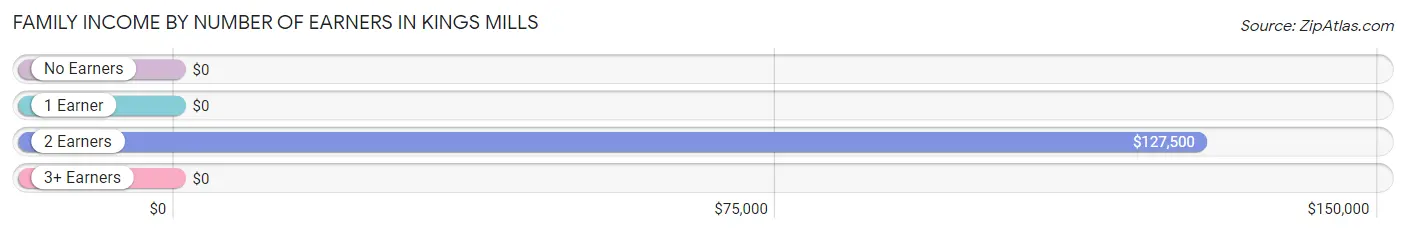
Family Income by Number of Earners in Kings Mills
| Number of Earners | # Families | Median Income |
| No Earners | 9 (2.7%) | $0 |
| 1 Earner | 54 (16.4%) | $0 |
| 2 Earners | 222 (67.5%) | $127,500 |
| 3+ Earners | 44 (13.4%) | $0 |
| Total | 329 (100.0%) | $124,931 |
Household Income in Kings Mills
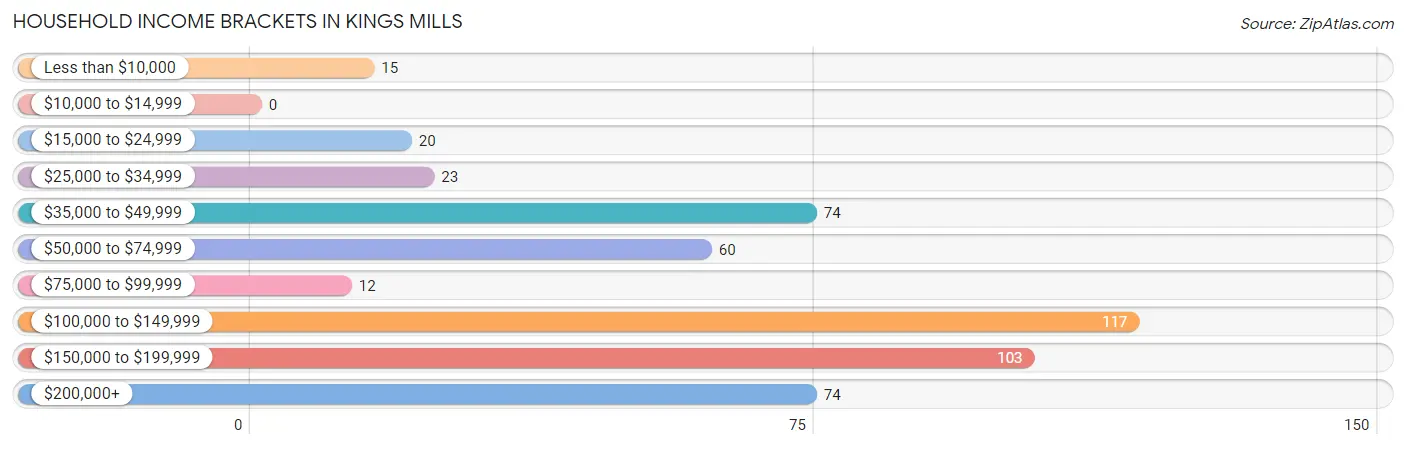
Household Income Brackets in Kings Mills
With 117 households falling in the category, the $100,000 to $149,999 income range is the most frequent in Kings Mills, accounting for 23.5% of all households.
| Income Bracket | # Households | % Households |
| Less than $10,000 | 15 | 3.0% |
| $10,000 to $14,999 | 0 | 0.0% |
| $15,000 to $24,999 | 20 | 4.0% |
| $25,000 to $34,999 | 23 | 4.6% |
| $35,000 to $49,999 | 74 | 14.9% |
| $50,000 to $74,999 | 60 | 12.0% |
| $75,000 to $99,999 | 12 | 2.4% |
| $100,000 to $149,999 | 117 | 23.5% |
| $150,000 to $199,999 | 103 | 20.7% |
| $200,000+ | 74 | 14.9% |
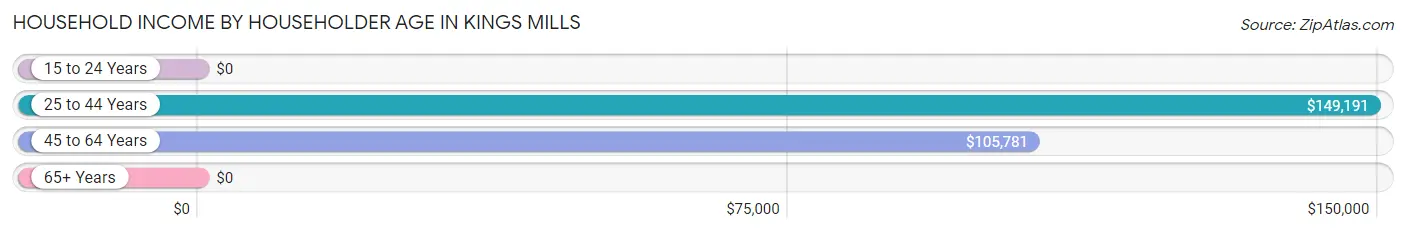
Household Income by Householder Age in Kings Mills
The median household income in Kings Mills is $125,655, with the highest median household income of $149,191 found in the 25 to 44 years age bracket for the primary householder. A total of 107 households (21.5%) fall into this category.
| Income Bracket | # Households | Median Income |
| 15 to 24 Years | 0 (0.0%) | $0 |
| 25 to 44 Years | 107 (21.5%) | $149,191 |
| 45 to 64 Years | 324 (65.1%) | $105,781 |
| 65+ Years | 67 (13.5%) | $0 |
| Total | 498 (100.0%) | $125,655 |
Poverty in Kings Mills
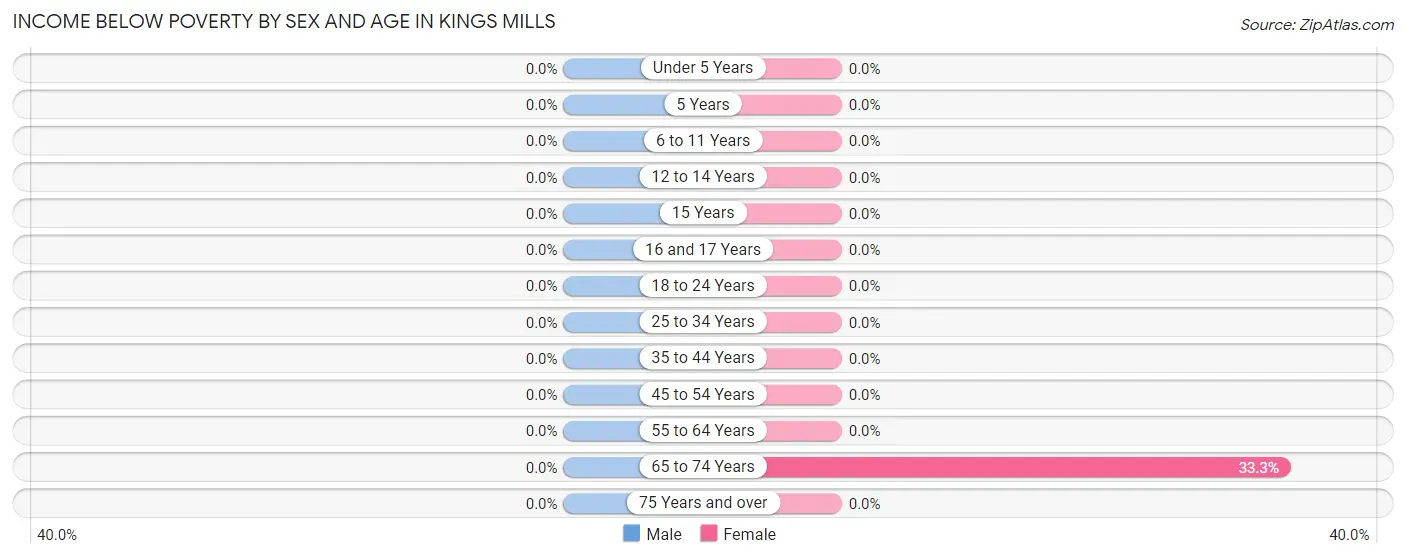
Income Below Poverty by Sex and Age in Kings Mills
| Age Bracket | Male | Female |
| Under 5 Years | 0 (0.0%) | 0 (0.0%) |
| 5 Years | 0 (0.0%) | 0 (0.0%) |
| 6 to 11 Years | 0 (0.0%) | 0 (0.0%) |
| 12 to 14 Years | 0 (0.0%) | 0 (0.0%) |
| 15 Years | 0 (0.0%) | 0 (0.0%) |
| 16 and 17 Years | 0 (0.0%) | 0 (0.0%) |
| 18 to 24 Years | 0 (0.0%) | 0 (0.0%) |
| 25 to 34 Years | 0 (0.0%) | 0 (0.0%) |
| 35 to 44 Years | 0 (0.0%) | 0 (0.0%) |
| 45 to 54 Years | 0 (0.0%) | 0 (0.0%) |
| 55 to 64 Years | 0 (0.0%) | 0 (0.0%) |
| 65 to 74 Years | 0 (0.0%) | 15 (33.3%) |
| 75 Years and over | 0 (0.0%) | 0 (0.0%) |
| Total | 0 (0.0%) | 15 (2.6%) |
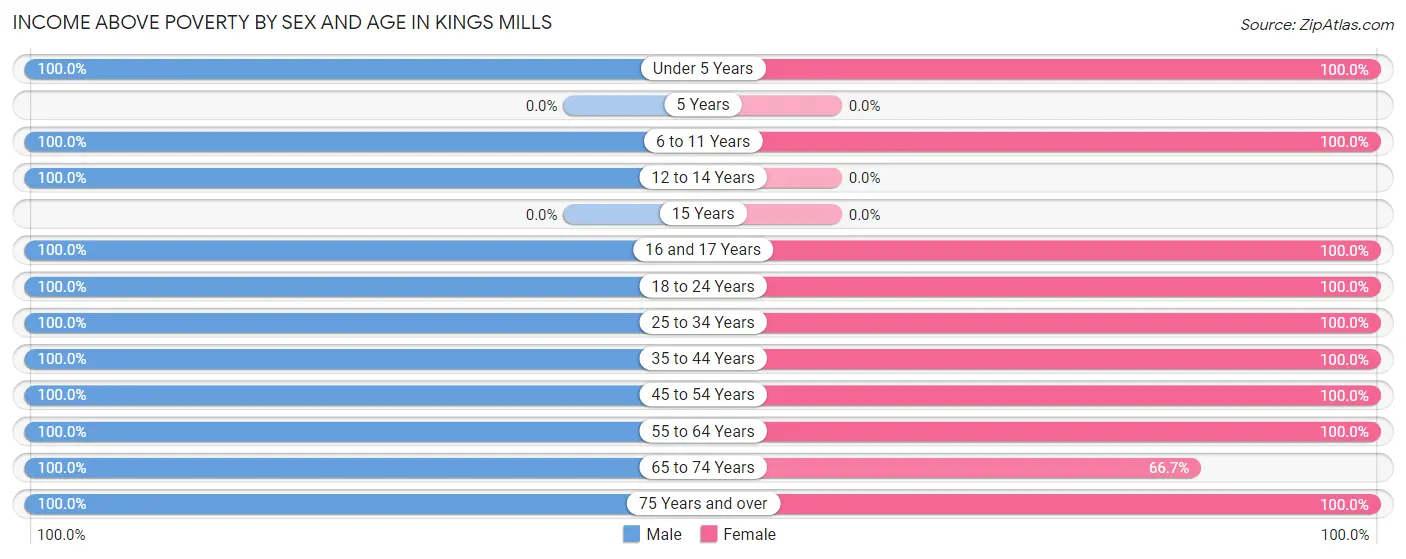
Income Above Poverty by Sex and Age in Kings Mills
According to the poverty statistics in Kings Mills, males aged under 5 years and females aged under 5 years are the age groups that are most secure financially, with 100.0% of males and 100.0% of females in these age groups living above the poverty line.
| Age Bracket | Male | Female |
| Under 5 Years | 21 (100.0%) | 9 (100.0%) |
| 5 Years | 0 (0.0%) | 0 (0.0%) |
| 6 to 11 Years | 20 (100.0%) | 41 (100.0%) |
| 12 to 14 Years | 48 (100.0%) | 0 (0.0%) |
| 15 Years | 0 (0.0%) | 0 (0.0%) |
| 16 and 17 Years | 15 (100.0%) | 30 (100.0%) |
| 18 to 24 Years | 92 (100.0%) | 38 (100.0%) |
| 25 to 34 Years | 75 (100.0%) | 77 (100.0%) |
| 35 to 44 Years | 21 (100.0%) | 38 (100.0%) |
| 45 to 54 Years | 131 (100.0%) | 108 (100.0%) |
| 55 to 64 Years | 125 (100.0%) | 156 (100.0%) |
| 65 to 74 Years | 11 (100.0%) | 30 (66.7%) |
| 75 Years and over | 34 (100.0%) | 24 (100.0%) |
| Total | 593 (100.0%) | 551 (97.4%) |
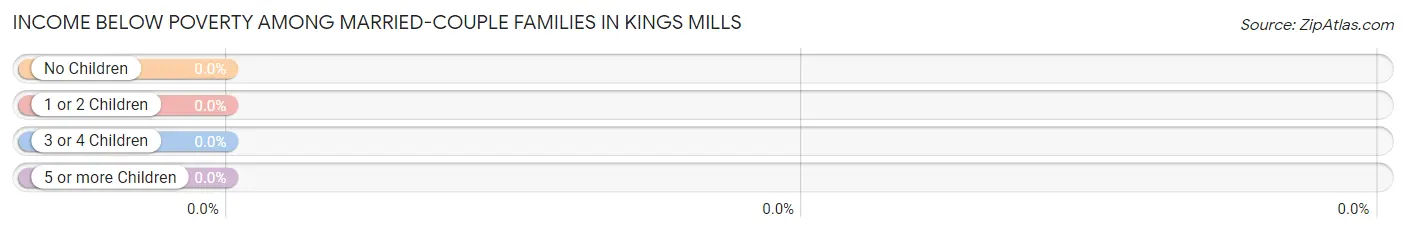
Income Below Poverty Among Married-Couple Families in Kings Mills
| Children | Above Poverty | Below Poverty |
| No Children | 181 (100.0%) | 0 (0.0%) |
| 1 or 2 Children | 72 (100.0%) | 0 (0.0%) |
| 3 or 4 Children | 0 (0.0%) | 0 (0.0%) |
| 5 or more Children | 0 (0.0%) | 0 (0.0%) |
| Total | 253 (100.0%) | 0 (0.0%) |
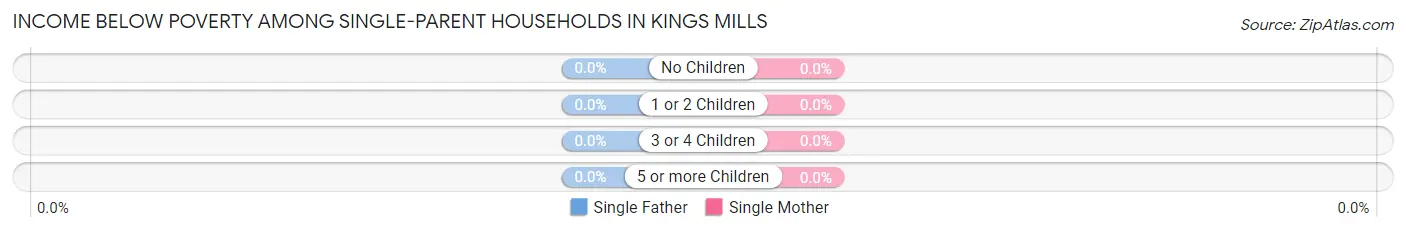
Income Below Poverty Among Single-Parent Households in Kings Mills
| Children | Single Father | Single Mother |
| No Children | 0 (0.0%) | 0 (0.0%) |
| 1 or 2 Children | 0 (0.0%) | 0 (0.0%) |
| 3 or 4 Children | 0 (0.0%) | 0 (0.0%) |
| 5 or more Children | 0 (0.0%) | 0 (0.0%) |
| Total | 0 (0.0%) | 0 (0.0%) |
Income Below Poverty Among Married-Couple vs Single-Parent Households in Kings Mills
| Children | Married-Couple Families | Single-Parent Households |
| No Children | 0 (0.0%) | 0 (0.0%) |
| 1 or 2 Children | 0 (0.0%) | 0 (0.0%) |
| 3 or 4 Children | 0 (0.0%) | 0 (0.0%) |
| 5 or more Children | 0 (0.0%) | 0 (0.0%) |
| Total | 0 (0.0%) | 0 (0.0%) |
Employment Characteristics in Kings Mills
Employment by Class of Employer in Kings Mills
Among the 841 employed individuals in Kings Mills, private company employees (680 | 80.9%), local government employees (59 | 7.0%), and not-for-profit organizations (56 | 6.7%) make up the most common classes of employment.
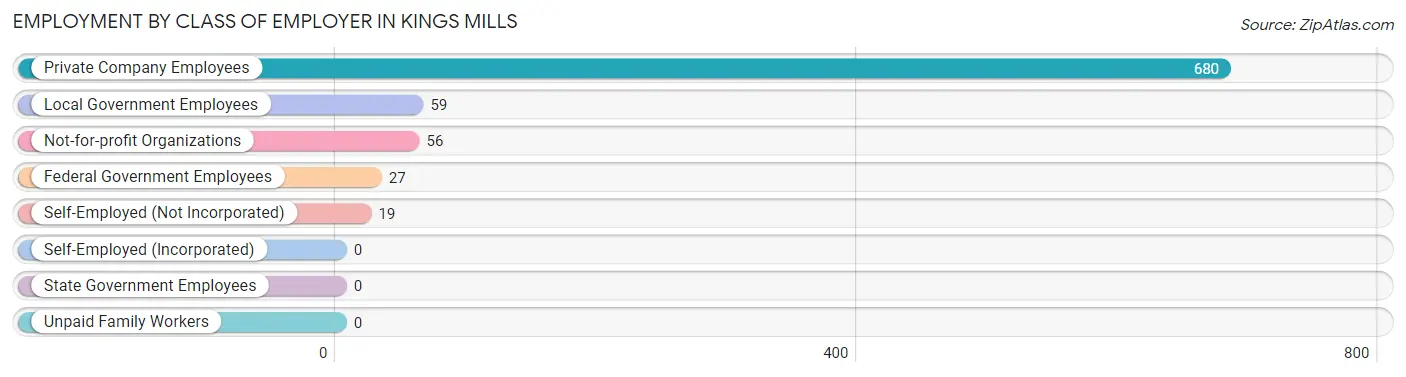
| Employer Class | # Employees | % Employees |
| Private Company Employees | 680 | 80.9% |
| Self-Employed (Incorporated) | 0 | 0.0% |
| Self-Employed (Not Incorporated) | 19 | 2.3% |
| Not-for-profit Organizations | 56 | 6.7% |
| Local Government Employees | 59 | 7.0% |
| State Government Employees | 0 | 0.0% |
| Federal Government Employees | 27 | 3.2% |
| Unpaid Family Workers | 0 | 0.0% |
| Total | 841 | 100.0% |
Employment Status by Age in Kings Mills
According to the labor force statistics for Kings Mills, out of the total population over 16 years of age (1,020), 83.8% or 855 individuals are in the labor force, with 1.6% or 14 of them unemployed. The age group with the highest labor force participation rate is 20 to 24 years, with 100.0% or 109 individuals in the labor force. Within the labor force, the 25 to 29 years age range has the highest percentage of unemployed individuals, with 8.2% or 8 of them being unemployed.
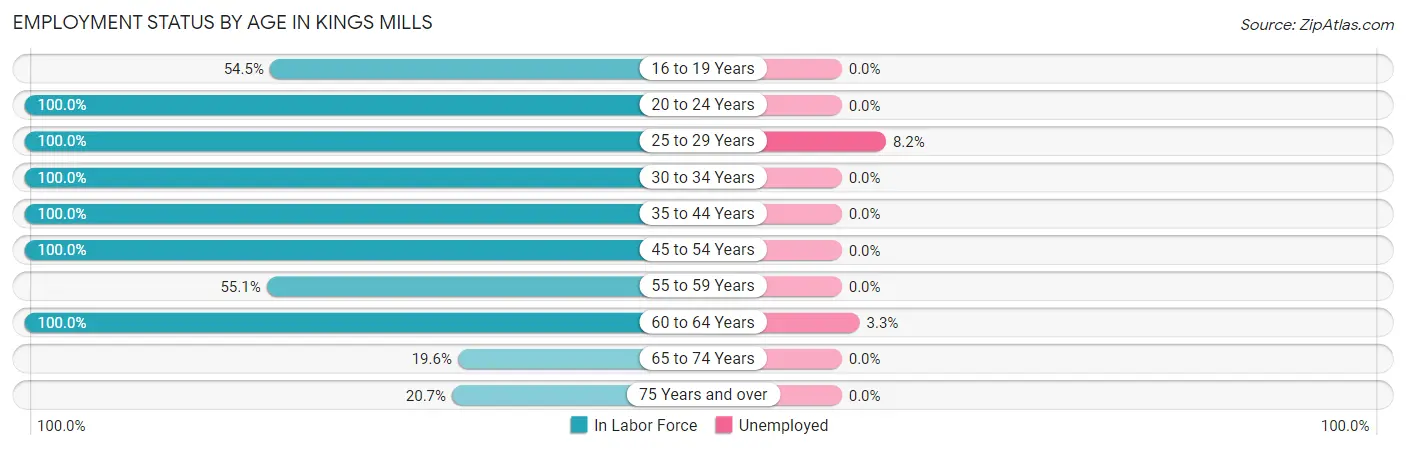
| Age Bracket | In Labor Force | Unemployed |
| 16 to 19 Years | 36 (54.5%) | 0 (0.0%) |
| 20 to 24 Years | 109 (100.0%) | 0 (0.0%) |
| 25 to 29 Years | 98 (100.0%) | 8 (8.2%) |
| 30 to 34 Years | 54 (100.0%) | 0 (0.0%) |
| 35 to 44 Years | 59 (100.0%) | 0 (0.0%) |
| 45 to 54 Years | 239 (100.0%) | 0 (0.0%) |
| 55 to 59 Years | 54 (55.1%) | 0 (0.0%) |
| 60 to 64 Years | 183 (100.0%) | 6 (3.3%) |
| 65 to 74 Years | 11 (19.6%) | 0 (0.0%) |
| 75 Years and over | 12 (20.7%) | 0 (0.0%) |
| Total | 855 (83.8%) | 14 (1.6%) |
Employment Status by Educational Attainment in Kings Mills
According to labor force statistics for Kings Mills, 94.0% of individuals (687) out of the total population between 25 and 64 years of age (731) are in the labor force, with 2.0% or 14 of them being unemployed. The group with the highest labor force participation rate are those with the educational attainment of less than high school, with 100.0% or 19 individuals in the labor force. Within the labor force, individuals with bachelor's degree or higher education have the highest percentage of unemployment, with 4.4% or 14 of them being unemployed.
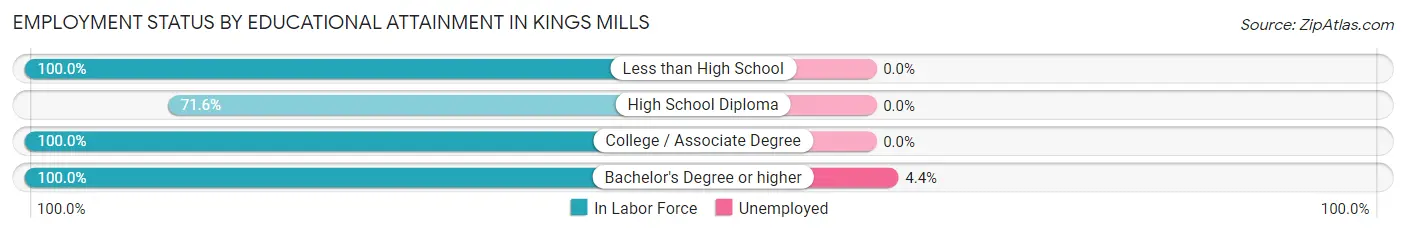
| Educational Attainment | In Labor Force | Unemployed |
| Less than High School | 19 (100.0%) | 0 (0.0%) |
| High School Diploma | 111 (71.6%) | 0 (0.0%) |
| College / Associate Degree | 237 (100.0%) | 0 (0.0%) |
| Bachelor's Degree or higher | 320 (100.0%) | 14 (4.4%) |
| Total | 687 (94.0%) | 15 (2.0%) |
Employment Occupations by Sex in Kings Mills
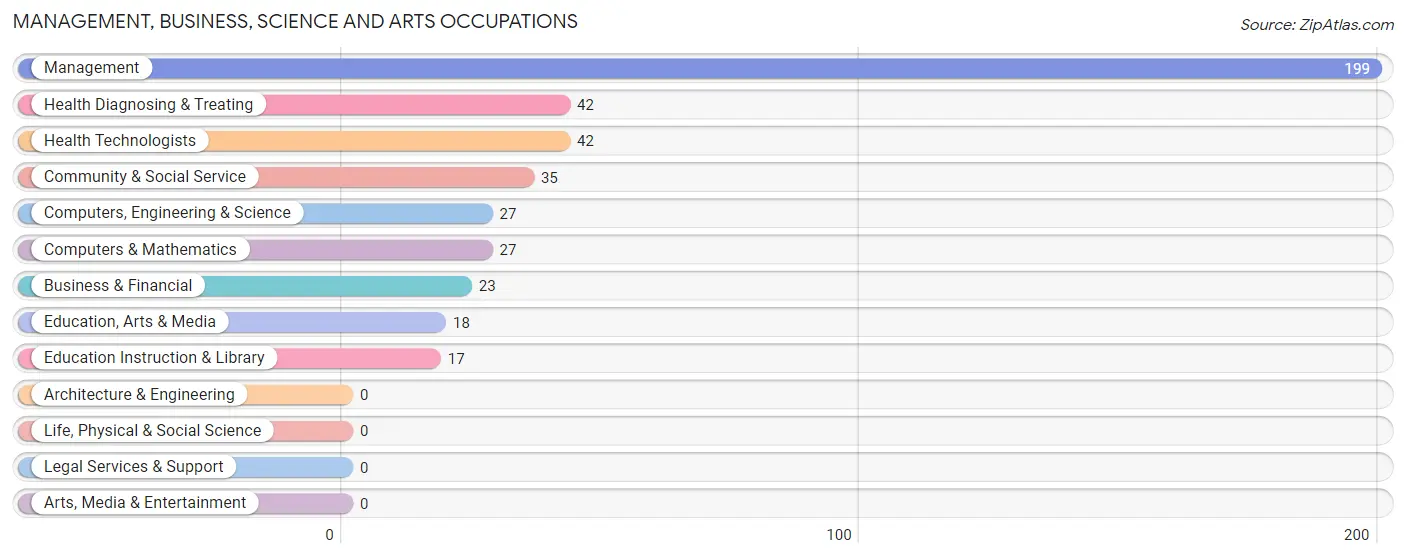
Management, Business, Science and Arts Occupations
The most common Management, Business, Science and Arts occupations in Kings Mills are Management (199 | 23.7%), Health Diagnosing & Treating (42 | 5.0%), Health Technologists (42 | 5.0%), Community & Social Service (35 | 4.2%), and Computers, Engineering & Science (27 | 3.2%).
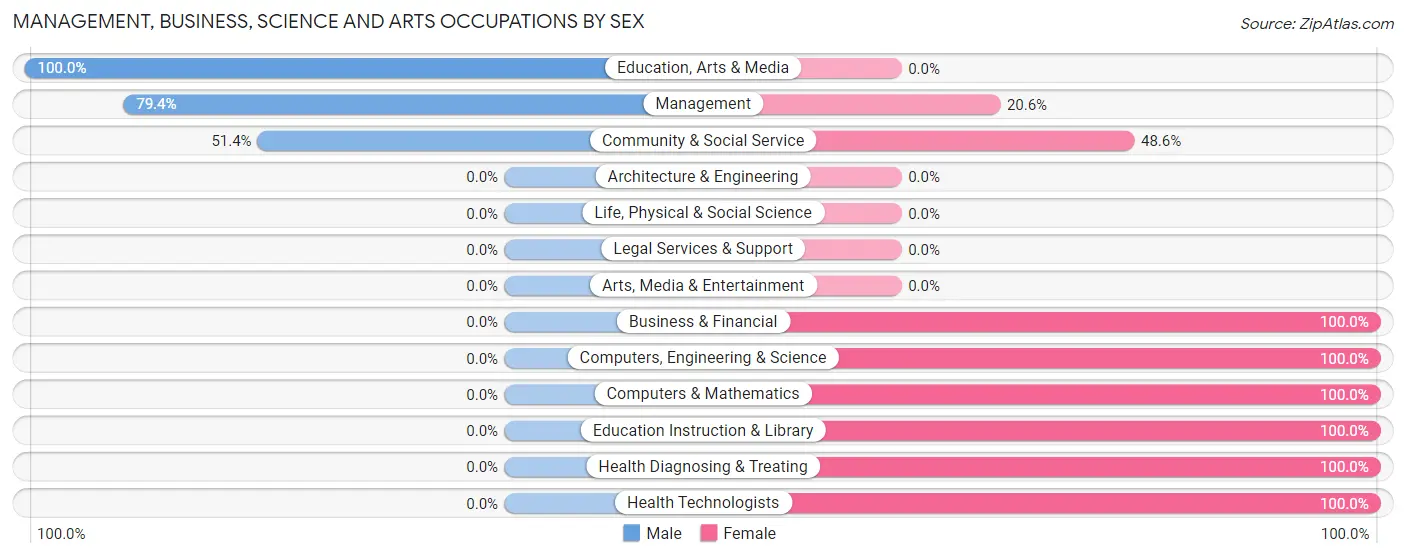
Management, Business, Science and Arts Occupations by Sex
Within the Management, Business, Science and Arts occupations in Kings Mills, the most male-oriented occupations are Education, Arts & Media (100.0%), Management (79.4%), and Community & Social Service (51.4%), while the most female-oriented occupations are Business & Financial (100.0%), Computers, Engineering & Science (100.0%), and Computers & Mathematics (100.0%).
| Occupation | Male | Female |
| Management | 158 (79.4%) | 41 (20.6%) |
| Business & Financial | 0 (0.0%) | 23 (100.0%) |
| Computers, Engineering & Science | 0 (0.0%) | 27 (100.0%) |
| Computers & Mathematics | 0 (0.0%) | 27 (100.0%) |
| Architecture & Engineering | 0 (0.0%) | 0 (0.0%) |
| Life, Physical & Social Science | 0 (0.0%) | 0 (0.0%) |
| Community & Social Service | 18 (51.4%) | 17 (48.6%) |
| Education, Arts & Media | 18 (100.0%) | 0 (0.0%) |
| Legal Services & Support | 0 (0.0%) | 0 (0.0%) |
| Education Instruction & Library | 0 (0.0%) | 17 (100.0%) |
| Arts, Media & Entertainment | 0 (0.0%) | 0 (0.0%) |
| Health Diagnosing & Treating | 0 (0.0%) | 42 (100.0%) |
| Health Technologists | 0 (0.0%) | 42 (100.0%) |
| Total (Category) | 176 (54.0%) | 150 (46.0%) |
| Total (Overall) | 482 (57.3%) | 359 (42.7%) |
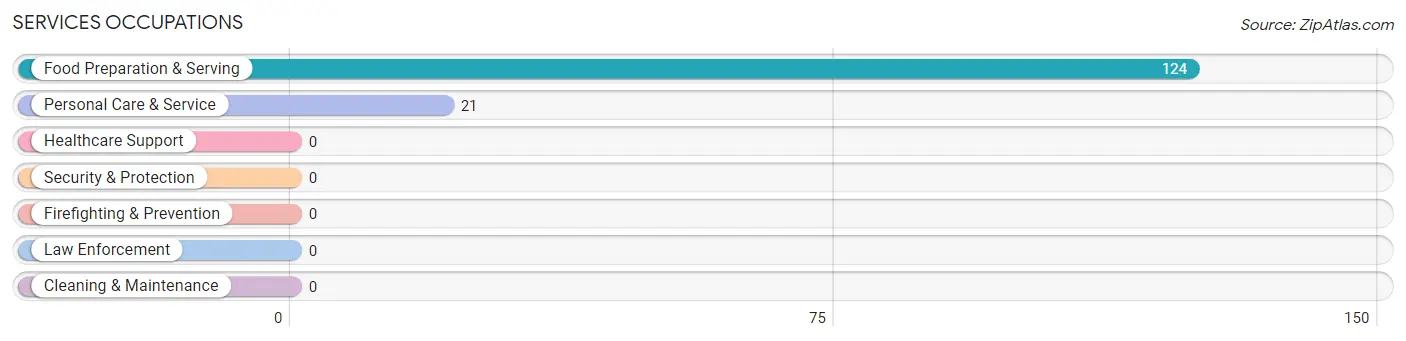
Services Occupations
The most common Services occupations in Kings Mills are Food Preparation & Serving (124 | 14.7%), and Personal Care & Service (21 | 2.5%).
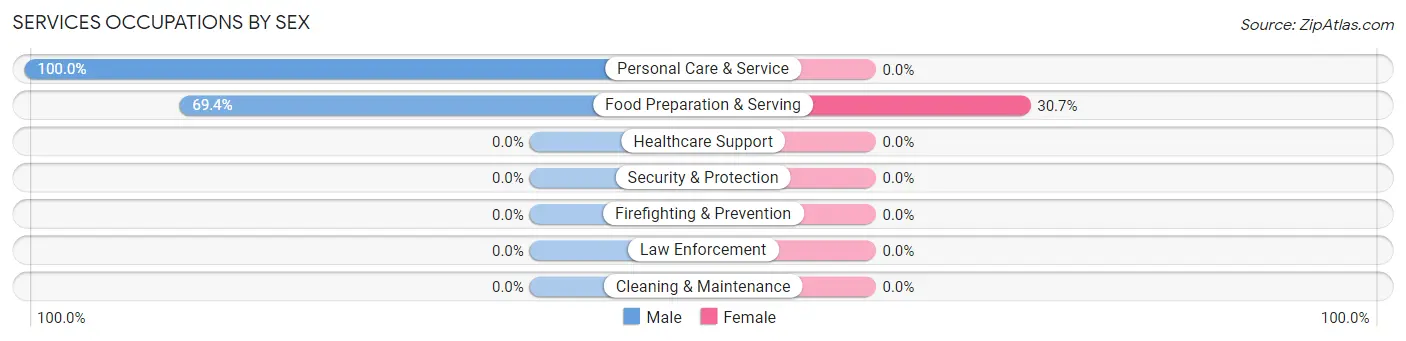
Services Occupations by Sex
| Occupation | Male | Female |
| Healthcare Support | 0 (0.0%) | 0 (0.0%) |
| Security & Protection | 0 (0.0%) | 0 (0.0%) |
| Firefighting & Prevention | 0 (0.0%) | 0 (0.0%) |
| Law Enforcement | 0 (0.0%) | 0 (0.0%) |
| Food Preparation & Serving | 86 (69.4%) | 38 (30.6%) |
| Cleaning & Maintenance | 0 (0.0%) | 0 (0.0%) |
| Personal Care & Service | 21 (100.0%) | 0 (0.0%) |
| Total (Category) | 107 (73.8%) | 38 (26.2%) |
| Total (Overall) | 482 (57.3%) | 359 (42.7%) |
Sales and Office Occupations
The most common Sales and Office occupations in Kings Mills are Office & Administration (143 | 17.0%), and Sales & Related (34 | 4.0%).
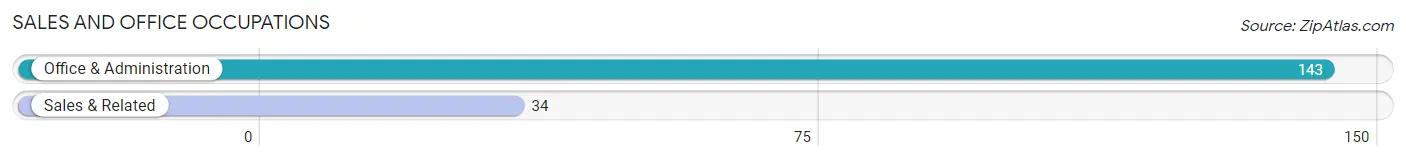
Sales and Office Occupations by Sex
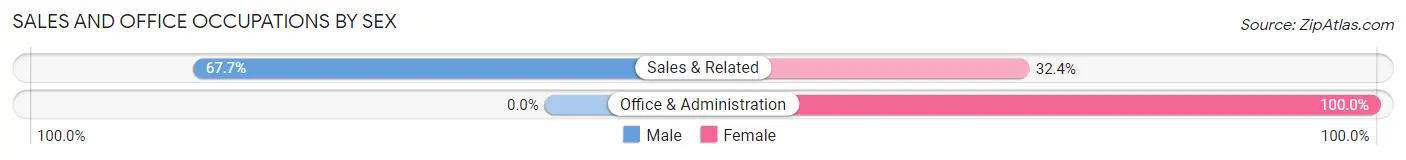
| Occupation | Male | Female |
| Sales & Related | 23 (67.6%) | 11 (32.4%) |
| Office & Administration | 0 (0.0%) | 143 (100.0%) |
| Total (Category) | 23 (13.0%) | 154 (87.0%) |
| Total (Overall) | 482 (57.3%) | 359 (42.7%) |
Natural Resources, Construction and Maintenance Occupations
The most common Natural Resources, Construction and Maintenance occupations in Kings Mills are Installation, Maintenance & Repair (114 | 13.6%), and Construction & Extraction (19 | 2.3%).
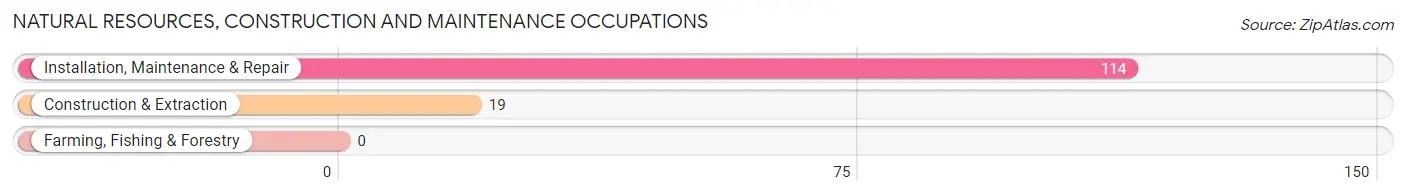
Natural Resources, Construction and Maintenance Occupations by Sex
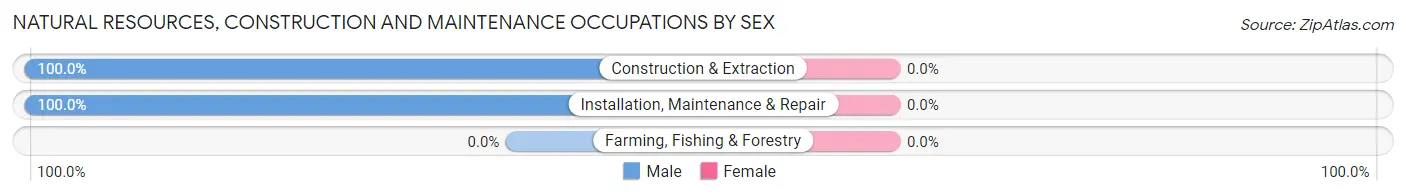
| Occupation | Male | Female |
| Farming, Fishing & Forestry | 0 (0.0%) | 0 (0.0%) |
| Construction & Extraction | 19 (100.0%) | 0 (0.0%) |
| Installation, Maintenance & Repair | 114 (100.0%) | 0 (0.0%) |
| Total (Category) | 133 (100.0%) | 0 (0.0%) |
| Total (Overall) | 482 (57.3%) | 359 (42.7%) |
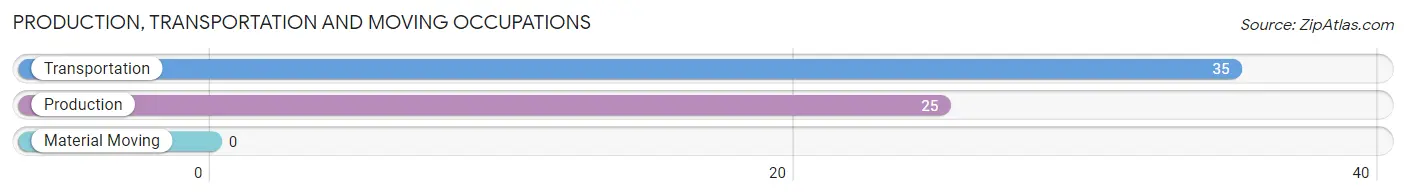
Production, Transportation and Moving Occupations
The most common Production, Transportation and Moving occupations in Kings Mills are Transportation (35 | 4.2%), and Production (25 | 3.0%).
Production, Transportation and Moving Occupations by Sex
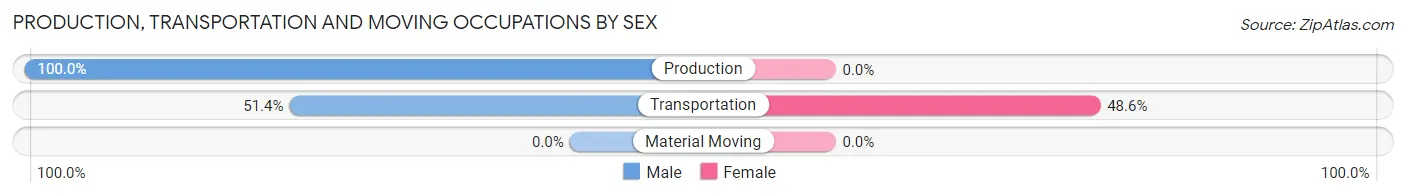
| Occupation | Male | Female |
| Production | 25 (100.0%) | 0 (0.0%) |
| Transportation | 18 (51.4%) | 17 (48.6%) |
| Material Moving | 0 (0.0%) | 0 (0.0%) |
| Total (Category) | 43 (71.7%) | 17 (28.3%) |
| Total (Overall) | 482 (57.3%) | 359 (42.7%) |
Employment Industries by Sex in Kings Mills
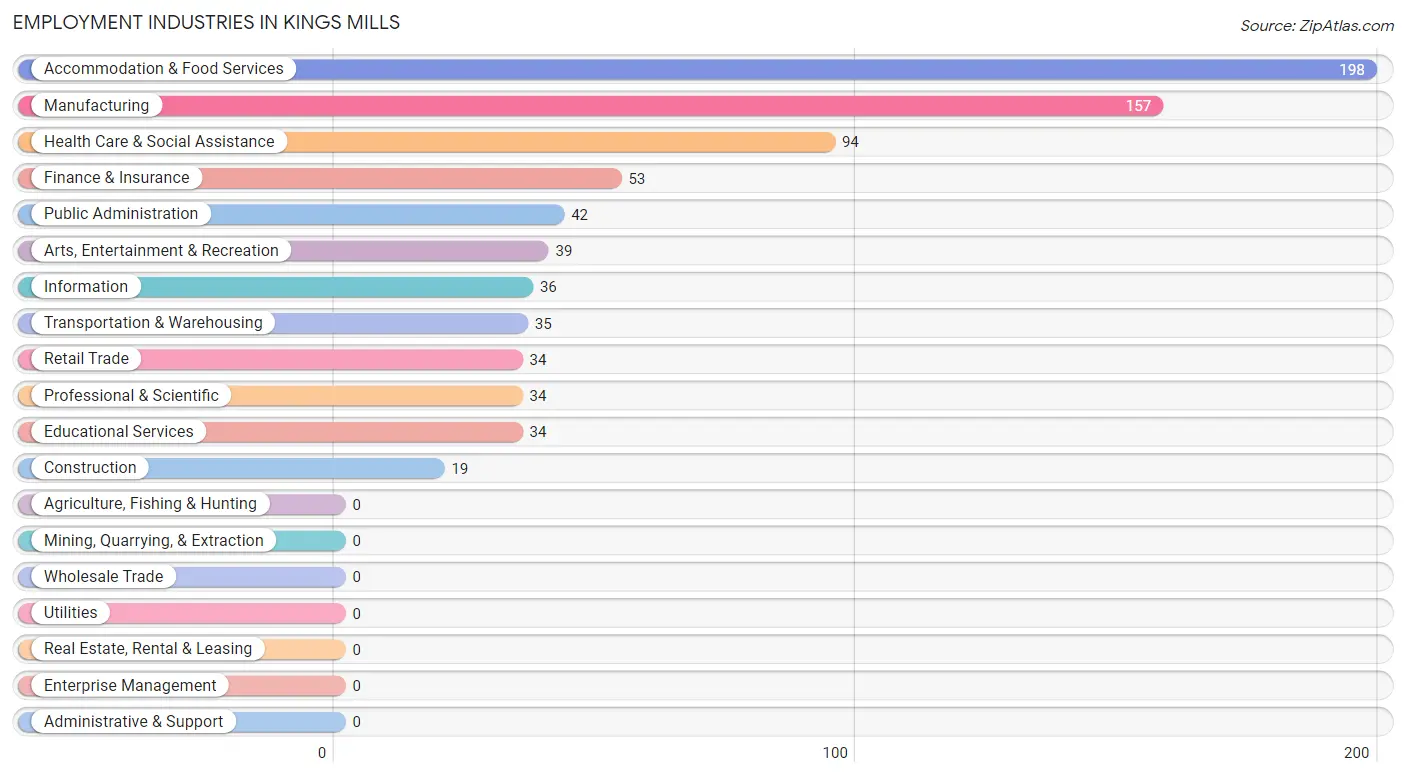
Employment Industries in Kings Mills
The major employment industries in Kings Mills include Accommodation & Food Services (198 | 23.5%), Manufacturing (157 | 18.7%), Health Care & Social Assistance (94 | 11.2%), Finance & Insurance (53 | 6.3%), and Public Administration (42 | 5.0%).
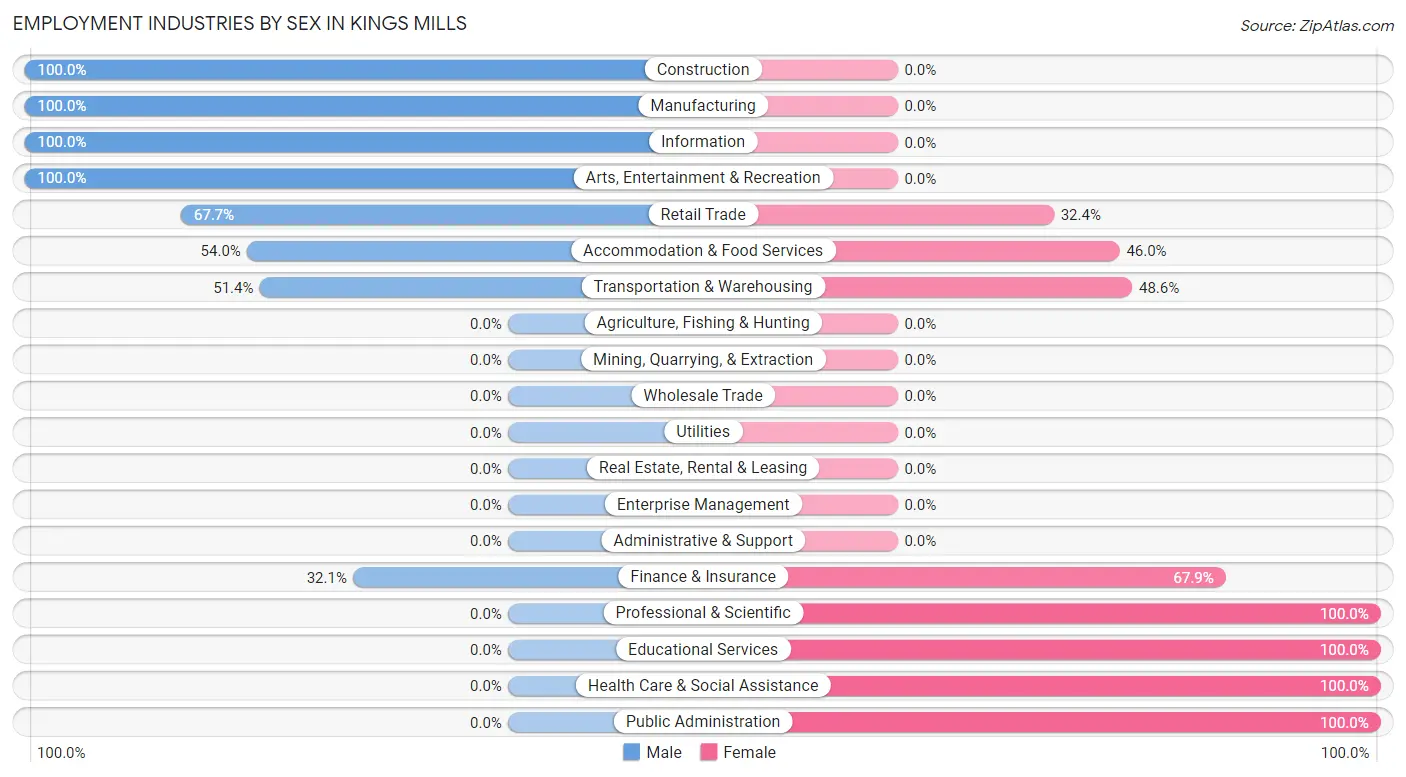
Employment Industries by Sex in Kings Mills
The Kings Mills industries that see more men than women are Construction (100.0%), Manufacturing (100.0%), and Information (100.0%), whereas the industries that tend to have a higher number of women are Professional & Scientific (100.0%), Educational Services (100.0%), and Health Care & Social Assistance (100.0%).
| Industry | Male | Female |
| Agriculture, Fishing & Hunting | 0 (0.0%) | 0 (0.0%) |
| Mining, Quarrying, & Extraction | 0 (0.0%) | 0 (0.0%) |
| Construction | 19 (100.0%) | 0 (0.0%) |
| Manufacturing | 157 (100.0%) | 0 (0.0%) |
| Wholesale Trade | 0 (0.0%) | 0 (0.0%) |
| Retail Trade | 23 (67.6%) | 11 (32.4%) |
| Transportation & Warehousing | 18 (51.4%) | 17 (48.6%) |
| Utilities | 0 (0.0%) | 0 (0.0%) |
| Information | 36 (100.0%) | 0 (0.0%) |
| Finance & Insurance | 17 (32.1%) | 36 (67.9%) |
| Real Estate, Rental & Leasing | 0 (0.0%) | 0 (0.0%) |
| Professional & Scientific | 0 (0.0%) | 34 (100.0%) |
| Enterprise Management | 0 (0.0%) | 0 (0.0%) |
| Administrative & Support | 0 (0.0%) | 0 (0.0%) |
| Educational Services | 0 (0.0%) | 34 (100.0%) |
| Health Care & Social Assistance | 0 (0.0%) | 94 (100.0%) |
| Arts, Entertainment & Recreation | 39 (100.0%) | 0 (0.0%) |
| Accommodation & Food Services | 107 (54.0%) | 91 (46.0%) |
| Public Administration | 0 (0.0%) | 42 (100.0%) |
| Total | 482 (57.3%) | 359 (42.7%) |
Education in Kings Mills
School Enrollment in Kings Mills
The most common levels of schooling among the 192 students in Kings Mills are high school (96 | 50.0%), elementary school (61 | 31.8%), and middle school (18 | 9.4%).
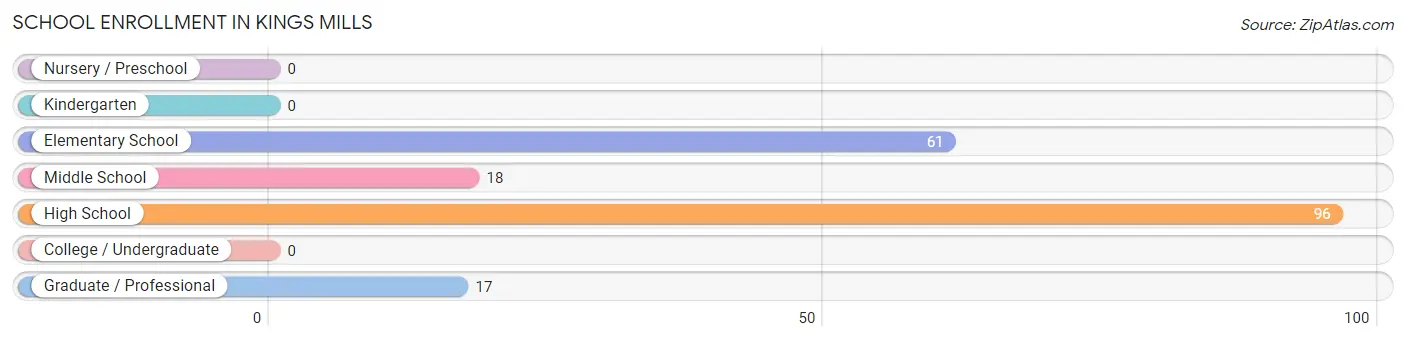
| School Level | # Students | % Students |
| Nursery / Preschool | 0 | 0.0% |
| Kindergarten | 0 | 0.0% |
| Elementary School | 61 | 31.8% |
| Middle School | 18 | 9.4% |
| High School | 96 | 50.0% |
| College / Undergraduate | 0 | 0.0% |
| Graduate / Professional | 17 | 8.8% |
| Total | 192 | 100.0% |
School Enrollment by Age by Funding Source in Kings Mills
Out of a total of 192 students who are enrolled in schools in Kings Mills, 53 (27.6%) attend a private institution, while the remaining 139 (72.4%) are enrolled in public schools. The age group of 18 to 19 year olds has the highest likelihood of being enrolled in private schools, with 21 (100.0% in the age bracket) enrolled. Conversely, the age group of 5 to 9 year old has the lowest likelihood of being enrolled in a private school, with 61 (100.0% in the age bracket) attending a public institution.
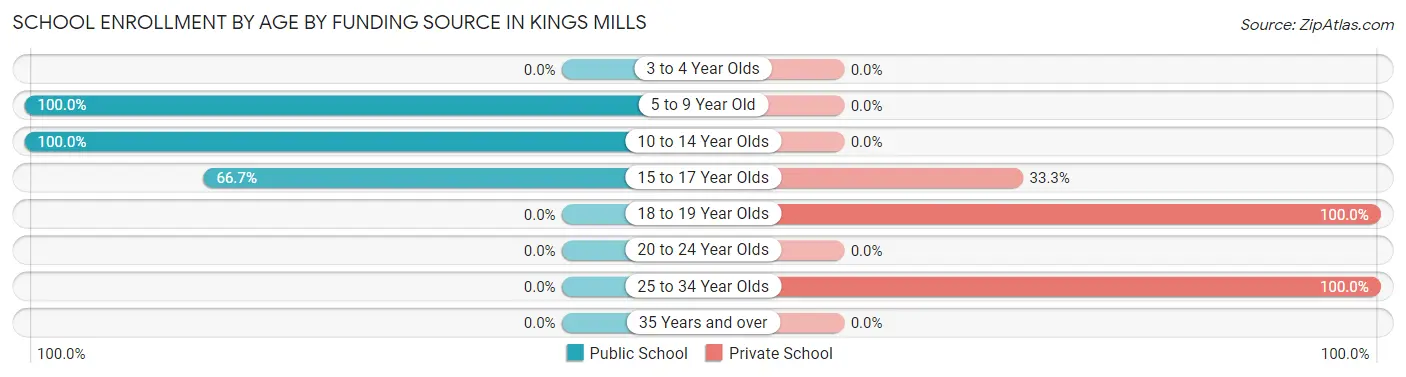
| Age Bracket | Public School | Private School |
| 3 to 4 Year Olds | 0 (0.0%) | 0 (0.0%) |
| 5 to 9 Year Old | 61 (100.0%) | 0 (0.0%) |
| 10 to 14 Year Olds | 48 (100.0%) | 0 (0.0%) |
| 15 to 17 Year Olds | 30 (66.7%) | 15 (33.3%) |
| 18 to 19 Year Olds | 0 (0.0%) | 21 (100.0%) |
| 20 to 24 Year Olds | 0 (0.0%) | 0 (0.0%) |
| 25 to 34 Year Olds | 0 (0.0%) | 17 (100.0%) |
| 35 Years and over | 0 (0.0%) | 0 (0.0%) |
| Total | 139 (72.4%) | 53 (27.6%) |
Educational Attainment by Field of Study in Kings Mills
Physical & health sciences (103 | 27.8%), science & technology (98 | 26.4%), education (37 | 10.0%), business (28 | 7.5%), and communications (23 | 6.2%) are the most common fields of study among 371 individuals in Kings Mills who have obtained a bachelor's degree or higher.
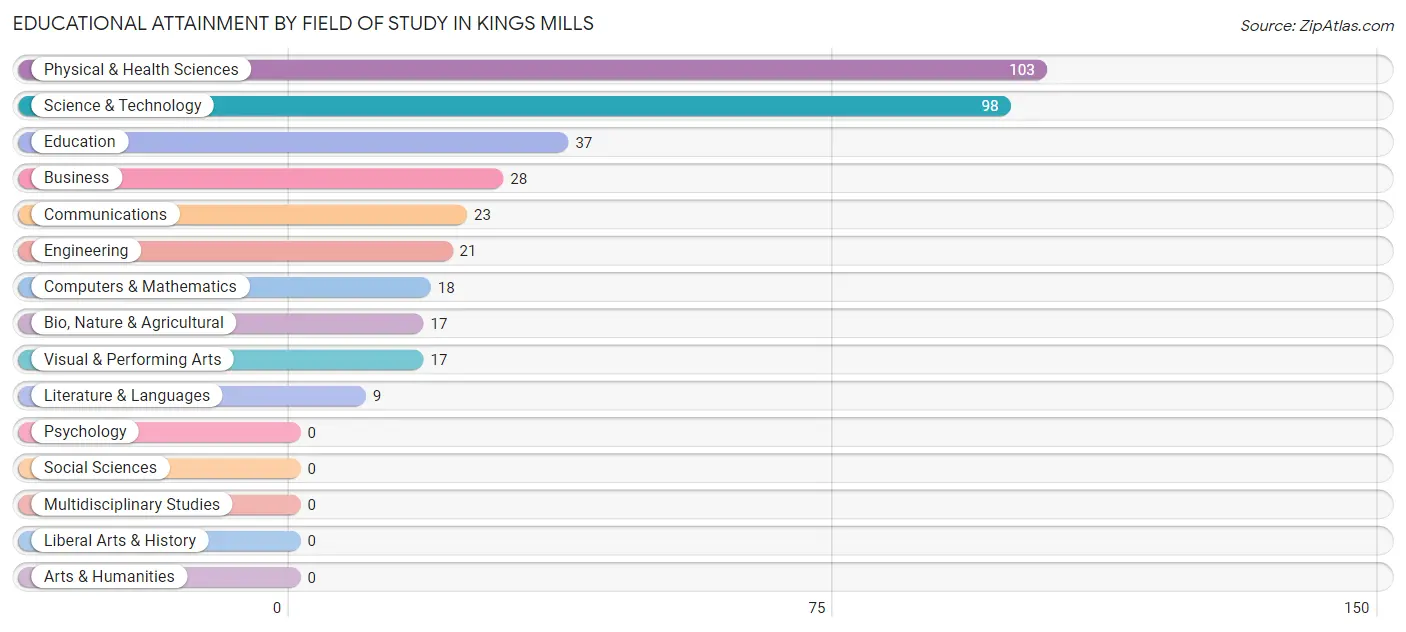
| Field of Study | # Graduates | % Graduates |
| Computers & Mathematics | 18 | 4.9% |
| Bio, Nature & Agricultural | 17 | 4.6% |
| Physical & Health Sciences | 103 | 27.8% |
| Psychology | 0 | 0.0% |
| Social Sciences | 0 | 0.0% |
| Engineering | 21 | 5.7% |
| Multidisciplinary Studies | 0 | 0.0% |
| Science & Technology | 98 | 26.4% |
| Business | 28 | 7.5% |
| Education | 37 | 10.0% |
| Literature & Languages | 9 | 2.4% |
| Liberal Arts & History | 0 | 0.0% |
| Visual & Performing Arts | 17 | 4.6% |
| Communications | 23 | 6.2% |
| Arts & Humanities | 0 | 0.0% |
| Total | 371 | 100.0% |
Transportation & Commute in Kings Mills
Vehicle Availability by Sex in Kings Mills
The most prevalent vehicle ownership categories in Kings Mills are males with 2 vehicles (266, accounting for 55.2%) and females with 2 vehicles (135, making up 74.1%).
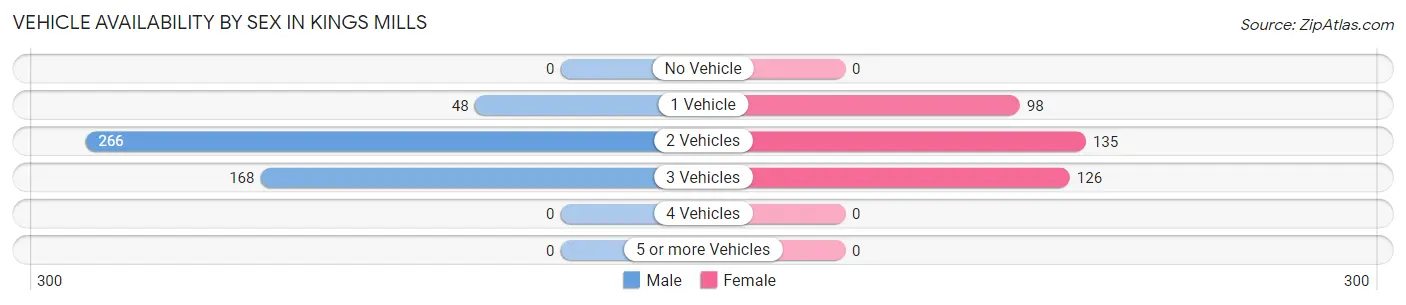
| Vehicles Available | Male | Female |
| No Vehicle | 0 (0.0%) | 0 (0.0%) |
| 1 Vehicle | 48 (10.0%) | 98 (27.3%) |
| 2 Vehicles | 266 (55.2%) | 135 (37.6%) |
| 3 Vehicles | 168 (34.8%) | 126 (35.1%) |
| 4 Vehicles | 0 (0.0%) | 0 (0.0%) |
| 5 or more Vehicles | 0 (0.0%) | 0 (0.0%) |
| Total | 482 (100.0%) | 359 (100.0%) |
Commute Time in Kings Mills
The most frequently occuring commute durations in Kings Mills are 10 to 14 minutes (147 commuters, 19.0%), 20 to 24 minutes (142 commuters, 18.3%), and 5 to 9 minutes (131 commuters, 16.9%).
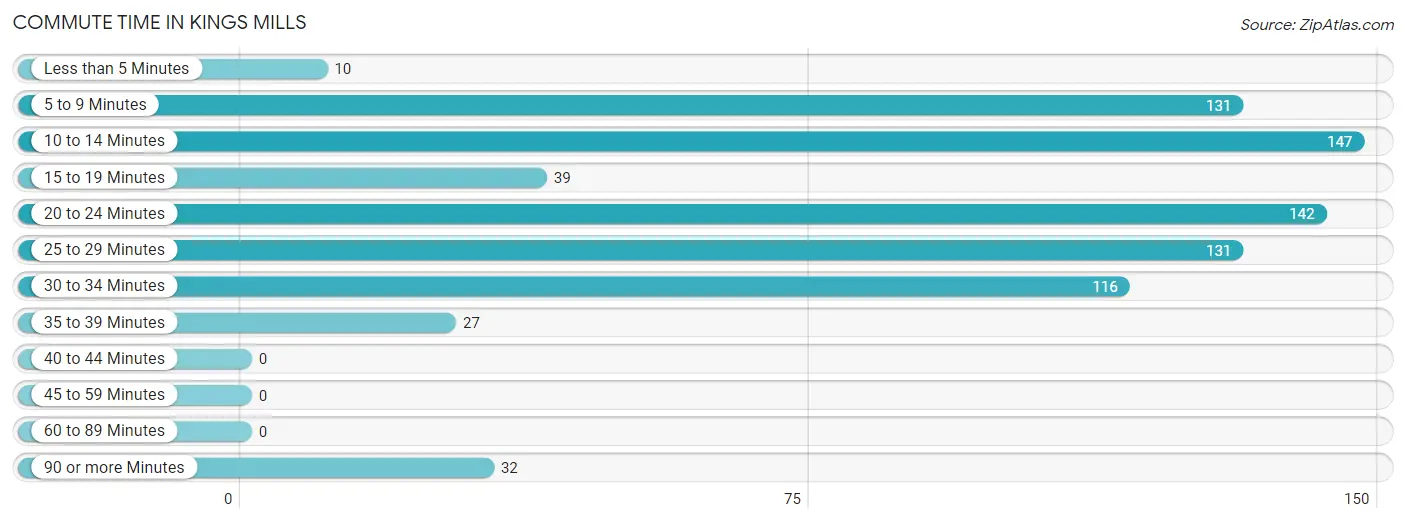
| Commute Time | # Commuters | % Commuters |
| Less than 5 Minutes | 10 | 1.3% |
| 5 to 9 Minutes | 131 | 16.9% |
| 10 to 14 Minutes | 147 | 19.0% |
| 15 to 19 Minutes | 39 | 5.0% |
| 20 to 24 Minutes | 142 | 18.3% |
| 25 to 29 Minutes | 131 | 16.9% |
| 30 to 34 Minutes | 116 | 15.0% |
| 35 to 39 Minutes | 27 | 3.5% |
| 40 to 44 Minutes | 0 | 0.0% |
| 45 to 59 Minutes | 0 | 0.0% |
| 60 to 89 Minutes | 0 | 0.0% |
| 90 or more Minutes | 32 | 4.1% |
Commute Time by Sex in Kings Mills
The most common commute times in Kings Mills are 30 to 34 minutes (116 commuters, 27.2%) for males and 5 to 9 minutes (131 commuters, 37.5%) for females.
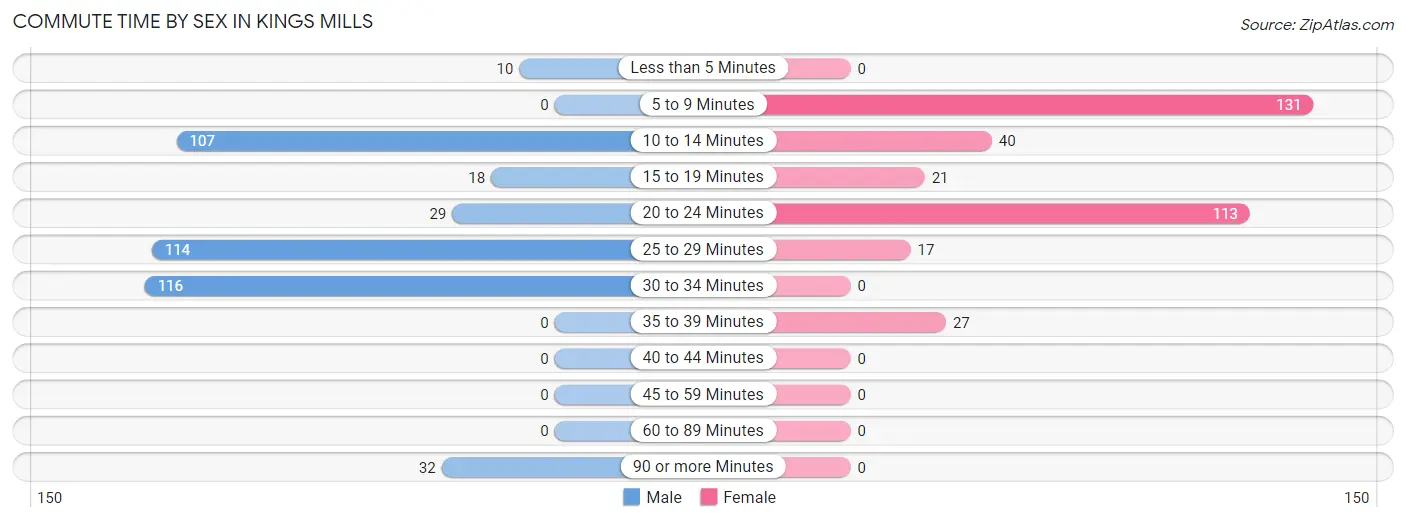
| Commute Time | Male | Female |
| Less than 5 Minutes | 10 (2.4%) | 0 (0.0%) |
| 5 to 9 Minutes | 0 (0.0%) | 131 (37.5%) |
| 10 to 14 Minutes | 107 (25.1%) | 40 (11.5%) |
| 15 to 19 Minutes | 18 (4.2%) | 21 (6.0%) |
| 20 to 24 Minutes | 29 (6.8%) | 113 (32.4%) |
| 25 to 29 Minutes | 114 (26.8%) | 17 (4.9%) |
| 30 to 34 Minutes | 116 (27.2%) | 0 (0.0%) |
| 35 to 39 Minutes | 0 (0.0%) | 27 (7.7%) |
| 40 to 44 Minutes | 0 (0.0%) | 0 (0.0%) |
| 45 to 59 Minutes | 0 (0.0%) | 0 (0.0%) |
| 60 to 89 Minutes | 0 (0.0%) | 0 (0.0%) |
| 90 or more Minutes | 32 (7.5%) | 0 (0.0%) |
Time of Departure to Work by Sex in Kings Mills
The most frequent times of departure to work in Kings Mills are 6:00 AM to 6:29 AM (112, 26.3%) for males and 7:00 AM to 7:29 AM (93, 26.7%) for females.
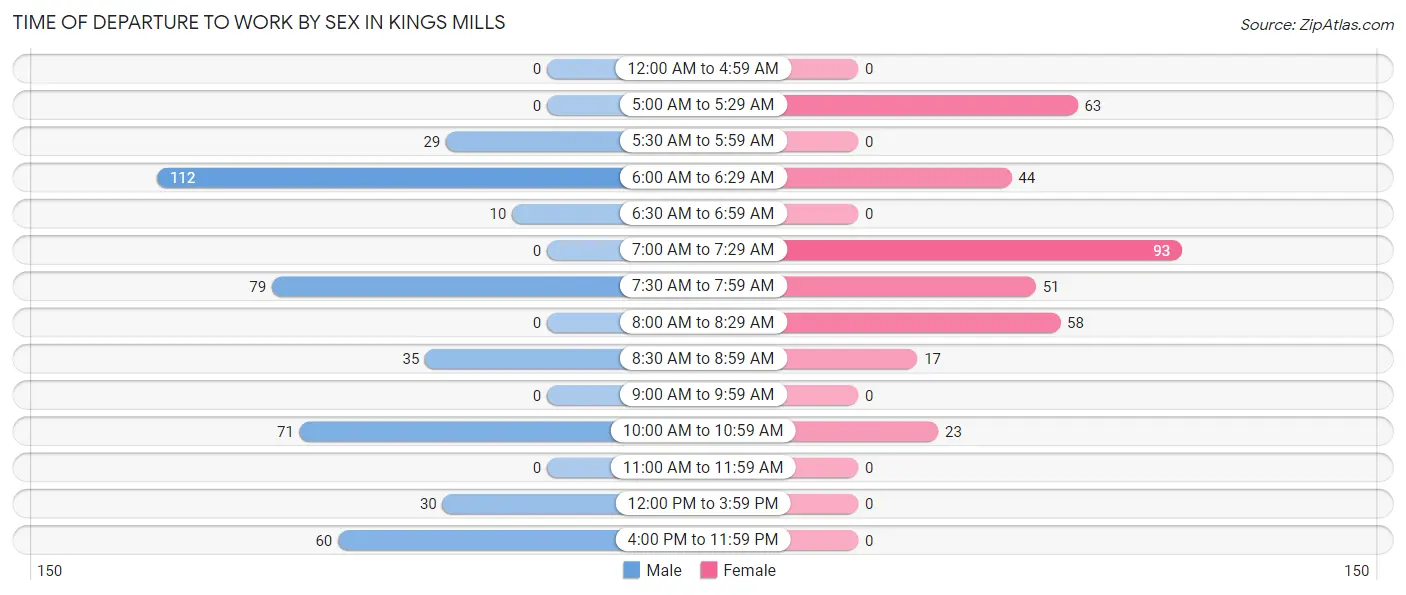
| Time of Departure | Male | Female |
| 12:00 AM to 4:59 AM | 0 (0.0%) | 0 (0.0%) |
| 5:00 AM to 5:29 AM | 0 (0.0%) | 63 (18.0%) |
| 5:30 AM to 5:59 AM | 29 (6.8%) | 0 (0.0%) |
| 6:00 AM to 6:29 AM | 112 (26.3%) | 44 (12.6%) |
| 6:30 AM to 6:59 AM | 10 (2.4%) | 0 (0.0%) |
| 7:00 AM to 7:29 AM | 0 (0.0%) | 93 (26.7%) |
| 7:30 AM to 7:59 AM | 79 (18.5%) | 51 (14.6%) |
| 8:00 AM to 8:29 AM | 0 (0.0%) | 58 (16.6%) |
| 8:30 AM to 8:59 AM | 35 (8.2%) | 17 (4.9%) |
| 9:00 AM to 9:59 AM | 0 (0.0%) | 0 (0.0%) |
| 10:00 AM to 10:59 AM | 71 (16.7%) | 23 (6.6%) |
| 11:00 AM to 11:59 AM | 0 (0.0%) | 0 (0.0%) |
| 12:00 PM to 3:59 PM | 30 (7.0%) | 0 (0.0%) |
| 4:00 PM to 11:59 PM | 60 (14.1%) | 0 (0.0%) |
| Total | 426 (100.0%) | 349 (100.0%) |
Housing Occupancy in Kings Mills
Occupancy by Ownership in Kings Mills
Of the total 498 dwellings in Kings Mills, owner-occupied units account for 498 (100.0%), while renter-occupied units make up 0 (0.0%).
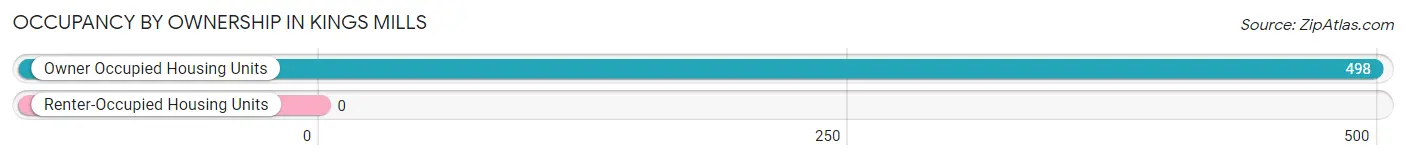
| Occupancy | # Housing Units | % Housing Units |
| Owner Occupied Housing Units | 498 | 100.0% |
| Renter-Occupied Housing Units | 0 | 0.0% |
| Total Occupied Housing Units | 498 | 100.0% |
Occupancy by Household Size in Kings Mills
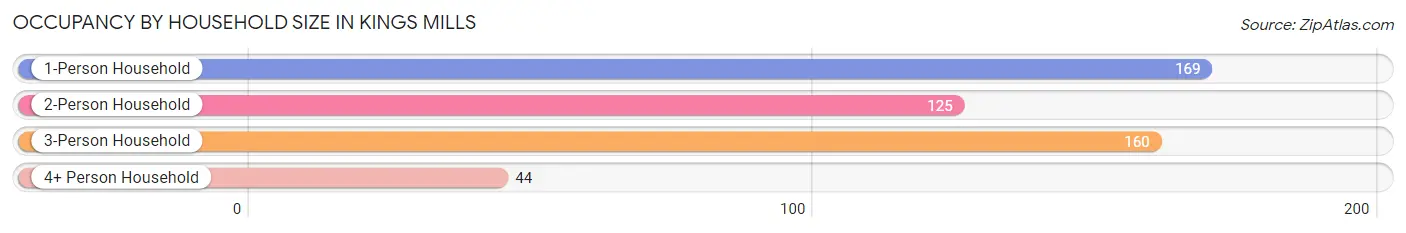
| Household Size | # Housing Units | % Housing Units |
| 1-Person Household | 169 | 33.9% |
| 2-Person Household | 125 | 25.1% |
| 3-Person Household | 160 | 32.1% |
| 4+ Person Household | 44 | 8.8% |
| Total Housing Units | 498 | 100.0% |
Occupancy by Ownership by Household Size in Kings Mills
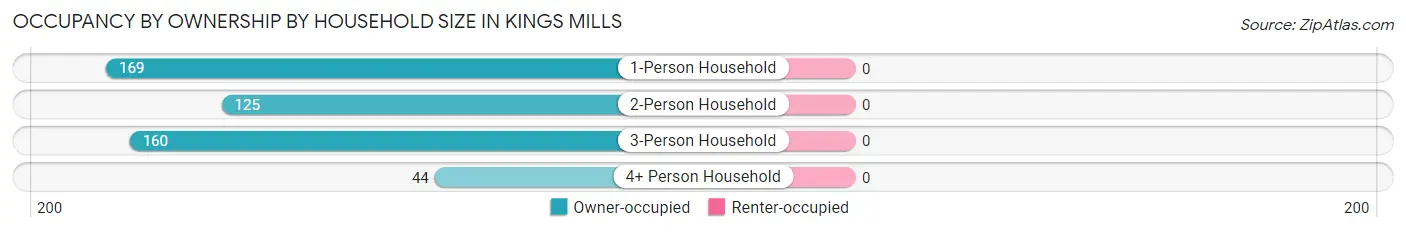
| Household Size | Owner-occupied | Renter-occupied |
| 1-Person Household | 169 (100.0%) | 0 (0.0%) |
| 2-Person Household | 125 (100.0%) | 0 (0.0%) |
| 3-Person Household | 160 (100.0%) | 0 (0.0%) |
| 4+ Person Household | 44 (100.0%) | 0 (0.0%) |
| Total Housing Units | 498 (100.0%) | 0 (0.0%) |
Occupancy by Educational Attainment in Kings Mills
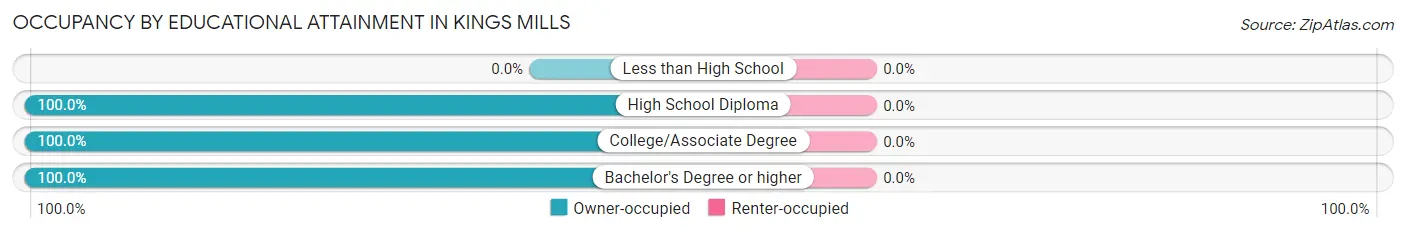
| Household Size | Owner-occupied | Renter-occupied |
| Less than High School | 0 (0.0%) | 0 (0.0%) |
| High School Diploma | 51 (100.0%) | 0 (0.0%) |
| College/Associate Degree | 153 (100.0%) | 0 (0.0%) |
| Bachelor's Degree or higher | 294 (100.0%) | 0 (0.0%) |
Occupancy by Age of Householder in Kings Mills
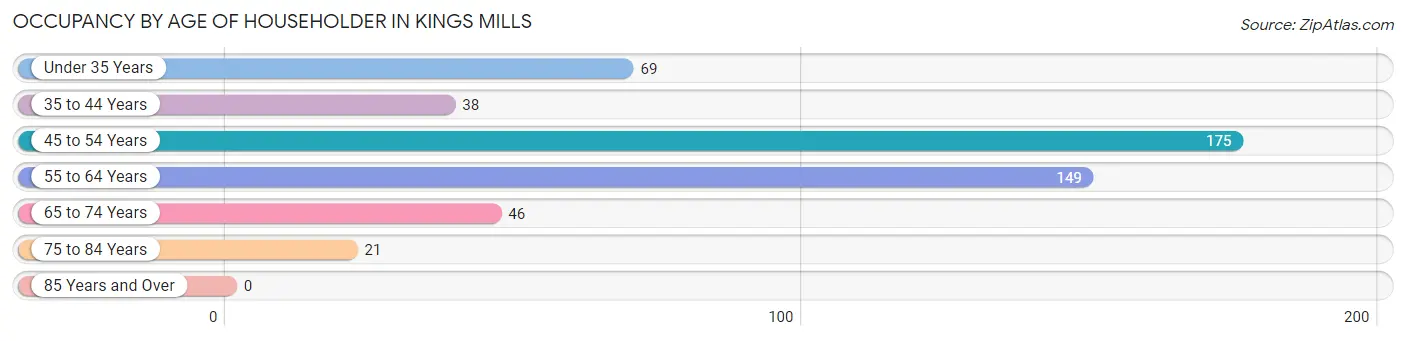
| Age Bracket | # Households | % Households |
| Under 35 Years | 69 | 13.9% |
| 35 to 44 Years | 38 | 7.6% |
| 45 to 54 Years | 175 | 35.1% |
| 55 to 64 Years | 149 | 29.9% |
| 65 to 74 Years | 46 | 9.2% |
| 75 to 84 Years | 21 | 4.2% |
| 85 Years and Over | 0 | 0.0% |
| Total | 498 | 100.0% |
Housing Finances in Kings Mills
Median Income by Occupancy in Kings Mills
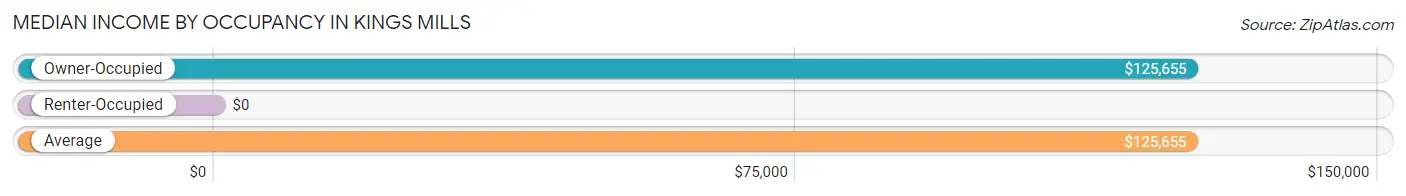
| Occupancy Type | # Households | Median Income |
| Owner-Occupied | 498 (100.0%) | $125,655 |
| Renter-Occupied | 0 (0.0%) | $0 |
| Average | 498 (100.0%) | $125,655 |
Occupancy by Householder Income Bracket in Kings Mills
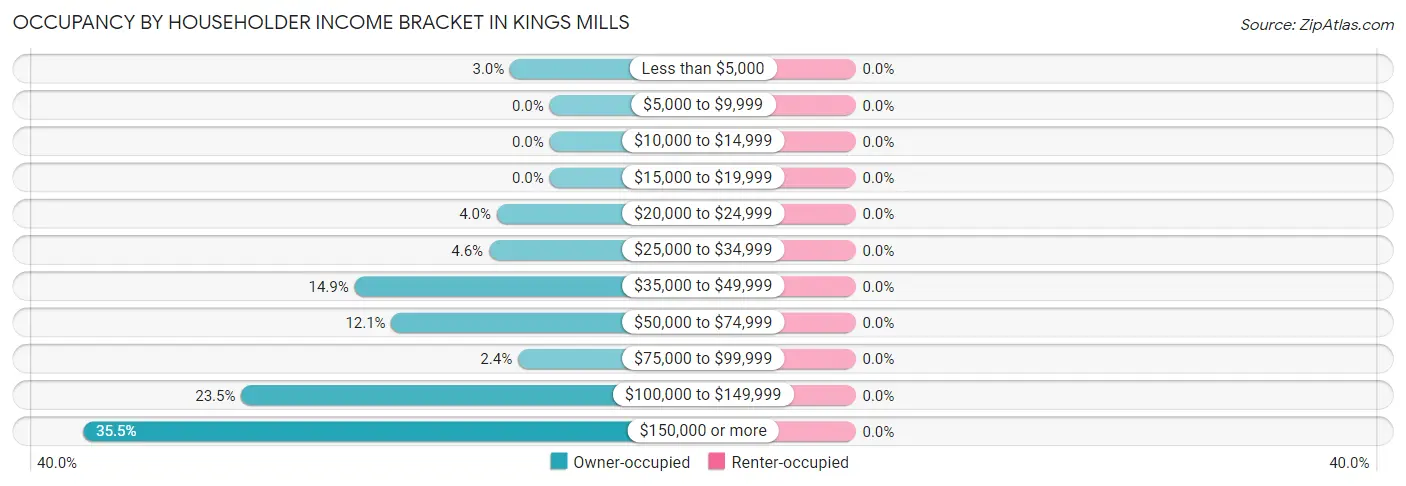
| Income Bracket | Owner-occupied | Renter-occupied |
| Less than $5,000 | 15 (3.0%) | 0 (0.0%) |
| $5,000 to $9,999 | 0 (0.0%) | 0 (0.0%) |
| $10,000 to $14,999 | 0 (0.0%) | 0 (0.0%) |
| $15,000 to $19,999 | 0 (0.0%) | 0 (0.0%) |
| $20,000 to $24,999 | 20 (4.0%) | 0 (0.0%) |
| $25,000 to $34,999 | 23 (4.6%) | 0 (0.0%) |
| $35,000 to $49,999 | 74 (14.9%) | 0 (0.0%) |
| $50,000 to $74,999 | 60 (12.0%) | 0 (0.0%) |
| $75,000 to $99,999 | 12 (2.4%) | 0 (0.0%) |
| $100,000 to $149,999 | 117 (23.5%) | 0 (0.0%) |
| $150,000 or more | 177 (35.5%) | 0 (0.0%) |
| Total | 498 (100.0%) | 0 (0.0%) |
Monthly Housing Cost Tiers in Kings Mills
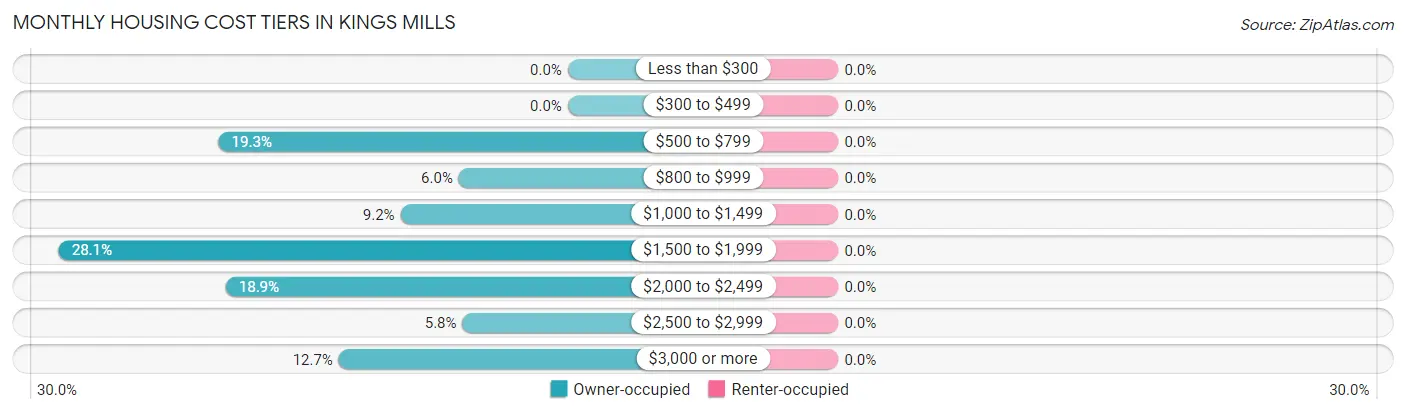
| Monthly Cost | Owner-occupied | Renter-occupied |
| Less than $300 | 0 (0.0%) | 0 (0.0%) |
| $300 to $499 | 0 (0.0%) | 0 (0.0%) |
| $500 to $799 | 96 (19.3%) | 0 (0.0%) |
| $800 to $999 | 30 (6.0%) | 0 (0.0%) |
| $1,000 to $1,499 | 46 (9.2%) | 0 (0.0%) |
| $1,500 to $1,999 | 140 (28.1%) | 0 (0.0%) |
| $2,000 to $2,499 | 94 (18.9%) | 0 (0.0%) |
| $2,500 to $2,999 | 29 (5.8%) | 0 (0.0%) |
| $3,000 or more | 63 (12.7%) | 0 (0.0%) |
| Total | 498 (100.0%) | 0 (0.0%) |
Physical Housing Characteristics in Kings Mills
Housing Structures in Kings Mills
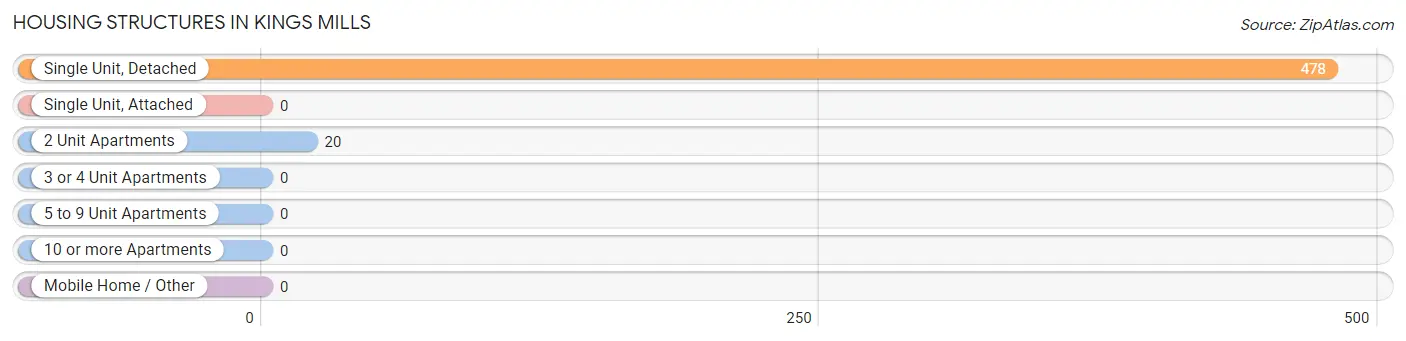
| Structure Type | # Housing Units | % Housing Units |
| Single Unit, Detached | 478 | 96.0% |
| Single Unit, Attached | 0 | 0.0% |
| 2 Unit Apartments | 20 | 4.0% |
| 3 or 4 Unit Apartments | 0 | 0.0% |
| 5 to 9 Unit Apartments | 0 | 0.0% |
| 10 or more Apartments | 0 | 0.0% |
| Mobile Home / Other | 0 | 0.0% |
| Total | 498 | 100.0% |
Housing Structures by Occupancy in Kings Mills
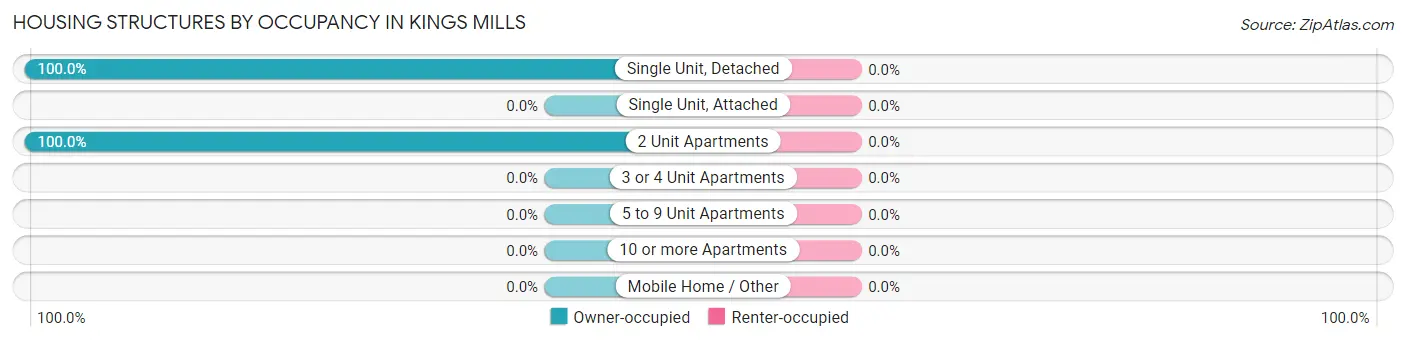
| Structure Type | Owner-occupied | Renter-occupied |
| Single Unit, Detached | 478 (100.0%) | 0 (0.0%) |
| Single Unit, Attached | 0 (0.0%) | 0 (0.0%) |
| 2 Unit Apartments | 20 (100.0%) | 0 (0.0%) |
| 3 or 4 Unit Apartments | 0 (0.0%) | 0 (0.0%) |
| 5 to 9 Unit Apartments | 0 (0.0%) | 0 (0.0%) |
| 10 or more Apartments | 0 (0.0%) | 0 (0.0%) |
| Mobile Home / Other | 0 (0.0%) | 0 (0.0%) |
| Total | 498 (100.0%) | 0 (0.0%) |
Housing Structures by Number of Rooms in Kings Mills
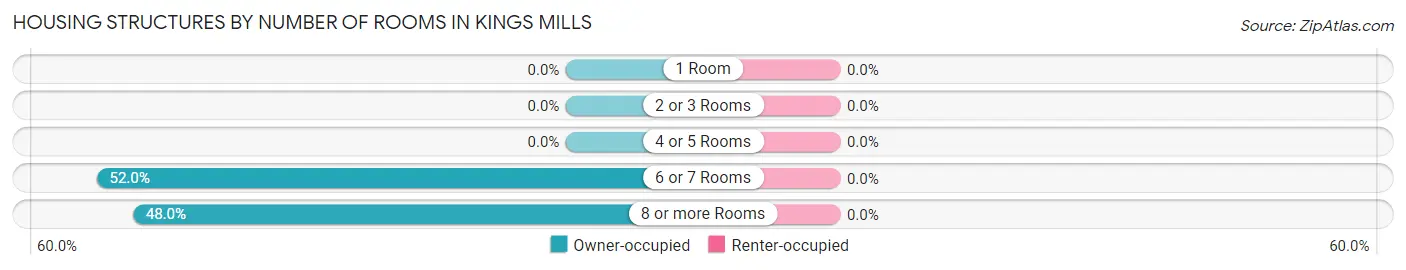
| Number of Rooms | Owner-occupied | Renter-occupied |
| 1 Room | 0 (0.0%) | 0 (0.0%) |
| 2 or 3 Rooms | 0 (0.0%) | 0 (0.0%) |
| 4 or 5 Rooms | 0 (0.0%) | 0 (0.0%) |
| 6 or 7 Rooms | 259 (52.0%) | 0 (0.0%) |
| 8 or more Rooms | 239 (48.0%) | 0 (0.0%) |
| Total | 498 (100.0%) | 0 (0.0%) |
Housing Structure by Heating Type in Kings Mills
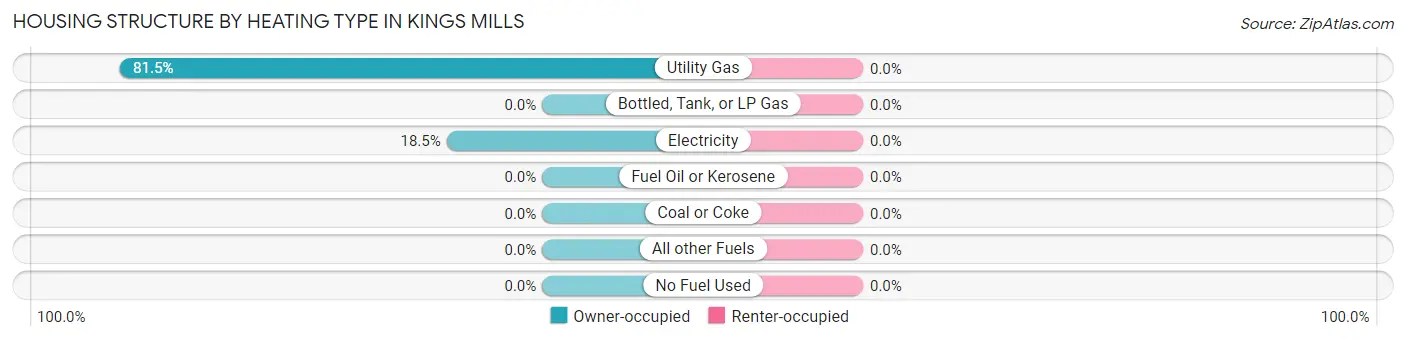
| Heating Type | Owner-occupied | Renter-occupied |
| Utility Gas | 406 (81.5%) | 0 (0.0%) |
| Bottled, Tank, or LP Gas | 0 (0.0%) | 0 (0.0%) |
| Electricity | 92 (18.5%) | 0 (0.0%) |
| Fuel Oil or Kerosene | 0 (0.0%) | 0 (0.0%) |
| Coal or Coke | 0 (0.0%) | 0 (0.0%) |
| All other Fuels | 0 (0.0%) | 0 (0.0%) |
| No Fuel Used | 0 (0.0%) | 0 (0.0%) |
| Total | 498 (100.0%) | 0 (0.0%) |
Household Vehicle Usage in Kings Mills
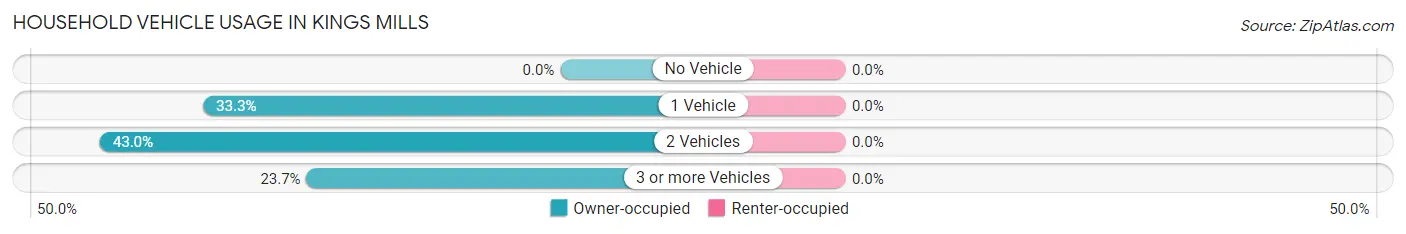
| Vehicles per Household | Owner-occupied | Renter-occupied |
| No Vehicle | 0 (0.0%) | 0 (0.0%) |
| 1 Vehicle | 166 (33.3%) | 0 (0.0%) |
| 2 Vehicles | 214 (43.0%) | 0 (0.0%) |
| 3 or more Vehicles | 118 (23.7%) | 0 (0.0%) |
| Total | 498 (100.0%) | 0 (0.0%) |
Real Estate & Mortgages in Kings Mills
Real Estate and Mortgage Overview in Kings Mills
| Characteristic | Without Mortgage | With Mortgage |
| Housing Units | 105 | 393 |
| Median Property Value | - | - |
| Median Household Income | $37,948 | $168 |
| Monthly Housing Costs | $572 | $63 |
| Real Estate Taxes | $2,719 | $0 |
Property Value by Mortgage Status in Kings Mills
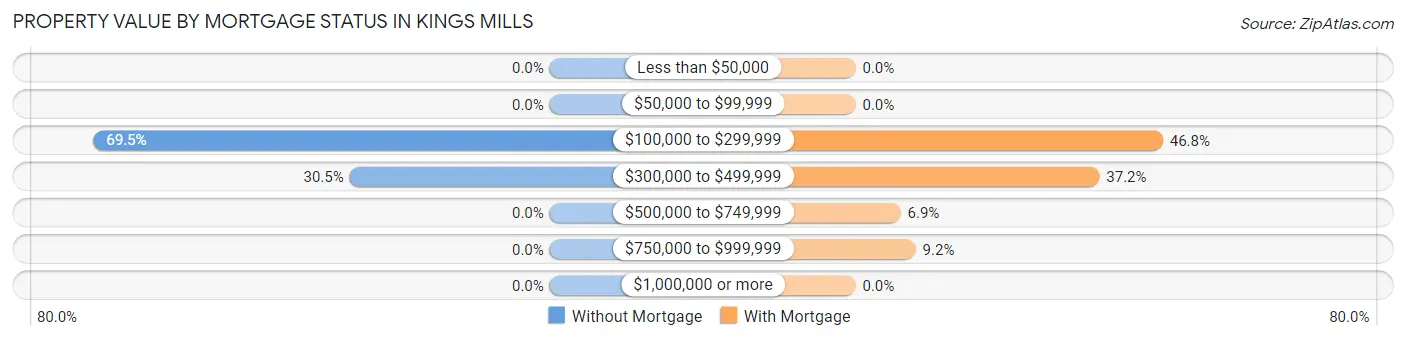
| Property Value | Without Mortgage | With Mortgage |
| Less than $50,000 | 0 (0.0%) | 0 (0.0%) |
| $50,000 to $99,999 | 0 (0.0%) | 0 (0.0%) |
| $100,000 to $299,999 | 73 (69.5%) | 184 (46.8%) |
| $300,000 to $499,999 | 32 (30.5%) | 146 (37.1%) |
| $500,000 to $749,999 | 0 (0.0%) | 27 (6.9%) |
| $750,000 to $999,999 | 0 (0.0%) | 36 (9.2%) |
| $1,000,000 or more | 0 (0.0%) | 0 (0.0%) |
| Total | 105 (100.0%) | 393 (100.0%) |
Household Income by Mortgage Status in Kings Mills
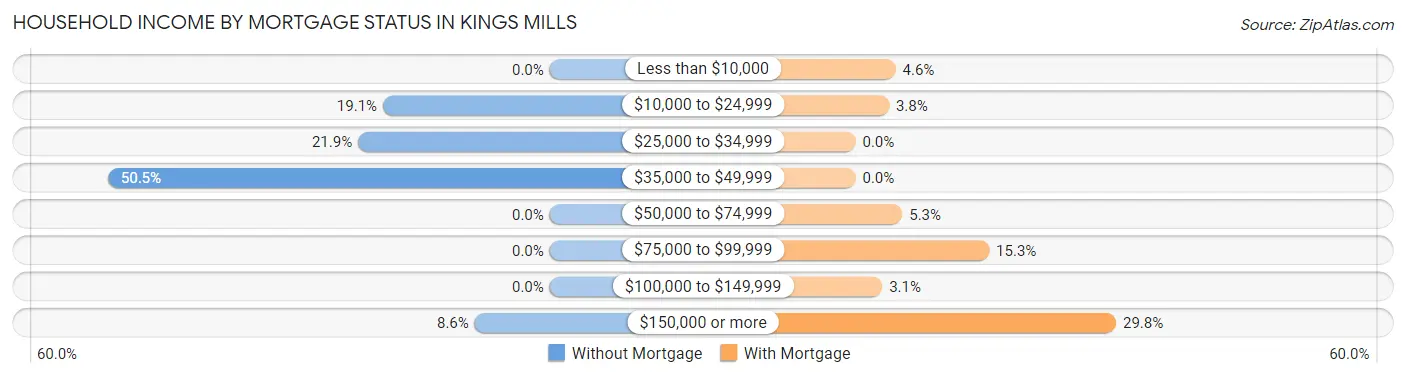
| Household Income | Without Mortgage | With Mortgage |
| Less than $10,000 | 0 (0.0%) | 18 (4.6%) |
| $10,000 to $24,999 | 20 (19.1%) | 15 (3.8%) |
| $25,000 to $34,999 | 23 (21.9%) | 0 (0.0%) |
| $35,000 to $49,999 | 53 (50.5%) | 0 (0.0%) |
| $50,000 to $74,999 | 0 (0.0%) | 21 (5.3%) |
| $75,000 to $99,999 | 0 (0.0%) | 60 (15.3%) |
| $100,000 to $149,999 | 0 (0.0%) | 12 (3.0%) |
| $150,000 or more | 9 (8.6%) | 117 (29.8%) |
| Total | 105 (100.0%) | 393 (100.0%) |
Property Value to Household Income Ratio in Kings Mills
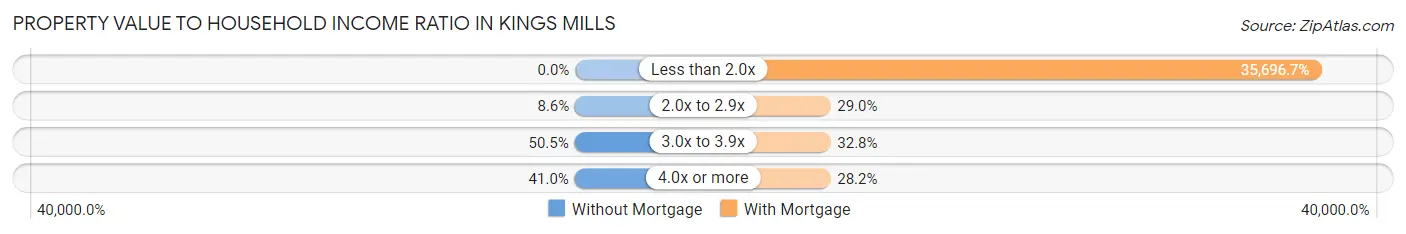
| Value-to-Income Ratio | Without Mortgage | With Mortgage |
| Less than 2.0x | 0 (0.0%) | 140,288 (35,696.7%) |
| 2.0x to 2.9x | 9 (8.6%) | 114 (29.0%) |
| 3.0x to 3.9x | 53 (50.5%) | 129 (32.8%) |
| 4.0x or more | 43 (40.9%) | 111 (28.2%) |
| Total | 105 (100.0%) | 393 (100.0%) |
Real Estate Taxes by Mortgage Status in Kings Mills
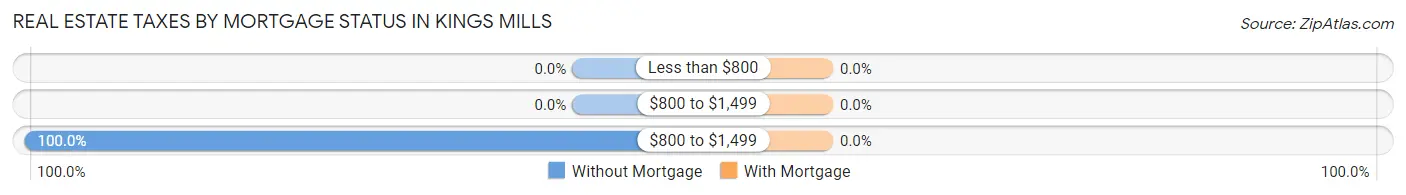
| Property Taxes | Without Mortgage | With Mortgage |
| Less than $800 | 0 (0.0%) | 0 (0.0%) |
| $800 to $1,499 | 0 (0.0%) | 0 (0.0%) |
| $800 to $1,499 | 105 (100.0%) | 0 (0.0%) |
| Total | 105 (100.0%) | 393 (100.0%) |
Health & Disability in Kings Mills
Health Insurance Coverage by Age in Kings Mills
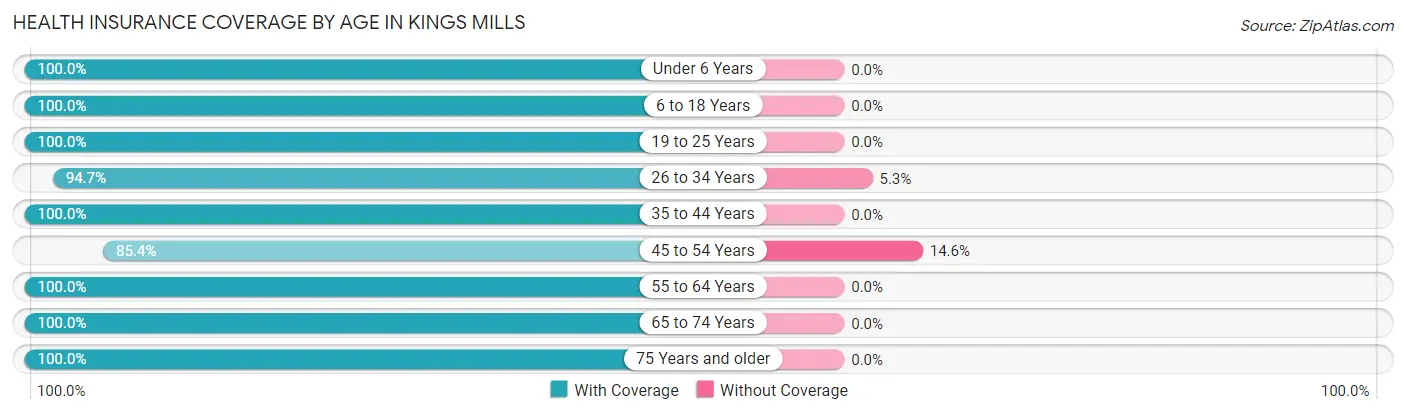
| Age Bracket | With Coverage | Without Coverage |
| Under 6 Years | 30 (100.0%) | 0 (0.0%) |
| 6 to 18 Years | 175 (100.0%) | 0 (0.0%) |
| 19 to 25 Years | 109 (100.0%) | 0 (0.0%) |
| 26 to 34 Years | 144 (94.7%) | 8 (5.3%) |
| 35 to 44 Years | 59 (100.0%) | 0 (0.0%) |
| 45 to 54 Years | 204 (85.4%) | 35 (14.6%) |
| 55 to 64 Years | 281 (100.0%) | 0 (0.0%) |
| 65 to 74 Years | 56 (100.0%) | 0 (0.0%) |
| 75 Years and older | 58 (100.0%) | 0 (0.0%) |
| Total | 1,116 (96.3%) | 43 (3.7%) |
Health Insurance Coverage by Citizenship Status in Kings Mills
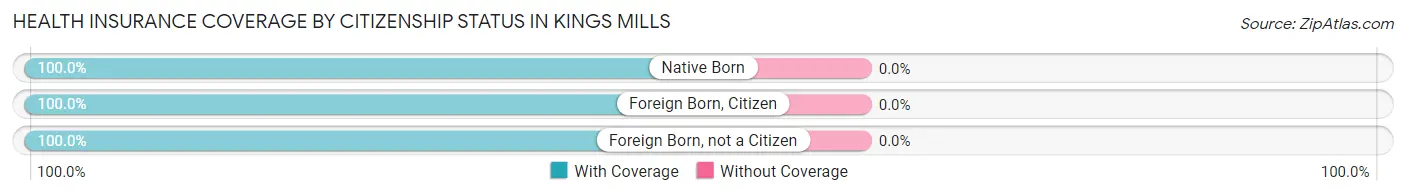
| Citizenship Status | With Coverage | Without Coverage |
| Native Born | 30 (100.0%) | 0 (0.0%) |
| Foreign Born, Citizen | 175 (100.0%) | 0 (0.0%) |
| Foreign Born, not a Citizen | 109 (100.0%) | 0 (0.0%) |
Health Insurance Coverage by Household Income in Kings Mills
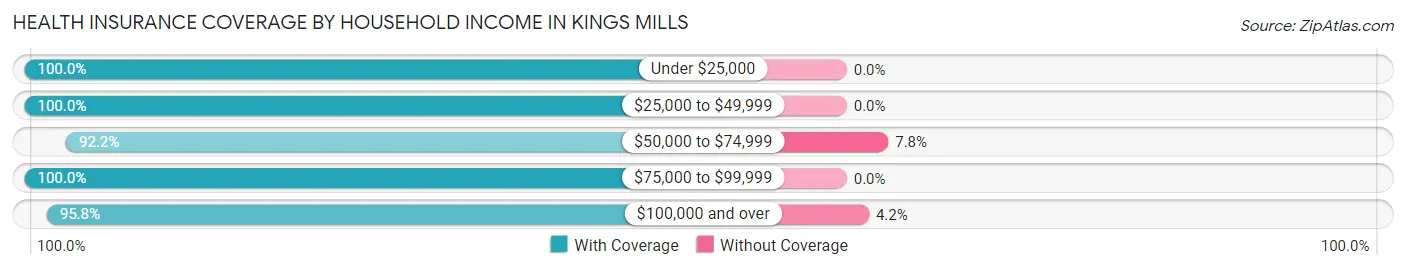
| Household Income | With Coverage | Without Coverage |
| Under $25,000 | 35 (100.0%) | 0 (0.0%) |
| $25,000 to $49,999 | 153 (100.0%) | 0 (0.0%) |
| $50,000 to $74,999 | 95 (92.2%) | 8 (7.8%) |
| $75,000 to $99,999 | 26 (100.0%) | 0 (0.0%) |
| $100,000 and over | 807 (95.8%) | 35 (4.2%) |
Public vs Private Health Insurance Coverage by Age in Kings Mills
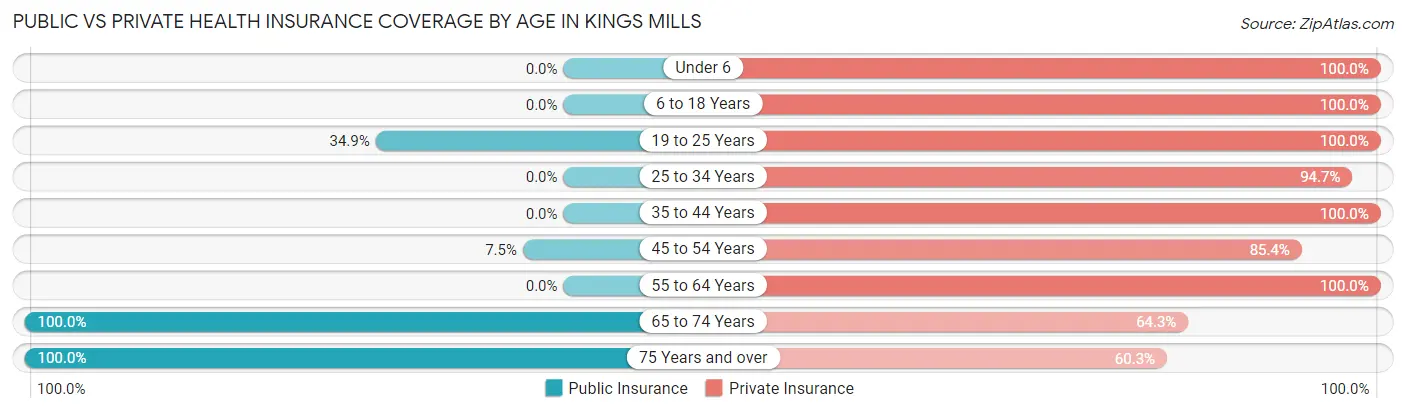
| Age Bracket | Public Insurance | Private Insurance |
| Under 6 | 0 (0.0%) | 30 (100.0%) |
| 6 to 18 Years | 0 (0.0%) | 175 (100.0%) |
| 19 to 25 Years | 38 (34.9%) | 109 (100.0%) |
| 25 to 34 Years | 0 (0.0%) | 144 (94.7%) |
| 35 to 44 Years | 0 (0.0%) | 59 (100.0%) |
| 45 to 54 Years | 18 (7.5%) | 204 (85.4%) |
| 55 to 64 Years | 0 (0.0%) | 281 (100.0%) |
| 65 to 74 Years | 56 (100.0%) | 36 (64.3%) |
| 75 Years and over | 58 (100.0%) | 35 (60.3%) |
| Total | 170 (14.7%) | 1,073 (92.6%) |
Disability Status by Sex by Age in Kings Mills
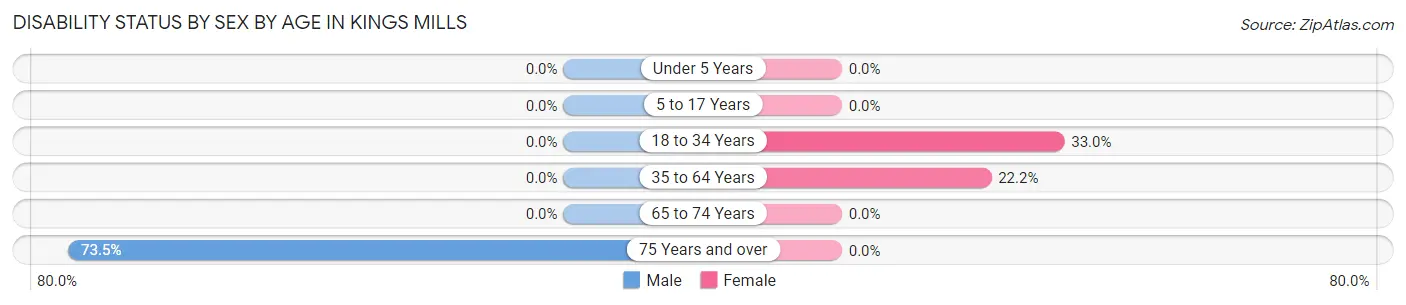
| Age Bracket | Male | Female |
| Under 5 Years | 0 (0.0%) | 0 (0.0%) |
| 5 to 17 Years | 0 (0.0%) | 0 (0.0%) |
| 18 to 34 Years | 0 (0.0%) | 38 (33.0%) |
| 35 to 64 Years | 0 (0.0%) | 67 (22.2%) |
| 65 to 74 Years | 0 (0.0%) | 0 (0.0%) |
| 75 Years and over | 25 (73.5%) | 0 (0.0%) |
Disability Class by Sex by Age in Kings Mills
Disability Class: Hearing Difficulty
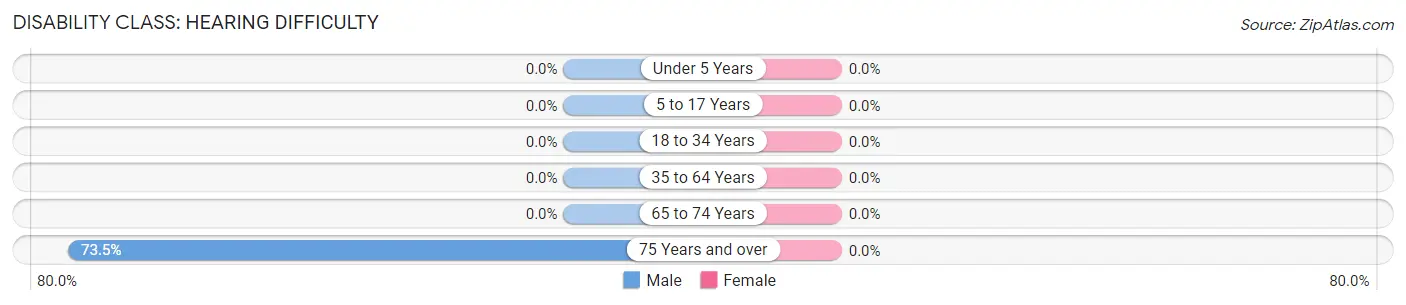
| Age Bracket | Male | Female |
| Under 5 Years | 0 (0.0%) | 0 (0.0%) |
| 5 to 17 Years | 0 (0.0%) | 0 (0.0%) |
| 18 to 34 Years | 0 (0.0%) | 0 (0.0%) |
| 35 to 64 Years | 0 (0.0%) | 0 (0.0%) |
| 65 to 74 Years | 0 (0.0%) | 0 (0.0%) |
| 75 Years and over | 25 (73.5%) | 0 (0.0%) |
Disability Class: Vision Difficulty
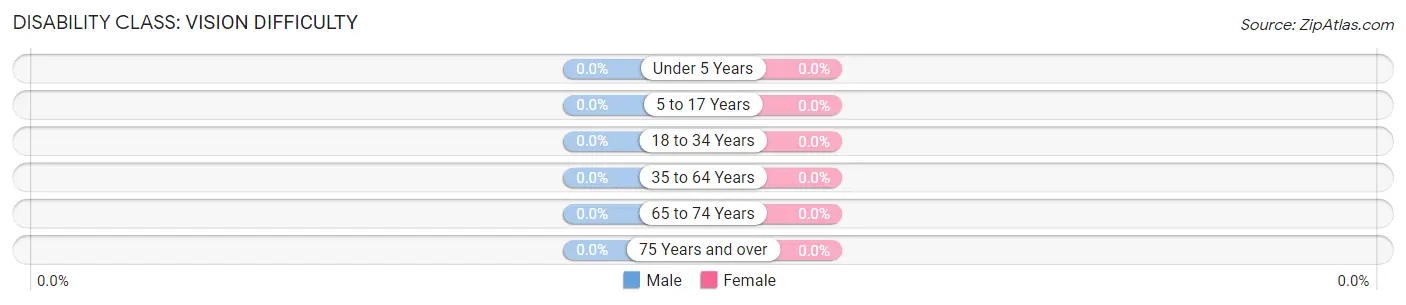
| Age Bracket | Male | Female |
| Under 5 Years | 0 (0.0%) | 0 (0.0%) |
| 5 to 17 Years | 0 (0.0%) | 0 (0.0%) |
| 18 to 34 Years | 0 (0.0%) | 0 (0.0%) |
| 35 to 64 Years | 0 (0.0%) | 0 (0.0%) |
| 65 to 74 Years | 0 (0.0%) | 0 (0.0%) |
| 75 Years and over | 0 (0.0%) | 0 (0.0%) |
Disability Class: Cognitive Difficulty
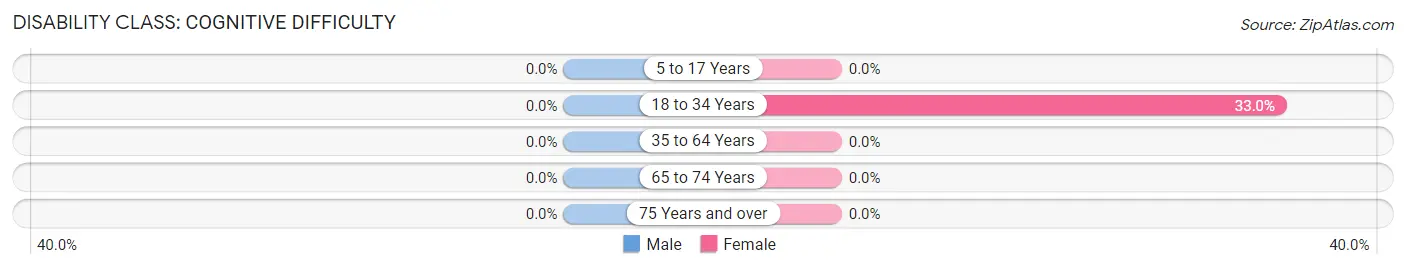
| Age Bracket | Male | Female |
| 5 to 17 Years | 0 (0.0%) | 0 (0.0%) |
| 18 to 34 Years | 0 (0.0%) | 38 (33.0%) |
| 35 to 64 Years | 0 (0.0%) | 0 (0.0%) |
| 65 to 74 Years | 0 (0.0%) | 0 (0.0%) |
| 75 Years and over | 0 (0.0%) | 0 (0.0%) |
Disability Class: Ambulatory Difficulty
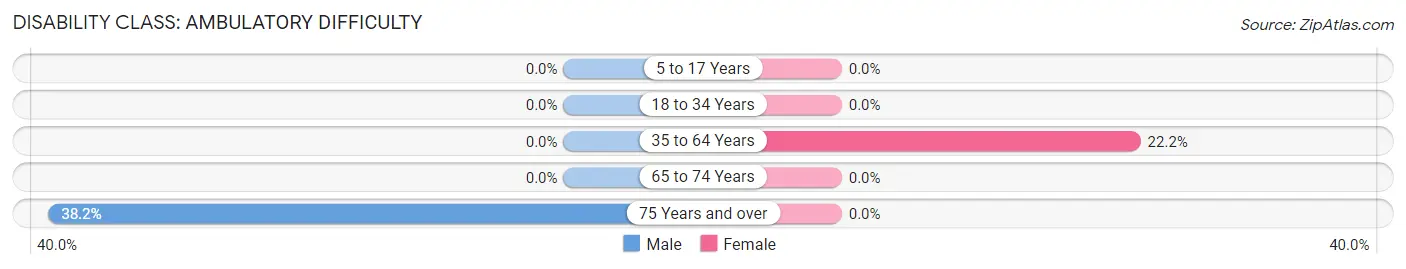
| Age Bracket | Male | Female |
| 5 to 17 Years | 0 (0.0%) | 0 (0.0%) |
| 18 to 34 Years | 0 (0.0%) | 0 (0.0%) |
| 35 to 64 Years | 0 (0.0%) | 67 (22.2%) |
| 65 to 74 Years | 0 (0.0%) | 0 (0.0%) |
| 75 Years and over | 13 (38.2%) | 0 (0.0%) |
Disability Class: Self-Care Difficulty
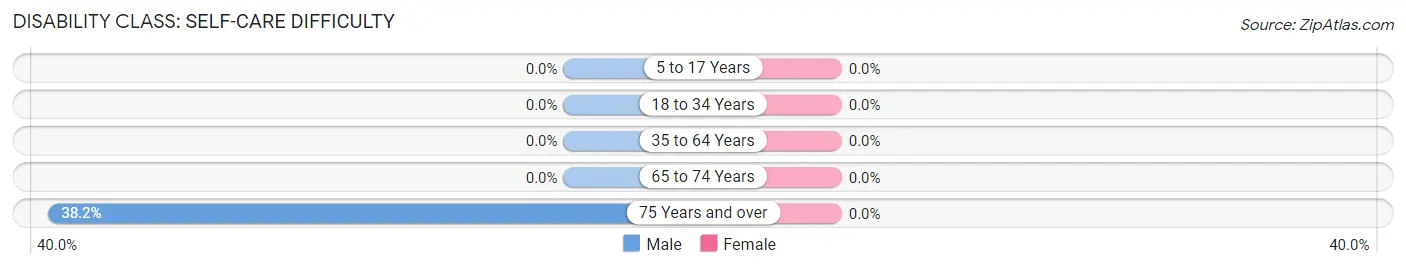
| Age Bracket | Male | Female |
| 5 to 17 Years | 0 (0.0%) | 0 (0.0%) |
| 18 to 34 Years | 0 (0.0%) | 0 (0.0%) |
| 35 to 64 Years | 0 (0.0%) | 0 (0.0%) |
| 65 to 74 Years | 0 (0.0%) | 0 (0.0%) |
| 75 Years and over | 13 (38.2%) | 0 (0.0%) |
Technology Access in Kings Mills
Computing Device Access in Kings Mills
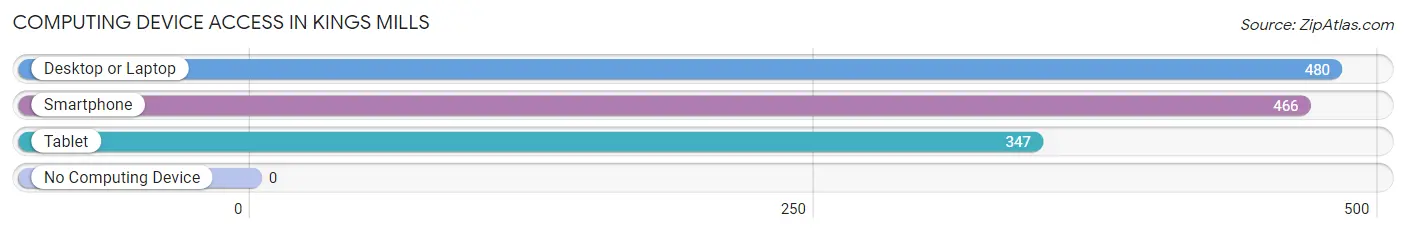
| Device Type | # Households | % Households |
| Desktop or Laptop | 480 | 96.4% |
| Smartphone | 466 | 93.6% |
| Tablet | 347 | 69.7% |
| No Computing Device | 0 | 0.0% |
| Total | 498 | 100.0% |
Internet Access in Kings Mills
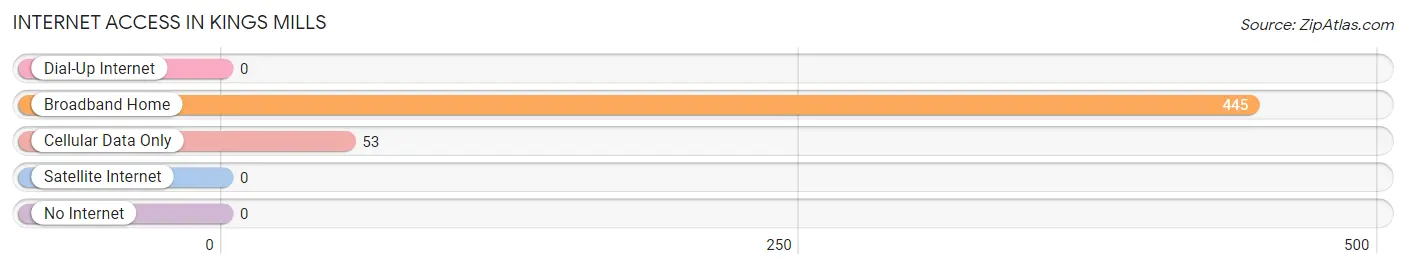
| Internet Type | # Households | % Households |
| Dial-Up Internet | 0 | 0.0% |
| Broadband Home | 445 | 89.4% |
| Cellular Data Only | 53 | 10.6% |
| Satellite Internet | 0 | 0.0% |
| No Internet | 0 | 0.0% |
| Total | 498 | 100.0% |
Kings Mills Summary
History
Kings Mills is a small village located in Warren County, Ohio. It is situated on the Little Miami River, about 25 miles northeast of Cincinnati. The village was founded in 1815 by William King, a Revolutionary War veteran, who purchased the land from the government. He named the village after himself and began to build a mill on the river. The mill was completed in 1817 and was used to grind grain and saw lumber.
The village grew slowly over the years, but it was not until the late 19th century that it began to experience significant growth. In 1876, the Cincinnati, Lebanon and Northern Railway was built through the village, connecting it to Cincinnati and other nearby towns. This allowed for increased trade and commerce, and the village began to grow. By the early 20th century, the village had a population of around 500 people.
In the early 20th century, the village was home to several businesses, including a general store, a blacksmith shop, a hotel, and a post office. The village also had a school, which was built in 1891 and served the local community until it closed in the 1950s.
Geography
Kings Mills is located in Warren County, Ohio, about 25 miles northeast of Cincinnati. It is situated on the Little Miami River, which flows through the village. The village is surrounded by rolling hills and farmland, and is located in a rural area. The climate in the area is temperate, with hot summers and cold winters.
The village covers an area of 0.6 square miles, and has a population of around 1,000 people. The village is served by two major highways, State Route 48 and State Route 126.
Economy
The economy of Kings Mills is largely based on agriculture and tourism. The village is home to several farms, which produce a variety of crops, including corn, soybeans, and wheat. The village also has several wineries, which attract tourists from all over the region.
The village is also home to several small businesses, including a general store, a hardware store, and a restaurant. The village also has a post office, a bank, and a library.
Demographics
As of the 2010 census, the population of Kings Mills was 1,000 people. The racial makeup of the village was 97.2% White, 0.7% African American, 0.3% Native American, 0.3% Asian, and 1.5% from other races. The median household income was $50,000, and the median age was 40 years.
The village is served by the Kings Local School District, which consists of two elementary schools, one middle school, and one high school. The village is also home to several churches, including the Kings Mills United Methodist Church and the Kings Mills Baptist Church.
Common Questions
What is the Total Population of Kings Mills?
Total Population of Kings Mills is 1,159.
What is the Total Male Population of Kings Mills?
Total Male Population of Kings Mills is 593.
What is the Total Female Population of Kings Mills?
Total Female Population of Kings Mills is 566.
What is the Ratio of Males per 100 Females in Kings Mills?
There are 104.77 Males per 100 Females in Kings Mills.
What is the Ratio of Females per 100 Males in Kings Mills?
There are 95.45 Females per 100 Males in Kings Mills.
What is the Median Population Age in Kings Mills?
Median Population Age in Kings Mills is 47.4 Years.
What is the Average Family Size in Kings Mills
Average Family Size in Kings Mills is 2.8 People.
What is the Average Household Size in Kings Mills
Average Household Size in Kings Mills is 2.3 People.
What is Per Capita Income in Kings Mills?
Per Capita income in Kings Mills is $60,294.
What is the Median Family Income in Kings Mills?
Median Family Income in Kings Mills is $124,931.
What is the Median Household income in Kings Mills?
Median Household Income in Kings Mills is $125,655.
What is Income or Wage Gap in Kings Mills?
Income or Wage Gap in Kings Mills is 17.5%.
Women in Kings Mills earn 82.5 cents for every dollar earned by a man.
What is Inequality or Gini Index in Kings Mills?
Inequality or Gini Index in Kings Mills is 0.42.
How Large is the Labor Force in Kings Mills?
There are 855 People in the Labor Forcein in Kings Mills.
What is the Percentage of People in the Labor Force in Kings Mills?
83.8% of People are in the Labor Force in Kings Mills.
What is the Unemployment Rate in Kings Mills?
Unemployment Rate in Kings Mills is 1.6%.