West Hill, OH
West Hill Map
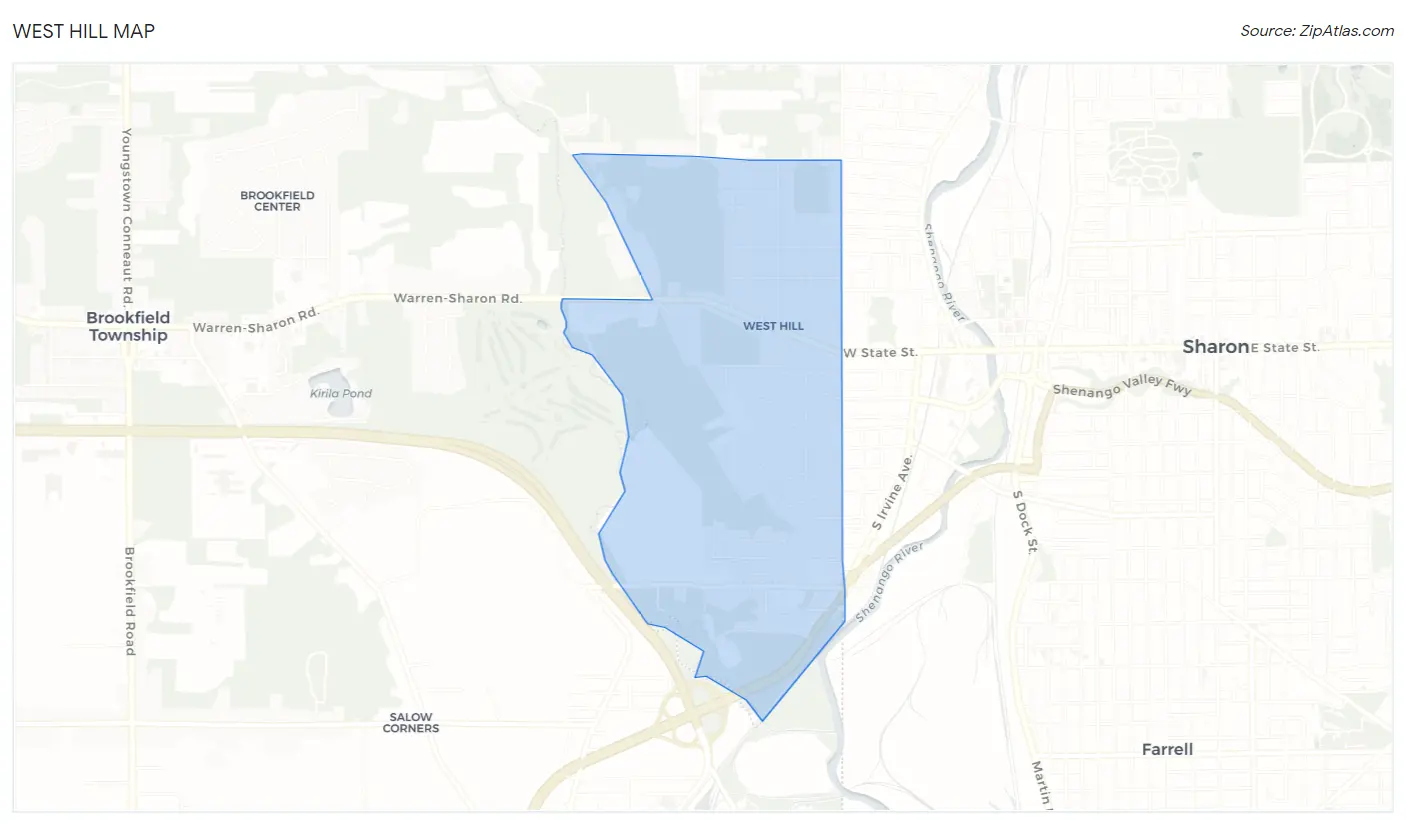
West Hill Overview
2,232
TOTAL POPULATION
1,141
MALE POPULATION
1,091
FEMALE POPULATION
104.58
MALES / 100 FEMALES
95.62
FEMALES / 100 MALES
42.9
MEDIAN AGE
3.0
AVG FAMILY SIZE
2.0
AVG HOUSEHOLD SIZE
$21,630
PER CAPITA INCOME
$41,397
AVG FAMILY INCOME
$30,590
AVG HOUSEHOLD INCOME
32.0%
WAGE / INCOME GAP [ % ]
68.0¢/ $1
WAGE / INCOME GAP [ $ ]
0.42
INEQUALITY / GINI INDEX
1,074
LABOR FORCE [ PEOPLE ]
56.1%
PERCENT IN LABOR FORCE
6.9%
UNEMPLOYMENT RATE
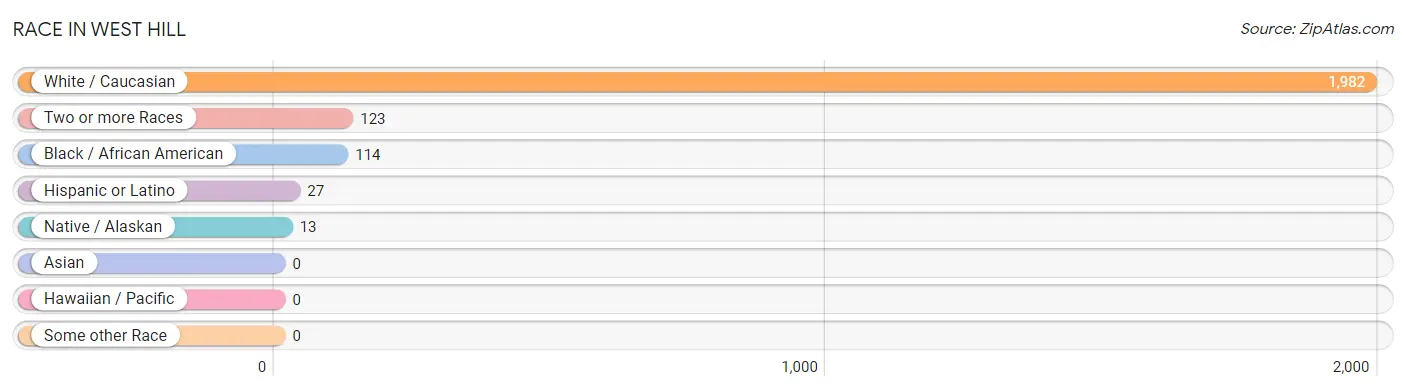
Race in West Hill
The most populous races in West Hill are White / Caucasian (1,982 | 88.8%), Two or more Races (123 | 5.5%), and Black / African American (114 | 5.1%).
| Race | # Population | % Population |
| Asian | 0 | 0.0% |
| Black / African American | 114 | 5.1% |
| Hawaiian / Pacific | 0 | 0.0% |
| Hispanic or Latino | 27 | 1.2% |
| Native / Alaskan | 13 | 0.6% |
| White / Caucasian | 1,982 | 88.8% |
| Two or more Races | 123 | 5.5% |
| Some other Race | 0 | 0.0% |
| Total | 2,232 | 100.0% |
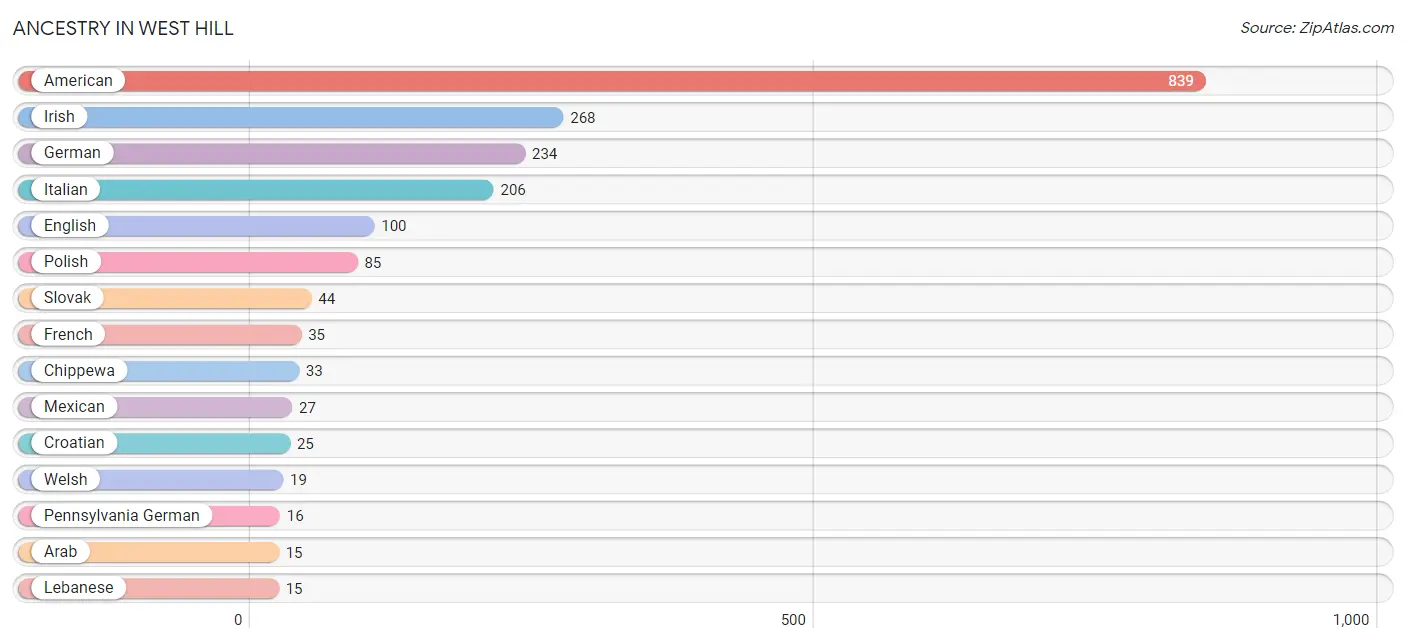
Ancestry in West Hill
The most populous ancestries reported in West Hill are American (839 | 37.6%), Irish (268 | 12.0%), German (234 | 10.5%), Italian (206 | 9.2%), and English (100 | 4.5%), together accounting for 73.8% of all West Hill residents.
| Ancestry | # Population | % Population |
| American | 839 | 37.6% |
| Arab | 15 | 0.7% |
| Blackfeet | 8 | 0.4% |
| Chippewa | 33 | 1.5% |
| Croatian | 25 | 1.1% |
| Dutch | 9 | 0.4% |
| Eastern European | 8 | 0.4% |
| English | 100 | 4.5% |
| French | 35 | 1.6% |
| French Canadian | 6 | 0.3% |
| German | 234 | 10.5% |
| Hungarian | 10 | 0.4% |
| Irish | 268 | 12.0% |
| Italian | 206 | 9.2% |
| Lebanese | 15 | 0.7% |
| Mexican | 27 | 1.2% |
| Mexican American Indian | 8 | 0.4% |
| Pennsylvania German | 16 | 0.7% |
| Polish | 85 | 3.8% |
| Russian | 5 | 0.2% |
| Slovak | 44 | 2.0% |
| Swedish | 14 | 0.6% |
| Welsh | 19 | 0.9% | View All 23 Rows |
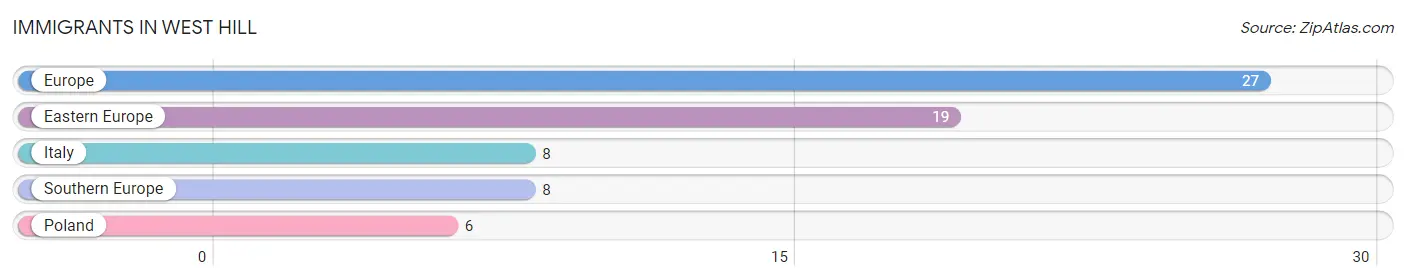
Immigrants in West Hill
The most numerous immigrant groups reported in West Hill came from Europe (27 | 1.2%), Eastern Europe (19 | 0.9%), Italy (8 | 0.4%), Southern Europe (8 | 0.4%), and Poland (6 | 0.3%), together accounting for 3.0% of all West Hill residents.
| Immigration Origin | # Population | % Population |
| Eastern Europe | 19 | 0.9% |
| Europe | 27 | 1.2% |
| Italy | 8 | 0.4% |
| Poland | 6 | 0.3% |
| Southern Europe | 8 | 0.4% | View All 5 Rows |
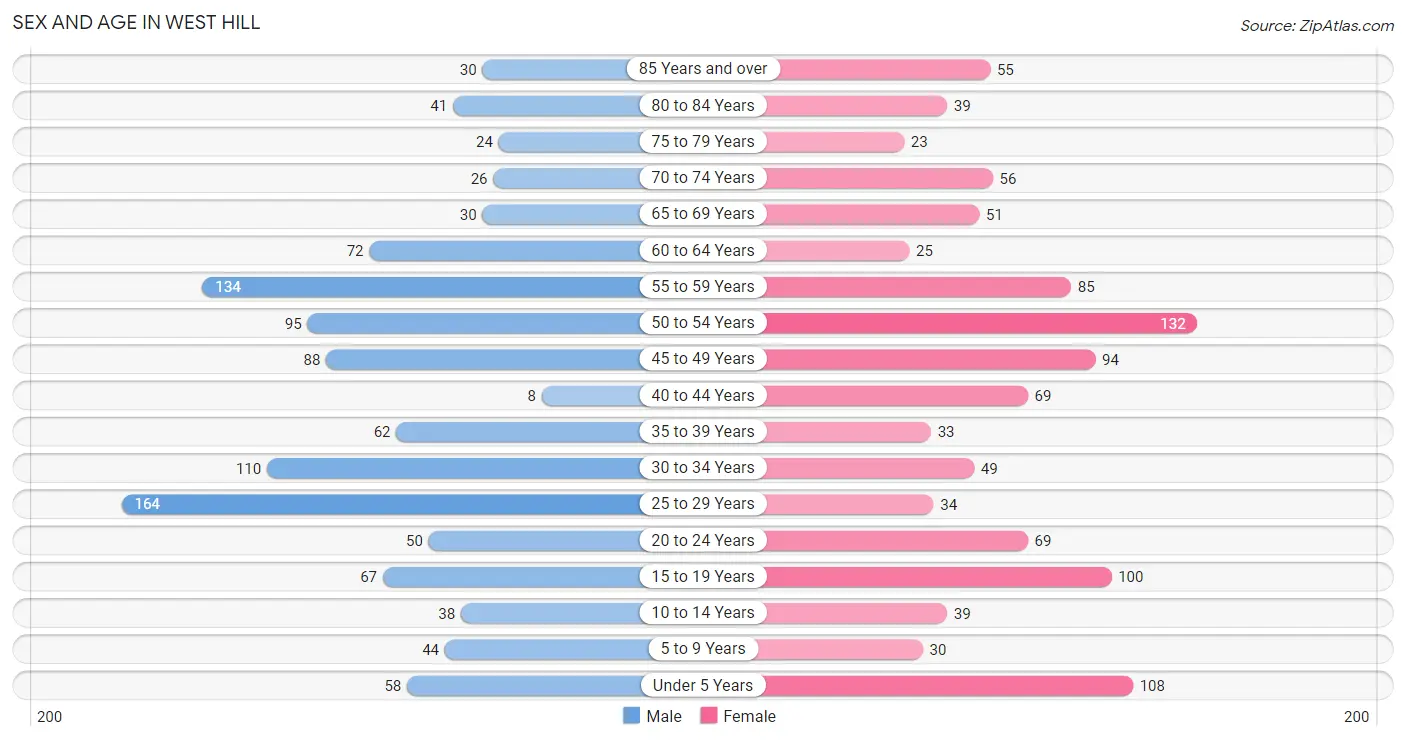
Sex and Age in West Hill
Sex and Age in West Hill
The most populous age groups in West Hill are 25 to 29 Years (164 | 14.4%) for men and 50 to 54 Years (132 | 12.1%) for women.
| Age Bracket | Male | Female |
| Under 5 Years | 58 (5.1%) | 108 (9.9%) |
| 5 to 9 Years | 44 (3.9%) | 30 (2.8%) |
| 10 to 14 Years | 38 (3.3%) | 39 (3.6%) |
| 15 to 19 Years | 67 (5.9%) | 100 (9.2%) |
| 20 to 24 Years | 50 (4.4%) | 69 (6.3%) |
| 25 to 29 Years | 164 (14.4%) | 34 (3.1%) |
| 30 to 34 Years | 110 (9.6%) | 49 (4.5%) |
| 35 to 39 Years | 62 (5.4%) | 33 (3.0%) |
| 40 to 44 Years | 8 (0.7%) | 69 (6.3%) |
| 45 to 49 Years | 88 (7.7%) | 94 (8.6%) |
| 50 to 54 Years | 95 (8.3%) | 132 (12.1%) |
| 55 to 59 Years | 134 (11.7%) | 85 (7.8%) |
| 60 to 64 Years | 72 (6.3%) | 25 (2.3%) |
| 65 to 69 Years | 30 (2.6%) | 51 (4.7%) |
| 70 to 74 Years | 26 (2.3%) | 56 (5.1%) |
| 75 to 79 Years | 24 (2.1%) | 23 (2.1%) |
| 80 to 84 Years | 41 (3.6%) | 39 (3.6%) |
| 85 Years and over | 30 (2.6%) | 55 (5.0%) |
| Total | 1,141 (100.0%) | 1,091 (100.0%) |
Families and Households in West Hill
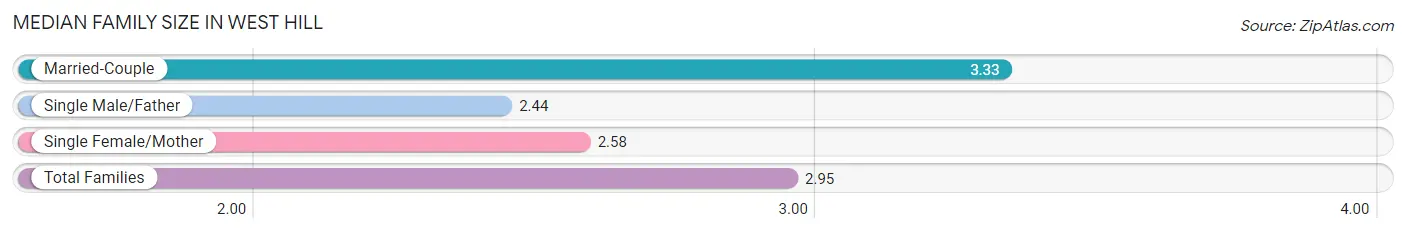
Median Family Size in West Hill
The median family size in West Hill is 2.95 persons per family, with married-couple families (248 | 54.0%) accounting for the largest median family size of 3.33 persons per family. On the other hand, single male/father families (100 | 21.8%) represent the smallest median family size with 2.44 persons per family.
| Family Type | # Families | Family Size |
| Married-Couple | 248 (54.0%) | 3.33 |
| Single Male/Father | 100 (21.8%) | 2.44 |
| Single Female/Mother | 111 (24.2%) | 2.58 |
| Total Families | 459 (100.0%) | 2.95 |
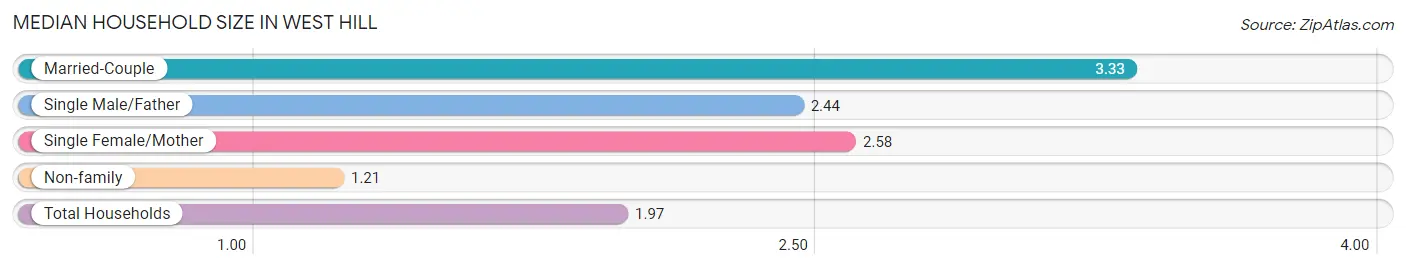
Median Household Size in West Hill
The median household size in West Hill is 1.97 persons per household, with married-couple households (248 | 23.6%) accounting for the largest median household size of 3.33 persons per household. non-family households (591 | 56.3%) represent the smallest median household size with 1.21 persons per household.
| Household Type | # Households | Household Size |
| Married-Couple | 248 (23.6%) | 3.33 |
| Single Male/Father | 100 (9.5%) | 2.44 |
| Single Female/Mother | 111 (10.6%) | 2.58 |
| Non-family | 591 (56.3%) | 1.21 |
| Total Households | 1,050 (100.0%) | 1.97 |
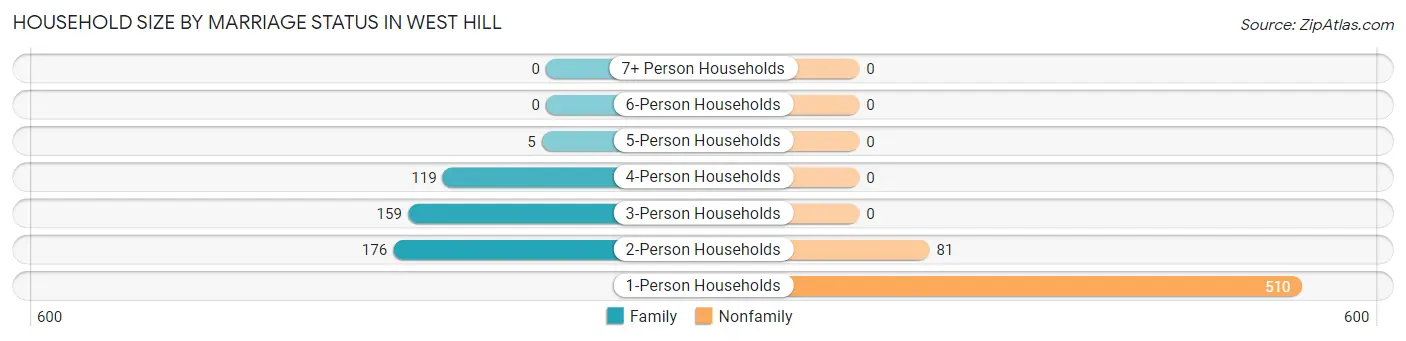
Household Size by Marriage Status in West Hill
Out of a total of 1,050 households in West Hill, 459 (43.7%) are family households, while 591 (56.3%) are nonfamily households. The most numerous type of family households are 2-person households, comprising 176, and the most common type of nonfamily households are 1-person households, comprising 510.
| Household Size | Family Households | Nonfamily Households |
| 1-Person Households | - | 510 (48.6%) |
| 2-Person Households | 176 (16.8%) | 81 (7.7%) |
| 3-Person Households | 159 (15.1%) | 0 (0.0%) |
| 4-Person Households | 119 (11.3%) | 0 (0.0%) |
| 5-Person Households | 5 (0.5%) | 0 (0.0%) |
| 6-Person Households | 0 (0.0%) | 0 (0.0%) |
| 7+ Person Households | 0 (0.0%) | 0 (0.0%) |
| Total | 459 (43.7%) | 591 (56.3%) |
Female Fertility in West Hill
Fertility by Age in West Hill
Average fertility rate in West Hill is 26.0 births per 1,000 women. Women in the age bracket of 20 to 34 years have the highest fertility rate with 79.0 births per 1,000 women. Women in the age bracket of 20 to 34 years acount for 100.0% of all women with births.
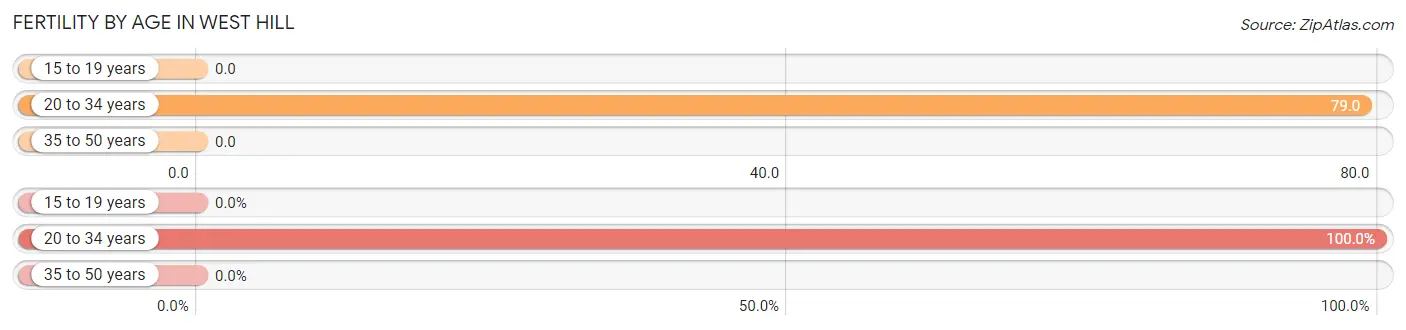
| Age Bracket | Women with Births | Births / 1,000 Women |
| 15 to 19 years | 0 (0.0%) | 0.0 |
| 20 to 34 years | 12 (100.0%) | 79.0 |
| 35 to 50 years | 0 (0.0%) | 0.0 |
| Total | 12 (100.0%) | 26.0 |
Fertility by Age by Marriage Status in West Hill
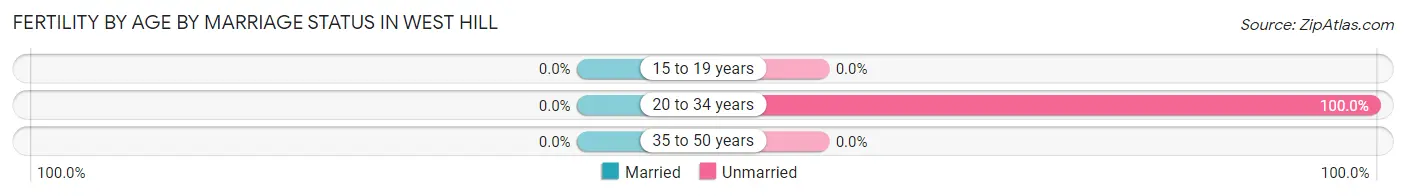
| Age Bracket | Married | Unmarried |
| 15 to 19 years | 0 (0.0%) | 0 (0.0%) |
| 20 to 34 years | 0 (0.0%) | 12 (100.0%) |
| 35 to 50 years | 0 (0.0%) | 0 (0.0%) |
| Total | 0 (0.0%) | 12 (100.0%) |
Fertility by Education in West Hill
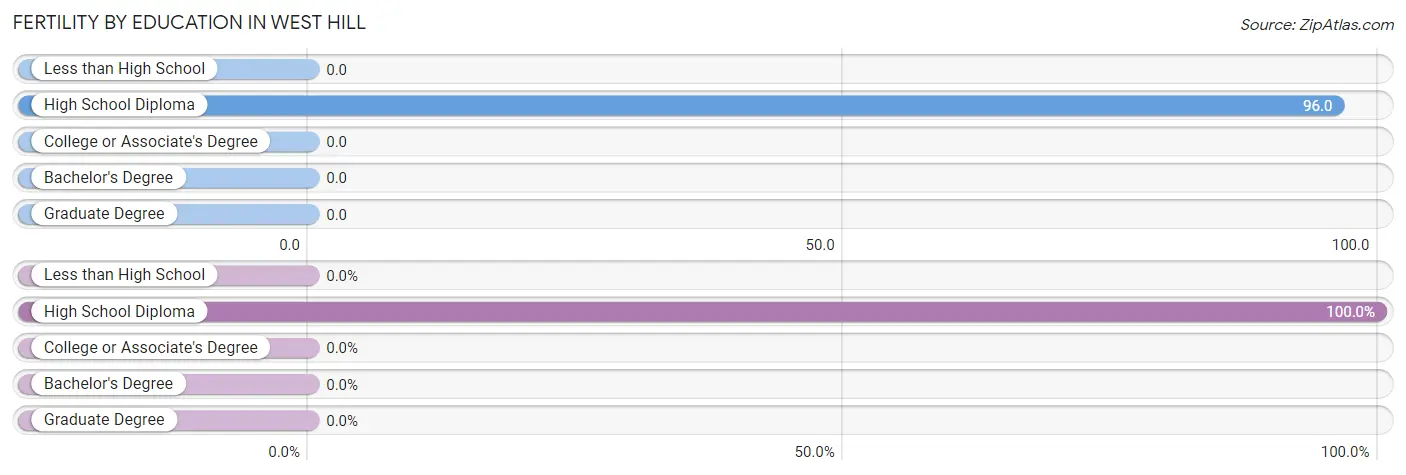
| Educational Attainment | Women with Births | Births / 1,000 Women |
| Less than High School | 0 (0.0%) | 0.0 |
| High School Diploma | 12 (100.0%) | 96.0 |
| College or Associate's Degree | 0 (0.0%) | 0.0 |
| Bachelor's Degree | 0 (0.0%) | 0.0 |
| Graduate Degree | 0 (0.0%) | 0.0 |
| Total | 12 (100.0%) | 26.0 |
Fertility by Education by Marriage Status in West Hill
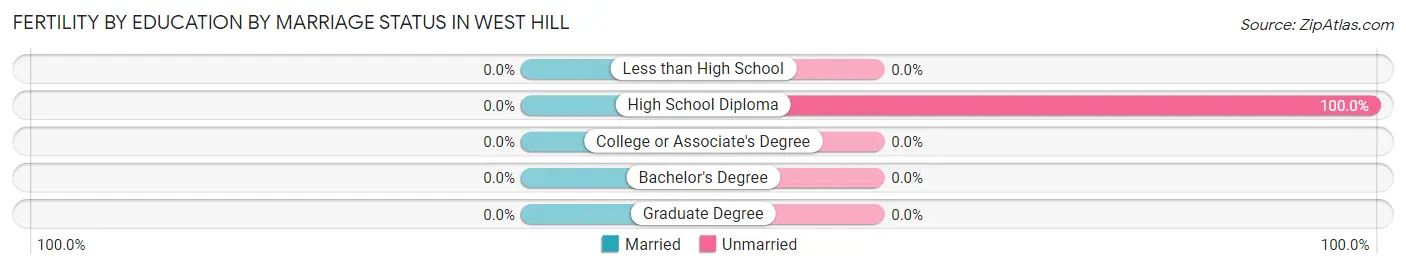
| Educational Attainment | Married | Unmarried |
| Less than High School | 0 (0.0%) | 0 (0.0%) |
| High School Diploma | 0 (0.0%) | 12 (100.0%) |
| College or Associate's Degree | 0 (0.0%) | 0 (0.0%) |
| Bachelor's Degree | 0 (0.0%) | 0 (0.0%) |
| Graduate Degree | 0 (0.0%) | 0 (0.0%) |
| Total | 0 (0.0%) | 12 (100.0%) |
Income in West Hill
Income Overview in West Hill
Per Capita Income in West Hill is $21,630, while median incomes of families and households are $41,397 and $30,590 respectively.
| Characteristic | Number | Measure |
| Per Capita Income | 2,232 | $21,630 |
| Median Family Income | 459 | $41,397 |
| Mean Family Income | 459 | $56,109 |
| Median Household Income | 1,050 | $30,590 |
| Mean Household Income | 1,050 | $43,000 |
| Income Deficit | 459 | $0 |
| Wage / Income Gap (%) | 2,232 | 32.03% |
| Wage / Income Gap ($) | 2,232 | 67.97¢ per $1 |
| Gini / Inequality Index | 2,232 | 0.42 |
Earnings by Sex in West Hill
Average Earnings in West Hill are $29,274, $31,712 for men and $21,554 for women, a difference of 32.0%.
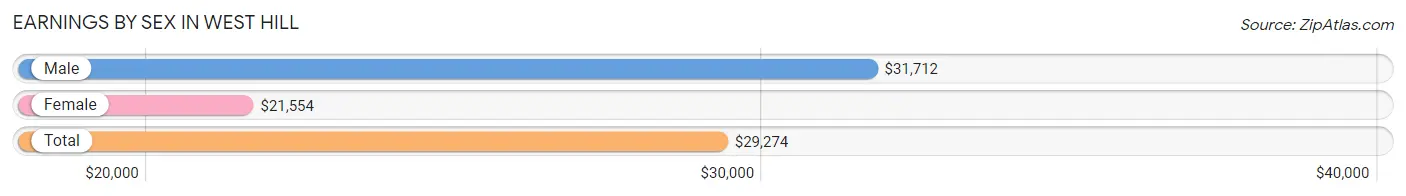
| Sex | Number | Average Earnings |
| Male | 599 (59.2%) | $31,712 |
| Female | 413 (40.8%) | $21,554 |
| Total | 1,012 (100.0%) | $29,274 |
Earnings by Sex by Income Bracket in West Hill
The most common earnings brackets in West Hill are $25,000 to $29,999 for men (110 | 18.4%) and $20,000 to $22,499 for women (78 | 18.9%).
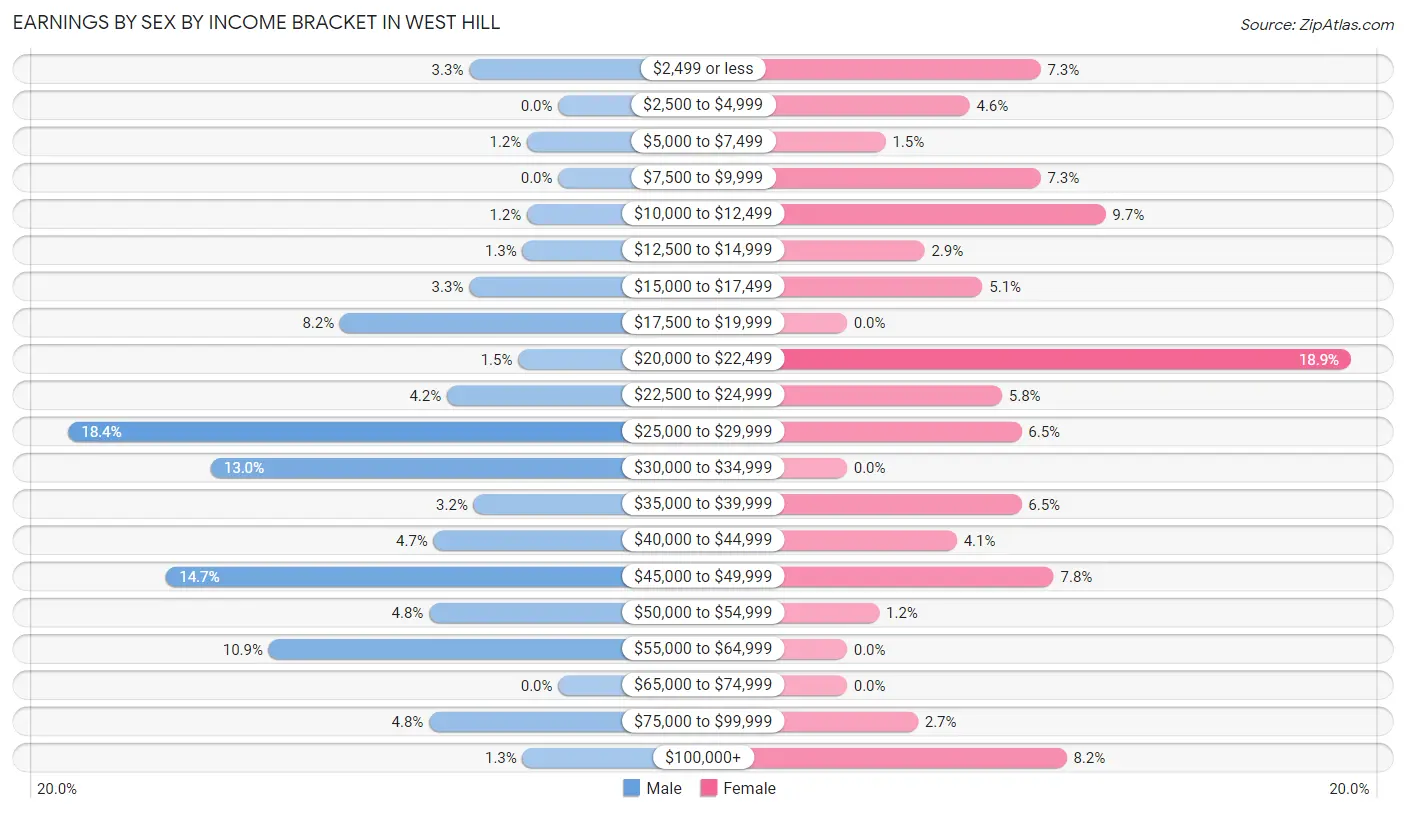
| Income | Male | Female |
| $2,499 or less | 20 (3.3%) | 30 (7.3%) |
| $2,500 to $4,999 | 0 (0.0%) | 19 (4.6%) |
| $5,000 to $7,499 | 7 (1.2%) | 6 (1.5%) |
| $7,500 to $9,999 | 0 (0.0%) | 30 (7.3%) |
| $10,000 to $12,499 | 7 (1.2%) | 40 (9.7%) |
| $12,500 to $14,999 | 8 (1.3%) | 12 (2.9%) |
| $15,000 to $17,499 | 20 (3.3%) | 21 (5.1%) |
| $17,500 to $19,999 | 49 (8.2%) | 0 (0.0%) |
| $20,000 to $22,499 | 9 (1.5%) | 78 (18.9%) |
| $22,500 to $24,999 | 25 (4.2%) | 24 (5.8%) |
| $25,000 to $29,999 | 110 (18.4%) | 27 (6.5%) |
| $30,000 to $34,999 | 78 (13.0%) | 0 (0.0%) |
| $35,000 to $39,999 | 19 (3.2%) | 27 (6.5%) |
| $40,000 to $44,999 | 28 (4.7%) | 17 (4.1%) |
| $45,000 to $49,999 | 88 (14.7%) | 32 (7.7%) |
| $50,000 to $54,999 | 29 (4.8%) | 5 (1.2%) |
| $55,000 to $64,999 | 65 (10.8%) | 0 (0.0%) |
| $65,000 to $74,999 | 0 (0.0%) | 0 (0.0%) |
| $75,000 to $99,999 | 29 (4.8%) | 11 (2.7%) |
| $100,000+ | 8 (1.3%) | 34 (8.2%) |
| Total | 599 (100.0%) | 413 (100.0%) |
Earnings by Sex by Educational Attainment in West Hill
Average earnings in West Hill are $32,077 for men and $22,147 for women, a difference of 31.0%. Men with an educational attainment of college or associate's degree enjoy the highest average annual earnings of $51,875, while those with high school diploma education earn the least with $30,511. Women with an educational attainment of college or associate's degree earn the most with the average annual earnings of $40,441, while those with high school diploma education have the smallest earnings of $20,125.
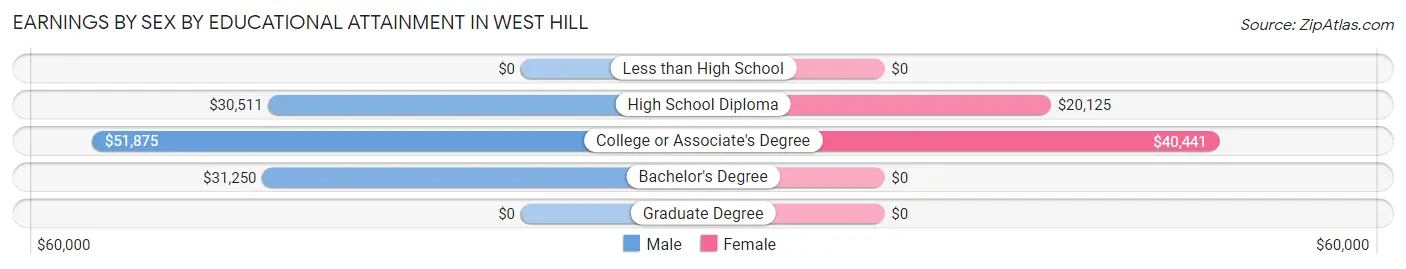
| Educational Attainment | Male Income | Female Income |
| Less than High School | - | - |
| High School Diploma | $30,511 | $20,125 |
| College or Associate's Degree | $51,875 | $40,441 |
| Bachelor's Degree | $31,250 | $0 |
| Graduate Degree | - | - |
| Total | $32,077 | $22,147 |
Family Income in West Hill
Family Income Brackets in West Hill
According to the West Hill family income data, there are 138 families falling into the $25,000 to $34,999 income range, which is the most common income bracket and makes up 30.1% of all families.
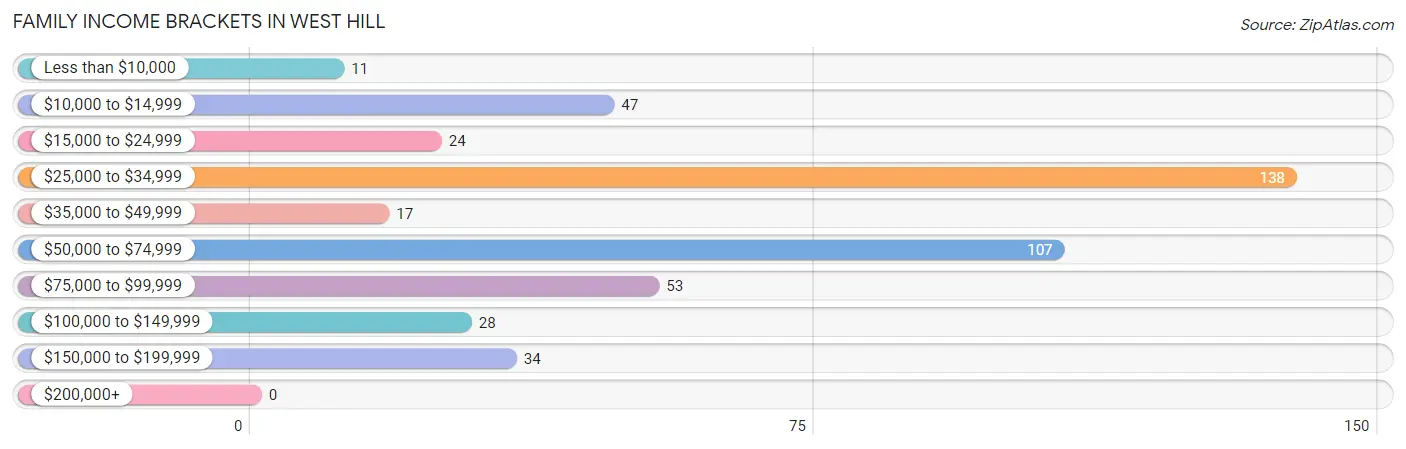
| Income Bracket | # Families | % Families |
| Less than $10,000 | 11 | 2.4% |
| $10,000 to $14,999 | 47 | 10.2% |
| $15,000 to $24,999 | 24 | 5.2% |
| $25,000 to $34,999 | 138 | 30.1% |
| $35,000 to $49,999 | 17 | 3.7% |
| $50,000 to $74,999 | 107 | 23.3% |
| $75,000 to $99,999 | 53 | 11.5% |
| $100,000 to $149,999 | 28 | 6.1% |
| $150,000 to $199,999 | 34 | 7.4% |
| $200,000+ | 0 | 0.0% |
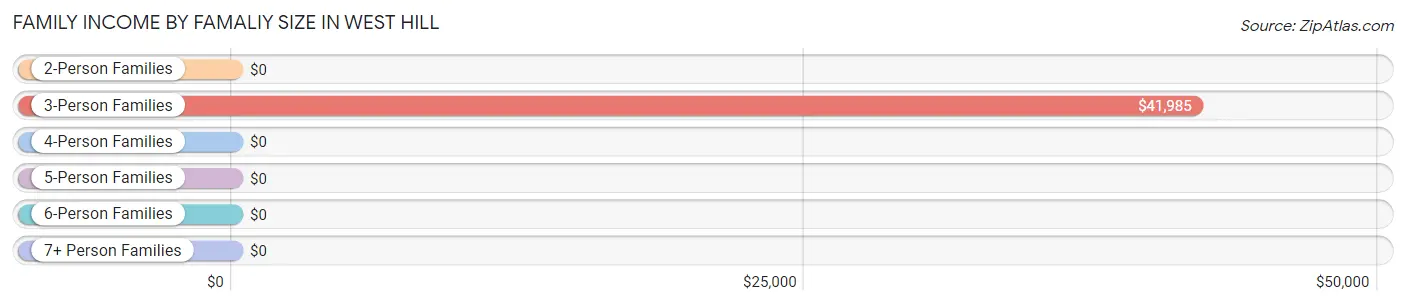
Family Income by Famaliy Size in West Hill
3-person families (159 | 34.6%) account for the highest median family income in West Hill with $41,985 per family, while 3-person families (159 | 34.6%) have the highest median income of $13,995 per family member.
| Income Bracket | # Families | Median Income |
| 2-Person Families | 176 (38.3%) | $0 |
| 3-Person Families | 159 (34.6%) | $41,985 |
| 4-Person Families | 119 (25.9%) | $0 |
| 5-Person Families | 5 (1.1%) | $0 |
| 6-Person Families | 0 (0.0%) | $0 |
| 7+ Person Families | 0 (0.0%) | $0 |
| Total | 459 (100.0%) | $41,397 |
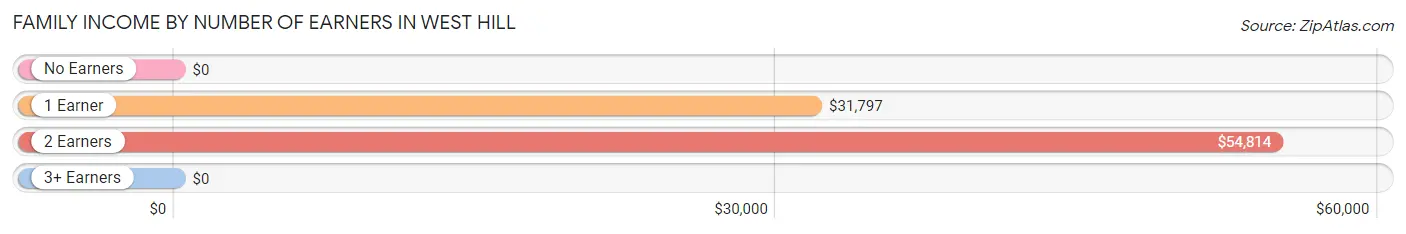
Family Income by Number of Earners in West Hill
| Number of Earners | # Families | Median Income |
| No Earners | 54 (11.8%) | $0 |
| 1 Earner | 266 (58.0%) | $31,797 |
| 2 Earners | 127 (27.7%) | $54,814 |
| 3+ Earners | 12 (2.6%) | $0 |
| Total | 459 (100.0%) | $41,397 |
Household Income in West Hill
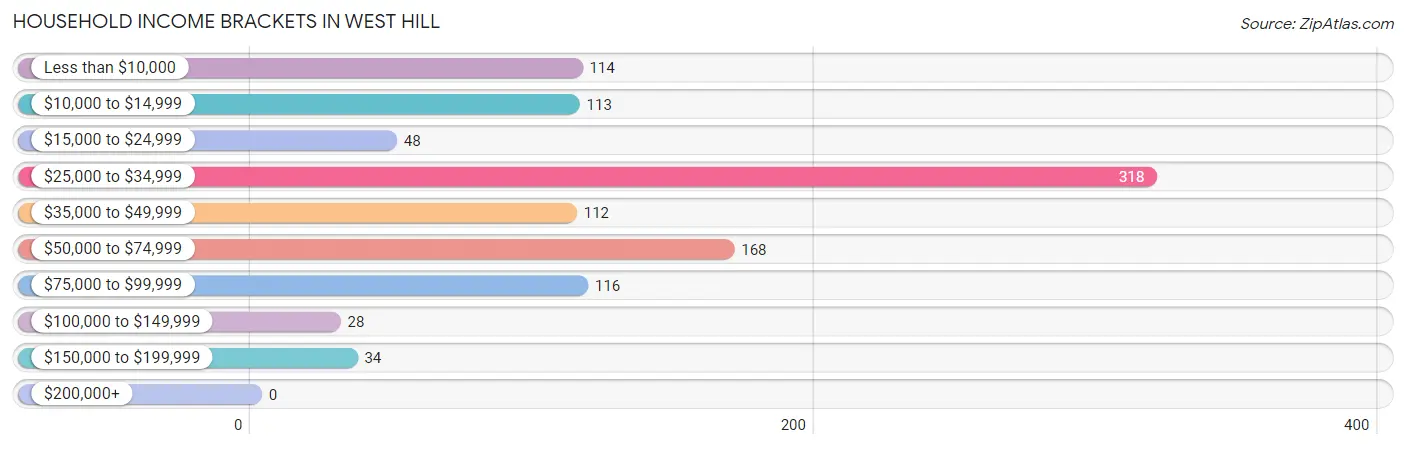
Household Income Brackets in West Hill
With 318 households falling in the category, the $25,000 to $34,999 income range is the most frequent in West Hill, accounting for 30.3% of all households.
| Income Bracket | # Households | % Households |
| Less than $10,000 | 114 | 10.9% |
| $10,000 to $14,999 | 113 | 10.8% |
| $15,000 to $24,999 | 48 | 4.6% |
| $25,000 to $34,999 | 318 | 30.3% |
| $35,000 to $49,999 | 112 | 10.7% |
| $50,000 to $74,999 | 168 | 16.0% |
| $75,000 to $99,999 | 116 | 11.0% |
| $100,000 to $149,999 | 28 | 2.7% |
| $150,000 to $199,999 | 34 | 3.2% |
| $200,000+ | 0 | 0.0% |
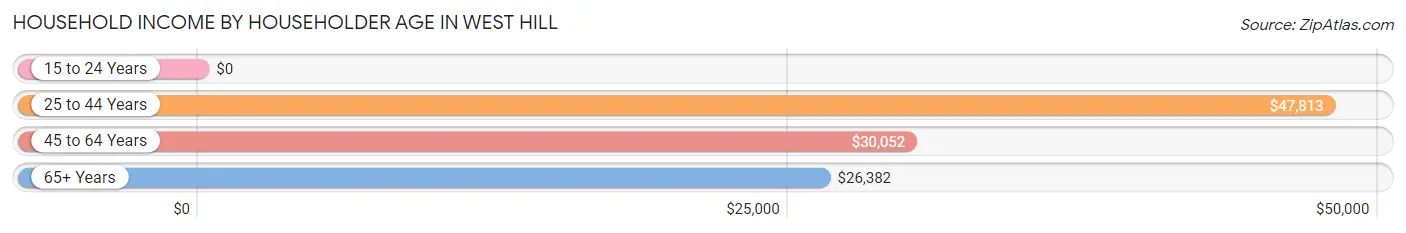
Household Income by Householder Age in West Hill
The median household income in West Hill is $30,590, with the highest median household income of $47,813 found in the 25 to 44 years age bracket for the primary householder. A total of 266 households (25.3%) fall into this category. Meanwhile, the 15 to 24 years age bracket for the primary householder has the lowest median household income of $0, with 37 households (3.5%) in this group.
| Income Bracket | # Households | Median Income |
| 15 to 24 Years | 37 (3.5%) | $0 |
| 25 to 44 Years | 266 (25.3%) | $47,813 |
| 45 to 64 Years | 518 (49.3%) | $30,052 |
| 65+ Years | 229 (21.8%) | $26,382 |
| Total | 1,050 (100.0%) | $30,590 |
Poverty in West Hill
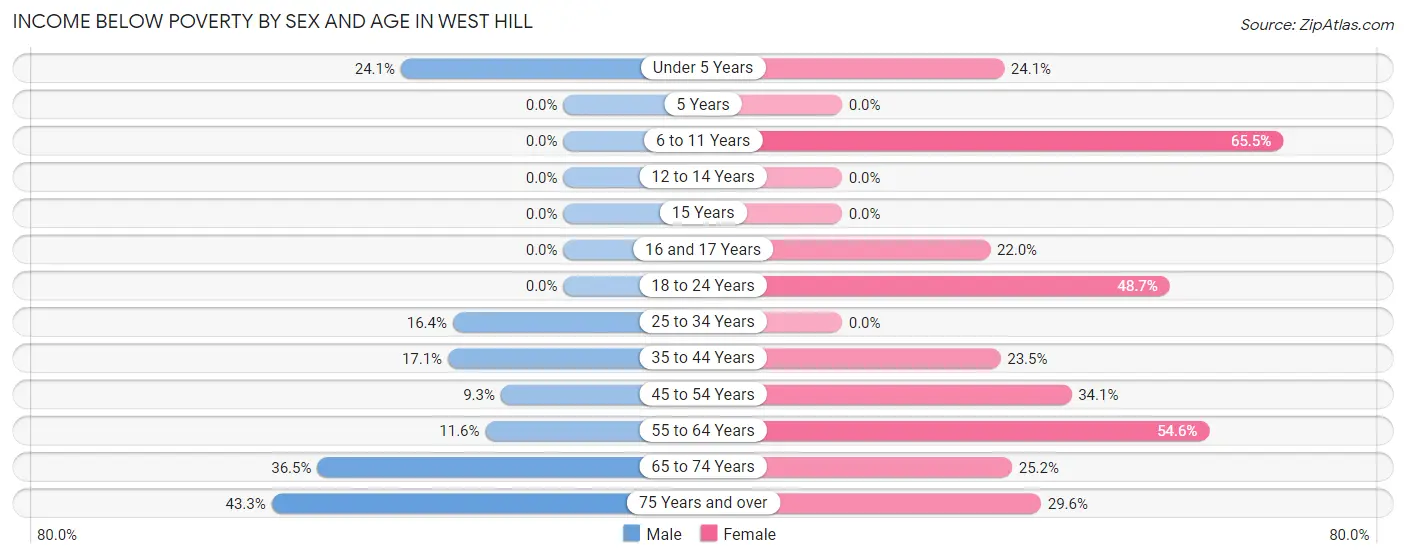
Income Below Poverty by Sex and Age in West Hill
With 14.3% poverty level for males and 32.3% for females among the residents of West Hill, 75 year old and over males and 6 to 11 year old females are the most vulnerable to poverty, with 26 males (43.3%) and 38 females (65.5%) in their respective age groups living below the poverty level.
| Age Bracket | Male | Female |
| Under 5 Years | 14 (24.1%) | 26 (24.1%) |
| 5 Years | 0 (0.0%) | 0 (0.0%) |
| 6 to 11 Years | 0 (0.0%) | 38 (65.5%) |
| 12 to 14 Years | 0 (0.0%) | 0 (0.0%) |
| 15 Years | 0 (0.0%) | 0 (0.0%) |
| 16 and 17 Years | 0 (0.0%) | 11 (22.0%) |
| 18 to 24 Years | 0 (0.0%) | 55 (48.7%) |
| 25 to 34 Years | 45 (16.4%) | 0 (0.0%) |
| 35 to 44 Years | 12 (17.1%) | 24 (23.5%) |
| 45 to 54 Years | 17 (9.3%) | 77 (34.1%) |
| 55 to 64 Years | 22 (11.6%) | 48 (54.5%) |
| 65 to 74 Years | 19 (36.5%) | 26 (25.2%) |
| 75 Years and over | 26 (43.3%) | 13 (29.5%) |
| Total | 155 (14.3%) | 318 (32.3%) |
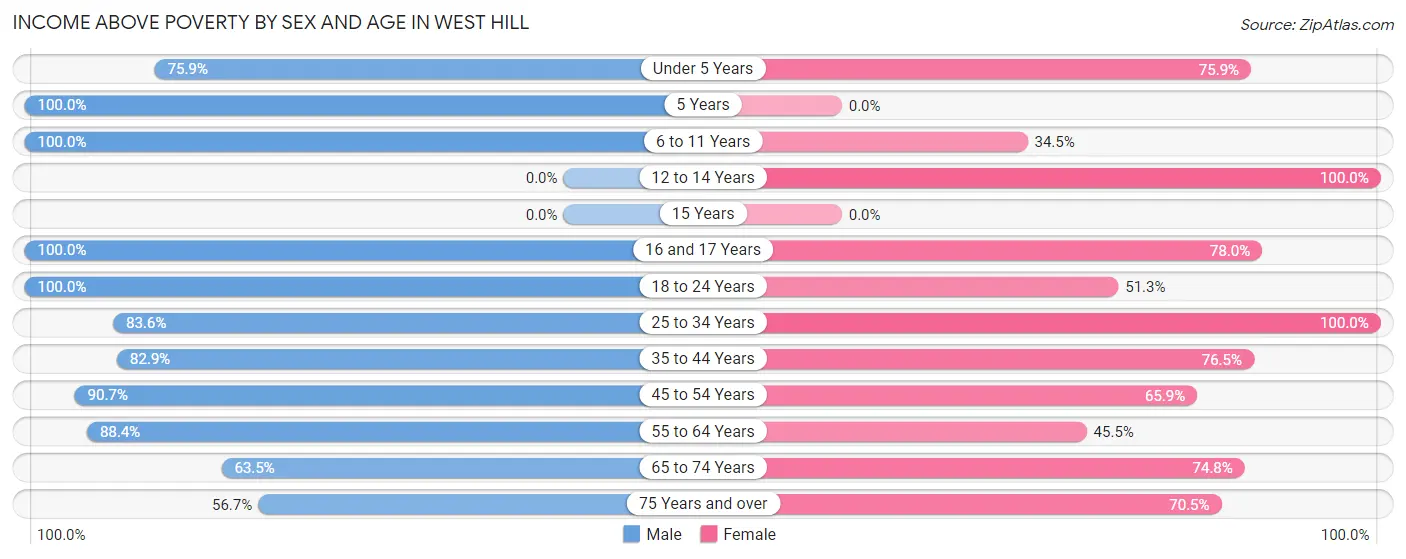
Income Above Poverty by Sex and Age in West Hill
According to the poverty statistics in West Hill, males aged 5 years and females aged 12 to 14 years are the age groups that are most secure financially, with 100.0% of males and 100.0% of females in these age groups living above the poverty line.
| Age Bracket | Male | Female |
| Under 5 Years | 44 (75.9%) | 82 (75.9%) |
| 5 Years | 9 (100.0%) | 0 (0.0%) |
| 6 to 11 Years | 73 (100.0%) | 20 (34.5%) |
| 12 to 14 Years | 0 (0.0%) | 11 (100.0%) |
| 15 Years | 0 (0.0%) | 0 (0.0%) |
| 16 and 17 Years | 67 (100.0%) | 39 (78.0%) |
| 18 to 24 Years | 50 (100.0%) | 58 (51.3%) |
| 25 to 34 Years | 229 (83.6%) | 83 (100.0%) |
| 35 to 44 Years | 58 (82.9%) | 78 (76.5%) |
| 45 to 54 Years | 166 (90.7%) | 149 (65.9%) |
| 55 to 64 Years | 168 (88.4%) | 40 (45.5%) |
| 65 to 74 Years | 33 (63.5%) | 77 (74.8%) |
| 75 Years and over | 34 (56.7%) | 31 (70.5%) |
| Total | 931 (85.7%) | 668 (67.7%) |
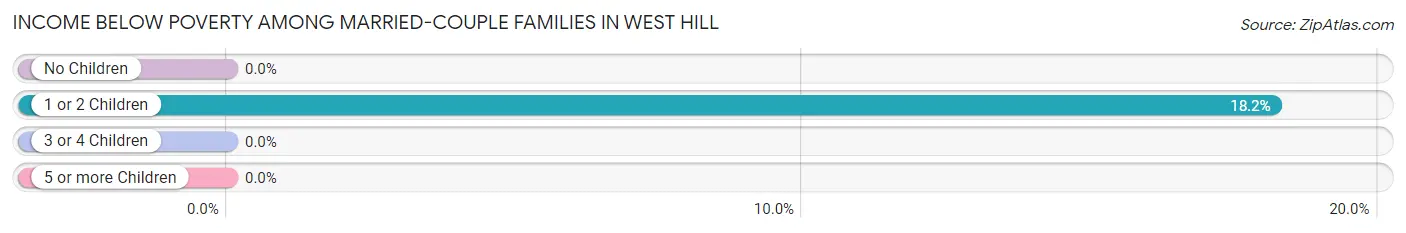
Income Below Poverty Among Married-Couple Families in West Hill
The poverty statistics for married-couple families in West Hill show that 12.9% or 32 of the total 248 families live below the poverty line. Families with 1 or 2 children have the highest poverty rate of 18.2%, comprising of 32 families. On the other hand, families with no children have the lowest poverty rate of 0.0%, which includes 0 families.
| Children | Above Poverty | Below Poverty |
| No Children | 72 (100.0%) | 0 (0.0%) |
| 1 or 2 Children | 144 (81.8%) | 32 (18.2%) |
| 3 or 4 Children | 0 (0.0%) | 0 (0.0%) |
| 5 or more Children | 0 (0.0%) | 0 (0.0%) |
| Total | 216 (87.1%) | 32 (12.9%) |
Income Below Poverty Among Single-Parent Households in West Hill
According to the poverty data in West Hill, 11.0% or 11 single-father households and 35.1% or 39 single-mother households are living below the poverty line. Among single-father households, those with 1 or 2 children have the highest poverty rate, with 11 households (17.5%) experiencing poverty. Likewise, among single-mother households, those with 1 or 2 children have the highest poverty rate, with 39 households (35.1%) falling below the poverty line.
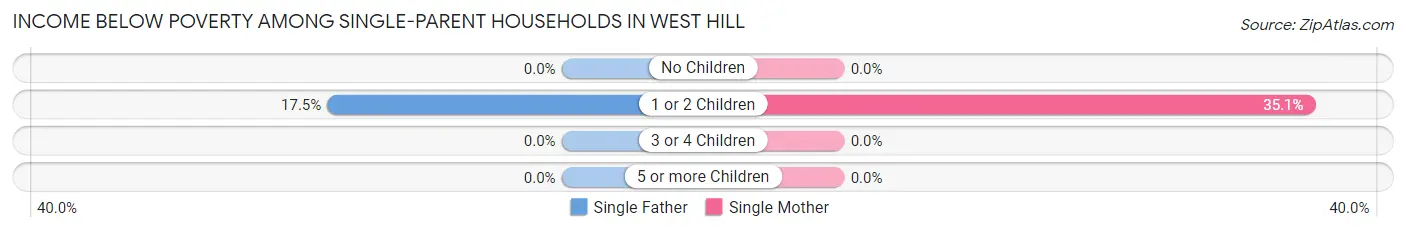
| Children | Single Father | Single Mother |
| No Children | 0 (0.0%) | 0 (0.0%) |
| 1 or 2 Children | 11 (17.5%) | 39 (35.1%) |
| 3 or 4 Children | 0 (0.0%) | 0 (0.0%) |
| 5 or more Children | 0 (0.0%) | 0 (0.0%) |
| Total | 11 (11.0%) | 39 (35.1%) |
Income Below Poverty Among Married-Couple vs Single-Parent Households in West Hill
The poverty data for West Hill shows that 32 of the married-couple family households (12.9%) and 50 of the single-parent households (23.7%) are living below the poverty level. Within the married-couple family households, those with 1 or 2 children have the highest poverty rate, with 32 households (18.2%) falling below the poverty line. Among the single-parent households, those with 1 or 2 children have the highest poverty rate, with 50 household (28.7%) living below poverty.
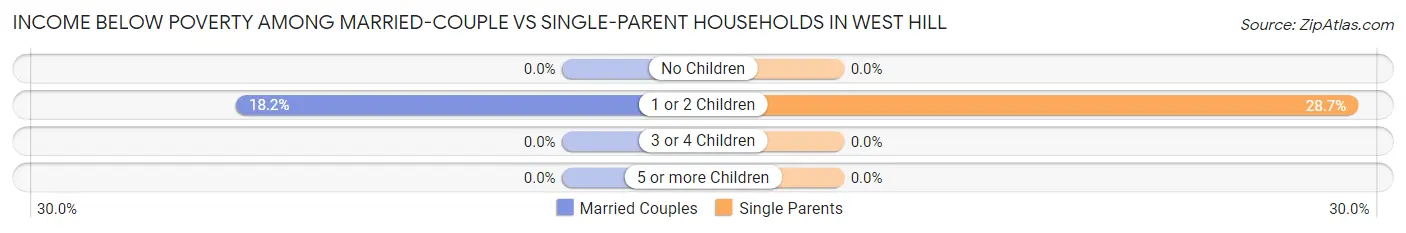
| Children | Married-Couple Families | Single-Parent Households |
| No Children | 0 (0.0%) | 0 (0.0%) |
| 1 or 2 Children | 32 (18.2%) | 50 (28.7%) |
| 3 or 4 Children | 0 (0.0%) | 0 (0.0%) |
| 5 or more Children | 0 (0.0%) | 0 (0.0%) |
| Total | 32 (12.9%) | 50 (23.7%) |
Employment Characteristics in West Hill
Employment by Class of Employer in West Hill
Among the 988 employed individuals in West Hill, private company employees (759 | 76.8%), not-for-profit organizations (80 | 8.1%), and self-employed (incorporated) (43 | 4.3%) make up the most common classes of employment.
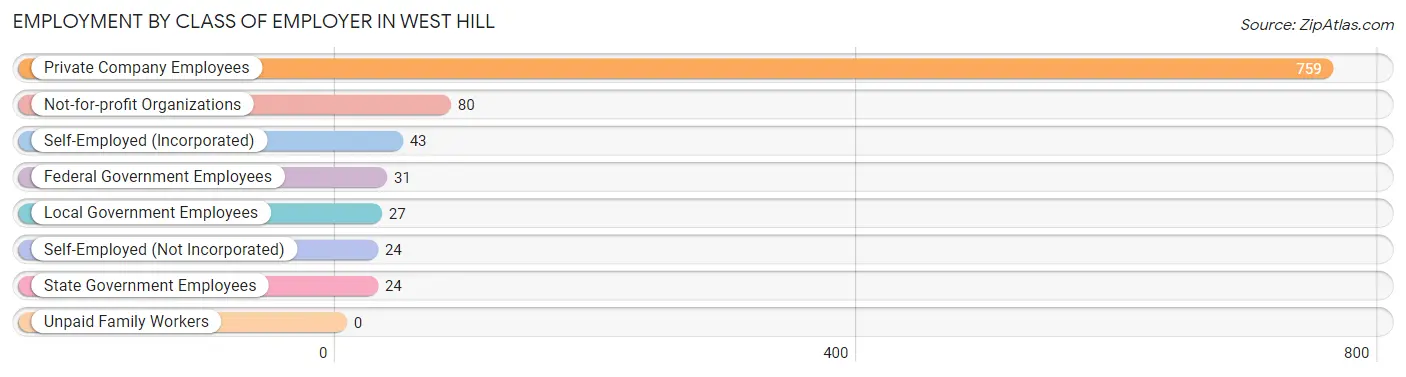
| Employer Class | # Employees | % Employees |
| Private Company Employees | 759 | 76.8% |
| Self-Employed (Incorporated) | 43 | 4.3% |
| Self-Employed (Not Incorporated) | 24 | 2.4% |
| Not-for-profit Organizations | 80 | 8.1% |
| Local Government Employees | 27 | 2.7% |
| State Government Employees | 24 | 2.4% |
| Federal Government Employees | 31 | 3.1% |
| Unpaid Family Workers | 0 | 0.0% |
| Total | 988 | 100.0% |
Employment Status by Age in West Hill
According to the labor force statistics for West Hill, out of the total population over 16 years of age (1,915), 56.1% or 1,074 individuals are in the labor force, with 6.9% or 74 of them unemployed. The age group with the highest labor force participation rate is 35 to 44 years, with 93.0% or 160 individuals in the labor force. Within the labor force, the 30 to 34 years age range has the highest percentage of unemployed individuals, with 27.7% or 36 of them being unemployed.
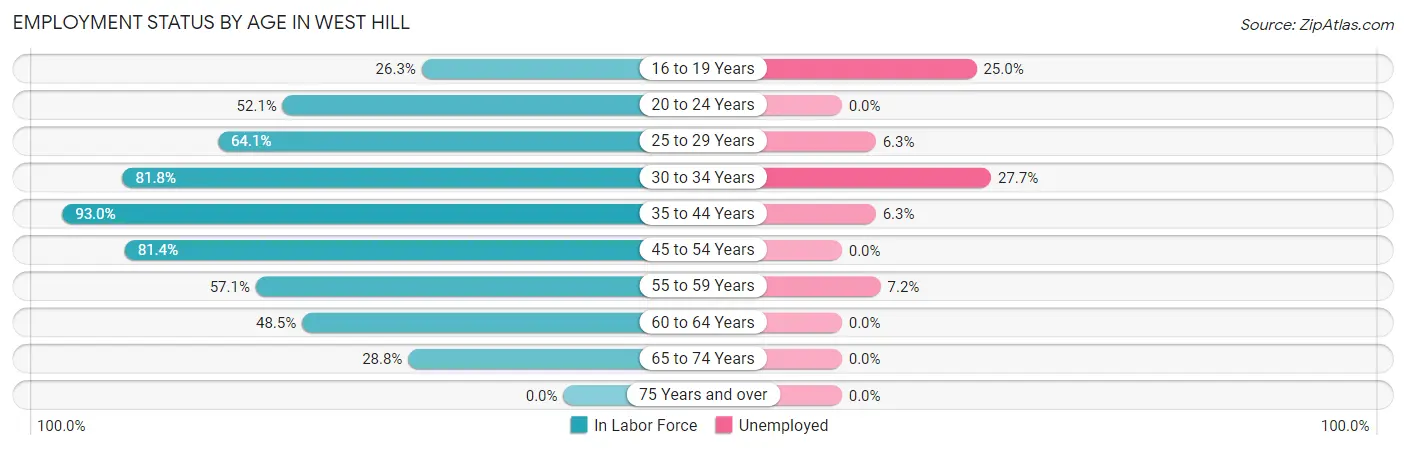
| Age Bracket | In Labor Force | Unemployed |
| 16 to 19 Years | 44 (26.3%) | 11 (25.0%) |
| 20 to 24 Years | 62 (52.1%) | 0 (0.0%) |
| 25 to 29 Years | 127 (64.1%) | 8 (6.3%) |
| 30 to 34 Years | 130 (81.8%) | 36 (27.7%) |
| 35 to 44 Years | 160 (93.0%) | 10 (6.3%) |
| 45 to 54 Years | 333 (81.4%) | 0 (0.0%) |
| 55 to 59 Years | 125 (57.1%) | 9 (7.2%) |
| 60 to 64 Years | 47 (48.5%) | 0 (0.0%) |
| 65 to 74 Years | 47 (28.8%) | 0 (0.0%) |
| 75 Years and over | 0 (0.0%) | 0 (0.0%) |
| Total | 1,074 (56.1%) | 74 (6.9%) |
Employment Status by Educational Attainment in West Hill
According to labor force statistics for West Hill, 73.5% of individuals (922) out of the total population between 25 and 64 years of age (1,254) are in the labor force, with 6.8% or 63 of them being unemployed. The group with the highest labor force participation rate are those with the educational attainment of bachelor's degree or higher, with 98.0% or 242 individuals in the labor force. Within the labor force, individuals with less than high school education have the highest percentage of unemployment, with 44.4% or 36 of them being unemployed.
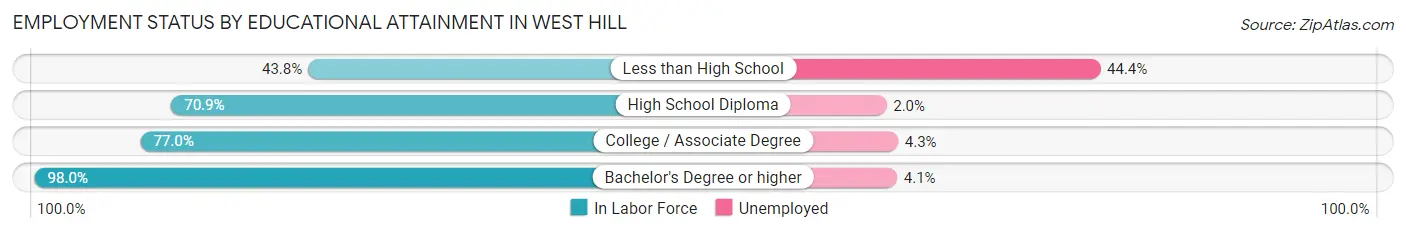
| Educational Attainment | In Labor Force | Unemployed |
| Less than High School | 81 (43.8%) | 82 (44.4%) |
| High School Diploma | 392 (70.9%) | 11 (2.0%) |
| College / Associate Degree | 207 (77.0%) | 12 (4.3%) |
| Bachelor's Degree or higher | 242 (98.0%) | 10 (4.1%) |
| Total | 922 (73.5%) | 85 (6.8%) |
Employment Occupations by Sex in West Hill
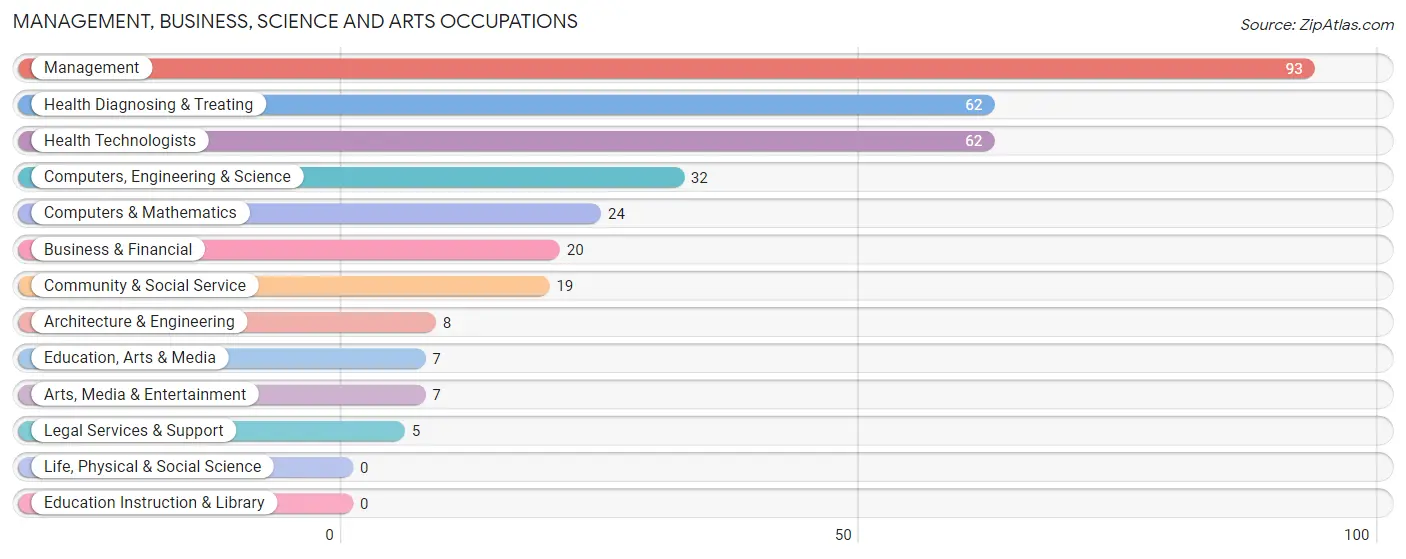
Management, Business, Science and Arts Occupations
The most common Management, Business, Science and Arts occupations in West Hill are Management (93 | 9.3%), Health Diagnosing & Treating (62 | 6.2%), Health Technologists (62 | 6.2%), Computers, Engineering & Science (32 | 3.2%), and Computers & Mathematics (24 | 2.4%).
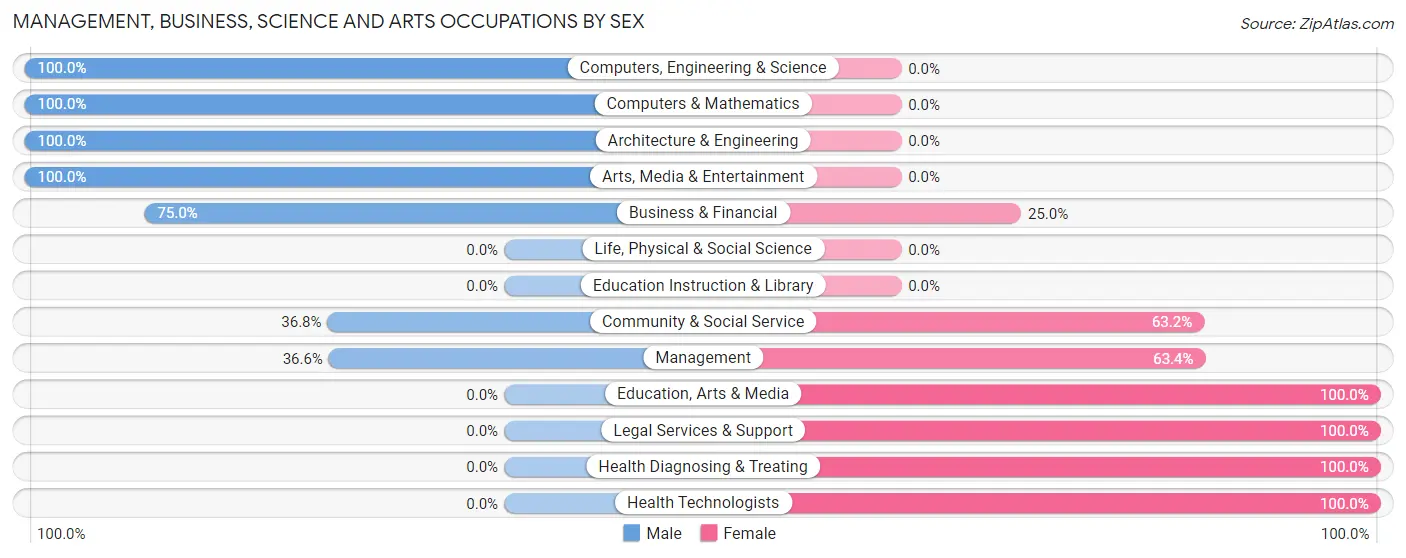
Management, Business, Science and Arts Occupations by Sex
Within the Management, Business, Science and Arts occupations in West Hill, the most male-oriented occupations are Computers, Engineering & Science (100.0%), Computers & Mathematics (100.0%), and Architecture & Engineering (100.0%), while the most female-oriented occupations are Education, Arts & Media (100.0%), Legal Services & Support (100.0%), and Health Diagnosing & Treating (100.0%).
| Occupation | Male | Female |
| Management | 34 (36.6%) | 59 (63.4%) |
| Business & Financial | 15 (75.0%) | 5 (25.0%) |
| Computers, Engineering & Science | 32 (100.0%) | 0 (0.0%) |
| Computers & Mathematics | 24 (100.0%) | 0 (0.0%) |
| Architecture & Engineering | 8 (100.0%) | 0 (0.0%) |
| Life, Physical & Social Science | 0 (0.0%) | 0 (0.0%) |
| Community & Social Service | 7 (36.8%) | 12 (63.2%) |
| Education, Arts & Media | 0 (0.0%) | 7 (100.0%) |
| Legal Services & Support | 0 (0.0%) | 5 (100.0%) |
| Education Instruction & Library | 0 (0.0%) | 0 (0.0%) |
| Arts, Media & Entertainment | 7 (100.0%) | 0 (0.0%) |
| Health Diagnosing & Treating | 0 (0.0%) | 62 (100.0%) |
| Health Technologists | 0 (0.0%) | 62 (100.0%) |
| Total (Category) | 88 (38.9%) | 138 (61.1%) |
| Total (Overall) | 599 (59.8%) | 402 (40.2%) |
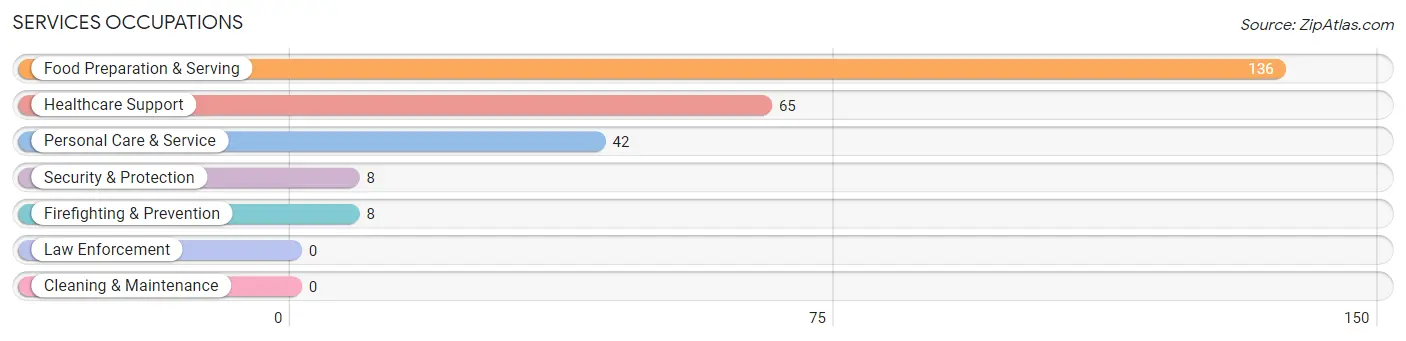
Services Occupations
The most common Services occupations in West Hill are Food Preparation & Serving (136 | 13.6%), Healthcare Support (65 | 6.5%), Personal Care & Service (42 | 4.2%), Security & Protection (8 | 0.8%), and Firefighting & Prevention (8 | 0.8%).
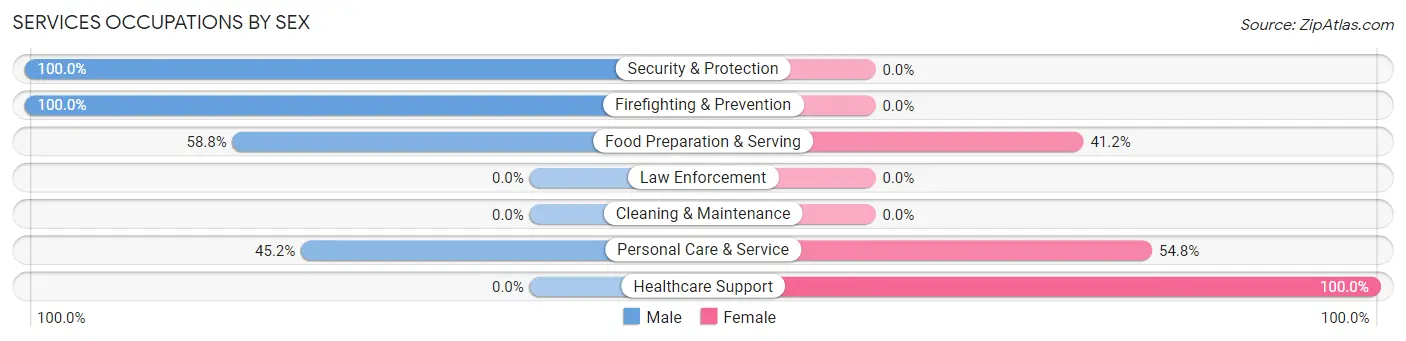
Services Occupations by Sex
Within the Services occupations in West Hill, the most male-oriented occupations are Security & Protection (100.0%), Firefighting & Prevention (100.0%), and Food Preparation & Serving (58.8%), while the most female-oriented occupations are Healthcare Support (100.0%), Personal Care & Service (54.8%), and Food Preparation & Serving (41.2%).
| Occupation | Male | Female |
| Healthcare Support | 0 (0.0%) | 65 (100.0%) |
| Security & Protection | 8 (100.0%) | 0 (0.0%) |
| Firefighting & Prevention | 8 (100.0%) | 0 (0.0%) |
| Law Enforcement | 0 (0.0%) | 0 (0.0%) |
| Food Preparation & Serving | 80 (58.8%) | 56 (41.2%) |
| Cleaning & Maintenance | 0 (0.0%) | 0 (0.0%) |
| Personal Care & Service | 19 (45.2%) | 23 (54.8%) |
| Total (Category) | 107 (42.6%) | 144 (57.4%) |
| Total (Overall) | 599 (59.8%) | 402 (40.2%) |
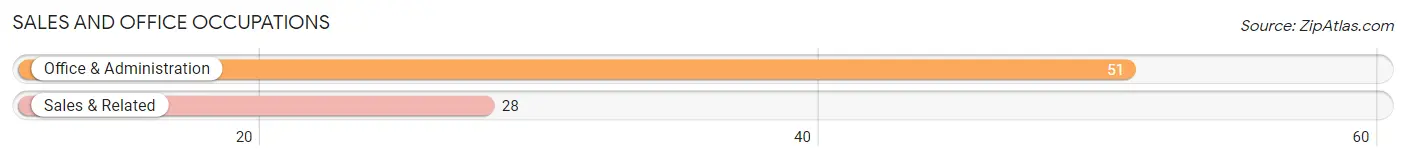
Sales and Office Occupations
The most common Sales and Office occupations in West Hill are Office & Administration (51 | 5.1%), and Sales & Related (28 | 2.8%).
Sales and Office Occupations by Sex
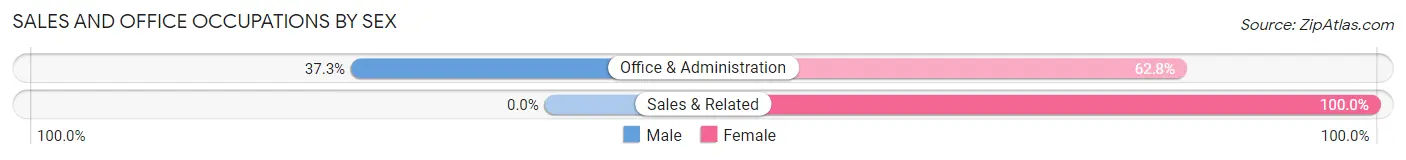
| Occupation | Male | Female |
| Sales & Related | 0 (0.0%) | 28 (100.0%) |
| Office & Administration | 19 (37.2%) | 32 (62.7%) |
| Total (Category) | 19 (24.0%) | 60 (75.9%) |
| Total (Overall) | 599 (59.8%) | 402 (40.2%) |
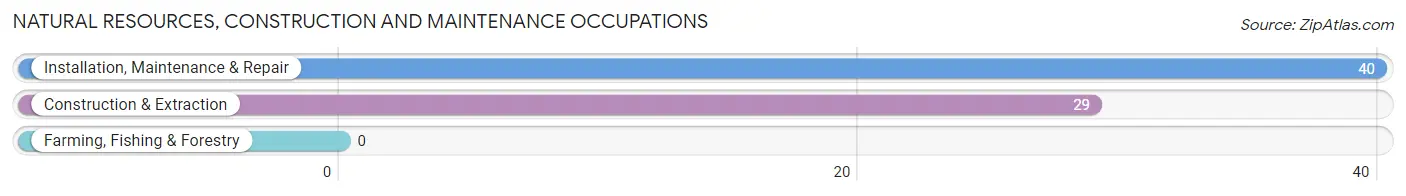
Natural Resources, Construction and Maintenance Occupations
The most common Natural Resources, Construction and Maintenance occupations in West Hill are Installation, Maintenance & Repair (40 | 4.0%), and Construction & Extraction (29 | 2.9%).
Natural Resources, Construction and Maintenance Occupations by Sex
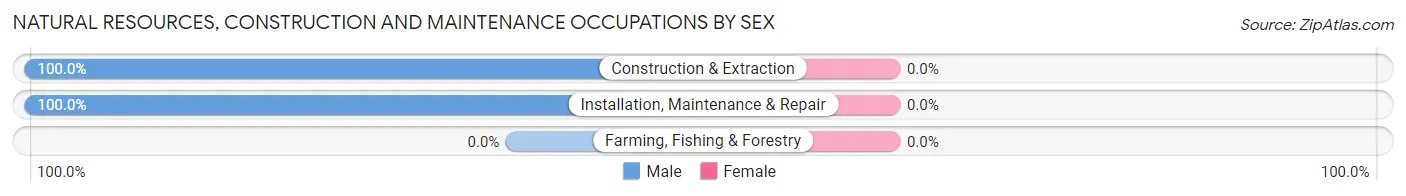
| Occupation | Male | Female |
| Farming, Fishing & Forestry | 0 (0.0%) | 0 (0.0%) |
| Construction & Extraction | 29 (100.0%) | 0 (0.0%) |
| Installation, Maintenance & Repair | 40 (100.0%) | 0 (0.0%) |
| Total (Category) | 69 (100.0%) | 0 (0.0%) |
| Total (Overall) | 599 (59.8%) | 402 (40.2%) |
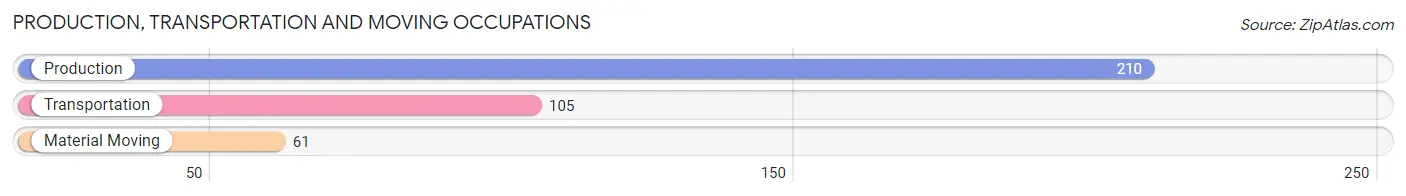
Production, Transportation and Moving Occupations
The most common Production, Transportation and Moving occupations in West Hill are Production (210 | 21.0%), Transportation (105 | 10.5%), and Material Moving (61 | 6.1%).
Production, Transportation and Moving Occupations by Sex
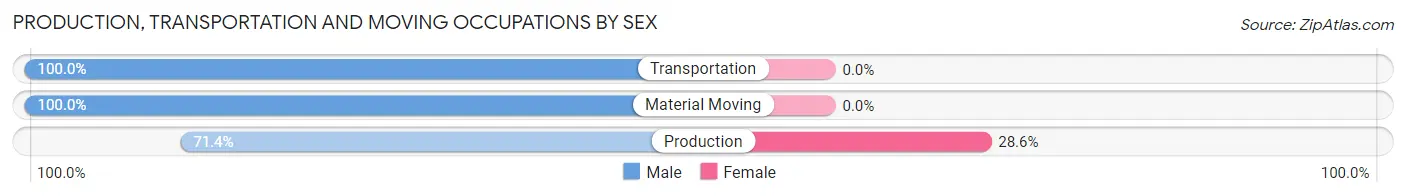
| Occupation | Male | Female |
| Production | 150 (71.4%) | 60 (28.6%) |
| Transportation | 105 (100.0%) | 0 (0.0%) |
| Material Moving | 61 (100.0%) | 0 (0.0%) |
| Total (Category) | 316 (84.0%) | 60 (16.0%) |
| Total (Overall) | 599 (59.8%) | 402 (40.2%) |
Employment Industries by Sex in West Hill
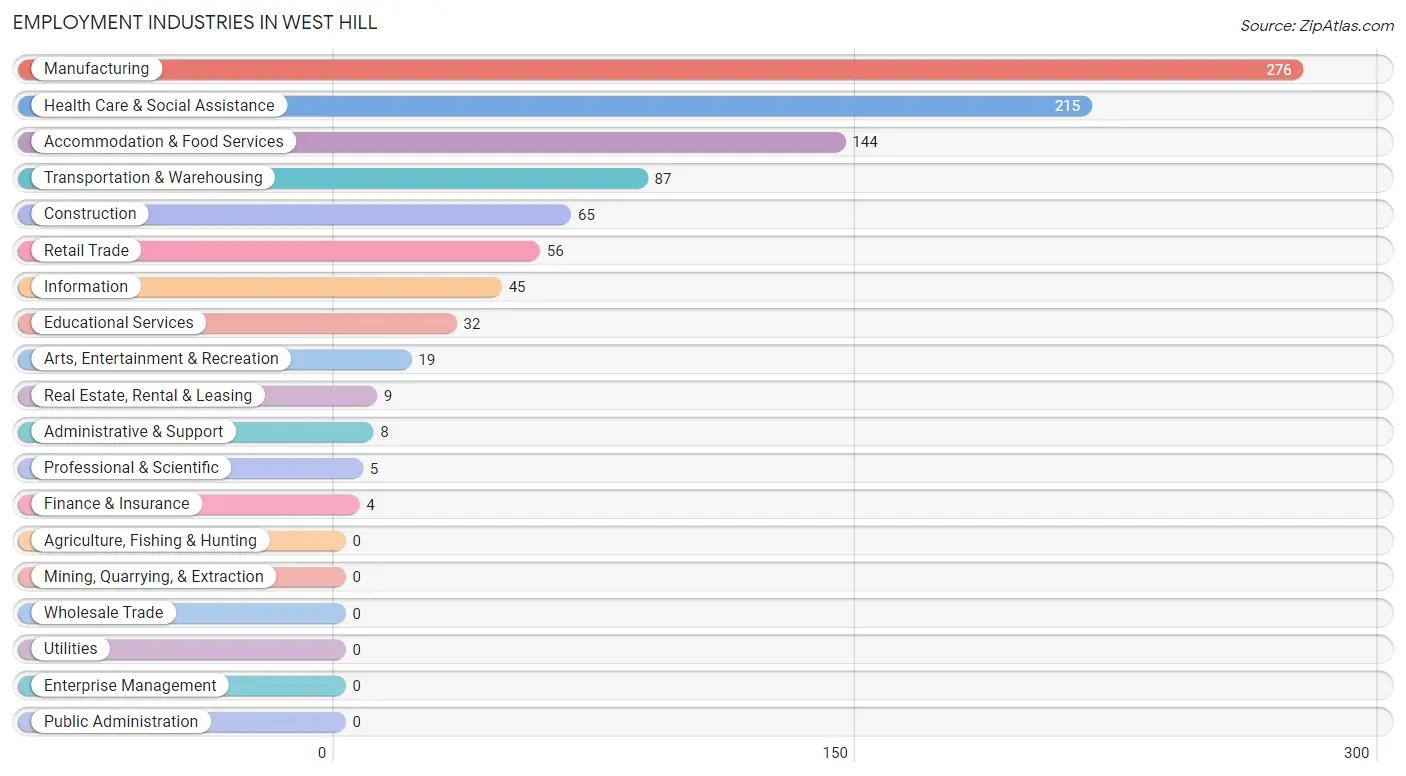
Employment Industries in West Hill
The major employment industries in West Hill include Manufacturing (276 | 27.6%), Health Care & Social Assistance (215 | 21.5%), Accommodation & Food Services (144 | 14.4%), Transportation & Warehousing (87 | 8.7%), and Construction (65 | 6.5%).
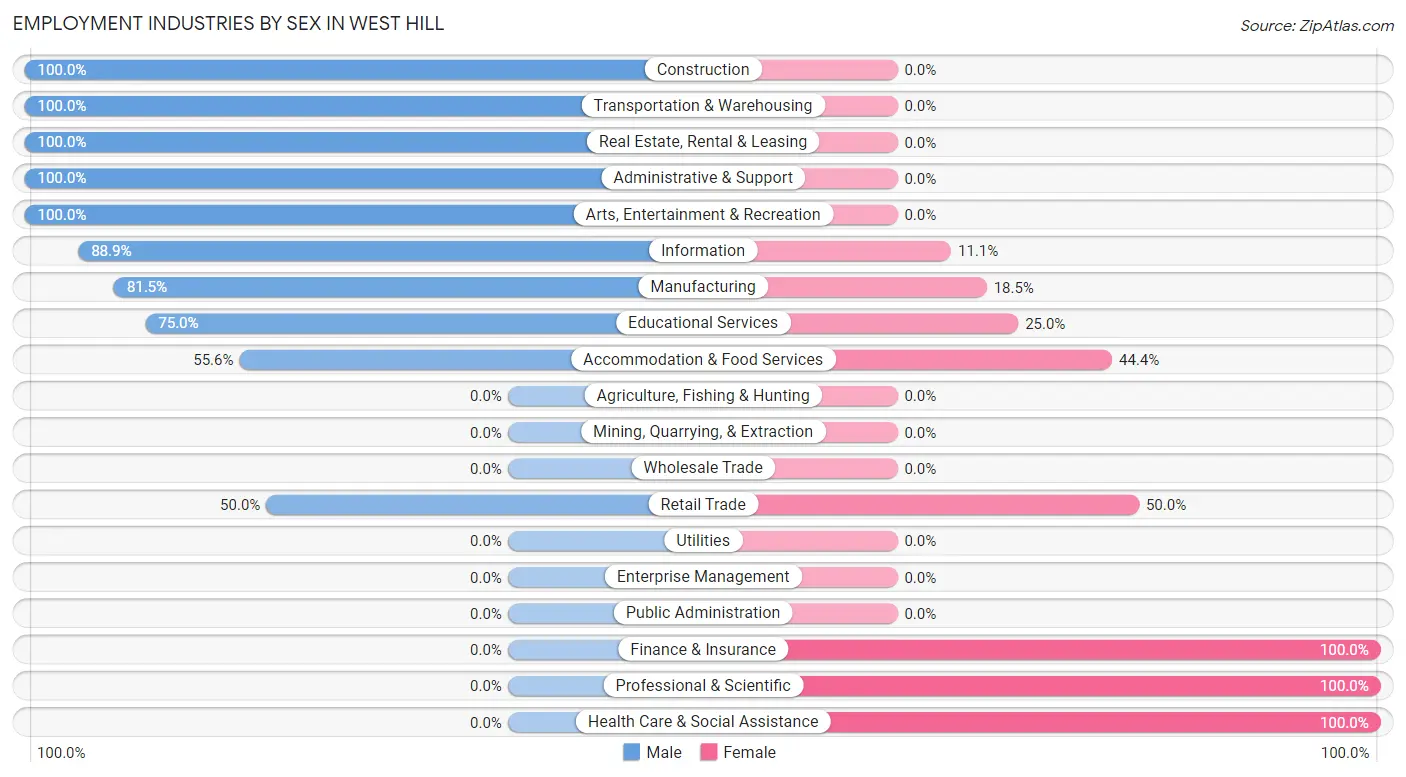
Employment Industries by Sex in West Hill
The West Hill industries that see more men than women are Construction (100.0%), Transportation & Warehousing (100.0%), and Real Estate, Rental & Leasing (100.0%), whereas the industries that tend to have a higher number of women are Finance & Insurance (100.0%), Professional & Scientific (100.0%), and Health Care & Social Assistance (100.0%).
| Industry | Male | Female |
| Agriculture, Fishing & Hunting | 0 (0.0%) | 0 (0.0%) |
| Mining, Quarrying, & Extraction | 0 (0.0%) | 0 (0.0%) |
| Construction | 65 (100.0%) | 0 (0.0%) |
| Manufacturing | 225 (81.5%) | 51 (18.5%) |
| Wholesale Trade | 0 (0.0%) | 0 (0.0%) |
| Retail Trade | 28 (50.0%) | 28 (50.0%) |
| Transportation & Warehousing | 87 (100.0%) | 0 (0.0%) |
| Utilities | 0 (0.0%) | 0 (0.0%) |
| Information | 40 (88.9%) | 5 (11.1%) |
| Finance & Insurance | 0 (0.0%) | 4 (100.0%) |
| Real Estate, Rental & Leasing | 9 (100.0%) | 0 (0.0%) |
| Professional & Scientific | 0 (0.0%) | 5 (100.0%) |
| Enterprise Management | 0 (0.0%) | 0 (0.0%) |
| Administrative & Support | 8 (100.0%) | 0 (0.0%) |
| Educational Services | 24 (75.0%) | 8 (25.0%) |
| Health Care & Social Assistance | 0 (0.0%) | 215 (100.0%) |
| Arts, Entertainment & Recreation | 19 (100.0%) | 0 (0.0%) |
| Accommodation & Food Services | 80 (55.6%) | 64 (44.4%) |
| Public Administration | 0 (0.0%) | 0 (0.0%) |
| Total | 599 (59.8%) | 402 (40.2%) |
Education in West Hill
School Enrollment in West Hill
The most common levels of schooling among the 293 students in West Hill are high school (128 | 43.7%), elementary school (103 | 35.1%), and middle school (31 | 10.6%).
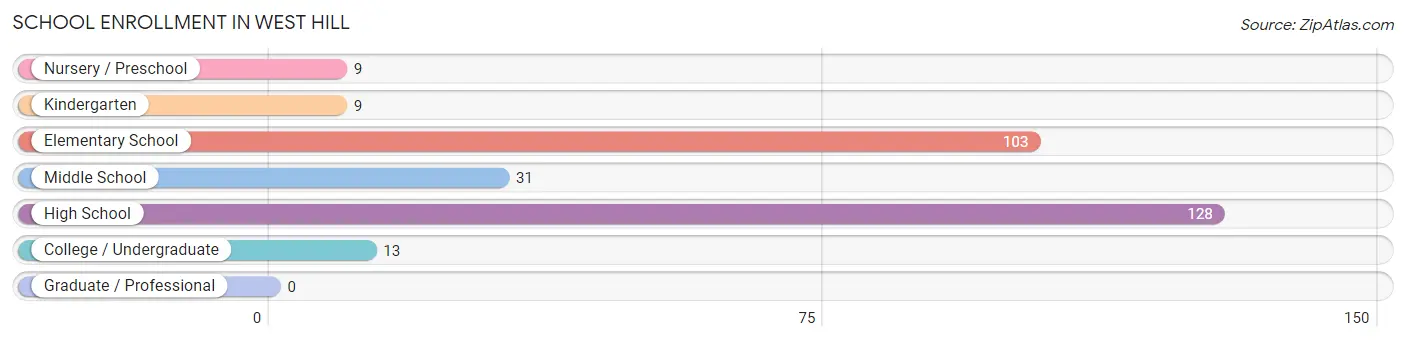
| School Level | # Students | % Students |
| Nursery / Preschool | 9 | 3.1% |
| Kindergarten | 9 | 3.1% |
| Elementary School | 103 | 35.1% |
| Middle School | 31 | 10.6% |
| High School | 128 | 43.7% |
| College / Undergraduate | 13 | 4.4% |
| Graduate / Professional | 0 | 0.0% |
| Total | 293 | 100.0% |
School Enrollment by Age by Funding Source in West Hill
Out of a total of 293 students who are enrolled in schools in West Hill, 29 (9.9%) attend a private institution, while the remaining 264 (90.1%) are enrolled in public schools. The age group of 5 to 9 year old has the highest likelihood of being enrolled in private schools, with 29 (39.2% in the age bracket) enrolled. Conversely, the age group of 3 to 4 year olds has the lowest likelihood of being enrolled in a private school, with 9 (100.0% in the age bracket) attending a public institution.
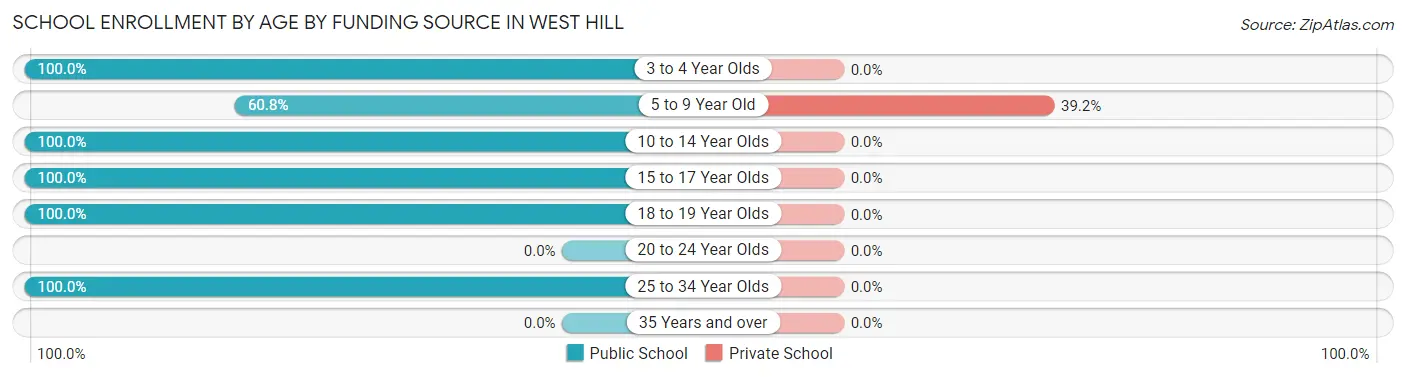
| Age Bracket | Public School | Private School |
| 3 to 4 Year Olds | 9 (100.0%) | 0 (0.0%) |
| 5 to 9 Year Old | 45 (60.8%) | 29 (39.2%) |
| 10 to 14 Year Olds | 69 (100.0%) | 0 (0.0%) |
| 15 to 17 Year Olds | 78 (100.0%) | 0 (0.0%) |
| 18 to 19 Year Olds | 50 (100.0%) | 0 (0.0%) |
| 20 to 24 Year Olds | 0 (0.0%) | 0 (0.0%) |
| 25 to 34 Year Olds | 13 (100.0%) | 0 (0.0%) |
| 35 Years and over | 0 (0.0%) | 0 (0.0%) |
| Total | 264 (90.1%) | 29 (9.9%) |
Educational Attainment by Field of Study in West Hill
Business (157 | 52.3%), engineering (43 | 14.3%), computers & mathematics (34 | 11.3%), education (25 | 8.3%), and science & technology (22 | 7.3%) are the most common fields of study among 300 individuals in West Hill who have obtained a bachelor's degree or higher.
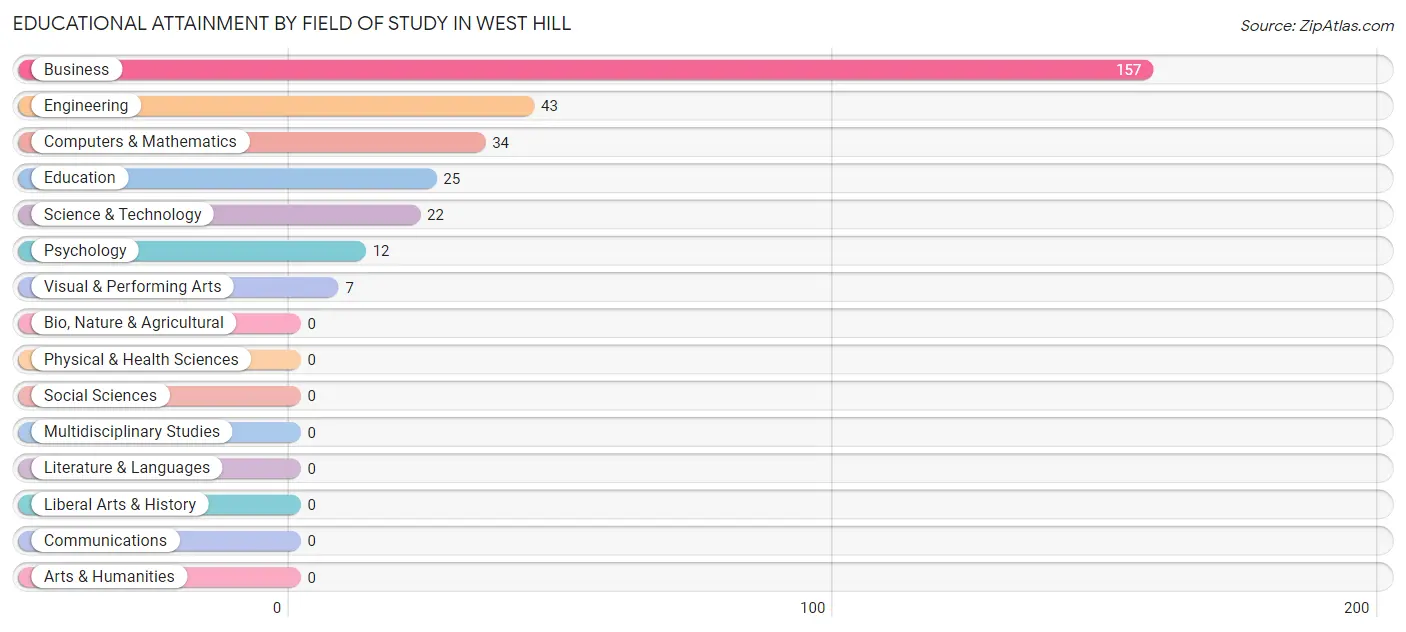
| Field of Study | # Graduates | % Graduates |
| Computers & Mathematics | 34 | 11.3% |
| Bio, Nature & Agricultural | 0 | 0.0% |
| Physical & Health Sciences | 0 | 0.0% |
| Psychology | 12 | 4.0% |
| Social Sciences | 0 | 0.0% |
| Engineering | 43 | 14.3% |
| Multidisciplinary Studies | 0 | 0.0% |
| Science & Technology | 22 | 7.3% |
| Business | 157 | 52.3% |
| Education | 25 | 8.3% |
| Literature & Languages | 0 | 0.0% |
| Liberal Arts & History | 0 | 0.0% |
| Visual & Performing Arts | 7 | 2.3% |
| Communications | 0 | 0.0% |
| Arts & Humanities | 0 | 0.0% |
| Total | 300 | 100.0% |
Transportation & Commute in West Hill
Vehicle Availability by Sex in West Hill
The most prevalent vehicle ownership categories in West Hill are males with 1 vehicle (258, accounting for 44.0%) and females with 1 vehicle (123, making up 64.2%).
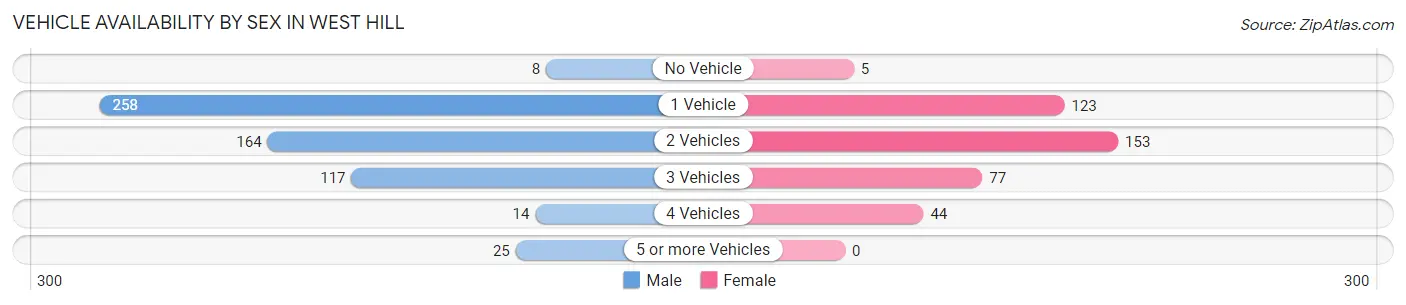
| Vehicles Available | Male | Female |
| No Vehicle | 8 (1.4%) | 5 (1.2%) |
| 1 Vehicle | 258 (44.0%) | 123 (30.6%) |
| 2 Vehicles | 164 (28.0%) | 153 (38.1%) |
| 3 Vehicles | 117 (20.0%) | 77 (19.2%) |
| 4 Vehicles | 14 (2.4%) | 44 (11.0%) |
| 5 or more Vehicles | 25 (4.3%) | 0 (0.0%) |
| Total | 586 (100.0%) | 402 (100.0%) |
Commute Time in West Hill
The most frequently occuring commute durations in West Hill are 10 to 14 minutes (228 commuters, 23.9%), 20 to 24 minutes (180 commuters, 18.9%), and 45 to 59 minutes (118 commuters, 12.4%).
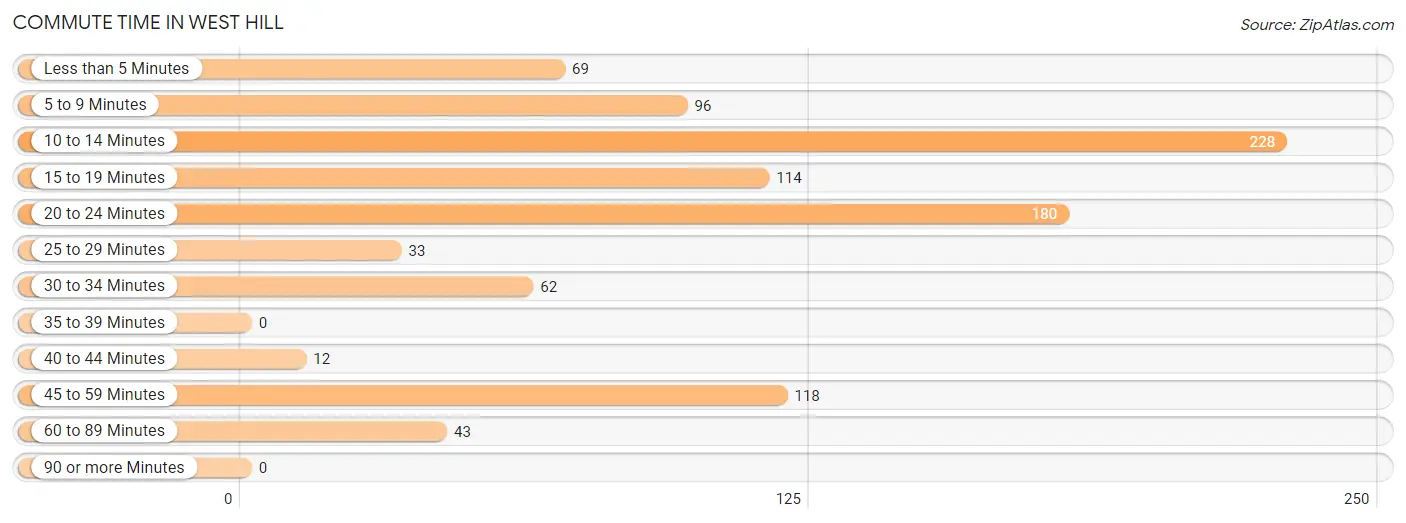
| Commute Time | # Commuters | % Commuters |
| Less than 5 Minutes | 69 | 7.2% |
| 5 to 9 Minutes | 96 | 10.1% |
| 10 to 14 Minutes | 228 | 23.9% |
| 15 to 19 Minutes | 114 | 11.9% |
| 20 to 24 Minutes | 180 | 18.9% |
| 25 to 29 Minutes | 33 | 3.5% |
| 30 to 34 Minutes | 62 | 6.5% |
| 35 to 39 Minutes | 0 | 0.0% |
| 40 to 44 Minutes | 12 | 1.3% |
| 45 to 59 Minutes | 118 | 12.4% |
| 60 to 89 Minutes | 43 | 4.5% |
| 90 or more Minutes | 0 | 0.0% |
Commute Time by Sex in West Hill
The most common commute times in West Hill are 20 to 24 minutes (147 commuters, 25.1%) for males and 10 to 14 minutes (90 commuters, 24.4%) for females.
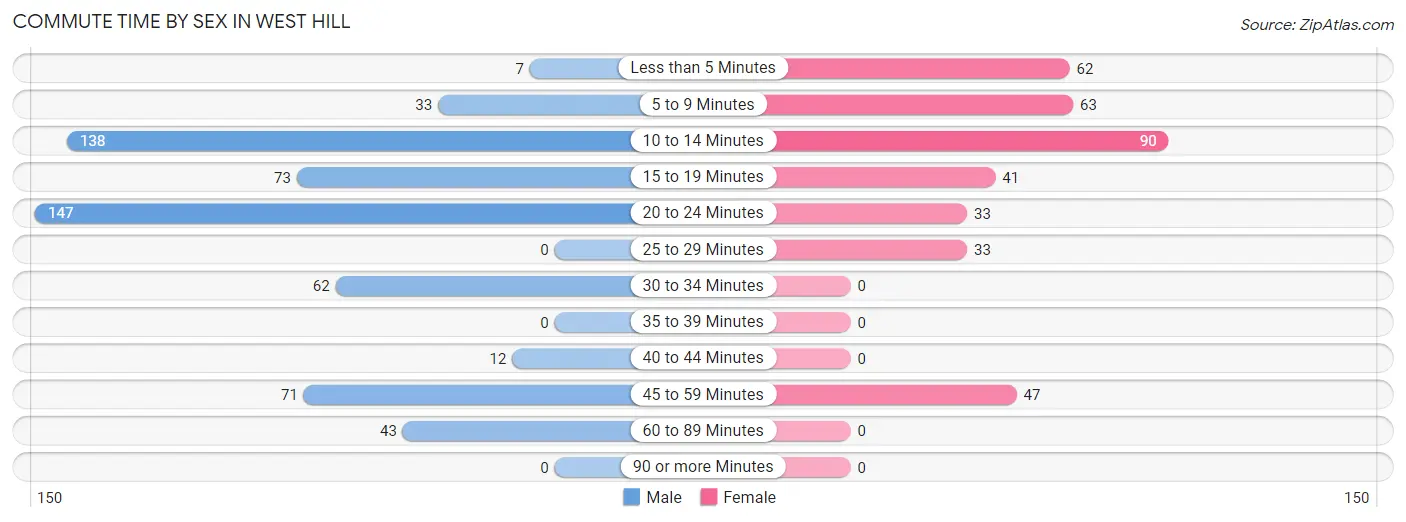
| Commute Time | Male | Female |
| Less than 5 Minutes | 7 (1.2%) | 62 (16.8%) |
| 5 to 9 Minutes | 33 (5.6%) | 63 (17.1%) |
| 10 to 14 Minutes | 138 (23.5%) | 90 (24.4%) |
| 15 to 19 Minutes | 73 (12.5%) | 41 (11.1%) |
| 20 to 24 Minutes | 147 (25.1%) | 33 (8.9%) |
| 25 to 29 Minutes | 0 (0.0%) | 33 (8.9%) |
| 30 to 34 Minutes | 62 (10.6%) | 0 (0.0%) |
| 35 to 39 Minutes | 0 (0.0%) | 0 (0.0%) |
| 40 to 44 Minutes | 12 (2.1%) | 0 (0.0%) |
| 45 to 59 Minutes | 71 (12.1%) | 47 (12.7%) |
| 60 to 89 Minutes | 43 (7.3%) | 0 (0.0%) |
| 90 or more Minutes | 0 (0.0%) | 0 (0.0%) |
Time of Departure to Work by Sex in West Hill
The most frequent times of departure to work in West Hill are 5:30 AM to 5:59 AM (130, 22.2%) for males and 8:00 AM to 8:29 AM (104, 28.2%) for females.
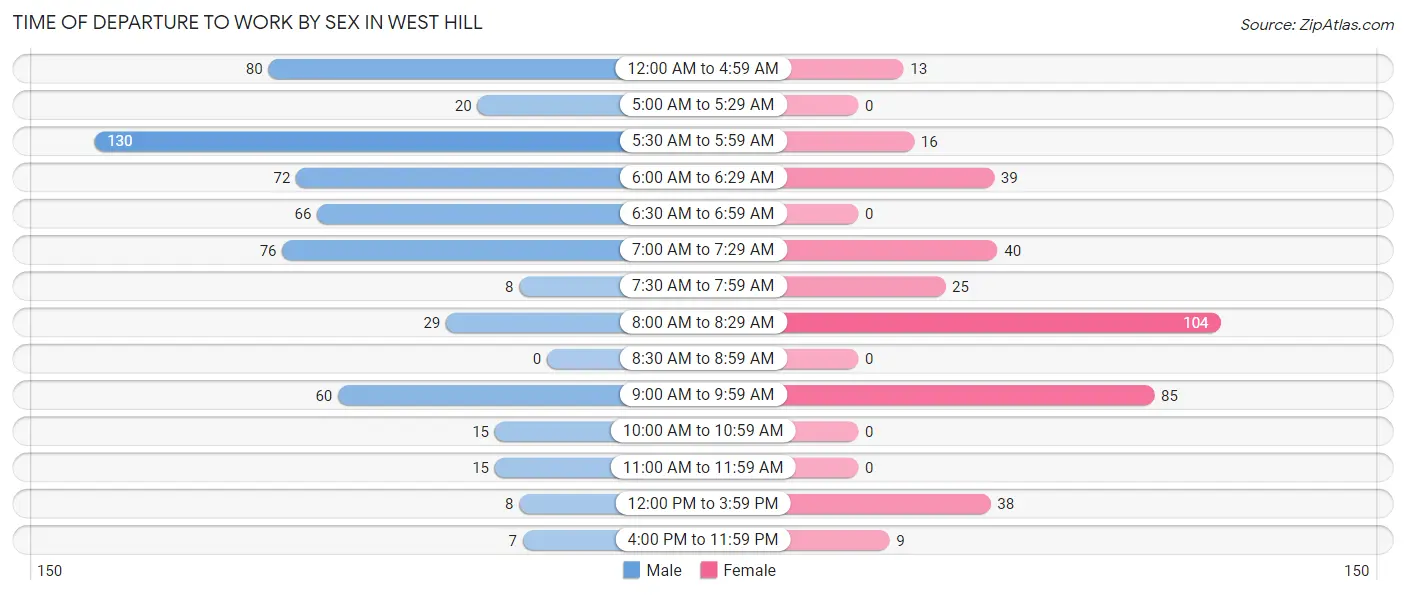
| Time of Departure | Male | Female |
| 12:00 AM to 4:59 AM | 80 (13.7%) | 13 (3.5%) |
| 5:00 AM to 5:29 AM | 20 (3.4%) | 0 (0.0%) |
| 5:30 AM to 5:59 AM | 130 (22.2%) | 16 (4.3%) |
| 6:00 AM to 6:29 AM | 72 (12.3%) | 39 (10.6%) |
| 6:30 AM to 6:59 AM | 66 (11.3%) | 0 (0.0%) |
| 7:00 AM to 7:29 AM | 76 (13.0%) | 40 (10.8%) |
| 7:30 AM to 7:59 AM | 8 (1.4%) | 25 (6.8%) |
| 8:00 AM to 8:29 AM | 29 (5.0%) | 104 (28.2%) |
| 8:30 AM to 8:59 AM | 0 (0.0%) | 0 (0.0%) |
| 9:00 AM to 9:59 AM | 60 (10.2%) | 85 (23.0%) |
| 10:00 AM to 10:59 AM | 15 (2.6%) | 0 (0.0%) |
| 11:00 AM to 11:59 AM | 15 (2.6%) | 0 (0.0%) |
| 12:00 PM to 3:59 PM | 8 (1.4%) | 38 (10.3%) |
| 4:00 PM to 11:59 PM | 7 (1.2%) | 9 (2.4%) |
| Total | 586 (100.0%) | 369 (100.0%) |
Housing Occupancy in West Hill
Occupancy by Ownership in West Hill
Of the total 1,050 dwellings in West Hill, owner-occupied units account for 597 (56.9%), while renter-occupied units make up 453 (43.1%).
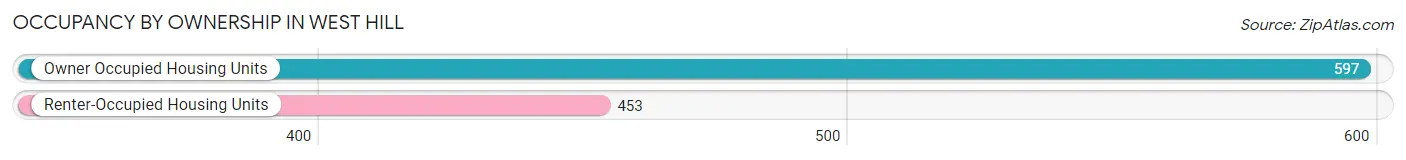
| Occupancy | # Housing Units | % Housing Units |
| Owner Occupied Housing Units | 597 | 56.9% |
| Renter-Occupied Housing Units | 453 | 43.1% |
| Total Occupied Housing Units | 1,050 | 100.0% |
Occupancy by Household Size in West Hill
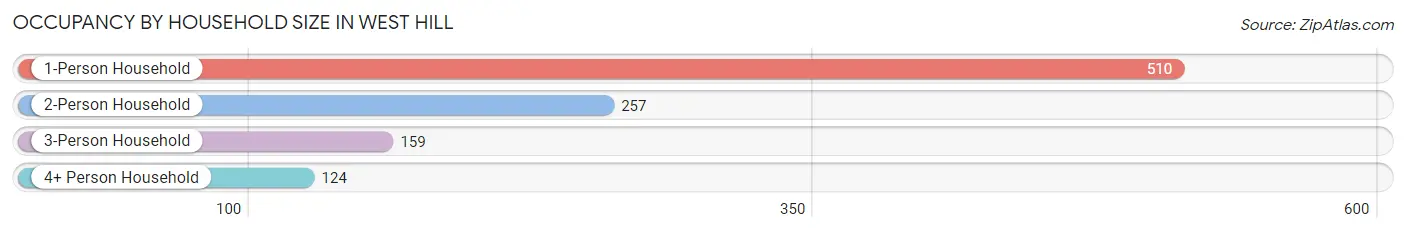
| Household Size | # Housing Units | % Housing Units |
| 1-Person Household | 510 | 48.6% |
| 2-Person Household | 257 | 24.5% |
| 3-Person Household | 159 | 15.1% |
| 4+ Person Household | 124 | 11.8% |
| Total Housing Units | 1,050 | 100.0% |
Occupancy by Ownership by Household Size in West Hill
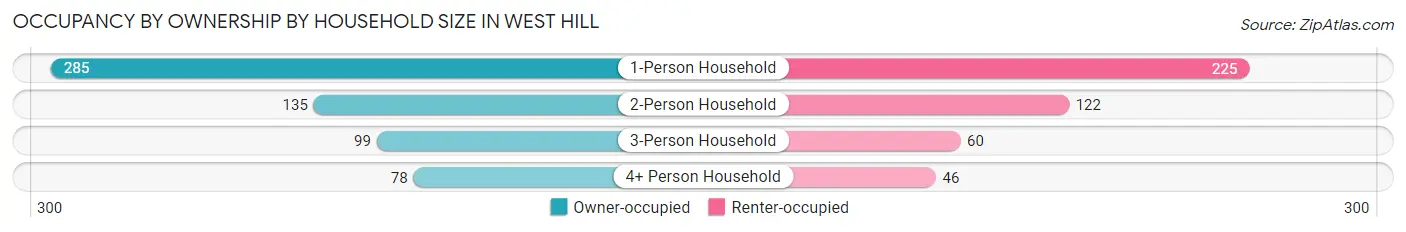
| Household Size | Owner-occupied | Renter-occupied |
| 1-Person Household | 285 (55.9%) | 225 (44.1%) |
| 2-Person Household | 135 (52.5%) | 122 (47.5%) |
| 3-Person Household | 99 (62.3%) | 60 (37.7%) |
| 4+ Person Household | 78 (62.9%) | 46 (37.1%) |
| Total Housing Units | 597 (56.9%) | 453 (43.1%) |
Occupancy by Educational Attainment in West Hill
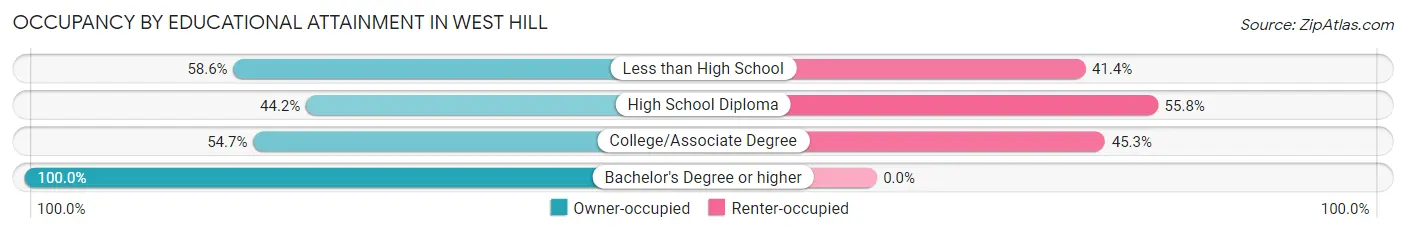
| Household Size | Owner-occupied | Renter-occupied |
| Less than High School | 75 (58.6%) | 53 (41.4%) |
| High School Diploma | 236 (44.2%) | 298 (55.8%) |
| College/Associate Degree | 123 (54.7%) | 102 (45.3%) |
| Bachelor's Degree or higher | 163 (100.0%) | 0 (0.0%) |
Occupancy by Age of Householder in West Hill
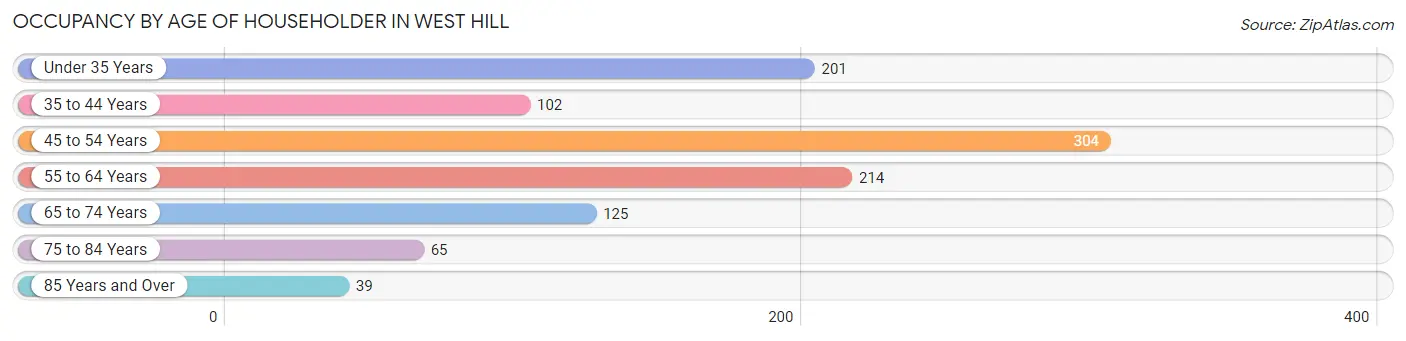
| Age Bracket | # Households | % Households |
| Under 35 Years | 201 | 19.1% |
| 35 to 44 Years | 102 | 9.7% |
| 45 to 54 Years | 304 | 28.9% |
| 55 to 64 Years | 214 | 20.4% |
| 65 to 74 Years | 125 | 11.9% |
| 75 to 84 Years | 65 | 6.2% |
| 85 Years and Over | 39 | 3.7% |
| Total | 1,050 | 100.0% |
Housing Finances in West Hill
Median Income by Occupancy in West Hill
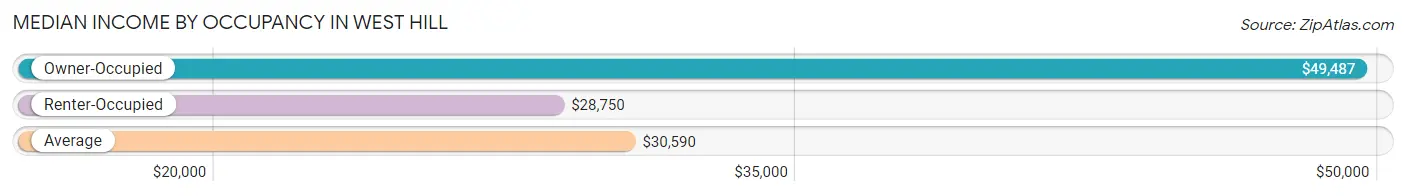
| Occupancy Type | # Households | Median Income |
| Owner-Occupied | 597 (56.9%) | $49,487 |
| Renter-Occupied | 453 (43.1%) | $28,750 |
| Average | 1,050 (100.0%) | $30,590 |
Occupancy by Householder Income Bracket in West Hill
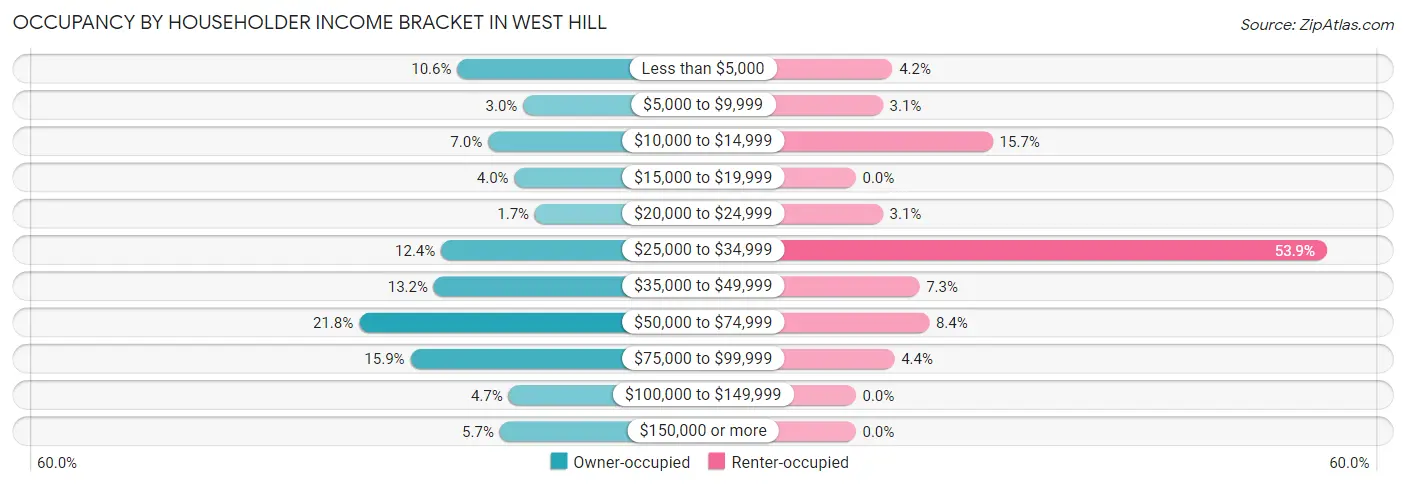
| Income Bracket | Owner-occupied | Renter-occupied |
| Less than $5,000 | 63 (10.5%) | 19 (4.2%) |
| $5,000 to $9,999 | 18 (3.0%) | 14 (3.1%) |
| $10,000 to $14,999 | 42 (7.0%) | 71 (15.7%) |
| $15,000 to $19,999 | 24 (4.0%) | 0 (0.0%) |
| $20,000 to $24,999 | 10 (1.7%) | 14 (3.1%) |
| $25,000 to $34,999 | 74 (12.4%) | 244 (53.9%) |
| $35,000 to $49,999 | 79 (13.2%) | 33 (7.3%) |
| $50,000 to $74,999 | 130 (21.8%) | 38 (8.4%) |
| $75,000 to $99,999 | 95 (15.9%) | 20 (4.4%) |
| $100,000 to $149,999 | 28 (4.7%) | 0 (0.0%) |
| $150,000 or more | 34 (5.7%) | 0 (0.0%) |
| Total | 597 (100.0%) | 453 (100.0%) |
Monthly Housing Cost Tiers in West Hill
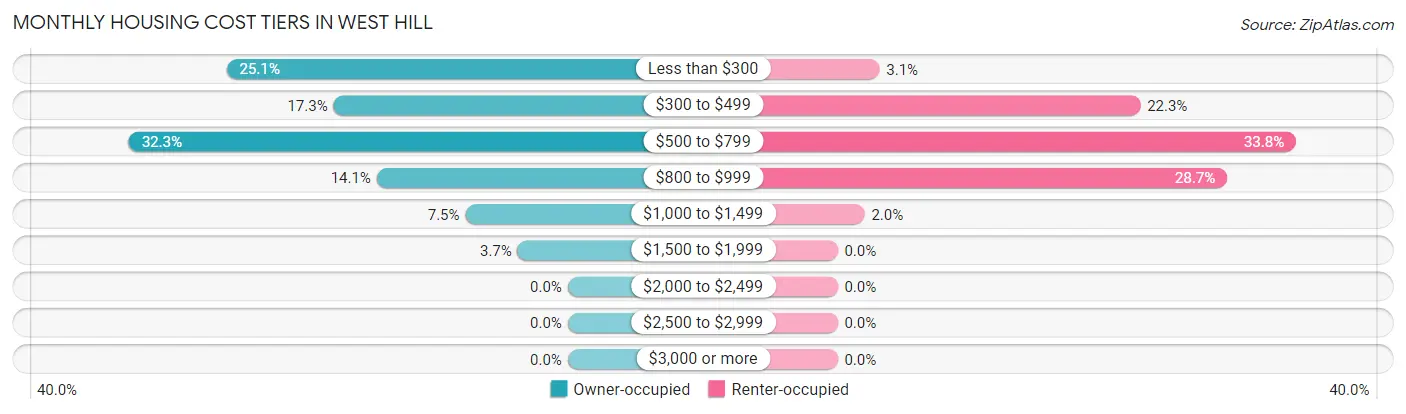
| Monthly Cost | Owner-occupied | Renter-occupied |
| Less than $300 | 150 (25.1%) | 14 (3.1%) |
| $300 to $499 | 103 (17.2%) | 101 (22.3%) |
| $500 to $799 | 193 (32.3%) | 153 (33.8%) |
| $800 to $999 | 84 (14.1%) | 130 (28.7%) |
| $1,000 to $1,499 | 45 (7.5%) | 9 (2.0%) |
| $1,500 to $1,999 | 22 (3.7%) | 0 (0.0%) |
| $2,000 to $2,499 | 0 (0.0%) | 0 (0.0%) |
| $2,500 to $2,999 | 0 (0.0%) | 0 (0.0%) |
| $3,000 or more | 0 (0.0%) | 0 (0.0%) |
| Total | 597 (100.0%) | 453 (100.0%) |
Physical Housing Characteristics in West Hill
Housing Structures in West Hill
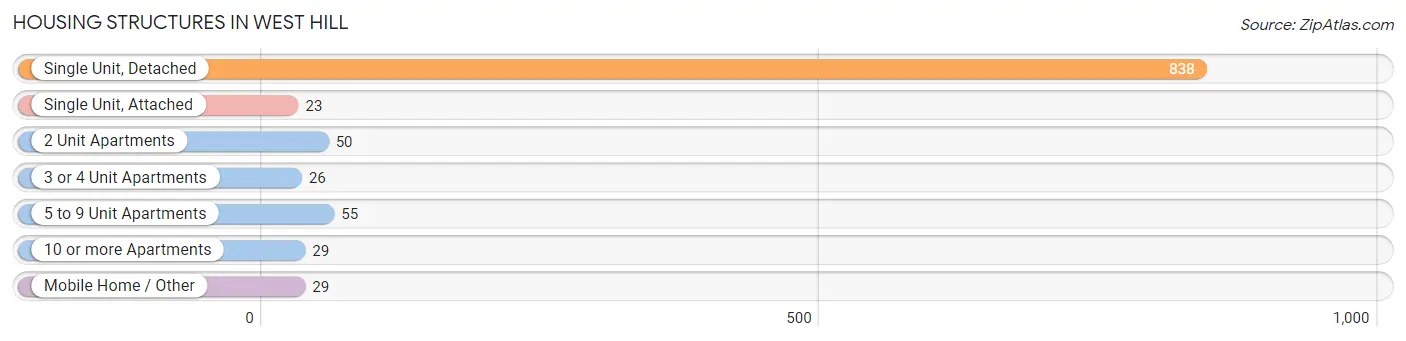
| Structure Type | # Housing Units | % Housing Units |
| Single Unit, Detached | 838 | 79.8% |
| Single Unit, Attached | 23 | 2.2% |
| 2 Unit Apartments | 50 | 4.8% |
| 3 or 4 Unit Apartments | 26 | 2.5% |
| 5 to 9 Unit Apartments | 55 | 5.2% |
| 10 or more Apartments | 29 | 2.8% |
| Mobile Home / Other | 29 | 2.8% |
| Total | 1,050 | 100.0% |
Housing Structures by Occupancy in West Hill
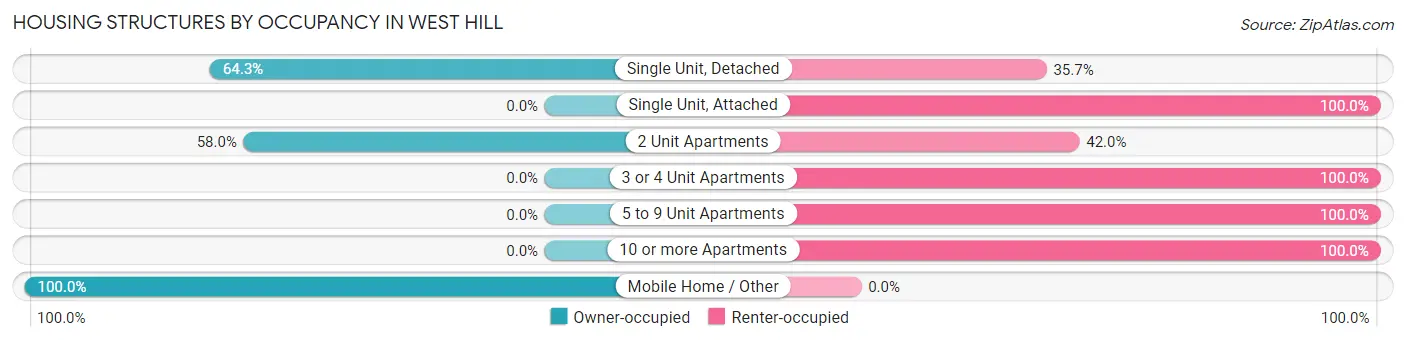
| Structure Type | Owner-occupied | Renter-occupied |
| Single Unit, Detached | 539 (64.3%) | 299 (35.7%) |
| Single Unit, Attached | 0 (0.0%) | 23 (100.0%) |
| 2 Unit Apartments | 29 (58.0%) | 21 (42.0%) |
| 3 or 4 Unit Apartments | 0 (0.0%) | 26 (100.0%) |
| 5 to 9 Unit Apartments | 0 (0.0%) | 55 (100.0%) |
| 10 or more Apartments | 0 (0.0%) | 29 (100.0%) |
| Mobile Home / Other | 29 (100.0%) | 0 (0.0%) |
| Total | 597 (56.9%) | 453 (43.1%) |
Housing Structures by Number of Rooms in West Hill
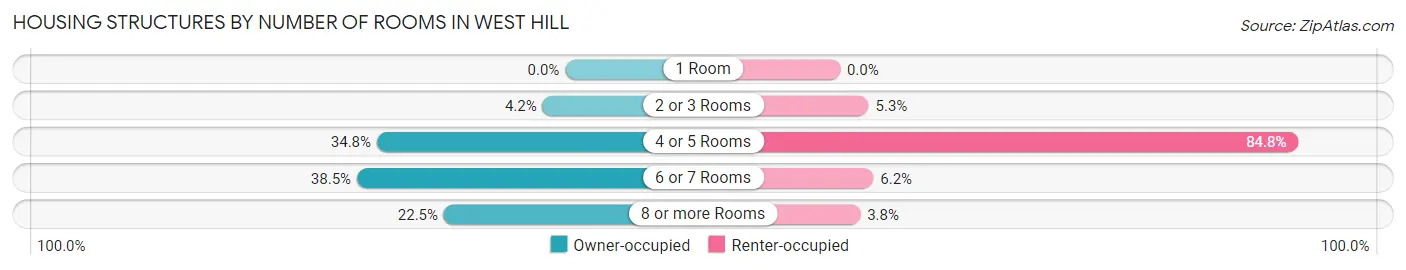
| Number of Rooms | Owner-occupied | Renter-occupied |
| 1 Room | 0 (0.0%) | 0 (0.0%) |
| 2 or 3 Rooms | 25 (4.2%) | 24 (5.3%) |
| 4 or 5 Rooms | 208 (34.8%) | 384 (84.8%) |
| 6 or 7 Rooms | 230 (38.5%) | 28 (6.2%) |
| 8 or more Rooms | 134 (22.5%) | 17 (3.7%) |
| Total | 597 (100.0%) | 453 (100.0%) |
Housing Structure by Heating Type in West Hill
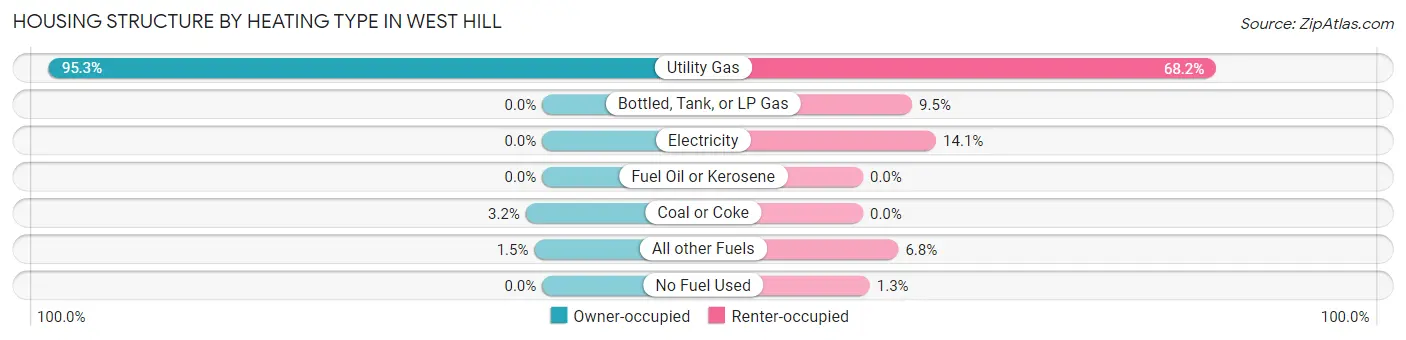
| Heating Type | Owner-occupied | Renter-occupied |
| Utility Gas | 569 (95.3%) | 309 (68.2%) |
| Bottled, Tank, or LP Gas | 0 (0.0%) | 43 (9.5%) |
| Electricity | 0 (0.0%) | 64 (14.1%) |
| Fuel Oil or Kerosene | 0 (0.0%) | 0 (0.0%) |
| Coal or Coke | 19 (3.2%) | 0 (0.0%) |
| All other Fuels | 9 (1.5%) | 31 (6.8%) |
| No Fuel Used | 0 (0.0%) | 6 (1.3%) |
| Total | 597 (100.0%) | 453 (100.0%) |
Household Vehicle Usage in West Hill
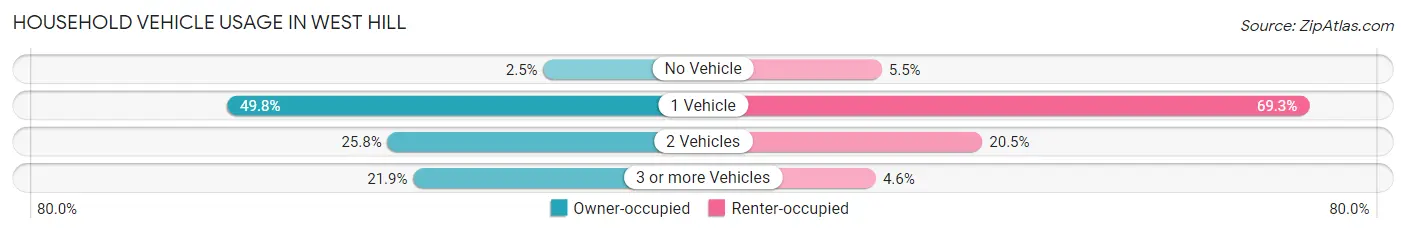
| Vehicles per Household | Owner-occupied | Renter-occupied |
| No Vehicle | 15 (2.5%) | 25 (5.5%) |
| 1 Vehicle | 297 (49.7%) | 314 (69.3%) |
| 2 Vehicles | 154 (25.8%) | 93 (20.5%) |
| 3 or more Vehicles | 131 (21.9%) | 21 (4.6%) |
| Total | 597 (100.0%) | 453 (100.0%) |
Real Estate & Mortgages in West Hill
Real Estate and Mortgage Overview in West Hill
| Characteristic | Without Mortgage | With Mortgage |
| Housing Units | 264 | 333 |
| Median Property Value | $42,400 | $79,400 |
| Median Household Income | $28,654 | $34 |
| Monthly Housing Costs | $280 | $0 |
| Real Estate Taxes | $592 | $0 |
Property Value by Mortgage Status in West Hill
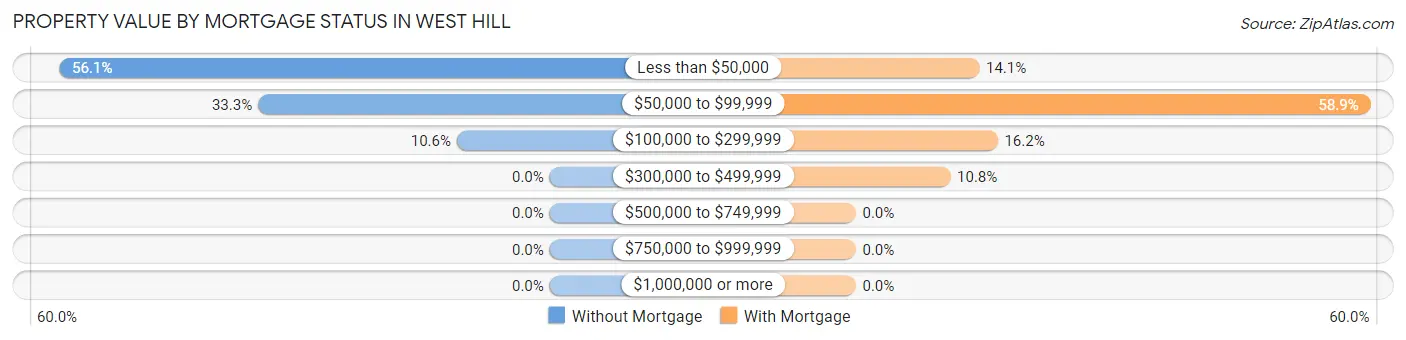
| Property Value | Without Mortgage | With Mortgage |
| Less than $50,000 | 148 (56.1%) | 47 (14.1%) |
| $50,000 to $99,999 | 88 (33.3%) | 196 (58.9%) |
| $100,000 to $299,999 | 28 (10.6%) | 54 (16.2%) |
| $300,000 to $499,999 | 0 (0.0%) | 36 (10.8%) |
| $500,000 to $749,999 | 0 (0.0%) | 0 (0.0%) |
| $750,000 to $999,999 | 0 (0.0%) | 0 (0.0%) |
| $1,000,000 or more | 0 (0.0%) | 0 (0.0%) |
| Total | 264 (100.0%) | 333 (100.0%) |
Household Income by Mortgage Status in West Hill
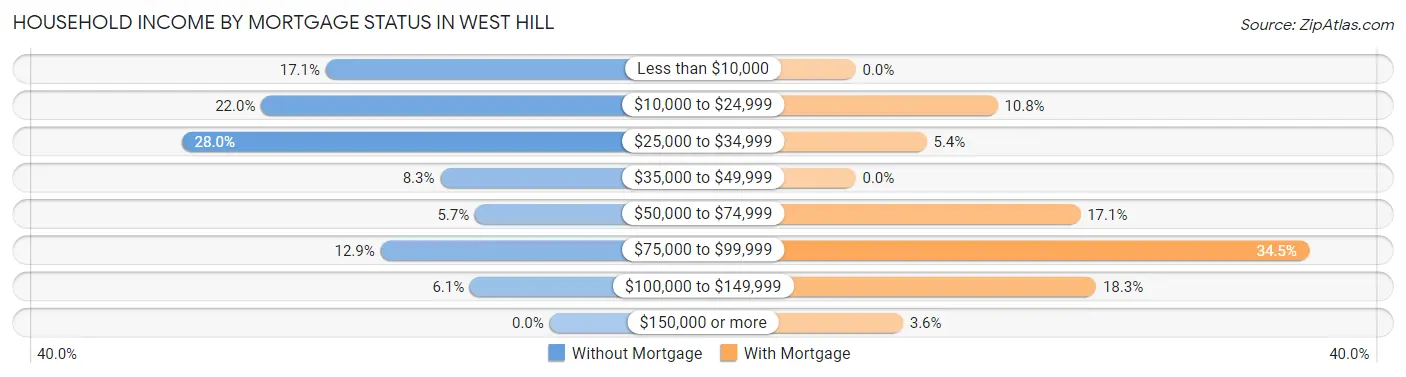
| Household Income | Without Mortgage | With Mortgage |
| Less than $10,000 | 45 (17.1%) | 0 (0.0%) |
| $10,000 to $24,999 | 58 (22.0%) | 36 (10.8%) |
| $25,000 to $34,999 | 74 (28.0%) | 18 (5.4%) |
| $35,000 to $49,999 | 22 (8.3%) | 0 (0.0%) |
| $50,000 to $74,999 | 15 (5.7%) | 57 (17.1%) |
| $75,000 to $99,999 | 34 (12.9%) | 115 (34.5%) |
| $100,000 to $149,999 | 16 (6.1%) | 61 (18.3%) |
| $150,000 or more | 0 (0.0%) | 12 (3.6%) |
| Total | 264 (100.0%) | 333 (100.0%) |
Property Value to Household Income Ratio in West Hill
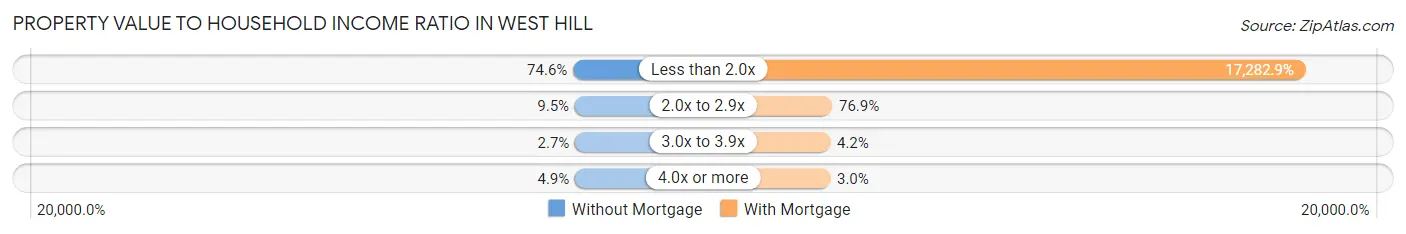
| Value-to-Income Ratio | Without Mortgage | With Mortgage |
| Less than 2.0x | 197 (74.6%) | 57,552 (17,282.9%) |
| 2.0x to 2.9x | 25 (9.5%) | 256 (76.9%) |
| 3.0x to 3.9x | 7 (2.6%) | 14 (4.2%) |
| 4.0x or more | 13 (4.9%) | 10 (3.0%) |
| Total | 264 (100.0%) | 333 (100.0%) |
Real Estate Taxes by Mortgage Status in West Hill
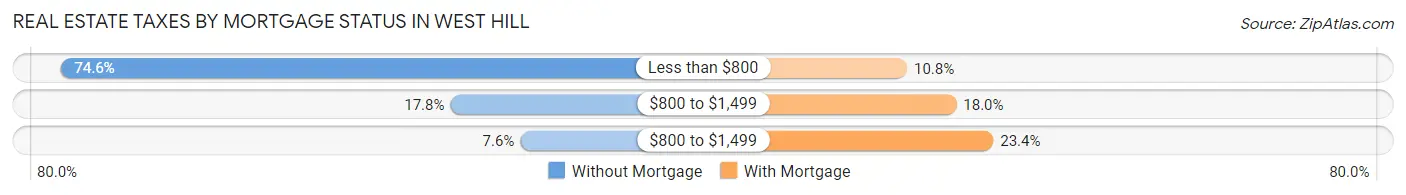
| Property Taxes | Without Mortgage | With Mortgage |
| Less than $800 | 197 (74.6%) | 36 (10.8%) |
| $800 to $1,499 | 47 (17.8%) | 60 (18.0%) |
| $800 to $1,499 | 20 (7.6%) | 78 (23.4%) |
| Total | 264 (100.0%) | 333 (100.0%) |
Health & Disability in West Hill
Health Insurance Coverage by Age in West Hill
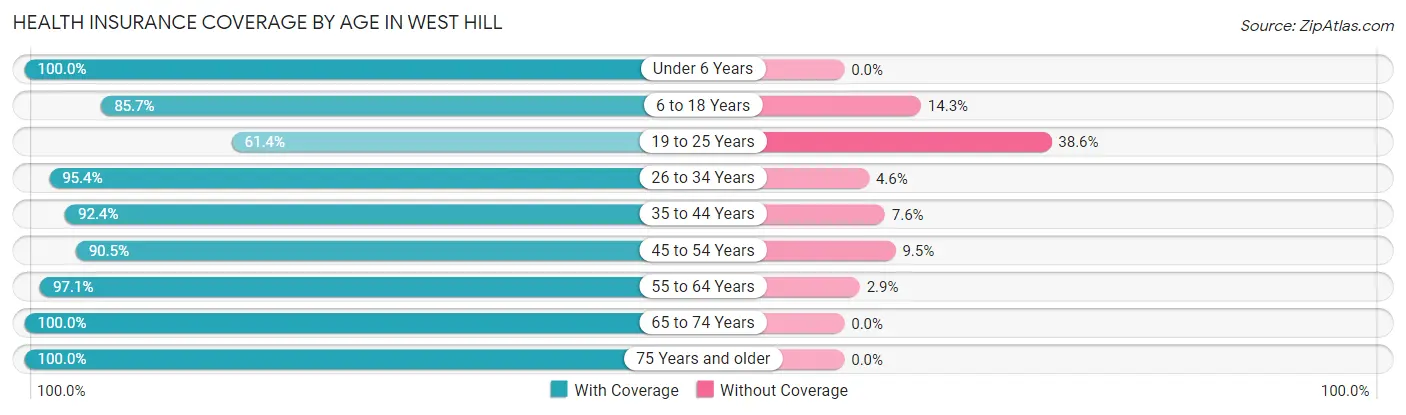
| Age Bracket | With Coverage | Without Coverage |
| Under 6 Years | 175 (100.0%) | 0 (0.0%) |
| 6 to 18 Years | 234 (85.7%) | 39 (14.3%) |
| 19 to 25 Years | 97 (61.4%) | 61 (38.6%) |
| 26 to 34 Years | 332 (95.4%) | 16 (4.6%) |
| 35 to 44 Years | 159 (92.4%) | 13 (7.6%) |
| 45 to 54 Years | 370 (90.5%) | 39 (9.5%) |
| 55 to 64 Years | 270 (97.1%) | 8 (2.9%) |
| 65 to 74 Years | 155 (100.0%) | 0 (0.0%) |
| 75 Years and older | 104 (100.0%) | 0 (0.0%) |
| Total | 1,896 (91.5%) | 176 (8.5%) |
Health Insurance Coverage by Citizenship Status in West Hill
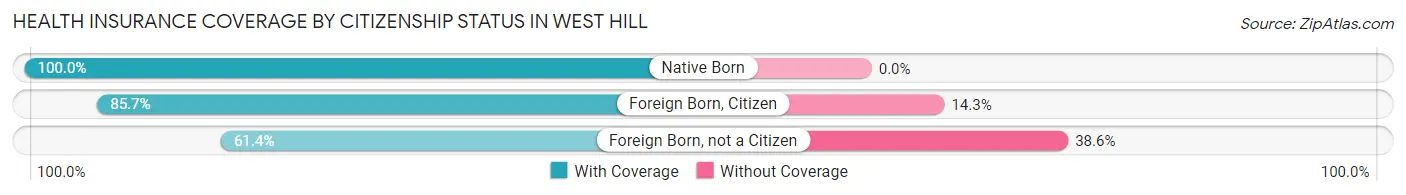
| Citizenship Status | With Coverage | Without Coverage |
| Native Born | 175 (100.0%) | 0 (0.0%) |
| Foreign Born, Citizen | 234 (85.7%) | 39 (14.3%) |
| Foreign Born, not a Citizen | 97 (61.4%) | 61 (38.6%) |
Health Insurance Coverage by Household Income in West Hill
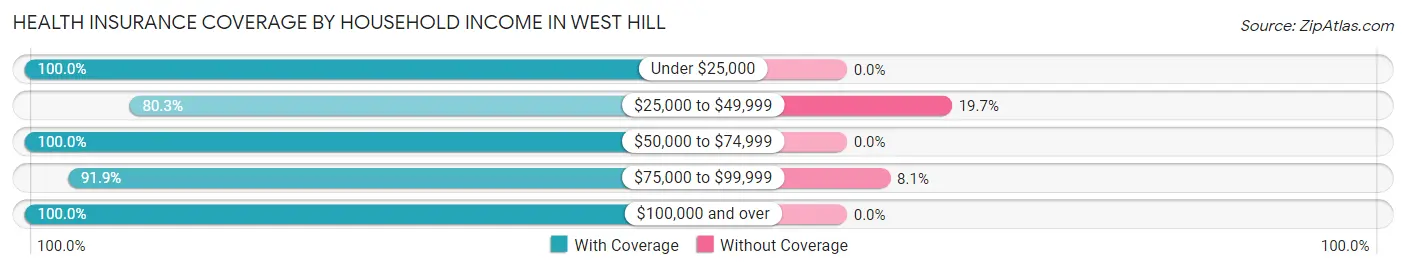
| Household Income | With Coverage | Without Coverage |
| Under $25,000 | 436 (100.0%) | 0 (0.0%) |
| $25,000 to $49,999 | 617 (80.3%) | 151 (19.7%) |
| $50,000 to $74,999 | 435 (100.0%) | 0 (0.0%) |
| $75,000 to $99,999 | 283 (91.9%) | 25 (8.1%) |
| $100,000 and over | 125 (100.0%) | 0 (0.0%) |
Public vs Private Health Insurance Coverage by Age in West Hill
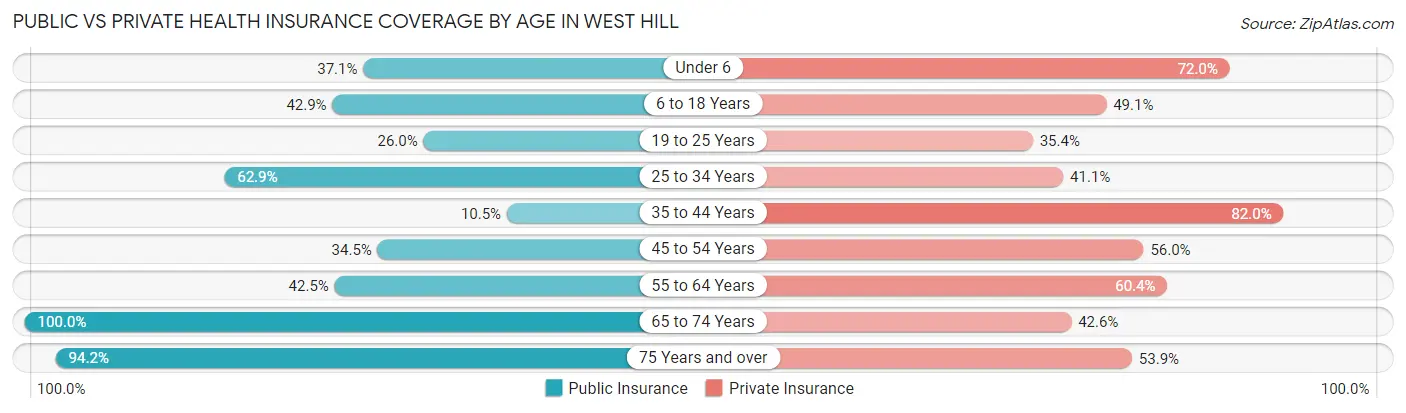
| Age Bracket | Public Insurance | Private Insurance |
| Under 6 | 65 (37.1%) | 126 (72.0%) |
| 6 to 18 Years | 117 (42.9%) | 134 (49.1%) |
| 19 to 25 Years | 41 (26.0%) | 56 (35.4%) |
| 25 to 34 Years | 219 (62.9%) | 143 (41.1%) |
| 35 to 44 Years | 18 (10.5%) | 141 (82.0%) |
| 45 to 54 Years | 141 (34.5%) | 229 (56.0%) |
| 55 to 64 Years | 118 (42.4%) | 168 (60.4%) |
| 65 to 74 Years | 155 (100.0%) | 66 (42.6%) |
| 75 Years and over | 98 (94.2%) | 56 (53.8%) |
| Total | 972 (46.9%) | 1,119 (54.0%) |
Disability Status by Sex by Age in West Hill
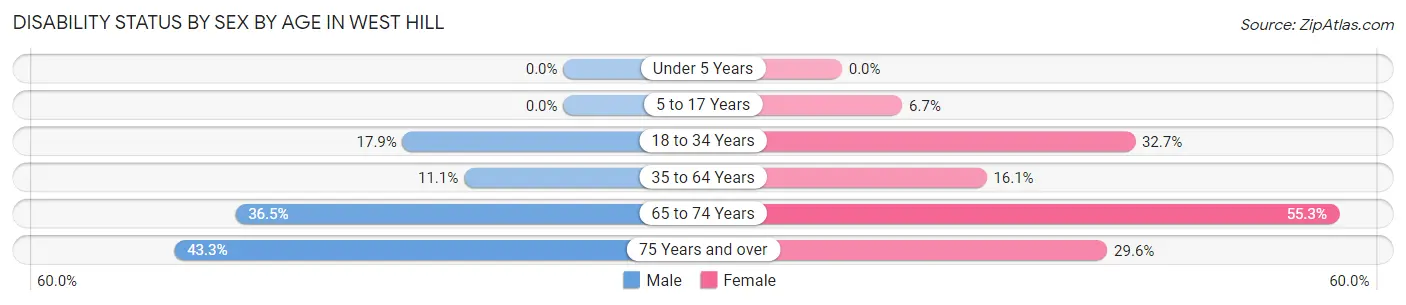
| Age Bracket | Male | Female |
| Under 5 Years | 0 (0.0%) | 0 (0.0%) |
| 5 to 17 Years | 0 (0.0%) | 8 (6.7%) |
| 18 to 34 Years | 58 (17.9%) | 64 (32.7%) |
| 35 to 64 Years | 49 (11.1%) | 67 (16.1%) |
| 65 to 74 Years | 19 (36.5%) | 57 (55.3%) |
| 75 Years and over | 26 (43.3%) | 13 (29.5%) |
Disability Class by Sex by Age in West Hill
Disability Class: Hearing Difficulty
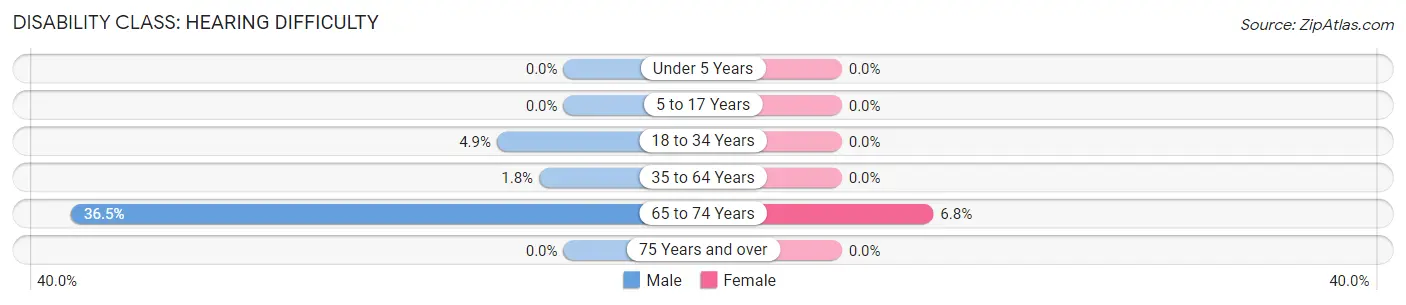
| Age Bracket | Male | Female |
| Under 5 Years | 0 (0.0%) | 0 (0.0%) |
| 5 to 17 Years | 0 (0.0%) | 0 (0.0%) |
| 18 to 34 Years | 16 (4.9%) | 0 (0.0%) |
| 35 to 64 Years | 8 (1.8%) | 0 (0.0%) |
| 65 to 74 Years | 19 (36.5%) | 7 (6.8%) |
| 75 Years and over | 0 (0.0%) | 0 (0.0%) |
Disability Class: Vision Difficulty
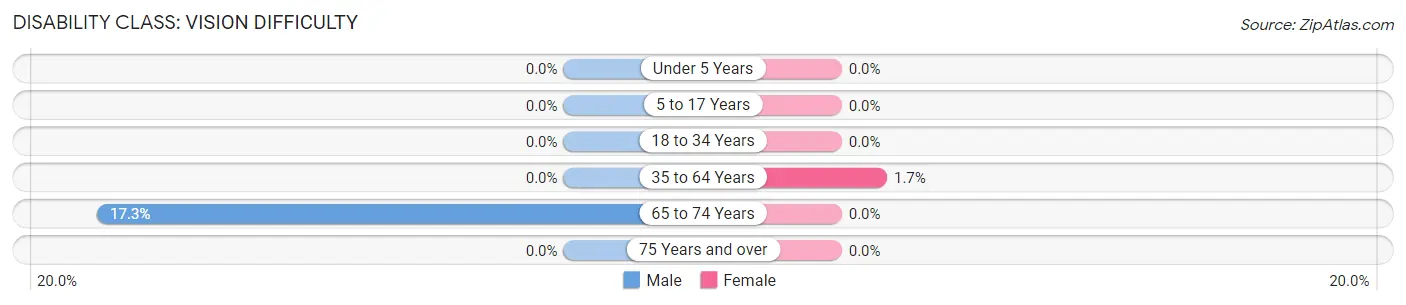
| Age Bracket | Male | Female |
| Under 5 Years | 0 (0.0%) | 0 (0.0%) |
| 5 to 17 Years | 0 (0.0%) | 0 (0.0%) |
| 18 to 34 Years | 0 (0.0%) | 0 (0.0%) |
| 35 to 64 Years | 0 (0.0%) | 7 (1.7%) |
| 65 to 74 Years | 9 (17.3%) | 0 (0.0%) |
| 75 Years and over | 0 (0.0%) | 0 (0.0%) |
Disability Class: Cognitive Difficulty
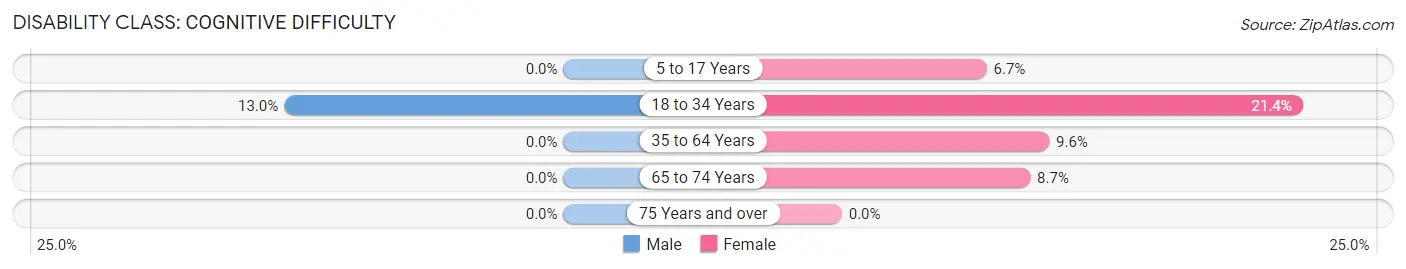
| Age Bracket | Male | Female |
| 5 to 17 Years | 0 (0.0%) | 8 (6.7%) |
| 18 to 34 Years | 42 (13.0%) | 42 (21.4%) |
| 35 to 64 Years | 0 (0.0%) | 40 (9.6%) |
| 65 to 74 Years | 0 (0.0%) | 9 (8.7%) |
| 75 Years and over | 0 (0.0%) | 0 (0.0%) |
Disability Class: Ambulatory Difficulty
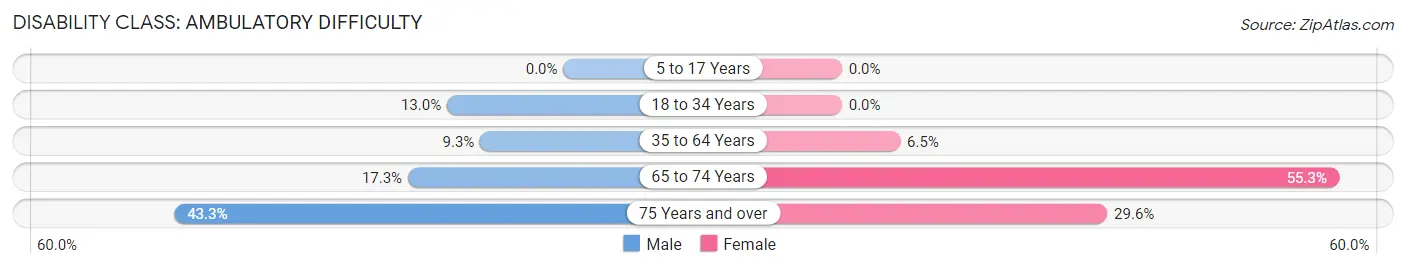
| Age Bracket | Male | Female |
| 5 to 17 Years | 0 (0.0%) | 0 (0.0%) |
| 18 to 34 Years | 42 (13.0%) | 0 (0.0%) |
| 35 to 64 Years | 41 (9.3%) | 27 (6.5%) |
| 65 to 74 Years | 9 (17.3%) | 57 (55.3%) |
| 75 Years and over | 26 (43.3%) | 13 (29.5%) |
Disability Class: Self-Care Difficulty
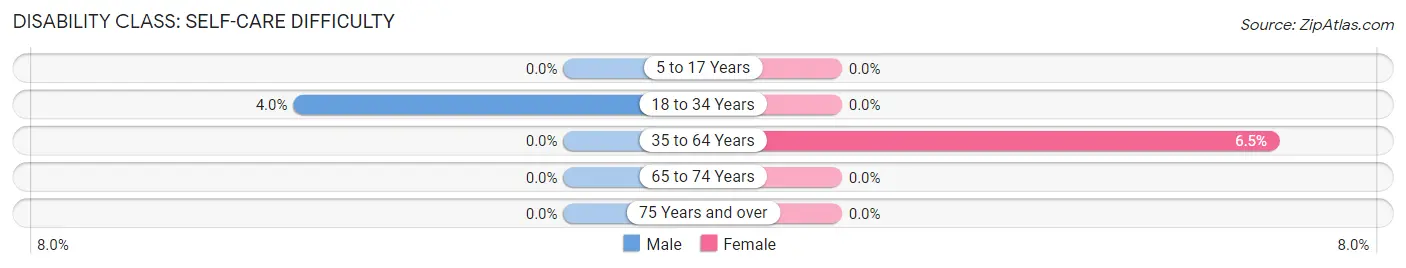
| Age Bracket | Male | Female |
| 5 to 17 Years | 0 (0.0%) | 0 (0.0%) |
| 18 to 34 Years | 13 (4.0%) | 0 (0.0%) |
| 35 to 64 Years | 0 (0.0%) | 27 (6.5%) |
| 65 to 74 Years | 0 (0.0%) | 0 (0.0%) |
| 75 Years and over | 0 (0.0%) | 0 (0.0%) |
Technology Access in West Hill
Computing Device Access in West Hill
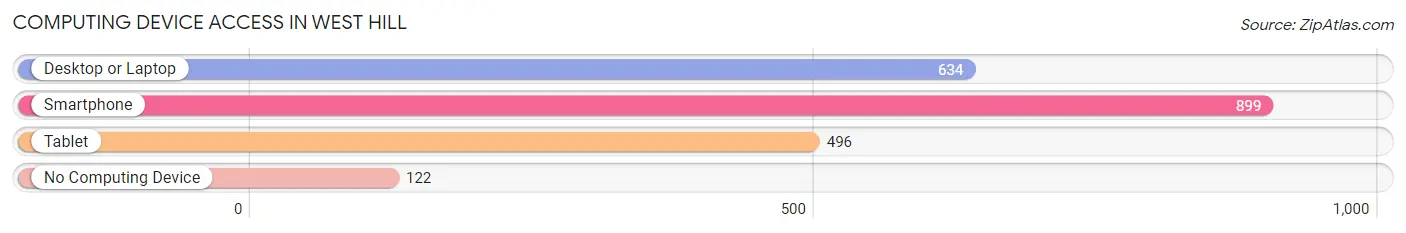
| Device Type | # Households | % Households |
| Desktop or Laptop | 634 | 60.4% |
| Smartphone | 899 | 85.6% |
| Tablet | 496 | 47.2% |
| No Computing Device | 122 | 11.6% |
| Total | 1,050 | 100.0% |
Internet Access in West Hill
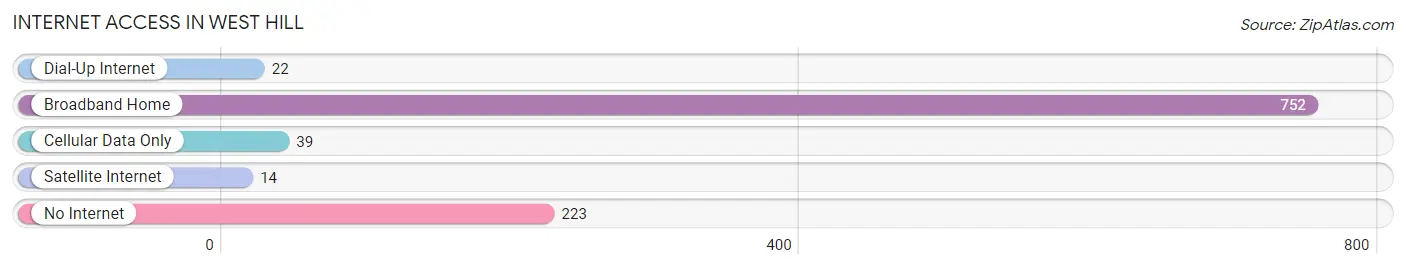
| Internet Type | # Households | % Households |
| Dial-Up Internet | 22 | 2.1% |
| Broadband Home | 752 | 71.6% |
| Cellular Data Only | 39 | 3.7% |
| Satellite Internet | 14 | 1.3% |
| No Internet | 223 | 21.2% |
| Total | 1,050 | 100.0% |
West Hill Summary
Hill, OH is a small village located in the northeastern part of Ohio. It is situated in the county of Geauga and is part of the Cleveland-Akron-Canton metropolitan area. The village has a population of approximately 1,000 people and is located about 30 miles east of Cleveland.
History
The area that is now known as West Hill was first settled in the early 1800s by a group of settlers from Connecticut. The settlers were attracted to the area due to its fertile soil and abundant natural resources. The village was originally known as Westfield, but the name was changed to West Hill in 1845.
The village was incorporated in 1848 and was home to a variety of businesses, including a sawmill, a gristmill, a blacksmith shop, and a general store. The village also had a post office, a school, and a church.
In the late 1800s, the village began to experience a period of growth and development. The railroad was extended to the village in 1881, and the village was connected to the electric grid in 1891. This allowed for the development of new businesses and industries, such as a brickyard, a canning factory, and a furniture factory.
The village continued to grow and prosper throughout the 20th century. In the 1950s, the village was home to a variety of businesses, including a grocery store, a hardware store, a drug store, and a variety of other shops.
Geography
West Hill is located in the northeastern part of Ohio, in the county of Geauga. The village is situated on the western edge of the Cuyahoga Valley National Park. The village is located about 30 miles east of Cleveland and is bordered by the cities of Chardon and Burton.
The village is situated on a hill, which is why it was given the name West Hill. The village is surrounded by rolling hills and is home to a variety of wildlife, including deer, foxes, and other small animals.
Economy
West Hill is a small village with a population of approximately 1,000 people. The village is home to a variety of businesses, including a grocery store, a hardware store, a drug store, and a variety of other shops. The village also has a post office, a school, and a church.
The village is also home to a variety of small businesses, such as a bakery, a florist, a barber shop, and a variety of other small businesses. The village is also home to a variety of agricultural businesses, such as a dairy farm, a vegetable farm, and a fruit farm.
Demographics
According to the 2010 census, the population of West Hill was 1,000 people. The village is predominantly white, with 95.7% of the population being white. The remaining 4.3% of the population is made up of African Americans, Asians, and other races.
The median household income in West Hill is $45,000, which is slightly lower than the national median of $50,000. The median age in West Hill is 44 years, which is slightly higher than the national median of 37 years. The village has a poverty rate of 8.3%, which is slightly higher than the national poverty rate of 12.3%.
Conclusion
West Hill is a small village located in the northeastern part of Ohio. The village has a population of approximately 1,000 people and is located about 30 miles east of Cleveland. The village was first settled in the early 1800s and was incorporated in 1848. The village has a variety of businesses, including a grocery store, a hardware store, a drug store, and a variety of other shops. The village is predominantly white, with 95.7% of the population being white. The median household income in West Hill is $45,000, which is slightly lower than the national median of $50,000. The village has a poverty rate of 8.3%, which is slightly higher than the national poverty rate of 12.3%.
Common Questions
What is the Total Population of West Hill?
Total Population of West Hill is 2,232.
What is the Total Male Population of West Hill?
Total Male Population of West Hill is 1,141.
What is the Total Female Population of West Hill?
Total Female Population of West Hill is 1,091.
What is the Ratio of Males per 100 Females in West Hill?
There are 104.58 Males per 100 Females in West Hill.
What is the Ratio of Females per 100 Males in West Hill?
There are 95.62 Females per 100 Males in West Hill.
What is the Median Population Age in West Hill?
Median Population Age in West Hill is 42.9 Years.
What is the Average Family Size in West Hill
Average Family Size in West Hill is 3.0 People.
What is the Average Household Size in West Hill
Average Household Size in West Hill is 2.0 People.
What is Per Capita Income in West Hill?
Per Capita income in West Hill is $21,630.
What is the Median Family Income in West Hill?
Median Family Income in West Hill is $41,397.
What is the Median Household income in West Hill?
Median Household Income in West Hill is $30,590.
What is Income or Wage Gap in West Hill?
Income or Wage Gap in West Hill is 32.0%.
Women in West Hill earn 68.0 cents for every dollar earned by a man.
What is Inequality or Gini Index in West Hill?
Inequality or Gini Index in West Hill is 0.42.
How Large is the Labor Force in West Hill?
There are 1,074 People in the Labor Forcein in West Hill.
What is the Percentage of People in the Labor Force in West Hill?
56.1% of People are in the Labor Force in West Hill.
What is the Unemployment Rate in West Hill?
Unemployment Rate in West Hill is 6.9%.