Morristown, OH
Morristown Map
Morristown Overview
277
TOTAL POPULATION
132
MALE POPULATION
145
FEMALE POPULATION
91.03
MALES / 100 FEMALES
109.85
FEMALES / 100 MALES
41.6
MEDIAN AGE
3.8
AVG FAMILY SIZE
3.0
AVG HOUSEHOLD SIZE
$22,190
PER CAPITA INCOME
$55,313
AVG FAMILY INCOME
$48,125
AVG HOUSEHOLD INCOME
0.30
INEQUALITY / GINI INDEX
137
LABOR FORCE [ PEOPLE ]
61.7%
PERCENT IN LABOR FORCE
21.9%
UNEMPLOYMENT RATE
Morristown Zip Codes
Morristown Area Codes
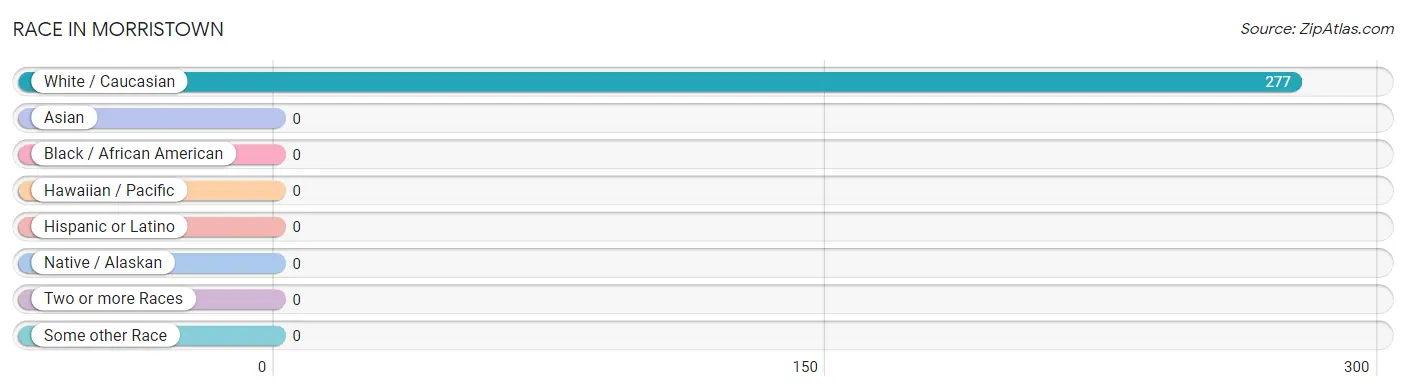
Race in Morristown
The most populous races in Morristown are , and White / Caucasian (277 | 100.0%).
| Race | # Population | % Population |
| Asian | 0 | 0.0% |
| Black / African American | 0 | 0.0% |
| Hawaiian / Pacific | 0 | 0.0% |
| Hispanic or Latino | 0 | 0.0% |
| Native / Alaskan | 0 | 0.0% |
| White / Caucasian | 277 | 100.0% |
| Two or more Races | 0 | 0.0% |
| Some other Race | 0 | 0.0% |
| Total | 277 | 100.0% |
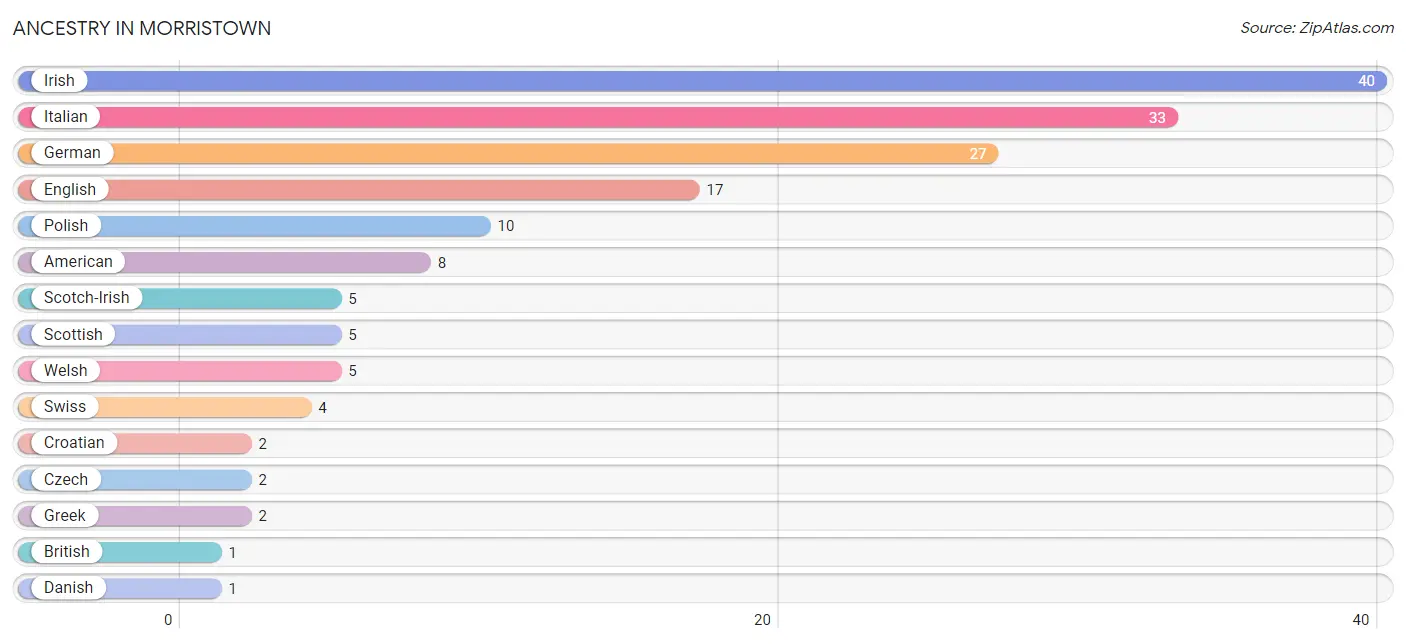
Ancestry in Morristown
The most populous ancestries reported in Morristown are Irish (40 | 14.4%), Italian (33 | 11.9%), German (27 | 9.8%), English (17 | 6.1%), and Polish (10 | 3.6%), together accounting for 45.9% of all Morristown residents.
| Ancestry | # Population | % Population |
| American | 8 | 2.9% |
| British | 1 | 0.4% |
| Croatian | 2 | 0.7% |
| Czech | 2 | 0.7% |
| Danish | 1 | 0.4% |
| Dutch | 1 | 0.4% |
| English | 17 | 6.1% |
| German | 27 | 9.8% |
| Greek | 2 | 0.7% |
| Irish | 40 | 14.4% |
| Italian | 33 | 11.9% |
| Polish | 10 | 3.6% |
| Scotch-Irish | 5 | 1.8% |
| Scottish | 5 | 1.8% |
| Swiss | 4 | 1.4% |
| Welsh | 5 | 1.8% | View All 16 Rows |
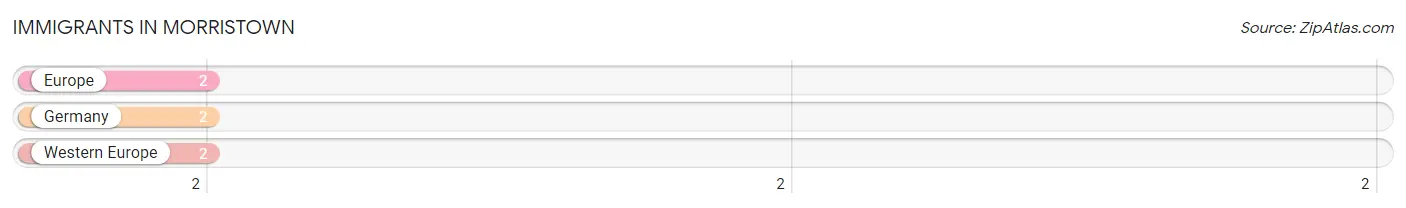
Immigrants in Morristown
The most numerous immigrant groups reported in Morristown came from Europe (2 | 0.7%), Germany (2 | 0.7%), and Western Europe (2 | 0.7%), together accounting for 2.2% of all Morristown residents.
| Immigration Origin | # Population | % Population |
| Europe | 2 | 0.7% |
| Germany | 2 | 0.7% |
| Western Europe | 2 | 0.7% | View All 3 Rows |
Sex and Age in Morristown
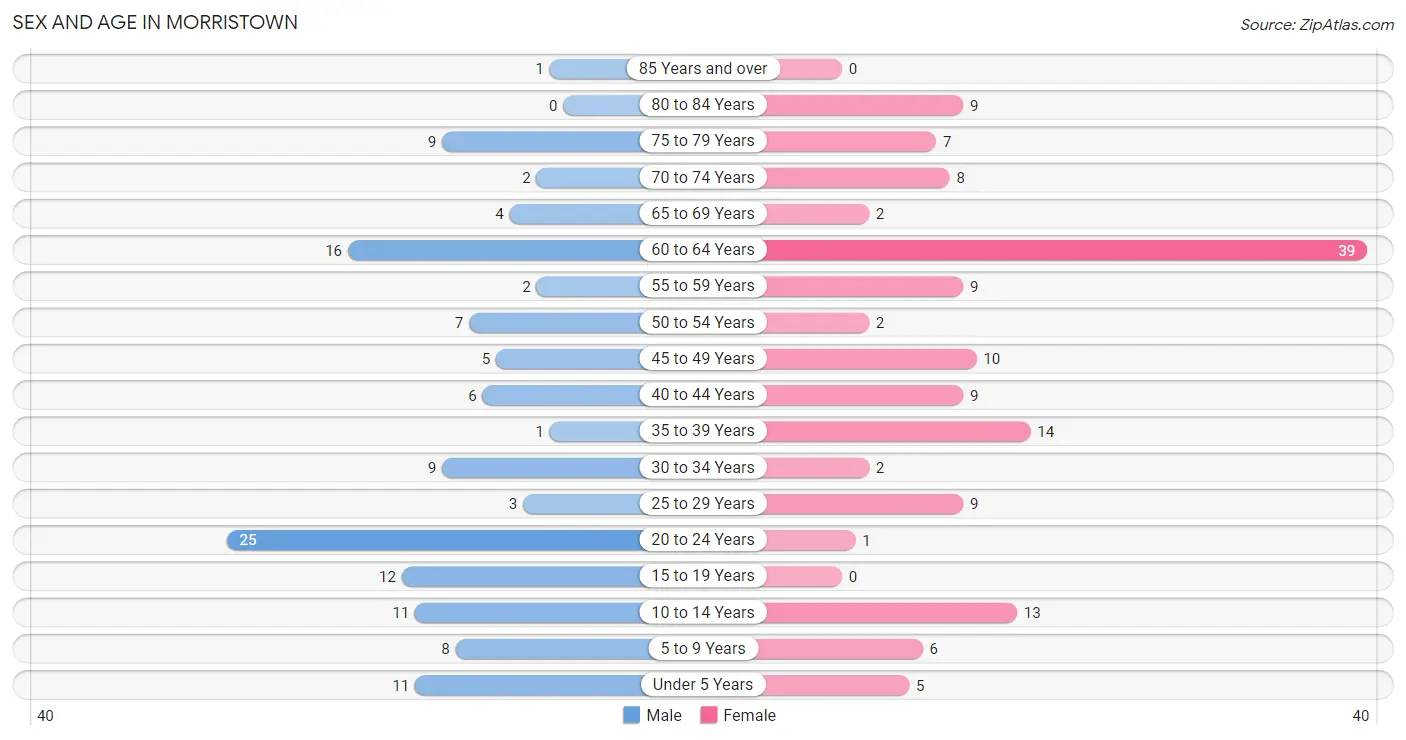
Sex and Age in Morristown
The most populous age groups in Morristown are 20 to 24 Years (25 | 18.9%) for men and 60 to 64 Years (39 | 26.9%) for women.
| Age Bracket | Male | Female |
| Under 5 Years | 11 (8.3%) | 5 (3.5%) |
| 5 to 9 Years | 8 (6.1%) | 6 (4.1%) |
| 10 to 14 Years | 11 (8.3%) | 13 (9.0%) |
| 15 to 19 Years | 12 (9.1%) | 0 (0.0%) |
| 20 to 24 Years | 25 (18.9%) | 1 (0.7%) |
| 25 to 29 Years | 3 (2.3%) | 9 (6.2%) |
| 30 to 34 Years | 9 (6.8%) | 2 (1.4%) |
| 35 to 39 Years | 1 (0.8%) | 14 (9.7%) |
| 40 to 44 Years | 6 (4.5%) | 9 (6.2%) |
| 45 to 49 Years | 5 (3.8%) | 10 (6.9%) |
| 50 to 54 Years | 7 (5.3%) | 2 (1.4%) |
| 55 to 59 Years | 2 (1.5%) | 9 (6.2%) |
| 60 to 64 Years | 16 (12.1%) | 39 (26.9%) |
| 65 to 69 Years | 4 (3.0%) | 2 (1.4%) |
| 70 to 74 Years | 2 (1.5%) | 8 (5.5%) |
| 75 to 79 Years | 9 (6.8%) | 7 (4.8%) |
| 80 to 84 Years | 0 (0.0%) | 9 (6.2%) |
| 85 Years and over | 1 (0.8%) | 0 (0.0%) |
| Total | 132 (100.0%) | 145 (100.0%) |
Families and Households in Morristown
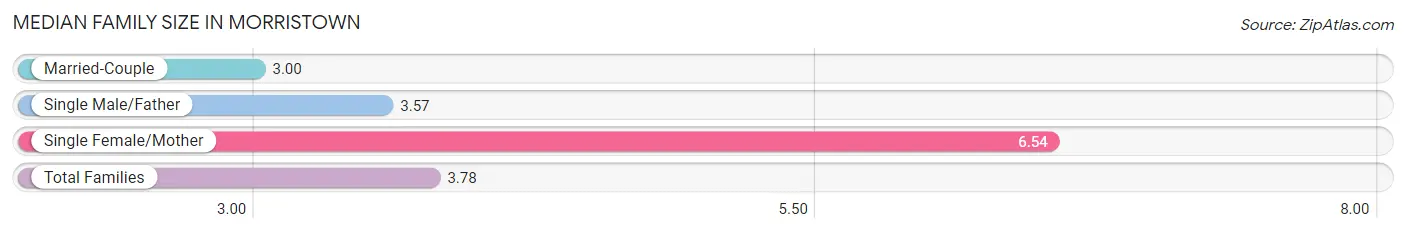
Median Family Size in Morristown
The median family size in Morristown is 3.78 persons per family, with single female/mother families (13 | 20.3%) accounting for the largest median family size of 6.54 persons per family. On the other hand, married-couple families (44 | 68.8%) represent the smallest median family size with 3.00 persons per family.
| Family Type | # Families | Family Size |
| Married-Couple | 44 (68.8%) | 3.00 |
| Single Male/Father | 7 (10.9%) | 3.57 |
| Single Female/Mother | 13 (20.3%) | 6.54 |
| Total Families | 64 (100.0%) | 3.78 |
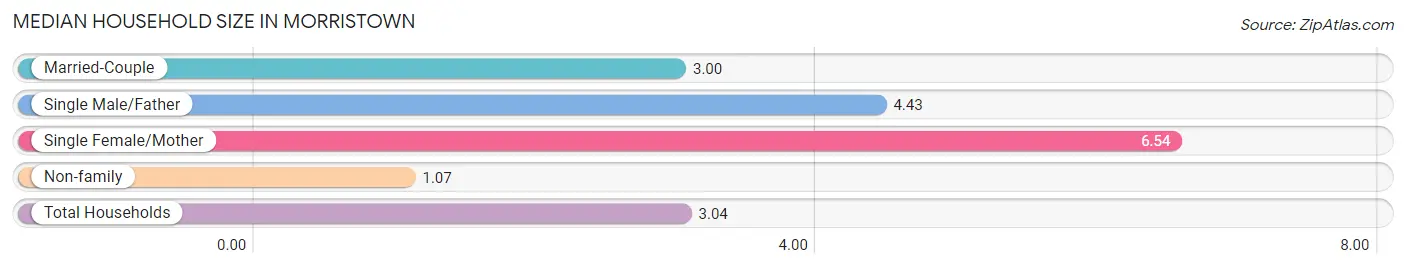
Median Household Size in Morristown
The median household size in Morristown is 3.04 persons per household, with single female/mother households (13 | 14.3%) accounting for the largest median household size of 6.54 persons per household. non-family households (27 | 29.7%) represent the smallest median household size with 1.07 persons per household.
| Household Type | # Households | Household Size |
| Married-Couple | 44 (48.3%) | 3.00 |
| Single Male/Father | 7 (7.7%) | 4.43 |
| Single Female/Mother | 13 (14.3%) | 6.54 |
| Non-family | 27 (29.7%) | 1.07 |
| Total Households | 91 (100.0%) | 3.04 |
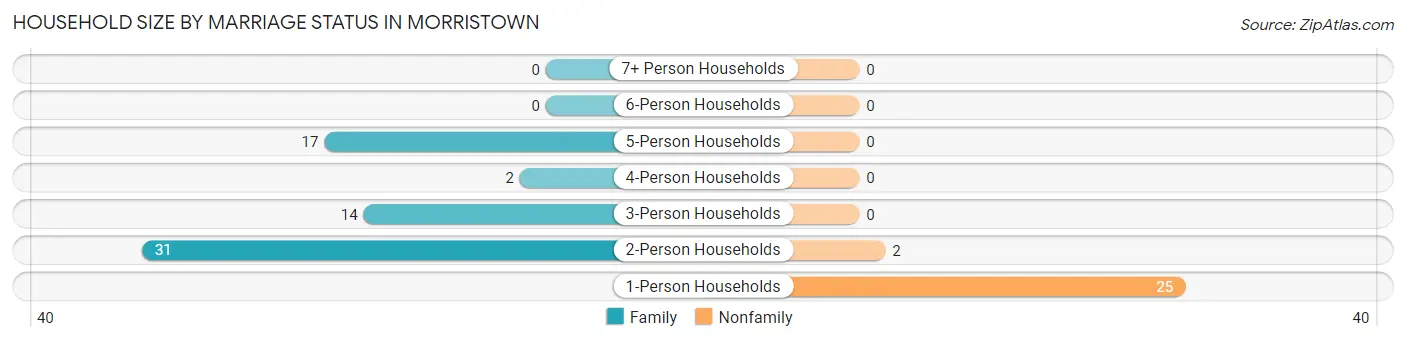
Household Size by Marriage Status in Morristown
Out of a total of 91 households in Morristown, 64 (70.3%) are family households, while 27 (29.7%) are nonfamily households. The most numerous type of family households are 2-person households, comprising 31, and the most common type of nonfamily households are 1-person households, comprising 25.
| Household Size | Family Households | Nonfamily Households |
| 1-Person Households | - | 25 (27.5%) |
| 2-Person Households | 31 (34.1%) | 2 (2.2%) |
| 3-Person Households | 14 (15.4%) | 0 (0.0%) |
| 4-Person Households | 2 (2.2%) | 0 (0.0%) |
| 5-Person Households | 17 (18.7%) | 0 (0.0%) |
| 6-Person Households | 0 (0.0%) | 0 (0.0%) |
| 7+ Person Households | 0 (0.0%) | 0 (0.0%) |
| Total | 64 (70.3%) | 27 (29.7%) |
Female Fertility in Morristown
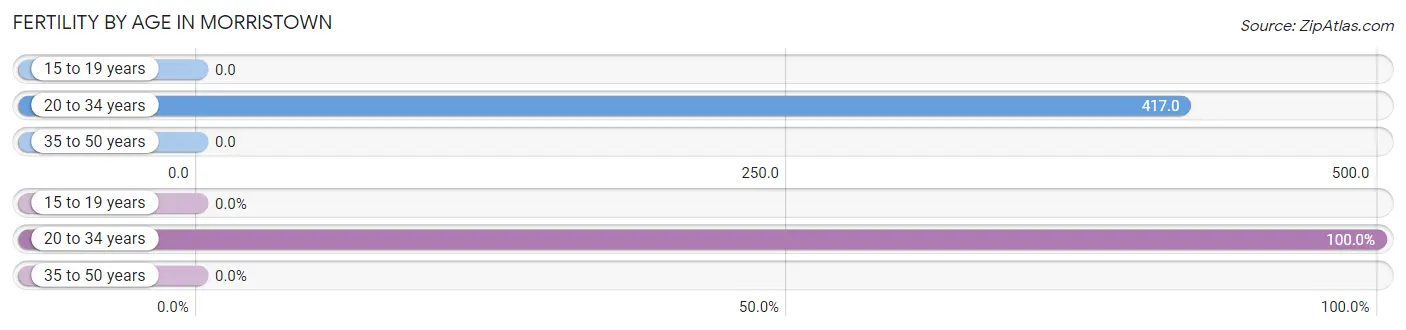
Fertility by Age in Morristown
Average fertility rate in Morristown is 111.0 births per 1,000 women. Women in the age bracket of 20 to 34 years have the highest fertility rate with 417.0 births per 1,000 women. Women in the age bracket of 20 to 34 years acount for 100.0% of all women with births.
| Age Bracket | Women with Births | Births / 1,000 Women |
| 15 to 19 years | 0 (0.0%) | 0.0 |
| 20 to 34 years | 5 (100.0%) | 417.0 |
| 35 to 50 years | 0 (0.0%) | 0.0 |
| Total | 5 (100.0%) | 111.0 |
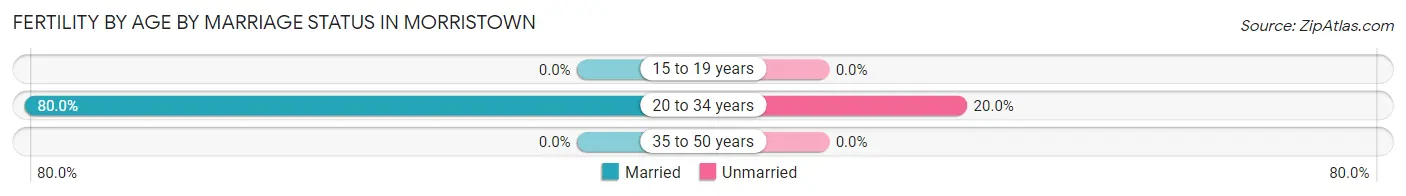
Fertility by Age by Marriage Status in Morristown
80.0% of women with births (5) in Morristown are married. The highest percentage of unmarried women with births falls into 20 to 34 years age bracket with 20.0% of them unmarried at the time of birth, while the lowest percentage of unmarried women with births belong to 20 to 34 years age bracket with 20.0% of them unmarried.
| Age Bracket | Married | Unmarried |
| 15 to 19 years | 0 (0.0%) | 0 (0.0%) |
| 20 to 34 years | 4 (80.0%) | 1 (20.0%) |
| 35 to 50 years | 0 (0.0%) | 0 (0.0%) |
| Total | 4 (80.0%) | 1 (20.0%) |
Fertility by Education in Morristown
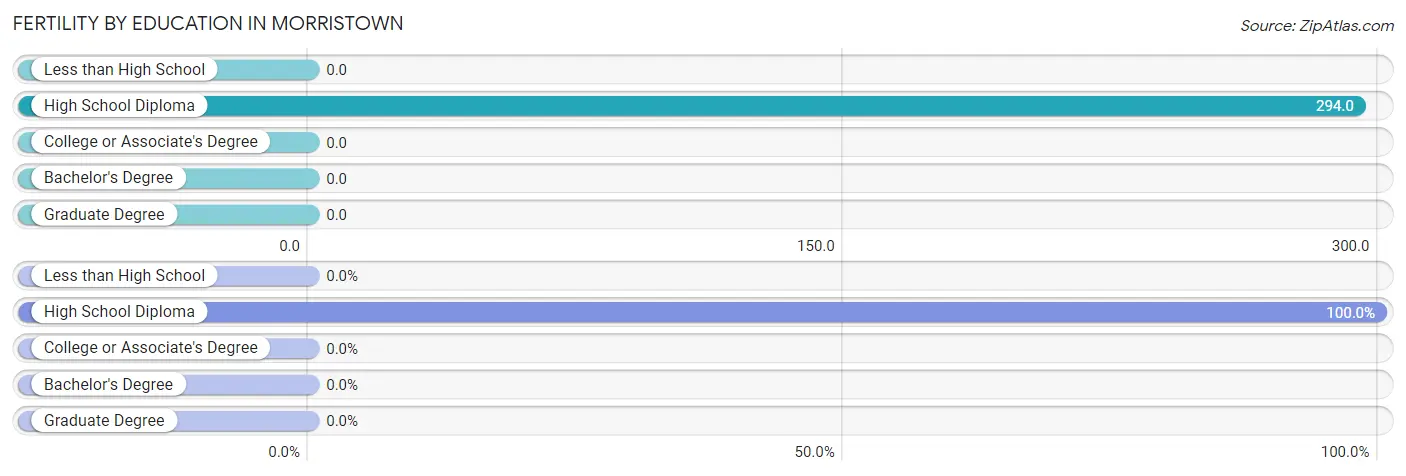
| Educational Attainment | Women with Births | Births / 1,000 Women |
| Less than High School | 0 (0.0%) | 0.0 |
| High School Diploma | 5 (100.0%) | 294.0 |
| College or Associate's Degree | 0 (0.0%) | 0.0 |
| Bachelor's Degree | 0 (0.0%) | 0.0 |
| Graduate Degree | 0 (0.0%) | 0.0 |
| Total | 5 (100.0%) | 111.0 |
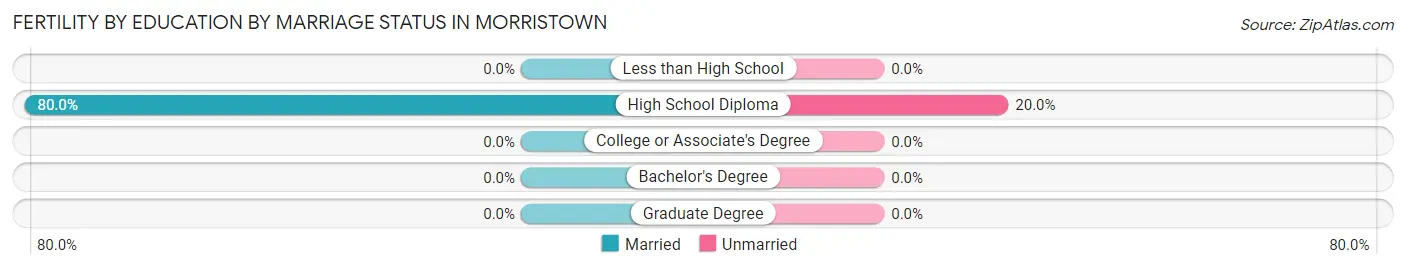
Fertility by Education by Marriage Status in Morristown
20.0% of women with births in Morristown are unmarried. Women with the educational attainment of high school diploma are most likely to be married with 80.0% of them married at childbirth, while women with the educational attainment of high school diploma are least likely to be married with 20.0% of them unmarried at childbirth.
| Educational Attainment | Married | Unmarried |
| Less than High School | 0 (0.0%) | 0 (0.0%) |
| High School Diploma | 4 (80.0%) | 1 (20.0%) |
| College or Associate's Degree | 0 (0.0%) | 0 (0.0%) |
| Bachelor's Degree | 0 (0.0%) | 0 (0.0%) |
| Graduate Degree | 0 (0.0%) | 0 (0.0%) |
| Total | 4 (80.0%) | 1 (20.0%) |
Income in Morristown
Income Overview in Morristown
Per Capita Income in Morristown is $22,190, while median incomes of families and households are $55,313 and $48,125 respectively.
| Characteristic | Number | Measure |
| Per Capita Income | 277 | $22,190 |
| Median Family Income | 64 | $55,313 |
| Mean Family Income | 64 | $61,523 |
| Median Household Income | 91 | $48,125 |
| Mean Household Income | 91 | $58,040 |
| Income Deficit | 64 | $0 |
| Wage / Income Gap (%) | 277 | 0.00% |
| Wage / Income Gap ($) | 277 | 100.00¢ per $1 |
| Gini / Inequality Index | 277 | 0.30 |
Earnings by Sex in Morristown
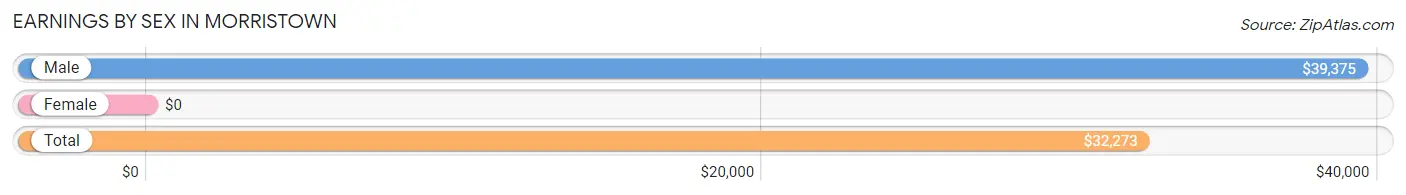
| Sex | Number | Average Earnings |
| Male | 33 (28.0%) | $39,375 |
| Female | 85 (72.0%) | $0 |
| Total | 118 (100.0%) | $32,273 |
Earnings by Sex by Income Bracket in Morristown
The most common earnings brackets in Morristown are $30,000 to $34,999 for men (13 | 39.4%) and $17,500 to $19,999 for women (23 | 27.1%).
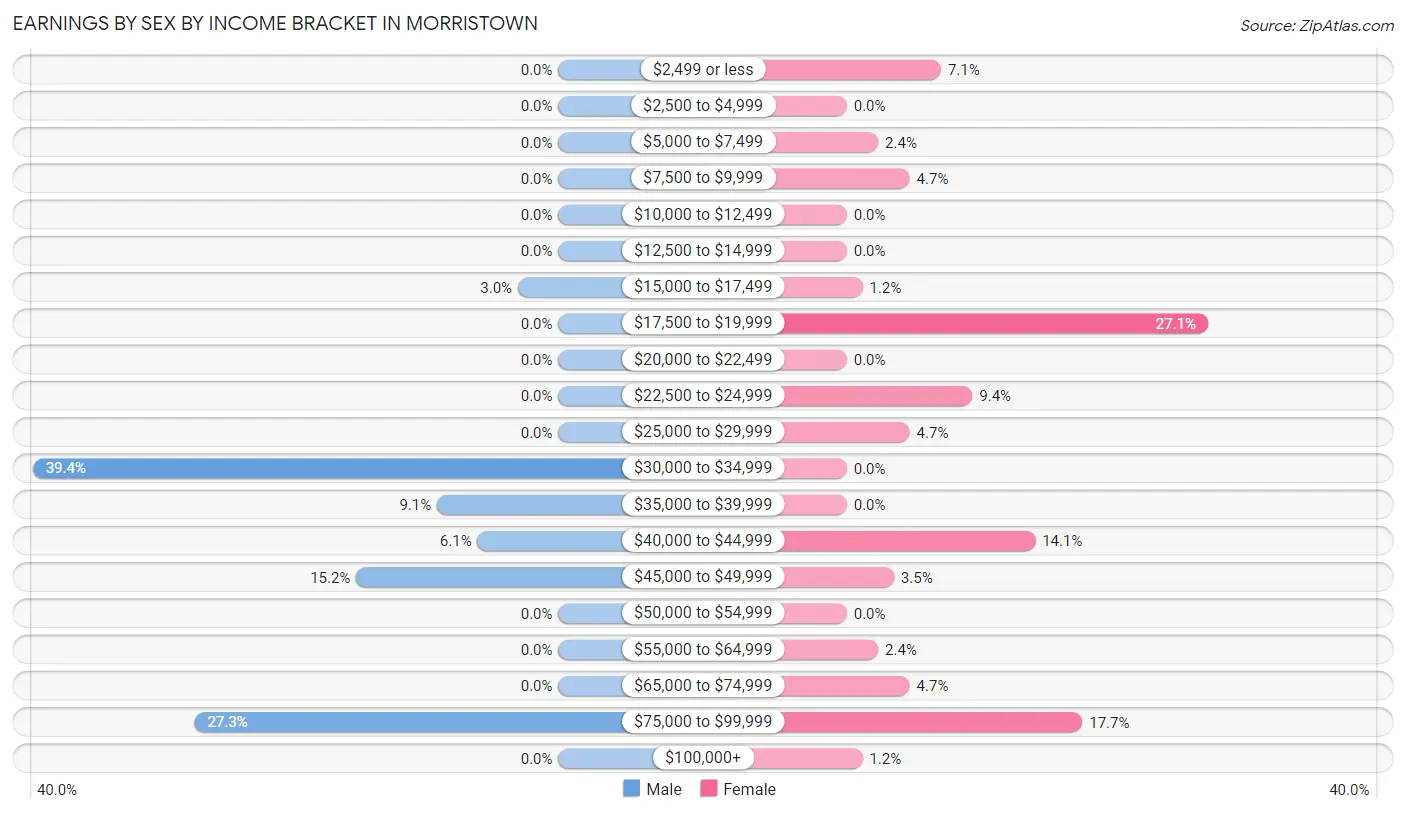
| Income | Male | Female |
| $2,499 or less | 0 (0.0%) | 6 (7.1%) |
| $2,500 to $4,999 | 0 (0.0%) | 0 (0.0%) |
| $5,000 to $7,499 | 0 (0.0%) | 2 (2.4%) |
| $7,500 to $9,999 | 0 (0.0%) | 4 (4.7%) |
| $10,000 to $12,499 | 0 (0.0%) | 0 (0.0%) |
| $12,500 to $14,999 | 0 (0.0%) | 0 (0.0%) |
| $15,000 to $17,499 | 1 (3.0%) | 1 (1.2%) |
| $17,500 to $19,999 | 0 (0.0%) | 23 (27.1%) |
| $20,000 to $22,499 | 0 (0.0%) | 0 (0.0%) |
| $22,500 to $24,999 | 0 (0.0%) | 8 (9.4%) |
| $25,000 to $29,999 | 0 (0.0%) | 4 (4.7%) |
| $30,000 to $34,999 | 13 (39.4%) | 0 (0.0%) |
| $35,000 to $39,999 | 3 (9.1%) | 0 (0.0%) |
| $40,000 to $44,999 | 2 (6.1%) | 12 (14.1%) |
| $45,000 to $49,999 | 5 (15.1%) | 3 (3.5%) |
| $50,000 to $54,999 | 0 (0.0%) | 0 (0.0%) |
| $55,000 to $64,999 | 0 (0.0%) | 2 (2.4%) |
| $65,000 to $74,999 | 0 (0.0%) | 4 (4.7%) |
| $75,000 to $99,999 | 9 (27.3%) | 15 (17.6%) |
| $100,000+ | 0 (0.0%) | 1 (1.2%) |
| Total | 33 (100.0%) | 85 (100.0%) |
Earnings by Sex by Educational Attainment in Morristown
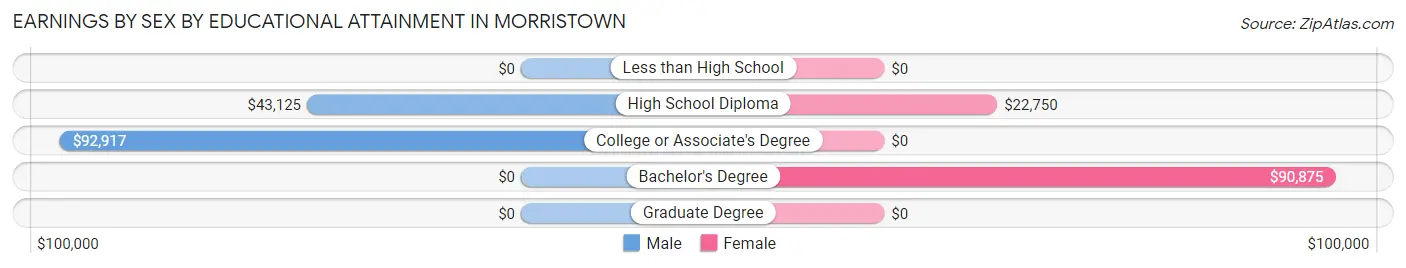
| Educational Attainment | Male Income | Female Income |
| Less than High School | - | - |
| High School Diploma | $43,125 | $22,750 |
| College or Associate's Degree | $92,917 | $0 |
| Bachelor's Degree | - | - |
| Graduate Degree | - | - |
| Total | $39,375 | $0 |
Family Income in Morristown
Family Income Brackets in Morristown
According to the Morristown family income data, there are 23 families falling into the $35,000 to $49,999 income range, which is the most common income bracket and makes up 35.9% of all families.
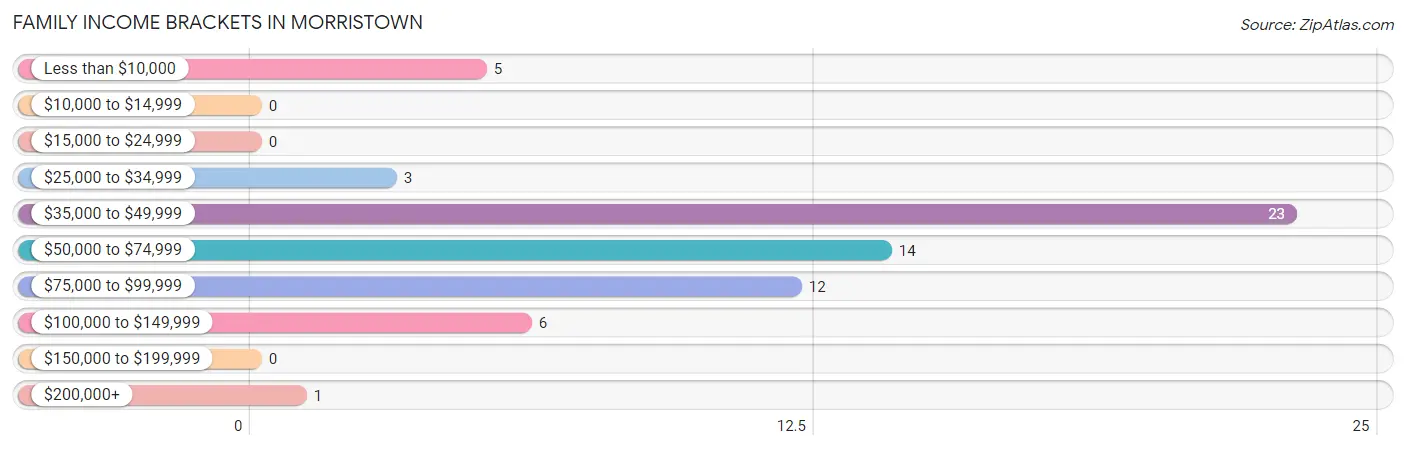
| Income Bracket | # Families | % Families |
| Less than $10,000 | 5 | 7.8% |
| $10,000 to $14,999 | 0 | 0.0% |
| $15,000 to $24,999 | 0 | 0.0% |
| $25,000 to $34,999 | 3 | 4.7% |
| $35,000 to $49,999 | 23 | 35.9% |
| $50,000 to $74,999 | 14 | 21.9% |
| $75,000 to $99,999 | 12 | 18.8% |
| $100,000 to $149,999 | 6 | 9.4% |
| $150,000 to $199,999 | 0 | 0.0% |
| $200,000+ | 1 | 1.6% |
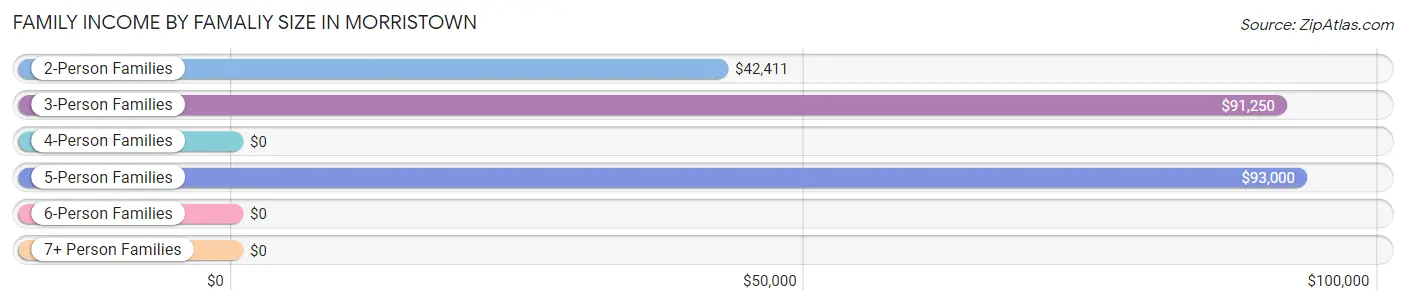
Family Income by Famaliy Size in Morristown
5-person families (12 | 18.8%) account for the highest median family income in Morristown with $93,000 per family, while 3-person families (16 | 25.0%) have the highest median income of $30,417 per family member.
| Income Bracket | # Families | Median Income |
| 2-Person Families | 31 (48.4%) | $42,411 |
| 3-Person Families | 16 (25.0%) | $91,250 |
| 4-Person Families | 5 (7.8%) | $0 |
| 5-Person Families | 12 (18.8%) | $93,000 |
| 6-Person Families | 0 (0.0%) | $0 |
| 7+ Person Families | 0 (0.0%) | $0 |
| Total | 64 (100.0%) | $55,313 |
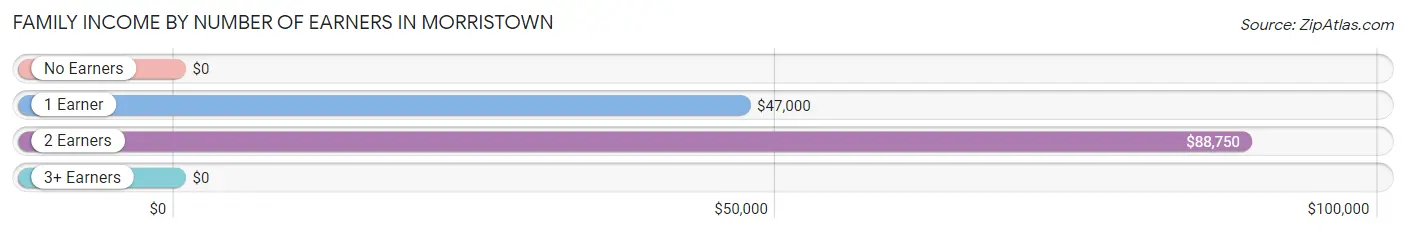
Family Income by Number of Earners in Morristown
| Number of Earners | # Families | Median Income |
| No Earners | 11 (17.2%) | $0 |
| 1 Earner | 34 (53.1%) | $47,000 |
| 2 Earners | 19 (29.7%) | $88,750 |
| 3+ Earners | 0 (0.0%) | $0 |
| Total | 64 (100.0%) | $55,313 |
Household Income in Morristown
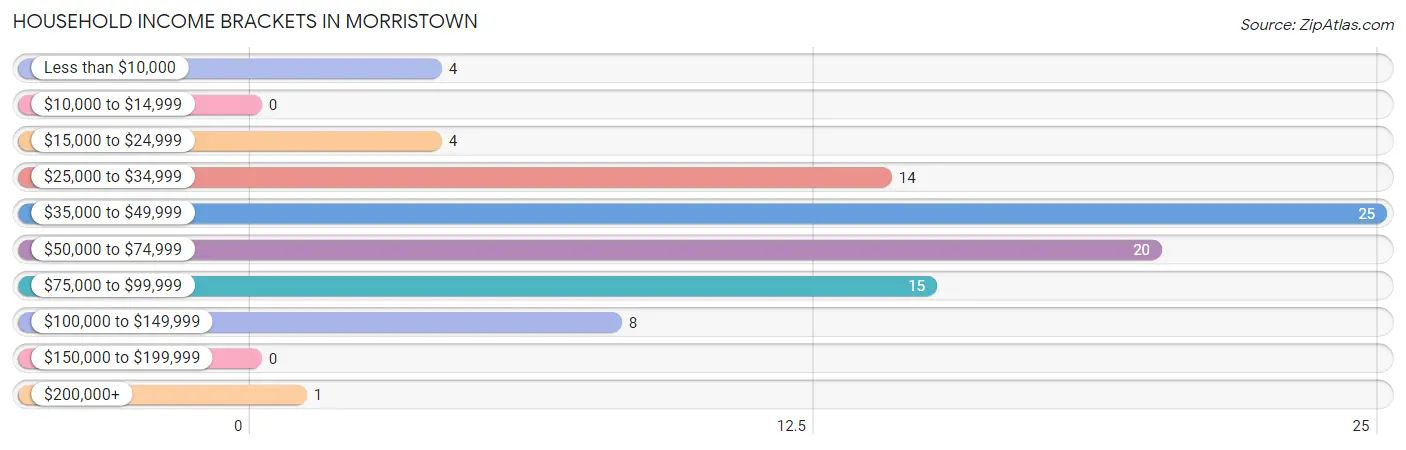
Household Income Brackets in Morristown
With 25 households falling in the category, the $35,000 to $49,999 income range is the most frequent in Morristown, accounting for 27.5% of all households.
| Income Bracket | # Households | % Households |
| Less than $10,000 | 4 | 4.4% |
| $10,000 to $14,999 | 0 | 0.0% |
| $15,000 to $24,999 | 4 | 4.4% |
| $25,000 to $34,999 | 14 | 15.4% |
| $35,000 to $49,999 | 25 | 27.5% |
| $50,000 to $74,999 | 20 | 22.0% |
| $75,000 to $99,999 | 15 | 16.5% |
| $100,000 to $149,999 | 8 | 8.8% |
| $150,000 to $199,999 | 0 | 0.0% |
| $200,000+ | 1 | 1.1% |
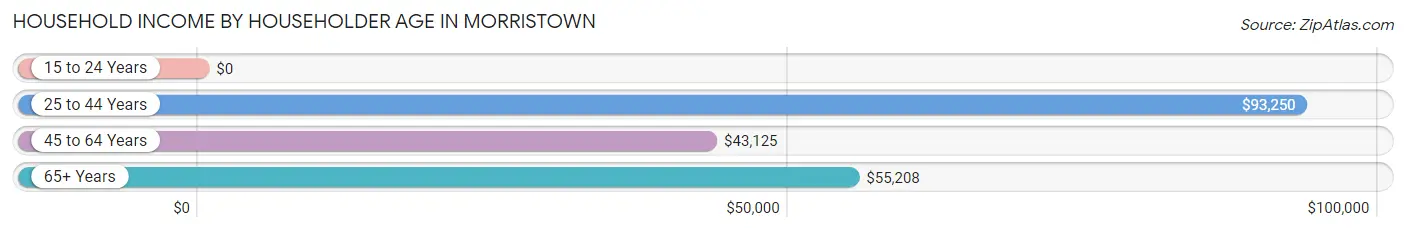
Household Income by Householder Age in Morristown
The median household income in Morristown is $48,125, with the highest median household income of $93,250 found in the 25 to 44 years age bracket for the primary householder. A total of 25 households (27.5%) fall into this category.
| Income Bracket | # Households | Median Income |
| 15 to 24 Years | 0 (0.0%) | $0 |
| 25 to 44 Years | 25 (27.5%) | $93,250 |
| 45 to 64 Years | 31 (34.1%) | $43,125 |
| 65+ Years | 35 (38.5%) | $55,208 |
| Total | 91 (100.0%) | $48,125 |
Poverty in Morristown
Income Below Poverty by Sex and Age in Morristown
With 16.7% poverty level for males and 1.4% for females among the residents of Morristown, 12 to 14 year old males and 55 to 64 year old females are the most vulnerable to poverty, with 5 males (83.3%) and 2 females (4.2%) in their respective age groups living below the poverty level.
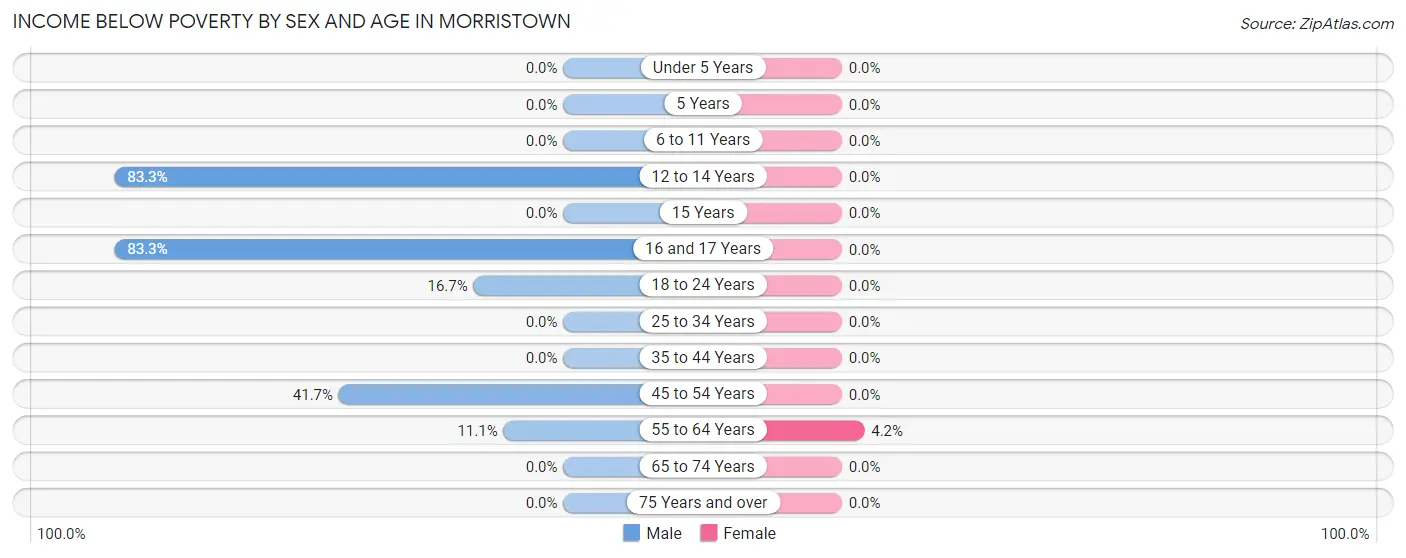
| Age Bracket | Male | Female |
| Under 5 Years | 0 (0.0%) | 0 (0.0%) |
| 5 Years | 0 (0.0%) | 0 (0.0%) |
| 6 to 11 Years | 0 (0.0%) | 0 (0.0%) |
| 12 to 14 Years | 5 (83.3%) | 0 (0.0%) |
| 15 Years | 0 (0.0%) | 0 (0.0%) |
| 16 and 17 Years | 5 (83.3%) | 0 (0.0%) |
| 18 to 24 Years | 5 (16.7%) | 0 (0.0%) |
| 25 to 34 Years | 0 (0.0%) | 0 (0.0%) |
| 35 to 44 Years | 0 (0.0%) | 0 (0.0%) |
| 45 to 54 Years | 5 (41.7%) | 0 (0.0%) |
| 55 to 64 Years | 2 (11.1%) | 2 (4.2%) |
| 65 to 74 Years | 0 (0.0%) | 0 (0.0%) |
| 75 Years and over | 0 (0.0%) | 0 (0.0%) |
| Total | 22 (16.7%) | 2 (1.4%) |
Income Above Poverty by Sex and Age in Morristown
According to the poverty statistics in Morristown, males aged under 5 years and females aged under 5 years are the age groups that are most secure financially, with 100.0% of males and 100.0% of females in these age groups living above the poverty line.
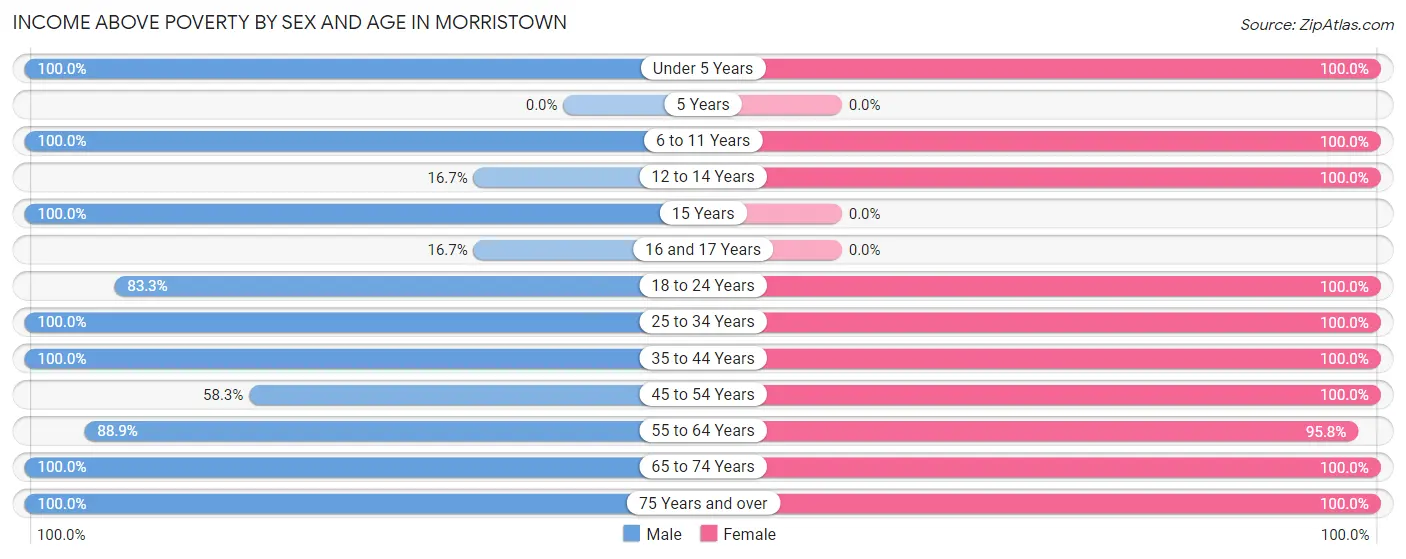
| Age Bracket | Male | Female |
| Under 5 Years | 11 (100.0%) | 5 (100.0%) |
| 5 Years | 0 (0.0%) | 0 (0.0%) |
| 6 to 11 Years | 13 (100.0%) | 6 (100.0%) |
| 12 to 14 Years | 1 (16.7%) | 13 (100.0%) |
| 15 Years | 1 (100.0%) | 0 (0.0%) |
| 16 and 17 Years | 1 (16.7%) | 0 (0.0%) |
| 18 to 24 Years | 25 (83.3%) | 1 (100.0%) |
| 25 to 34 Years | 12 (100.0%) | 11 (100.0%) |
| 35 to 44 Years | 7 (100.0%) | 23 (100.0%) |
| 45 to 54 Years | 7 (58.3%) | 12 (100.0%) |
| 55 to 64 Years | 16 (88.9%) | 46 (95.8%) |
| 65 to 74 Years | 6 (100.0%) | 10 (100.0%) |
| 75 Years and over | 10 (100.0%) | 16 (100.0%) |
| Total | 110 (83.3%) | 143 (98.6%) |
Income Below Poverty Among Married-Couple Families in Morristown
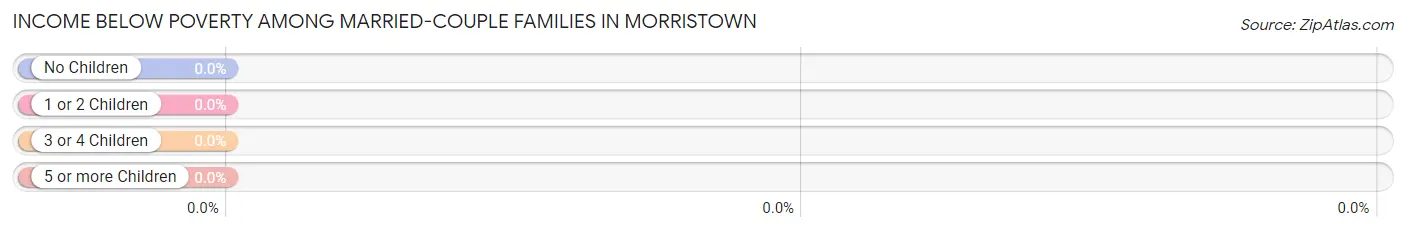
| Children | Above Poverty | Below Poverty |
| No Children | 32 (100.0%) | 0 (0.0%) |
| 1 or 2 Children | 0 (0.0%) | 0 (0.0%) |
| 3 or 4 Children | 12 (100.0%) | 0 (0.0%) |
| 5 or more Children | 0 (0.0%) | 0 (0.0%) |
| Total | 44 (100.0%) | 0 (0.0%) |
Income Below Poverty Among Single-Parent Households in Morristown
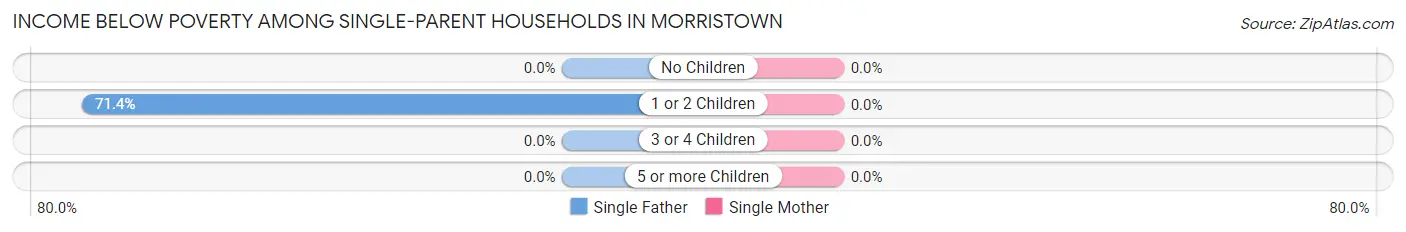
| Children | Single Father | Single Mother |
| No Children | 0 (0.0%) | 0 (0.0%) |
| 1 or 2 Children | 5 (71.4%) | 0 (0.0%) |
| 3 or 4 Children | 0 (0.0%) | 0 (0.0%) |
| 5 or more Children | 0 (0.0%) | 0 (0.0%) |
| Total | 5 (71.4%) | 0 (0.0%) |
Income Below Poverty Among Married-Couple vs Single-Parent Households in Morristown
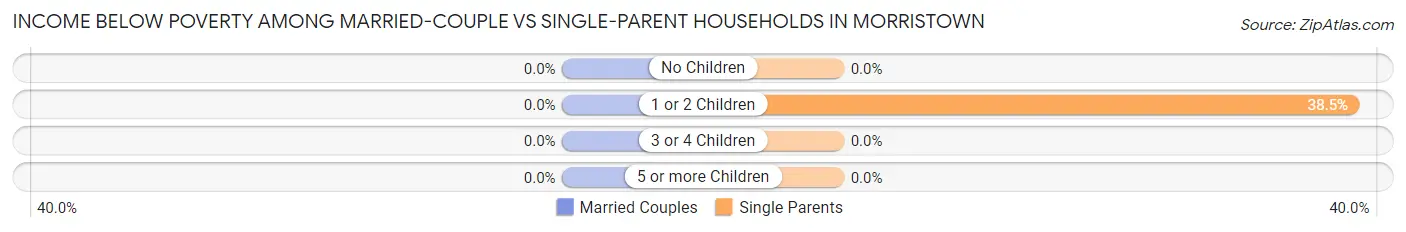
| Children | Married-Couple Families | Single-Parent Households |
| No Children | 0 (0.0%) | 0 (0.0%) |
| 1 or 2 Children | 0 (0.0%) | 5 (38.5%) |
| 3 or 4 Children | 0 (0.0%) | 0 (0.0%) |
| 5 or more Children | 0 (0.0%) | 0 (0.0%) |
| Total | 0 (0.0%) | 5 (25.0%) |
Employment Characteristics in Morristown
Employment by Class of Employer in Morristown
Among the 107 employed individuals in Morristown, private company employees (95 | 88.8%), not-for-profit organizations (7 | 6.5%), and state government employees (3 | 2.8%) make up the most common classes of employment.
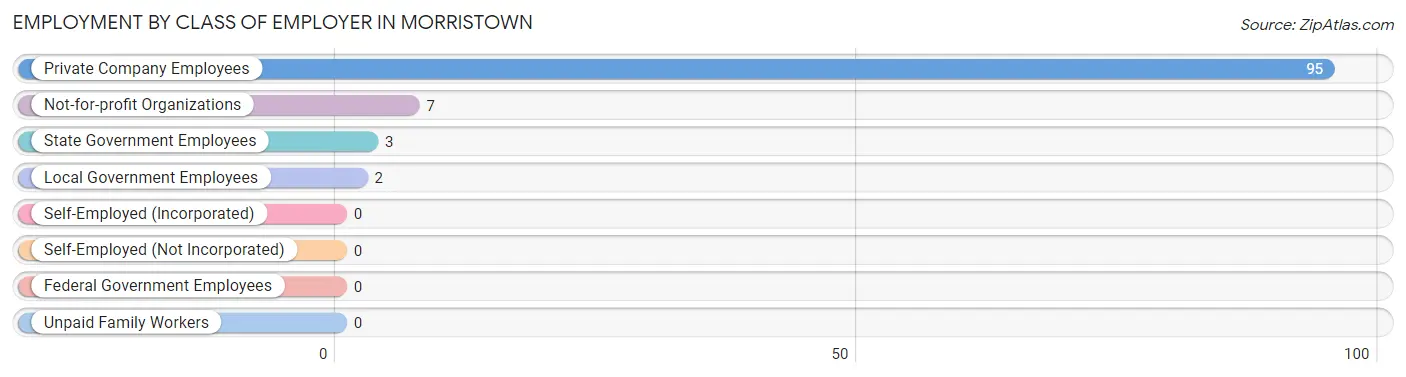
| Employer Class | # Employees | % Employees |
| Private Company Employees | 95 | 88.8% |
| Self-Employed (Incorporated) | 0 | 0.0% |
| Self-Employed (Not Incorporated) | 0 | 0.0% |
| Not-for-profit Organizations | 7 | 6.5% |
| Local Government Employees | 2 | 1.9% |
| State Government Employees | 3 | 2.8% |
| Federal Government Employees | 0 | 0.0% |
| Unpaid Family Workers | 0 | 0.0% |
| Total | 107 | 100.0% |
Employment Status by Age in Morristown
According to the labor force statistics for Morristown, out of the total population over 16 years of age (222), 61.7% or 137 individuals are in the labor force, with 21.9% or 30 of them unemployed. The age group with the highest labor force participation rate is 20 to 24 years, with 100.0% or 26 individuals in the labor force. Within the labor force, the 20 to 24 years age range has the highest percentage of unemployed individuals, with 96.2% or 25 of them being unemployed.
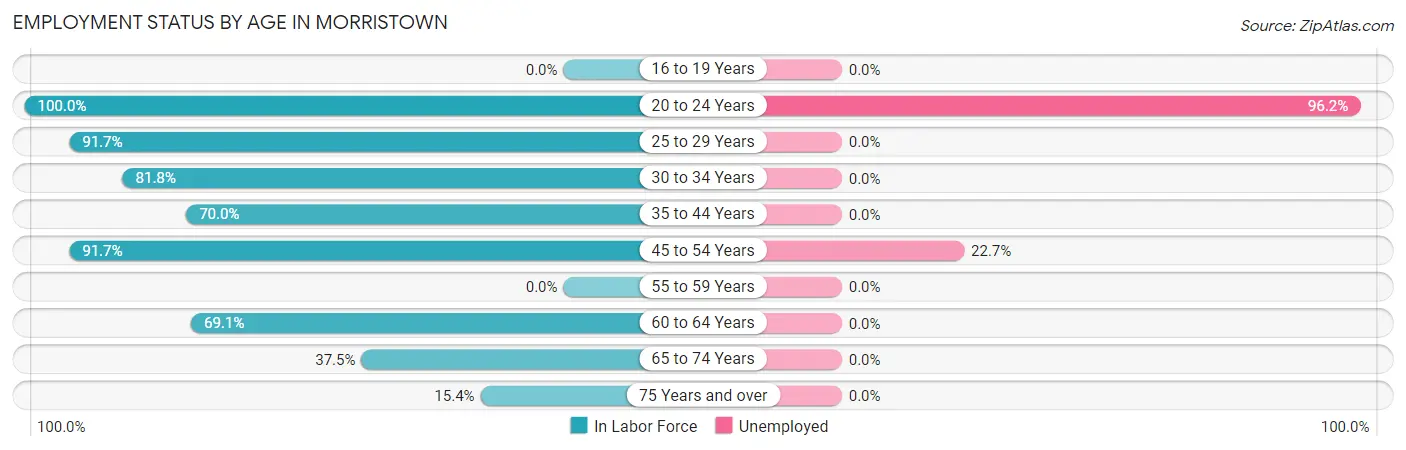
| Age Bracket | In Labor Force | Unemployed |
| 16 to 19 Years | 0 (0.0%) | 0 (0.0%) |
| 20 to 24 Years | 26 (100.0%) | 25 (96.2%) |
| 25 to 29 Years | 11 (91.7%) | 0 (0.0%) |
| 30 to 34 Years | 9 (81.8%) | 0 (0.0%) |
| 35 to 44 Years | 21 (70.0%) | 0 (0.0%) |
| 45 to 54 Years | 22 (91.7%) | 5 (22.7%) |
| 55 to 59 Years | 0 (0.0%) | 0 (0.0%) |
| 60 to 64 Years | 38 (69.1%) | 0 (0.0%) |
| 65 to 74 Years | 6 (37.5%) | 0 (0.0%) |
| 75 Years and over | 4 (15.4%) | 0 (0.0%) |
| Total | 137 (61.7%) | 30 (21.9%) |
Employment Status by Educational Attainment in Morristown
According to labor force statistics for Morristown, 70.6% of individuals (101) out of the total population between 25 and 64 years of age (143) are in the labor force, with 5.0% or 5 of them being unemployed. The group with the highest labor force participation rate are those with the educational attainment of college / associate degree, with 88.1% or 37 individuals in the labor force. Within the labor force, individuals with high school diploma education have the highest percentage of unemployment, with 17.9% or 5 of them being unemployed.
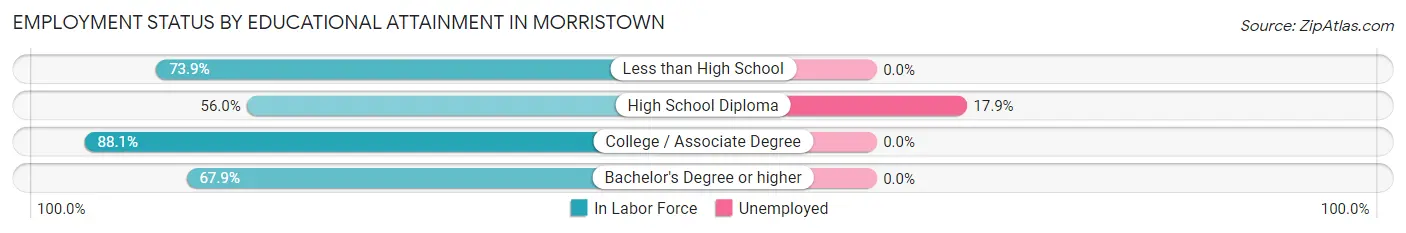
| Educational Attainment | In Labor Force | Unemployed |
| Less than High School | 17 (73.9%) | 0 (0.0%) |
| High School Diploma | 28 (56.0%) | 9 (17.9%) |
| College / Associate Degree | 37 (88.1%) | 0 (0.0%) |
| Bachelor's Degree or higher | 19 (67.9%) | 0 (0.0%) |
| Total | 101 (70.6%) | 7 (5.0%) |
Employment Occupations by Sex in Morristown
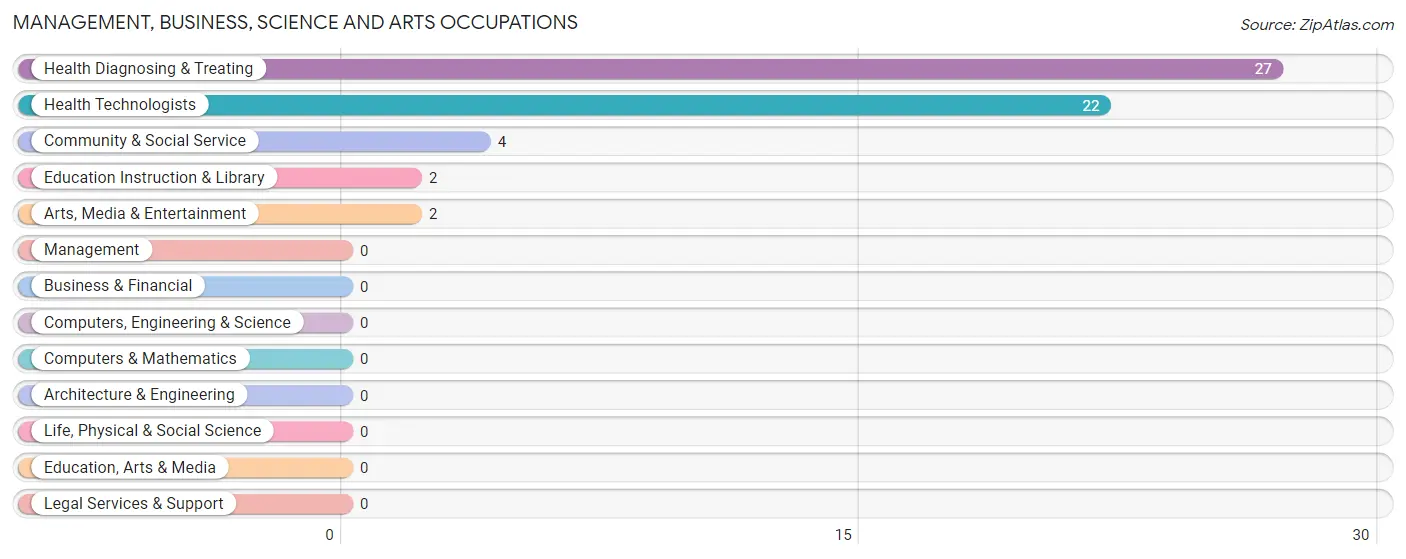
Management, Business, Science and Arts Occupations
The most common Management, Business, Science and Arts occupations in Morristown are Health Diagnosing & Treating (27 | 25.2%), Health Technologists (22 | 20.6%), Community & Social Service (4 | 3.7%), Education Instruction & Library (2 | 1.9%), and Arts, Media & Entertainment (2 | 1.9%).
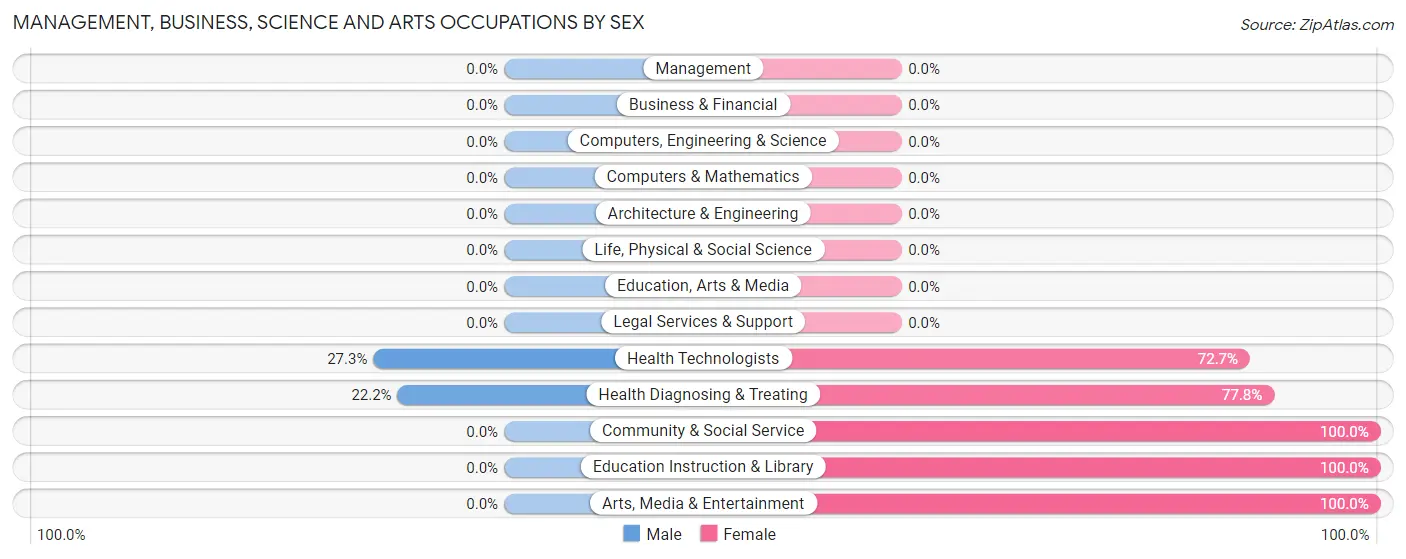
Management, Business, Science and Arts Occupations by Sex
Within the Management, Business, Science and Arts occupations in Morristown, the most male-oriented occupations are Health Technologists (27.3%), and Health Diagnosing & Treating (22.2%), while the most female-oriented occupations are Community & Social Service (100.0%), Education Instruction & Library (100.0%), and Arts, Media & Entertainment (100.0%).
| Occupation | Male | Female |
| Management | 0 (0.0%) | 0 (0.0%) |
| Business & Financial | 0 (0.0%) | 0 (0.0%) |
| Computers, Engineering & Science | 0 (0.0%) | 0 (0.0%) |
| Computers & Mathematics | 0 (0.0%) | 0 (0.0%) |
| Architecture & Engineering | 0 (0.0%) | 0 (0.0%) |
| Life, Physical & Social Science | 0 (0.0%) | 0 (0.0%) |
| Community & Social Service | 0 (0.0%) | 4 (100.0%) |
| Education, Arts & Media | 0 (0.0%) | 0 (0.0%) |
| Legal Services & Support | 0 (0.0%) | 0 (0.0%) |
| Education Instruction & Library | 0 (0.0%) | 2 (100.0%) |
| Arts, Media & Entertainment | 0 (0.0%) | 2 (100.0%) |
| Health Diagnosing & Treating | 6 (22.2%) | 21 (77.8%) |
| Health Technologists | 6 (27.3%) | 16 (72.7%) |
| Total (Category) | 6 (19.4%) | 25 (80.6%) |
| Total (Overall) | 31 (29.0%) | 76 (71.0%) |
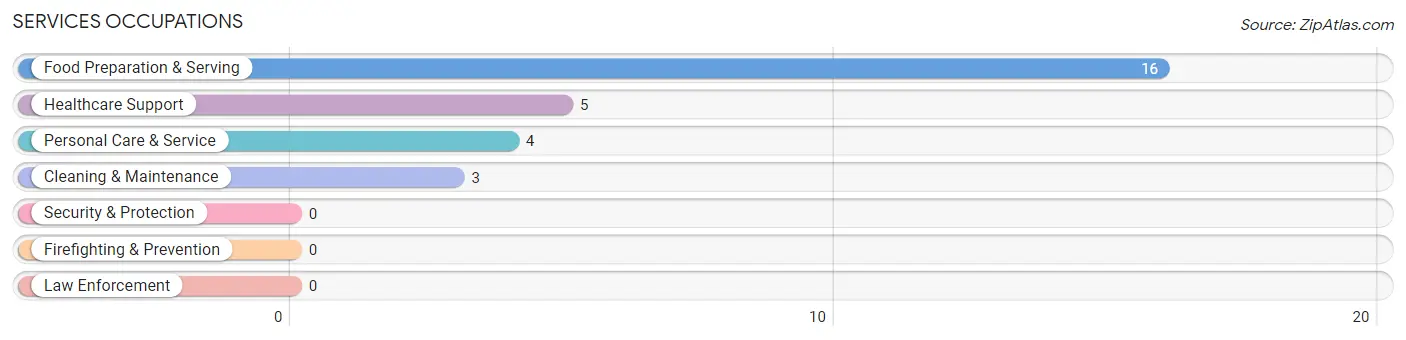
Services Occupations
The most common Services occupations in Morristown are Food Preparation & Serving (16 | 14.9%), Healthcare Support (5 | 4.7%), Personal Care & Service (4 | 3.7%), and Cleaning & Maintenance (3 | 2.8%).
Services Occupations by Sex
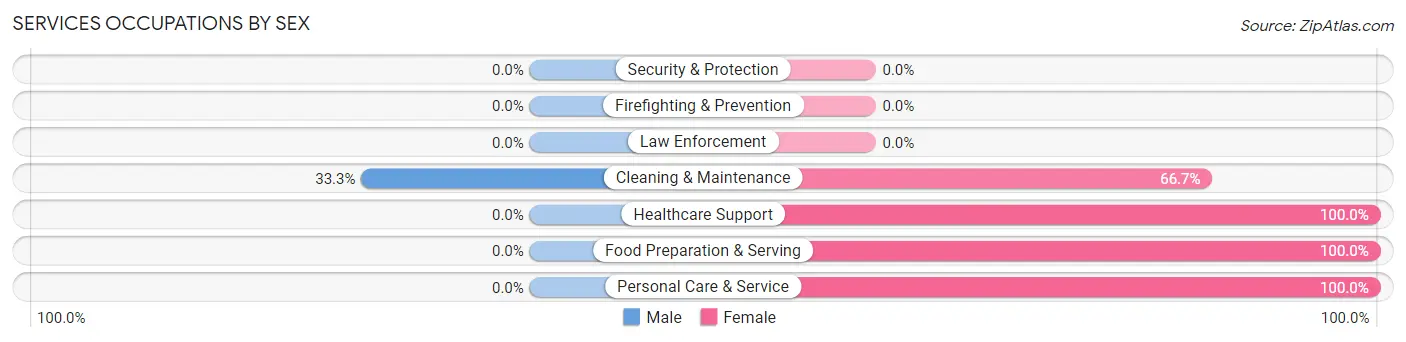
| Occupation | Male | Female |
| Healthcare Support | 0 (0.0%) | 5 (100.0%) |
| Security & Protection | 0 (0.0%) | 0 (0.0%) |
| Firefighting & Prevention | 0 (0.0%) | 0 (0.0%) |
| Law Enforcement | 0 (0.0%) | 0 (0.0%) |
| Food Preparation & Serving | 0 (0.0%) | 16 (100.0%) |
| Cleaning & Maintenance | 1 (33.3%) | 2 (66.7%) |
| Personal Care & Service | 0 (0.0%) | 4 (100.0%) |
| Total (Category) | 1 (3.6%) | 27 (96.4%) |
| Total (Overall) | 31 (29.0%) | 76 (71.0%) |
Sales and Office Occupations
The most common Sales and Office occupations in Morristown are , and Sales & Related (3 | 2.8%).
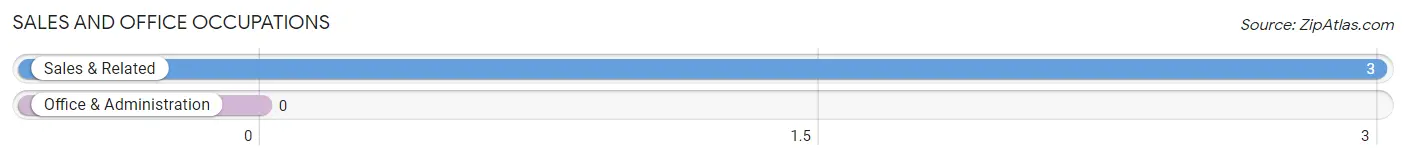
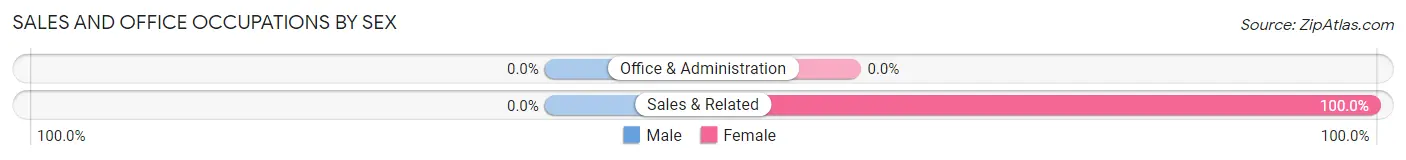
Sales and Office Occupations by Sex
| Occupation | Male | Female |
| Sales & Related | 0 (0.0%) | 3 (100.0%) |
| Office & Administration | 0 (0.0%) | 0 (0.0%) |
| Total (Category) | 0 (0.0%) | 3 (100.0%) |
| Total (Overall) | 31 (29.0%) | 76 (71.0%) |
Natural Resources, Construction and Maintenance Occupations
The most common Natural Resources, Construction and Maintenance occupations in Morristown are Construction & Extraction (12 | 11.2%), and Installation, Maintenance & Repair (3 | 2.8%).
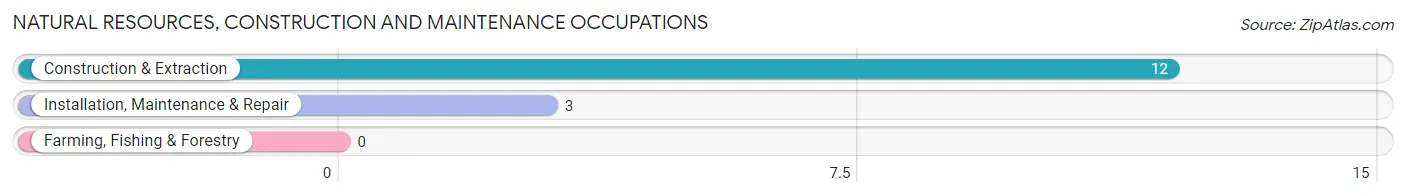
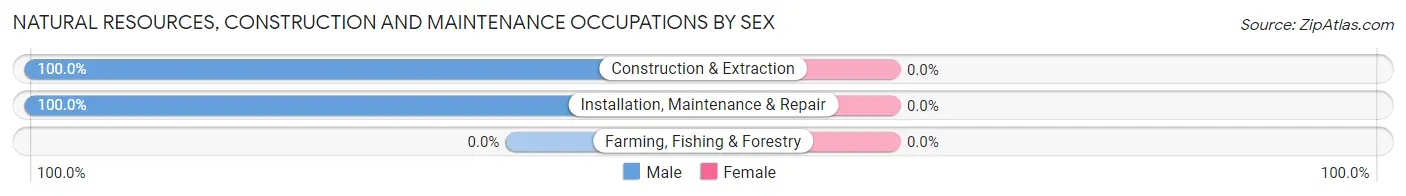
Natural Resources, Construction and Maintenance Occupations by Sex
| Occupation | Male | Female |
| Farming, Fishing & Forestry | 0 (0.0%) | 0 (0.0%) |
| Construction & Extraction | 12 (100.0%) | 0 (0.0%) |
| Installation, Maintenance & Repair | 3 (100.0%) | 0 (0.0%) |
| Total (Category) | 15 (100.0%) | 0 (0.0%) |
| Total (Overall) | 31 (29.0%) | 76 (71.0%) |
Production, Transportation and Moving Occupations
The most common Production, Transportation and Moving occupations in Morristown are Transportation (25 | 23.4%), and Production (5 | 4.7%).
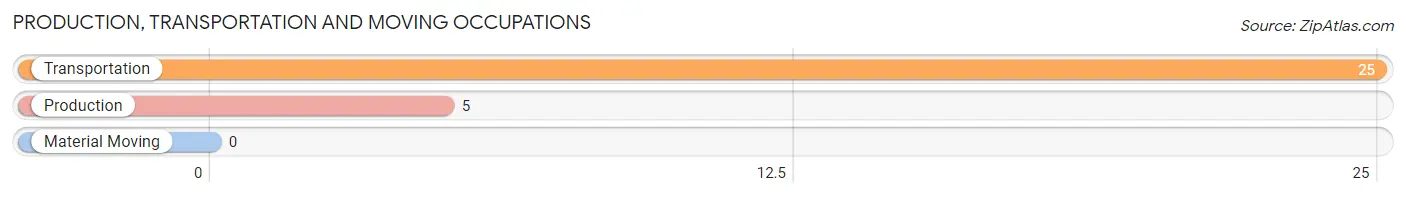
Production, Transportation and Moving Occupations by Sex
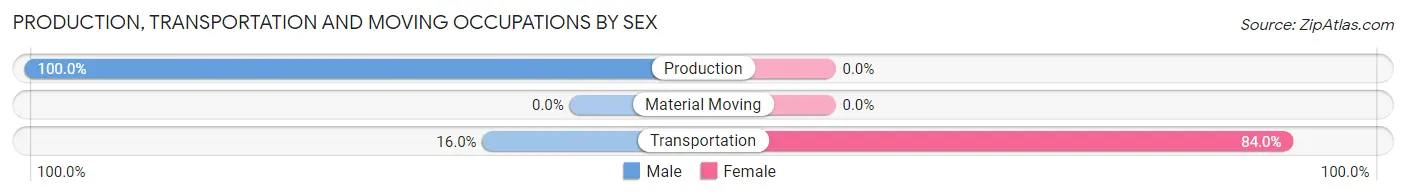
| Occupation | Male | Female |
| Production | 5 (100.0%) | 0 (0.0%) |
| Transportation | 4 (16.0%) | 21 (84.0%) |
| Material Moving | 0 (0.0%) | 0 (0.0%) |
| Total (Category) | 9 (30.0%) | 21 (70.0%) |
| Total (Overall) | 31 (29.0%) | 76 (71.0%) |
Employment Industries by Sex in Morristown
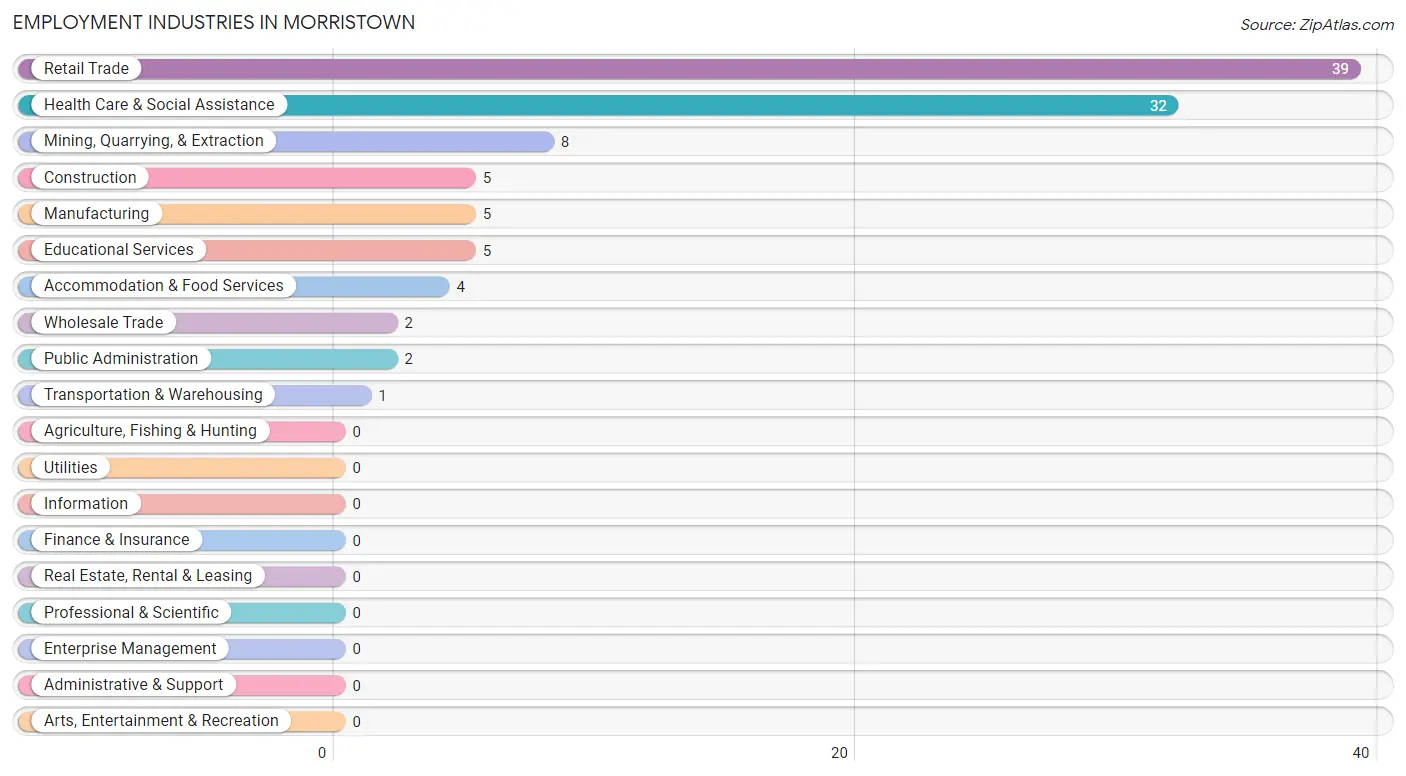
Employment Industries in Morristown
The major employment industries in Morristown include Retail Trade (39 | 36.4%), Health Care & Social Assistance (32 | 29.9%), Mining, Quarrying, & Extraction (8 | 7.5%), Construction (5 | 4.7%), and Manufacturing (5 | 4.7%).
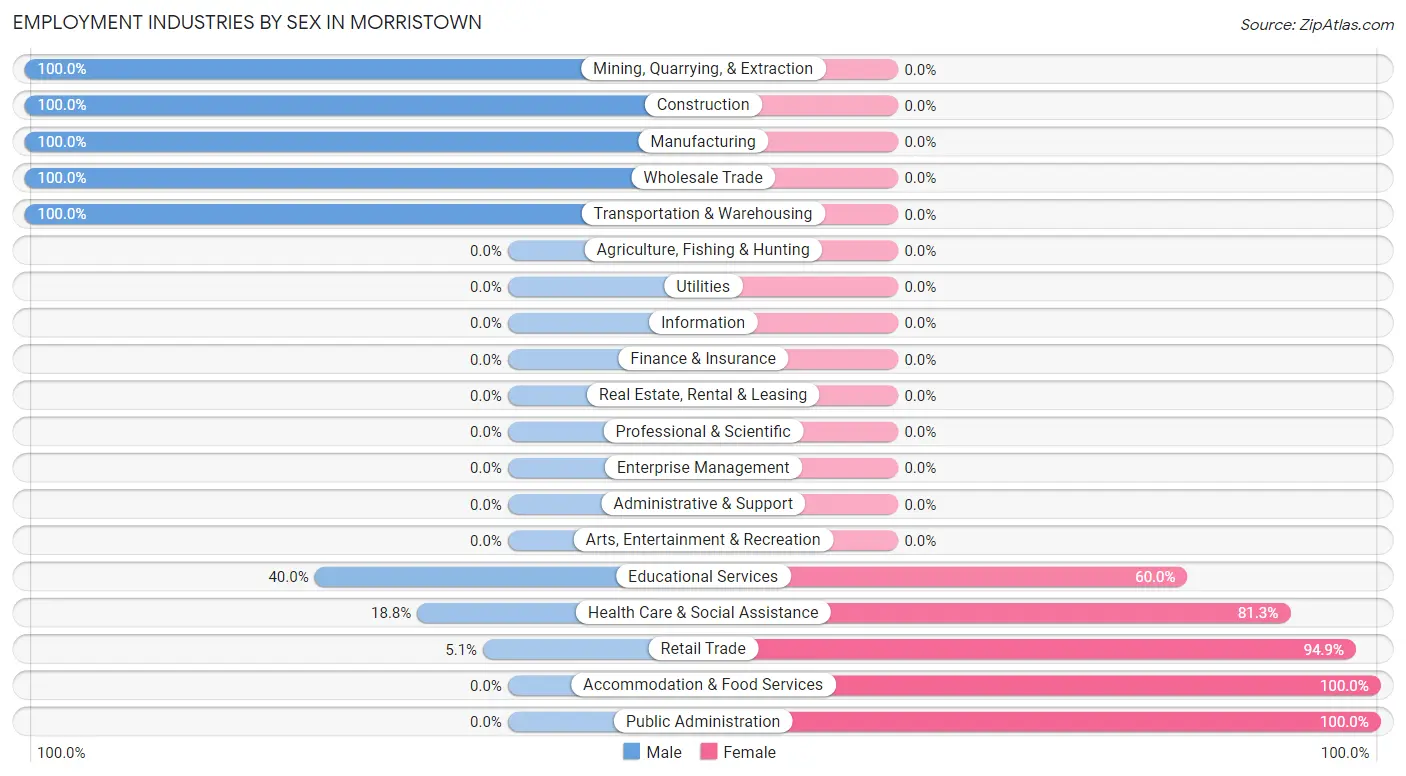
Employment Industries by Sex in Morristown
The Morristown industries that see more men than women are Mining, Quarrying, & Extraction (100.0%), Construction (100.0%), and Manufacturing (100.0%), whereas the industries that tend to have a higher number of women are Accommodation & Food Services (100.0%), Public Administration (100.0%), and Retail Trade (94.9%).
| Industry | Male | Female |
| Agriculture, Fishing & Hunting | 0 (0.0%) | 0 (0.0%) |
| Mining, Quarrying, & Extraction | 8 (100.0%) | 0 (0.0%) |
| Construction | 5 (100.0%) | 0 (0.0%) |
| Manufacturing | 5 (100.0%) | 0 (0.0%) |
| Wholesale Trade | 2 (100.0%) | 0 (0.0%) |
| Retail Trade | 2 (5.1%) | 37 (94.9%) |
| Transportation & Warehousing | 1 (100.0%) | 0 (0.0%) |
| Utilities | 0 (0.0%) | 0 (0.0%) |
| Information | 0 (0.0%) | 0 (0.0%) |
| Finance & Insurance | 0 (0.0%) | 0 (0.0%) |
| Real Estate, Rental & Leasing | 0 (0.0%) | 0 (0.0%) |
| Professional & Scientific | 0 (0.0%) | 0 (0.0%) |
| Enterprise Management | 0 (0.0%) | 0 (0.0%) |
| Administrative & Support | 0 (0.0%) | 0 (0.0%) |
| Educational Services | 2 (40.0%) | 3 (60.0%) |
| Health Care & Social Assistance | 6 (18.8%) | 26 (81.2%) |
| Arts, Entertainment & Recreation | 0 (0.0%) | 0 (0.0%) |
| Accommodation & Food Services | 0 (0.0%) | 4 (100.0%) |
| Public Administration | 0 (0.0%) | 2 (100.0%) |
| Total | 31 (29.0%) | 76 (71.0%) |
Education in Morristown
School Enrollment in Morristown
The most common levels of schooling among the 48 students in Morristown are middle school (19 | 39.6%), high school (17 | 35.4%), and kindergarten (7 | 14.6%).
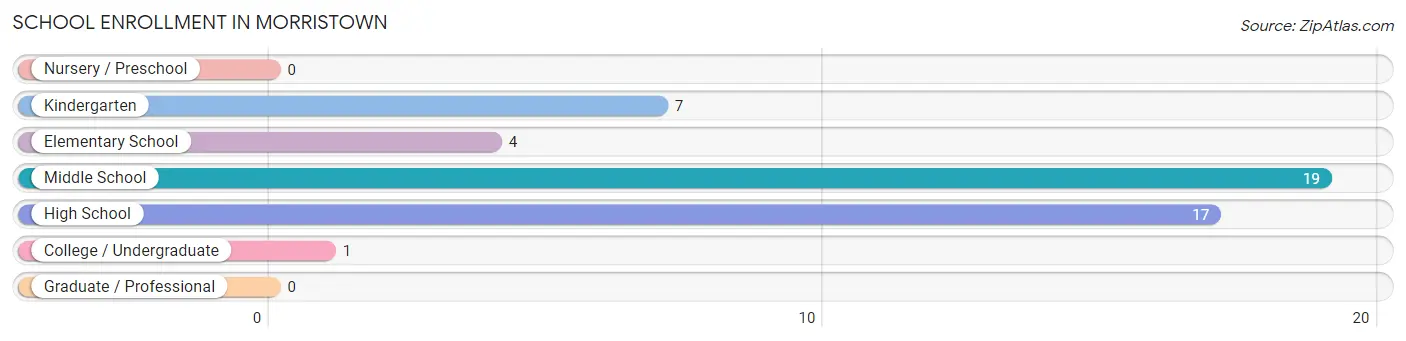
| School Level | # Students | % Students |
| Nursery / Preschool | 0 | 0.0% |
| Kindergarten | 7 | 14.6% |
| Elementary School | 4 | 8.3% |
| Middle School | 19 | 39.6% |
| High School | 17 | 35.4% |
| College / Undergraduate | 1 | 2.1% |
| Graduate / Professional | 0 | 0.0% |
| Total | 48 | 100.0% |
School Enrollment by Age by Funding Source in Morristown
Out of a total of 48 students who are enrolled in schools in Morristown, 2 (4.2%) attend a private institution, while the remaining 46 (95.8%) are enrolled in public schools. The age group of 35 years and over has the highest likelihood of being enrolled in private schools, with 1 (100.0% in the age bracket) enrolled. Conversely, the age group of 5 to 9 year old has the lowest likelihood of being enrolled in a private school, with 11 (100.0% in the age bracket) attending a public institution.
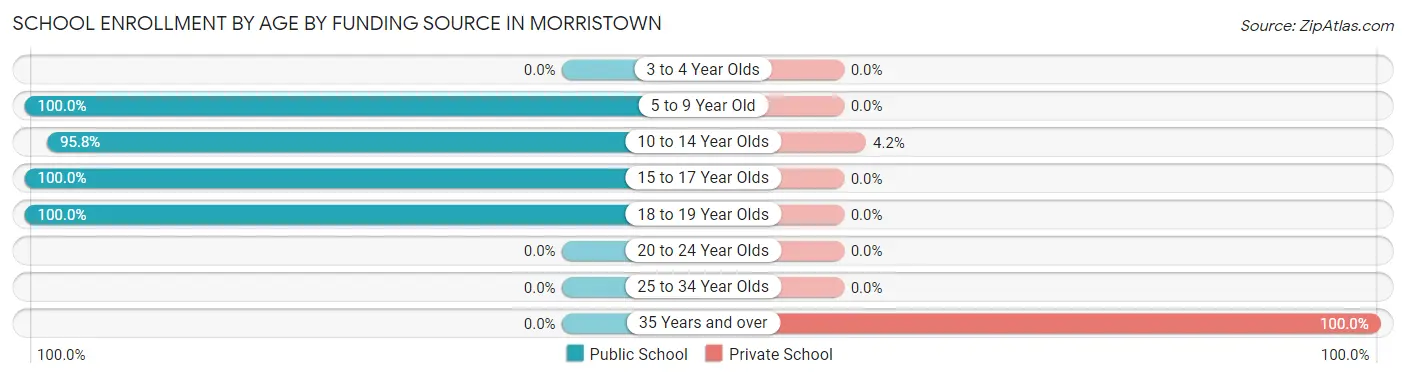
| Age Bracket | Public School | Private School |
| 3 to 4 Year Olds | 0 (0.0%) | 0 (0.0%) |
| 5 to 9 Year Old | 11 (100.0%) | 0 (0.0%) |
| 10 to 14 Year Olds | 23 (95.8%) | 1 (4.2%) |
| 15 to 17 Year Olds | 7 (100.0%) | 0 (0.0%) |
| 18 to 19 Year Olds | 5 (100.0%) | 0 (0.0%) |
| 20 to 24 Year Olds | 0 (0.0%) | 0 (0.0%) |
| 25 to 34 Year Olds | 0 (0.0%) | 0 (0.0%) |
| 35 Years and over | 0 (0.0%) | 1 (100.0%) |
| Total | 46 (95.8%) | 2 (4.2%) |
Educational Attainment by Field of Study in Morristown
Science & technology (14 | 45.2%), bio, nature & agricultural (6 | 19.4%), education (5 | 16.1%), communications (4 | 12.9%), and engineering (2 | 6.5%) are the most common fields of study among 31 individuals in Morristown who have obtained a bachelor's degree or higher.
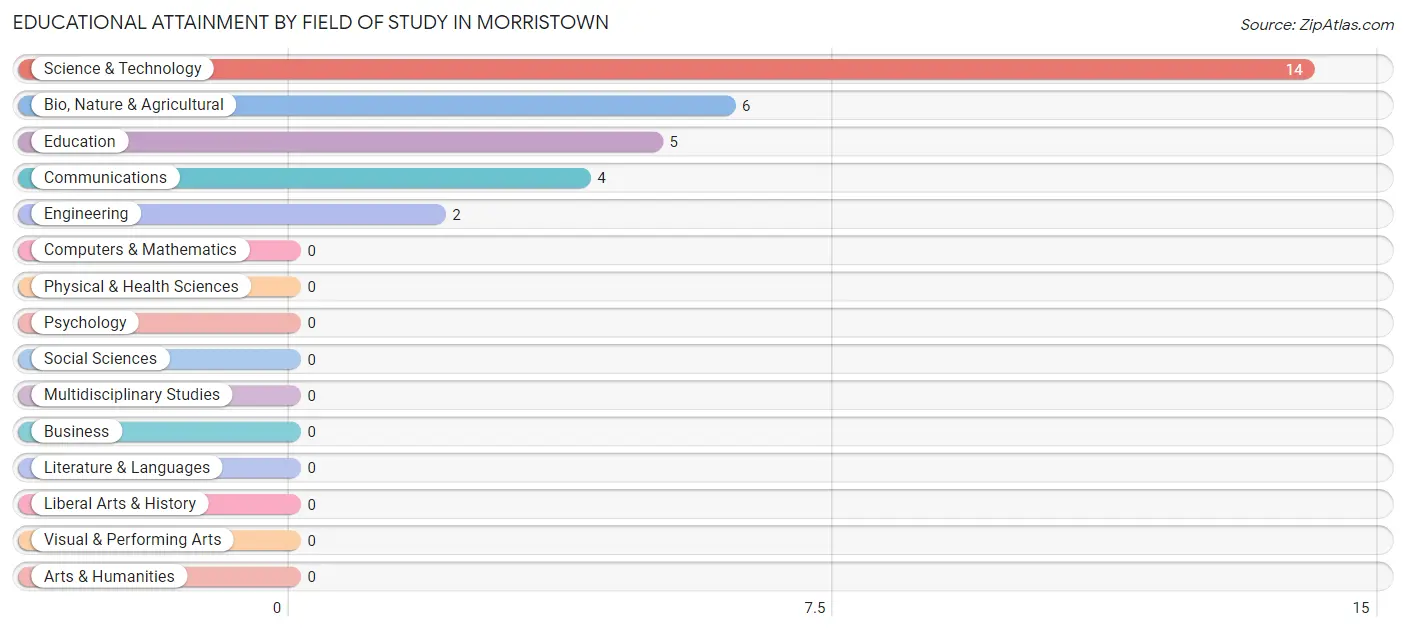
| Field of Study | # Graduates | % Graduates |
| Computers & Mathematics | 0 | 0.0% |
| Bio, Nature & Agricultural | 6 | 19.4% |
| Physical & Health Sciences | 0 | 0.0% |
| Psychology | 0 | 0.0% |
| Social Sciences | 0 | 0.0% |
| Engineering | 2 | 6.5% |
| Multidisciplinary Studies | 0 | 0.0% |
| Science & Technology | 14 | 45.2% |
| Business | 0 | 0.0% |
| Education | 5 | 16.1% |
| Literature & Languages | 0 | 0.0% |
| Liberal Arts & History | 0 | 0.0% |
| Visual & Performing Arts | 0 | 0.0% |
| Communications | 4 | 12.9% |
| Arts & Humanities | 0 | 0.0% |
| Total | 31 | 100.0% |
Transportation & Commute in Morristown
Vehicle Availability by Sex in Morristown
The most prevalent vehicle ownership categories in Morristown are males with 2 vehicles (16, accounting for 51.6%) and females with 2 vehicles (62, making up 21.0%).
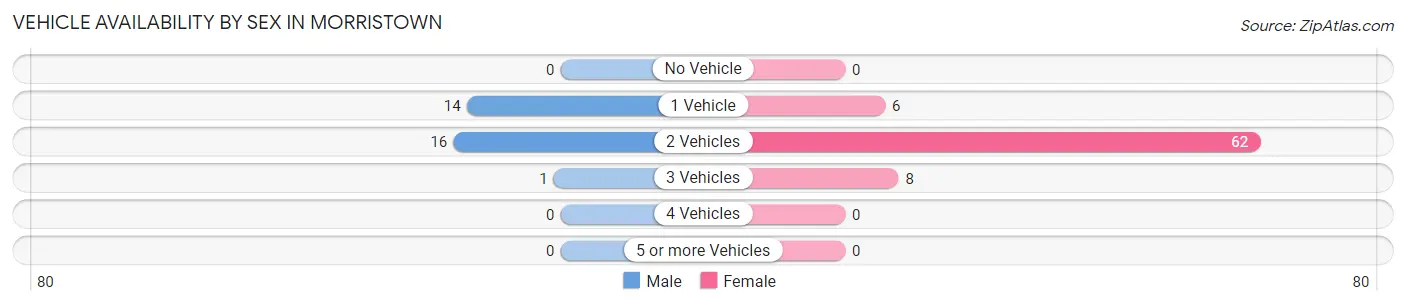
| Vehicles Available | Male | Female |
| No Vehicle | 0 (0.0%) | 0 (0.0%) |
| 1 Vehicle | 14 (45.2%) | 6 (7.9%) |
| 2 Vehicles | 16 (51.6%) | 62 (81.6%) |
| 3 Vehicles | 1 (3.2%) | 8 (10.5%) |
| 4 Vehicles | 0 (0.0%) | 0 (0.0%) |
| 5 or more Vehicles | 0 (0.0%) | 0 (0.0%) |
| Total | 31 (100.0%) | 76 (100.0%) |
Commute Time in Morristown
The most frequently occuring commute durations in Morristown are 10 to 14 minutes (34 commuters, 31.8%), 15 to 19 minutes (23 commuters, 21.5%), and 25 to 29 minutes (18 commuters, 16.8%).
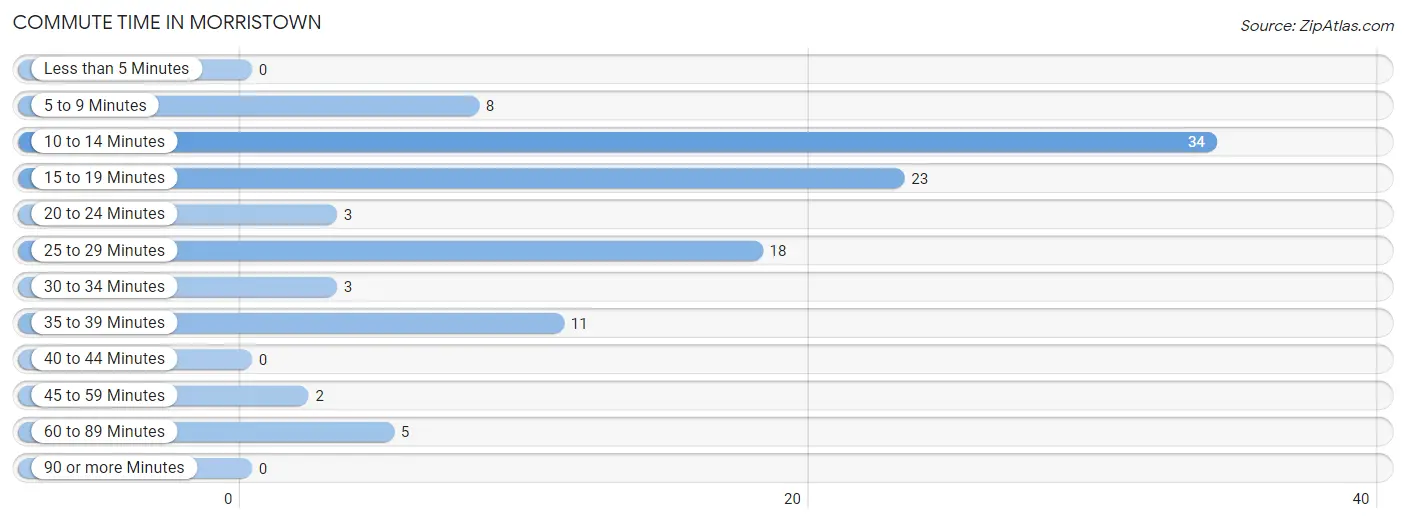
| Commute Time | # Commuters | % Commuters |
| Less than 5 Minutes | 0 | 0.0% |
| 5 to 9 Minutes | 8 | 7.5% |
| 10 to 14 Minutes | 34 | 31.8% |
| 15 to 19 Minutes | 23 | 21.5% |
| 20 to 24 Minutes | 3 | 2.8% |
| 25 to 29 Minutes | 18 | 16.8% |
| 30 to 34 Minutes | 3 | 2.8% |
| 35 to 39 Minutes | 11 | 10.3% |
| 40 to 44 Minutes | 0 | 0.0% |
| 45 to 59 Minutes | 2 | 1.9% |
| 60 to 89 Minutes | 5 | 4.7% |
| 90 or more Minutes | 0 | 0.0% |
Commute Time by Sex in Morristown
The most common commute times in Morristown are 10 to 14 minutes (7 commuters, 22.6%) for males and 10 to 14 minutes (27 commuters, 35.5%) for females.
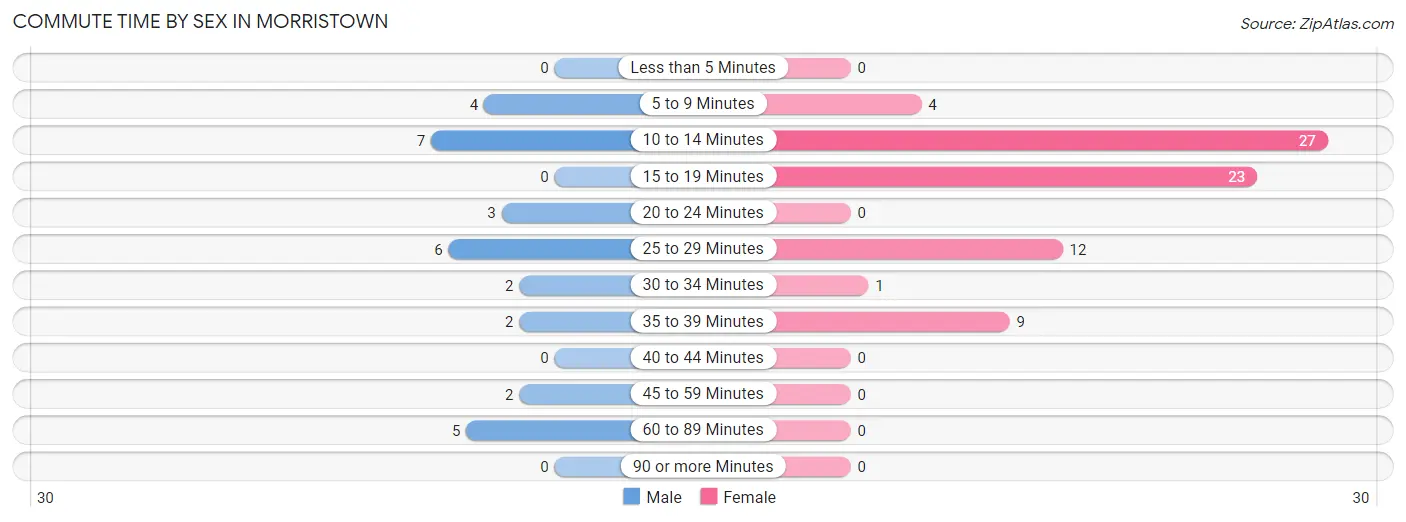
| Commute Time | Male | Female |
| Less than 5 Minutes | 0 (0.0%) | 0 (0.0%) |
| 5 to 9 Minutes | 4 (12.9%) | 4 (5.3%) |
| 10 to 14 Minutes | 7 (22.6%) | 27 (35.5%) |
| 15 to 19 Minutes | 0 (0.0%) | 23 (30.3%) |
| 20 to 24 Minutes | 3 (9.7%) | 0 (0.0%) |
| 25 to 29 Minutes | 6 (19.4%) | 12 (15.8%) |
| 30 to 34 Minutes | 2 (6.5%) | 1 (1.3%) |
| 35 to 39 Minutes | 2 (6.5%) | 9 (11.8%) |
| 40 to 44 Minutes | 0 (0.0%) | 0 (0.0%) |
| 45 to 59 Minutes | 2 (6.5%) | 0 (0.0%) |
| 60 to 89 Minutes | 5 (16.1%) | 0 (0.0%) |
| 90 or more Minutes | 0 (0.0%) | 0 (0.0%) |
Time of Departure to Work by Sex in Morristown
The most frequent times of departure to work in Morristown are 6:00 AM to 6:29 AM (9, 29.0%) for males and 8:30 AM to 8:59 AM (20, 26.3%) for females.
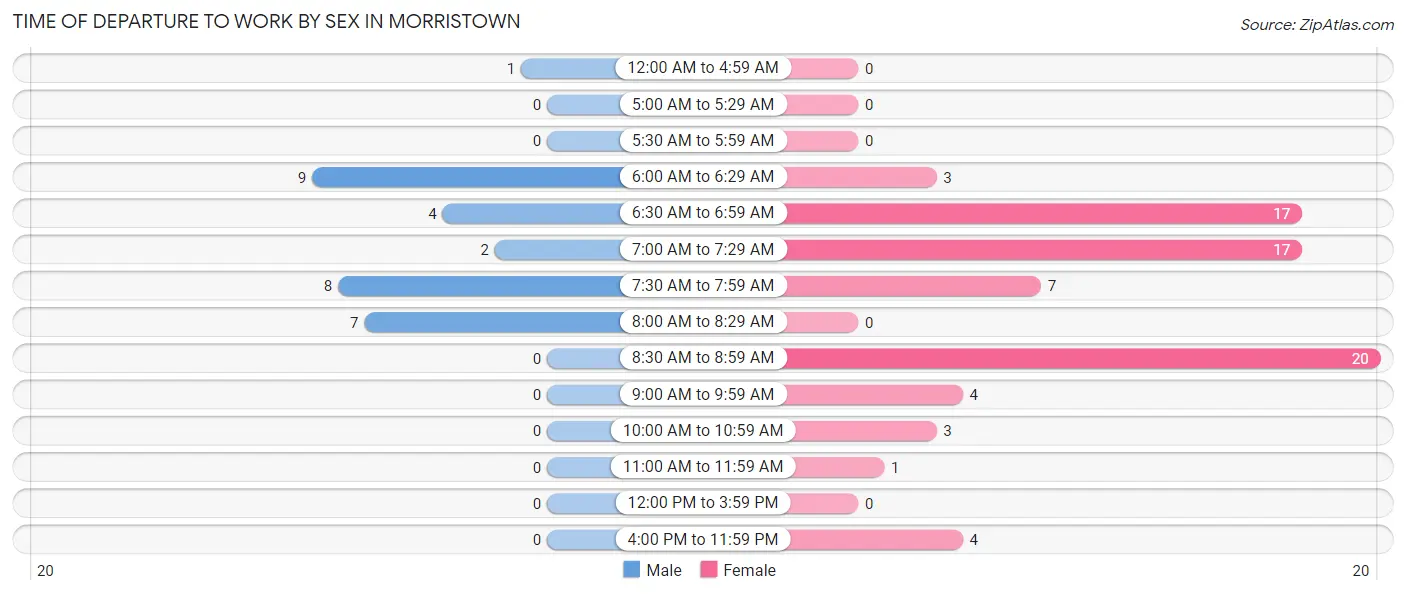
| Time of Departure | Male | Female |
| 12:00 AM to 4:59 AM | 1 (3.2%) | 0 (0.0%) |
| 5:00 AM to 5:29 AM | 0 (0.0%) | 0 (0.0%) |
| 5:30 AM to 5:59 AM | 0 (0.0%) | 0 (0.0%) |
| 6:00 AM to 6:29 AM | 9 (29.0%) | 3 (4.0%) |
| 6:30 AM to 6:59 AM | 4 (12.9%) | 17 (22.4%) |
| 7:00 AM to 7:29 AM | 2 (6.5%) | 17 (22.4%) |
| 7:30 AM to 7:59 AM | 8 (25.8%) | 7 (9.2%) |
| 8:00 AM to 8:29 AM | 7 (22.6%) | 0 (0.0%) |
| 8:30 AM to 8:59 AM | 0 (0.0%) | 20 (26.3%) |
| 9:00 AM to 9:59 AM | 0 (0.0%) | 4 (5.3%) |
| 10:00 AM to 10:59 AM | 0 (0.0%) | 3 (4.0%) |
| 11:00 AM to 11:59 AM | 0 (0.0%) | 1 (1.3%) |
| 12:00 PM to 3:59 PM | 0 (0.0%) | 0 (0.0%) |
| 4:00 PM to 11:59 PM | 0 (0.0%) | 4 (5.3%) |
| Total | 31 (100.0%) | 76 (100.0%) |
Housing Occupancy in Morristown
Occupancy by Ownership in Morristown
Of the total 91 dwellings in Morristown, owner-occupied units account for 64 (70.3%), while renter-occupied units make up 27 (29.7%).
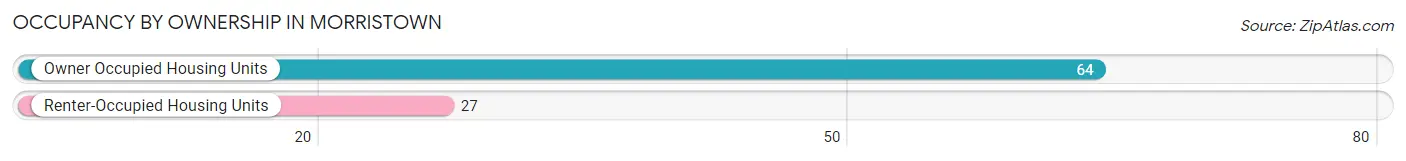
| Occupancy | # Housing Units | % Housing Units |
| Owner Occupied Housing Units | 64 | 70.3% |
| Renter-Occupied Housing Units | 27 | 29.7% |
| Total Occupied Housing Units | 91 | 100.0% |
Occupancy by Household Size in Morristown
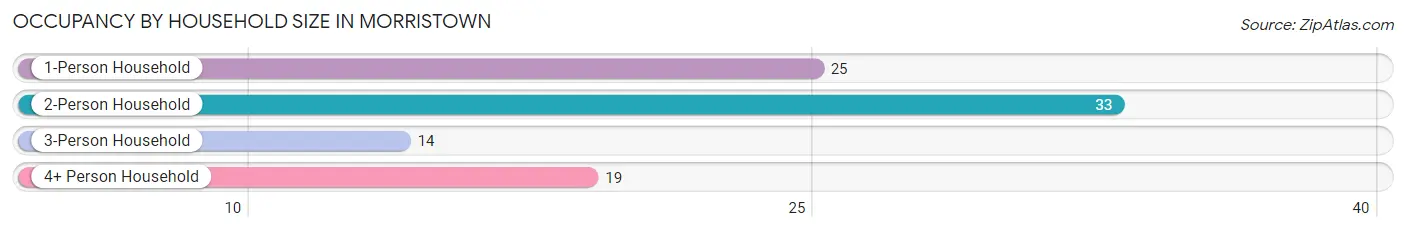
| Household Size | # Housing Units | % Housing Units |
| 1-Person Household | 25 | 27.5% |
| 2-Person Household | 33 | 36.3% |
| 3-Person Household | 14 | 15.4% |
| 4+ Person Household | 19 | 20.9% |
| Total Housing Units | 91 | 100.0% |
Occupancy by Ownership by Household Size in Morristown
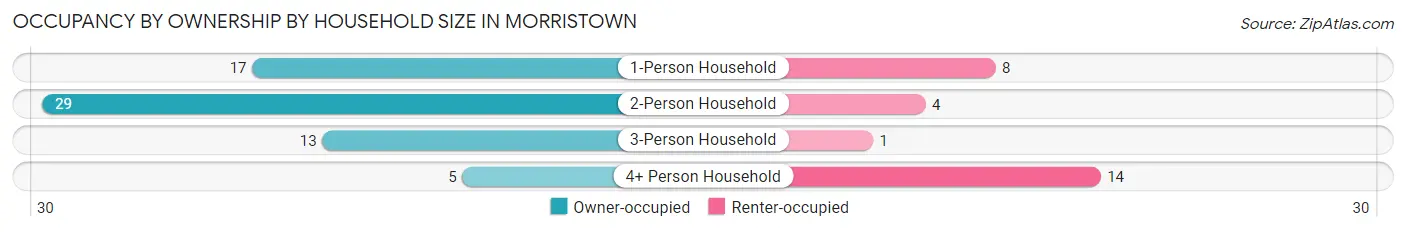
| Household Size | Owner-occupied | Renter-occupied |
| 1-Person Household | 17 (68.0%) | 8 (32.0%) |
| 2-Person Household | 29 (87.9%) | 4 (12.1%) |
| 3-Person Household | 13 (92.9%) | 1 (7.1%) |
| 4+ Person Household | 5 (26.3%) | 14 (73.7%) |
| Total Housing Units | 64 (70.3%) | 27 (29.7%) |
Occupancy by Educational Attainment in Morristown
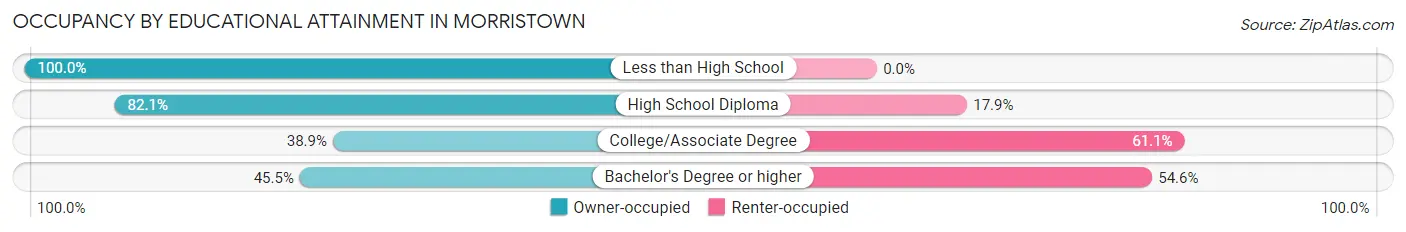
| Household Size | Owner-occupied | Renter-occupied |
| Less than High School | 6 (100.0%) | 0 (0.0%) |
| High School Diploma | 46 (82.1%) | 10 (17.9%) |
| College/Associate Degree | 7 (38.9%) | 11 (61.1%) |
| Bachelor's Degree or higher | 5 (45.5%) | 6 (54.5%) |
Occupancy by Age of Householder in Morristown
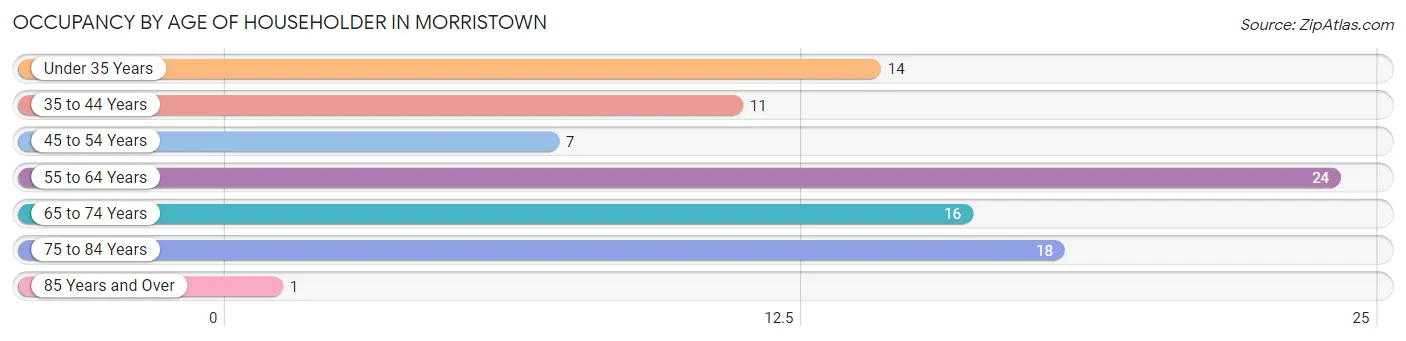
| Age Bracket | # Households | % Households |
| Under 35 Years | 14 | 15.4% |
| 35 to 44 Years | 11 | 12.1% |
| 45 to 54 Years | 7 | 7.7% |
| 55 to 64 Years | 24 | 26.4% |
| 65 to 74 Years | 16 | 17.6% |
| 75 to 84 Years | 18 | 19.8% |
| 85 Years and Over | 1 | 1.1% |
| Total | 91 | 100.0% |
Housing Finances in Morristown
Median Income by Occupancy in Morristown
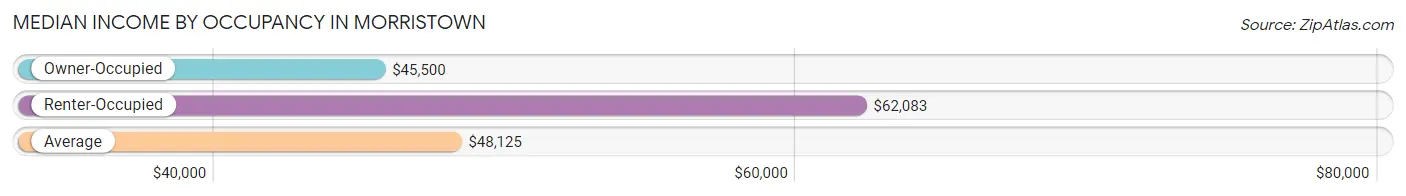
| Occupancy Type | # Households | Median Income |
| Owner-Occupied | 64 (70.3%) | $45,500 |
| Renter-Occupied | 27 (29.7%) | $62,083 |
| Average | 91 (100.0%) | $48,125 |
Occupancy by Householder Income Bracket in Morristown
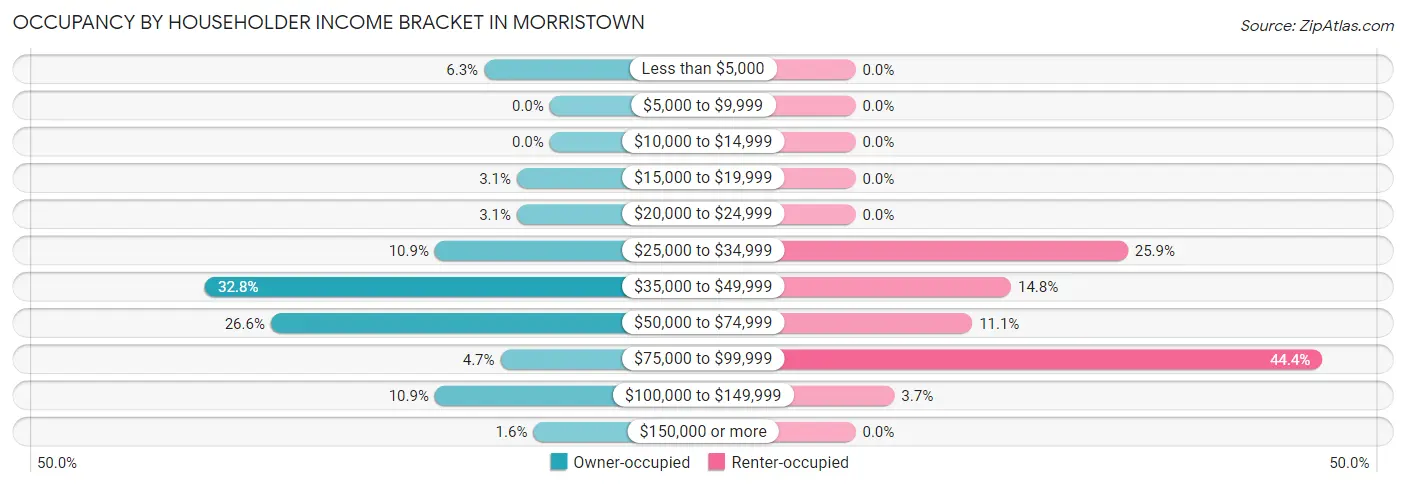
| Income Bracket | Owner-occupied | Renter-occupied |
| Less than $5,000 | 4 (6.2%) | 0 (0.0%) |
| $5,000 to $9,999 | 0 (0.0%) | 0 (0.0%) |
| $10,000 to $14,999 | 0 (0.0%) | 0 (0.0%) |
| $15,000 to $19,999 | 2 (3.1%) | 0 (0.0%) |
| $20,000 to $24,999 | 2 (3.1%) | 0 (0.0%) |
| $25,000 to $34,999 | 7 (10.9%) | 7 (25.9%) |
| $35,000 to $49,999 | 21 (32.8%) | 4 (14.8%) |
| $50,000 to $74,999 | 17 (26.6%) | 3 (11.1%) |
| $75,000 to $99,999 | 3 (4.7%) | 12 (44.4%) |
| $100,000 to $149,999 | 7 (10.9%) | 1 (3.7%) |
| $150,000 or more | 1 (1.6%) | 0 (0.0%) |
| Total | 64 (100.0%) | 27 (100.0%) |
Monthly Housing Cost Tiers in Morristown
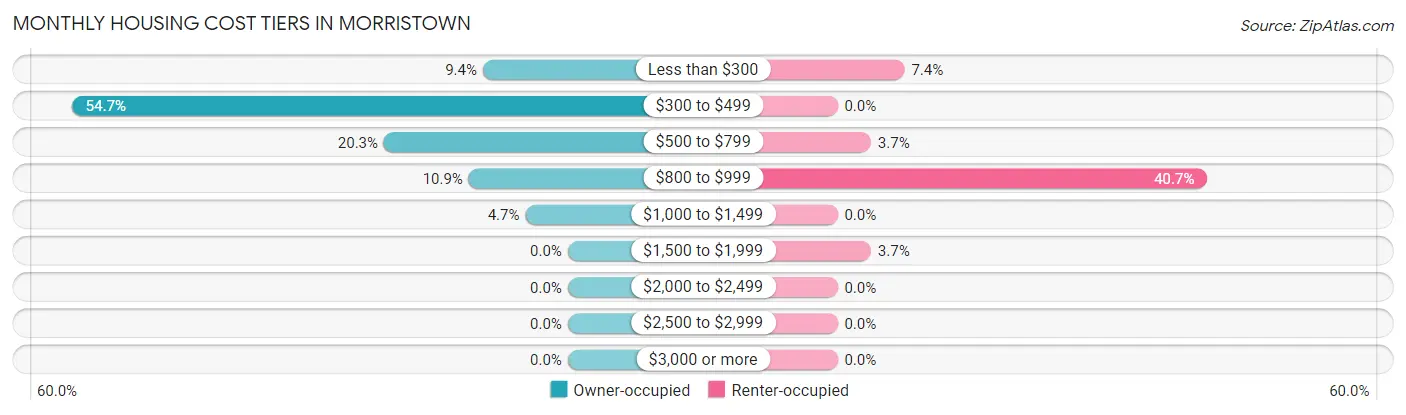
| Monthly Cost | Owner-occupied | Renter-occupied |
| Less than $300 | 6 (9.4%) | 2 (7.4%) |
| $300 to $499 | 35 (54.7%) | 0 (0.0%) |
| $500 to $799 | 13 (20.3%) | 1 (3.7%) |
| $800 to $999 | 7 (10.9%) | 11 (40.7%) |
| $1,000 to $1,499 | 3 (4.7%) | 0 (0.0%) |
| $1,500 to $1,999 | 0 (0.0%) | 1 (3.7%) |
| $2,000 to $2,499 | 0 (0.0%) | 0 (0.0%) |
| $2,500 to $2,999 | 0 (0.0%) | 0 (0.0%) |
| $3,000 or more | 0 (0.0%) | 0 (0.0%) |
| Total | 64 (100.0%) | 27 (100.0%) |
Physical Housing Characteristics in Morristown
Housing Structures in Morristown
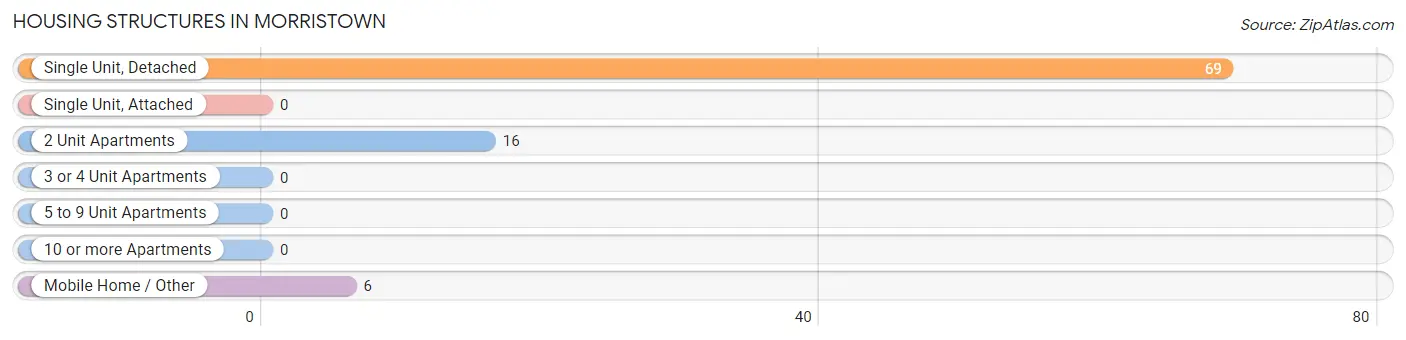
| Structure Type | # Housing Units | % Housing Units |
| Single Unit, Detached | 69 | 75.8% |
| Single Unit, Attached | 0 | 0.0% |
| 2 Unit Apartments | 16 | 17.6% |
| 3 or 4 Unit Apartments | 0 | 0.0% |
| 5 to 9 Unit Apartments | 0 | 0.0% |
| 10 or more Apartments | 0 | 0.0% |
| Mobile Home / Other | 6 | 6.6% |
| Total | 91 | 100.0% |
Housing Structures by Occupancy in Morristown
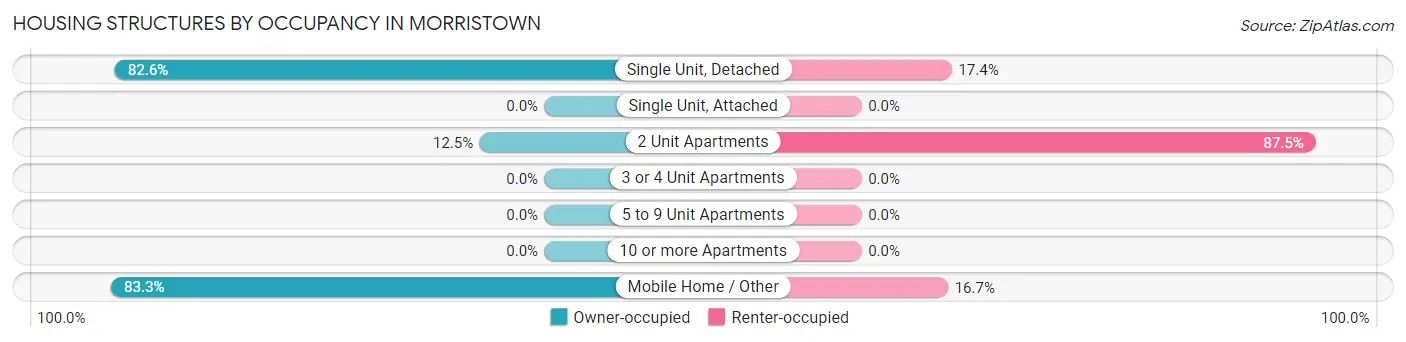
| Structure Type | Owner-occupied | Renter-occupied |
| Single Unit, Detached | 57 (82.6%) | 12 (17.4%) |
| Single Unit, Attached | 0 (0.0%) | 0 (0.0%) |
| 2 Unit Apartments | 2 (12.5%) | 14 (87.5%) |
| 3 or 4 Unit Apartments | 0 (0.0%) | 0 (0.0%) |
| 5 to 9 Unit Apartments | 0 (0.0%) | 0 (0.0%) |
| 10 or more Apartments | 0 (0.0%) | 0 (0.0%) |
| Mobile Home / Other | 5 (83.3%) | 1 (16.7%) |
| Total | 64 (70.3%) | 27 (29.7%) |
Housing Structures by Number of Rooms in Morristown
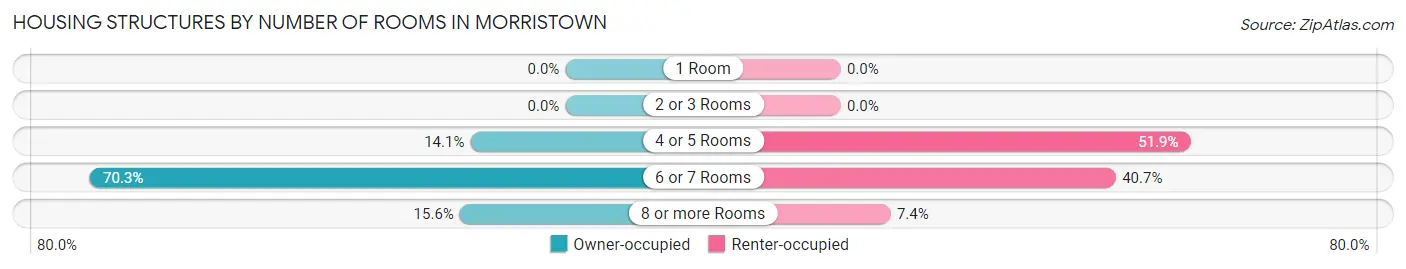
| Number of Rooms | Owner-occupied | Renter-occupied |
| 1 Room | 0 (0.0%) | 0 (0.0%) |
| 2 or 3 Rooms | 0 (0.0%) | 0 (0.0%) |
| 4 or 5 Rooms | 9 (14.1%) | 14 (51.8%) |
| 6 or 7 Rooms | 45 (70.3%) | 11 (40.7%) |
| 8 or more Rooms | 10 (15.6%) | 2 (7.4%) |
| Total | 64 (100.0%) | 27 (100.0%) |
Housing Structure by Heating Type in Morristown
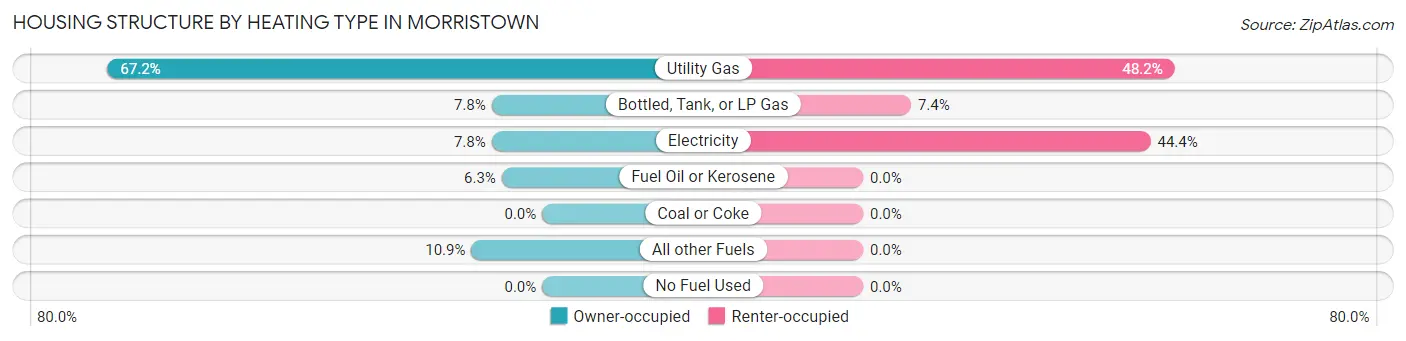
| Heating Type | Owner-occupied | Renter-occupied |
| Utility Gas | 43 (67.2%) | 13 (48.1%) |
| Bottled, Tank, or LP Gas | 5 (7.8%) | 2 (7.4%) |
| Electricity | 5 (7.8%) | 12 (44.4%) |
| Fuel Oil or Kerosene | 4 (6.2%) | 0 (0.0%) |
| Coal or Coke | 0 (0.0%) | 0 (0.0%) |
| All other Fuels | 7 (10.9%) | 0 (0.0%) |
| No Fuel Used | 0 (0.0%) | 0 (0.0%) |
| Total | 64 (100.0%) | 27 (100.0%) |
Household Vehicle Usage in Morristown
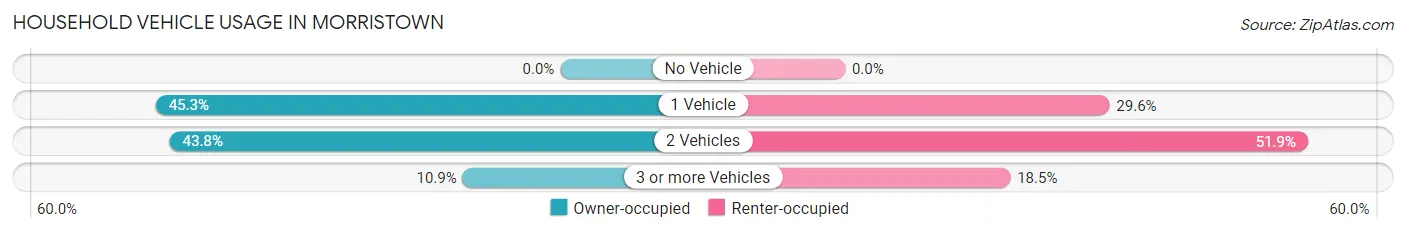
| Vehicles per Household | Owner-occupied | Renter-occupied |
| No Vehicle | 0 (0.0%) | 0 (0.0%) |
| 1 Vehicle | 29 (45.3%) | 8 (29.6%) |
| 2 Vehicles | 28 (43.8%) | 14 (51.8%) |
| 3 or more Vehicles | 7 (10.9%) | 5 (18.5%) |
| Total | 64 (100.0%) | 27 (100.0%) |
Real Estate & Mortgages in Morristown
Real Estate and Mortgage Overview in Morristown
| Characteristic | Without Mortgage | With Mortgage |
| Housing Units | 54 | 10 |
| Median Property Value | - | - |
| Median Household Income | $42,143 | $0 |
| Monthly Housing Costs | $400 | $0 |
| Real Estate Taxes | - | - |
Property Value by Mortgage Status in Morristown
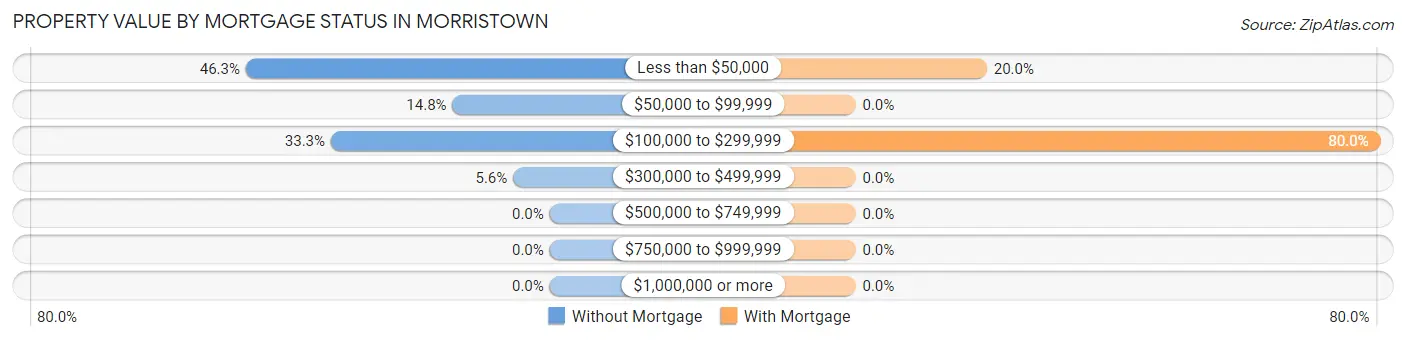
| Property Value | Without Mortgage | With Mortgage |
| Less than $50,000 | 25 (46.3%) | 2 (20.0%) |
| $50,000 to $99,999 | 8 (14.8%) | 0 (0.0%) |
| $100,000 to $299,999 | 18 (33.3%) | 8 (80.0%) |
| $300,000 to $499,999 | 3 (5.6%) | 0 (0.0%) |
| $500,000 to $749,999 | 0 (0.0%) | 0 (0.0%) |
| $750,000 to $999,999 | 0 (0.0%) | 0 (0.0%) |
| $1,000,000 or more | 0 (0.0%) | 0 (0.0%) |
| Total | 54 (100.0%) | 10 (100.0%) |
Household Income by Mortgage Status in Morristown
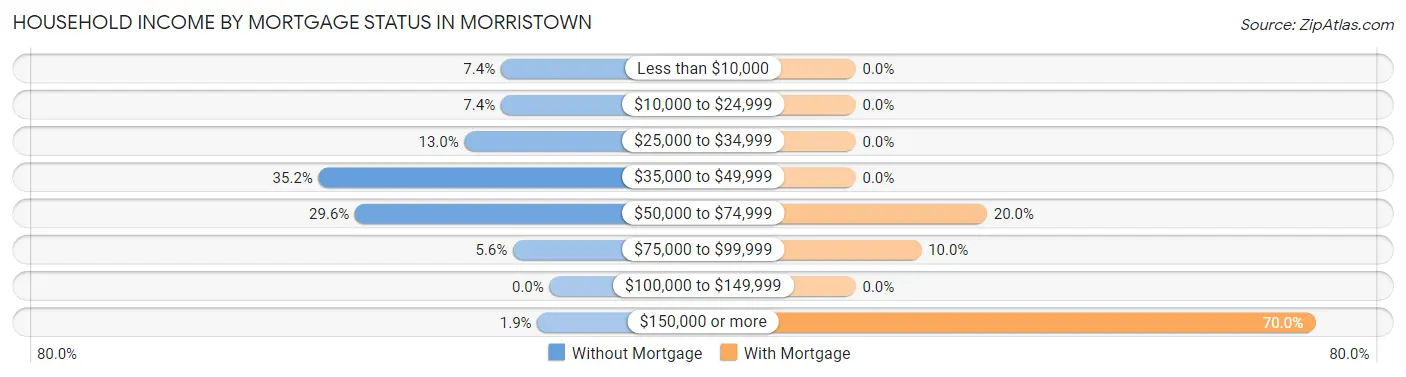
| Household Income | Without Mortgage | With Mortgage |
| Less than $10,000 | 4 (7.4%) | 0 (0.0%) |
| $10,000 to $24,999 | 4 (7.4%) | 0 (0.0%) |
| $25,000 to $34,999 | 7 (13.0%) | 0 (0.0%) |
| $35,000 to $49,999 | 19 (35.2%) | 0 (0.0%) |
| $50,000 to $74,999 | 16 (29.6%) | 2 (20.0%) |
| $75,000 to $99,999 | 3 (5.6%) | 1 (10.0%) |
| $100,000 to $149,999 | 0 (0.0%) | 0 (0.0%) |
| $150,000 or more | 1 (1.8%) | 7 (70.0%) |
| Total | 54 (100.0%) | 10 (100.0%) |
Property Value to Household Income Ratio in Morristown
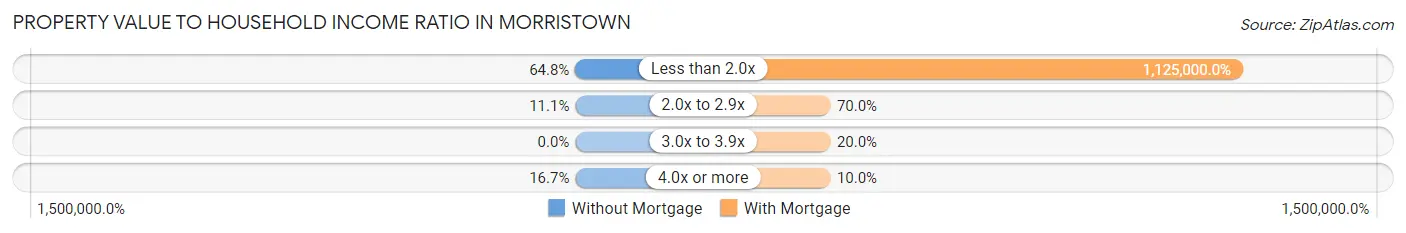
| Value-to-Income Ratio | Without Mortgage | With Mortgage |
| Less than 2.0x | 35 (64.8%) | 112,500 (1,125,000.0%) |
| 2.0x to 2.9x | 6 (11.1%) | 7 (70.0%) |
| 3.0x to 3.9x | 0 (0.0%) | 2 (20.0%) |
| 4.0x or more | 9 (16.7%) | 1 (10.0%) |
| Total | 54 (100.0%) | 10 (100.0%) |
Real Estate Taxes by Mortgage Status in Morristown
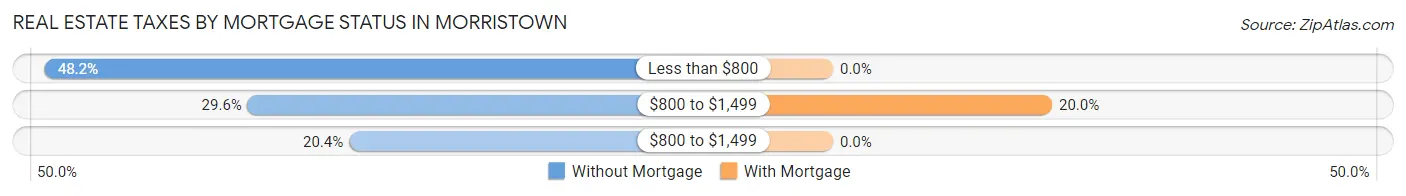
| Property Taxes | Without Mortgage | With Mortgage |
| Less than $800 | 26 (48.1%) | 0 (0.0%) |
| $800 to $1,499 | 16 (29.6%) | 2 (20.0%) |
| $800 to $1,499 | 11 (20.4%) | 0 (0.0%) |
| Total | 54 (100.0%) | 10 (100.0%) |
Health & Disability in Morristown
Health Insurance Coverage by Age in Morristown
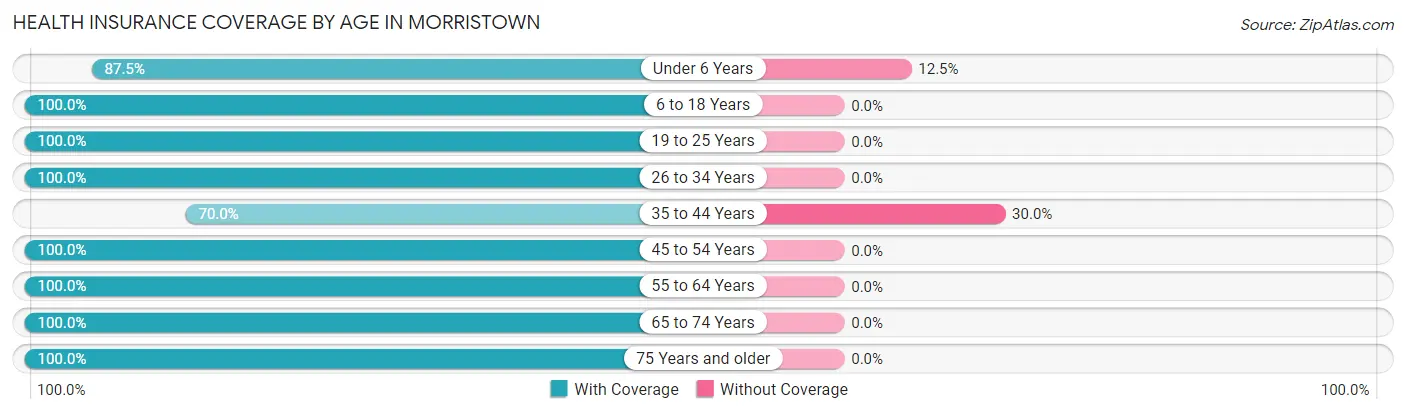
| Age Bracket | With Coverage | Without Coverage |
| Under 6 Years | 14 (87.5%) | 2 (12.5%) |
| 6 to 18 Years | 50 (100.0%) | 0 (0.0%) |
| 19 to 25 Years | 26 (100.0%) | 0 (0.0%) |
| 26 to 34 Years | 23 (100.0%) | 0 (0.0%) |
| 35 to 44 Years | 21 (70.0%) | 9 (30.0%) |
| 45 to 54 Years | 24 (100.0%) | 0 (0.0%) |
| 55 to 64 Years | 66 (100.0%) | 0 (0.0%) |
| 65 to 74 Years | 16 (100.0%) | 0 (0.0%) |
| 75 Years and older | 26 (100.0%) | 0 (0.0%) |
| Total | 266 (96.0%) | 11 (4.0%) |
Health Insurance Coverage by Citizenship Status in Morristown
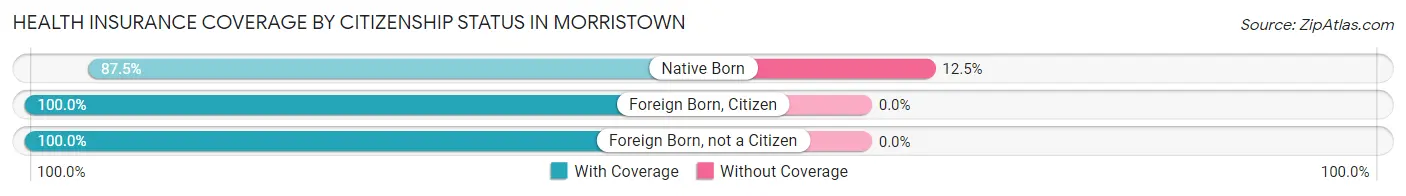
| Citizenship Status | With Coverage | Without Coverage |
| Native Born | 14 (87.5%) | 2 (12.5%) |
| Foreign Born, Citizen | 50 (100.0%) | 0 (0.0%) |
| Foreign Born, not a Citizen | 26 (100.0%) | 0 (0.0%) |
Health Insurance Coverage by Household Income in Morristown
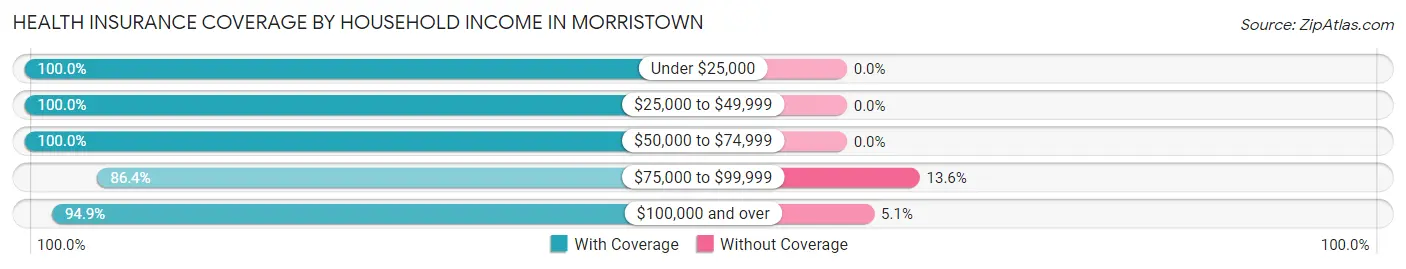
| Household Income | With Coverage | Without Coverage |
| Under $25,000 | 8 (100.0%) | 0 (0.0%) |
| $25,000 to $49,999 | 75 (100.0%) | 0 (0.0%) |
| $50,000 to $74,999 | 89 (100.0%) | 0 (0.0%) |
| $75,000 to $99,999 | 57 (86.4%) | 9 (13.6%) |
| $100,000 and over | 37 (94.9%) | 2 (5.1%) |
Public vs Private Health Insurance Coverage by Age in Morristown
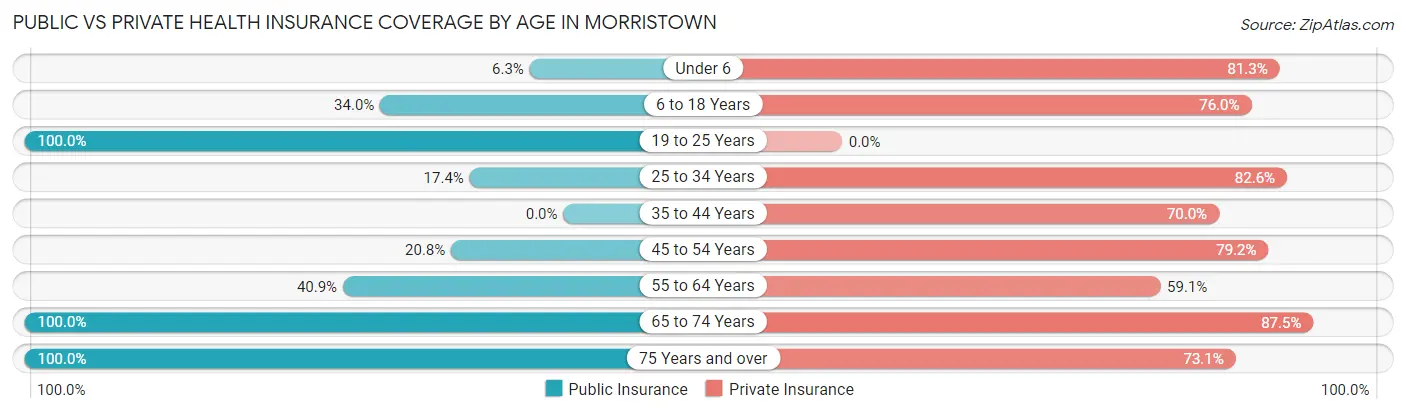
| Age Bracket | Public Insurance | Private Insurance |
| Under 6 | 1 (6.2%) | 13 (81.2%) |
| 6 to 18 Years | 17 (34.0%) | 38 (76.0%) |
| 19 to 25 Years | 26 (100.0%) | 0 (0.0%) |
| 25 to 34 Years | 4 (17.4%) | 19 (82.6%) |
| 35 to 44 Years | 0 (0.0%) | 21 (70.0%) |
| 45 to 54 Years | 5 (20.8%) | 19 (79.2%) |
| 55 to 64 Years | 27 (40.9%) | 39 (59.1%) |
| 65 to 74 Years | 16 (100.0%) | 14 (87.5%) |
| 75 Years and over | 26 (100.0%) | 19 (73.1%) |
| Total | 122 (44.0%) | 182 (65.7%) |
Disability Status by Sex by Age in Morristown
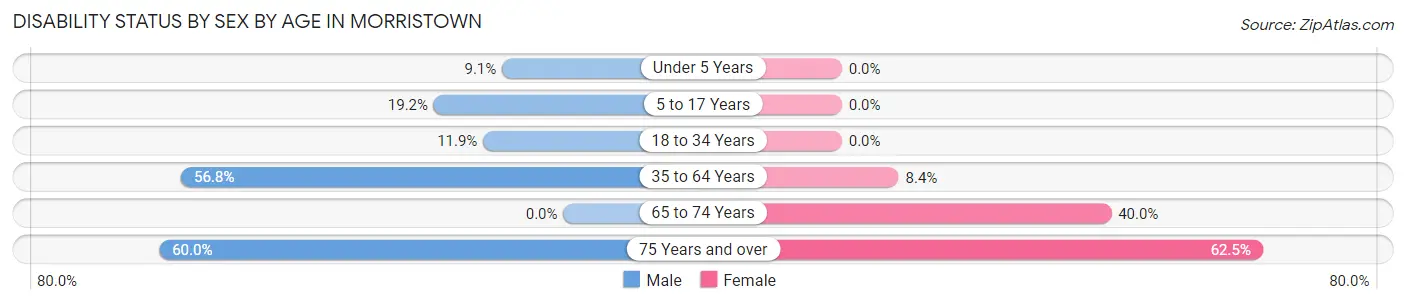
| Age Bracket | Male | Female |
| Under 5 Years | 1 (9.1%) | 0 (0.0%) |
| 5 to 17 Years | 5 (19.2%) | 0 (0.0%) |
| 18 to 34 Years | 5 (11.9%) | 0 (0.0%) |
| 35 to 64 Years | 21 (56.8%) | 7 (8.4%) |
| 65 to 74 Years | 0 (0.0%) | 4 (40.0%) |
| 75 Years and over | 6 (60.0%) | 10 (62.5%) |
Disability Class by Sex by Age in Morristown
Disability Class: Hearing Difficulty
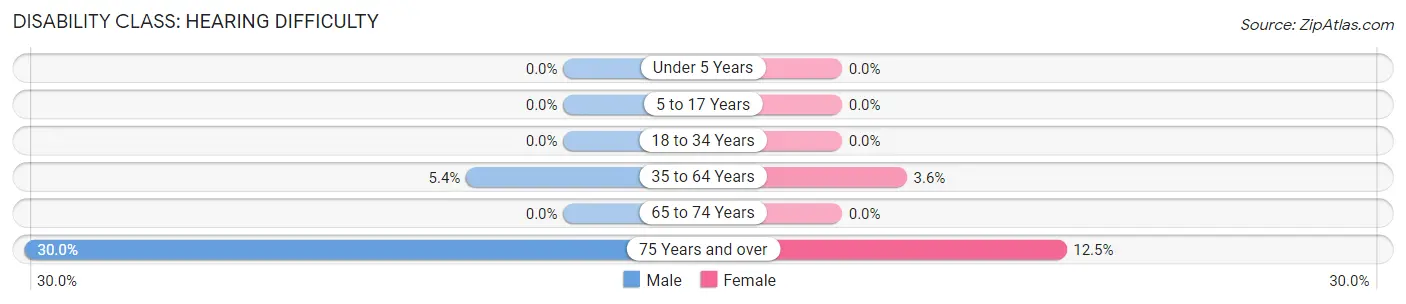
| Age Bracket | Male | Female |
| Under 5 Years | 0 (0.0%) | 0 (0.0%) |
| 5 to 17 Years | 0 (0.0%) | 0 (0.0%) |
| 18 to 34 Years | 0 (0.0%) | 0 (0.0%) |
| 35 to 64 Years | 2 (5.4%) | 3 (3.6%) |
| 65 to 74 Years | 0 (0.0%) | 0 (0.0%) |
| 75 Years and over | 3 (30.0%) | 2 (12.5%) |
Disability Class: Vision Difficulty
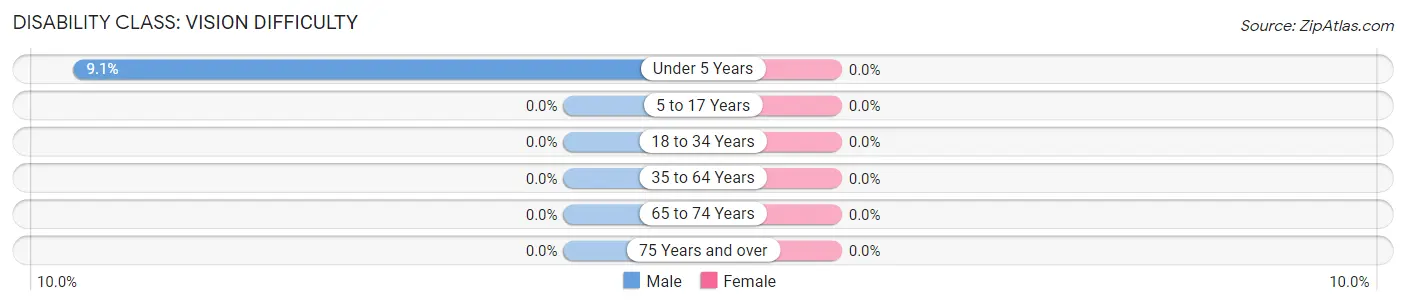
| Age Bracket | Male | Female |
| Under 5 Years | 1 (9.1%) | 0 (0.0%) |
| 5 to 17 Years | 0 (0.0%) | 0 (0.0%) |
| 18 to 34 Years | 0 (0.0%) | 0 (0.0%) |
| 35 to 64 Years | 0 (0.0%) | 0 (0.0%) |
| 65 to 74 Years | 0 (0.0%) | 0 (0.0%) |
| 75 Years and over | 0 (0.0%) | 0 (0.0%) |
Disability Class: Cognitive Difficulty
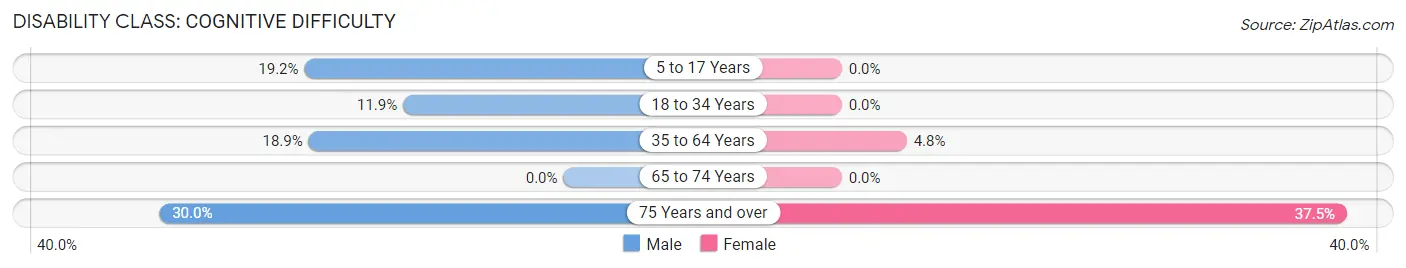
| Age Bracket | Male | Female |
| 5 to 17 Years | 5 (19.2%) | 0 (0.0%) |
| 18 to 34 Years | 5 (11.9%) | 0 (0.0%) |
| 35 to 64 Years | 7 (18.9%) | 4 (4.8%) |
| 65 to 74 Years | 0 (0.0%) | 0 (0.0%) |
| 75 Years and over | 3 (30.0%) | 6 (37.5%) |
Disability Class: Ambulatory Difficulty
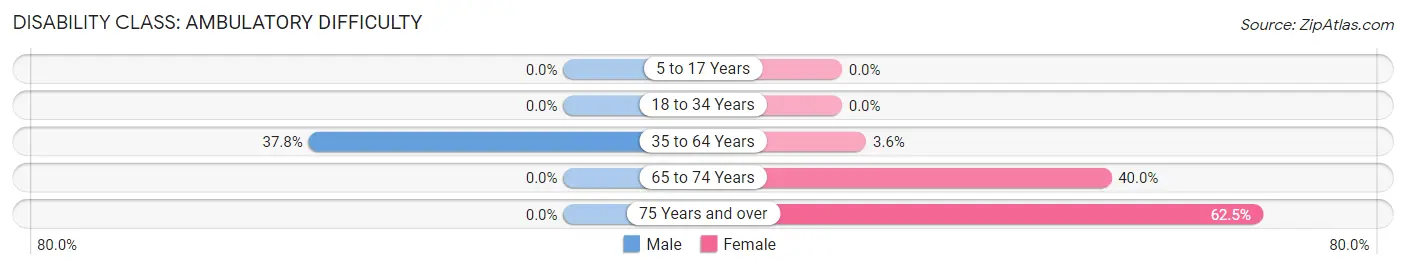
| Age Bracket | Male | Female |
| 5 to 17 Years | 0 (0.0%) | 0 (0.0%) |
| 18 to 34 Years | 0 (0.0%) | 0 (0.0%) |
| 35 to 64 Years | 14 (37.8%) | 3 (3.6%) |
| 65 to 74 Years | 0 (0.0%) | 4 (40.0%) |
| 75 Years and over | 0 (0.0%) | 10 (62.5%) |
Disability Class: Self-Care Difficulty
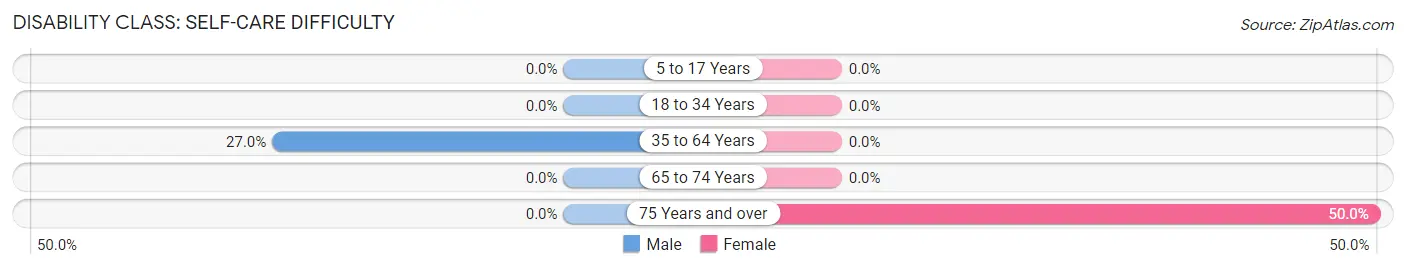
| Age Bracket | Male | Female |
| 5 to 17 Years | 0 (0.0%) | 0 (0.0%) |
| 18 to 34 Years | 0 (0.0%) | 0 (0.0%) |
| 35 to 64 Years | 10 (27.0%) | 0 (0.0%) |
| 65 to 74 Years | 0 (0.0%) | 0 (0.0%) |
| 75 Years and over | 0 (0.0%) | 8 (50.0%) |
Technology Access in Morristown
Computing Device Access in Morristown
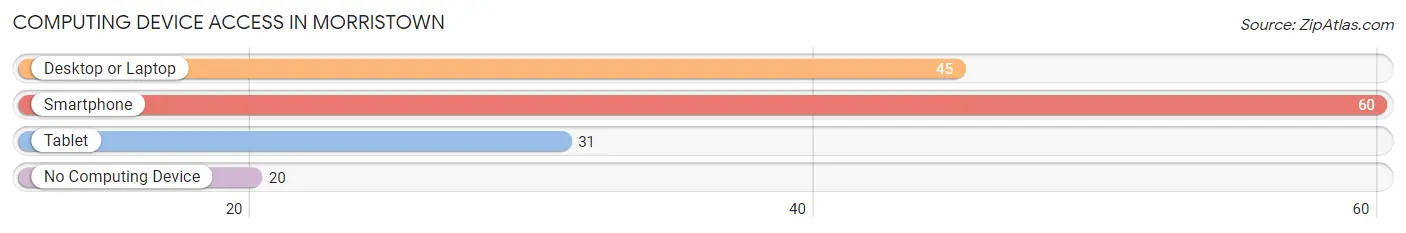
| Device Type | # Households | % Households |
| Desktop or Laptop | 45 | 49.4% |
| Smartphone | 60 | 65.9% |
| Tablet | 31 | 34.1% |
| No Computing Device | 20 | 22.0% |
| Total | 91 | 100.0% |
Internet Access in Morristown
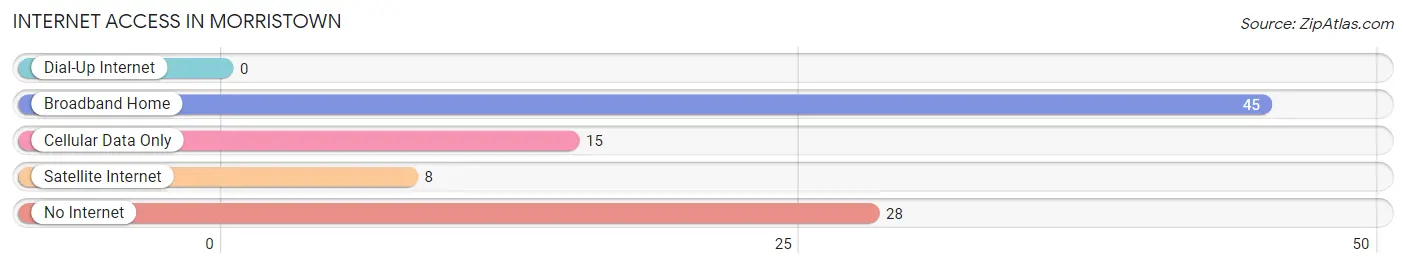
| Internet Type | # Households | % Households |
| Dial-Up Internet | 0 | 0.0% |
| Broadband Home | 45 | 49.4% |
| Cellular Data Only | 15 | 16.5% |
| Satellite Internet | 8 | 8.8% |
| No Internet | 28 | 30.8% |
| Total | 91 | 100.0% |
Morristown Summary
Morristown, Ohio is a small village located in the southeastern corner of Belmont County, Ohio. It is situated along the Ohio River, approximately 25 miles west of Wheeling, West Virginia. The village has a population of approximately 1,000 people and is part of the St. Clairsville-Richland City School District.
History
Morristown was founded in 1817 by John Morris, a Revolutionary War veteran. Morris purchased the land from the United States government and named the village after himself. The village was incorporated in 1837 and has remained a small, rural community ever since.
The village was an important stop on the Underground Railroad, with many of the local residents helping to hide and transport escaped slaves. The village was also home to a number of prominent abolitionists, including John Rankin and his son James.
Geography
Morristown is located in the southeastern corner of Belmont County, Ohio. It is situated along the Ohio River, approximately 25 miles west of Wheeling, West Virginia. The village is located in a rural area, with the nearest major city being St. Clairsville, Ohio, which is approximately 10 miles away.
The village is located in a hilly region, with the highest point being the hilltop cemetery located on the east side of town. The village is surrounded by farmland, with the nearest major highway being Interstate 70, which is approximately 15 miles away.
Economy
The economy of Morristown is largely based on agriculture and tourism. The village is home to a number of small businesses, including a grocery store, a hardware store, and a few restaurants. The village also has a number of bed and breakfasts, which attract visitors from all over the region.
The village is also home to a number of small manufacturing companies, including a plastics manufacturer and a metal fabrication shop. The village is also home to a number of small farms, which produce a variety of crops, including corn, soybeans, and hay.
Demographics
As of the 2010 census, the population of Morristown was 1,000 people. The racial makeup of the village was 97.2% White, 0.7% African American, 0.2% Native American, 0.2% Asian, 0.2% from other races, and 1.7% from two or more races. Hispanic or Latino of any race were 0.7% of the population.
The median household income in Morristown was $37,500, and the median family income was $45,000. The per capita income for the village was $18,000. About 11.2% of families and 14.2% of the population were below the poverty line, including 18.2% of those under age 18 and 8.3% of those age 65 or over.
Conclusion
Morristown, Ohio is a small village located in the southeastern corner of Belmont County, Ohio. It is situated along the Ohio River, approximately 25 miles west of Wheeling, West Virginia. The village has a population of approximately 1,000 people and is part of the St. Clairsville-Richland City School District. The village has a long history, dating back to its founding in 1817, and has remained a small, rural community ever since. The economy of Morristown is largely based on agriculture and tourism, and the village is home to a number of small businesses, manufacturing companies, and farms. The population of Morristown is predominantly white, with a median household income of $37,500 and a median family income of $45,000.
Common Questions
What is the Total Population of Morristown?
Total Population of Morristown is 277.
What is the Total Male Population of Morristown?
Total Male Population of Morristown is 132.
What is the Total Female Population of Morristown?
Total Female Population of Morristown is 145.
What is the Ratio of Males per 100 Females in Morristown?
There are 91.03 Males per 100 Females in Morristown.
What is the Ratio of Females per 100 Males in Morristown?
There are 109.85 Females per 100 Males in Morristown.
What is the Median Population Age in Morristown?
Median Population Age in Morristown is 41.6 Years.
What is the Average Family Size in Morristown
Average Family Size in Morristown is 3.8 People.
What is the Average Household Size in Morristown
Average Household Size in Morristown is 3.0 People.
What is Per Capita Income in Morristown?
Per Capita income in Morristown is $22,190.
What is the Median Family Income in Morristown?
Median Family Income in Morristown is $55,313.
What is the Median Household income in Morristown?
Median Household Income in Morristown is $48,125.
What is Inequality or Gini Index in Morristown?
Inequality or Gini Index in Morristown is 0.30.
How Large is the Labor Force in Morristown?
There are 137 People in the Labor Forcein in Morristown.
What is the Percentage of People in the Labor Force in Morristown?
61.7% of People are in the Labor Force in Morristown.
What is the Unemployment Rate in Morristown?
Unemployment Rate in Morristown is 21.9%.