Zip Codes with the Highest Percentage of Population Employed in Food Preparation & Serving in Bowling Green, OH
RELATED REPORTS & OPTIONS
Food Preparation & Serving
Bowling Green
Compare Zip Codes
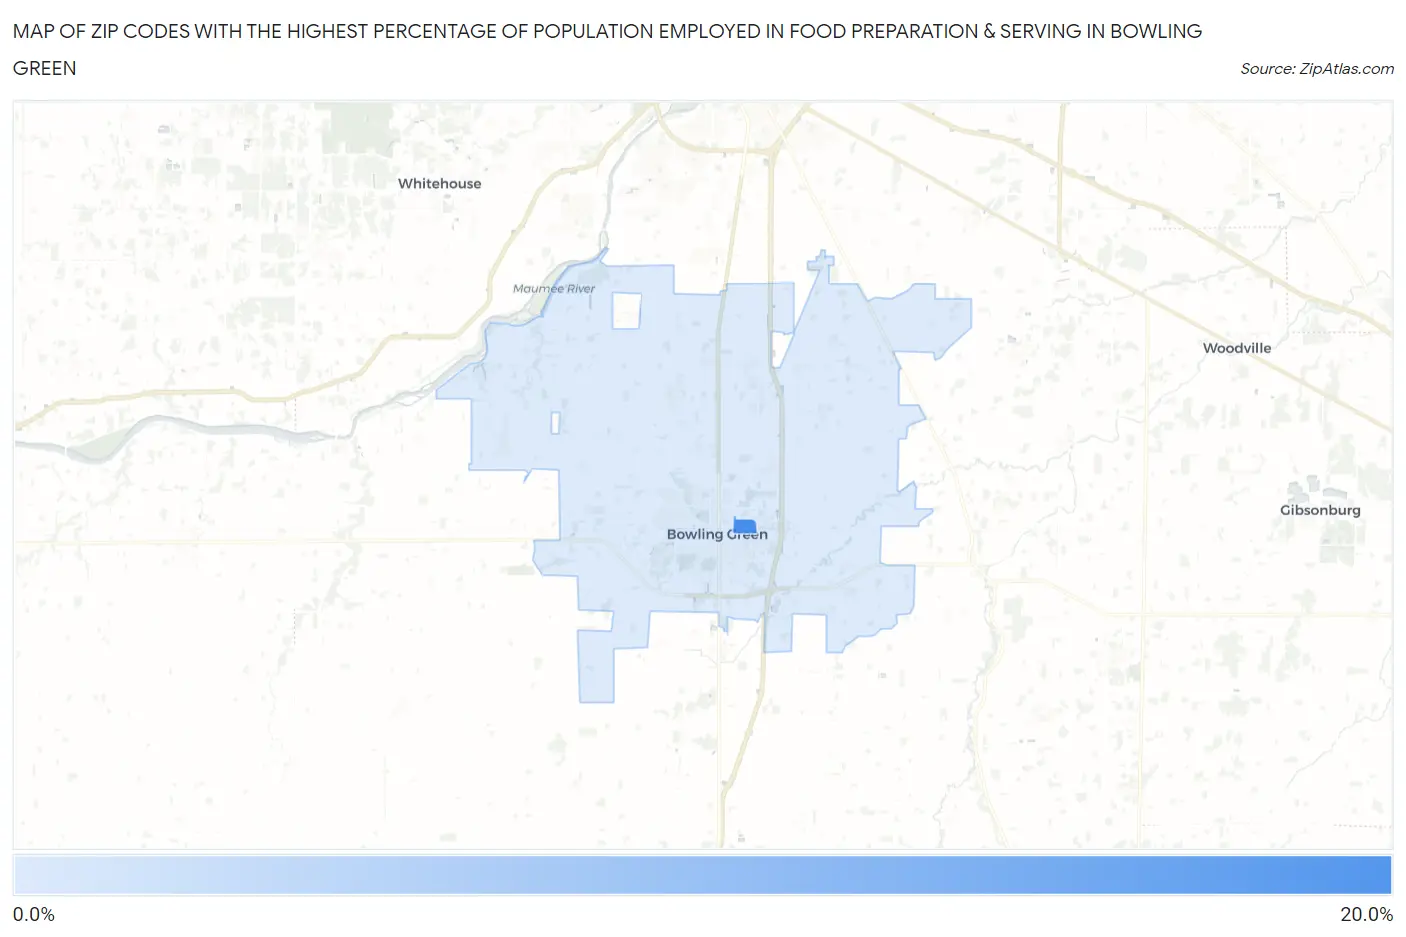
Map of Zip Codes with the Highest Percentage of Population Employed in Food Preparation & Serving in Bowling Green
0.0%
20.0%
Zip Codes with the Highest Percentage of Population Employed in Food Preparation & Serving in Bowling Green, OH
| Zip Code | % Employed | vs State | vs National | |
| 1. | 43403 | 16.9% | 5.6%(+11.3)#33 | 5.3%(+11.6)#759 |
| 2. | 43402 | 8.2% | 5.6%(+2.58)#205 | 5.3%(+2.90)#4,459 |
1
Common Questions
What are the Top Zip Codes with the Highest Percentage of Population Employed in Food Preparation & Serving in Bowling Green, OH?
Top Zip Codes with the Highest Percentage of Population Employed in Food Preparation & Serving in Bowling Green, OH are:
What zip code has the Highest Percentage of Population Employed in Food Preparation & Serving in Bowling Green, OH?
43403 has the Highest Percentage of Population Employed in Food Preparation & Serving in Bowling Green, OH with 16.9%.
What is the Percentage of Population Employed in Food Preparation & Serving in Bowling Green, OH?
Percentage of Population Employed in Food Preparation & Serving in Bowling Green is 10.1%.
What is the Percentage of Population Employed in Food Preparation & Serving in Ohio?
Percentage of Population Employed in Food Preparation & Serving in Ohio is 5.6%.
What is the Percentage of Population Employed in Food Preparation & Serving in the United States?
Percentage of Population Employed in Food Preparation & Serving in the United States is 5.3%.