Kinsman Center, OH
Kinsman Center Map
Kinsman Center Overview
821
TOTAL POPULATION
434
MALE POPULATION
387
FEMALE POPULATION
112.14
MALES / 100 FEMALES
89.17
FEMALES / 100 MALES
60.1
MEDIAN AGE
2.7
AVG FAMILY SIZE
2.5
AVG HOUSEHOLD SIZE
$25,962
PER CAPITA INCOME
$61,528
AVG FAMILY INCOME
$60,694
AVG HOUSEHOLD INCOME
49.4%
WAGE / INCOME GAP [ % ]
50.6¢/ $1
WAGE / INCOME GAP [ $ ]
0.40
INEQUALITY / GINI INDEX
321
LABOR FORCE [ PEOPLE ]
46.8%
PERCENT IN LABOR FORCE
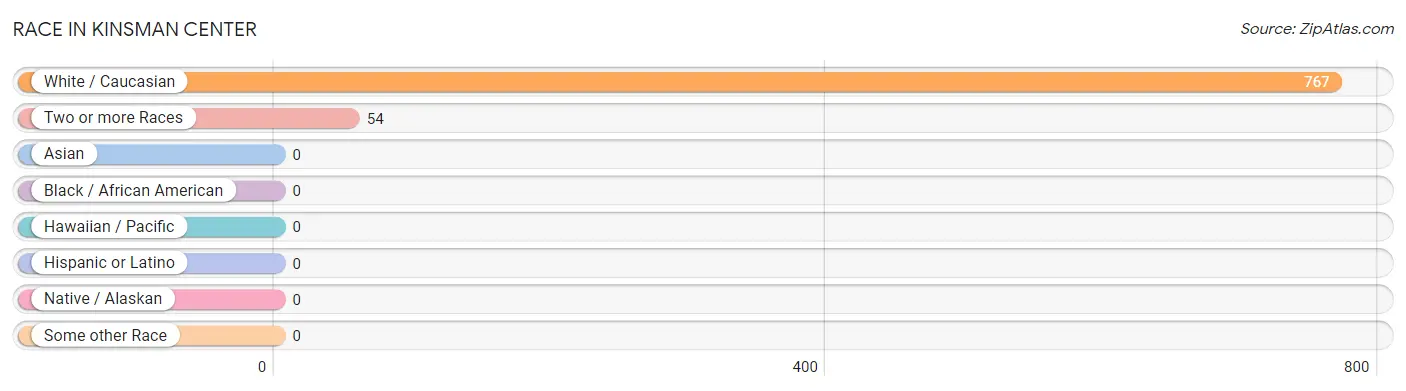
Race in Kinsman Center
The most populous races in Kinsman Center are White / Caucasian (767 | 93.4%), and Two or more Races (54 | 6.6%).
| Race | # Population | % Population |
| Asian | 0 | 0.0% |
| Black / African American | 0 | 0.0% |
| Hawaiian / Pacific | 0 | 0.0% |
| Hispanic or Latino | 0 | 0.0% |
| Native / Alaskan | 0 | 0.0% |
| White / Caucasian | 767 | 93.4% |
| Two or more Races | 54 | 6.6% |
| Some other Race | 0 | 0.0% |
| Total | 821 | 100.0% |
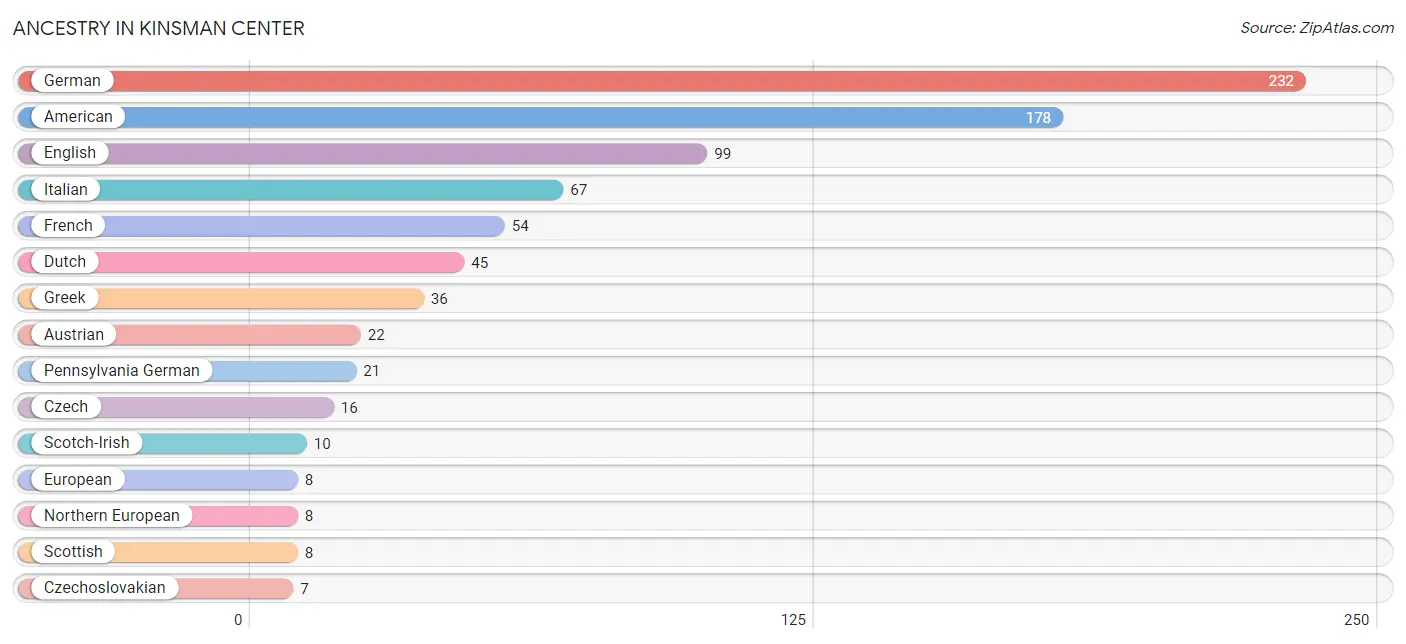
Ancestry in Kinsman Center
The most populous ancestries reported in Kinsman Center are German (232 | 28.3%), American (178 | 21.7%), English (99 | 12.1%), Italian (67 | 8.2%), and French (54 | 6.6%), together accounting for 76.7% of all Kinsman Center residents.
| Ancestry | # Population | % Population |
| American | 178 | 21.7% |
| Austrian | 22 | 2.7% |
| Czech | 16 | 1.9% |
| Czechoslovakian | 7 | 0.9% |
| Dutch | 45 | 5.5% |
| English | 99 | 12.1% |
| European | 8 | 1.0% |
| French | 54 | 6.6% |
| French Canadian | 7 | 0.9% |
| German | 232 | 28.3% |
| Greek | 36 | 4.4% |
| Hungarian | 7 | 0.9% |
| Italian | 67 | 8.2% |
| Northern European | 8 | 1.0% |
| Pennsylvania German | 21 | 2.6% |
| Scotch-Irish | 10 | 1.2% |
| Scottish | 8 | 1.0% | View All 17 Rows |
Immigrants in Kinsman Center

| Immigration Origin | # Population | % Population | View All 0 Rows |
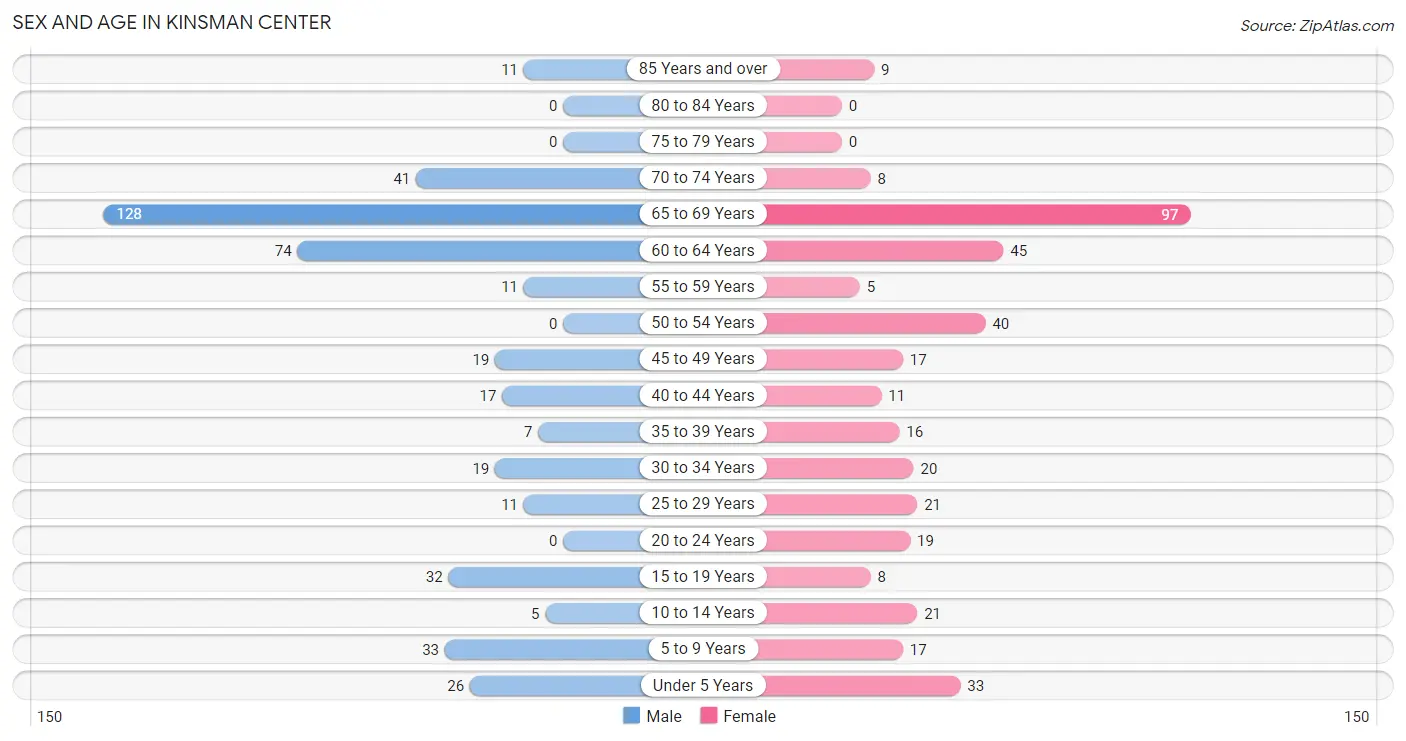
Sex and Age in Kinsman Center
Sex and Age in Kinsman Center
The most populous age groups in Kinsman Center are 65 to 69 Years (128 | 29.5%) for men and 65 to 69 Years (97 | 25.1%) for women.
| Age Bracket | Male | Female |
| Under 5 Years | 26 (6.0%) | 33 (8.5%) |
| 5 to 9 Years | 33 (7.6%) | 17 (4.4%) |
| 10 to 14 Years | 5 (1.1%) | 21 (5.4%) |
| 15 to 19 Years | 32 (7.4%) | 8 (2.1%) |
| 20 to 24 Years | 0 (0.0%) | 19 (4.9%) |
| 25 to 29 Years | 11 (2.5%) | 21 (5.4%) |
| 30 to 34 Years | 19 (4.4%) | 20 (5.2%) |
| 35 to 39 Years | 7 (1.6%) | 16 (4.1%) |
| 40 to 44 Years | 17 (3.9%) | 11 (2.8%) |
| 45 to 49 Years | 19 (4.4%) | 17 (4.4%) |
| 50 to 54 Years | 0 (0.0%) | 40 (10.3%) |
| 55 to 59 Years | 11 (2.5%) | 5 (1.3%) |
| 60 to 64 Years | 74 (17.1%) | 45 (11.6%) |
| 65 to 69 Years | 128 (29.5%) | 97 (25.1%) |
| 70 to 74 Years | 41 (9.5%) | 8 (2.1%) |
| 75 to 79 Years | 0 (0.0%) | 0 (0.0%) |
| 80 to 84 Years | 0 (0.0%) | 0 (0.0%) |
| 85 Years and over | 11 (2.5%) | 9 (2.3%) |
| Total | 434 (100.0%) | 387 (100.0%) |
Families and Households in Kinsman Center
Median Family Size in Kinsman Center
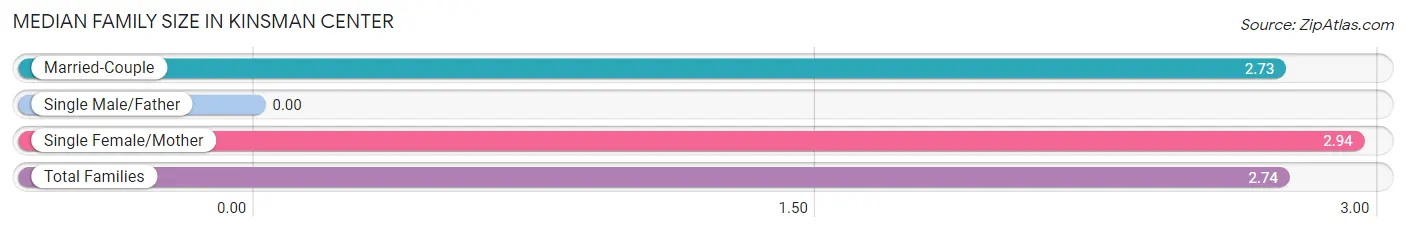
| Family Type | # Families | Family Size |
| Married-Couple | 254 (93.4%) | 2.73 |
| Single Male/Father | 0 (0.0%) | - |
| Single Female/Mother | 18 (6.6%) | 2.94 |
| Total Families | 272 (100.0%) | 2.74 |
Median Household Size in Kinsman Center
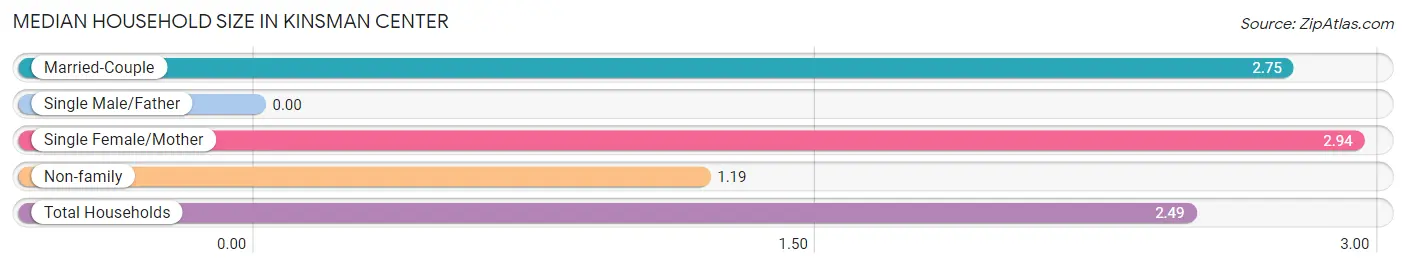
| Household Type | # Households | Household Size |
| Married-Couple | 254 (77.0%) | 2.75 |
| Single Male/Father | 0 (0.0%) | - |
| Single Female/Mother | 18 (5.4%) | 2.94 |
| Non-family | 58 (17.6%) | 1.19 |
| Total Households | 330 (100.0%) | 2.49 |
Household Size by Marriage Status in Kinsman Center
Out of a total of 330 households in Kinsman Center, 272 (82.4%) are family households, while 58 (17.6%) are nonfamily households. The most numerous type of family households are 2-person households, comprising 199, and the most common type of nonfamily households are 1-person households, comprising 48.
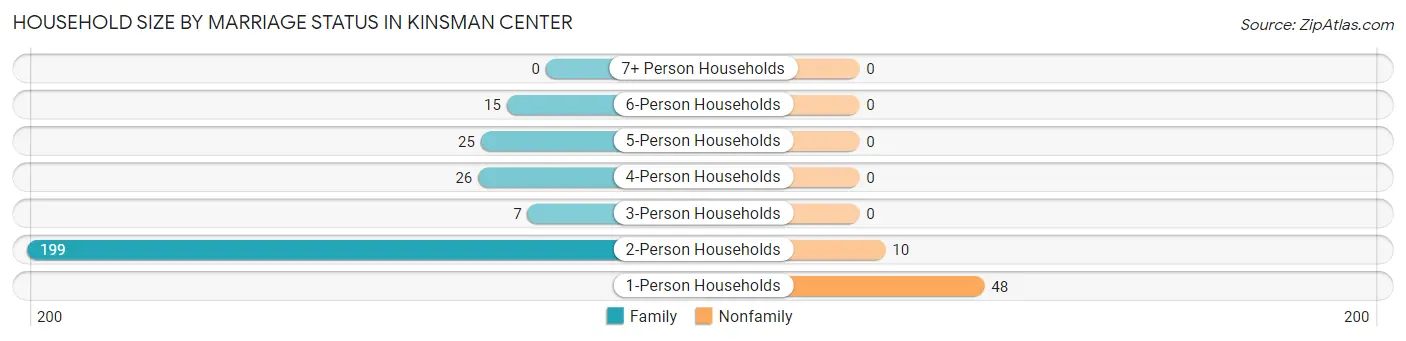
| Household Size | Family Households | Nonfamily Households |
| 1-Person Households | - | 48 (14.5%) |
| 2-Person Households | 199 (60.3%) | 10 (3.0%) |
| 3-Person Households | 7 (2.1%) | 0 (0.0%) |
| 4-Person Households | 26 (7.9%) | 0 (0.0%) |
| 5-Person Households | 25 (7.6%) | 0 (0.0%) |
| 6-Person Households | 15 (4.5%) | 0 (0.0%) |
| 7+ Person Households | 0 (0.0%) | 0 (0.0%) |
| Total | 272 (82.4%) | 58 (17.6%) |
Female Fertility in Kinsman Center
Fertility by Age in Kinsman Center
Average fertility rate in Kinsman Center is 98.0 births per 1,000 women. Women in the age bracket of 20 to 34 years have the highest fertility rate with 183.0 births per 1,000 women. Women in the age bracket of 20 to 34 years acount for 100.0% of all women with births.
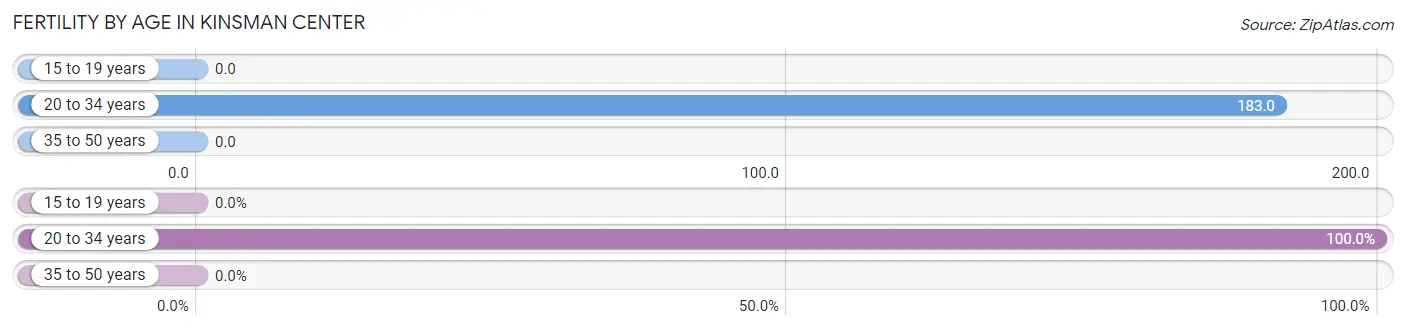
| Age Bracket | Women with Births | Births / 1,000 Women |
| 15 to 19 years | 0 (0.0%) | 0.0 |
| 20 to 34 years | 11 (100.0%) | 183.0 |
| 35 to 50 years | 0 (0.0%) | 0.0 |
| Total | 11 (100.0%) | 98.0 |
Fertility by Age by Marriage Status in Kinsman Center
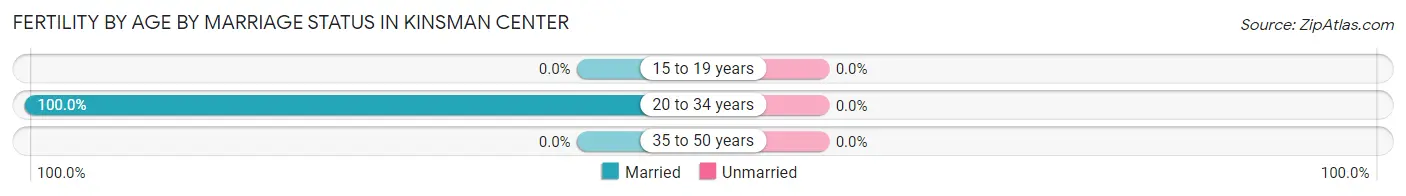
| Age Bracket | Married | Unmarried |
| 15 to 19 years | 0 (0.0%) | 0 (0.0%) |
| 20 to 34 years | 11 (100.0%) | 0 (0.0%) |
| 35 to 50 years | 0 (0.0%) | 0 (0.0%) |
| Total | 11 (100.0%) | 0 (0.0%) |
Fertility by Education in Kinsman Center
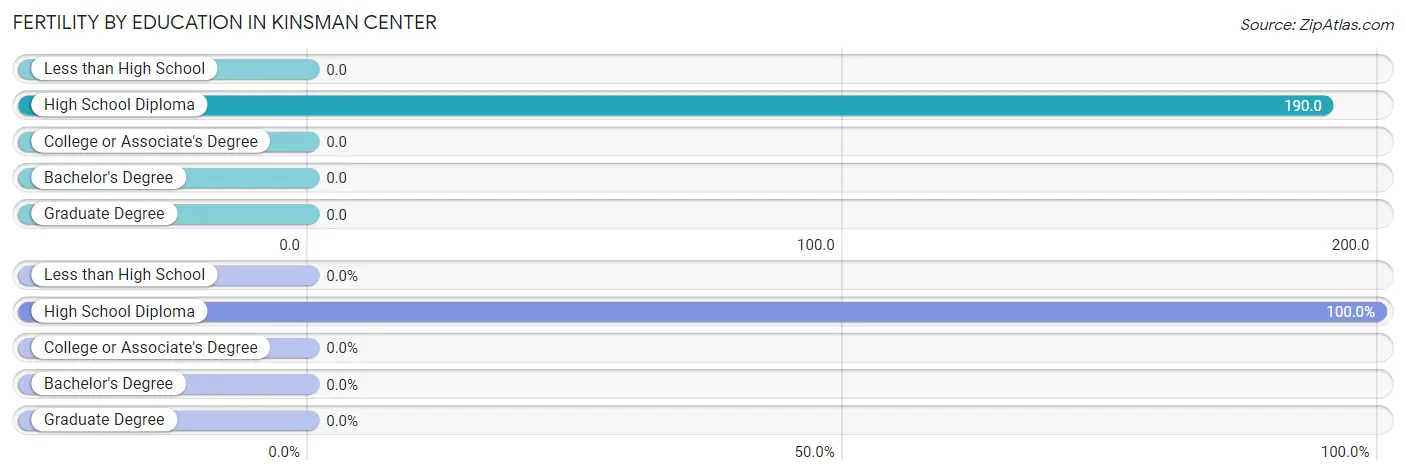
| Educational Attainment | Women with Births | Births / 1,000 Women |
| Less than High School | 0 (0.0%) | 0.0 |
| High School Diploma | 11 (100.0%) | 190.0 |
| College or Associate's Degree | 0 (0.0%) | 0.0 |
| Bachelor's Degree | 0 (0.0%) | 0.0 |
| Graduate Degree | 0 (0.0%) | 0.0 |
| Total | 11 (100.0%) | 98.0 |
Fertility by Education by Marriage Status in Kinsman Center
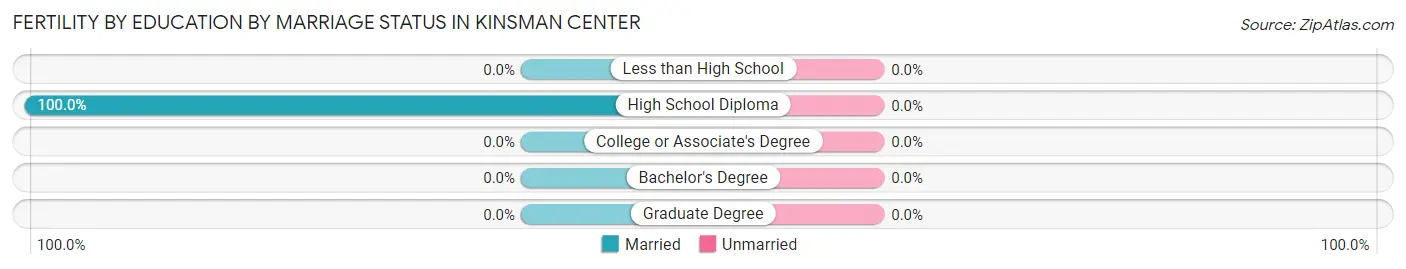
| Educational Attainment | Married | Unmarried |
| Less than High School | 0 (0.0%) | 0 (0.0%) |
| High School Diploma | 11 (100.0%) | 0 (0.0%) |
| College or Associate's Degree | 0 (0.0%) | 0 (0.0%) |
| Bachelor's Degree | 0 (0.0%) | 0 (0.0%) |
| Graduate Degree | 0 (0.0%) | 0 (0.0%) |
| Total | 11 (100.0%) | 0 (0.0%) |
Income in Kinsman Center
Income Overview in Kinsman Center
Per Capita Income in Kinsman Center is $25,962, while median incomes of families and households are $61,528 and $60,694 respectively.
| Characteristic | Number | Measure |
| Per Capita Income | 821 | $25,962 |
| Median Family Income | 272 | $61,528 |
| Mean Family Income | 272 | $66,712 |
| Median Household Income | 330 | $60,694 |
| Mean Household Income | 330 | $63,002 |
| Income Deficit | 272 | $0 |
| Wage / Income Gap (%) | 821 | 49.44% |
| Wage / Income Gap ($) | 821 | 50.56¢ per $1 |
| Gini / Inequality Index | 821 | 0.40 |
Earnings by Sex in Kinsman Center
Average Earnings in Kinsman Center are $38,594, $62,159 for men and $31,429 for women, a difference of 49.4%.
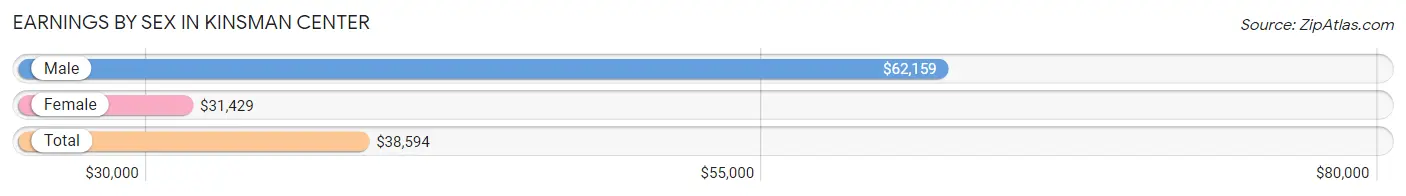
| Sex | Number | Average Earnings |
| Male | 153 (47.7%) | $62,159 |
| Female | 168 (52.3%) | $31,429 |
| Total | 321 (100.0%) | $38,594 |
Earnings by Sex by Income Bracket in Kinsman Center
The most common earnings brackets in Kinsman Center are $65,000 to $74,999 for men (45 | 29.4%) and $30,000 to $34,999 for women (43 | 25.6%).
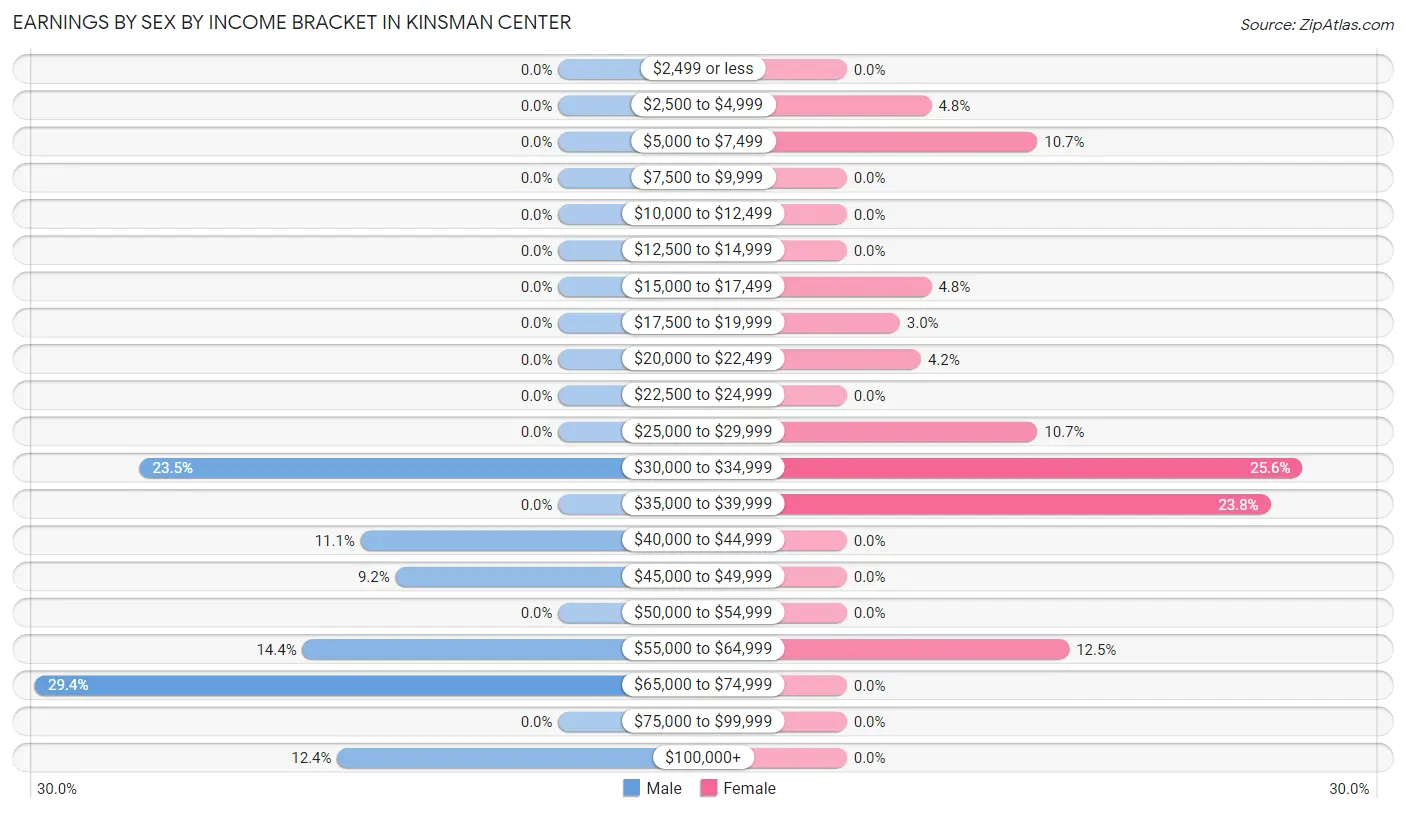
| Income | Male | Female |
| $2,499 or less | 0 (0.0%) | 0 (0.0%) |
| $2,500 to $4,999 | 0 (0.0%) | 8 (4.8%) |
| $5,000 to $7,499 | 0 (0.0%) | 18 (10.7%) |
| $7,500 to $9,999 | 0 (0.0%) | 0 (0.0%) |
| $10,000 to $12,499 | 0 (0.0%) | 0 (0.0%) |
| $12,500 to $14,999 | 0 (0.0%) | 0 (0.0%) |
| $15,000 to $17,499 | 0 (0.0%) | 8 (4.8%) |
| $17,500 to $19,999 | 0 (0.0%) | 5 (3.0%) |
| $20,000 to $22,499 | 0 (0.0%) | 7 (4.2%) |
| $22,500 to $24,999 | 0 (0.0%) | 0 (0.0%) |
| $25,000 to $29,999 | 0 (0.0%) | 18 (10.7%) |
| $30,000 to $34,999 | 36 (23.5%) | 43 (25.6%) |
| $35,000 to $39,999 | 0 (0.0%) | 40 (23.8%) |
| $40,000 to $44,999 | 17 (11.1%) | 0 (0.0%) |
| $45,000 to $49,999 | 14 (9.1%) | 0 (0.0%) |
| $50,000 to $54,999 | 0 (0.0%) | 0 (0.0%) |
| $55,000 to $64,999 | 22 (14.4%) | 21 (12.5%) |
| $65,000 to $74,999 | 45 (29.4%) | 0 (0.0%) |
| $75,000 to $99,999 | 0 (0.0%) | 0 (0.0%) |
| $100,000+ | 19 (12.4%) | 0 (0.0%) |
| Total | 153 (100.0%) | 168 (100.0%) |
Earnings by Sex by Educational Attainment in Kinsman Center
Average earnings in Kinsman Center are $62,159 for men and $32,393 for women, a difference of 47.9%. Men with an educational attainment of high school diploma enjoy the highest average annual earnings of $64,773, while those with high school diploma education earn the least with $64,773. Women with an educational attainment of high school diploma earn the most with the average annual earnings of $38,938, while those with college or associate's degree education have the smallest earnings of $31,000.
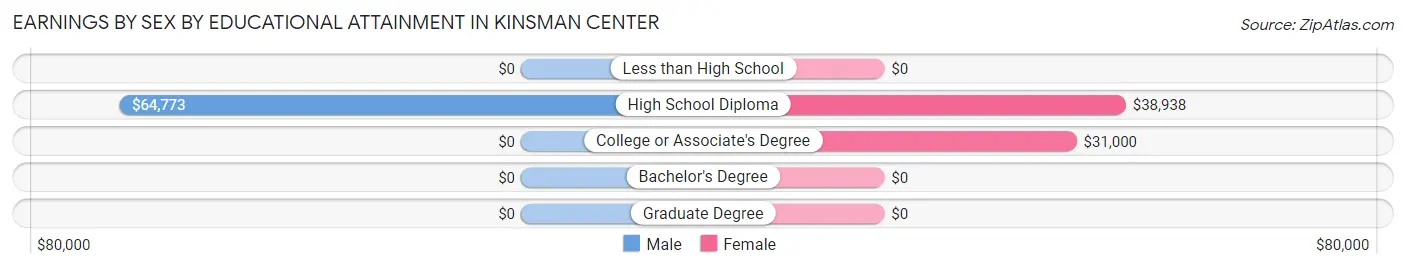
| Educational Attainment | Male Income | Female Income |
| Less than High School | - | - |
| High School Diploma | $64,773 | $38,938 |
| College or Associate's Degree | - | - |
| Bachelor's Degree | - | - |
| Graduate Degree | - | - |
| Total | $62,159 | $32,393 |
Family Income in Kinsman Center
Family Income Brackets in Kinsman Center
According to the Kinsman Center family income data, there are 80 families falling into the $15,000 to $24,999 income range, which is the most common income bracket and makes up 29.4% of all families.
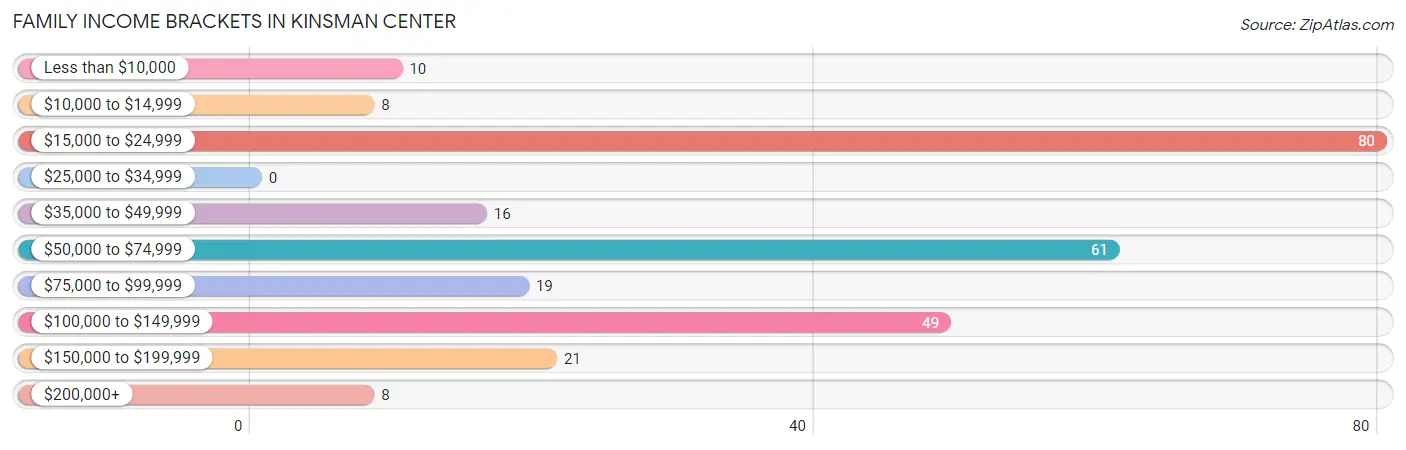
| Income Bracket | # Families | % Families |
| Less than $10,000 | 10 | 3.7% |
| $10,000 to $14,999 | 8 | 2.9% |
| $15,000 to $24,999 | 80 | 29.4% |
| $25,000 to $34,999 | 0 | 0.0% |
| $35,000 to $49,999 | 16 | 5.9% |
| $50,000 to $74,999 | 61 | 22.4% |
| $75,000 to $99,999 | 19 | 7.0% |
| $100,000 to $149,999 | 49 | 18.0% |
| $150,000 to $199,999 | 21 | 7.7% |
| $200,000+ | 8 | 2.9% |
Family Income by Famaliy Size in Kinsman Center
5-person families (25 | 9.2%) account for the highest median family income in Kinsman Center with $161,375 per family, while 5-person families (25 | 9.2%) have the highest median income of $32,275 per family member.
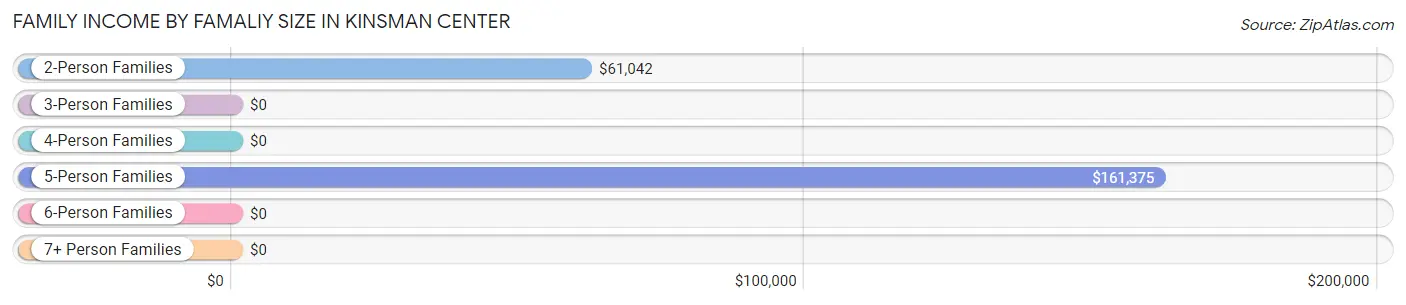
| Income Bracket | # Families | Median Income |
| 2-Person Families | 206 (75.7%) | $61,042 |
| 3-Person Families | 0 (0.0%) | $0 |
| 4-Person Families | 26 (9.6%) | $0 |
| 5-Person Families | 25 (9.2%) | $161,375 |
| 6-Person Families | 15 (5.5%) | $0 |
| 7+ Person Families | 0 (0.0%) | $0 |
| Total | 272 (100.0%) | $61,528 |
Family Income by Number of Earners in Kinsman Center
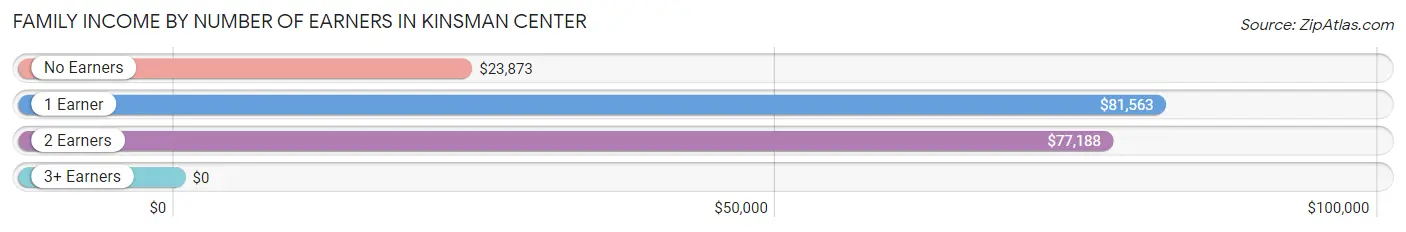
| Number of Earners | # Families | Median Income |
| No Earners | 112 (41.2%) | $23,873 |
| 1 Earner | 50 (18.4%) | $81,563 |
| 2 Earners | 93 (34.2%) | $77,188 |
| 3+ Earners | 17 (6.2%) | $0 |
| Total | 272 (100.0%) | $61,528 |
Household Income in Kinsman Center
Household Income Brackets in Kinsman Center
With 114 households falling in the category, the $15,000 to $24,999 income range is the most frequent in Kinsman Center, accounting for 34.5% of all households.
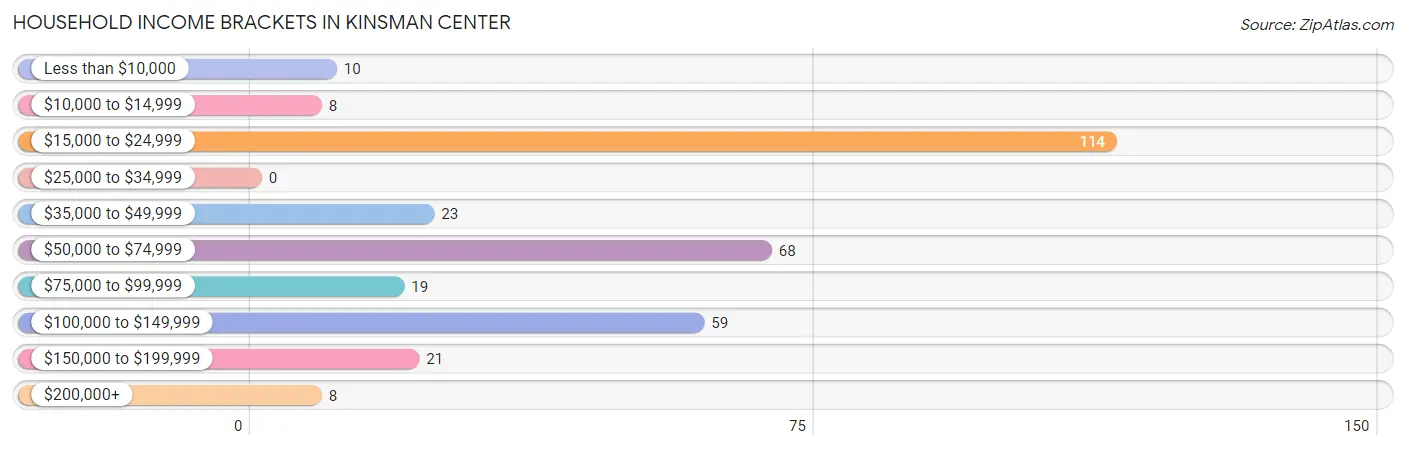
| Income Bracket | # Households | % Households |
| Less than $10,000 | 10 | 3.0% |
| $10,000 to $14,999 | 8 | 2.4% |
| $15,000 to $24,999 | 114 | 34.5% |
| $25,000 to $34,999 | 0 | 0.0% |
| $35,000 to $49,999 | 23 | 7.0% |
| $50,000 to $74,999 | 68 | 20.6% |
| $75,000 to $99,999 | 19 | 5.8% |
| $100,000 to $149,999 | 59 | 17.9% |
| $150,000 to $199,999 | 21 | 6.4% |
| $200,000+ | 8 | 2.4% |
Household Income by Householder Age in Kinsman Center
The median household income in Kinsman Center is $60,694, with the highest median household income of $79,643 found in the 45 to 64 years age bracket for the primary householder. A total of 98 households (29.7%) fall into this category.
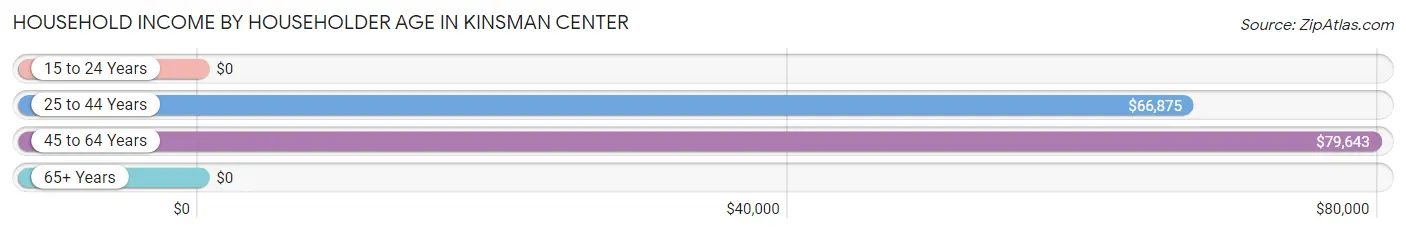
| Income Bracket | # Households | Median Income |
| 15 to 24 Years | 0 (0.0%) | $0 |
| 25 to 44 Years | 73 (22.1%) | $66,875 |
| 45 to 64 Years | 98 (29.7%) | $79,643 |
| 65+ Years | 159 (48.2%) | $0 |
| Total | 330 (100.0%) | $60,694 |
Poverty in Kinsman Center
Income Below Poverty by Sex and Age in Kinsman Center
With 5.8% poverty level for males and 7.0% for females among the residents of Kinsman Center, 6 to 11 year old males and 5 year old females are the most vulnerable to poverty, with 9 males (33.3%) and 9 females (100.0%) in their respective age groups living below the poverty level.
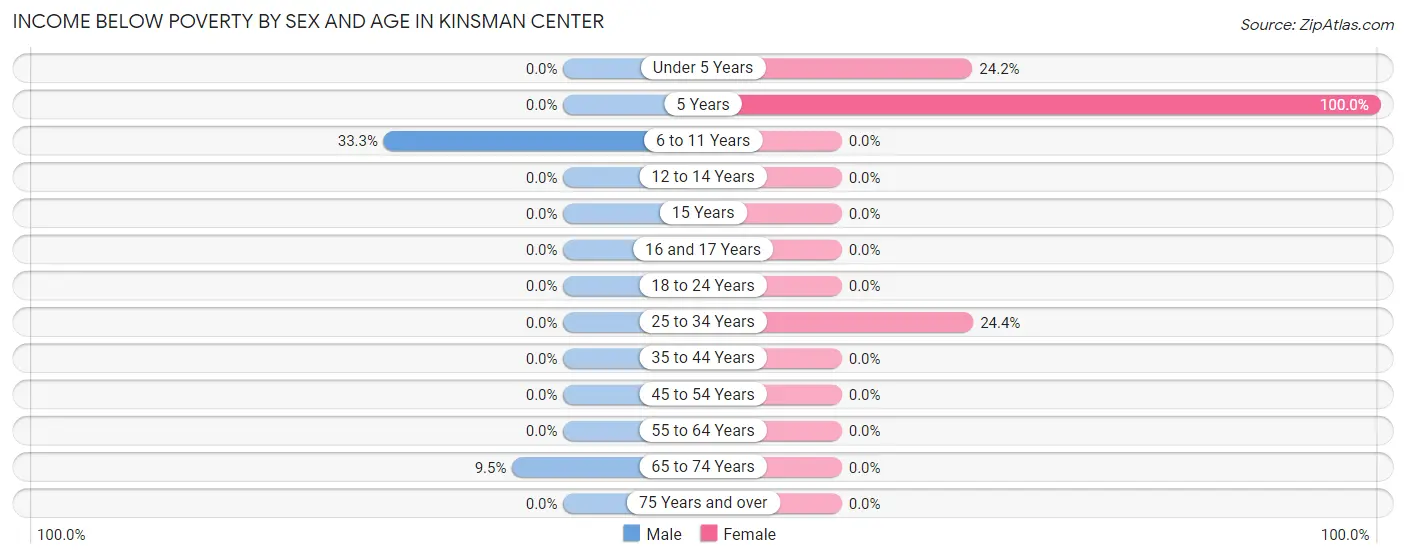
| Age Bracket | Male | Female |
| Under 5 Years | 0 (0.0%) | 8 (24.2%) |
| 5 Years | 0 (0.0%) | 9 (100.0%) |
| 6 to 11 Years | 9 (33.3%) | 0 (0.0%) |
| 12 to 14 Years | 0 (0.0%) | 0 (0.0%) |
| 15 Years | 0 (0.0%) | 0 (0.0%) |
| 16 and 17 Years | 0 (0.0%) | 0 (0.0%) |
| 18 to 24 Years | 0 (0.0%) | 0 (0.0%) |
| 25 to 34 Years | 0 (0.0%) | 10 (24.4%) |
| 35 to 44 Years | 0 (0.0%) | 0 (0.0%) |
| 45 to 54 Years | 0 (0.0%) | 0 (0.0%) |
| 55 to 64 Years | 0 (0.0%) | 0 (0.0%) |
| 65 to 74 Years | 16 (9.5%) | 0 (0.0%) |
| 75 Years and over | 0 (0.0%) | 0 (0.0%) |
| Total | 25 (5.8%) | 27 (7.0%) |
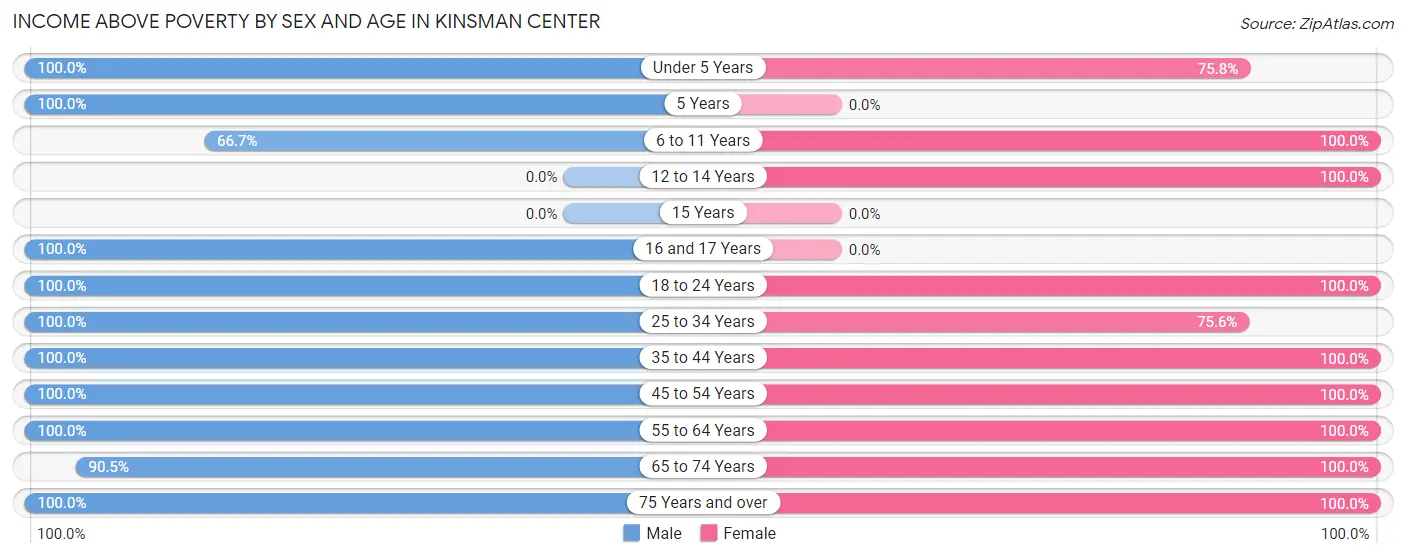
Income Above Poverty by Sex and Age in Kinsman Center
According to the poverty statistics in Kinsman Center, males aged under 5 years and females aged 6 to 11 years are the age groups that are most secure financially, with 100.0% of males and 100.0% of females in these age groups living above the poverty line.
| Age Bracket | Male | Female |
| Under 5 Years | 20 (100.0%) | 25 (75.8%) |
| 5 Years | 11 (100.0%) | 0 (0.0%) |
| 6 to 11 Years | 18 (66.7%) | 15 (100.0%) |
| 12 to 14 Years | 0 (0.0%) | 14 (100.0%) |
| 15 Years | 0 (0.0%) | 0 (0.0%) |
| 16 and 17 Years | 8 (100.0%) | 0 (0.0%) |
| 18 to 24 Years | 24 (100.0%) | 27 (100.0%) |
| 25 to 34 Years | 30 (100.0%) | 31 (75.6%) |
| 35 to 44 Years | 24 (100.0%) | 27 (100.0%) |
| 45 to 54 Years | 19 (100.0%) | 57 (100.0%) |
| 55 to 64 Years | 85 (100.0%) | 50 (100.0%) |
| 65 to 74 Years | 153 (90.5%) | 105 (100.0%) |
| 75 Years and over | 11 (100.0%) | 9 (100.0%) |
| Total | 403 (94.2%) | 360 (93.0%) |
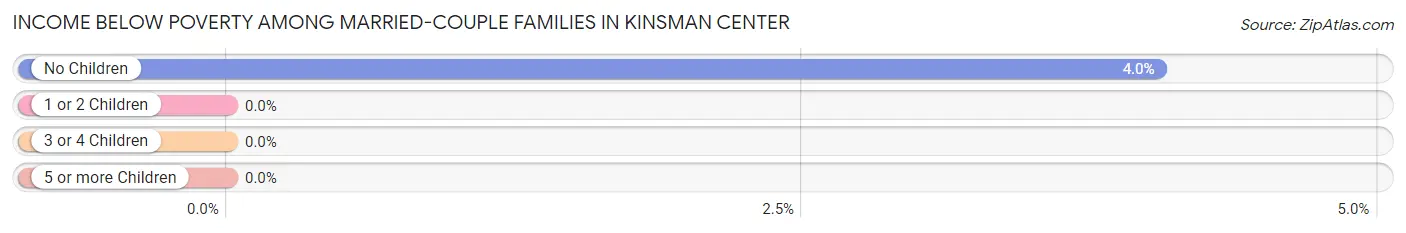
Income Below Poverty Among Married-Couple Families in Kinsman Center
The poverty statistics for married-couple families in Kinsman Center show that 3.2% or 8 of the total 254 families live below the poverty line. Families with no children have the highest poverty rate of 4.0%, comprising of 8 families. On the other hand, families with 1 or 2 children have the lowest poverty rate of 0.0%, which includes 0 families.
| Children | Above Poverty | Below Poverty |
| No Children | 190 (96.0%) | 8 (4.0%) |
| 1 or 2 Children | 33 (100.0%) | 0 (0.0%) |
| 3 or 4 Children | 23 (100.0%) | 0 (0.0%) |
| 5 or more Children | 0 (0.0%) | 0 (0.0%) |
| Total | 246 (96.9%) | 8 (3.2%) |
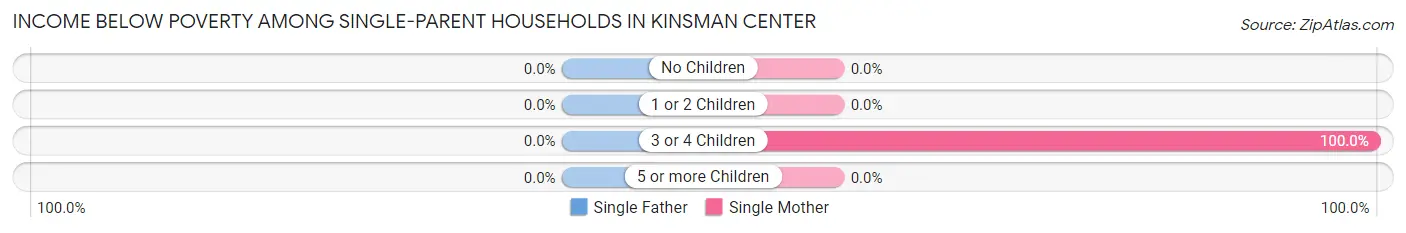
Income Below Poverty Among Single-Parent Households in Kinsman Center
| Children | Single Father | Single Mother |
| No Children | 0 (0.0%) | 0 (0.0%) |
| 1 or 2 Children | 0 (0.0%) | 0 (0.0%) |
| 3 or 4 Children | 0 (0.0%) | 10 (100.0%) |
| 5 or more Children | 0 (0.0%) | 0 (0.0%) |
| Total | 0 (0.0%) | 10 (55.6%) |
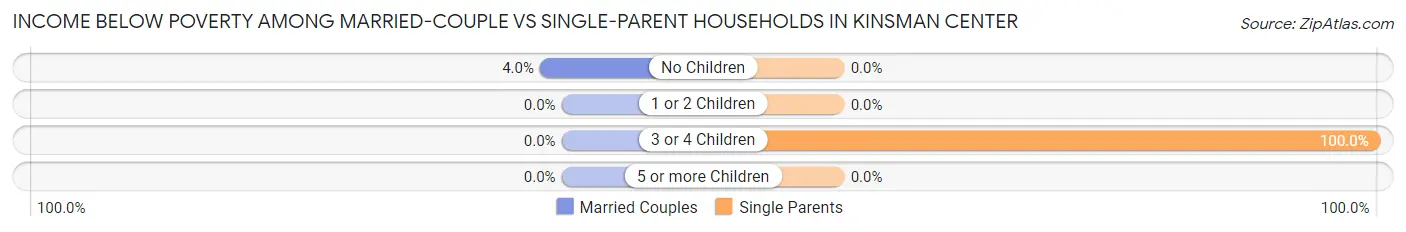
Income Below Poverty Among Married-Couple vs Single-Parent Households in Kinsman Center
The poverty data for Kinsman Center shows that 8 of the married-couple family households (3.2%) and 10 of the single-parent households (55.6%) are living below the poverty level. Within the married-couple family households, those with no children have the highest poverty rate, with 8 households (4.0%) falling below the poverty line. Among the single-parent households, those with 3 or 4 children have the highest poverty rate, with 10 household (100.0%) living below poverty.
| Children | Married-Couple Families | Single-Parent Households |
| No Children | 8 (4.0%) | 0 (0.0%) |
| 1 or 2 Children | 0 (0.0%) | 0 (0.0%) |
| 3 or 4 Children | 0 (0.0%) | 10 (100.0%) |
| 5 or more Children | 0 (0.0%) | 0 (0.0%) |
| Total | 8 (3.2%) | 10 (55.6%) |
Employment Characteristics in Kinsman Center
Employment by Class of Employer in Kinsman Center
Among the 321 employed individuals in Kinsman Center, private company employees (178 | 55.4%), local government employees (79 | 24.6%), and self-employed (not incorporated) (40 | 12.5%) make up the most common classes of employment.
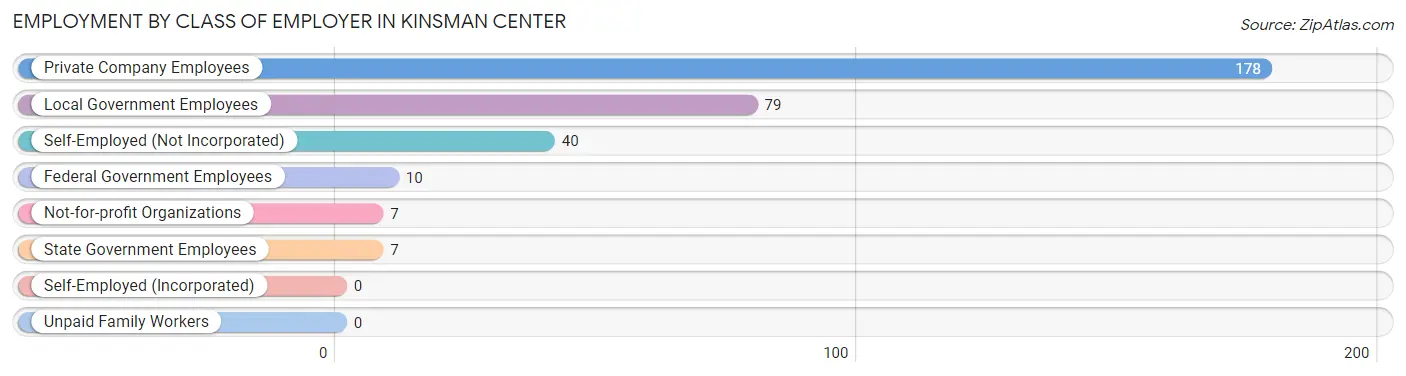
| Employer Class | # Employees | % Employees |
| Private Company Employees | 178 | 55.4% |
| Self-Employed (Incorporated) | 0 | 0.0% |
| Self-Employed (Not Incorporated) | 40 | 12.5% |
| Not-for-profit Organizations | 7 | 2.2% |
| Local Government Employees | 79 | 24.6% |
| State Government Employees | 7 | 2.2% |
| Federal Government Employees | 10 | 3.1% |
| Unpaid Family Workers | 0 | 0.0% |
| Total | 321 | 100.0% |
Employment Status by Age in Kinsman Center
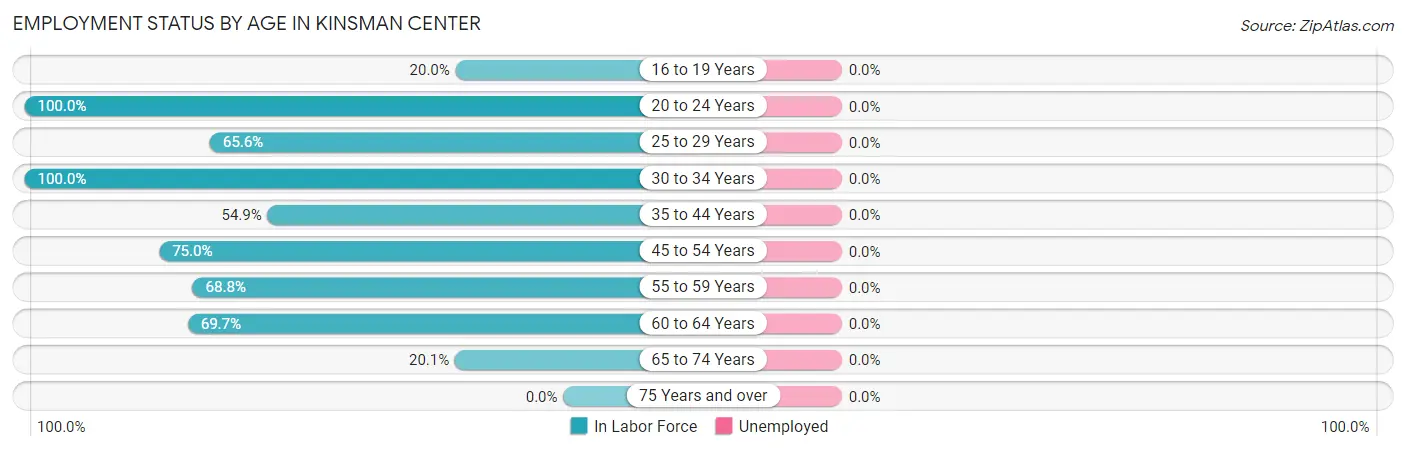
| Age Bracket | In Labor Force | Unemployed |
| 16 to 19 Years | 8 (20.0%) | 0 (0.0%) |
| 20 to 24 Years | 19 (100.0%) | 0 (0.0%) |
| 25 to 29 Years | 21 (65.6%) | 0 (0.0%) |
| 30 to 34 Years | 39 (100.0%) | 0 (0.0%) |
| 35 to 44 Years | 28 (54.9%) | 0 (0.0%) |
| 45 to 54 Years | 57 (75.0%) | 0 (0.0%) |
| 55 to 59 Years | 11 (68.8%) | 0 (0.0%) |
| 60 to 64 Years | 83 (69.7%) | 0 (0.0%) |
| 65 to 74 Years | 55 (20.1%) | 0 (0.0%) |
| 75 Years and over | 0 (0.0%) | 0 (0.0%) |
| Total | 321 (46.8%) | 0 (0.0%) |
Employment Status by Educational Attainment in Kinsman Center
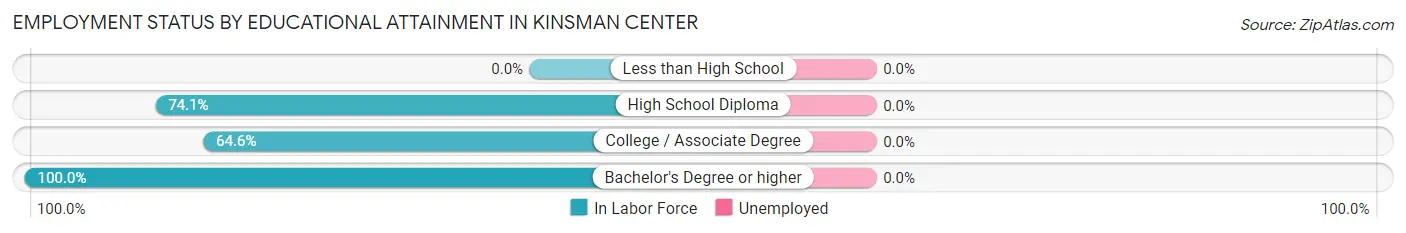
| Educational Attainment | In Labor Force | Unemployed |
| Less than High School | 0 (0.0%) | 0 (0.0%) |
| High School Diploma | 140 (74.1%) | 0 (0.0%) |
| College / Associate Degree | 82 (64.6%) | 0 (0.0%) |
| Bachelor's Degree or higher | 17 (100.0%) | 0 (0.0%) |
| Total | 239 (71.8%) | 0 (0.0%) |
Employment Occupations by Sex in Kinsman Center
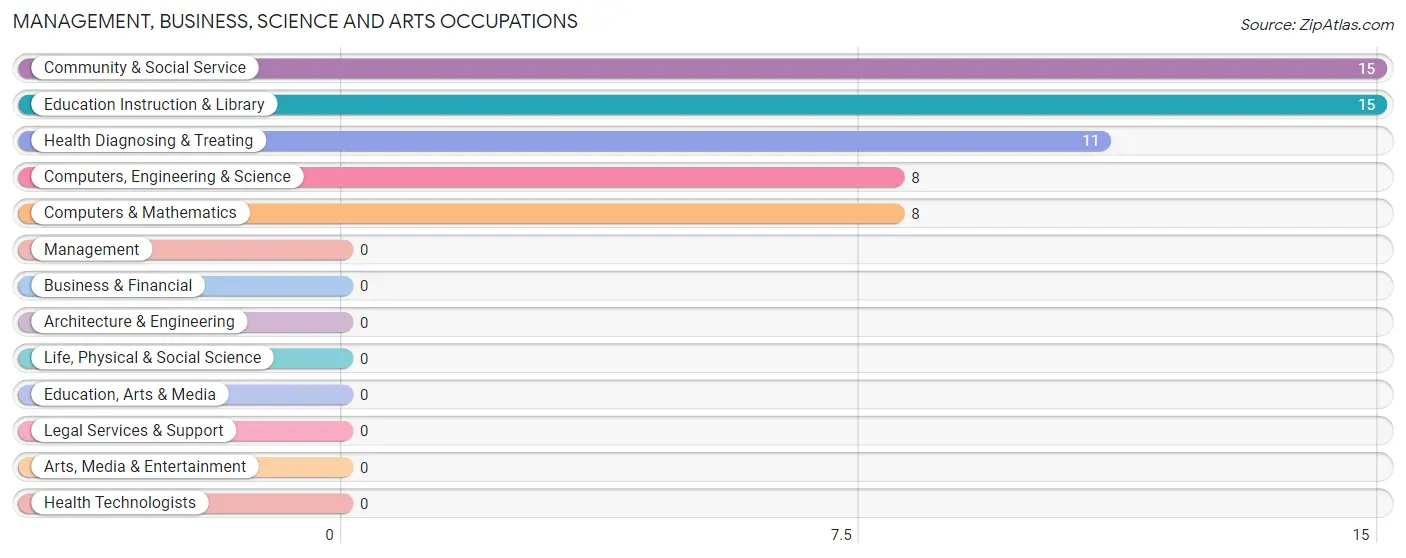
Management, Business, Science and Arts Occupations
The most common Management, Business, Science and Arts occupations in Kinsman Center are Community & Social Service (15 | 4.7%), Education Instruction & Library (15 | 4.7%), Health Diagnosing & Treating (11 | 3.4%), Computers, Engineering & Science (8 | 2.5%), and Computers & Mathematics (8 | 2.5%).
Management, Business, Science and Arts Occupations by Sex
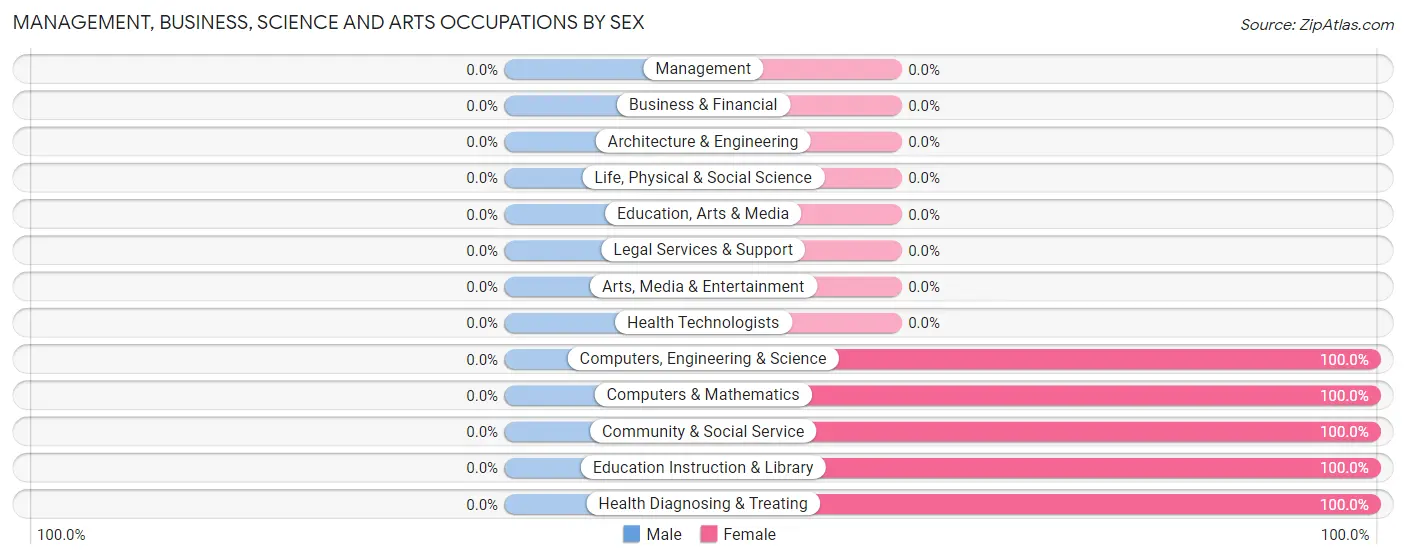
| Occupation | Male | Female |
| Management | 0 (0.0%) | 0 (0.0%) |
| Business & Financial | 0 (0.0%) | 0 (0.0%) |
| Computers, Engineering & Science | 0 (0.0%) | 8 (100.0%) |
| Computers & Mathematics | 0 (0.0%) | 8 (100.0%) |
| Architecture & Engineering | 0 (0.0%) | 0 (0.0%) |
| Life, Physical & Social Science | 0 (0.0%) | 0 (0.0%) |
| Community & Social Service | 0 (0.0%) | 15 (100.0%) |
| Education, Arts & Media | 0 (0.0%) | 0 (0.0%) |
| Legal Services & Support | 0 (0.0%) | 0 (0.0%) |
| Education Instruction & Library | 0 (0.0%) | 15 (100.0%) |
| Arts, Media & Entertainment | 0 (0.0%) | 0 (0.0%) |
| Health Diagnosing & Treating | 0 (0.0%) | 11 (100.0%) |
| Health Technologists | 0 (0.0%) | 0 (0.0%) |
| Total (Category) | 0 (0.0%) | 34 (100.0%) |
| Total (Overall) | 153 (47.7%) | 168 (52.3%) |
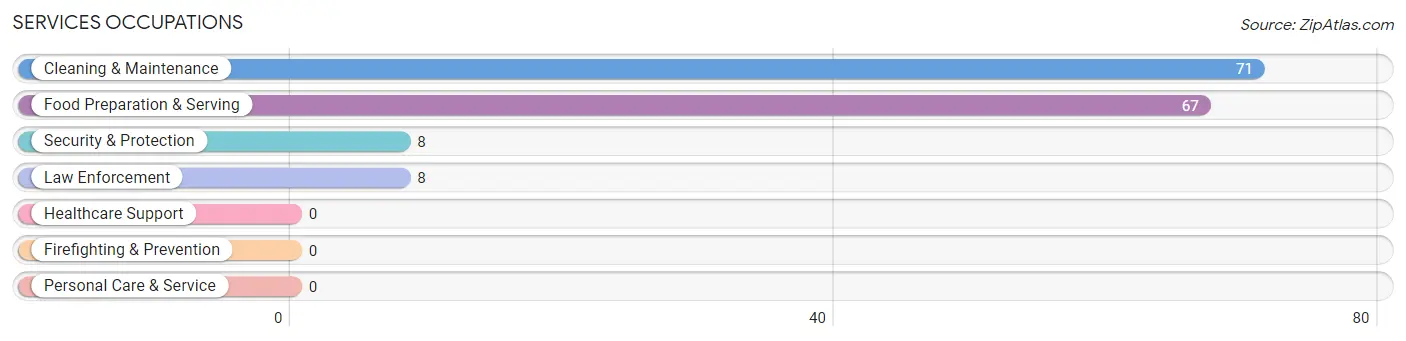
Services Occupations
The most common Services occupations in Kinsman Center are Cleaning & Maintenance (71 | 22.1%), Food Preparation & Serving (67 | 20.9%), Security & Protection (8 | 2.5%), and Law Enforcement (8 | 2.5%).
Services Occupations by Sex
Within the Services occupations in Kinsman Center, the most male-oriented occupations are Security & Protection (100.0%), Law Enforcement (100.0%), and Cleaning & Maintenance (50.7%), while the most female-oriented occupations are Food Preparation & Serving (94.0%), and Cleaning & Maintenance (49.3%).
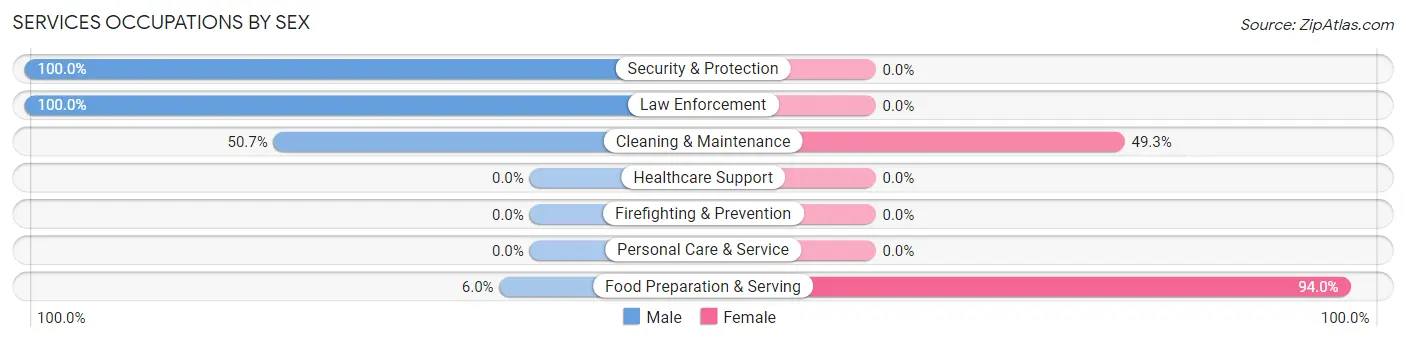
| Occupation | Male | Female |
| Healthcare Support | 0 (0.0%) | 0 (0.0%) |
| Security & Protection | 8 (100.0%) | 0 (0.0%) |
| Firefighting & Prevention | 0 (0.0%) | 0 (0.0%) |
| Law Enforcement | 8 (100.0%) | 0 (0.0%) |
| Food Preparation & Serving | 4 (6.0%) | 63 (94.0%) |
| Cleaning & Maintenance | 36 (50.7%) | 35 (49.3%) |
| Personal Care & Service | 0 (0.0%) | 0 (0.0%) |
| Total (Category) | 48 (32.9%) | 98 (67.1%) |
| Total (Overall) | 153 (47.7%) | 168 (52.3%) |
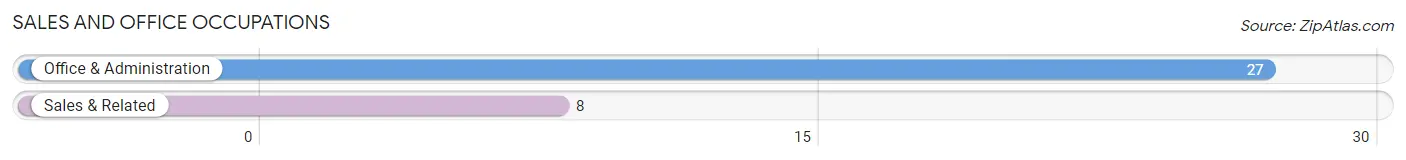
Sales and Office Occupations
The most common Sales and Office occupations in Kinsman Center are Office & Administration (27 | 8.4%), and Sales & Related (8 | 2.5%).
Sales and Office Occupations by Sex
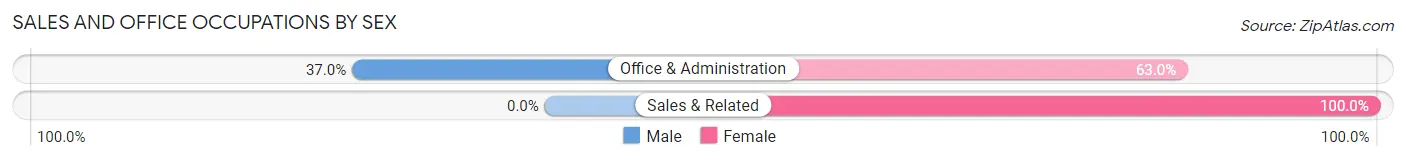
| Occupation | Male | Female |
| Sales & Related | 0 (0.0%) | 8 (100.0%) |
| Office & Administration | 10 (37.0%) | 17 (63.0%) |
| Total (Category) | 10 (28.6%) | 25 (71.4%) |
| Total (Overall) | 153 (47.7%) | 168 (52.3%) |
Natural Resources, Construction and Maintenance Occupations
The most common Natural Resources, Construction and Maintenance occupations in Kinsman Center are , and Construction & Extraction (7 | 2.2%).
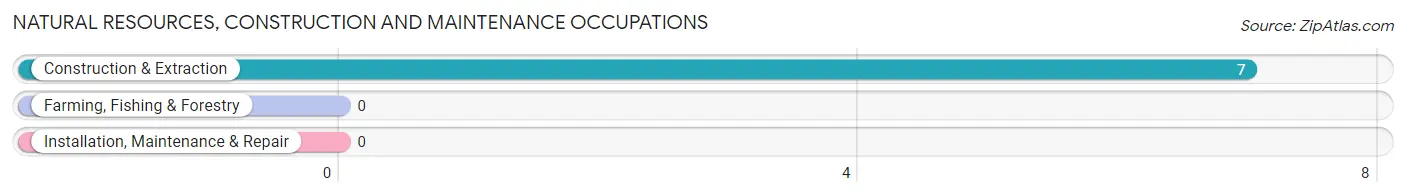
Natural Resources, Construction and Maintenance Occupations by Sex
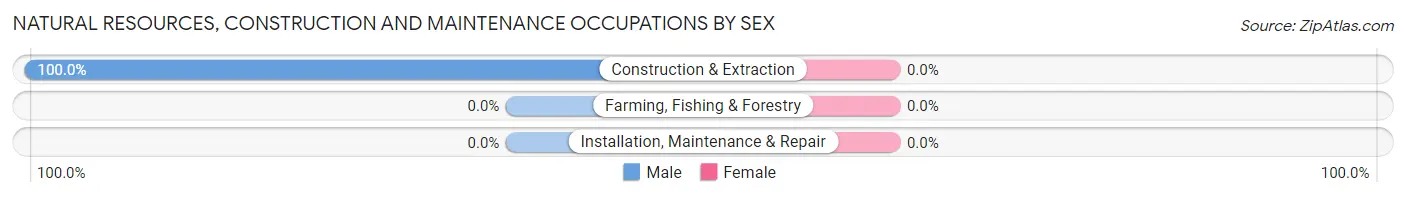
| Occupation | Male | Female |
| Farming, Fishing & Forestry | 0 (0.0%) | 0 (0.0%) |
| Construction & Extraction | 7 (100.0%) | 0 (0.0%) |
| Installation, Maintenance & Repair | 0 (0.0%) | 0 (0.0%) |
| Total (Category) | 7 (100.0%) | 0 (0.0%) |
| Total (Overall) | 153 (47.7%) | 168 (52.3%) |
Production, Transportation and Moving Occupations
The most common Production, Transportation and Moving occupations in Kinsman Center are Production (88 | 27.4%), and Transportation (11 | 3.4%).
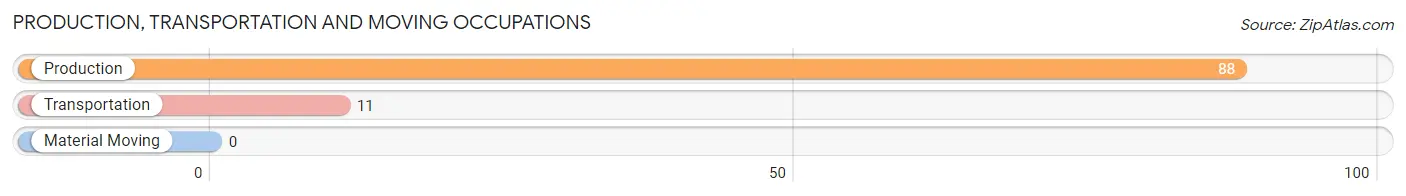
Production, Transportation and Moving Occupations by Sex
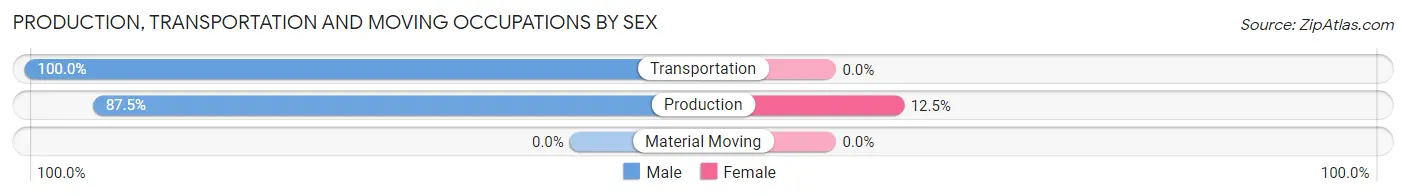
| Occupation | Male | Female |
| Production | 77 (87.5%) | 11 (12.5%) |
| Transportation | 11 (100.0%) | 0 (0.0%) |
| Material Moving | 0 (0.0%) | 0 (0.0%) |
| Total (Category) | 88 (88.9%) | 11 (11.1%) |
| Total (Overall) | 153 (47.7%) | 168 (52.3%) |
Employment Industries by Sex in Kinsman Center
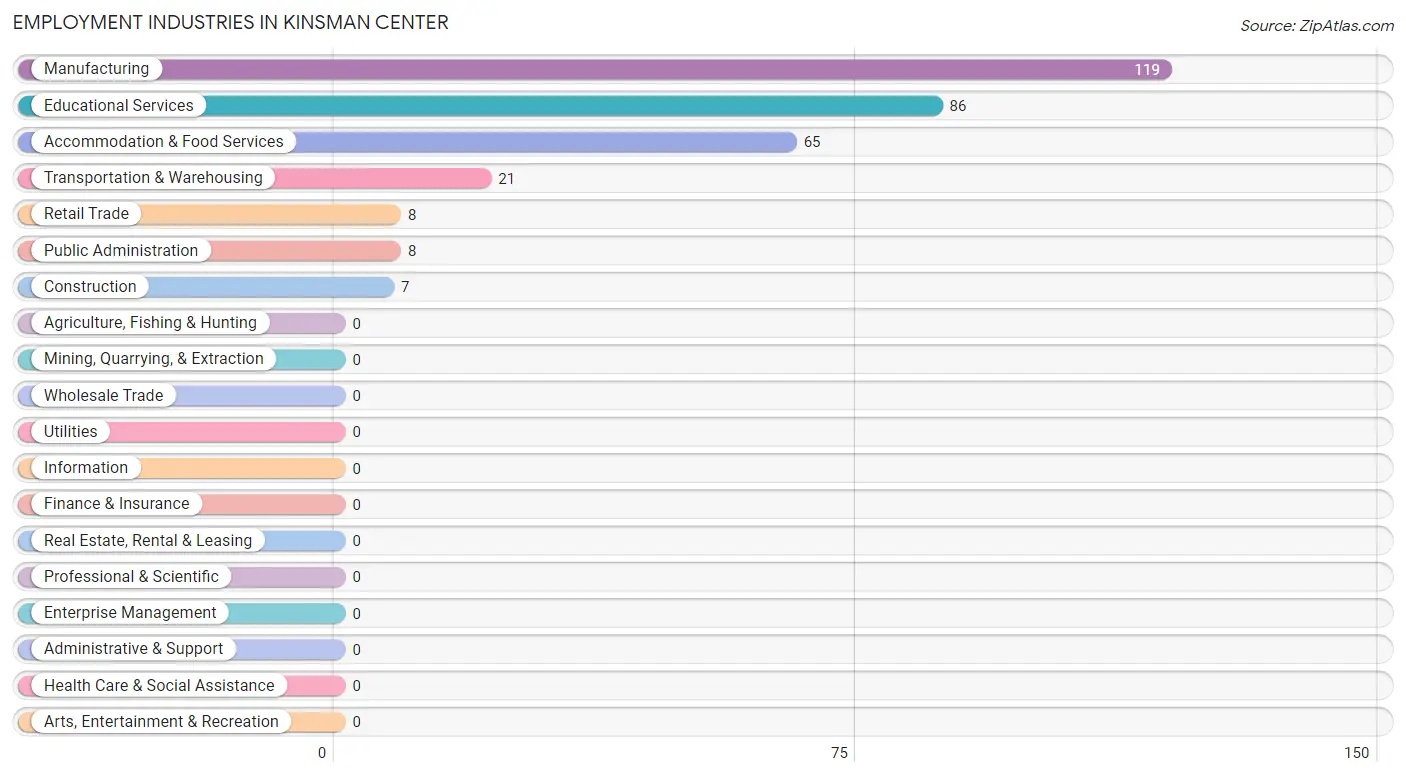
Employment Industries in Kinsman Center
The major employment industries in Kinsman Center include Manufacturing (119 | 37.1%), Educational Services (86 | 26.8%), Accommodation & Food Services (65 | 20.3%), Transportation & Warehousing (21 | 6.5%), and Retail Trade (8 | 2.5%).
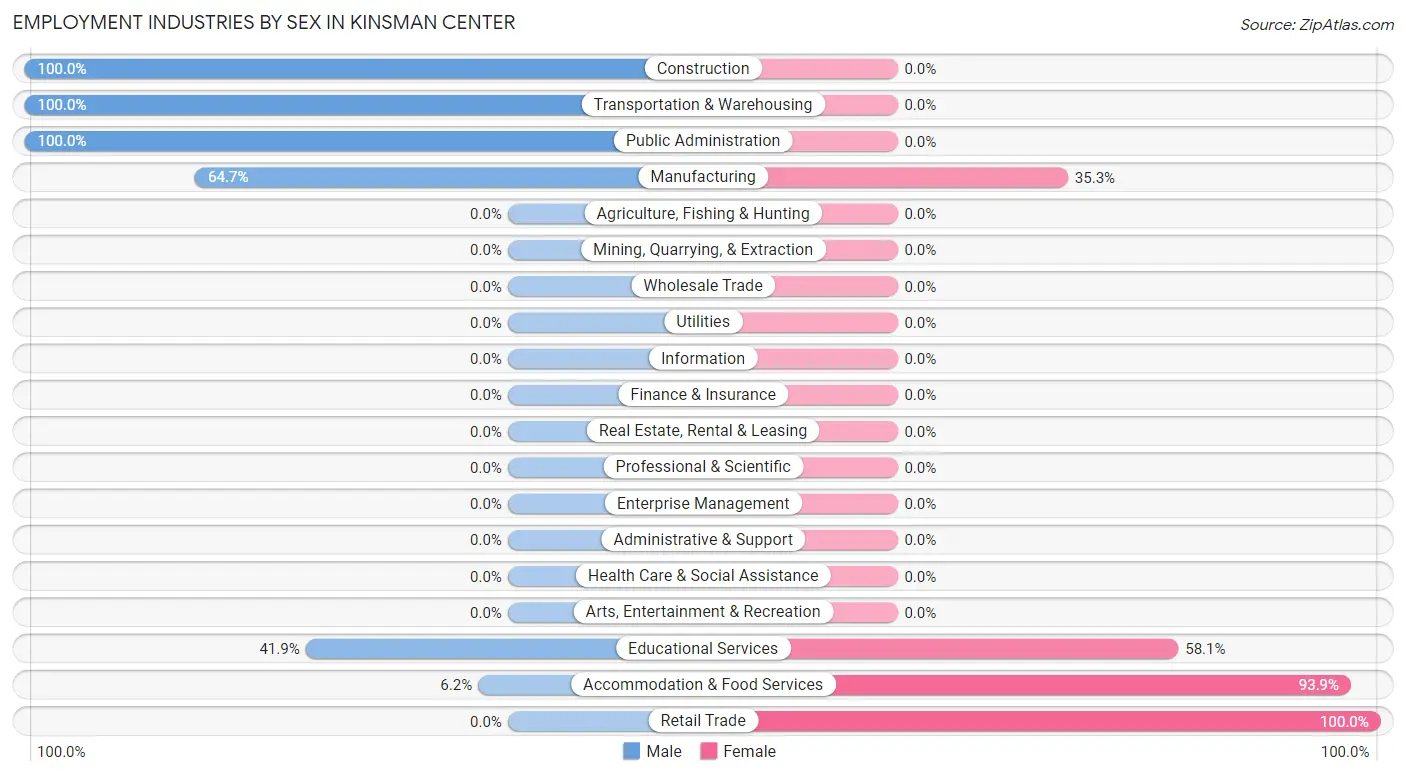
Employment Industries by Sex in Kinsman Center
The Kinsman Center industries that see more men than women are Construction (100.0%), Transportation & Warehousing (100.0%), and Public Administration (100.0%), whereas the industries that tend to have a higher number of women are Retail Trade (100.0%), Accommodation & Food Services (93.9%), and Educational Services (58.1%).
| Industry | Male | Female |
| Agriculture, Fishing & Hunting | 0 (0.0%) | 0 (0.0%) |
| Mining, Quarrying, & Extraction | 0 (0.0%) | 0 (0.0%) |
| Construction | 7 (100.0%) | 0 (0.0%) |
| Manufacturing | 77 (64.7%) | 42 (35.3%) |
| Wholesale Trade | 0 (0.0%) | 0 (0.0%) |
| Retail Trade | 0 (0.0%) | 8 (100.0%) |
| Transportation & Warehousing | 21 (100.0%) | 0 (0.0%) |
| Utilities | 0 (0.0%) | 0 (0.0%) |
| Information | 0 (0.0%) | 0 (0.0%) |
| Finance & Insurance | 0 (0.0%) | 0 (0.0%) |
| Real Estate, Rental & Leasing | 0 (0.0%) | 0 (0.0%) |
| Professional & Scientific | 0 (0.0%) | 0 (0.0%) |
| Enterprise Management | 0 (0.0%) | 0 (0.0%) |
| Administrative & Support | 0 (0.0%) | 0 (0.0%) |
| Educational Services | 36 (41.9%) | 50 (58.1%) |
| Health Care & Social Assistance | 0 (0.0%) | 0 (0.0%) |
| Arts, Entertainment & Recreation | 0 (0.0%) | 0 (0.0%) |
| Accommodation & Food Services | 4 (6.1%) | 61 (93.9%) |
| Public Administration | 8 (100.0%) | 0 (0.0%) |
| Total | 153 (47.7%) | 168 (52.3%) |
Education in Kinsman Center
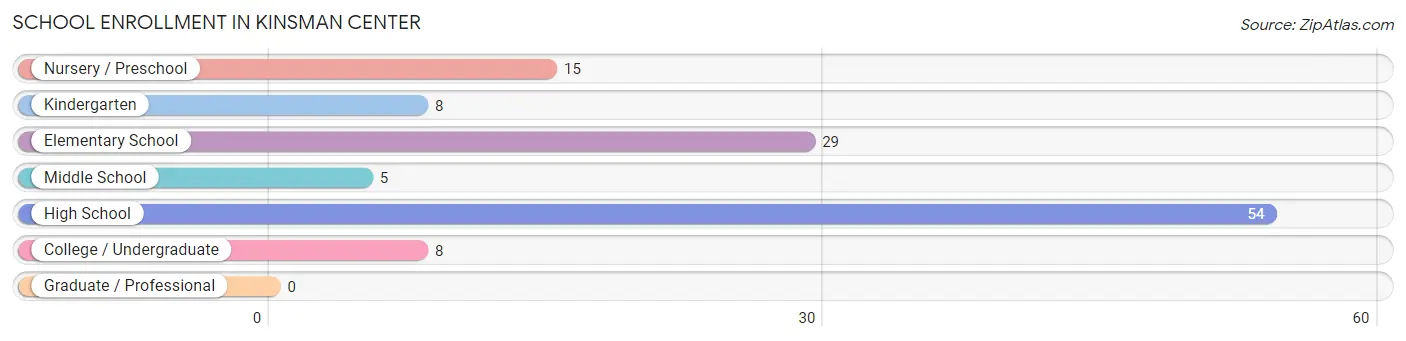
School Enrollment in Kinsman Center
The most common levels of schooling among the 119 students in Kinsman Center are high school (54 | 45.4%), elementary school (29 | 24.4%), and nursery / preschool (15 | 12.6%).
| School Level | # Students | % Students |
| Nursery / Preschool | 15 | 12.6% |
| Kindergarten | 8 | 6.7% |
| Elementary School | 29 | 24.4% |
| Middle School | 5 | 4.2% |
| High School | 54 | 45.4% |
| College / Undergraduate | 8 | 6.7% |
| Graduate / Professional | 0 | 0.0% |
| Total | 119 | 100.0% |
School Enrollment by Age by Funding Source in Kinsman Center
Out of a total of 119 students who are enrolled in schools in Kinsman Center, 29 (24.4%) attend a private institution, while the remaining 90 (75.6%) are enrolled in public schools. The age group of 15 to 17 year olds has the highest likelihood of being enrolled in private schools, with 8 (100.0% in the age bracket) enrolled. Conversely, the age group of 3 to 4 year olds has the lowest likelihood of being enrolled in a private school, with 4 (100.0% in the age bracket) attending a public institution.
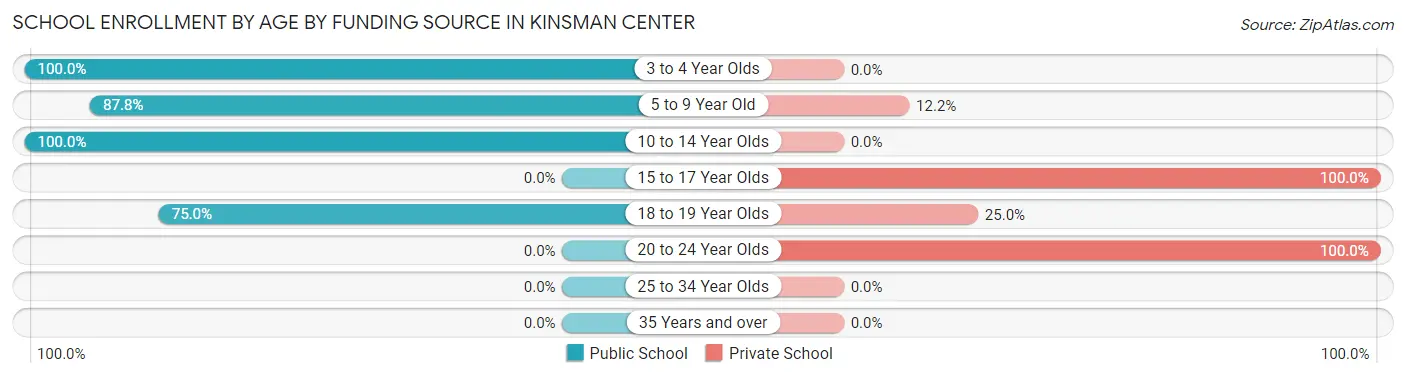
| Age Bracket | Public School | Private School |
| 3 to 4 Year Olds | 4 (100.0%) | 0 (0.0%) |
| 5 to 9 Year Old | 36 (87.8%) | 5 (12.2%) |
| 10 to 14 Year Olds | 26 (100.0%) | 0 (0.0%) |
| 15 to 17 Year Olds | 0 (0.0%) | 8 (100.0%) |
| 18 to 19 Year Olds | 24 (75.0%) | 8 (25.0%) |
| 20 to 24 Year Olds | 0 (0.0%) | 8 (100.0%) |
| 25 to 34 Year Olds | 0 (0.0%) | 0 (0.0%) |
| 35 Years and over | 0 (0.0%) | 0 (0.0%) |
| Total | 90 (75.6%) | 29 (24.4%) |
Educational Attainment by Field of Study in Kinsman Center
Education (16 | 61.5%), and engineering (10 | 38.5%) are the most common fields of study among 26 individuals in Kinsman Center who have obtained a bachelor's degree or higher.
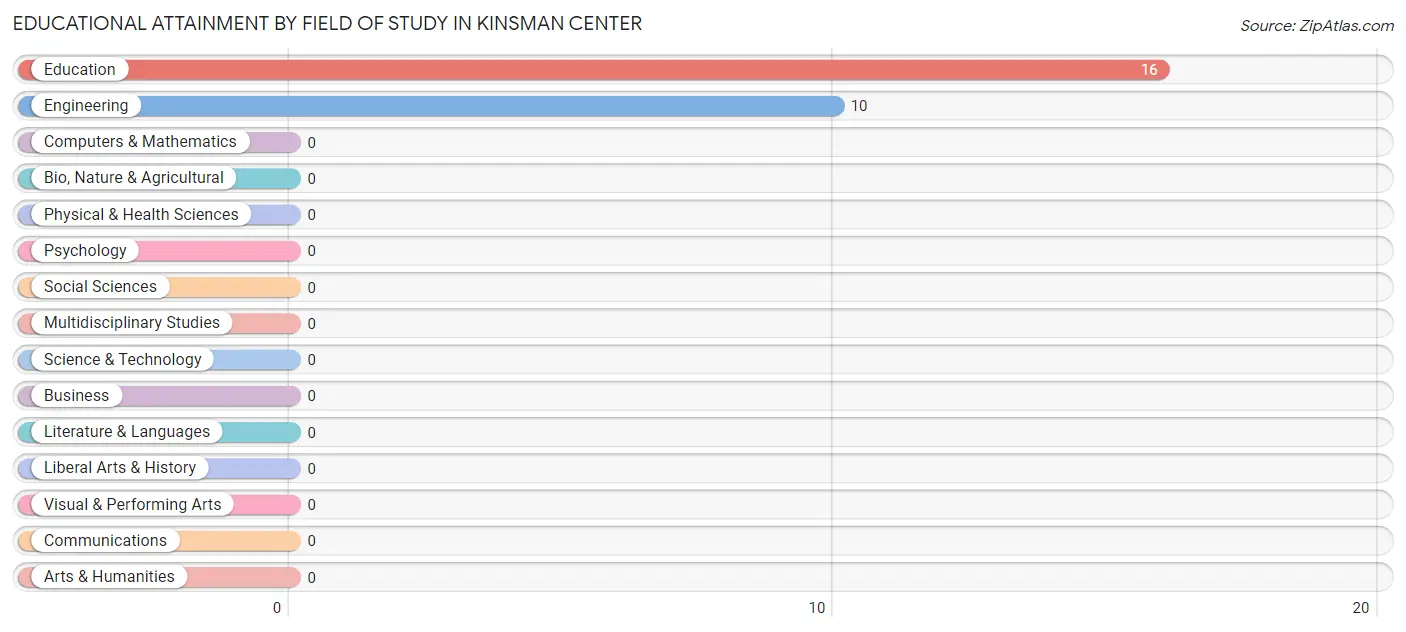
| Field of Study | # Graduates | % Graduates |
| Computers & Mathematics | 0 | 0.0% |
| Bio, Nature & Agricultural | 0 | 0.0% |
| Physical & Health Sciences | 0 | 0.0% |
| Psychology | 0 | 0.0% |
| Social Sciences | 0 | 0.0% |
| Engineering | 10 | 38.5% |
| Multidisciplinary Studies | 0 | 0.0% |
| Science & Technology | 0 | 0.0% |
| Business | 0 | 0.0% |
| Education | 16 | 61.5% |
| Literature & Languages | 0 | 0.0% |
| Liberal Arts & History | 0 | 0.0% |
| Visual & Performing Arts | 0 | 0.0% |
| Communications | 0 | 0.0% |
| Arts & Humanities | 0 | 0.0% |
| Total | 26 | 100.0% |
Transportation & Commute in Kinsman Center
Vehicle Availability by Sex in Kinsman Center
The most prevalent vehicle ownership categories in Kinsman Center are males with 2 vehicles (121, accounting for 79.1%) and females with 2 vehicles (131, making up 72.0%).
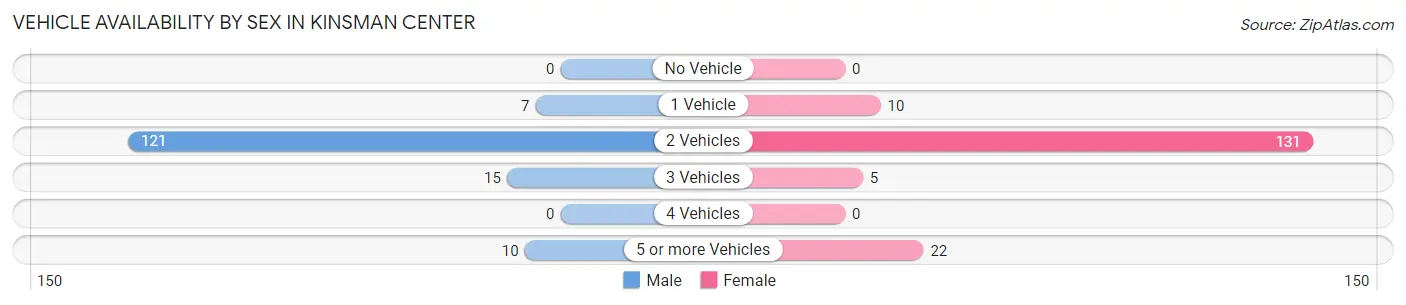
| Vehicles Available | Male | Female |
| No Vehicle | 0 (0.0%) | 0 (0.0%) |
| 1 Vehicle | 7 (4.6%) | 10 (5.9%) |
| 2 Vehicles | 121 (79.1%) | 131 (78.0%) |
| 3 Vehicles | 15 (9.8%) | 5 (3.0%) |
| 4 Vehicles | 0 (0.0%) | 0 (0.0%) |
| 5 or more Vehicles | 10 (6.5%) | 22 (13.1%) |
| Total | 153 (100.0%) | 168 (100.0%) |
Commute Time in Kinsman Center
The most frequently occuring commute durations in Kinsman Center are 30 to 34 minutes (138 commuters, 50.4%), 20 to 24 minutes (43 commuters, 15.7%), and 35 to 39 minutes (21 commuters, 7.7%).
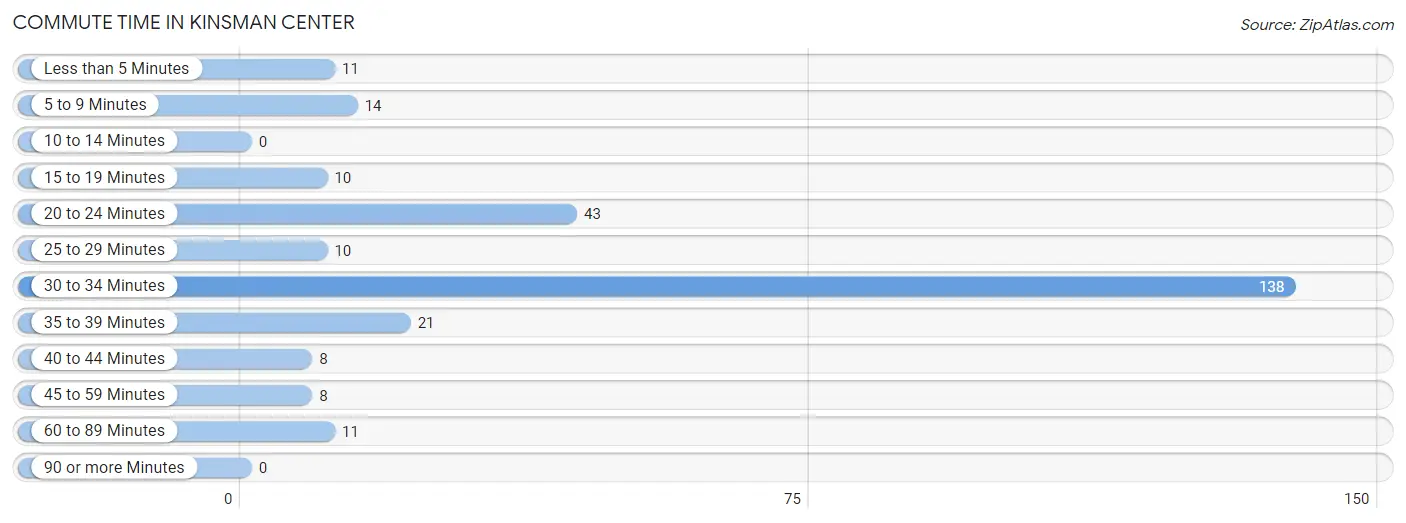
| Commute Time | # Commuters | % Commuters |
| Less than 5 Minutes | 11 | 4.0% |
| 5 to 9 Minutes | 14 | 5.1% |
| 10 to 14 Minutes | 0 | 0.0% |
| 15 to 19 Minutes | 10 | 3.6% |
| 20 to 24 Minutes | 43 | 15.7% |
| 25 to 29 Minutes | 10 | 3.6% |
| 30 to 34 Minutes | 138 | 50.4% |
| 35 to 39 Minutes | 21 | 7.7% |
| 40 to 44 Minutes | 8 | 2.9% |
| 45 to 59 Minutes | 8 | 2.9% |
| 60 to 89 Minutes | 11 | 4.0% |
| 90 or more Minutes | 0 | 0.0% |
Commute Time by Sex in Kinsman Center
The most common commute times in Kinsman Center are 30 to 34 minutes (71 commuters, 46.4%) for males and 30 to 34 minutes (67 commuters, 55.4%) for females.
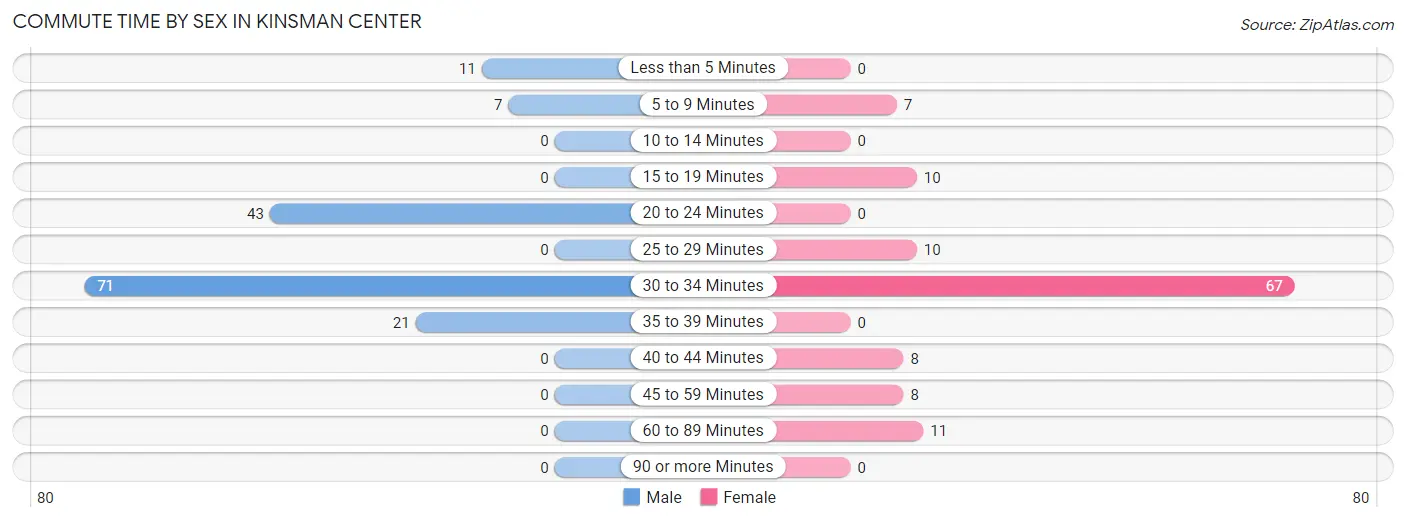
| Commute Time | Male | Female |
| Less than 5 Minutes | 11 (7.2%) | 0 (0.0%) |
| 5 to 9 Minutes | 7 (4.6%) | 7 (5.8%) |
| 10 to 14 Minutes | 0 (0.0%) | 0 (0.0%) |
| 15 to 19 Minutes | 0 (0.0%) | 10 (8.3%) |
| 20 to 24 Minutes | 43 (28.1%) | 0 (0.0%) |
| 25 to 29 Minutes | 0 (0.0%) | 10 (8.3%) |
| 30 to 34 Minutes | 71 (46.4%) | 67 (55.4%) |
| 35 to 39 Minutes | 21 (13.7%) | 0 (0.0%) |
| 40 to 44 Minutes | 0 (0.0%) | 8 (6.6%) |
| 45 to 59 Minutes | 0 (0.0%) | 8 (6.6%) |
| 60 to 89 Minutes | 0 (0.0%) | 11 (9.1%) |
| 90 or more Minutes | 0 (0.0%) | 0 (0.0%) |
Time of Departure to Work by Sex in Kinsman Center
The most frequent times of departure to work in Kinsman Center are 12:00 PM to 3:59 PM (80, 52.3%) for males and 9:00 AM to 9:59 AM (43, 35.5%) for females.
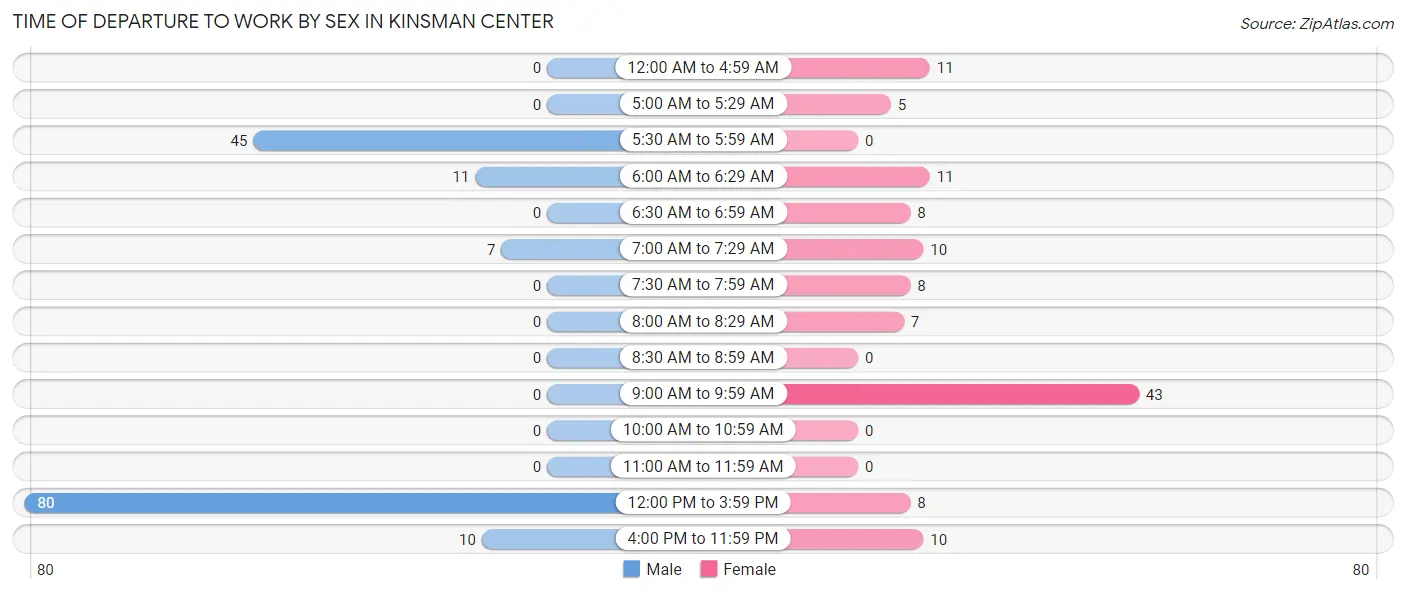
| Time of Departure | Male | Female |
| 12:00 AM to 4:59 AM | 0 (0.0%) | 11 (9.1%) |
| 5:00 AM to 5:29 AM | 0 (0.0%) | 5 (4.1%) |
| 5:30 AM to 5:59 AM | 45 (29.4%) | 0 (0.0%) |
| 6:00 AM to 6:29 AM | 11 (7.2%) | 11 (9.1%) |
| 6:30 AM to 6:59 AM | 0 (0.0%) | 8 (6.6%) |
| 7:00 AM to 7:29 AM | 7 (4.6%) | 10 (8.3%) |
| 7:30 AM to 7:59 AM | 0 (0.0%) | 8 (6.6%) |
| 8:00 AM to 8:29 AM | 0 (0.0%) | 7 (5.8%) |
| 8:30 AM to 8:59 AM | 0 (0.0%) | 0 (0.0%) |
| 9:00 AM to 9:59 AM | 0 (0.0%) | 43 (35.5%) |
| 10:00 AM to 10:59 AM | 0 (0.0%) | 0 (0.0%) |
| 11:00 AM to 11:59 AM | 0 (0.0%) | 0 (0.0%) |
| 12:00 PM to 3:59 PM | 80 (52.3%) | 8 (6.6%) |
| 4:00 PM to 11:59 PM | 10 (6.5%) | 10 (8.3%) |
| Total | 153 (100.0%) | 121 (100.0%) |
Housing Occupancy in Kinsman Center
Occupancy by Ownership in Kinsman Center
Of the total 330 dwellings in Kinsman Center, owner-occupied units account for 275 (83.3%), while renter-occupied units make up 55 (16.7%).
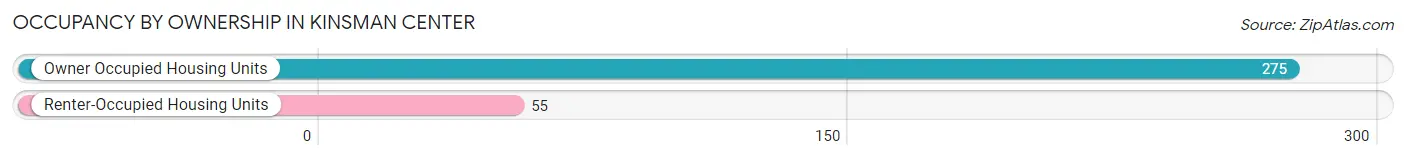
| Occupancy | # Housing Units | % Housing Units |
| Owner Occupied Housing Units | 275 | 83.3% |
| Renter-Occupied Housing Units | 55 | 16.7% |
| Total Occupied Housing Units | 330 | 100.0% |
Occupancy by Household Size in Kinsman Center
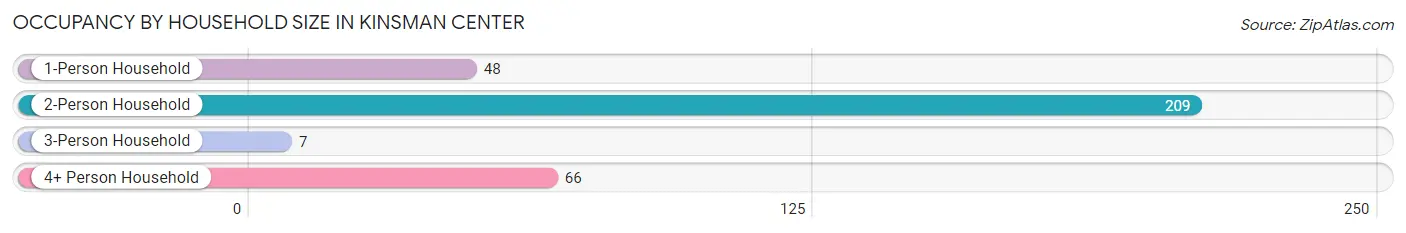
| Household Size | # Housing Units | % Housing Units |
| 1-Person Household | 48 | 14.5% |
| 2-Person Household | 209 | 63.3% |
| 3-Person Household | 7 | 2.1% |
| 4+ Person Household | 66 | 20.0% |
| Total Housing Units | 330 | 100.0% |
Occupancy by Ownership by Household Size in Kinsman Center
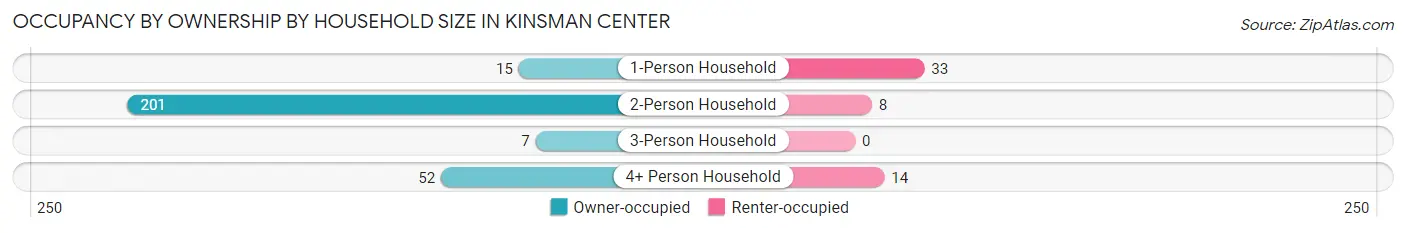
| Household Size | Owner-occupied | Renter-occupied |
| 1-Person Household | 15 (31.2%) | 33 (68.8%) |
| 2-Person Household | 201 (96.2%) | 8 (3.8%) |
| 3-Person Household | 7 (100.0%) | 0 (0.0%) |
| 4+ Person Household | 52 (78.8%) | 14 (21.2%) |
| Total Housing Units | 275 (83.3%) | 55 (16.7%) |
Occupancy by Educational Attainment in Kinsman Center
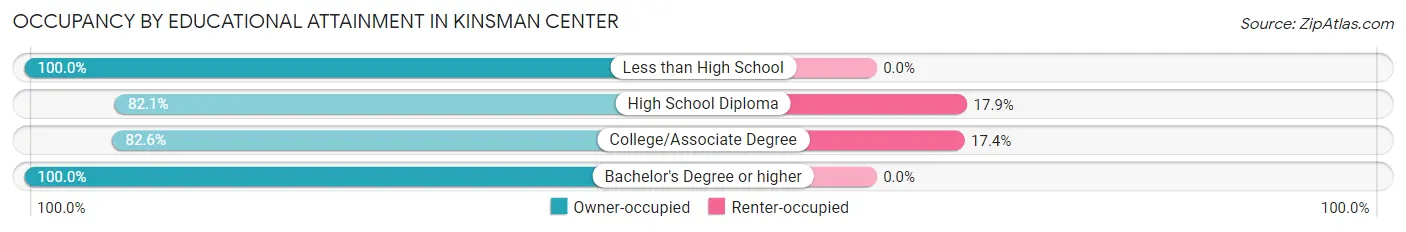
| Household Size | Owner-occupied | Renter-occupied |
| Less than High School | 11 (100.0%) | 0 (0.0%) |
| High School Diploma | 183 (82.1%) | 40 (17.9%) |
| College/Associate Degree | 71 (82.6%) | 15 (17.4%) |
| Bachelor's Degree or higher | 10 (100.0%) | 0 (0.0%) |
Occupancy by Age of Householder in Kinsman Center
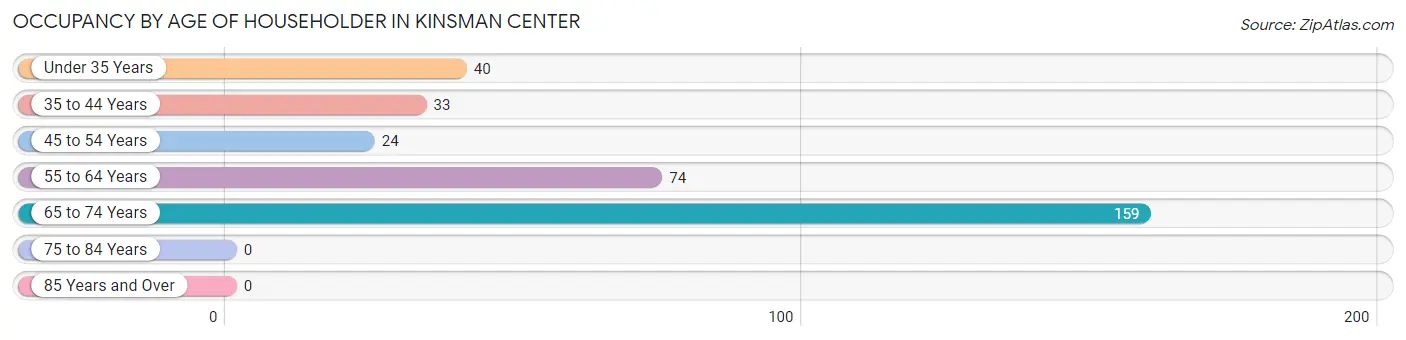
| Age Bracket | # Households | % Households |
| Under 35 Years | 40 | 12.1% |
| 35 to 44 Years | 33 | 10.0% |
| 45 to 54 Years | 24 | 7.3% |
| 55 to 64 Years | 74 | 22.4% |
| 65 to 74 Years | 159 | 48.2% |
| 75 to 84 Years | 0 | 0.0% |
| 85 Years and Over | 0 | 0.0% |
| Total | 330 | 100.0% |
Housing Finances in Kinsman Center
Median Income by Occupancy in Kinsman Center
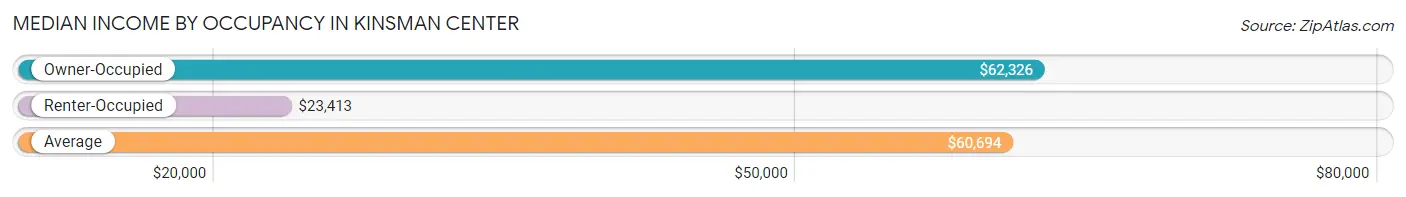
| Occupancy Type | # Households | Median Income |
| Owner-Occupied | 275 (83.3%) | $62,326 |
| Renter-Occupied | 55 (16.7%) | $23,413 |
| Average | 330 (100.0%) | $60,694 |
Occupancy by Householder Income Bracket in Kinsman Center
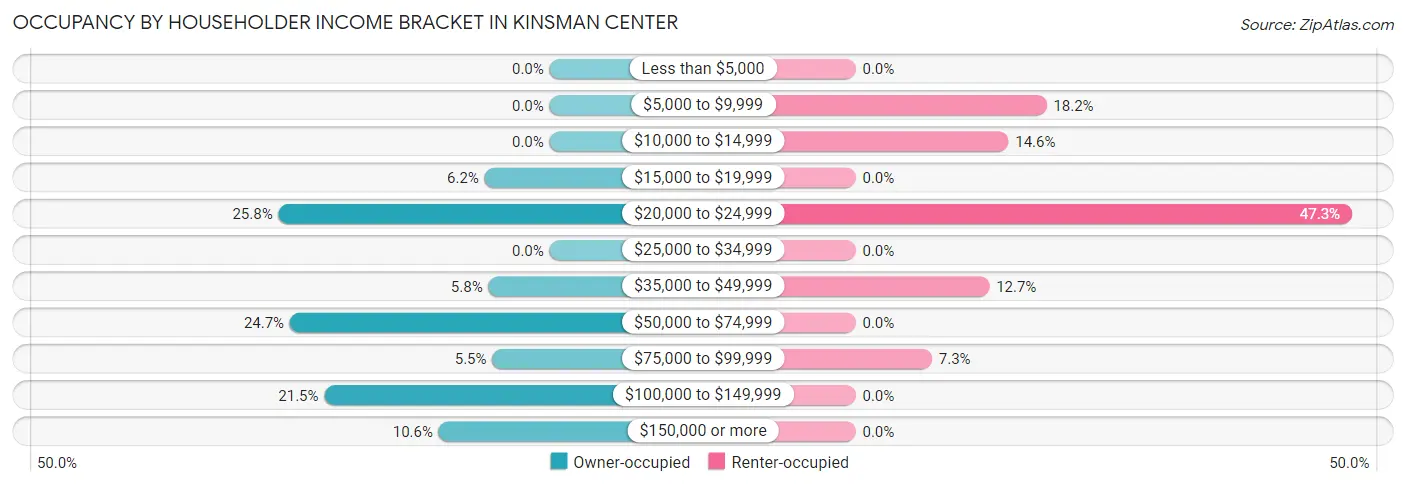
| Income Bracket | Owner-occupied | Renter-occupied |
| Less than $5,000 | 0 (0.0%) | 0 (0.0%) |
| $5,000 to $9,999 | 0 (0.0%) | 10 (18.2%) |
| $10,000 to $14,999 | 0 (0.0%) | 8 (14.5%) |
| $15,000 to $19,999 | 17 (6.2%) | 0 (0.0%) |
| $20,000 to $24,999 | 71 (25.8%) | 26 (47.3%) |
| $25,000 to $34,999 | 0 (0.0%) | 0 (0.0%) |
| $35,000 to $49,999 | 16 (5.8%) | 7 (12.7%) |
| $50,000 to $74,999 | 68 (24.7%) | 0 (0.0%) |
| $75,000 to $99,999 | 15 (5.4%) | 4 (7.3%) |
| $100,000 to $149,999 | 59 (21.4%) | 0 (0.0%) |
| $150,000 or more | 29 (10.5%) | 0 (0.0%) |
| Total | 275 (100.0%) | 55 (100.0%) |
Monthly Housing Cost Tiers in Kinsman Center
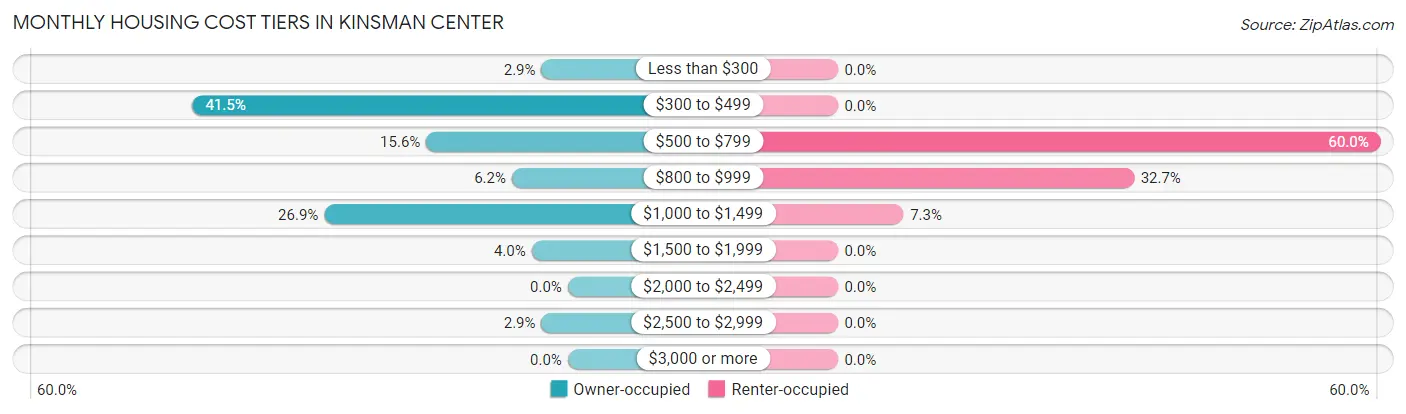
| Monthly Cost | Owner-occupied | Renter-occupied |
| Less than $300 | 8 (2.9%) | 0 (0.0%) |
| $300 to $499 | 114 (41.4%) | 0 (0.0%) |
| $500 to $799 | 43 (15.6%) | 33 (60.0%) |
| $800 to $999 | 17 (6.2%) | 18 (32.7%) |
| $1,000 to $1,499 | 74 (26.9%) | 4 (7.3%) |
| $1,500 to $1,999 | 11 (4.0%) | 0 (0.0%) |
| $2,000 to $2,499 | 0 (0.0%) | 0 (0.0%) |
| $2,500 to $2,999 | 8 (2.9%) | 0 (0.0%) |
| $3,000 or more | 0 (0.0%) | 0 (0.0%) |
| Total | 275 (100.0%) | 55 (100.0%) |
Physical Housing Characteristics in Kinsman Center
Housing Structures in Kinsman Center
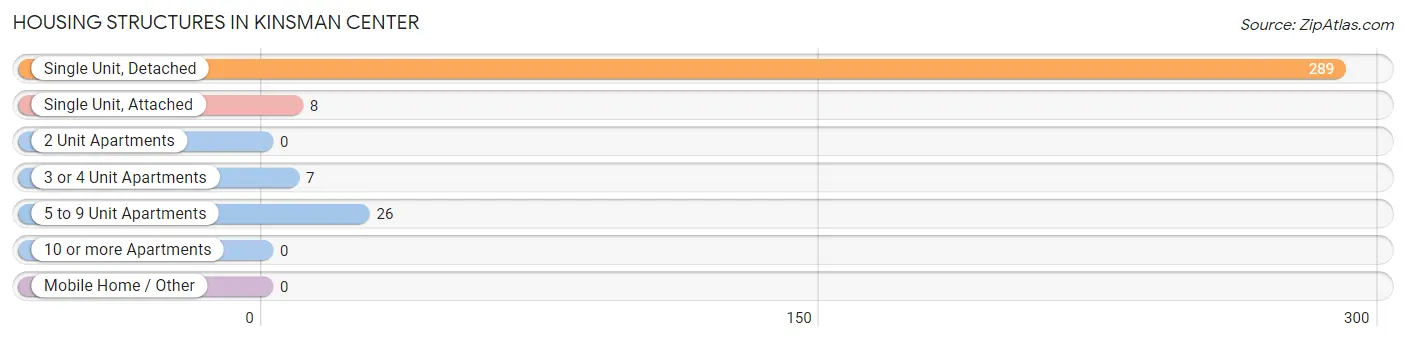
| Structure Type | # Housing Units | % Housing Units |
| Single Unit, Detached | 289 | 87.6% |
| Single Unit, Attached | 8 | 2.4% |
| 2 Unit Apartments | 0 | 0.0% |
| 3 or 4 Unit Apartments | 7 | 2.1% |
| 5 to 9 Unit Apartments | 26 | 7.9% |
| 10 or more Apartments | 0 | 0.0% |
| Mobile Home / Other | 0 | 0.0% |
| Total | 330 | 100.0% |
Housing Structures by Occupancy in Kinsman Center
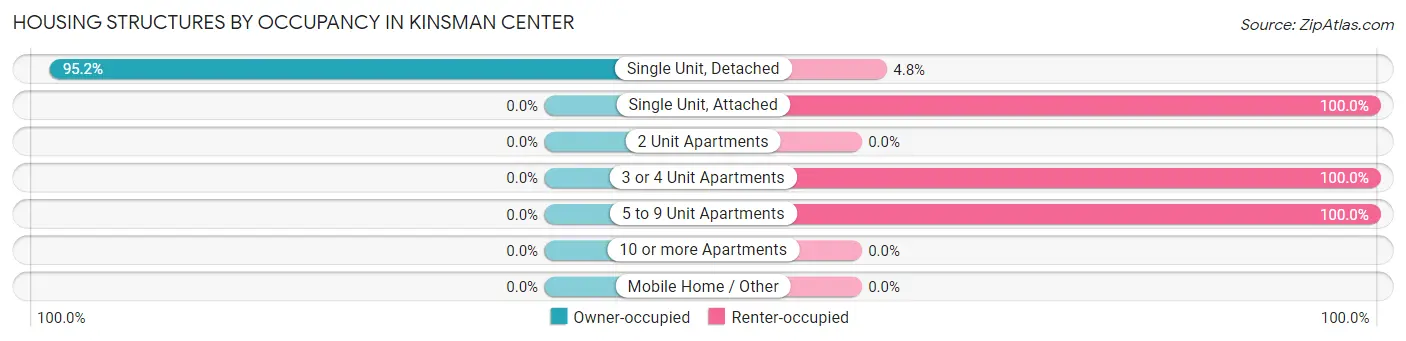
| Structure Type | Owner-occupied | Renter-occupied |
| Single Unit, Detached | 275 (95.2%) | 14 (4.8%) |
| Single Unit, Attached | 0 (0.0%) | 8 (100.0%) |
| 2 Unit Apartments | 0 (0.0%) | 0 (0.0%) |
| 3 or 4 Unit Apartments | 0 (0.0%) | 7 (100.0%) |
| 5 to 9 Unit Apartments | 0 (0.0%) | 26 (100.0%) |
| 10 or more Apartments | 0 (0.0%) | 0 (0.0%) |
| Mobile Home / Other | 0 (0.0%) | 0 (0.0%) |
| Total | 275 (83.3%) | 55 (16.7%) |
Housing Structures by Number of Rooms in Kinsman Center
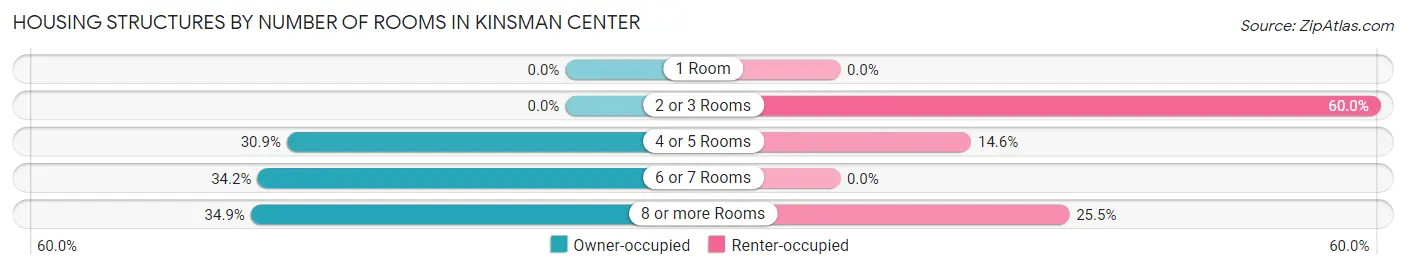
| Number of Rooms | Owner-occupied | Renter-occupied |
| 1 Room | 0 (0.0%) | 0 (0.0%) |
| 2 or 3 Rooms | 0 (0.0%) | 33 (60.0%) |
| 4 or 5 Rooms | 85 (30.9%) | 8 (14.5%) |
| 6 or 7 Rooms | 94 (34.2%) | 0 (0.0%) |
| 8 or more Rooms | 96 (34.9%) | 14 (25.5%) |
| Total | 275 (100.0%) | 55 (100.0%) |
Housing Structure by Heating Type in Kinsman Center
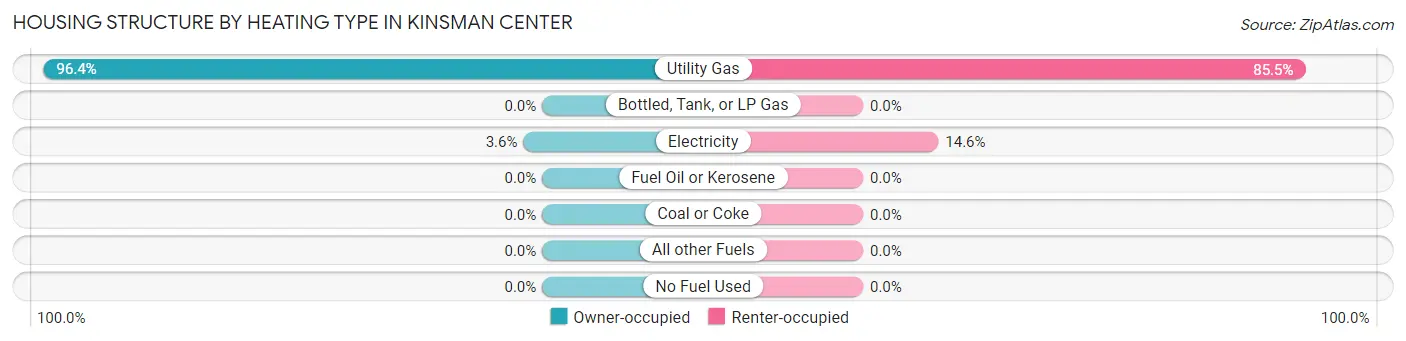
| Heating Type | Owner-occupied | Renter-occupied |
| Utility Gas | 265 (96.4%) | 47 (85.5%) |
| Bottled, Tank, or LP Gas | 0 (0.0%) | 0 (0.0%) |
| Electricity | 10 (3.6%) | 8 (14.5%) |
| Fuel Oil or Kerosene | 0 (0.0%) | 0 (0.0%) |
| Coal or Coke | 0 (0.0%) | 0 (0.0%) |
| All other Fuels | 0 (0.0%) | 0 (0.0%) |
| No Fuel Used | 0 (0.0%) | 0 (0.0%) |
| Total | 275 (100.0%) | 55 (100.0%) |
Household Vehicle Usage in Kinsman Center
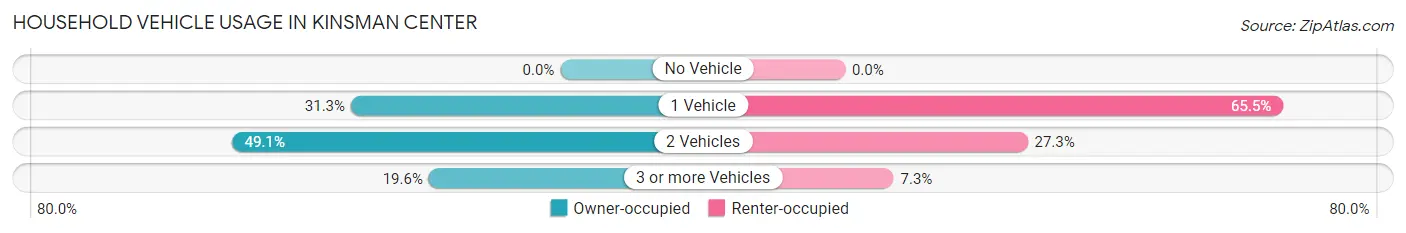
| Vehicles per Household | Owner-occupied | Renter-occupied |
| No Vehicle | 0 (0.0%) | 0 (0.0%) |
| 1 Vehicle | 86 (31.3%) | 36 (65.4%) |
| 2 Vehicles | 135 (49.1%) | 15 (27.3%) |
| 3 or more Vehicles | 54 (19.6%) | 4 (7.3%) |
| Total | 275 (100.0%) | 55 (100.0%) |
Real Estate & Mortgages in Kinsman Center
Real Estate and Mortgage Overview in Kinsman Center
| Characteristic | Without Mortgage | With Mortgage |
| Housing Units | 150 | 125 |
| Median Property Value | - | - |
| Median Household Income | - | - |
| Monthly Housing Costs | $342 | $0 |
| Real Estate Taxes | $1,179 | $0 |
Property Value by Mortgage Status in Kinsman Center
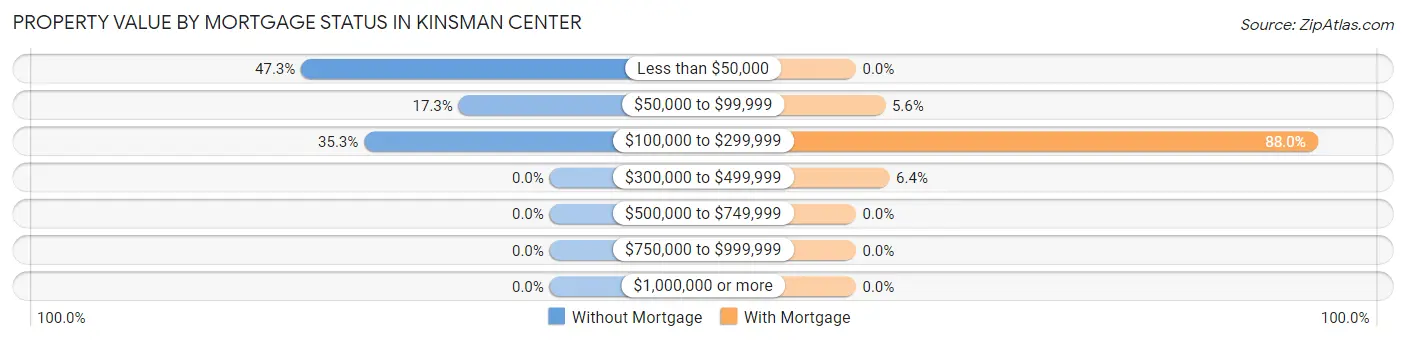
| Property Value | Without Mortgage | With Mortgage |
| Less than $50,000 | 71 (47.3%) | 0 (0.0%) |
| $50,000 to $99,999 | 26 (17.3%) | 7 (5.6%) |
| $100,000 to $299,999 | 53 (35.3%) | 110 (88.0%) |
| $300,000 to $499,999 | 0 (0.0%) | 8 (6.4%) |
| $500,000 to $749,999 | 0 (0.0%) | 0 (0.0%) |
| $750,000 to $999,999 | 0 (0.0%) | 0 (0.0%) |
| $1,000,000 or more | 0 (0.0%) | 0 (0.0%) |
| Total | 150 (100.0%) | 125 (100.0%) |
Household Income by Mortgage Status in Kinsman Center
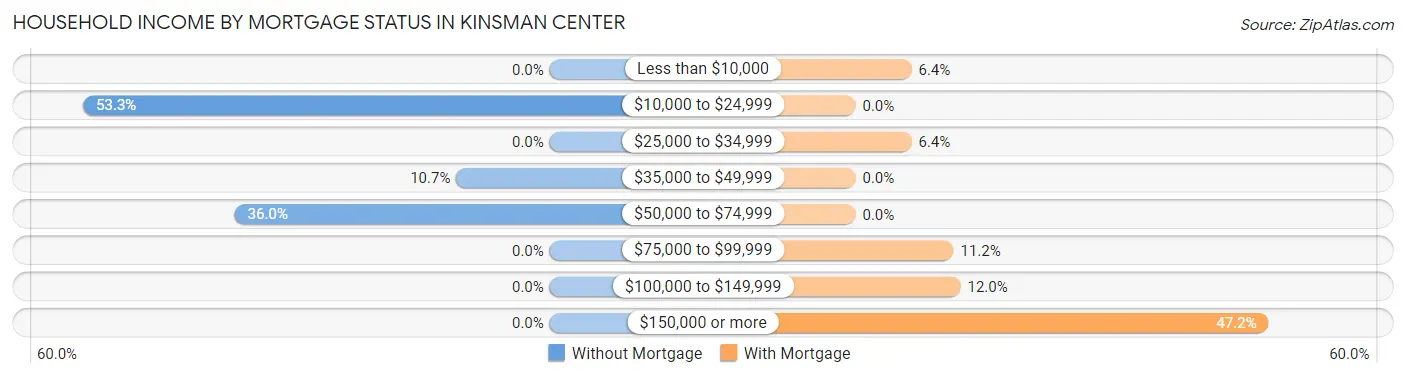
| Household Income | Without Mortgage | With Mortgage |
| Less than $10,000 | 0 (0.0%) | 8 (6.4%) |
| $10,000 to $24,999 | 80 (53.3%) | 0 (0.0%) |
| $25,000 to $34,999 | 0 (0.0%) | 8 (6.4%) |
| $35,000 to $49,999 | 16 (10.7%) | 0 (0.0%) |
| $50,000 to $74,999 | 54 (36.0%) | 0 (0.0%) |
| $75,000 to $99,999 | 0 (0.0%) | 14 (11.2%) |
| $100,000 to $149,999 | 0 (0.0%) | 15 (12.0%) |
| $150,000 or more | 0 (0.0%) | 59 (47.2%) |
| Total | 150 (100.0%) | 125 (100.0%) |
Property Value to Household Income Ratio in Kinsman Center
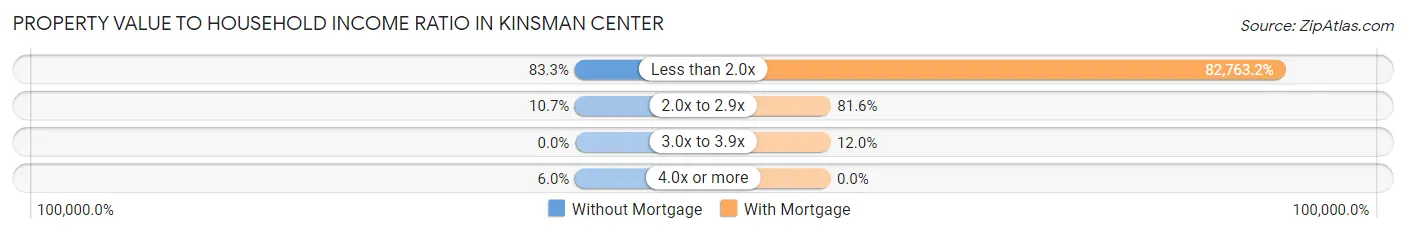
| Value-to-Income Ratio | Without Mortgage | With Mortgage |
| Less than 2.0x | 125 (83.3%) | 103,454 (82,763.2%) |
| 2.0x to 2.9x | 16 (10.7%) | 102 (81.6%) |
| 3.0x to 3.9x | 0 (0.0%) | 15 (12.0%) |
| 4.0x or more | 9 (6.0%) | 0 (0.0%) |
| Total | 150 (100.0%) | 125 (100.0%) |
Real Estate Taxes by Mortgage Status in Kinsman Center
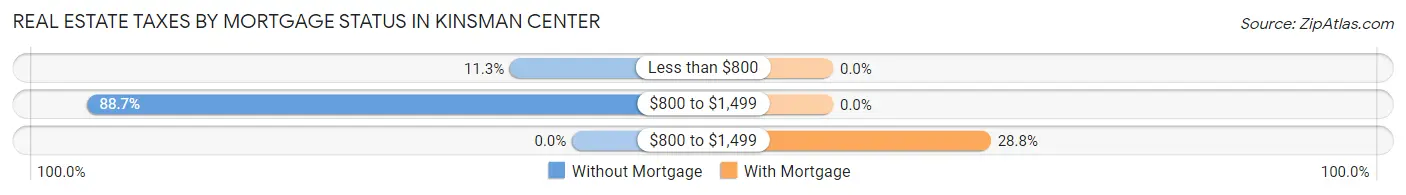
| Property Taxes | Without Mortgage | With Mortgage |
| Less than $800 | 17 (11.3%) | 0 (0.0%) |
| $800 to $1,499 | 133 (88.7%) | 0 (0.0%) |
| $800 to $1,499 | 0 (0.0%) | 36 (28.8%) |
| Total | 150 (100.0%) | 125 (100.0%) |
Health & Disability in Kinsman Center
Health Insurance Coverage by Age in Kinsman Center
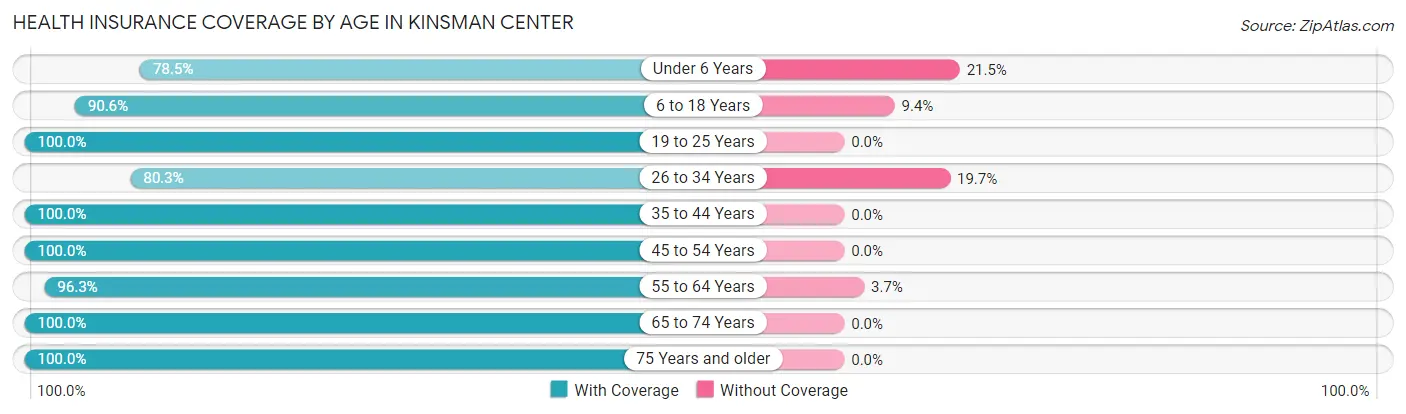
| Age Bracket | With Coverage | Without Coverage |
| Under 6 Years | 62 (78.5%) | 17 (21.5%) |
| 6 to 18 Years | 87 (90.6%) | 9 (9.4%) |
| 19 to 25 Years | 19 (100.0%) | 0 (0.0%) |
| 26 to 34 Years | 57 (80.3%) | 14 (19.7%) |
| 35 to 44 Years | 51 (100.0%) | 0 (0.0%) |
| 45 to 54 Years | 76 (100.0%) | 0 (0.0%) |
| 55 to 64 Years | 130 (96.3%) | 5 (3.7%) |
| 65 to 74 Years | 274 (100.0%) | 0 (0.0%) |
| 75 Years and older | 20 (100.0%) | 0 (0.0%) |
| Total | 776 (94.5%) | 45 (5.5%) |
Health Insurance Coverage by Citizenship Status in Kinsman Center
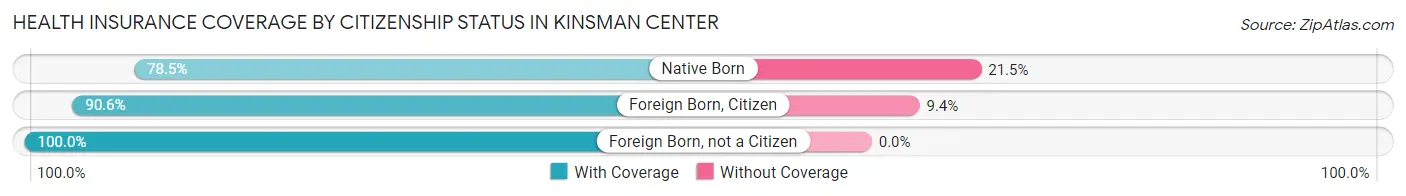
| Citizenship Status | With Coverage | Without Coverage |
| Native Born | 62 (78.5%) | 17 (21.5%) |
| Foreign Born, Citizen | 87 (90.6%) | 9 (9.4%) |
| Foreign Born, not a Citizen | 19 (100.0%) | 0 (0.0%) |
Health Insurance Coverage by Household Income in Kinsman Center
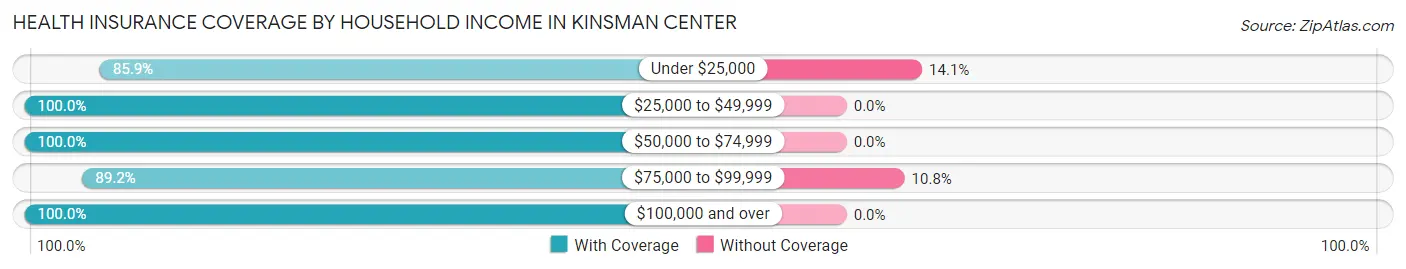
| Household Income | With Coverage | Without Coverage |
| Under $25,000 | 219 (85.9%) | 36 (14.1%) |
| $25,000 to $49,999 | 73 (100.0%) | 0 (0.0%) |
| $50,000 to $74,999 | 134 (100.0%) | 0 (0.0%) |
| $75,000 to $99,999 | 74 (89.2%) | 9 (10.8%) |
| $100,000 and over | 276 (100.0%) | 0 (0.0%) |
Public vs Private Health Insurance Coverage by Age in Kinsman Center
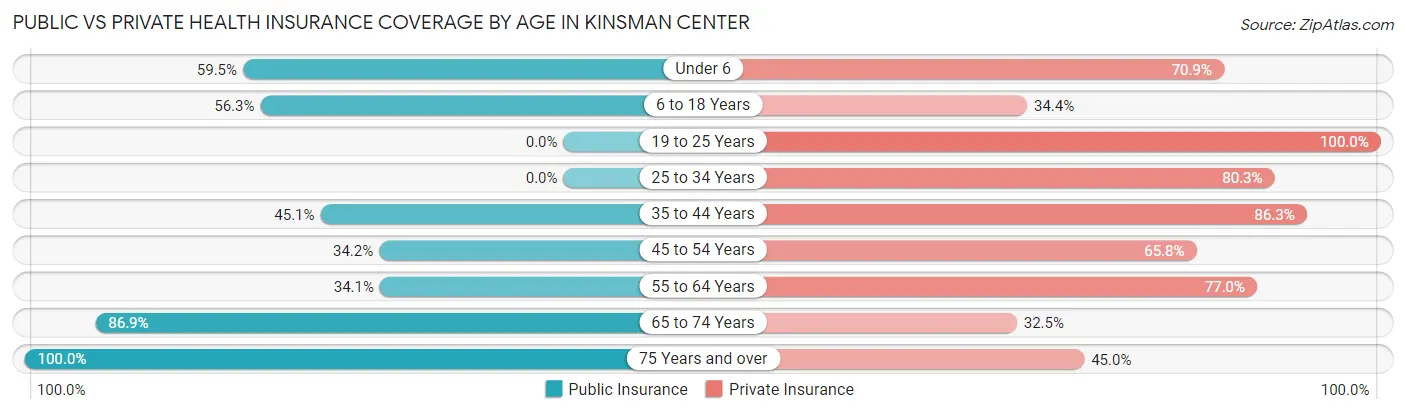
| Age Bracket | Public Insurance | Private Insurance |
| Under 6 | 47 (59.5%) | 56 (70.9%) |
| 6 to 18 Years | 54 (56.2%) | 33 (34.4%) |
| 19 to 25 Years | 0 (0.0%) | 19 (100.0%) |
| 25 to 34 Years | 0 (0.0%) | 57 (80.3%) |
| 35 to 44 Years | 23 (45.1%) | 44 (86.3%) |
| 45 to 54 Years | 26 (34.2%) | 50 (65.8%) |
| 55 to 64 Years | 46 (34.1%) | 104 (77.0%) |
| 65 to 74 Years | 238 (86.9%) | 89 (32.5%) |
| 75 Years and over | 20 (100.0%) | 9 (45.0%) |
| Total | 454 (55.3%) | 461 (56.1%) |
Disability Status by Sex by Age in Kinsman Center
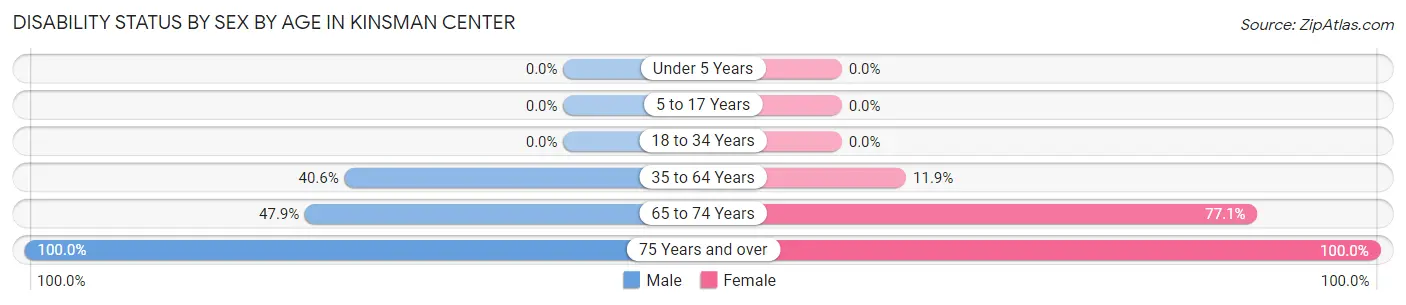
| Age Bracket | Male | Female |
| Under 5 Years | 0 (0.0%) | 0 (0.0%) |
| 5 to 17 Years | 0 (0.0%) | 0 (0.0%) |
| 18 to 34 Years | 0 (0.0%) | 0 (0.0%) |
| 35 to 64 Years | 52 (40.6%) | 16 (11.9%) |
| 65 to 74 Years | 81 (47.9%) | 81 (77.1%) |
| 75 Years and over | 11 (100.0%) | 9 (100.0%) |
Disability Class by Sex by Age in Kinsman Center
Disability Class: Hearing Difficulty
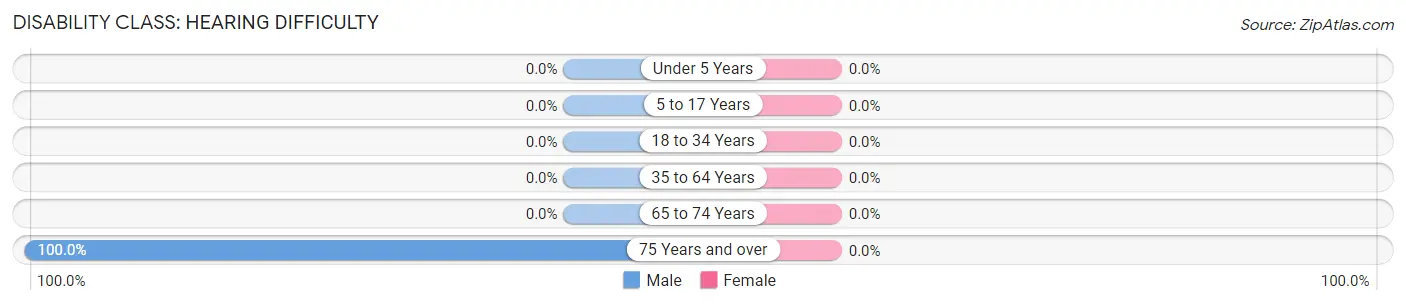
| Age Bracket | Male | Female |
| Under 5 Years | 0 (0.0%) | 0 (0.0%) |
| 5 to 17 Years | 0 (0.0%) | 0 (0.0%) |
| 18 to 34 Years | 0 (0.0%) | 0 (0.0%) |
| 35 to 64 Years | 0 (0.0%) | 0 (0.0%) |
| 65 to 74 Years | 0 (0.0%) | 0 (0.0%) |
| 75 Years and over | 11 (100.0%) | 0 (0.0%) |
Disability Class: Vision Difficulty
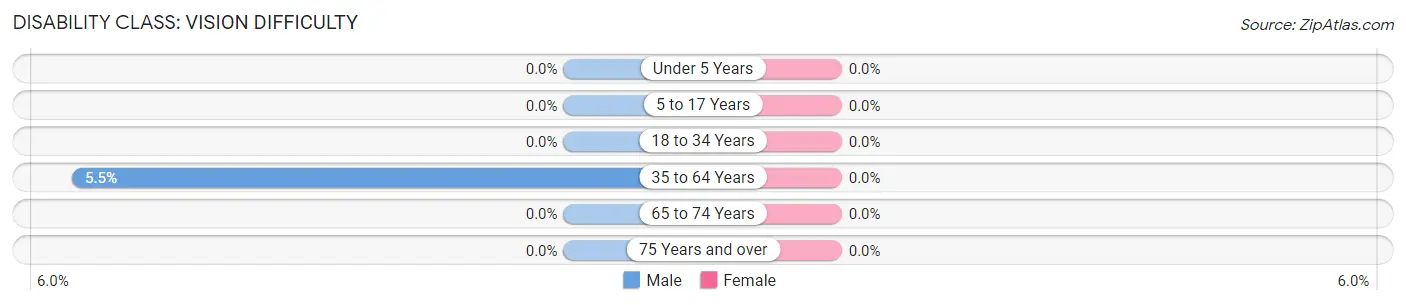
| Age Bracket | Male | Female |
| Under 5 Years | 0 (0.0%) | 0 (0.0%) |
| 5 to 17 Years | 0 (0.0%) | 0 (0.0%) |
| 18 to 34 Years | 0 (0.0%) | 0 (0.0%) |
| 35 to 64 Years | 7 (5.5%) | 0 (0.0%) |
| 65 to 74 Years | 0 (0.0%) | 0 (0.0%) |
| 75 Years and over | 0 (0.0%) | 0 (0.0%) |
Disability Class: Cognitive Difficulty
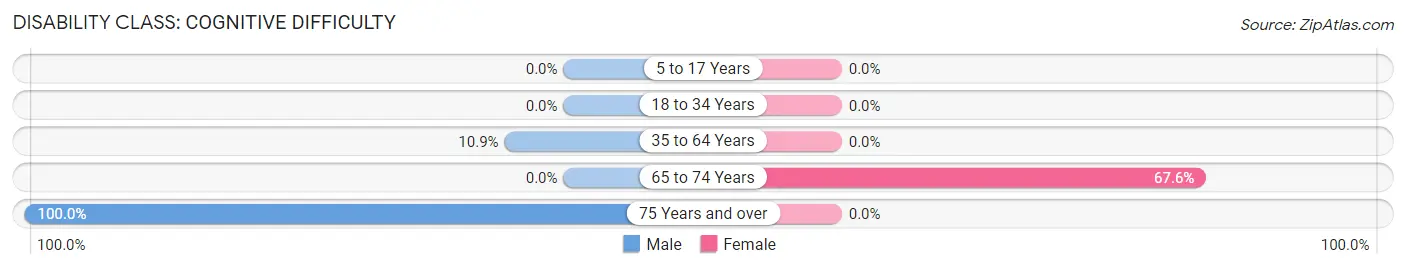
| Age Bracket | Male | Female |
| 5 to 17 Years | 0 (0.0%) | 0 (0.0%) |
| 18 to 34 Years | 0 (0.0%) | 0 (0.0%) |
| 35 to 64 Years | 14 (10.9%) | 0 (0.0%) |
| 65 to 74 Years | 0 (0.0%) | 71 (67.6%) |
| 75 Years and over | 11 (100.0%) | 0 (0.0%) |
Disability Class: Ambulatory Difficulty
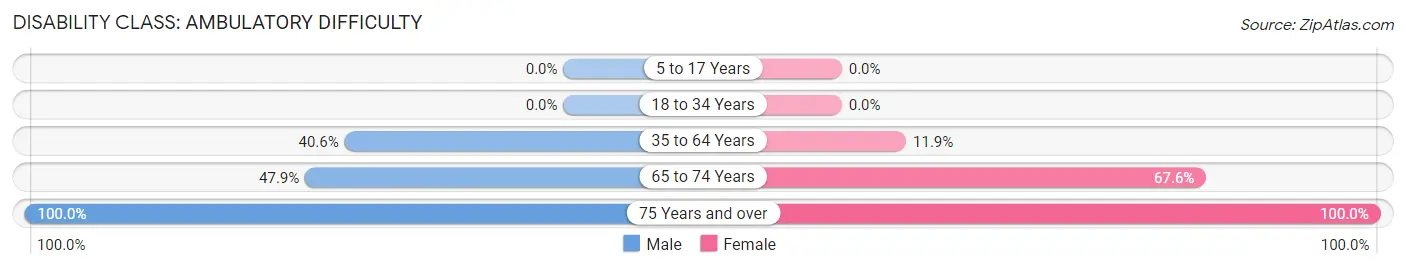
| Age Bracket | Male | Female |
| 5 to 17 Years | 0 (0.0%) | 0 (0.0%) |
| 18 to 34 Years | 0 (0.0%) | 0 (0.0%) |
| 35 to 64 Years | 52 (40.6%) | 16 (11.9%) |
| 65 to 74 Years | 81 (47.9%) | 71 (67.6%) |
| 75 Years and over | 11 (100.0%) | 9 (100.0%) |
Disability Class: Self-Care Difficulty
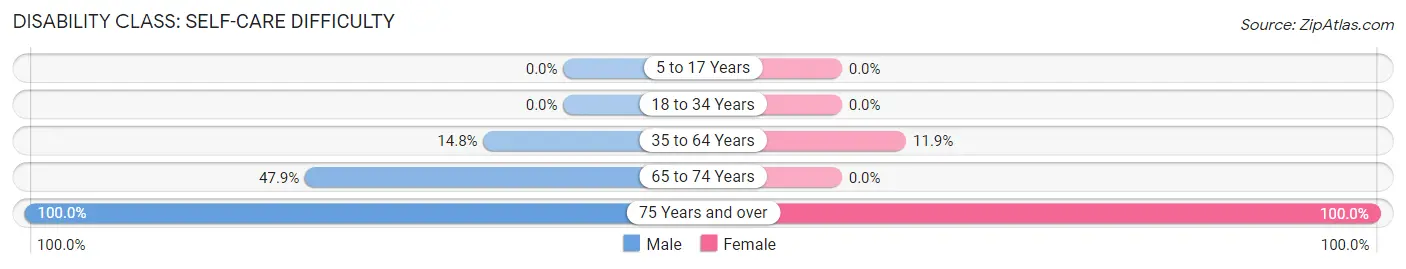
| Age Bracket | Male | Female |
| 5 to 17 Years | 0 (0.0%) | 0 (0.0%) |
| 18 to 34 Years | 0 (0.0%) | 0 (0.0%) |
| 35 to 64 Years | 19 (14.8%) | 16 (11.9%) |
| 65 to 74 Years | 81 (47.9%) | 0 (0.0%) |
| 75 Years and over | 11 (100.0%) | 9 (100.0%) |
Technology Access in Kinsman Center
Computing Device Access in Kinsman Center
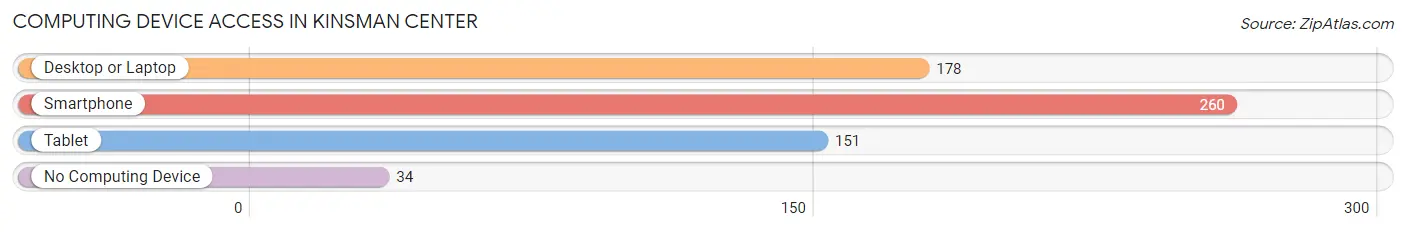
| Device Type | # Households | % Households |
| Desktop or Laptop | 178 | 53.9% |
| Smartphone | 260 | 78.8% |
| Tablet | 151 | 45.8% |
| No Computing Device | 34 | 10.3% |
| Total | 330 | 100.0% |
Internet Access in Kinsman Center
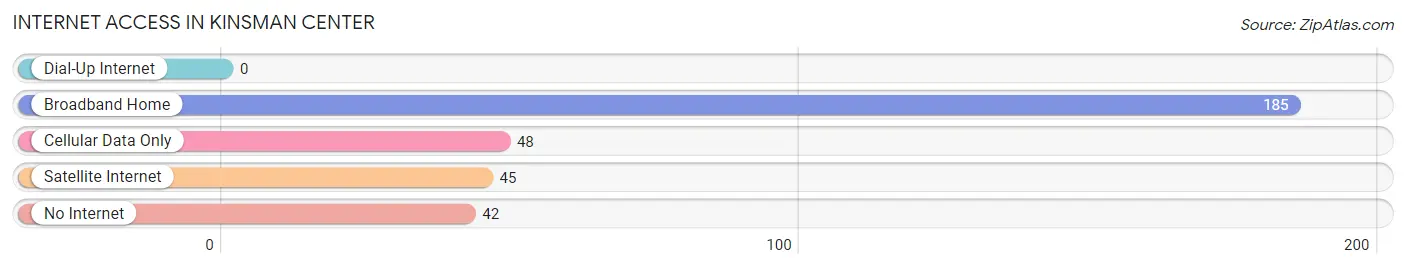
| Internet Type | # Households | % Households |
| Dial-Up Internet | 0 | 0.0% |
| Broadband Home | 185 | 56.1% |
| Cellular Data Only | 48 | 14.5% |
| Satellite Internet | 45 | 13.6% |
| No Internet | 42 | 12.7% |
| Total | 330 | 100.0% |
Kinsman Center Summary
Kinsman Center is a small village located in Trumbull County, Ohio. It is situated in the northeast corner of the state, just south of the Pennsylvania border. The village has a population of approximately 1,000 people and is part of the larger metropolitan area of Youngstown-Warren-Boardman. Kinsman Center is a rural community with a strong sense of community and a rich history.
History
Kinsman Center was founded in 1820 by a group of settlers from Connecticut. The settlers were led by a man named John Kinsman, who was a veteran of the Revolutionary War. The village was originally known as Kinsman’s Corners, but the name was changed to Kinsman Center in 1837. The village was incorporated in 1845 and has remained a small, rural community ever since.
Kinsman Center was an important stop on the Underground Railroad during the Civil War. The village was a safe haven for escaped slaves and a place of refuge for those seeking freedom. The village was also home to a number of abolitionists, including the prominent Quaker, John Kinsman.
Geography
Kinsman Center is located in the northeast corner of Ohio, just south of the Pennsylvania border. The village is situated in the Mahoning Valley, which is part of the larger Appalachian Plateau region. The village is surrounded by rolling hills and wooded areas, and is located near the Mahoning River.
The climate in Kinsman Center is typical of the Midwest, with hot summers and cold winters. The average temperature in the summer is around 75 degrees Fahrenheit, and the average temperature in the winter is around 25 degrees Fahrenheit. The village receives an average of 40 inches of precipitation each year.
Economy
Kinsman Center is a small, rural community with a limited economy. The village is home to a few small businesses, including a grocery store, a hardware store, and a few restaurants. The village also has a few small manufacturing companies that produce a variety of products, including furniture and automotive parts.
The village is also home to a number of farms, which produce a variety of crops, including corn, soybeans, and wheat. The village also has a few small wineries, which produce a variety of wines.
Demographics
Kinsman Center has a population of approximately 1,000 people. The village is predominantly white, with a small African American population. The median household income in the village is around $40,000, and the median home value is around $100,000. The village has a low unemployment rate, and the majority of the population is employed in the manufacturing and agricultural industries.
Kinsman Center is a small, rural community with a strong sense of community and a rich history. The village is home to a variety of businesses and industries, and is a great place to live and work. The village is a great place to raise a family, and offers a variety of recreational activities, including fishing, hunting, and camping.
Common Questions
What is the Total Population of Kinsman Center?
Total Population of Kinsman Center is 821.
What is the Total Male Population of Kinsman Center?
Total Male Population of Kinsman Center is 434.
What is the Total Female Population of Kinsman Center?
Total Female Population of Kinsman Center is 387.
What is the Ratio of Males per 100 Females in Kinsman Center?
There are 112.14 Males per 100 Females in Kinsman Center.
What is the Ratio of Females per 100 Males in Kinsman Center?
There are 89.17 Females per 100 Males in Kinsman Center.
What is the Median Population Age in Kinsman Center?
Median Population Age in Kinsman Center is 60.1 Years.
What is the Average Family Size in Kinsman Center
Average Family Size in Kinsman Center is 2.7 People.
What is the Average Household Size in Kinsman Center
Average Household Size in Kinsman Center is 2.5 People.
What is Per Capita Income in Kinsman Center?
Per Capita income in Kinsman Center is $25,962.
What is the Median Family Income in Kinsman Center?
Median Family Income in Kinsman Center is $61,528.
What is the Median Household income in Kinsman Center?
Median Household Income in Kinsman Center is $60,694.
What is Income or Wage Gap in Kinsman Center?
Income or Wage Gap in Kinsman Center is 49.4%.
Women in Kinsman Center earn 50.6 cents for every dollar earned by a man.
What is Inequality or Gini Index in Kinsman Center?
Inequality or Gini Index in Kinsman Center is 0.40.
How Large is the Labor Force in Kinsman Center?
There are 321 People in the Labor Forcein in Kinsman Center.
What is the Percentage of People in the Labor Force in Kinsman Center?
46.8% of People are in the Labor Force in Kinsman Center.