Martins Ferry, OH
Martins Ferry Map
Martins Ferry Overview
6,283
TOTAL POPULATION
3,058
MALE POPULATION
3,225
FEMALE POPULATION
94.82
MALES / 100 FEMALES
105.46
FEMALES / 100 MALES
40.3
MEDIAN AGE
2.9
AVG FAMILY SIZE
2.2
AVG HOUSEHOLD SIZE
$25,192
PER CAPITA INCOME
$49,050
AVG FAMILY INCOME
$39,195
AVG HOUSEHOLD INCOME
9.8%
WAGE / INCOME GAP [ % ]
90.2¢/ $1
WAGE / INCOME GAP [ $ ]
$13,291
FAMILY INCOME DEFICIT
0.52
INEQUALITY / GINI INDEX
3,157
LABOR FORCE [ PEOPLE ]
60.6%
PERCENT IN LABOR FORCE
20.8%
UNEMPLOYMENT RATE
Martins Ferry Zip Codes
Martins Ferry Area Codes
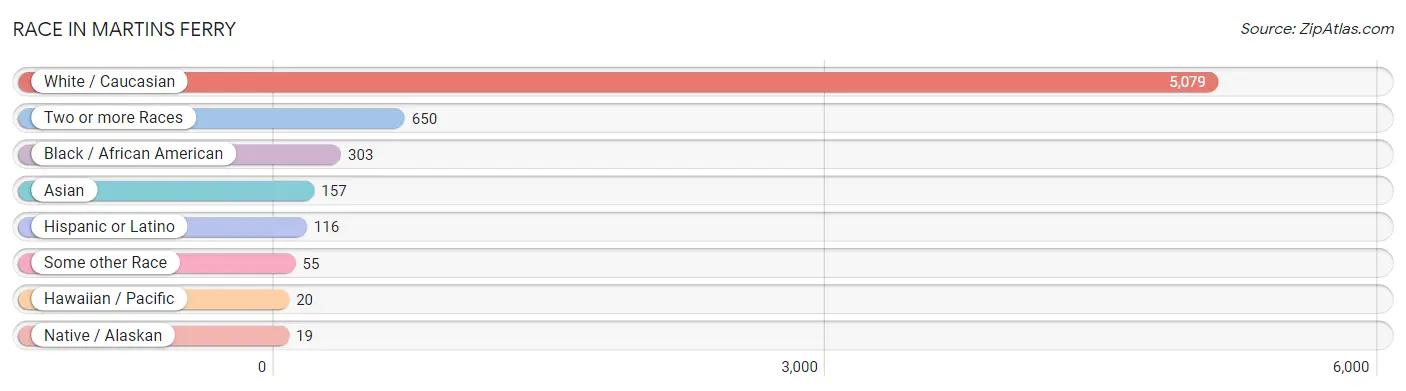
Race in Martins Ferry
The most populous races in Martins Ferry are White / Caucasian (5,079 | 80.8%), Two or more Races (650 | 10.3%), and Black / African American (303 | 4.8%).
| Race | # Population | % Population |
| Asian | 157 | 2.5% |
| Black / African American | 303 | 4.8% |
| Hawaiian / Pacific | 20 | 0.3% |
| Hispanic or Latino | 116 | 1.8% |
| Native / Alaskan | 19 | 0.3% |
| White / Caucasian | 5,079 | 80.8% |
| Two or more Races | 650 | 10.3% |
| Some other Race | 55 | 0.9% |
| Total | 6,283 | 100.0% |
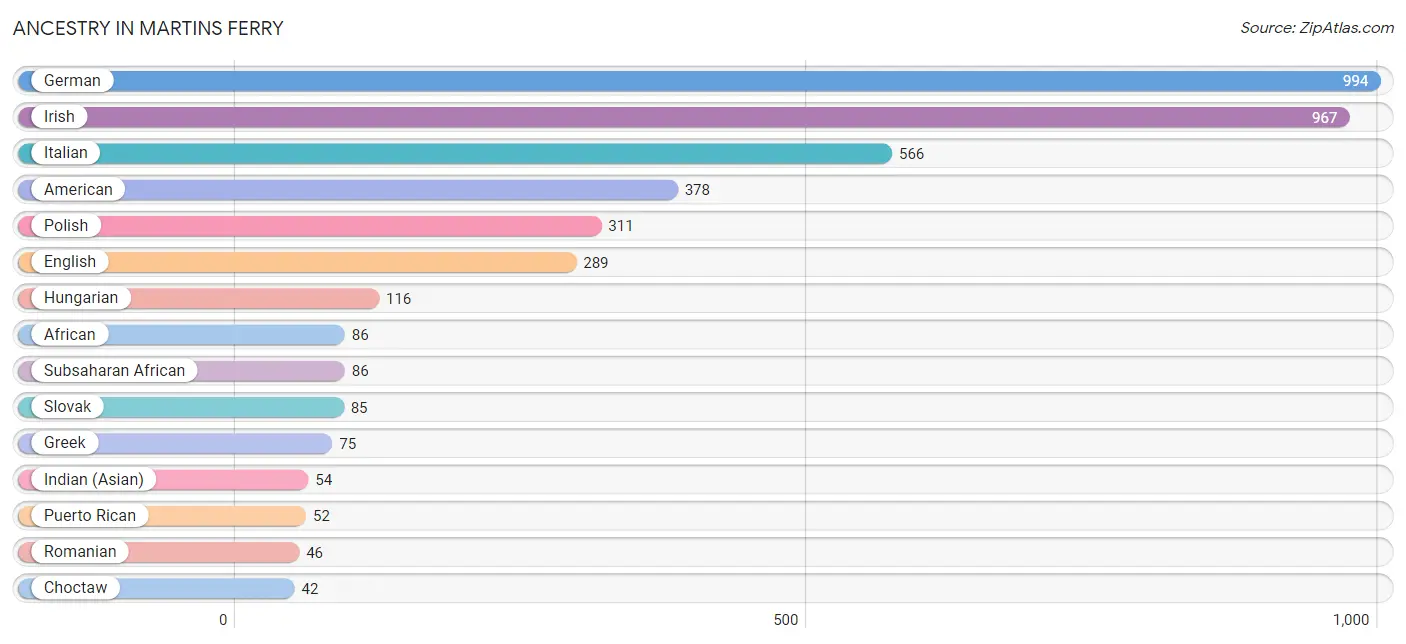
Ancestry in Martins Ferry
The most populous ancestries reported in Martins Ferry are German (994 | 15.8%), Irish (967 | 15.4%), Italian (566 | 9.0%), American (378 | 6.0%), and Polish (311 | 5.0%), together accounting for 51.2% of all Martins Ferry residents.
| Ancestry | # Population | % Population |
| African | 86 | 1.4% |
| American | 378 | 6.0% |
| Arab | 23 | 0.4% |
| Austrian | 6 | 0.1% |
| British | 18 | 0.3% |
| Choctaw | 42 | 0.7% |
| Czech | 29 | 0.5% |
| Czechoslovakian | 7 | 0.1% |
| Dutch | 21 | 0.3% |
| English | 289 | 4.6% |
| European | 38 | 0.6% |
| French | 35 | 0.6% |
| French Canadian | 7 | 0.1% |
| German | 994 | 15.8% |
| Greek | 75 | 1.2% |
| Hungarian | 116 | 1.8% |
| Indian (Asian) | 54 | 0.9% |
| Irish | 967 | 15.4% |
| Italian | 566 | 9.0% |
| Lebanese | 23 | 0.4% |
| Mexican | 12 | 0.2% |
| Pennsylvania German | 7 | 0.1% |
| Polish | 311 | 5.0% |
| Puerto Rican | 52 | 0.8% |
| Romanian | 46 | 0.7% |
| Samoan | 20 | 0.3% |
| Scandinavian | 4 | 0.1% |
| Scottish | 25 | 0.4% |
| Slovak | 85 | 1.3% |
| Slovene | 11 | 0.2% |
| Subsaharan African | 86 | 1.4% |
| Swedish | 11 | 0.2% |
| Swiss | 10 | 0.2% |
| Thai | 13 | 0.2% |
| Trinidadian and Tobagonian | 7 | 0.1% |
| Turkish | 13 | 0.2% |
| Welsh | 31 | 0.5% | View All 37 Rows |
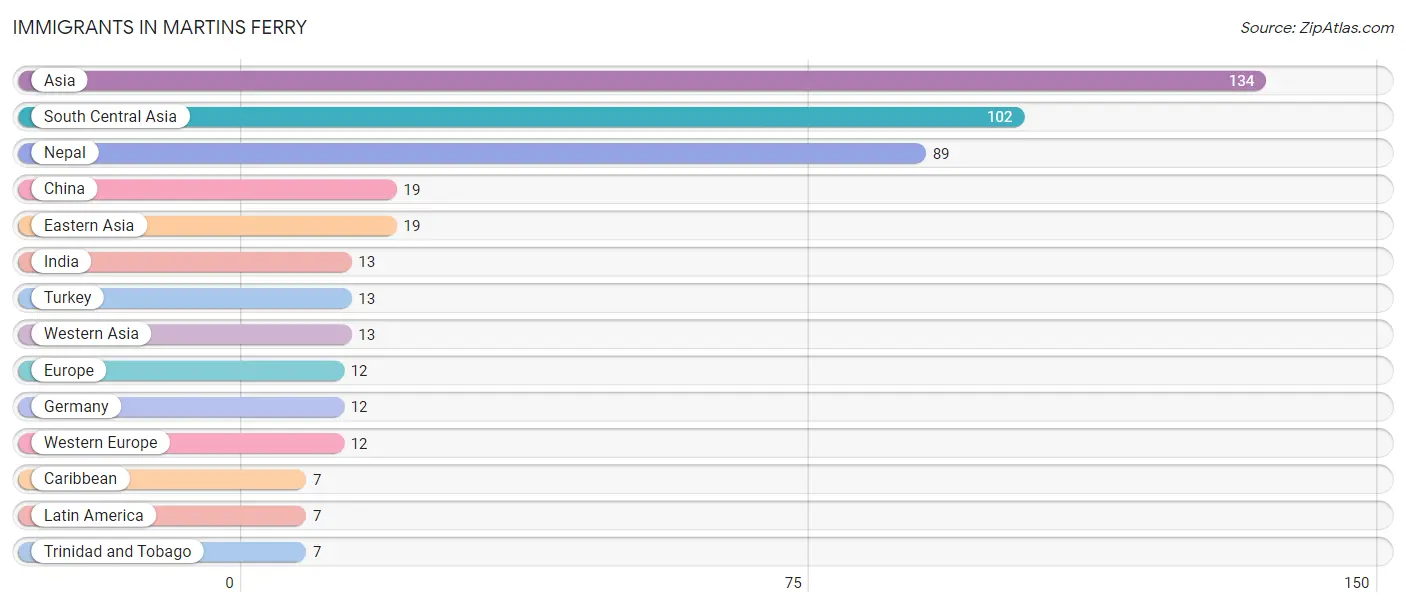
Immigrants in Martins Ferry
The most numerous immigrant groups reported in Martins Ferry came from Asia (134 | 2.1%), South Central Asia (102 | 1.6%), Nepal (89 | 1.4%), China (19 | 0.3%), and Eastern Asia (19 | 0.3%), together accounting for 5.8% of all Martins Ferry residents.
| Immigration Origin | # Population | % Population |
| Asia | 134 | 2.1% |
| Caribbean | 7 | 0.1% |
| China | 19 | 0.3% |
| Eastern Asia | 19 | 0.3% |
| Europe | 12 | 0.2% |
| Germany | 12 | 0.2% |
| India | 13 | 0.2% |
| Latin America | 7 | 0.1% |
| Nepal | 89 | 1.4% |
| South Central Asia | 102 | 1.6% |
| Trinidad and Tobago | 7 | 0.1% |
| Turkey | 13 | 0.2% |
| Western Asia | 13 | 0.2% |
| Western Europe | 12 | 0.2% | View All 14 Rows |
Sex and Age in Martins Ferry
Sex and Age in Martins Ferry
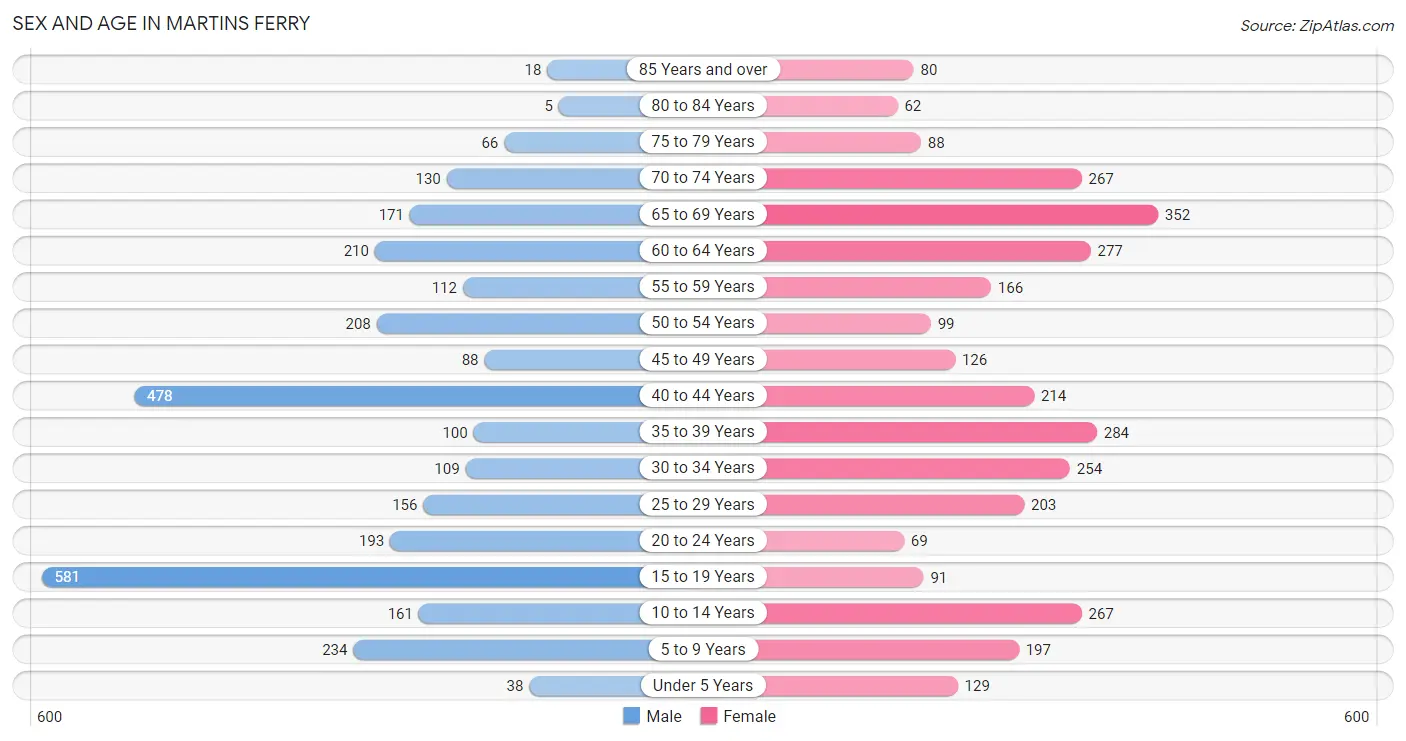
The most populous age groups in Martins Ferry are 15 to 19 Years (581 | 19.0%) for men and 65 to 69 Years (352 | 10.9%) for women.
| Age Bracket | Male | Female |
| Under 5 Years | 38 (1.2%) | 129 (4.0%) |
| 5 to 9 Years | 234 (7.6%) | 197 (6.1%) |
| 10 to 14 Years | 161 (5.3%) | 267 (8.3%) |
| 15 to 19 Years | 581 (19.0%) | 91 (2.8%) |
| 20 to 24 Years | 193 (6.3%) | 69 (2.1%) |
| 25 to 29 Years | 156 (5.1%) | 203 (6.3%) |
| 30 to 34 Years | 109 (3.6%) | 254 (7.9%) |
| 35 to 39 Years | 100 (3.3%) | 284 (8.8%) |
| 40 to 44 Years | 478 (15.6%) | 214 (6.6%) |
| 45 to 49 Years | 88 (2.9%) | 126 (3.9%) |
| 50 to 54 Years | 208 (6.8%) | 99 (3.1%) |
| 55 to 59 Years | 112 (3.7%) | 166 (5.1%) |
| 60 to 64 Years | 210 (6.9%) | 277 (8.6%) |
| 65 to 69 Years | 171 (5.6%) | 352 (10.9%) |
| 70 to 74 Years | 130 (4.3%) | 267 (8.3%) |
| 75 to 79 Years | 66 (2.2%) | 88 (2.7%) |
| 80 to 84 Years | 5 (0.2%) | 62 (1.9%) |
| 85 Years and over | 18 (0.6%) | 80 (2.5%) |
| Total | 3,058 (100.0%) | 3,225 (100.0%) |
Families and Households in Martins Ferry
Median Family Size in Martins Ferry
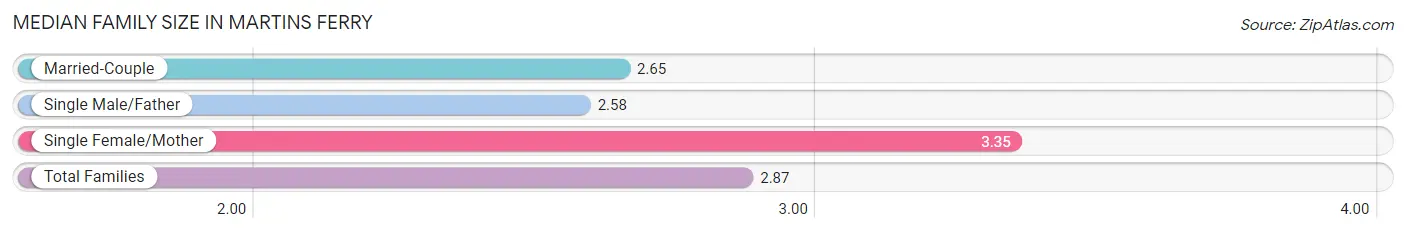
The median family size in Martins Ferry is 2.87 persons per family, with single female/mother families (500 | 32.1%) accounting for the largest median family size of 3.35 persons per family. On the other hand, single male/father families (103 | 6.6%) represent the smallest median family size with 2.58 persons per family.
| Family Type | # Families | Family Size |
| Married-Couple | 956 (61.3%) | 2.65 |
| Single Male/Father | 103 (6.6%) | 2.58 |
| Single Female/Mother | 500 (32.1%) | 3.35 |
| Total Families | 1,559 (100.0%) | 2.87 |
Median Household Size in Martins Ferry
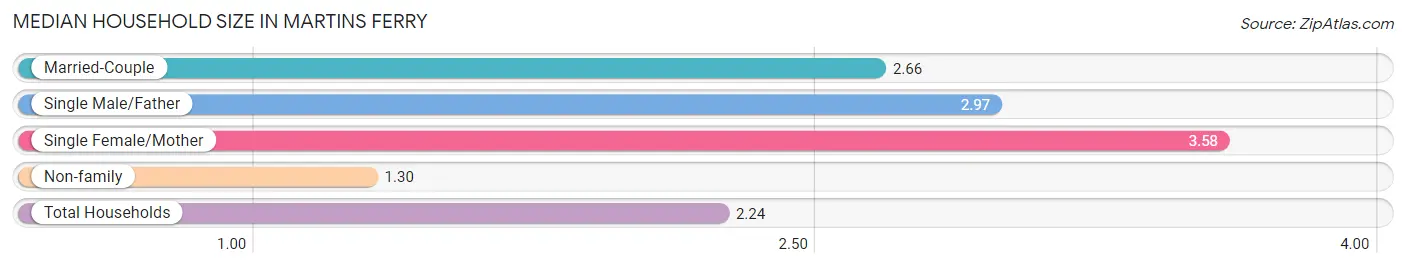
The median household size in Martins Ferry is 2.24 persons per household, with single female/mother households (500 | 18.1%) accounting for the largest median household size of 3.58 persons per household. non-family households (1,209 | 43.7%) represent the smallest median household size with 1.30 persons per household.
| Household Type | # Households | Household Size |
| Married-Couple | 956 (34.5%) | 2.66 |
| Single Male/Father | 103 (3.7%) | 2.97 |
| Single Female/Mother | 500 (18.1%) | 3.58 |
| Non-family | 1,209 (43.7%) | 1.30 |
| Total Households | 2,768 (100.0%) | 2.24 |
Household Size by Marriage Status in Martins Ferry
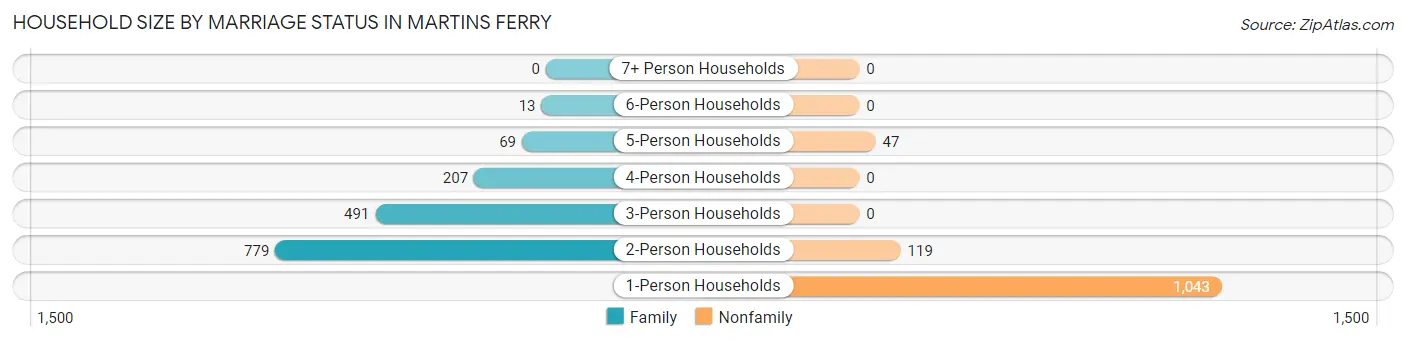
Out of a total of 2,768 households in Martins Ferry, 1,559 (56.3%) are family households, while 1,209 (43.7%) are nonfamily households. The most numerous type of family households are 2-person households, comprising 779, and the most common type of nonfamily households are 1-person households, comprising 1,043.
| Household Size | Family Households | Nonfamily Households |
| 1-Person Households | - | 1,043 (37.7%) |
| 2-Person Households | 779 (28.1%) | 119 (4.3%) |
| 3-Person Households | 491 (17.7%) | 0 (0.0%) |
| 4-Person Households | 207 (7.5%) | 0 (0.0%) |
| 5-Person Households | 69 (2.5%) | 47 (1.7%) |
| 6-Person Households | 13 (0.5%) | 0 (0.0%) |
| 7+ Person Households | 0 (0.0%) | 0 (0.0%) |
| Total | 1,559 (56.3%) | 1,209 (43.7%) |
Female Fertility in Martins Ferry
Fertility by Age in Martins Ferry
Average fertility rate in Martins Ferry is 42.0 births per 1,000 women. Women in the age bracket of 20 to 34 years have the highest fertility rate with 74.0 births per 1,000 women. Women in the age bracket of 20 to 34 years acount for 75.0% of all women with births.
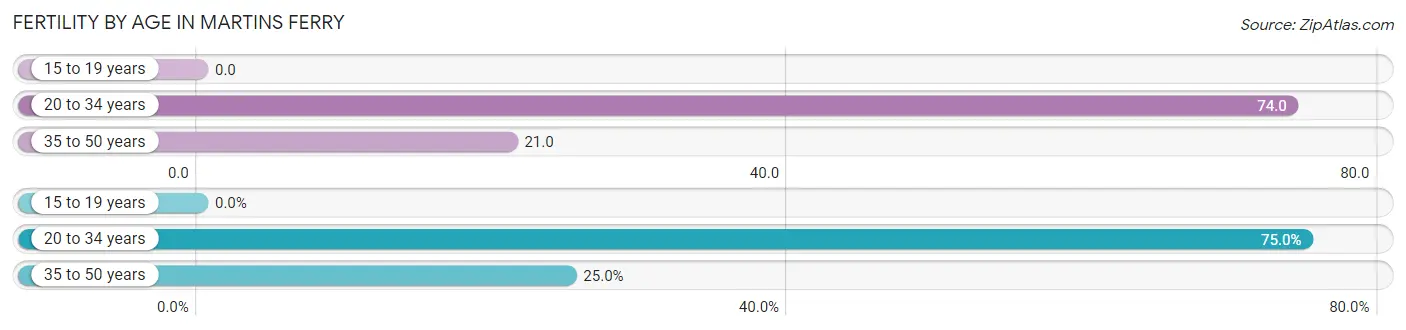
| Age Bracket | Women with Births | Births / 1,000 Women |
| 15 to 19 years | 0 (0.0%) | 0.0 |
| 20 to 34 years | 39 (75.0%) | 74.0 |
| 35 to 50 years | 13 (25.0%) | 21.0 |
| Total | 52 (100.0%) | 42.0 |
Fertility by Age by Marriage Status in Martins Ferry
11.5% of women with births (52) in Martins Ferry are married. The highest percentage of unmarried women with births falls into 20 to 34 years age bracket with 100.0% of them unmarried at the time of birth, while the lowest percentage of unmarried women with births belong to 35 to 50 years age bracket with 53.8% of them unmarried.
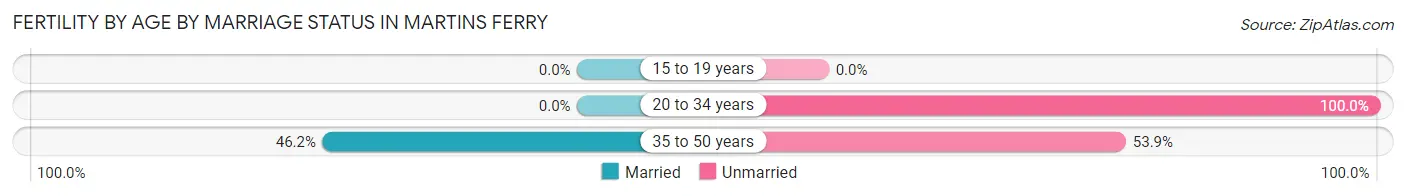
| Age Bracket | Married | Unmarried |
| 15 to 19 years | 0 (0.0%) | 0 (0.0%) |
| 20 to 34 years | 0 (0.0%) | 39 (100.0%) |
| 35 to 50 years | 6 (46.2%) | 7 (53.8%) |
| Total | 6 (11.5%) | 46 (88.5%) |
Fertility by Education in Martins Ferry
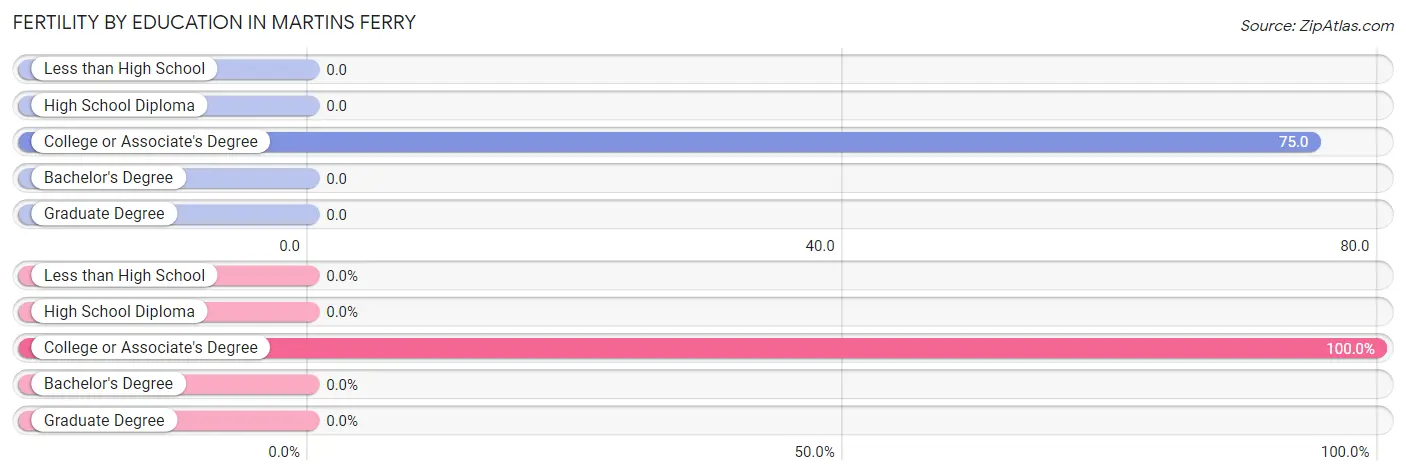
| Educational Attainment | Women with Births | Births / 1,000 Women |
| Less than High School | 0 (0.0%) | 0.0 |
| High School Diploma | 0 (0.0%) | 0.0 |
| College or Associate's Degree | 52 (100.0%) | 75.0 |
| Bachelor's Degree | 0 (0.0%) | 0.0 |
| Graduate Degree | 0 (0.0%) | 0.0 |
| Total | 52 (100.0%) | 42.0 |
Fertility by Education by Marriage Status in Martins Ferry
88.5% of women with births in Martins Ferry are unmarried. Women with the educational attainment of college or associate's degree are most likely to be married with 11.5% of them married at childbirth, while women with the educational attainment of college or associate's degree are least likely to be married with 88.5% of them unmarried at childbirth.
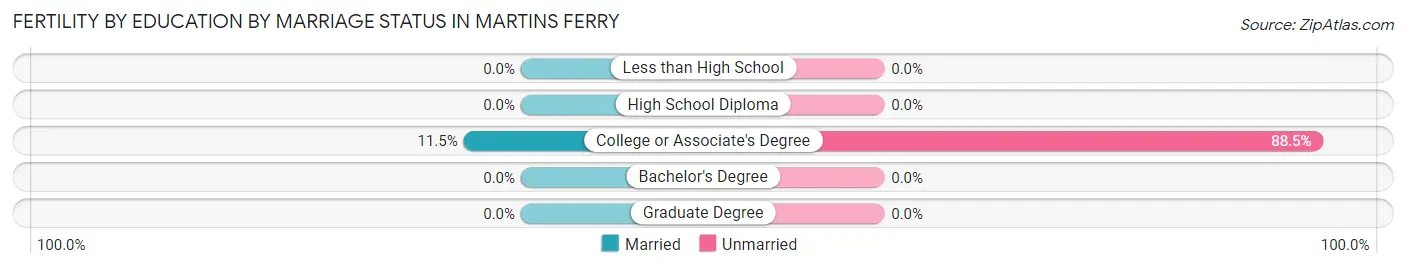
| Educational Attainment | Married | Unmarried |
| Less than High School | 0 (0.0%) | 0 (0.0%) |
| High School Diploma | 0 (0.0%) | 0 (0.0%) |
| College or Associate's Degree | 6 (11.5%) | 46 (88.5%) |
| Bachelor's Degree | 0 (0.0%) | 0 (0.0%) |
| Graduate Degree | 0 (0.0%) | 0 (0.0%) |
| Total | 6 (11.5%) | 46 (88.5%) |
Income in Martins Ferry
Income Overview in Martins Ferry
Per Capita Income in Martins Ferry is $25,192, while median incomes of families and households are $49,050 and $39,195 respectively.
| Characteristic | Number | Measure |
| Per Capita Income | 6,283 | $25,192 |
| Median Family Income | 1,559 | $49,050 |
| Mean Family Income | 1,559 | $61,711 |
| Median Household Income | 2,768 | $39,195 |
| Mean Household Income | 2,768 | $58,954 |
| Income Deficit | 1,559 | $13,291 |
| Wage / Income Gap (%) | 6,283 | 9.80% |
| Wage / Income Gap ($) | 6,283 | 90.20¢ per $1 |
| Gini / Inequality Index | 6,283 | 0.52 |
Earnings by Sex in Martins Ferry
Average Earnings in Martins Ferry are $22,878, $20,938 for men and $23,214 for women, a difference of 9.8%.
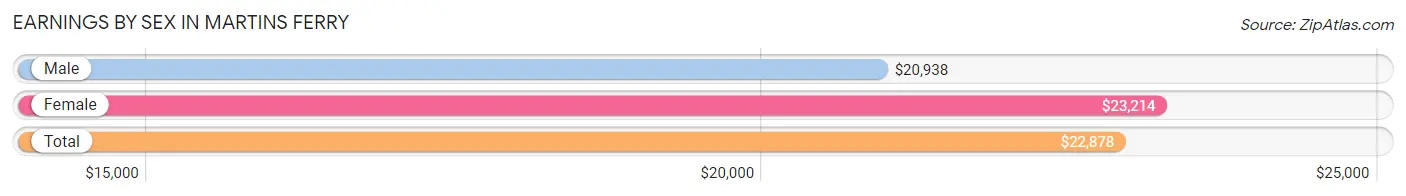
| Sex | Number | Average Earnings |
| Male | 1,756 (54.6%) | $20,938 |
| Female | 1,462 (45.4%) | $23,214 |
| Total | 3,218 (100.0%) | $22,878 |
Earnings by Sex by Income Bracket in Martins Ferry
The most common earnings brackets in Martins Ferry are $2,499 or less for men (406 | 23.1%) and $17,500 to $19,999 for women (213 | 14.6%).
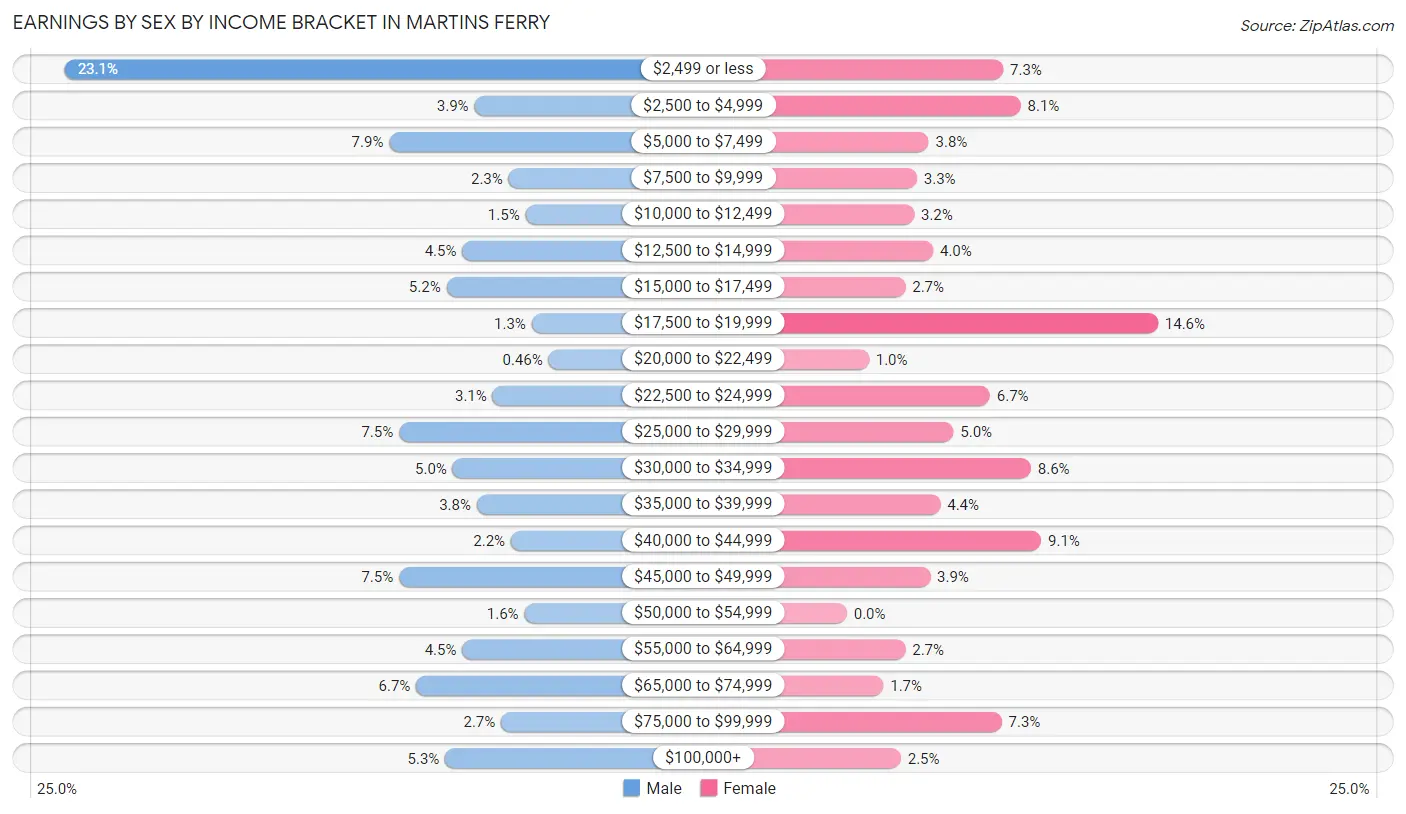
| Income | Male | Female |
| $2,499 or less | 406 (23.1%) | 107 (7.3%) |
| $2,500 to $4,999 | 69 (3.9%) | 119 (8.1%) |
| $5,000 to $7,499 | 139 (7.9%) | 56 (3.8%) |
| $7,500 to $9,999 | 41 (2.3%) | 48 (3.3%) |
| $10,000 to $12,499 | 27 (1.5%) | 46 (3.2%) |
| $12,500 to $14,999 | 79 (4.5%) | 59 (4.0%) |
| $15,000 to $17,499 | 92 (5.2%) | 40 (2.7%) |
| $17,500 to $19,999 | 22 (1.3%) | 213 (14.6%) |
| $20,000 to $22,499 | 8 (0.5%) | 15 (1.0%) |
| $22,500 to $24,999 | 54 (3.1%) | 98 (6.7%) |
| $25,000 to $29,999 | 131 (7.5%) | 73 (5.0%) |
| $30,000 to $34,999 | 87 (5.0%) | 126 (8.6%) |
| $35,000 to $39,999 | 67 (3.8%) | 64 (4.4%) |
| $40,000 to $44,999 | 39 (2.2%) | 133 (9.1%) |
| $45,000 to $49,999 | 131 (7.5%) | 57 (3.9%) |
| $50,000 to $54,999 | 28 (1.6%) | 0 (0.0%) |
| $55,000 to $64,999 | 79 (4.5%) | 40 (2.7%) |
| $65,000 to $74,999 | 117 (6.7%) | 25 (1.7%) |
| $75,000 to $99,999 | 47 (2.7%) | 106 (7.2%) |
| $100,000+ | 93 (5.3%) | 37 (2.5%) |
| Total | 1,756 (100.0%) | 1,462 (100.0%) |
Earnings by Sex by Educational Attainment in Martins Ferry
Average earnings in Martins Ferry are $36,042 for men and $24,710 for women, a difference of 31.4%. Men with an educational attainment of college or associate's degree enjoy the highest average annual earnings of $56,875, while those with less than high school education earn the least with $28,417. Women with an educational attainment of bachelor's degree earn the most with the average annual earnings of $58,667, while those with college or associate's degree education have the smallest earnings of $21,750.
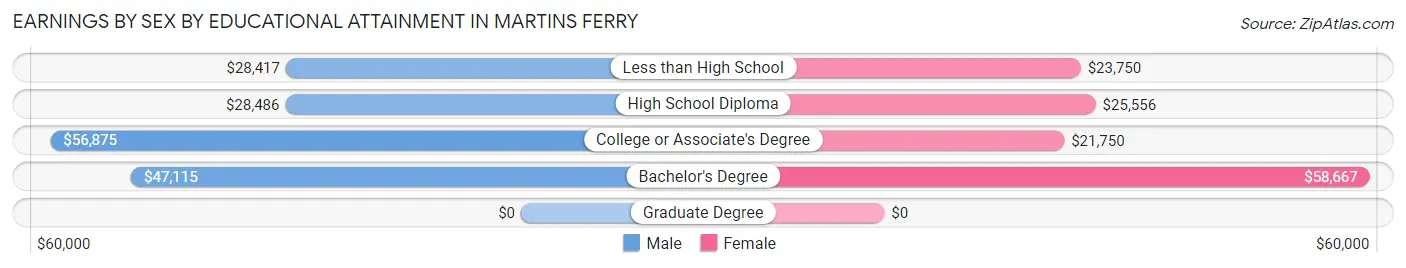
| Educational Attainment | Male Income | Female Income |
| Less than High School | $28,417 | $23,750 |
| High School Diploma | $28,486 | $25,556 |
| College or Associate's Degree | $56,875 | $21,750 |
| Bachelor's Degree | $47,115 | $58,667 |
| Graduate Degree | - | - |
| Total | $36,042 | $24,710 |
Family Income in Martins Ferry
Family Income Brackets in Martins Ferry
According to the Martins Ferry family income data, there are 245 families falling into the $75,000 to $99,999 income range, which is the most common income bracket and makes up 15.7% of all families. Conversely, the $200,000+ income bracket is the least frequent group with only 8 families (0.5%) belonging to this category.
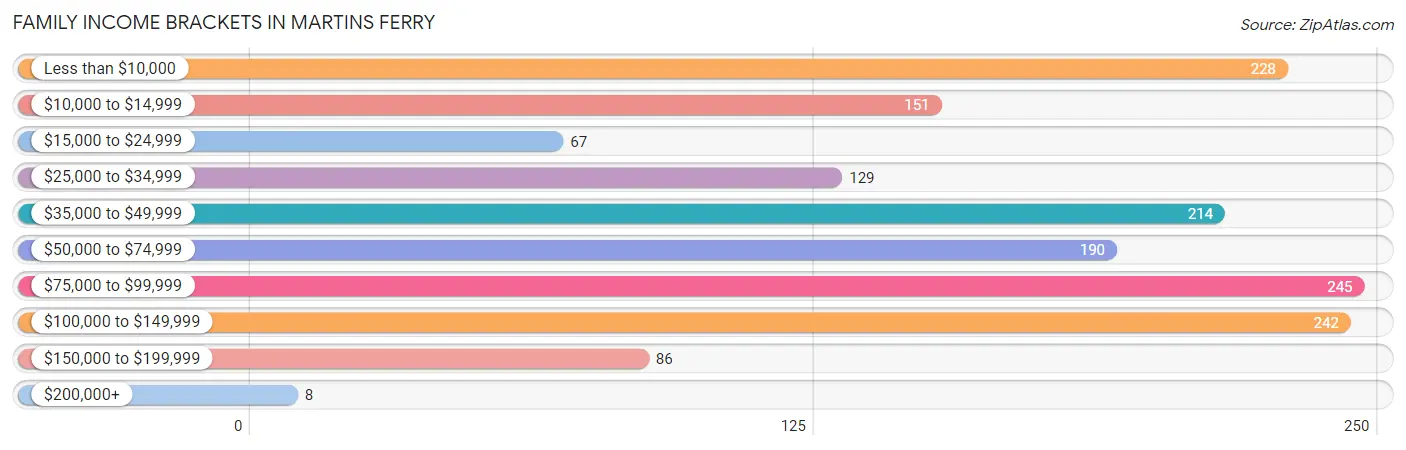
| Income Bracket | # Families | % Families |
| Less than $10,000 | 228 | 14.6% |
| $10,000 to $14,999 | 151 | 9.7% |
| $15,000 to $24,999 | 67 | 4.3% |
| $25,000 to $34,999 | 129 | 8.3% |
| $35,000 to $49,999 | 214 | 13.7% |
| $50,000 to $74,999 | 190 | 12.2% |
| $75,000 to $99,999 | 245 | 15.7% |
| $100,000 to $149,999 | 242 | 15.5% |
| $150,000 to $199,999 | 86 | 5.5% |
| $200,000+ | 8 | 0.5% |
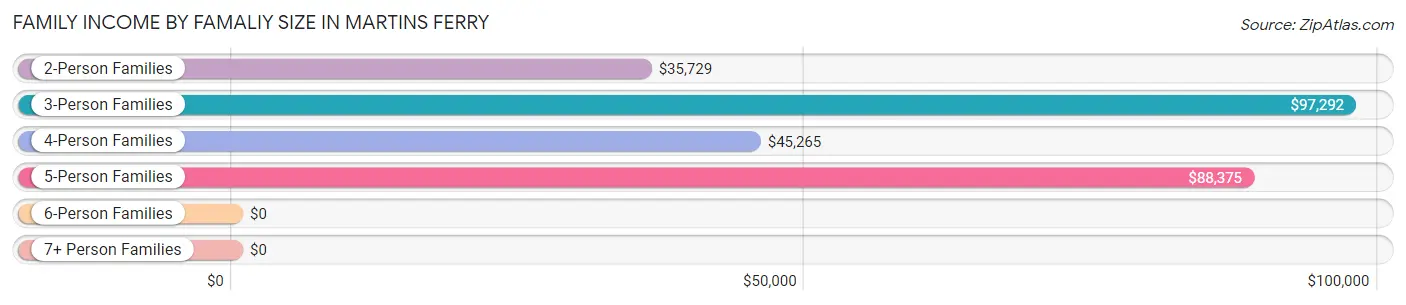
Family Income by Famaliy Size in Martins Ferry
3-person families (471 | 30.2%) account for the highest median family income in Martins Ferry with $97,292 per family, while 3-person families (471 | 30.2%) have the highest median income of $32,431 per family member.
| Income Bracket | # Families | Median Income |
| 2-Person Families | 851 (54.6%) | $35,729 |
| 3-Person Families | 471 (30.2%) | $97,292 |
| 4-Person Families | 155 (9.9%) | $45,265 |
| 5-Person Families | 69 (4.4%) | $88,375 |
| 6-Person Families | 13 (0.8%) | $0 |
| 7+ Person Families | 0 (0.0%) | $0 |
| Total | 1,559 (100.0%) | $49,050 |
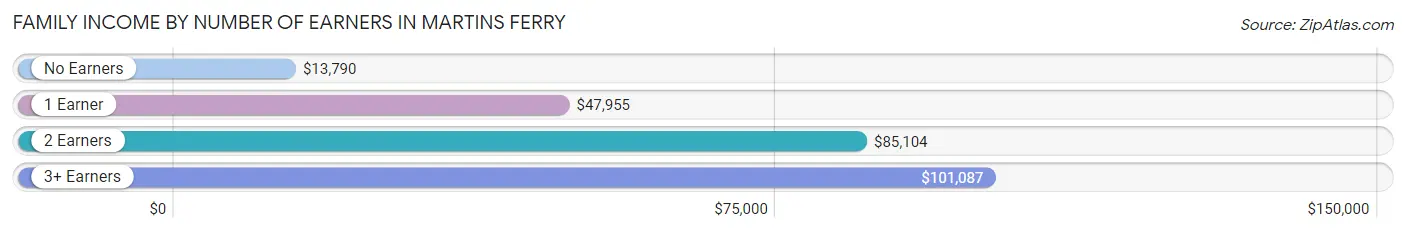
Family Income by Number of Earners in Martins Ferry
The median family income in Martins Ferry is $49,050, with families comprising 3+ earners (114) having the highest median family income of $101,087, while families with no earners (414) have the lowest median family income of $13,790, accounting for 7.3% and 26.6% of families, respectively.
| Number of Earners | # Families | Median Income |
| No Earners | 414 (26.6%) | $13,790 |
| 1 Earner | 502 (32.2%) | $47,955 |
| 2 Earners | 529 (33.9%) | $85,104 |
| 3+ Earners | 114 (7.3%) | $101,087 |
| Total | 1,559 (100.0%) | $49,050 |
Household Income in Martins Ferry
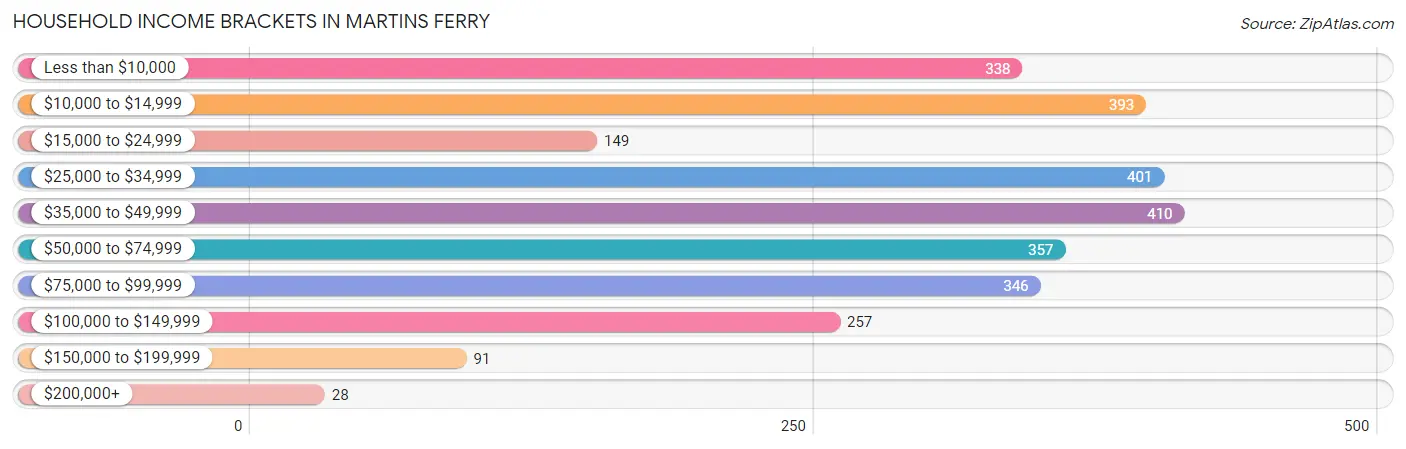
Household Income Brackets in Martins Ferry
With 410 households falling in the category, the $35,000 to $49,999 income range is the most frequent in Martins Ferry, accounting for 14.8% of all households. In contrast, only 28 households (1.0%) fall into the $200,000+ income bracket, making it the least populous group.
| Income Bracket | # Households | % Households |
| Less than $10,000 | 338 | 12.2% |
| $10,000 to $14,999 | 393 | 14.2% |
| $15,000 to $24,999 | 149 | 5.4% |
| $25,000 to $34,999 | 401 | 14.5% |
| $35,000 to $49,999 | 410 | 14.8% |
| $50,000 to $74,999 | 357 | 12.9% |
| $75,000 to $99,999 | 346 | 12.5% |
| $100,000 to $149,999 | 257 | 9.3% |
| $150,000 to $199,999 | 91 | 3.3% |
| $200,000+ | 28 | 1.0% |
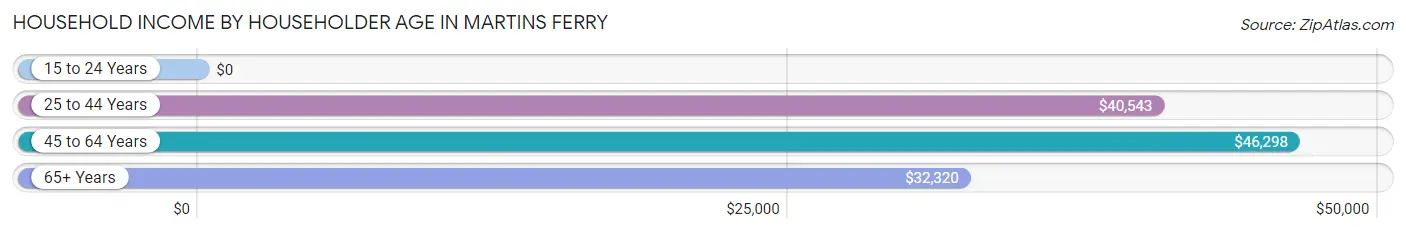
Household Income by Householder Age in Martins Ferry
The median household income in Martins Ferry is $39,195, with the highest median household income of $46,298 found in the 45 to 64 years age bracket for the primary householder. A total of 715 households (25.8%) fall into this category. Meanwhile, the 15 to 24 years age bracket for the primary householder has the lowest median household income of $0, with 37 households (1.3%) in this group.
| Income Bracket | # Households | Median Income |
| 15 to 24 Years | 37 (1.3%) | $0 |
| 25 to 44 Years | 1,122 (40.5%) | $40,543 |
| 45 to 64 Years | 715 (25.8%) | $46,298 |
| 65+ Years | 894 (32.3%) | $32,320 |
| Total | 2,768 (100.0%) | $39,195 |
Poverty in Martins Ferry
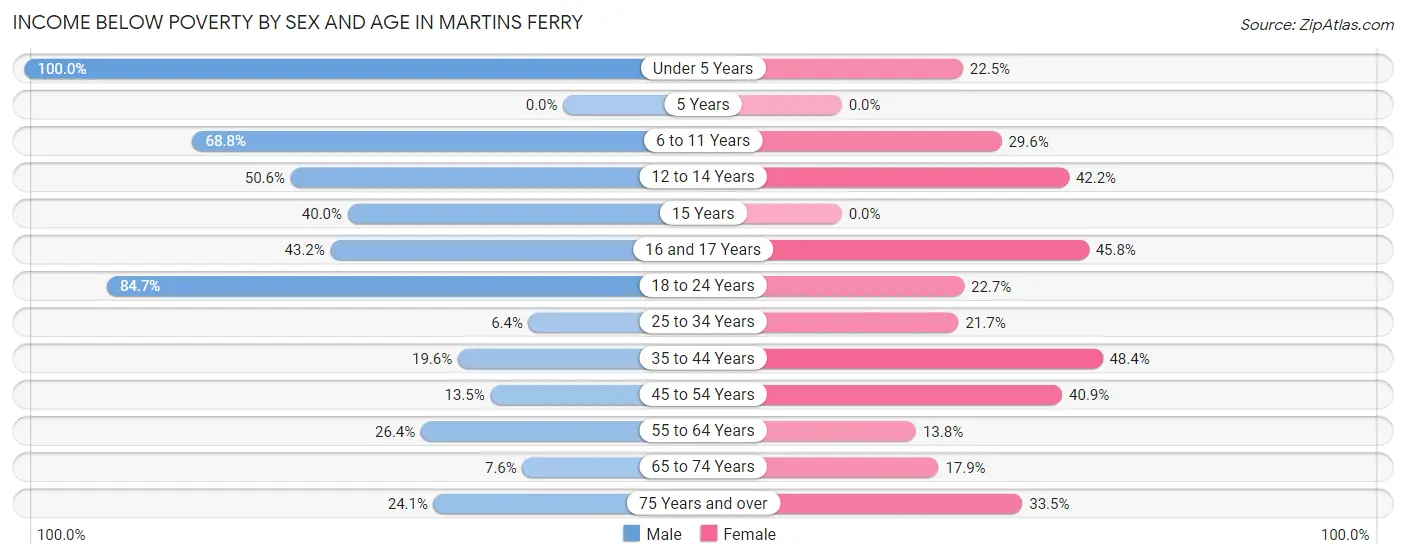
Income Below Poverty by Sex and Age in Martins Ferry
With 37.3% poverty level for males and 27.6% for females among the residents of Martins Ferry, under 5 year old males and 35 to 44 year old females are the most vulnerable to poverty, with 38 males (100.0%) and 241 females (48.4%) in their respective age groups living below the poverty level.
| Age Bracket | Male | Female |
| Under 5 Years | 38 (100.0%) | 29 (22.5%) |
| 5 Years | 0 (0.0%) | 0 (0.0%) |
| 6 to 11 Years | 150 (68.8%) | 83 (29.6%) |
| 12 to 14 Years | 43 (50.6%) | 43 (42.2%) |
| 15 Years | 12 (40.0%) | 0 (0.0%) |
| 16 and 17 Years | 70 (43.2%) | 11 (45.8%) |
| 18 to 24 Years | 493 (84.7%) | 27 (22.7%) |
| 25 to 34 Years | 17 (6.4%) | 99 (21.7%) |
| 35 to 44 Years | 113 (19.6%) | 241 (48.4%) |
| 45 to 54 Years | 40 (13.5%) | 92 (40.9%) |
| 55 to 64 Years | 85 (26.4%) | 61 (13.8%) |
| 65 to 74 Years | 22 (7.6%) | 108 (17.9%) |
| 75 Years and over | 19 (24.0%) | 65 (33.5%) |
| Total | 1,102 (37.3%) | 859 (27.6%) |
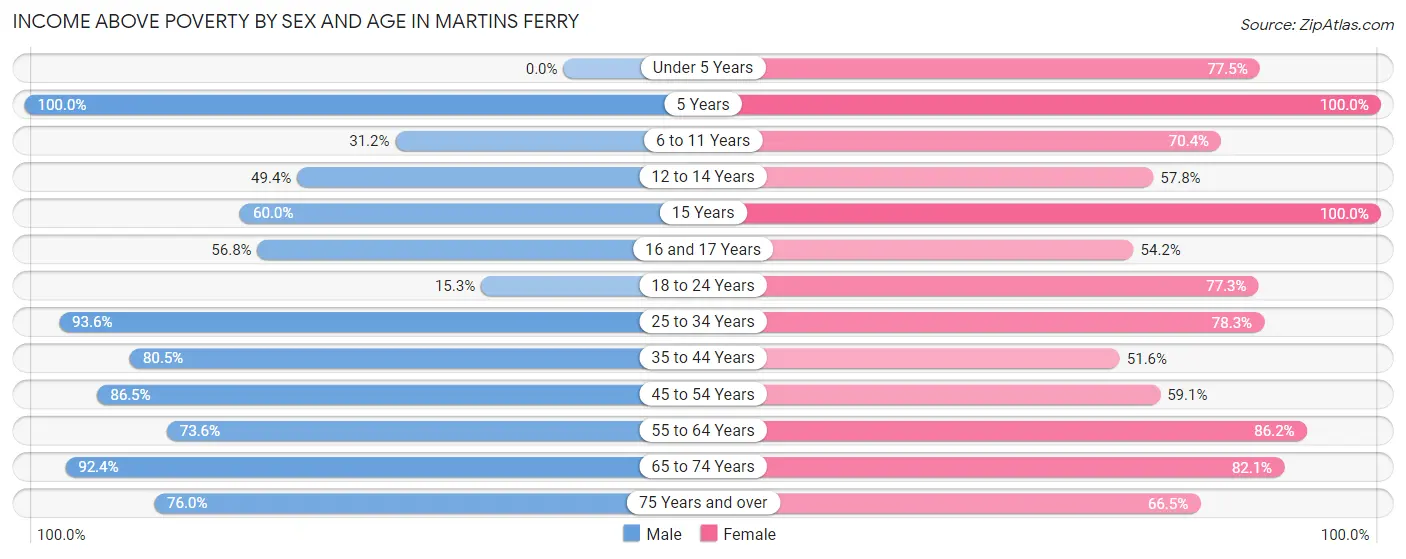
Income Above Poverty by Sex and Age in Martins Ferry
According to the poverty statistics in Martins Ferry, males aged 5 years and females aged 5 years are the age groups that are most secure financially, with 100.0% of males and 100.0% of females in these age groups living above the poverty line.
| Age Bracket | Male | Female |
| Under 5 Years | 0 (0.0%) | 100 (77.5%) |
| 5 Years | 6 (100.0%) | 19 (100.0%) |
| 6 to 11 Years | 68 (31.2%) | 197 (70.4%) |
| 12 to 14 Years | 42 (49.4%) | 59 (57.8%) |
| 15 Years | 18 (60.0%) | 17 (100.0%) |
| 16 and 17 Years | 92 (56.8%) | 13 (54.2%) |
| 18 to 24 Years | 89 (15.3%) | 92 (77.3%) |
| 25 to 34 Years | 248 (93.6%) | 358 (78.3%) |
| 35 to 44 Years | 465 (80.4%) | 257 (51.6%) |
| 45 to 54 Years | 256 (86.5%) | 133 (59.1%) |
| 55 to 64 Years | 237 (73.6%) | 382 (86.2%) |
| 65 to 74 Years | 269 (92.4%) | 494 (82.1%) |
| 75 Years and over | 60 (75.9%) | 129 (66.5%) |
| Total | 1,850 (62.7%) | 2,250 (72.4%) |
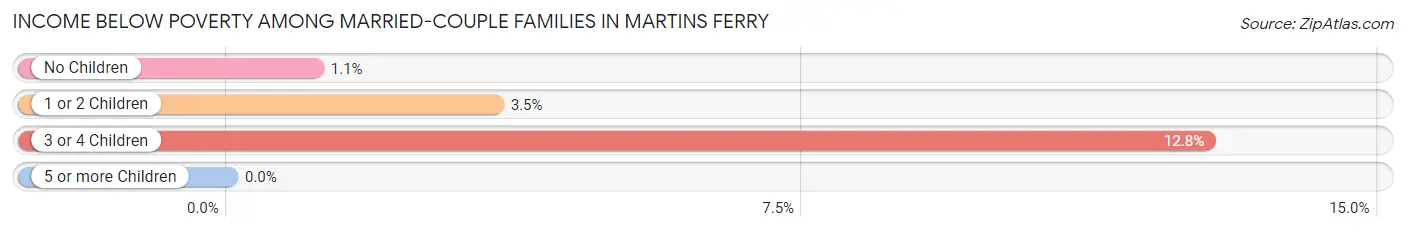
Income Below Poverty Among Married-Couple Families in Martins Ferry
The poverty statistics for married-couple families in Martins Ferry show that 2.6% or 25 of the total 956 families live below the poverty line. Families with 3 or 4 children have the highest poverty rate of 12.8%, comprising of 6 families. On the other hand, families with no children have the lowest poverty rate of 1.1%, which includes 6 families.
| Children | Above Poverty | Below Poverty |
| No Children | 528 (98.9%) | 6 (1.1%) |
| 1 or 2 Children | 362 (96.5%) | 13 (3.5%) |
| 3 or 4 Children | 41 (87.2%) | 6 (12.8%) |
| 5 or more Children | 0 (0.0%) | 0 (0.0%) |
| Total | 931 (97.4%) | 25 (2.6%) |
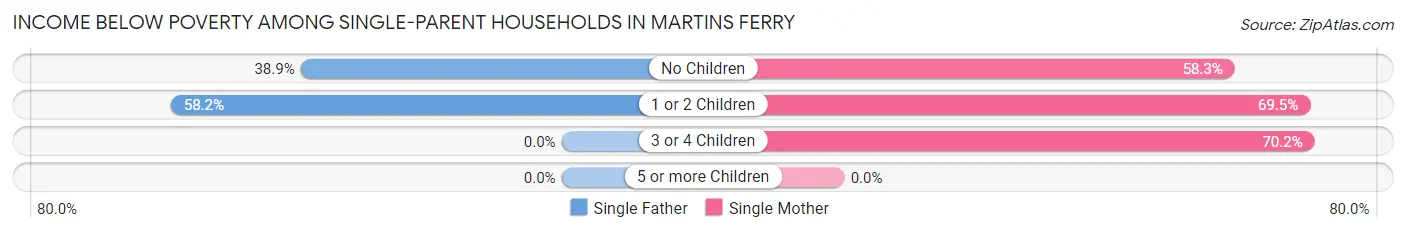
Income Below Poverty Among Single-Parent Households in Martins Ferry
According to the poverty data in Martins Ferry, 51.5% or 53 single-father households and 67.0% or 335 single-mother households are living below the poverty line. Among single-father households, those with 1 or 2 children have the highest poverty rate, with 39 households (58.2%) experiencing poverty. Likewise, among single-mother households, those with 3 or 4 children have the highest poverty rate, with 47 households (70.2%) falling below the poverty line.
| Children | Single Father | Single Mother |
| No Children | 14 (38.9%) | 67 (58.3%) |
| 1 or 2 Children | 39 (58.2%) | 221 (69.5%) |
| 3 or 4 Children | 0 (0.0%) | 47 (70.2%) |
| 5 or more Children | 0 (0.0%) | 0 (0.0%) |
| Total | 53 (51.5%) | 335 (67.0%) |
Income Below Poverty Among Married-Couple vs Single-Parent Households in Martins Ferry
The poverty data for Martins Ferry shows that 25 of the married-couple family households (2.6%) and 388 of the single-parent households (64.3%) are living below the poverty level. Within the married-couple family households, those with 3 or 4 children have the highest poverty rate, with 6 households (12.8%) falling below the poverty line. Among the single-parent households, those with 3 or 4 children have the highest poverty rate, with 47 household (70.2%) living below poverty.
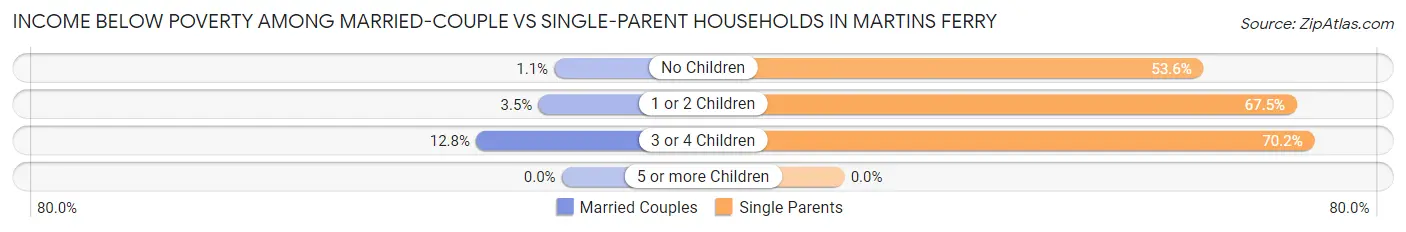
| Children | Married-Couple Families | Single-Parent Households |
| No Children | 6 (1.1%) | 81 (53.6%) |
| 1 or 2 Children | 13 (3.5%) | 260 (67.5%) |
| 3 or 4 Children | 6 (12.8%) | 47 (70.2%) |
| 5 or more Children | 0 (0.0%) | 0 (0.0%) |
| Total | 25 (2.6%) | 388 (64.3%) |
Employment Characteristics in Martins Ferry
Employment by Class of Employer in Martins Ferry
Among the 2,502 employed individuals in Martins Ferry, private company employees (2,178 | 87.1%), not-for-profit organizations (133 | 5.3%), and self-employed (not incorporated) (69 | 2.8%) make up the most common classes of employment.
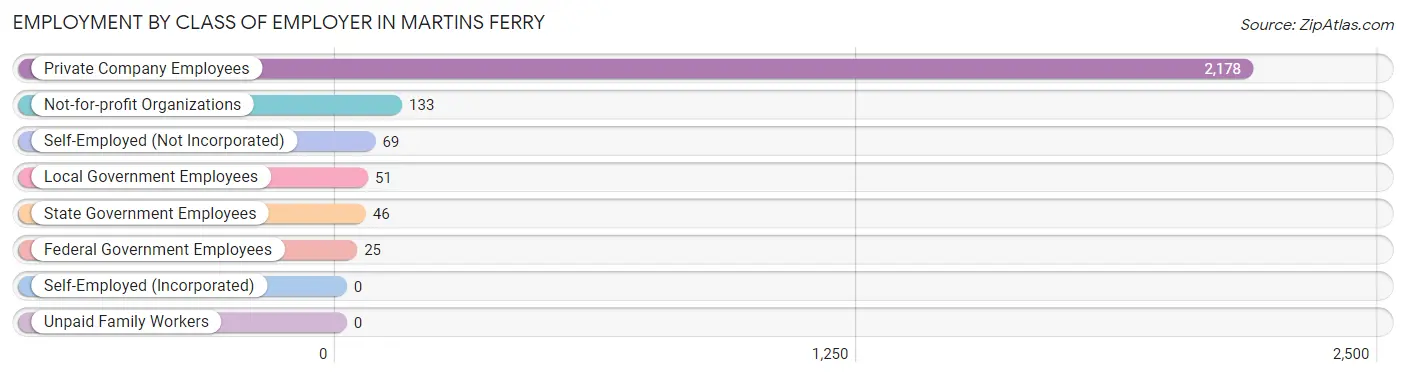
| Employer Class | # Employees | % Employees |
| Private Company Employees | 2,178 | 87.1% |
| Self-Employed (Incorporated) | 0 | 0.0% |
| Self-Employed (Not Incorporated) | 69 | 2.8% |
| Not-for-profit Organizations | 133 | 5.3% |
| Local Government Employees | 51 | 2.0% |
| State Government Employees | 46 | 1.8% |
| Federal Government Employees | 25 | 1.0% |
| Unpaid Family Workers | 0 | 0.0% |
| Total | 2,502 | 100.0% |
Employment Status by Age in Martins Ferry
According to the labor force statistics for Martins Ferry, out of the total population over 16 years of age (5,210), 60.6% or 3,157 individuals are in the labor force, with 20.8% or 657 of them unemployed. The age group with the highest labor force participation rate is 20 to 24 years, with 88.5% or 232 individuals in the labor force. Within the labor force, the 16 to 19 years age range has the highest percentage of unemployed individuals, with 75.2% or 336 of them being unemployed.
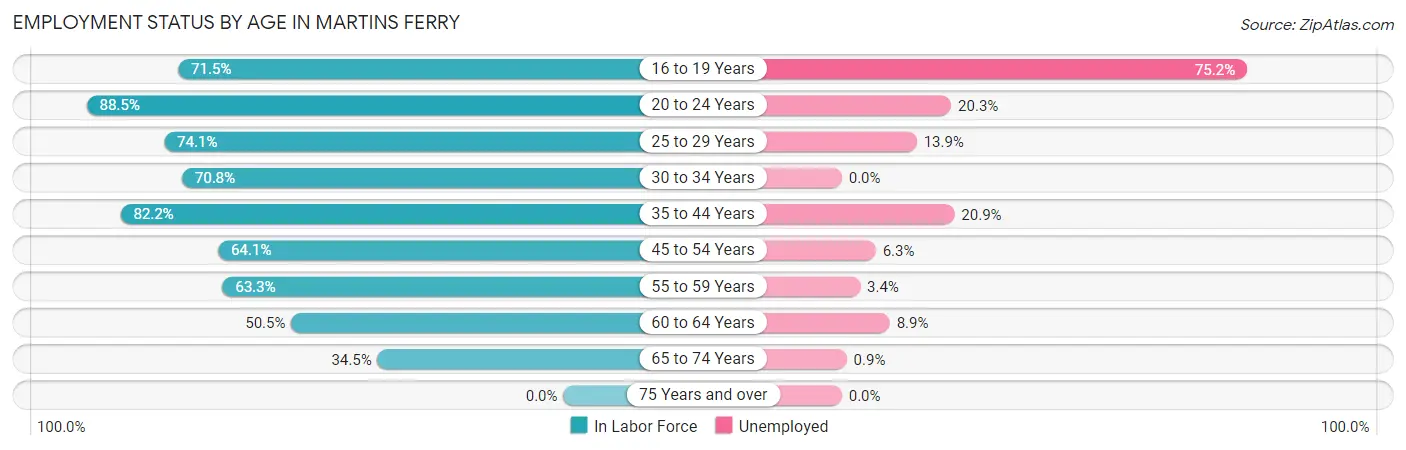
| Age Bracket | In Labor Force | Unemployed |
| 16 to 19 Years | 447 (71.5%) | 336 (75.2%) |
| 20 to 24 Years | 232 (88.5%) | 47 (20.3%) |
| 25 to 29 Years | 266 (74.1%) | 37 (13.9%) |
| 30 to 34 Years | 257 (70.8%) | 0 (0.0%) |
| 35 to 44 Years | 884 (82.2%) | 185 (20.9%) |
| 45 to 54 Years | 334 (64.1%) | 21 (6.3%) |
| 55 to 59 Years | 176 (63.3%) | 6 (3.4%) |
| 60 to 64 Years | 246 (50.5%) | 22 (8.9%) |
| 65 to 74 Years | 317 (34.5%) | 3 (0.9%) |
| 75 Years and over | 0 (0.0%) | 0 (0.0%) |
| Total | 3,157 (60.6%) | 657 (20.8%) |
Employment Status by Educational Attainment in Martins Ferry
According to labor force statistics for Martins Ferry, 70.1% of individuals (2,162) out of the total population between 25 and 64 years of age (3,084) are in the labor force, with 12.5% or 270 of them being unemployed. The group with the highest labor force participation rate are those with the educational attainment of bachelor's degree or higher, with 85.2% or 287 individuals in the labor force. Within the labor force, individuals with bachelor's degree or higher education have the highest percentage of unemployment, with 31.0% or 89 of them being unemployed.
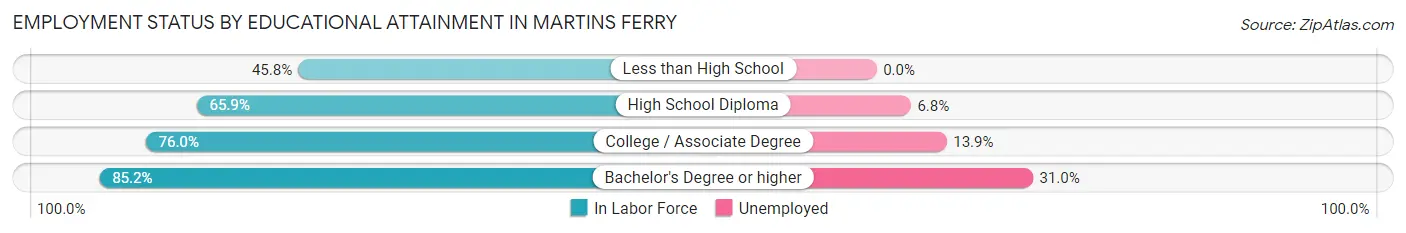
| Educational Attainment | In Labor Force | Unemployed |
| Less than High School | 119 (45.8%) | 0 (0.0%) |
| High School Diploma | 872 (65.9%) | 90 (6.8%) |
| College / Associate Degree | 885 (76.0%) | 162 (13.9%) |
| Bachelor's Degree or higher | 287 (85.2%) | 104 (31.0%) |
| Total | 2,162 (70.1%) | 386 (12.5%) |
Employment Occupations by Sex in Martins Ferry
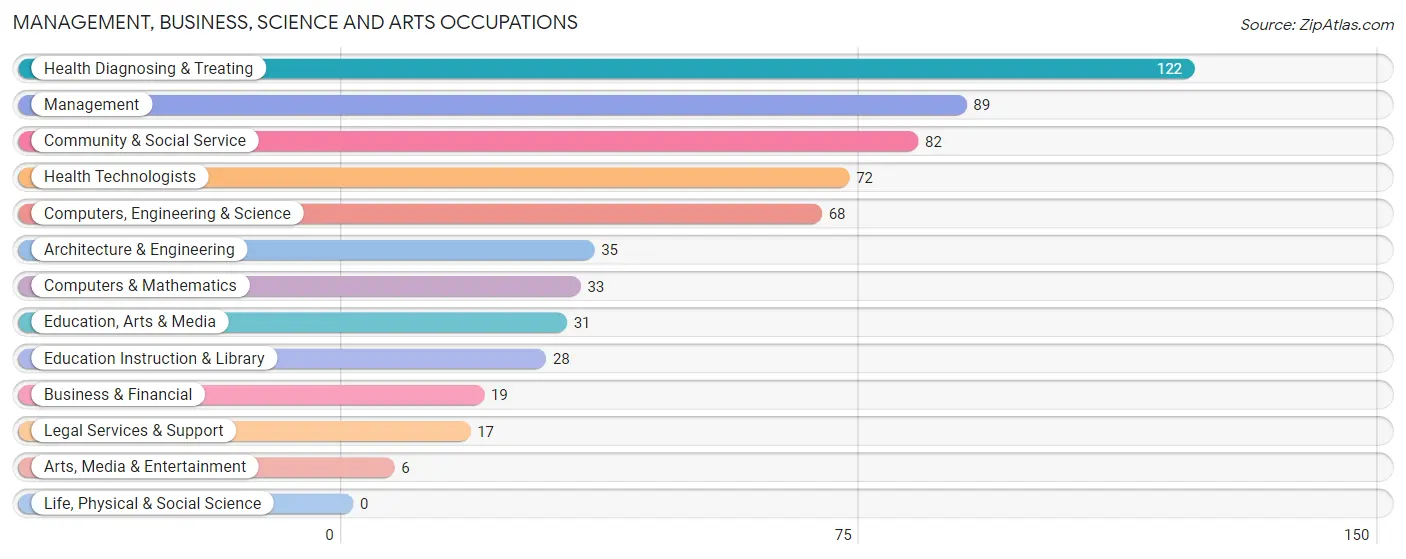
Management, Business, Science and Arts Occupations
The most common Management, Business, Science and Arts occupations in Martins Ferry are Health Diagnosing & Treating (122 | 4.9%), Management (89 | 3.6%), Community & Social Service (82 | 3.3%), Health Technologists (72 | 2.9%), and Computers, Engineering & Science (68 | 2.7%).
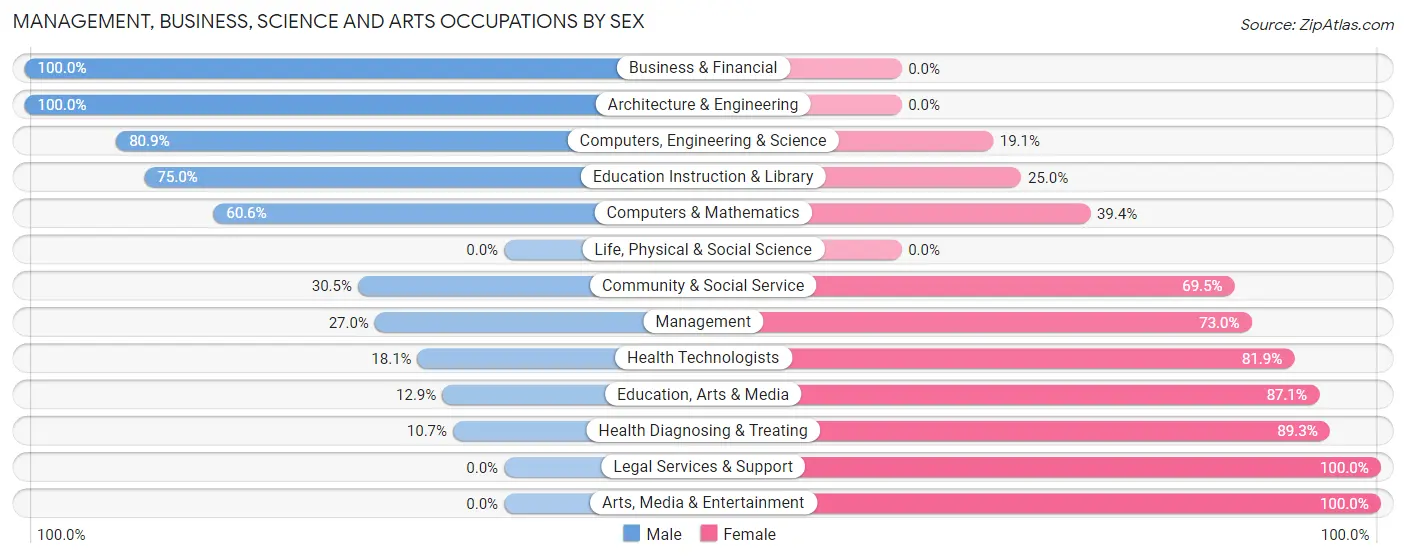
Management, Business, Science and Arts Occupations by Sex
Within the Management, Business, Science and Arts occupations in Martins Ferry, the most male-oriented occupations are Business & Financial (100.0%), Architecture & Engineering (100.0%), and Computers, Engineering & Science (80.9%), while the most female-oriented occupations are Legal Services & Support (100.0%), Arts, Media & Entertainment (100.0%), and Health Diagnosing & Treating (89.3%).
| Occupation | Male | Female |
| Management | 24 (27.0%) | 65 (73.0%) |
| Business & Financial | 19 (100.0%) | 0 (0.0%) |
| Computers, Engineering & Science | 55 (80.9%) | 13 (19.1%) |
| Computers & Mathematics | 20 (60.6%) | 13 (39.4%) |
| Architecture & Engineering | 35 (100.0%) | 0 (0.0%) |
| Life, Physical & Social Science | 0 (0.0%) | 0 (0.0%) |
| Community & Social Service | 25 (30.5%) | 57 (69.5%) |
| Education, Arts & Media | 4 (12.9%) | 27 (87.1%) |
| Legal Services & Support | 0 (0.0%) | 17 (100.0%) |
| Education Instruction & Library | 21 (75.0%) | 7 (25.0%) |
| Arts, Media & Entertainment | 0 (0.0%) | 6 (100.0%) |
| Health Diagnosing & Treating | 13 (10.7%) | 109 (89.3%) |
| Health Technologists | 13 (18.1%) | 59 (81.9%) |
| Total (Category) | 136 (35.8%) | 244 (64.2%) |
| Total (Overall) | 1,287 (51.4%) | 1,215 (48.6%) |
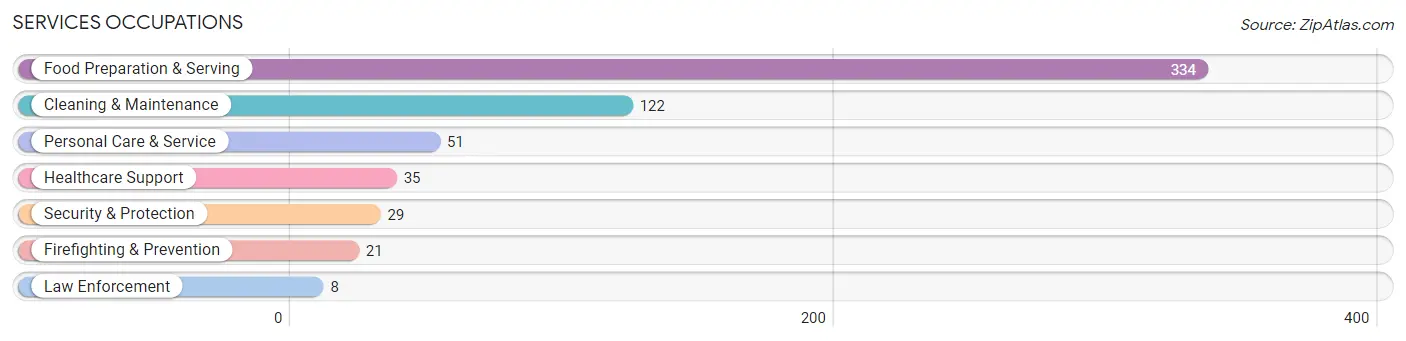
Services Occupations
The most common Services occupations in Martins Ferry are Food Preparation & Serving (334 | 13.4%), Cleaning & Maintenance (122 | 4.9%), Personal Care & Service (51 | 2.0%), Healthcare Support (35 | 1.4%), and Security & Protection (29 | 1.2%).
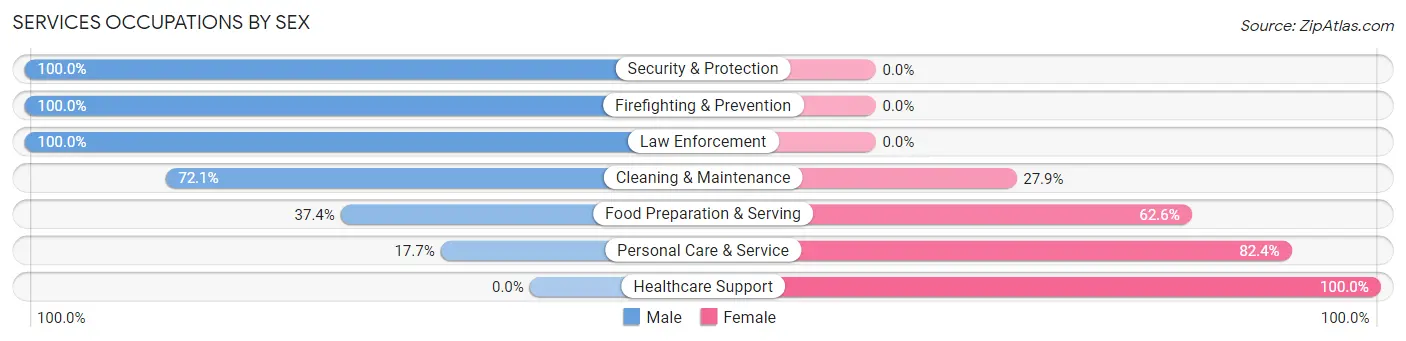
Services Occupations by Sex
Within the Services occupations in Martins Ferry, the most male-oriented occupations are Security & Protection (100.0%), Firefighting & Prevention (100.0%), and Law Enforcement (100.0%), while the most female-oriented occupations are Healthcare Support (100.0%), Personal Care & Service (82.4%), and Food Preparation & Serving (62.6%).
| Occupation | Male | Female |
| Healthcare Support | 0 (0.0%) | 35 (100.0%) |
| Security & Protection | 29 (100.0%) | 0 (0.0%) |
| Firefighting & Prevention | 21 (100.0%) | 0 (0.0%) |
| Law Enforcement | 8 (100.0%) | 0 (0.0%) |
| Food Preparation & Serving | 125 (37.4%) | 209 (62.6%) |
| Cleaning & Maintenance | 88 (72.1%) | 34 (27.9%) |
| Personal Care & Service | 9 (17.6%) | 42 (82.4%) |
| Total (Category) | 251 (44.0%) | 320 (56.0%) |
| Total (Overall) | 1,287 (51.4%) | 1,215 (48.6%) |
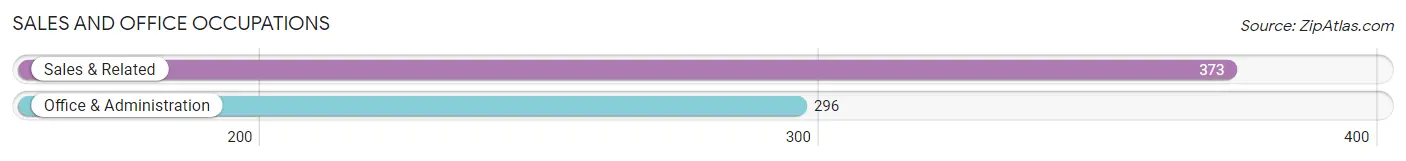
Sales and Office Occupations
The most common Sales and Office occupations in Martins Ferry are Sales & Related (373 | 14.9%), and Office & Administration (296 | 11.8%).
Sales and Office Occupations by Sex
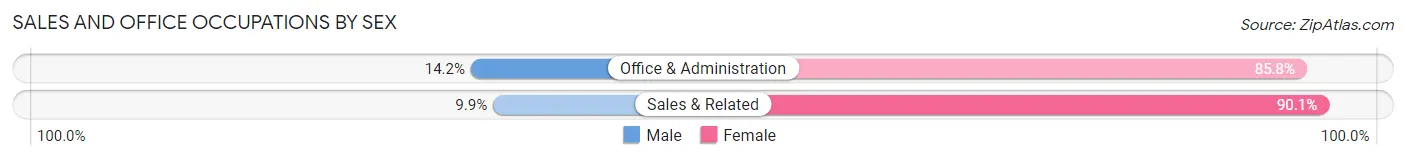
| Occupation | Male | Female |
| Sales & Related | 37 (9.9%) | 336 (90.1%) |
| Office & Administration | 42 (14.2%) | 254 (85.8%) |
| Total (Category) | 79 (11.8%) | 590 (88.2%) |
| Total (Overall) | 1,287 (51.4%) | 1,215 (48.6%) |
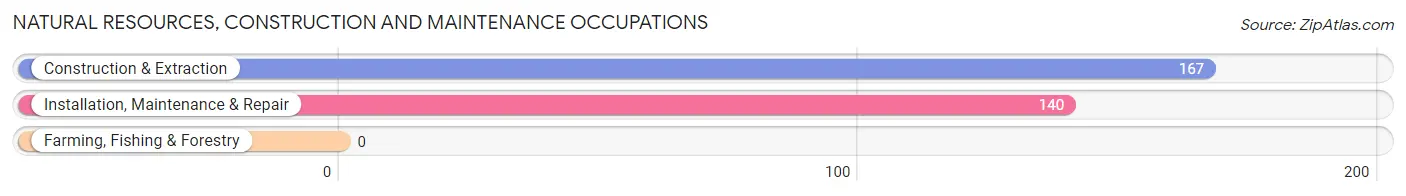
Natural Resources, Construction and Maintenance Occupations
The most common Natural Resources, Construction and Maintenance occupations in Martins Ferry are Construction & Extraction (167 | 6.7%), and Installation, Maintenance & Repair (140 | 5.6%).
Natural Resources, Construction and Maintenance Occupations by Sex
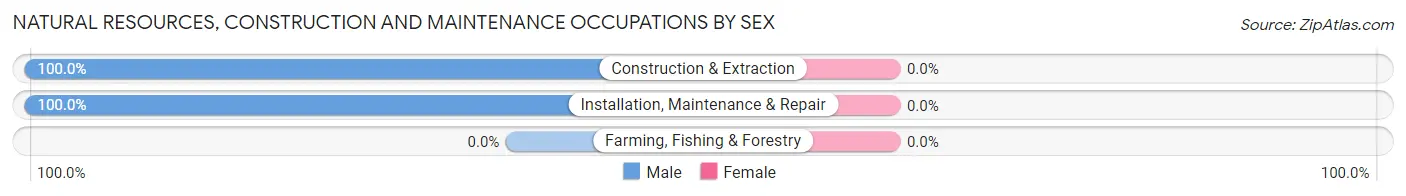
| Occupation | Male | Female |
| Farming, Fishing & Forestry | 0 (0.0%) | 0 (0.0%) |
| Construction & Extraction | 167 (100.0%) | 0 (0.0%) |
| Installation, Maintenance & Repair | 140 (100.0%) | 0 (0.0%) |
| Total (Category) | 307 (100.0%) | 0 (0.0%) |
| Total (Overall) | 1,287 (51.4%) | 1,215 (48.6%) |
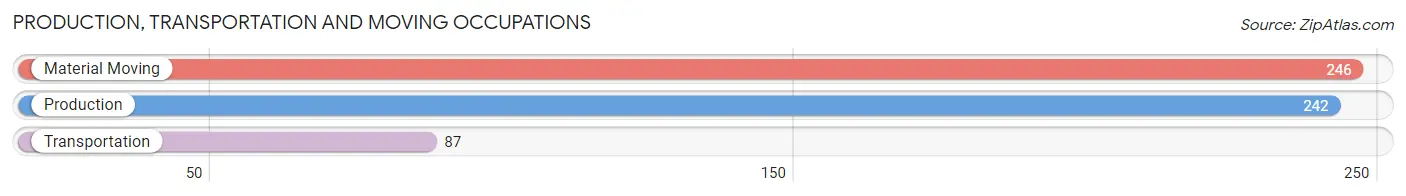
Production, Transportation and Moving Occupations
The most common Production, Transportation and Moving occupations in Martins Ferry are Material Moving (246 | 9.8%), Production (242 | 9.7%), and Transportation (87 | 3.5%).
Production, Transportation and Moving Occupations by Sex
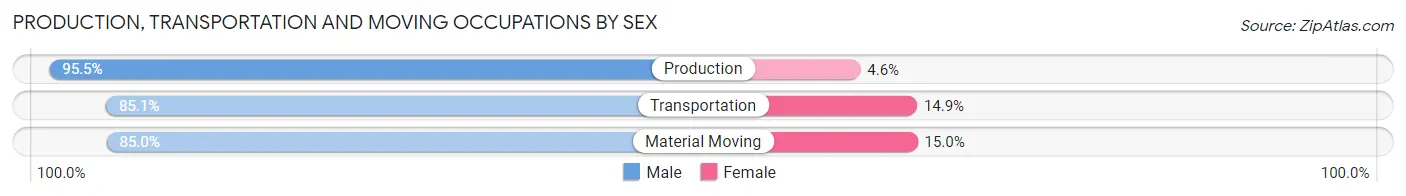
| Occupation | Male | Female |
| Production | 231 (95.5%) | 11 (4.5%) |
| Transportation | 74 (85.1%) | 13 (14.9%) |
| Material Moving | 209 (85.0%) | 37 (15.0%) |
| Total (Category) | 514 (89.4%) | 61 (10.6%) |
| Total (Overall) | 1,287 (51.4%) | 1,215 (48.6%) |
Employment Industries by Sex in Martins Ferry
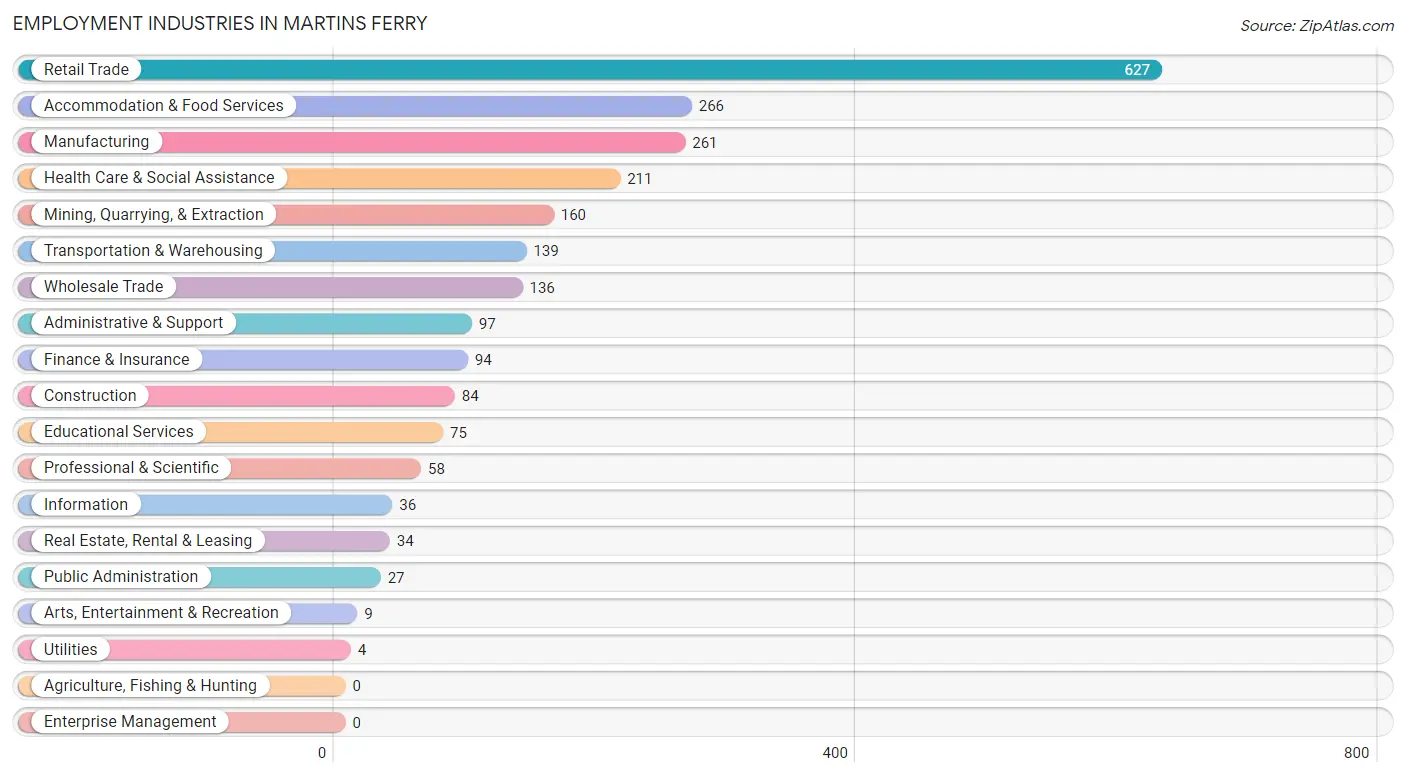
Employment Industries in Martins Ferry
The major employment industries in Martins Ferry include Retail Trade (627 | 25.1%), Accommodation & Food Services (266 | 10.6%), Manufacturing (261 | 10.4%), Health Care & Social Assistance (211 | 8.4%), and Mining, Quarrying, & Extraction (160 | 6.4%).
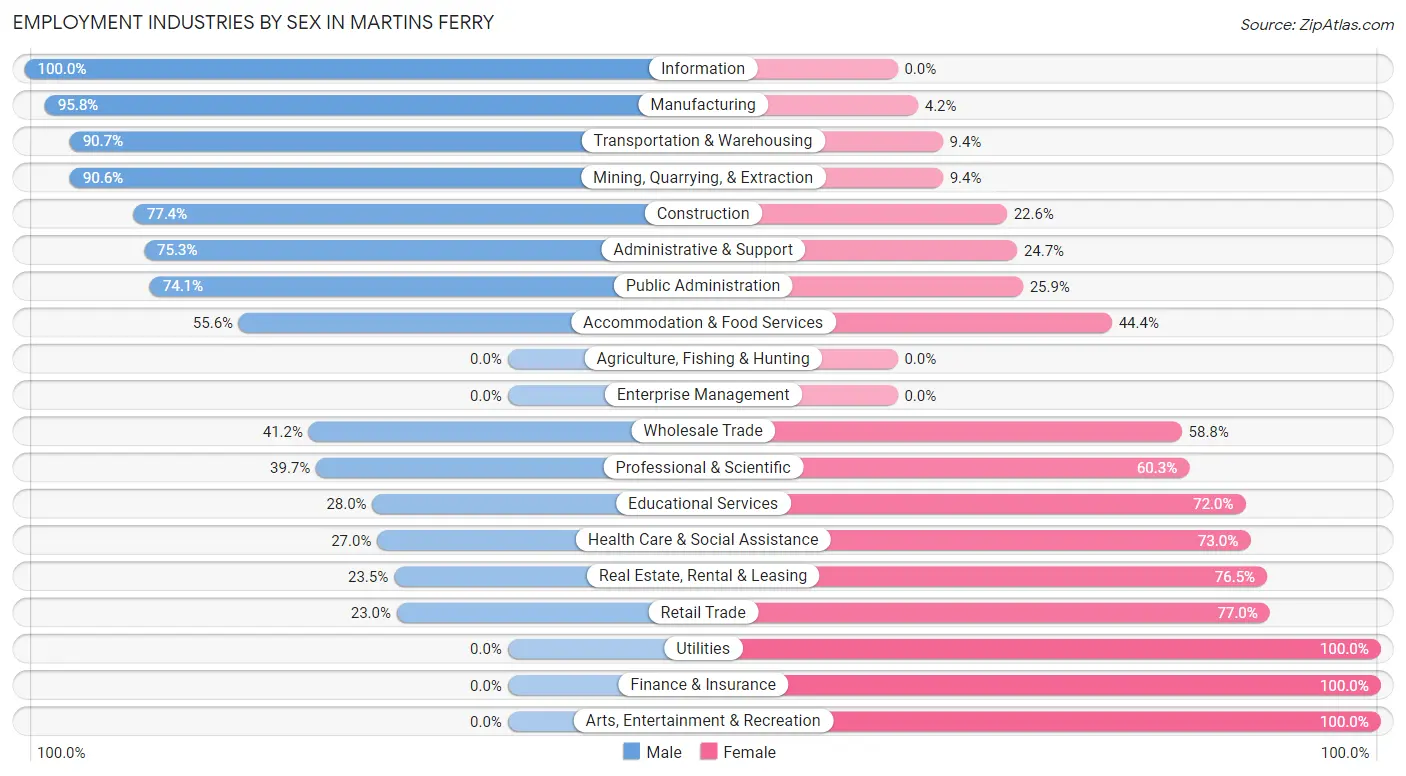
Employment Industries by Sex in Martins Ferry
The Martins Ferry industries that see more men than women are Information (100.0%), Manufacturing (95.8%), and Transportation & Warehousing (90.6%), whereas the industries that tend to have a higher number of women are Utilities (100.0%), Finance & Insurance (100.0%), and Arts, Entertainment & Recreation (100.0%).
| Industry | Male | Female |
| Agriculture, Fishing & Hunting | 0 (0.0%) | 0 (0.0%) |
| Mining, Quarrying, & Extraction | 145 (90.6%) | 15 (9.4%) |
| Construction | 65 (77.4%) | 19 (22.6%) |
| Manufacturing | 250 (95.8%) | 11 (4.2%) |
| Wholesale Trade | 56 (41.2%) | 80 (58.8%) |
| Retail Trade | 144 (23.0%) | 483 (77.0%) |
| Transportation & Warehousing | 126 (90.6%) | 13 (9.3%) |
| Utilities | 0 (0.0%) | 4 (100.0%) |
| Information | 36 (100.0%) | 0 (0.0%) |
| Finance & Insurance | 0 (0.0%) | 94 (100.0%) |
| Real Estate, Rental & Leasing | 8 (23.5%) | 26 (76.5%) |
| Professional & Scientific | 23 (39.7%) | 35 (60.3%) |
| Enterprise Management | 0 (0.0%) | 0 (0.0%) |
| Administrative & Support | 73 (75.3%) | 24 (24.7%) |
| Educational Services | 21 (28.0%) | 54 (72.0%) |
| Health Care & Social Assistance | 57 (27.0%) | 154 (73.0%) |
| Arts, Entertainment & Recreation | 0 (0.0%) | 9 (100.0%) |
| Accommodation & Food Services | 148 (55.6%) | 118 (44.4%) |
| Public Administration | 20 (74.1%) | 7 (25.9%) |
| Total | 1,287 (51.4%) | 1,215 (48.6%) |
Education in Martins Ferry
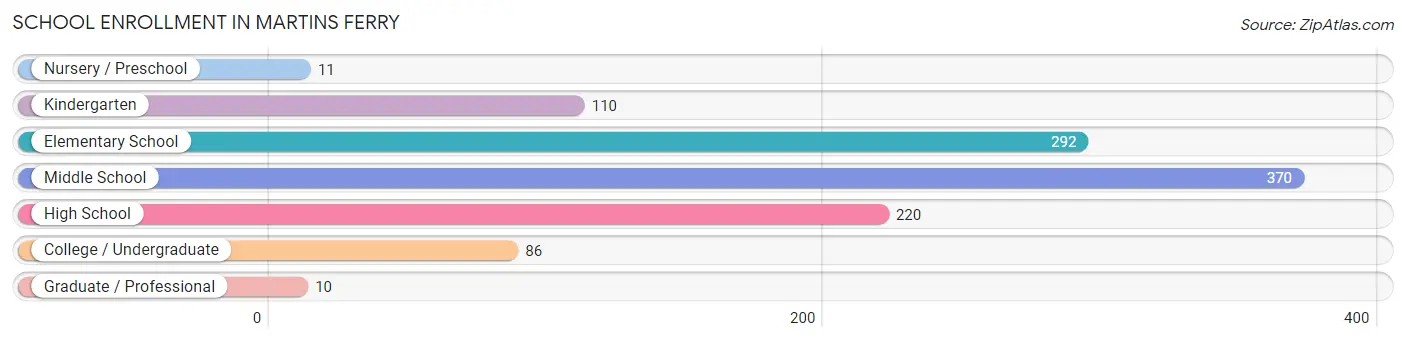
School Enrollment in Martins Ferry
The most common levels of schooling among the 1,099 students in Martins Ferry are middle school (370 | 33.7%), elementary school (292 | 26.6%), and high school (220 | 20.0%).
| School Level | # Students | % Students |
| Nursery / Preschool | 11 | 1.0% |
| Kindergarten | 110 | 10.0% |
| Elementary School | 292 | 26.6% |
| Middle School | 370 | 33.7% |
| High School | 220 | 20.0% |
| College / Undergraduate | 86 | 7.8% |
| Graduate / Professional | 10 | 0.9% |
| Total | 1,099 | 100.0% |
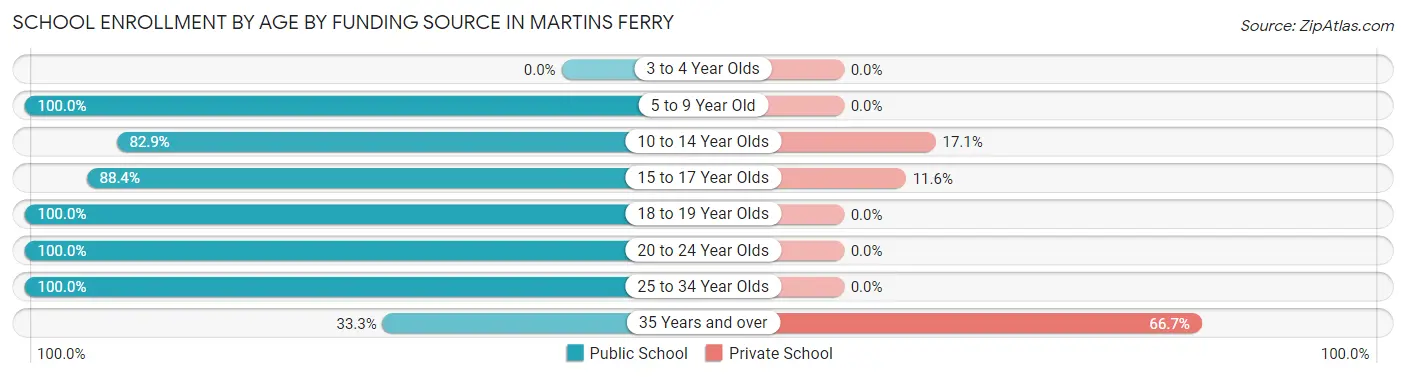
School Enrollment by Age by Funding Source in Martins Ferry
Out of a total of 1,099 students who are enrolled in schools in Martins Ferry, 103 (9.4%) attend a private institution, while the remaining 996 (90.6%) are enrolled in public schools. The age group of 35 years and over has the highest likelihood of being enrolled in private schools, with 10 (66.7% in the age bracket) enrolled. Conversely, the age group of 5 to 9 year old has the lowest likelihood of being enrolled in a private school, with 357 (100.0% in the age bracket) attending a public institution.
| Age Bracket | Public School | Private School |
| 3 to 4 Year Olds | 0 (0.0%) | 0 (0.0%) |
| 5 to 9 Year Old | 357 (100.0%) | 0 (0.0%) |
| 10 to 14 Year Olds | 339 (82.9%) | 70 (17.1%) |
| 15 to 17 Year Olds | 176 (88.4%) | 23 (11.6%) |
| 18 to 19 Year Olds | 81 (100.0%) | 0 (0.0%) |
| 20 to 24 Year Olds | 15 (100.0%) | 0 (0.0%) |
| 25 to 34 Year Olds | 23 (100.0%) | 0 (0.0%) |
| 35 Years and over | 5 (33.3%) | 10 (66.7%) |
| Total | 996 (90.6%) | 103 (9.4%) |
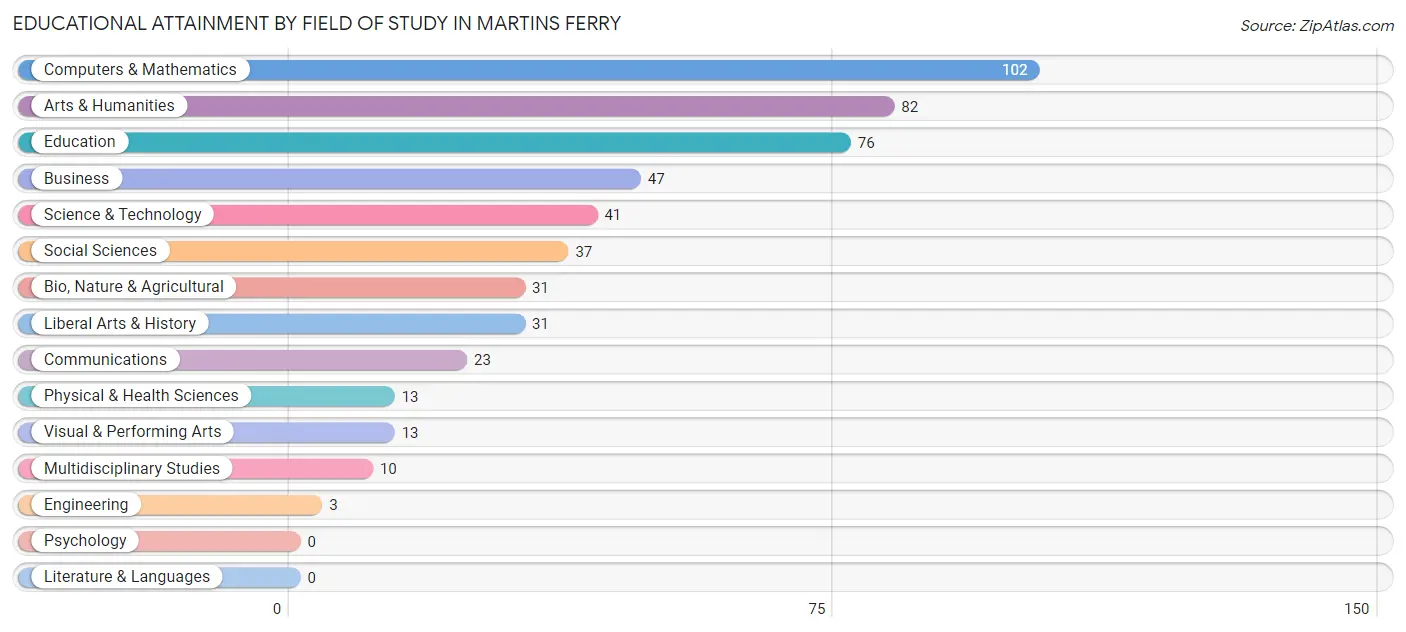
Educational Attainment by Field of Study in Martins Ferry
Computers & mathematics (102 | 20.0%), arts & humanities (82 | 16.1%), education (76 | 14.9%), business (47 | 9.2%), and science & technology (41 | 8.1%) are the most common fields of study among 509 individuals in Martins Ferry who have obtained a bachelor's degree or higher.
| Field of Study | # Graduates | % Graduates |
| Computers & Mathematics | 102 | 20.0% |
| Bio, Nature & Agricultural | 31 | 6.1% |
| Physical & Health Sciences | 13 | 2.5% |
| Psychology | 0 | 0.0% |
| Social Sciences | 37 | 7.3% |
| Engineering | 3 | 0.6% |
| Multidisciplinary Studies | 10 | 2.0% |
| Science & Technology | 41 | 8.1% |
| Business | 47 | 9.2% |
| Education | 76 | 14.9% |
| Literature & Languages | 0 | 0.0% |
| Liberal Arts & History | 31 | 6.1% |
| Visual & Performing Arts | 13 | 2.5% |
| Communications | 23 | 4.5% |
| Arts & Humanities | 82 | 16.1% |
| Total | 509 | 100.0% |
Transportation & Commute in Martins Ferry
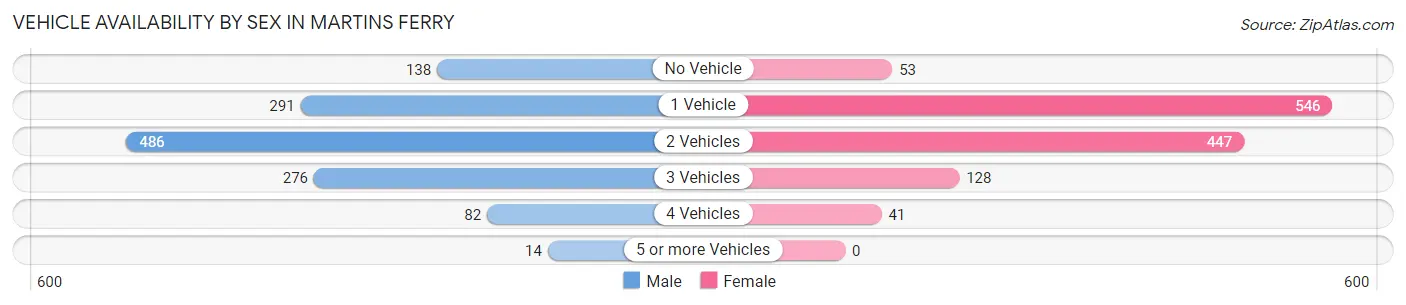
Vehicle Availability by Sex in Martins Ferry
The most prevalent vehicle ownership categories in Martins Ferry are males with 2 vehicles (486, accounting for 37.8%) and females with 2 vehicles (447, making up 40.0%).
| Vehicles Available | Male | Female |
| No Vehicle | 138 (10.7%) | 53 (4.4%) |
| 1 Vehicle | 291 (22.6%) | 546 (44.9%) |
| 2 Vehicles | 486 (37.8%) | 447 (36.8%) |
| 3 Vehicles | 276 (21.4%) | 128 (10.5%) |
| 4 Vehicles | 82 (6.4%) | 41 (3.4%) |
| 5 or more Vehicles | 14 (1.1%) | 0 (0.0%) |
| Total | 1,287 (100.0%) | 1,215 (100.0%) |
Commute Time in Martins Ferry
The most frequently occuring commute durations in Martins Ferry are 20 to 24 minutes (595 commuters, 24.6%), 10 to 14 minutes (495 commuters, 20.4%), and 5 to 9 minutes (398 commuters, 16.5%).
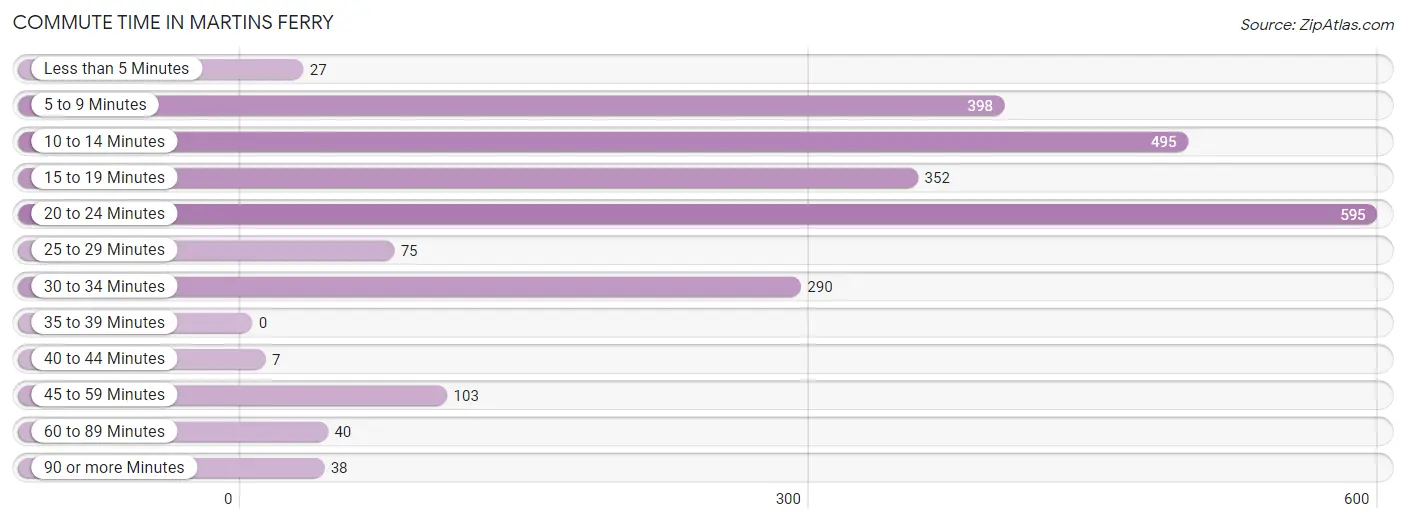
| Commute Time | # Commuters | % Commuters |
| Less than 5 Minutes | 27 | 1.1% |
| 5 to 9 Minutes | 398 | 16.5% |
| 10 to 14 Minutes | 495 | 20.4% |
| 15 to 19 Minutes | 352 | 14.5% |
| 20 to 24 Minutes | 595 | 24.6% |
| 25 to 29 Minutes | 75 | 3.1% |
| 30 to 34 Minutes | 290 | 12.0% |
| 35 to 39 Minutes | 0 | 0.0% |
| 40 to 44 Minutes | 7 | 0.3% |
| 45 to 59 Minutes | 103 | 4.3% |
| 60 to 89 Minutes | 40 | 1.7% |
| 90 or more Minutes | 38 | 1.6% |
Commute Time by Sex in Martins Ferry
The most common commute times in Martins Ferry are 10 to 14 minutes (352 commuters, 27.6%) for males and 20 to 24 minutes (350 commuters, 30.6%) for females.
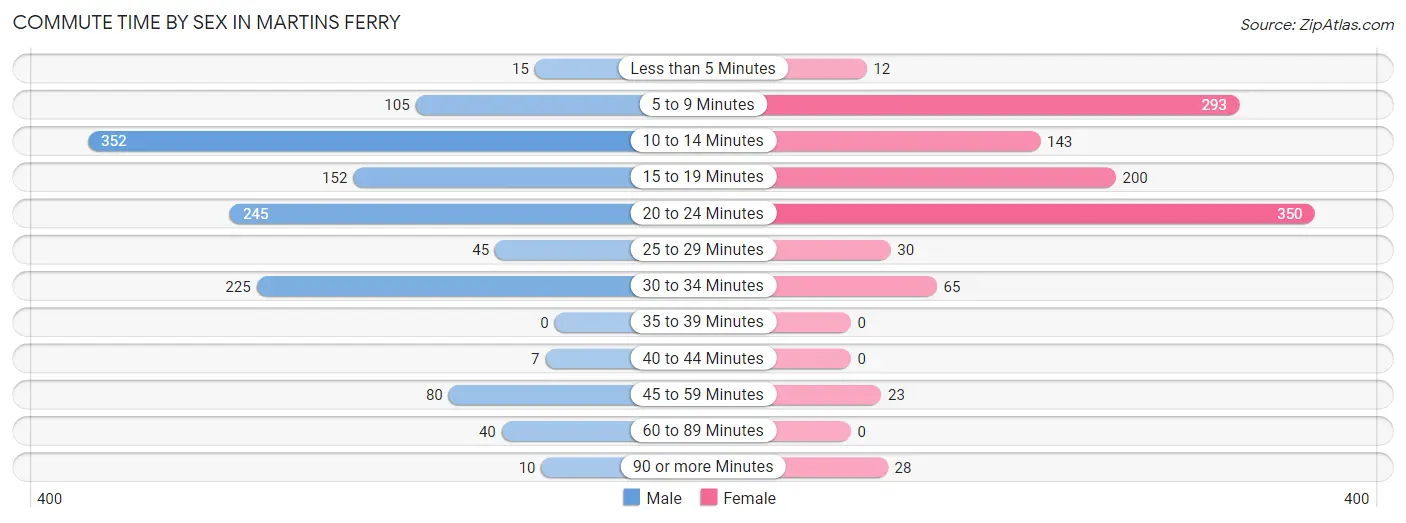
| Commute Time | Male | Female |
| Less than 5 Minutes | 15 (1.2%) | 12 (1.1%) |
| 5 to 9 Minutes | 105 (8.2%) | 293 (25.6%) |
| 10 to 14 Minutes | 352 (27.6%) | 143 (12.5%) |
| 15 to 19 Minutes | 152 (11.9%) | 200 (17.5%) |
| 20 to 24 Minutes | 245 (19.2%) | 350 (30.6%) |
| 25 to 29 Minutes | 45 (3.5%) | 30 (2.6%) |
| 30 to 34 Minutes | 225 (17.6%) | 65 (5.7%) |
| 35 to 39 Minutes | 0 (0.0%) | 0 (0.0%) |
| 40 to 44 Minutes | 7 (0.5%) | 0 (0.0%) |
| 45 to 59 Minutes | 80 (6.3%) | 23 (2.0%) |
| 60 to 89 Minutes | 40 (3.1%) | 0 (0.0%) |
| 90 or more Minutes | 10 (0.8%) | 28 (2.5%) |
Time of Departure to Work by Sex in Martins Ferry
The most frequent times of departure to work in Martins Ferry are 7:00 AM to 7:29 AM (205, 16.1%) for males and 4:00 PM to 11:59 PM (243, 21.2%) for females.
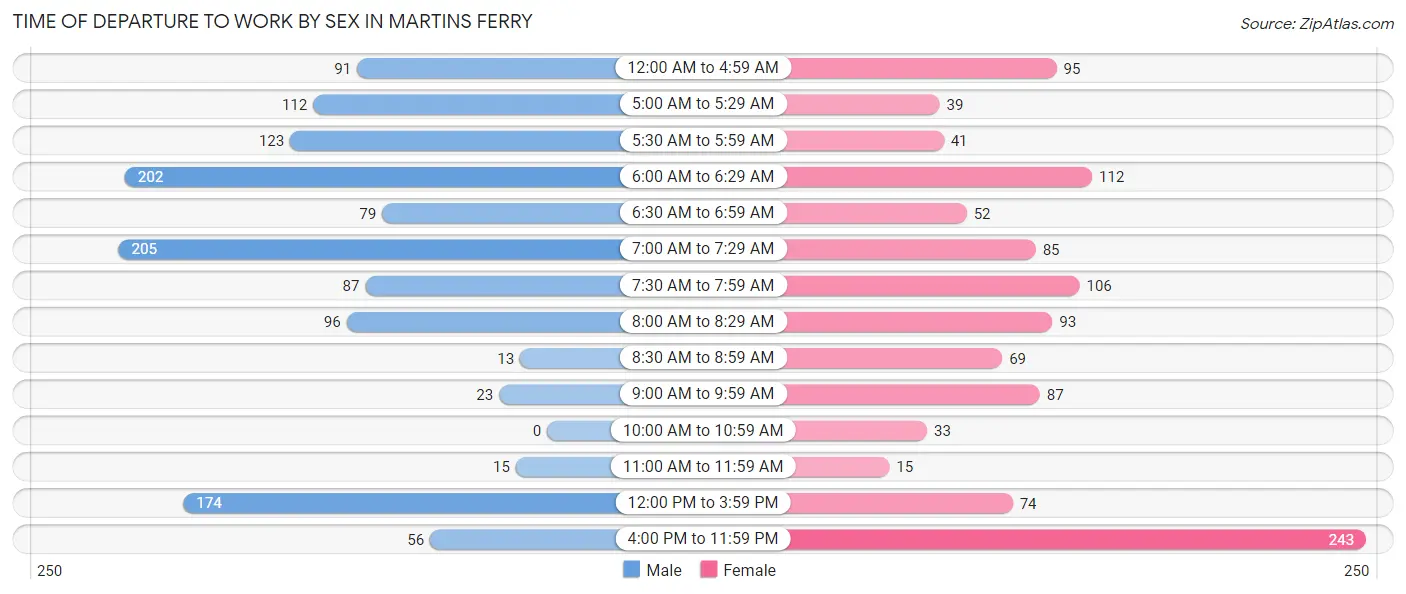
| Time of Departure | Male | Female |
| 12:00 AM to 4:59 AM | 91 (7.1%) | 95 (8.3%) |
| 5:00 AM to 5:29 AM | 112 (8.8%) | 39 (3.4%) |
| 5:30 AM to 5:59 AM | 123 (9.6%) | 41 (3.6%) |
| 6:00 AM to 6:29 AM | 202 (15.8%) | 112 (9.8%) |
| 6:30 AM to 6:59 AM | 79 (6.2%) | 52 (4.5%) |
| 7:00 AM to 7:29 AM | 205 (16.1%) | 85 (7.4%) |
| 7:30 AM to 7:59 AM | 87 (6.8%) | 106 (9.3%) |
| 8:00 AM to 8:29 AM | 96 (7.5%) | 93 (8.1%) |
| 8:30 AM to 8:59 AM | 13 (1.0%) | 69 (6.0%) |
| 9:00 AM to 9:59 AM | 23 (1.8%) | 87 (7.6%) |
| 10:00 AM to 10:59 AM | 0 (0.0%) | 33 (2.9%) |
| 11:00 AM to 11:59 AM | 15 (1.2%) | 15 (1.3%) |
| 12:00 PM to 3:59 PM | 174 (13.6%) | 74 (6.5%) |
| 4:00 PM to 11:59 PM | 56 (4.4%) | 243 (21.2%) |
| Total | 1,276 (100.0%) | 1,144 (100.0%) |
Housing Occupancy in Martins Ferry
Occupancy by Ownership in Martins Ferry
Of the total 2,768 dwellings in Martins Ferry, owner-occupied units account for 1,488 (53.8%), while renter-occupied units make up 1,280 (46.2%).
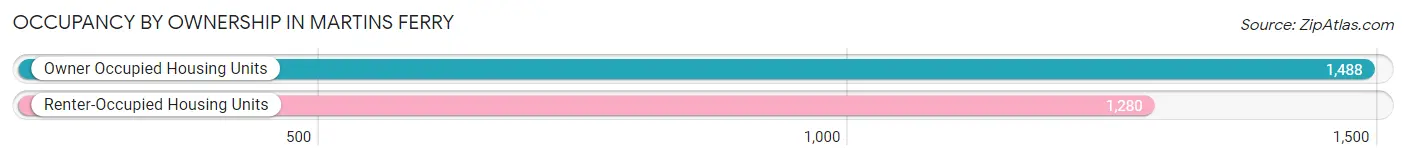
| Occupancy | # Housing Units | % Housing Units |
| Owner Occupied Housing Units | 1,488 | 53.8% |
| Renter-Occupied Housing Units | 1,280 | 46.2% |
| Total Occupied Housing Units | 2,768 | 100.0% |
Occupancy by Household Size in Martins Ferry
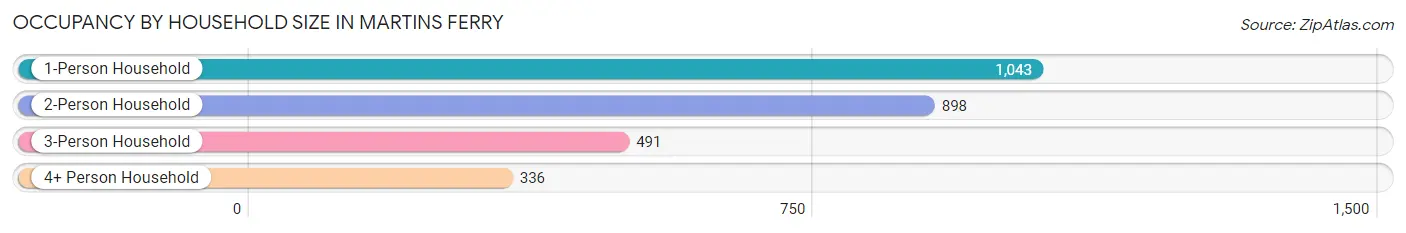
| Household Size | # Housing Units | % Housing Units |
| 1-Person Household | 1,043 | 37.7% |
| 2-Person Household | 898 | 32.4% |
| 3-Person Household | 491 | 17.7% |
| 4+ Person Household | 336 | 12.1% |
| Total Housing Units | 2,768 | 100.0% |
Occupancy by Ownership by Household Size in Martins Ferry
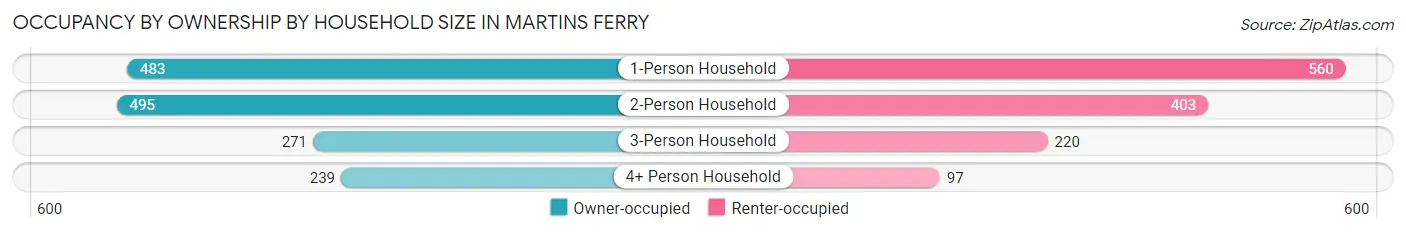
| Household Size | Owner-occupied | Renter-occupied |
| 1-Person Household | 483 (46.3%) | 560 (53.7%) |
| 2-Person Household | 495 (55.1%) | 403 (44.9%) |
| 3-Person Household | 271 (55.2%) | 220 (44.8%) |
| 4+ Person Household | 239 (71.1%) | 97 (28.9%) |
| Total Housing Units | 1,488 (53.8%) | 1,280 (46.2%) |
Occupancy by Educational Attainment in Martins Ferry
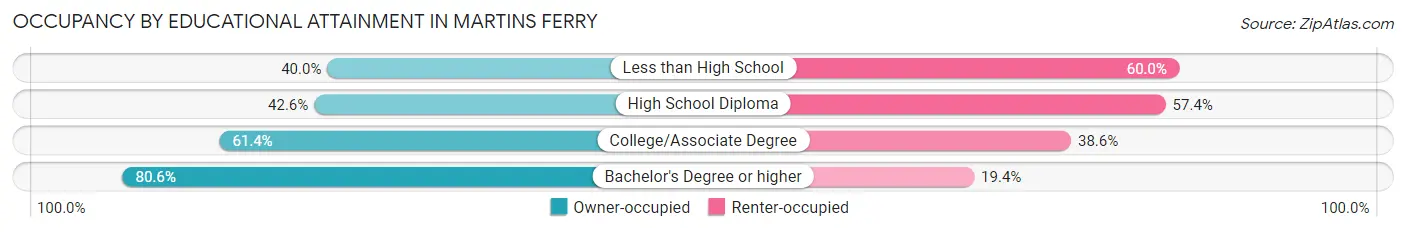
| Household Size | Owner-occupied | Renter-occupied |
| Less than High School | 94 (40.0%) | 141 (60.0%) |
| High School Diploma | 501 (42.6%) | 675 (57.4%) |
| College/Associate Degree | 640 (61.4%) | 403 (38.6%) |
| Bachelor's Degree or higher | 253 (80.6%) | 61 (19.4%) |
Occupancy by Age of Householder in Martins Ferry
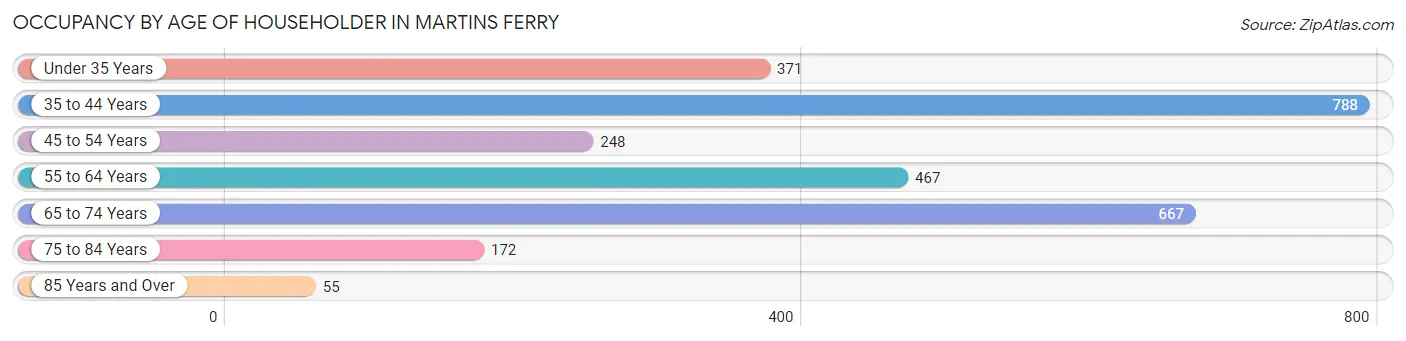
| Age Bracket | # Households | % Households |
| Under 35 Years | 371 | 13.4% |
| 35 to 44 Years | 788 | 28.5% |
| 45 to 54 Years | 248 | 9.0% |
| 55 to 64 Years | 467 | 16.9% |
| 65 to 74 Years | 667 | 24.1% |
| 75 to 84 Years | 172 | 6.2% |
| 85 Years and Over | 55 | 2.0% |
| Total | 2,768 | 100.0% |
Housing Finances in Martins Ferry
Median Income by Occupancy in Martins Ferry
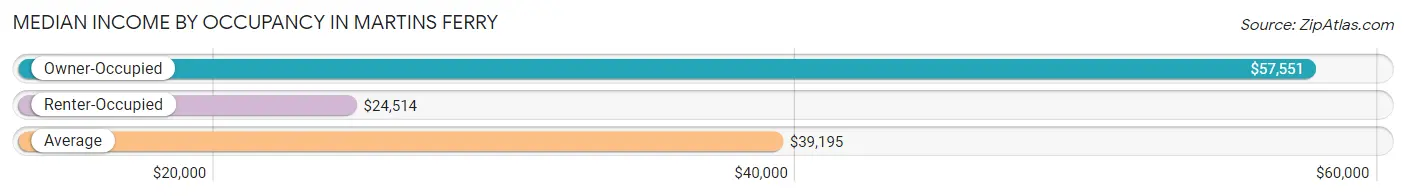
| Occupancy Type | # Households | Median Income |
| Owner-Occupied | 1,488 (53.8%) | $57,551 |
| Renter-Occupied | 1,280 (46.2%) | $24,514 |
| Average | 2,768 (100.0%) | $39,195 |
Occupancy by Householder Income Bracket in Martins Ferry
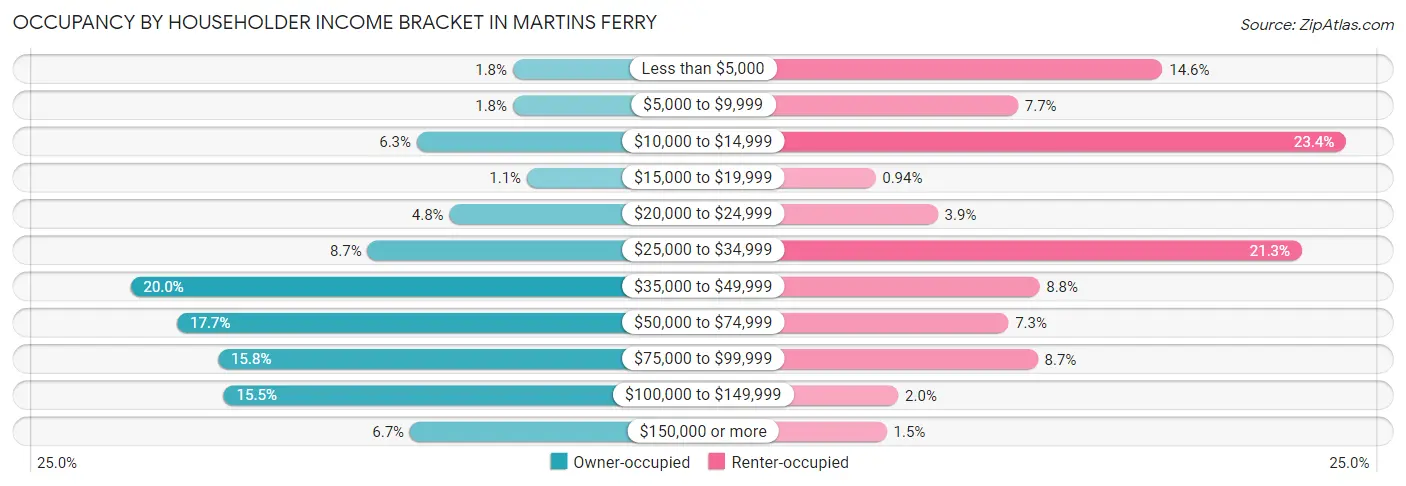
| Income Bracket | Owner-occupied | Renter-occupied |
| Less than $5,000 | 26 (1.8%) | 187 (14.6%) |
| $5,000 to $9,999 | 26 (1.8%) | 99 (7.7%) |
| $10,000 to $14,999 | 94 (6.3%) | 299 (23.4%) |
| $15,000 to $19,999 | 16 (1.1%) | 12 (0.9%) |
| $20,000 to $24,999 | 71 (4.8%) | 50 (3.9%) |
| $25,000 to $34,999 | 129 (8.7%) | 272 (21.2%) |
| $35,000 to $49,999 | 297 (20.0%) | 112 (8.7%) |
| $50,000 to $74,999 | 264 (17.7%) | 93 (7.3%) |
| $75,000 to $99,999 | 235 (15.8%) | 111 (8.7%) |
| $100,000 to $149,999 | 231 (15.5%) | 26 (2.0%) |
| $150,000 or more | 99 (6.7%) | 19 (1.5%) |
| Total | 1,488 (100.0%) | 1,280 (100.0%) |
Monthly Housing Cost Tiers in Martins Ferry
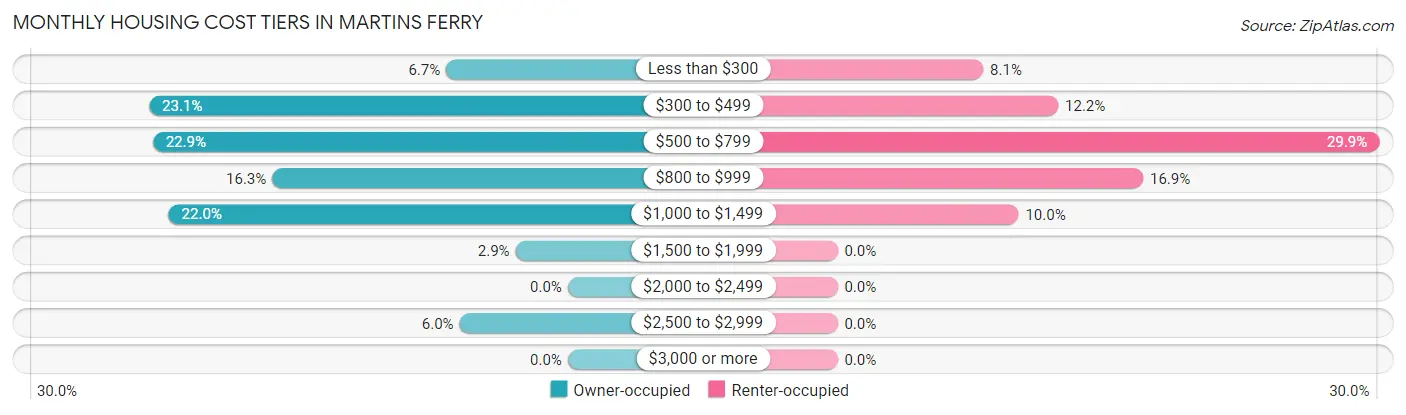
| Monthly Cost | Owner-occupied | Renter-occupied |
| Less than $300 | 100 (6.7%) | 103 (8.1%) |
| $300 to $499 | 344 (23.1%) | 156 (12.2%) |
| $500 to $799 | 341 (22.9%) | 383 (29.9%) |
| $800 to $999 | 243 (16.3%) | 216 (16.9%) |
| $1,000 to $1,499 | 328 (22.0%) | 128 (10.0%) |
| $1,500 to $1,999 | 43 (2.9%) | 0 (0.0%) |
| $2,000 to $2,499 | 0 (0.0%) | 0 (0.0%) |
| $2,500 to $2,999 | 89 (6.0%) | 0 (0.0%) |
| $3,000 or more | 0 (0.0%) | 0 (0.0%) |
| Total | 1,488 (100.0%) | 1,280 (100.0%) |
Physical Housing Characteristics in Martins Ferry
Housing Structures in Martins Ferry
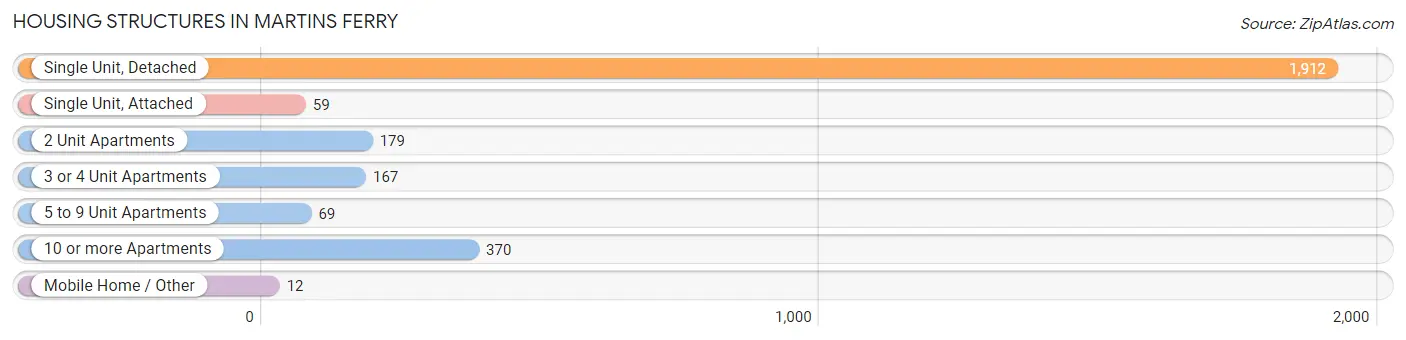
| Structure Type | # Housing Units | % Housing Units |
| Single Unit, Detached | 1,912 | 69.1% |
| Single Unit, Attached | 59 | 2.1% |
| 2 Unit Apartments | 179 | 6.5% |
| 3 or 4 Unit Apartments | 167 | 6.0% |
| 5 to 9 Unit Apartments | 69 | 2.5% |
| 10 or more Apartments | 370 | 13.4% |
| Mobile Home / Other | 12 | 0.4% |
| Total | 2,768 | 100.0% |
Housing Structures by Occupancy in Martins Ferry
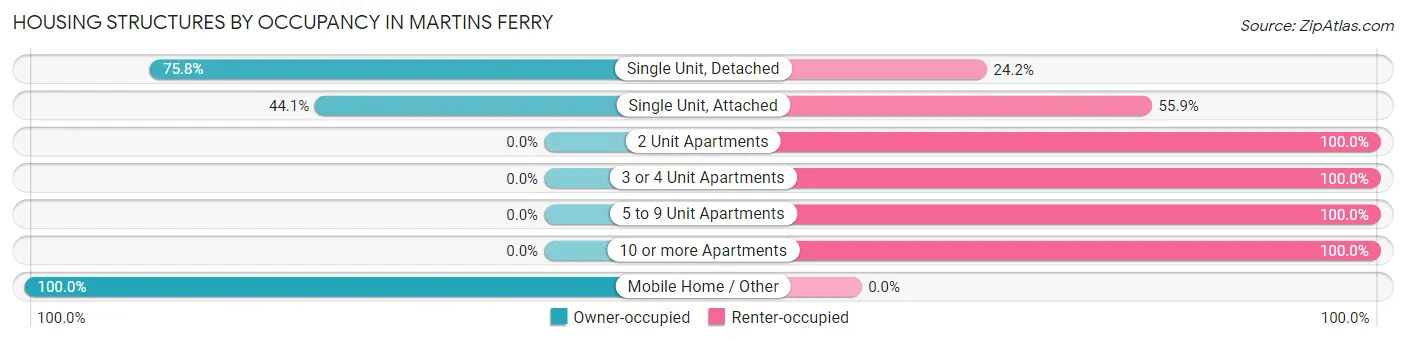
| Structure Type | Owner-occupied | Renter-occupied |
| Single Unit, Detached | 1,450 (75.8%) | 462 (24.2%) |
| Single Unit, Attached | 26 (44.1%) | 33 (55.9%) |
| 2 Unit Apartments | 0 (0.0%) | 179 (100.0%) |
| 3 or 4 Unit Apartments | 0 (0.0%) | 167 (100.0%) |
| 5 to 9 Unit Apartments | 0 (0.0%) | 69 (100.0%) |
| 10 or more Apartments | 0 (0.0%) | 370 (100.0%) |
| Mobile Home / Other | 12 (100.0%) | 0 (0.0%) |
| Total | 1,488 (53.8%) | 1,280 (46.2%) |
Housing Structures by Number of Rooms in Martins Ferry
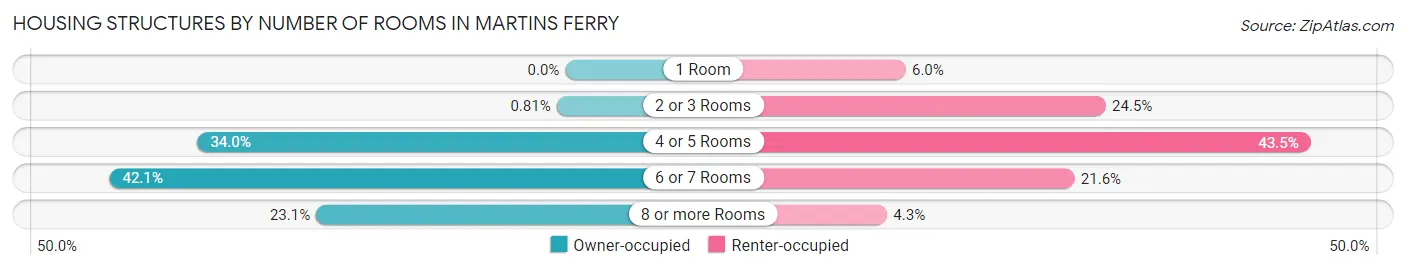
| Number of Rooms | Owner-occupied | Renter-occupied |
| 1 Room | 0 (0.0%) | 77 (6.0%) |
| 2 or 3 Rooms | 12 (0.8%) | 314 (24.5%) |
| 4 or 5 Rooms | 506 (34.0%) | 557 (43.5%) |
| 6 or 7 Rooms | 627 (42.1%) | 277 (21.6%) |
| 8 or more Rooms | 343 (23.1%) | 55 (4.3%) |
| Total | 1,488 (100.0%) | 1,280 (100.0%) |
Housing Structure by Heating Type in Martins Ferry
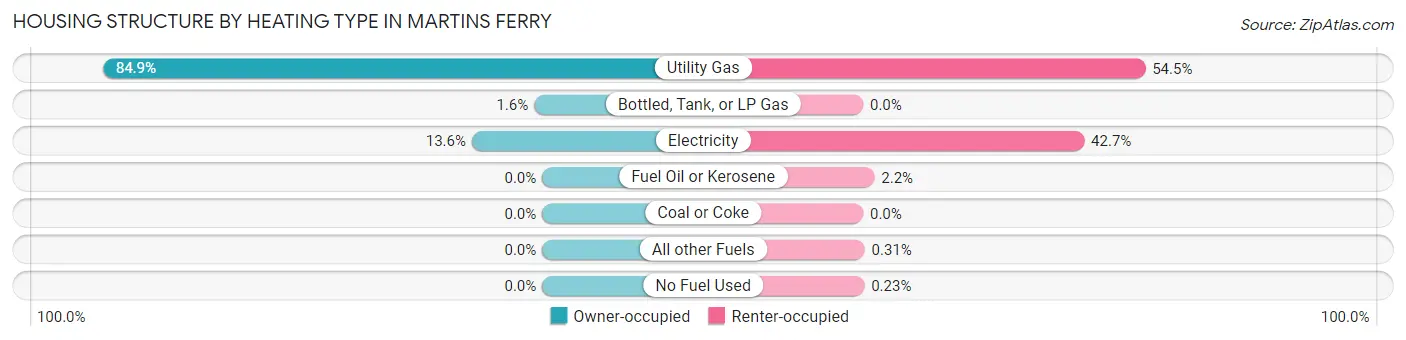
| Heating Type | Owner-occupied | Renter-occupied |
| Utility Gas | 1,263 (84.9%) | 698 (54.5%) |
| Bottled, Tank, or LP Gas | 23 (1.5%) | 0 (0.0%) |
| Electricity | 202 (13.6%) | 547 (42.7%) |
| Fuel Oil or Kerosene | 0 (0.0%) | 28 (2.2%) |
| Coal or Coke | 0 (0.0%) | 0 (0.0%) |
| All other Fuels | 0 (0.0%) | 4 (0.3%) |
| No Fuel Used | 0 (0.0%) | 3 (0.2%) |
| Total | 1,488 (100.0%) | 1,280 (100.0%) |
Household Vehicle Usage in Martins Ferry
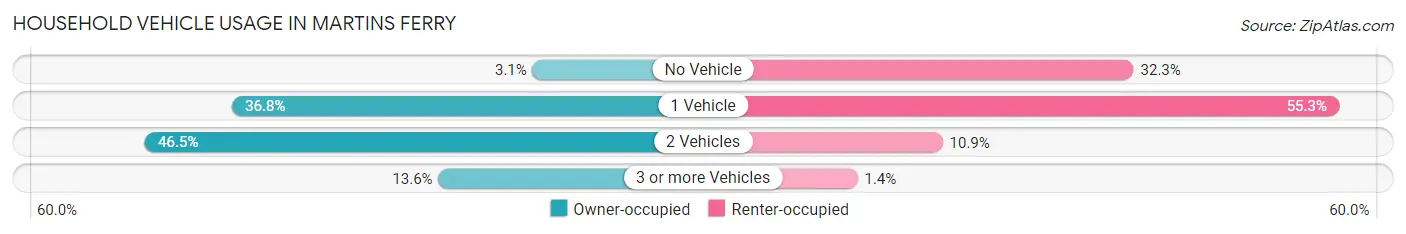
| Vehicles per Household | Owner-occupied | Renter-occupied |
| No Vehicle | 46 (3.1%) | 414 (32.3%) |
| 1 Vehicle | 547 (36.8%) | 708 (55.3%) |
| 2 Vehicles | 692 (46.5%) | 140 (10.9%) |
| 3 or more Vehicles | 203 (13.6%) | 18 (1.4%) |
| Total | 1,488 (100.0%) | 1,280 (100.0%) |
Real Estate & Mortgages in Martins Ferry
Real Estate and Mortgage Overview in Martins Ferry
| Characteristic | Without Mortgage | With Mortgage |
| Housing Units | 584 | 904 |
| Median Property Value | $87,300 | $91,900 |
| Median Household Income | $44,470 | $91 |
| Monthly Housing Costs | $434 | $0 |
| Real Estate Taxes | $839 | $0 |
Property Value by Mortgage Status in Martins Ferry
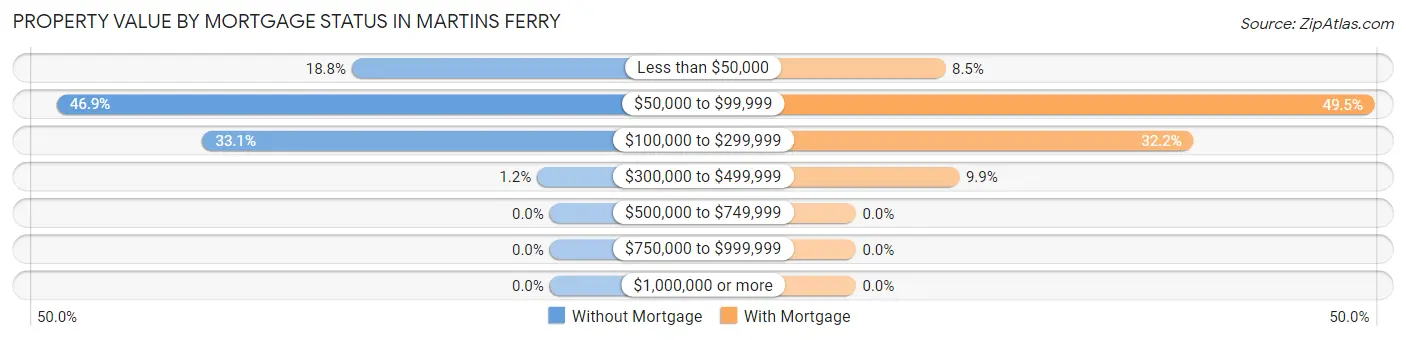
| Property Value | Without Mortgage | With Mortgage |
| Less than $50,000 | 110 (18.8%) | 77 (8.5%) |
| $50,000 to $99,999 | 274 (46.9%) | 447 (49.4%) |
| $100,000 to $299,999 | 193 (33.1%) | 291 (32.2%) |
| $300,000 to $499,999 | 7 (1.2%) | 89 (9.9%) |
| $500,000 to $749,999 | 0 (0.0%) | 0 (0.0%) |
| $750,000 to $999,999 | 0 (0.0%) | 0 (0.0%) |
| $1,000,000 or more | 0 (0.0%) | 0 (0.0%) |
| Total | 584 (100.0%) | 904 (100.0%) |
Household Income by Mortgage Status in Martins Ferry
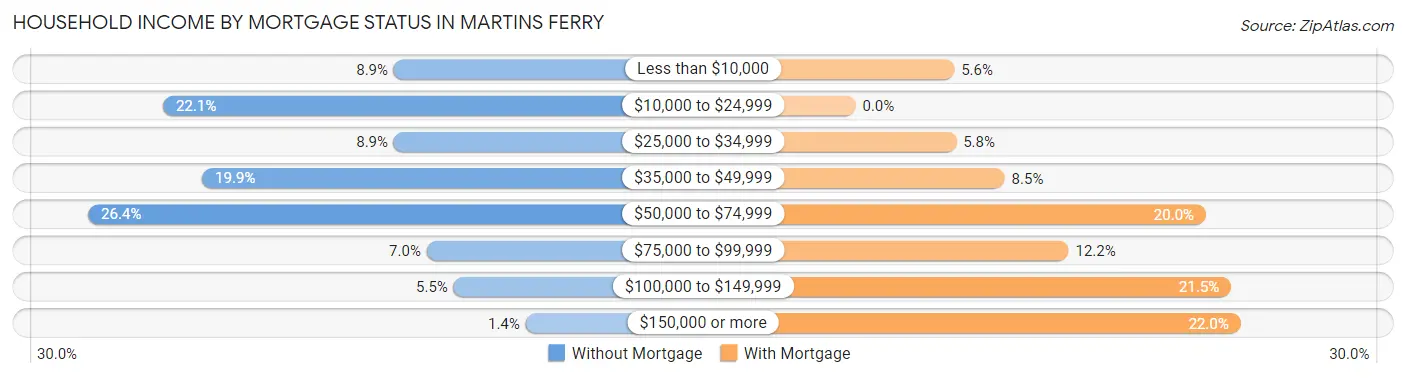
| Household Income | Without Mortgage | With Mortgage |
| Less than $10,000 | 52 (8.9%) | 51 (5.6%) |
| $10,000 to $24,999 | 129 (22.1%) | 0 (0.0%) |
| $25,000 to $34,999 | 52 (8.9%) | 52 (5.8%) |
| $35,000 to $49,999 | 116 (19.9%) | 77 (8.5%) |
| $50,000 to $74,999 | 154 (26.4%) | 181 (20.0%) |
| $75,000 to $99,999 | 41 (7.0%) | 110 (12.2%) |
| $100,000 to $149,999 | 32 (5.5%) | 194 (21.5%) |
| $150,000 or more | 8 (1.4%) | 199 (22.0%) |
| Total | 584 (100.0%) | 904 (100.0%) |
Property Value to Household Income Ratio in Martins Ferry
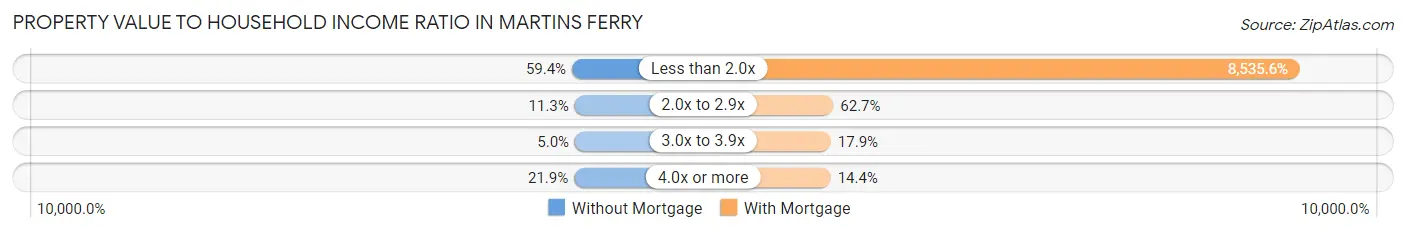
| Value-to-Income Ratio | Without Mortgage | With Mortgage |
| Less than 2.0x | 347 (59.4%) | 77,162 (8,535.6%) |
| 2.0x to 2.9x | 66 (11.3%) | 567 (62.7%) |
| 3.0x to 3.9x | 29 (5.0%) | 162 (17.9%) |
| 4.0x or more | 128 (21.9%) | 130 (14.4%) |
| Total | 584 (100.0%) | 904 (100.0%) |
Real Estate Taxes by Mortgage Status in Martins Ferry
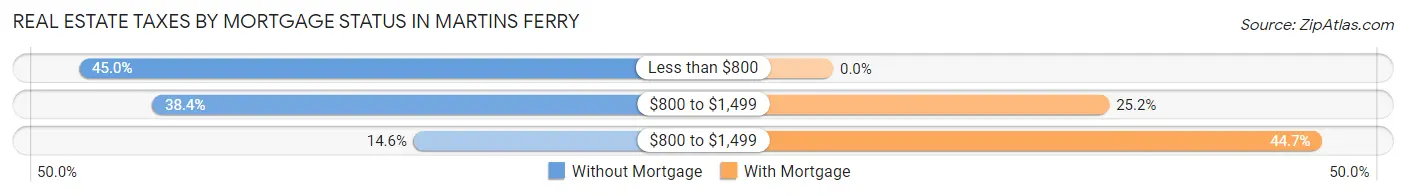
| Property Taxes | Without Mortgage | With Mortgage |
| Less than $800 | 263 (45.0%) | 0 (0.0%) |
| $800 to $1,499 | 224 (38.4%) | 228 (25.2%) |
| $800 to $1,499 | 85 (14.5%) | 404 (44.7%) |
| Total | 584 (100.0%) | 904 (100.0%) |
Health & Disability in Martins Ferry
Health Insurance Coverage by Age in Martins Ferry
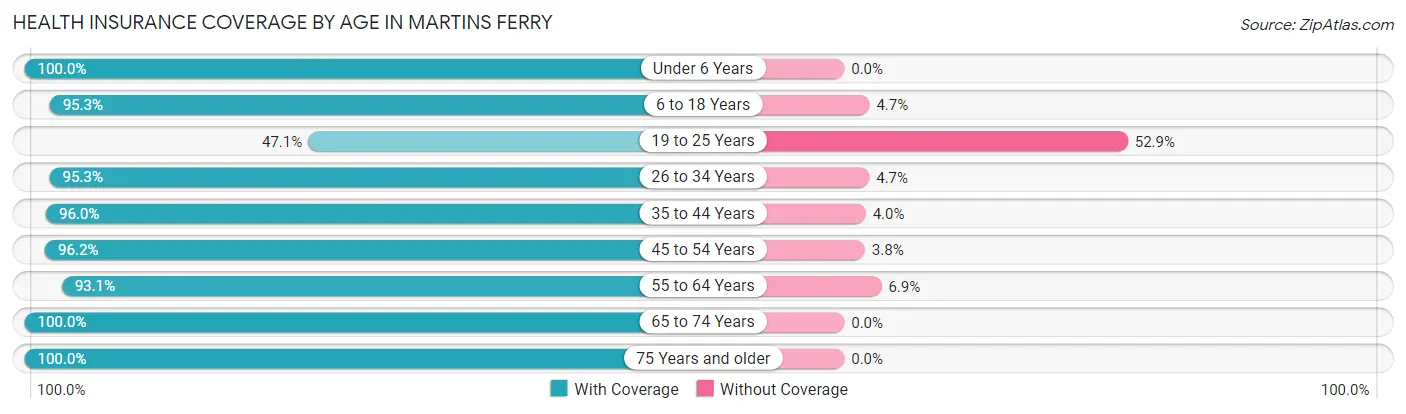
| Age Bracket | With Coverage | Without Coverage |
| Under 6 Years | 192 (100.0%) | 0 (0.0%) |
| 6 to 18 Years | 1,056 (95.3%) | 52 (4.7%) |
| 19 to 25 Years | 338 (47.1%) | 379 (52.9%) |
| 26 to 34 Years | 634 (95.3%) | 31 (4.7%) |
| 35 to 44 Years | 1,033 (96.0%) | 43 (4.0%) |
| 45 to 54 Years | 501 (96.2%) | 20 (3.8%) |
| 55 to 64 Years | 712 (93.1%) | 53 (6.9%) |
| 65 to 74 Years | 893 (100.0%) | 0 (0.0%) |
| 75 Years and older | 273 (100.0%) | 0 (0.0%) |
| Total | 5,632 (90.7%) | 578 (9.3%) |
Health Insurance Coverage by Citizenship Status in Martins Ferry
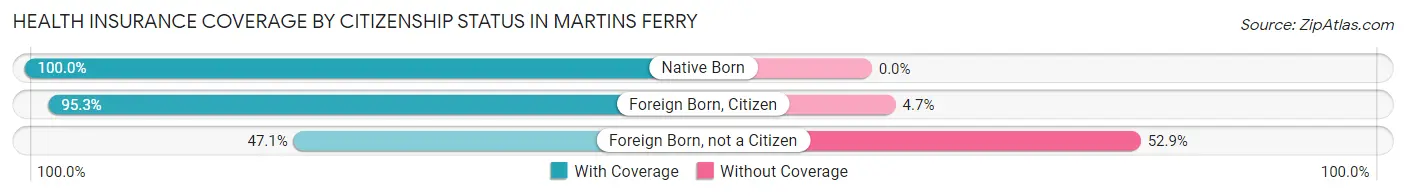
| Citizenship Status | With Coverage | Without Coverage |
| Native Born | 192 (100.0%) | 0 (0.0%) |
| Foreign Born, Citizen | 1,056 (95.3%) | 52 (4.7%) |
| Foreign Born, not a Citizen | 338 (47.1%) | 379 (52.9%) |
Health Insurance Coverage by Household Income in Martins Ferry
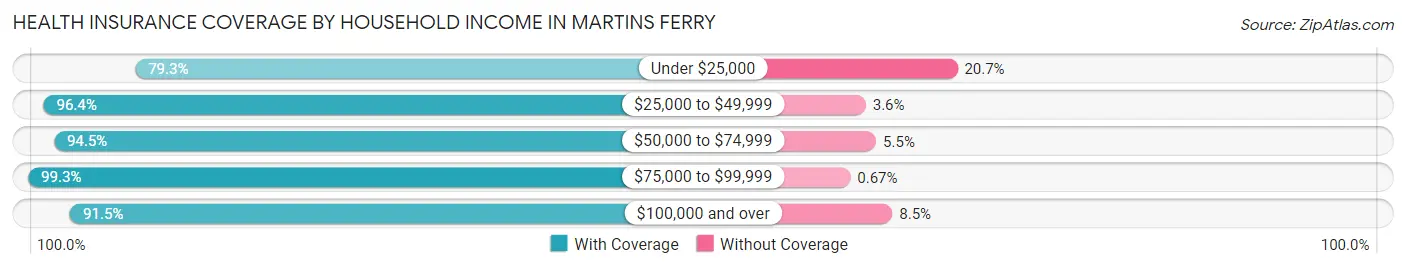
| Household Income | With Coverage | Without Coverage |
| Under $25,000 | 1,510 (79.3%) | 395 (20.7%) |
| $25,000 to $49,999 | 1,515 (96.4%) | 56 (3.6%) |
| $50,000 to $74,999 | 773 (94.5%) | 45 (5.5%) |
| $75,000 to $99,999 | 1,031 (99.3%) | 7 (0.7%) |
| $100,000 and over | 803 (91.5%) | 75 (8.5%) |
Public vs Private Health Insurance Coverage by Age in Martins Ferry
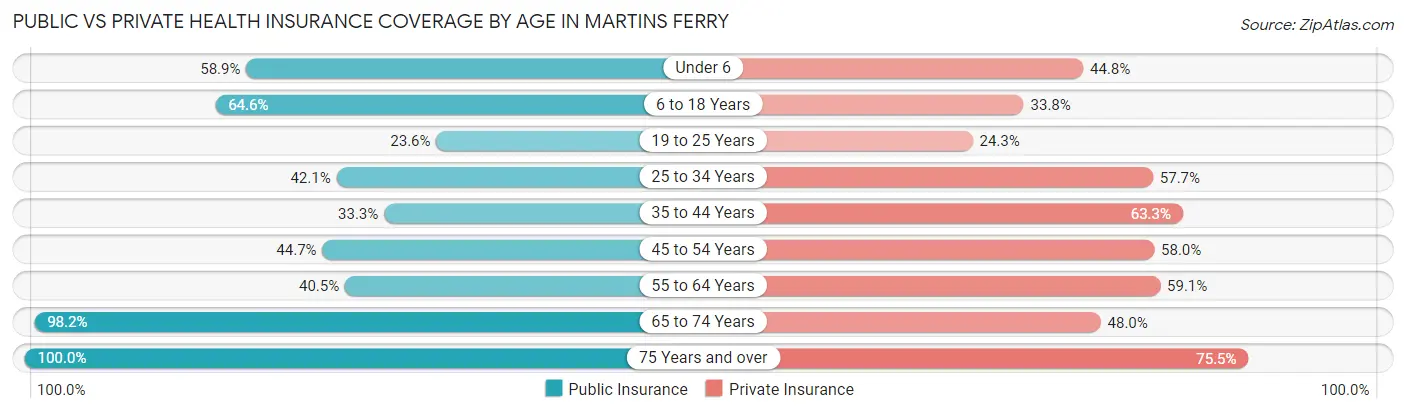
| Age Bracket | Public Insurance | Private Insurance |
| Under 6 | 113 (58.9%) | 86 (44.8%) |
| 6 to 18 Years | 716 (64.6%) | 374 (33.8%) |
| 19 to 25 Years | 169 (23.6%) | 174 (24.3%) |
| 25 to 34 Years | 280 (42.1%) | 384 (57.7%) |
| 35 to 44 Years | 358 (33.3%) | 681 (63.3%) |
| 45 to 54 Years | 233 (44.7%) | 302 (58.0%) |
| 55 to 64 Years | 310 (40.5%) | 452 (59.1%) |
| 65 to 74 Years | 877 (98.2%) | 429 (48.0%) |
| 75 Years and over | 273 (100.0%) | 206 (75.5%) |
| Total | 3,329 (53.6%) | 3,088 (49.7%) |
Disability Status by Sex by Age in Martins Ferry
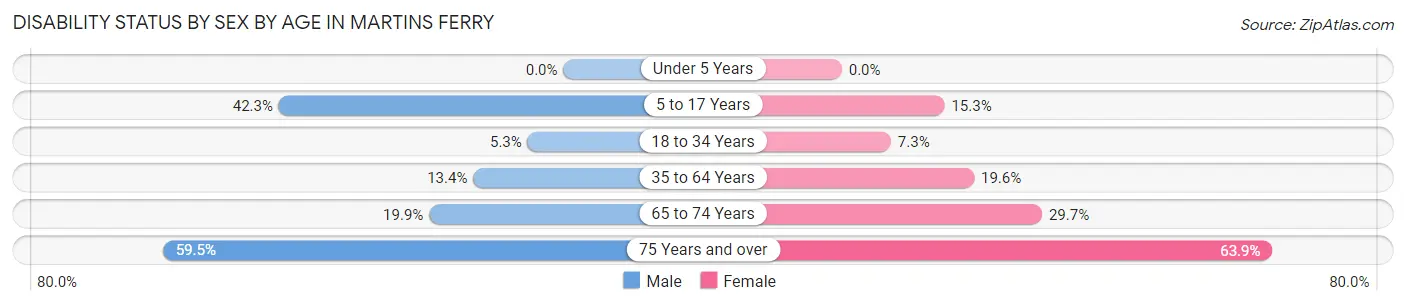
| Age Bracket | Male | Female |
| Under 5 Years | 0 (0.0%) | 0 (0.0%) |
| 5 to 17 Years | 248 (42.2%) | 77 (15.2%) |
| 18 to 34 Years | 45 (5.3%) | 42 (7.3%) |
| 35 to 64 Years | 160 (13.4%) | 229 (19.6%) |
| 65 to 74 Years | 58 (19.9%) | 179 (29.7%) |
| 75 Years and over | 47 (59.5%) | 124 (63.9%) |
Disability Class by Sex by Age in Martins Ferry
Disability Class: Hearing Difficulty
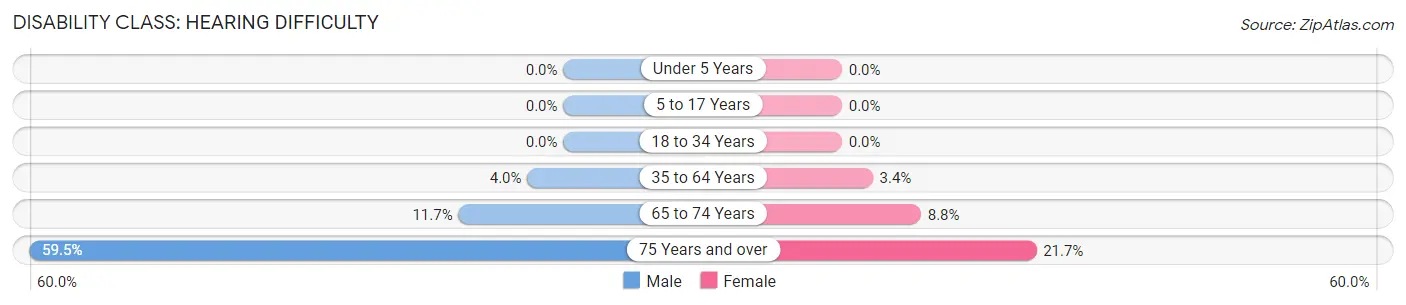
| Age Bracket | Male | Female |
| Under 5 Years | 0 (0.0%) | 0 (0.0%) |
| 5 to 17 Years | 0 (0.0%) | 0 (0.0%) |
| 18 to 34 Years | 0 (0.0%) | 0 (0.0%) |
| 35 to 64 Years | 48 (4.0%) | 40 (3.4%) |
| 65 to 74 Years | 34 (11.7%) | 53 (8.8%) |
| 75 Years and over | 47 (59.5%) | 42 (21.6%) |
Disability Class: Vision Difficulty
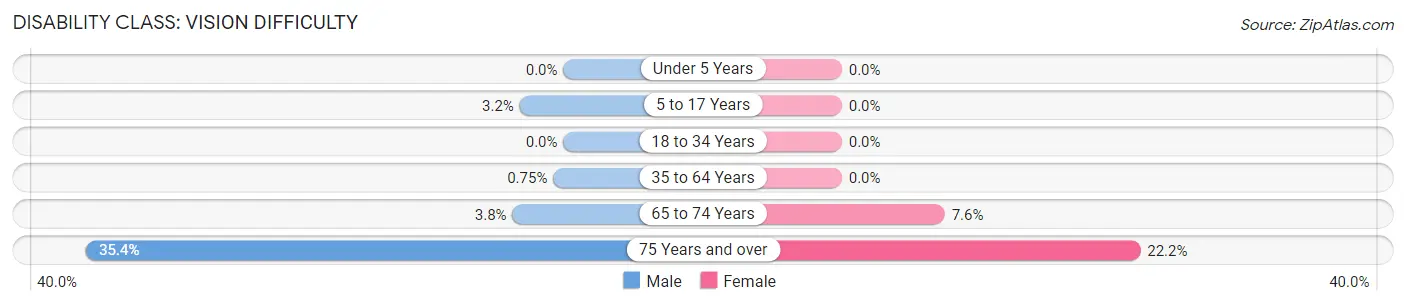
| Age Bracket | Male | Female |
| Under 5 Years | 0 (0.0%) | 0 (0.0%) |
| 5 to 17 Years | 19 (3.2%) | 0 (0.0%) |
| 18 to 34 Years | 0 (0.0%) | 0 (0.0%) |
| 35 to 64 Years | 9 (0.7%) | 0 (0.0%) |
| 65 to 74 Years | 11 (3.8%) | 46 (7.6%) |
| 75 Years and over | 28 (35.4%) | 43 (22.2%) |
Disability Class: Cognitive Difficulty
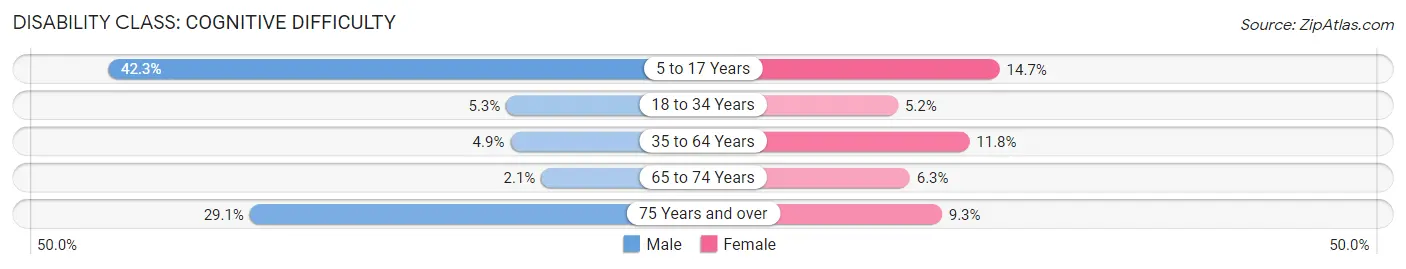
| Age Bracket | Male | Female |
| 5 to 17 Years | 248 (42.2%) | 74 (14.6%) |
| 18 to 34 Years | 45 (5.3%) | 30 (5.2%) |
| 35 to 64 Years | 59 (4.9%) | 138 (11.8%) |
| 65 to 74 Years | 6 (2.1%) | 38 (6.3%) |
| 75 Years and over | 23 (29.1%) | 18 (9.3%) |
Disability Class: Ambulatory Difficulty
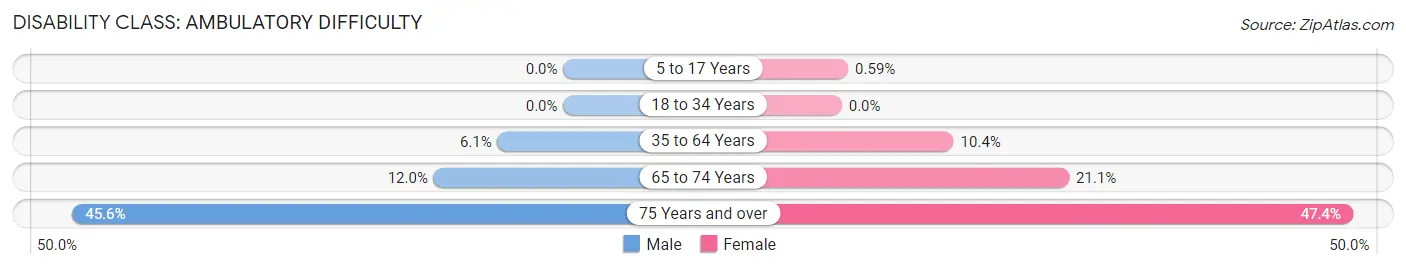
| Age Bracket | Male | Female |
| 5 to 17 Years | 0 (0.0%) | 3 (0.6%) |
| 18 to 34 Years | 0 (0.0%) | 0 (0.0%) |
| 35 to 64 Years | 73 (6.1%) | 121 (10.4%) |
| 65 to 74 Years | 35 (12.0%) | 127 (21.1%) |
| 75 Years and over | 36 (45.6%) | 92 (47.4%) |
Disability Class: Self-Care Difficulty
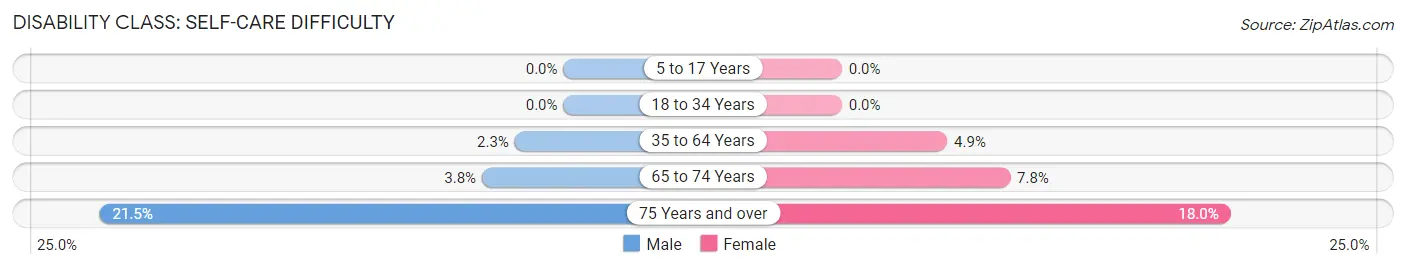
| Age Bracket | Male | Female |
| 5 to 17 Years | 0 (0.0%) | 0 (0.0%) |
| 18 to 34 Years | 0 (0.0%) | 0 (0.0%) |
| 35 to 64 Years | 27 (2.3%) | 57 (4.9%) |
| 65 to 74 Years | 11 (3.8%) | 47 (7.8%) |
| 75 Years and over | 17 (21.5%) | 35 (18.0%) |
Technology Access in Martins Ferry
Computing Device Access in Martins Ferry
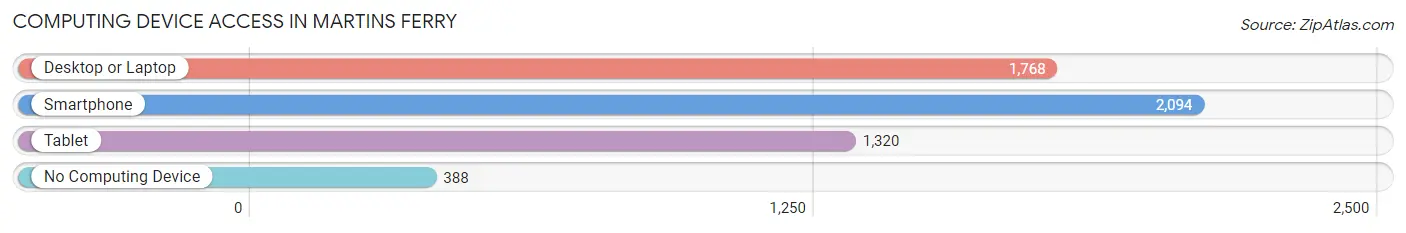
| Device Type | # Households | % Households |
| Desktop or Laptop | 1,768 | 63.9% |
| Smartphone | 2,094 | 75.6% |
| Tablet | 1,320 | 47.7% |
| No Computing Device | 388 | 14.0% |
| Total | 2,768 | 100.0% |
Internet Access in Martins Ferry
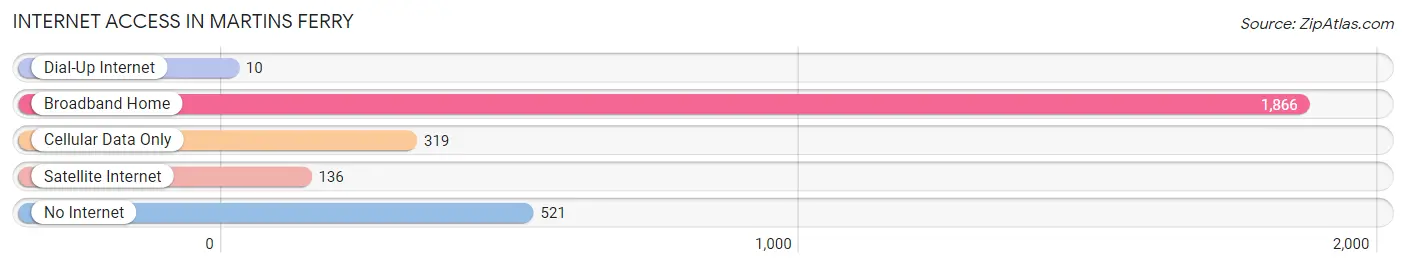
| Internet Type | # Households | % Households |
| Dial-Up Internet | 10 | 0.4% |
| Broadband Home | 1,866 | 67.4% |
| Cellular Data Only | 319 | 11.5% |
| Satellite Internet | 136 | 4.9% |
| No Internet | 521 | 18.8% |
| Total | 2,768 | 100.0% |
Martins Ferry Summary
Martins Ferry, Ohio is a small city located in Belmont County, Ohio, United States. It is situated along the Ohio River, just across from the city of Wheeling, West Virginia. The city has a population of 6,915 as of the 2010 census, and is part of the Wheeling, West Virginia Metropolitan Statistical Area.
History
Martins Ferry was founded in 1785 by Colonel Ebenezer Zane, who named it after his friend, Colonel Jacob Martin. The city was originally part of the Northwest Territory, and was later included in the Virginia Military District. In 1802, the city was officially incorporated as a village.
In the early 19th century, Martins Ferry was a major port on the Ohio River, and was a major stop on the Underground Railroad. During the Civil War, the city was the site of several battles, including the Battle of Martins Ferry in 1863.
In the late 19th century, the city became an important industrial center, with several steel mills and other factories. The city was also home to several glass factories, which produced a variety of glass products.
Geography
Martins Ferry is located at 40°6′17″N 80°45′17″W (40.104722, -80.754722). According to the United States Census Bureau, the city has a total area of 2.2 square miles (5.7 km2), all land.
The city is situated along the Ohio River, just across from the city of Wheeling, West Virginia. The city is located in the Appalachian Plateau region of Ohio, and is part of the Appalachian Mountains.
Economy
Martins Ferry’s economy is largely based on manufacturing and industry. The city is home to several steel mills and other factories, as well as several glass factories. The city is also home to several retail stores and restaurants.
Demographics
As of the 2010 census, there were 6,915 people, 2,845 households, and 1,717 families residing in the city. The population density was 3,097.2 people per square mile (1,196.2/km2). There were 3,097 housing units at an average density of 1,396.2 per square mile (538.7/km2). The racial makeup of the city was 97.2% White, 0.7% African American, 0.2% Native American, 0.3% Asian, 0.2% from other races, and 1.4% from two or more races. Hispanic or Latino of any race were 0.7% of the population.
There were 2,845 households, out of which 28.2% had children under the age of 18 living with them, 39.2% were married couples living together, 15.7% had a female householder with no husband present, and 40.2% were non-families. 35.2% of all households were made up of individuals, and 16.2% had someone living alone who was 65 years of age or older. The average household size was 2.30 and the average family size was 2.97.
In the city, the population was spread out, with 24.2% under the age of 18, 8.2% from 18 to 24, 26.2% from 25 to 44, 22.7% from 45 to 64, and 18.7% who were 65 years of age or older. The median age was 38 years. For every 100 females, there were 87.2 males. For every 100 females age 18 and over, there were 82.3 males.
The median income for a household in the city was $27,813, and the median income for a family was $35,938. Males had a median income of $30,917 versus $20,972 for females. The per capita income for the city was $15,945. About 13.2% of families and 16.2% of the population were below the poverty line, including 22.2% of those under age 18 and 11.2% of those age 65 or over.
Common Questions
What is the Total Population of Martins Ferry?
Total Population of Martins Ferry is 6,283.
What is the Total Male Population of Martins Ferry?
Total Male Population of Martins Ferry is 3,058.
What is the Total Female Population of Martins Ferry?
Total Female Population of Martins Ferry is 3,225.
What is the Ratio of Males per 100 Females in Martins Ferry?
There are 94.82 Males per 100 Females in Martins Ferry.
What is the Ratio of Females per 100 Males in Martins Ferry?
There are 105.46 Females per 100 Males in Martins Ferry.
What is the Median Population Age in Martins Ferry?
Median Population Age in Martins Ferry is 40.3 Years.
What is the Average Family Size in Martins Ferry
Average Family Size in Martins Ferry is 2.9 People.
What is the Average Household Size in Martins Ferry
Average Household Size in Martins Ferry is 2.2 People.
What is Per Capita Income in Martins Ferry?
Per Capita income in Martins Ferry is $25,192.
What is the Median Family Income in Martins Ferry?
Median Family Income in Martins Ferry is $49,050.
What is the Median Household income in Martins Ferry?
Median Household Income in Martins Ferry is $39,195.
What is Income or Wage Gap in Martins Ferry?
Income or Wage Gap in Martins Ferry is 9.8%.
Women in Martins Ferry earn 90.2 cents for every dollar earned by a man.
What is Family Income Deficit in Martins Ferry?
Family Income Deficit in Martins Ferry is $13,291.
Families that are below poverty line in Martins Ferry earn $13,291 less on average than the poverty threshold level.
What is Inequality or Gini Index in Martins Ferry?
Inequality or Gini Index in Martins Ferry is 0.52.
How Large is the Labor Force in Martins Ferry?
There are 3,157 People in the Labor Forcein in Martins Ferry.
What is the Percentage of People in the Labor Force in Martins Ferry?
60.6% of People are in the Labor Force in Martins Ferry.
What is the Unemployment Rate in Martins Ferry?
Unemployment Rate in Martins Ferry is 20.8%.